Article

Elemental Gains and Losses during Hydrothermal Alteration in Awak Mas Gold Deposit, Sulawesi Island, Indonesia: Constraints from Balanced Mineral Reactions

1
Geo-Resources Research Center, National Research and Innovation Agency, Jakarta 10340, Indonesia
2
Department of Geological Engineering, Universitas Gadjah Mada, Yogyakarta 55281, Indonesia
3
Institute of Applied Mineralogy and Economic Geology, RWTH Aachen University, 52056 Aachen, Germany
*
Author to whom correspondence should be addressed.
Minerals 2022, 12(12), 1630; https://doi.org/10.3390/min12121630
Submission received: 10 November 2022 / Revised: 13 December 2022 / Accepted: 14 December 2022 / Published: 17 December 2022
(This article belongs to the Special Issue Economic Mineral Deposits: A Review)

Abstract

:
Hydrothermal gold mineralization is commonly associated with metasomatic processes resulting from interaction of hostrock with infiltrating hot aqueous fluids. Understanding of the alteration mechanism requires quantification of element changes in altered rock, relative to the unaltered or least-altered rock, representing the protolith. Balanced mineral reactions are used to gain quantitative insight into the alteration process associated with gold mineralization at the Awak Mas deposit. Three representative samples were carefully selected from the least-altered pyllite and the two alteration zones bordering the mineralization. Mineral mode, textural features, and mineral compositions were studied by microscopy and electron microprobe analyzer (EMPA). Quantitative modal analysis was performed with a Quanta 650 F QEMSCAN® system. The hydrothermal alteration sequence around the mineralization starts with the proximal albite–ankerite–pyrite alteration zone via the distal albite–chlorite alteration zone to the least-altered phyllite wall-rock. Balanced mineral reaction calculations were performed to evaluate elemental gains and losses. Most noticeable is the addition of Si, Na and Ca to each alteration zone. This alteration is represented by the almost complete replacement of muscovite by albite. The addition of Fe and S was highest in the albite–ankerite–pyrite alteration zone. Alteration of the least altered phyllite to the albite–chlorite zone involved a mass increase of 14.5% and a neglectable volume increase of 0.6%. The mass and a volume increase from the least altered phyllite to the albite–ankerite–pyrite zone was 40.5% and 0.47%, respectively. The very low volume change during alteration is also corroborated by the textural preservation indicating isovolumetric metasomatic reactions. The replacement of muscovite by albite may have had an important effect on the change of the rock failure mode from ductile to brittle, with consequences for the focusing of fluid flow.

1. Introduction

Fluids infiltrating and reacting with rocks during metamorphism and/or magmatism represent the most important open system process in the formation of orogenic gold deposits. Thus, orogenic Au deposits provide a valuable opportunity to investigate geochemical changes associated with structurally focused metasomatic activity [1,2,3].
Mass transfer calculations are quantitative tools used to monitor the fluid–rock interaction during the alteration and mineralization process. This provides information about the effects of overprinting metasomatism suffered by the altered rocks. Gresens [1] demonstrated that in order to calculate the mass change involved in fluid–rock reactions, the total mass per unit volume of the sample before and after the alteration must be known. One approach commonly used to solve this problem is to try to identify immobile elements [2,3,4,5,6,7,8].
An alternative approach was introduced by Dipple and Ferry [9], who calculated the time integrated molar fluid flux assuming chemical equilibrium between an aqueous chloride fluid and the alteration assemblages. Quantification of mass transfer and fluid flux or fluid rock ratios are generally based on whole rock geochemistry, stable isotopes or the mineralogical composition [1,2,9,10,11]. The commonly observed large range in fluid–rock ratio estimates for the various methods may, however, be explained by differences in reaching equilibrium for a specific system under consideration [3,11]. In this study, we combine petrological observations, mineralogical quantification and mineral chemistry data in order to quantify mass transfer and volume change during alteration reactions in the Awak Mas gold deposit.
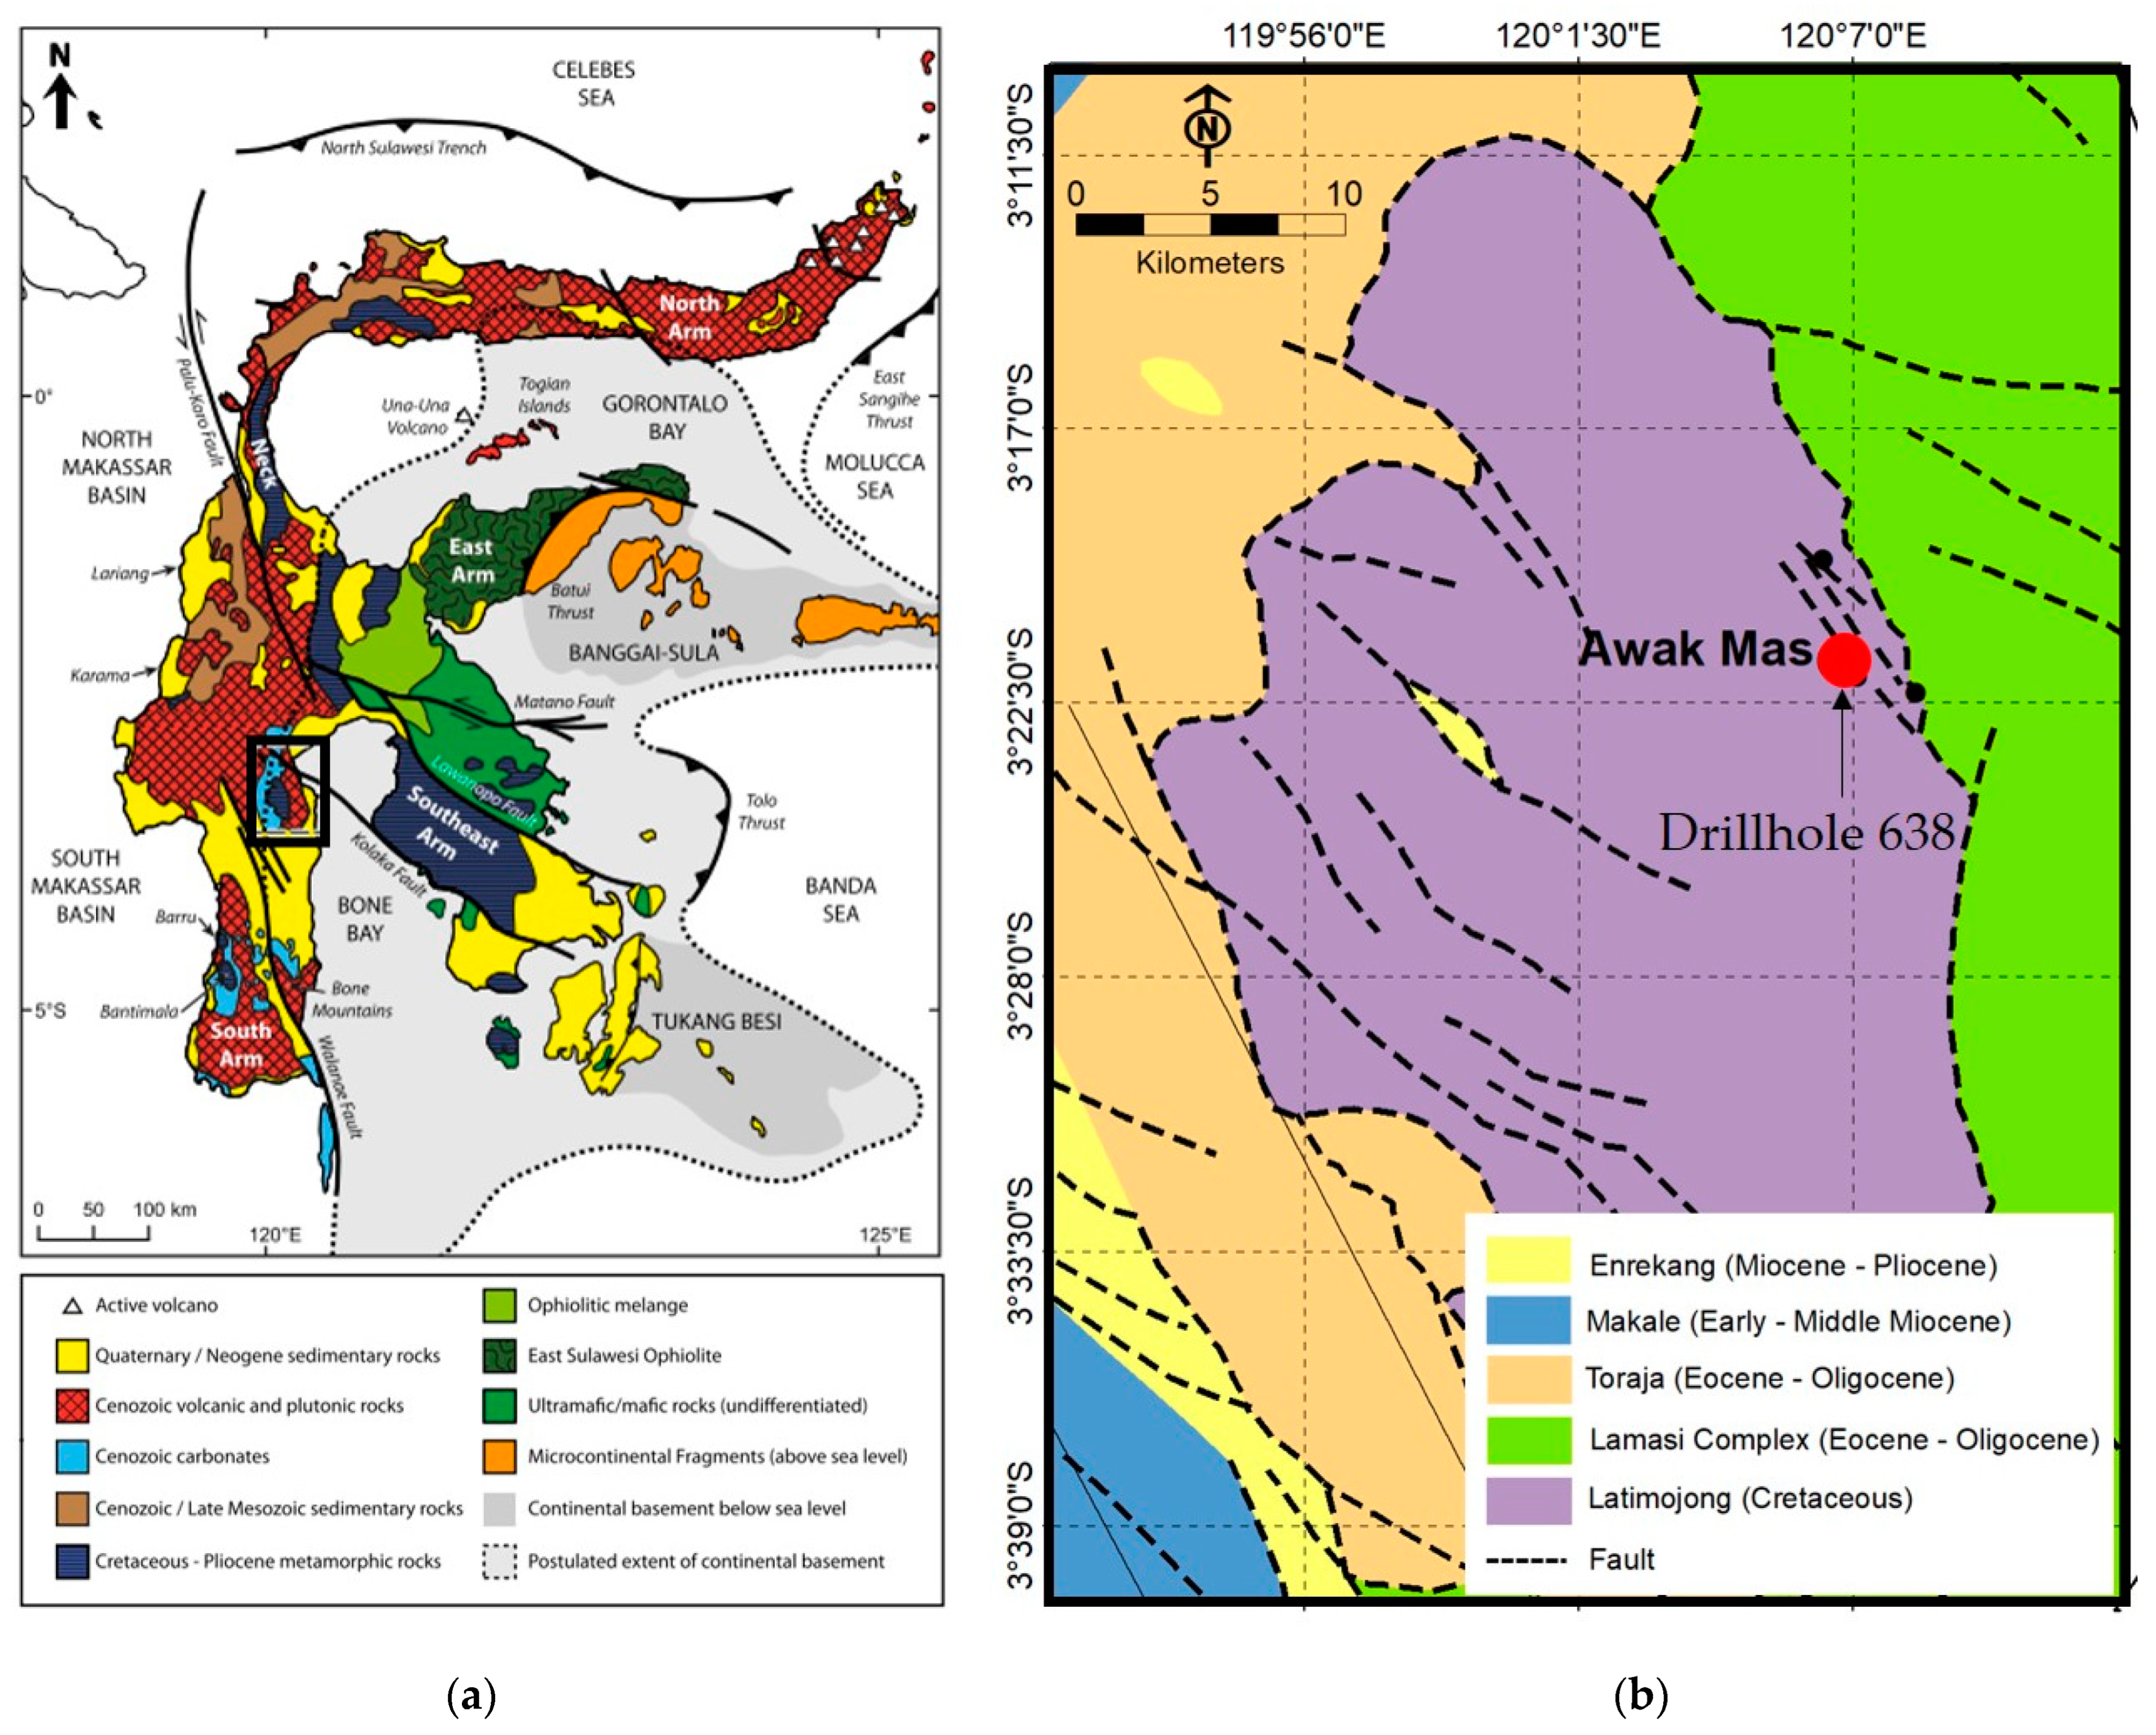
The Awak Mas gold deposit is in the Latimojong District, Luwu Regency, South Sulawesi Province, Republic of Indonesia. The location is about 350 km north of Makassar, the capital city of the South Sulawesi Province (Figure 1a). The Sulawesi Island is commonly divided into five tectonic provinces: (1) North Sulawesi Volcanic Province (arc-related igneous rocks), (2) Western Sulawesi Province (arc rocks and continental basement), (3) Central Sulawesi Metamorphic Belt, (4) East Sulawesi Ophiolite, and (5) other micro-continental fragments (East Arm and Buton) [12,13,14,15,16].
The Awak Mas gold deposit is situated in the southern arm of the Western Sulawesi Province, where both metamorphic basement units and arc-related igneous units prevail (Figure 1b). The Latimojong Formation is underlaid by phyllites, slates, basic to intermediate volcanics, limestones, and schists, representing a platform and/or fore arc trough flysch sequence intruded by granite, diorite, monzonite, and/or syenite plugs and stocks [16,17,18,19,20,21,22]. The other lithological formation in this area is the Lamasi Complex, composed of mafic to intermediate rocks. The Toraja Group consists of lithologies originating from marine to shallow marine depositions, as well as carbonate rocks of the Makale Formation and the Enrekang volcanics [16,17,18,19].
Awak Mas is an orogenic gold deposit hosted by pumpellyite to greenschist facies metasedimentary and metavolcanic rocks [21,22]. The gold mineralization is spatially related to sulfide minerals within quartz–albite–ankerite and quartz–ankerite–siderite bordered quartz veins [22]. Pyrite is the most abundant sulfide, whereas galena and chalcopyrite are very minor. The mineralized quartz veins are encased by an alteration halo grating from the proximal albite–ankerite–pyrite alteration zone, via the distal albite–chlorite alteration zone into the least altered phyllite. The relation between alteration zones and the gold mineralization is sketched by the core log from drill hole number 638 (Figure 2). The highest gold content of up to 25 ppm occurs within the albite–ankerite–pyrite altered phyllite. The infiltrating aqueous ore fluid was found to be CO2-poor and of low salinity at temperatures between 275 and 325 °C [22]. Fluid inclusion chemistry points to an origin of metamorphic dewatering of organic-rich marine sedimentary sequences [22].

2. Materials and Methods

Three representative bulk samples and polished sections were carefully selected from a fresh outcrop of host rock phyllites 5 m away from the collar of drill hole 638 and the two alteration zones exposed in the drill core (Figure 2). Microscopic studies were conducted to describe the petrography of the unaltered host-rocks and to identify the alteration assemblages. Bulk rock mineral assembly quantification was performed by a Quanta 650 F QEMSCAN® system at the Institute of Applied Mineralogy and Mineral Deposits, RWTH Aachen University. The instrument was equipped with a Bruker Dual X-Flash5030 energy dispersive X-ray (EDS) detector, operated with an accelerating voltage of 15 kV and a specimen current of approximately 10 nA. For spectral interpretation and data processing, the iDiscover v.5.2 software suite (FEI) was used. The analytical method used refers to the work of Gottlieb et al. [24], Pirrie et al. [25] and Sindern and Meyer [26].
The XRF analysis operated to determine the major element concentration in bulk samples was conducted at the IML Laboratory of Geochemistry and Environmental Analysis, RWTH Aachen University. Mineral compositions were analyzed to identify systematic chemical variations within the alteration zones. The analyses were carried out using a JEOL-JXA-8900R electron microprobe analyzer at the Institute of Applied Mineralogy and Mineral Deposits, RWTH Aachen University. Analyses of silicates and carbonates were performed at 15 kV between 19 and 24 nA. Sulfides and oxides were analyzed at 25 kV between 25 and 27 nA. The measurements were calibrated with natural sulfide, oxide and silicate mineral standards for specific elements.

3. Results

3.1. Mineralogy

The least altered phyllite exhibits well-established foliation and consists of fine-grained muscovite, albite, chlorite, quartz and biotite (Figure 3a). The albite is mostly altered to muscovite. The accessory minerals occupying a volume of less than 1% are rutile, kaolinite and pyrite.
Samples from the albite–chlorite alteration zone are strongly foliated and cross-cut by thin quartz–calcite veins and veinlets. The mineralogical composition of the albite–chlorite alteration is predominantly albite followed by chlorite, calcite, muscovite and quartz. In addition, accessory minerals, such as rutile and pyrite, occupy a volume of less than 1%. The main secondary minerals that are formed by hydrothermal alteration in this zone are albite, chlorite and calcite, which are also present in the least altered phyllites to varying degrees. Chlorite and albite replace the matrix as well as detrital grains of muscovite along foliation (Figure 3b). Calcite occurs in fractures and replaces rock fragments as disseminated grains. Minor kaolinite is probably a supergene replacement of Fe-bearing minerals.
The albite–ankerite–pyrite alteration zone is composed of albite, ankerite, pyrite and siderite. The accessory minerals occupying a volume of less than 1% are muscovite, quartz, kaolinite and rutile. The dominant secondary mineral is albite, which almost totally replaces muscovite and chlorite by maintaining the foliation structure (Figure 2c). Disseminated pyrite replaces the Fe-bearing minerals (muscovite, chlorite and ankerite) along the sheared foliation, as well as porphyroblast.
The mineral distribution map and modal mineral analysis by QEMSCAN of the least altered phyllite and the two alteration zones is summarized in Figure 4 and Figure 5 and Table 1. Chalcopyrite, smectite, apatite, zircon, Fe-rim and chromite amounts are less than 1% and are not detected by the EPMA measurements are therefore ignored in the calculations of this study. Dolomite chemical calculations fall into the ankerite category. In the least altered phyllite, muscovite is the predominant mineral component (56%), followed by albite (~18%), chlorite (~12%), quartz (~8%), biotite (~3%), rutile (~1%) and pyrite (~1%).
In the distal albite–chlorite alteration zone, the model abundance of albite, chlorite and calcite reaches ~64, ~24 and ~5%, respectively. Relative to the least altered phyllite, muscovite is reduced by ~3 mass%, due to carbonatization and the replacement of muscovite by chlorite and albite. The abundance of quartz (~2%), rutile (~1%) and pyrite (~1%) is also reduced in this alteration zone. In the proximal albite–ankerite–pyrite alteration zone, albite (~76%) has almost totally replaced chlorite and muscovite as result of sodic medasomatism. Ankerite (~12%) is only formed in this alteration zone together with an increased amount of pyrite (~6%).

3.2. Bulk Geochemistry

The potassium contents of the samples from the least altered albite–chlorite alteration zone and albite–ankerite–pyrite alteration zone are represented by the decrease in K2O of 3.37, 0.90 and 0.34 wt% (Table 2). This is inversely proportional to the sodium content (Na2O), where the highest content is in albite–ankerite–pyrite alteration zone proximal to the veins, with a value of 7.93 wt%.

3.3. Mineral Chemistry

The mineral formulae were calculated from mineral chemistry measured by an electron microprobe analyzer (EPMA) using the characteristic analyses (Table 3, Table 4 and Table 5). Standard formulae were used for quartz, biotite and kaolinite due to the very small grain sizes [27,28].

3.4. Quantification of Mineral Reactions for Gains and Losses of Elements

Mineral–fluid reactions during alteration were identified by petrographic analysis. The dominant mineral reaction observed was the replacement of muscovite by albite. This replacement is caused by the reaction of the wall-rock with sodium- and silica-rich hydrothermal fluids, as a result of which potassium and hydrogen cations and water are released according to following reaction:
KAl2(AlSi3O10)(OH)2 + 3Na+ + 6SiO4 → 3NaAlSi3O8 + 2H+ + K+
Muscovite→Hydrothermal fluid→Albite
The gains and losses of elements during alteration was calculated from balanced mineral reactions for the various alteration zones [3]. Using the quantification of mineral data from the precursor rock and altered rock, the metasomatic process was evaluated by the components added to the system or lost from the system. The metasomatic reaction of muscovite replaced by albite was observed in the albite–ankerite–pyrite alteration zone (Figure 3c). By using the mineral formulae calculated from electron microprobe analysis (Table 5), and normalizing for Al, the reaction can be written as follows:
1.671   Si M + 1.0   Al M + 0.049   Ti M + 0.246   Fe M + 0.159   Mg M + 0.005   Ca M + 0.219   Na M + 0.184   K M + 0.007   Mn M + 5.559   O M + 1.001   H M + 1.335   Si F + 0.713   Na F + 2.451   O F = 3.005   Si A + 1.0   Al A + 0.003   Fe A + 0.002   Ca A + 0.932   Na A + 0.002   K A + 8.01   O A + 0.049 Ti F + 0.242   Fe F + 0.159   Mg F + 0.002   Ca F + 0.183   K F + 0.007   Mn F + 1.011   H F M = muscovite , F = fluid , A = albite .
The metasomatic reaction in the albite–ankerite–pyrite alteration zone compared to the phyllite host rocks indicates that Fe, Ca, Mg, K, Mn, O and H were not completely removed by the fluid but were used to form other mineral phases such as ankerite, siderite and pyrite, involving more complex mineral–fluid reactions. The quantification of mineral reactions during hydrothermal alteration was calculated using the balanced mineral reaction method [3,6,29] by combining the mass proportion (Table 1) and the mineral formulae calculated from electron microprobe analysis (Table 3, Table 4 and Table 5). These datasets were used to calculate the elemental composition of the rocks in mole/100 g.
Applying this method [3], the first step is to multiply the molar weight of the elements by their factor in the mineral formula. For example, SiO2 has a Si factor of 1 and O factor of 2, used in order to calculate the elemental composition of the rocks in mole/100 g. The result is then multiplied by a factor determined from the modal abundance of the minerals in 100 g rock by dividing the molar weight with the modal abundance (in wt.%).
Gains and losses of elements defined from the difference in the elemental composition of the precursor rock and the altered rock were corrected for mass and volume changes. The calculation process involves iteration of a mass factor for the altered sample, minimizing the Al and Ti deficit and surplus, respectively, as immobile. The enrichment or depletion of elements by hydrothermal fluid during the alteration is interpreted by the difference between elemental compositions.
In the albite–chlorite alteration zone, the hydrothermal reaction involved a mass and volume increase of 14.5% and 0.6%, respectively, compared to the least altered phyllite. The balanced reaction indicates that the least altered phyllite reacted with the hydrothermal fluid, which added significant amounts of Si, Ca and Na to the system and removed K (Table 6 and Figure 6a). The alteration process involved 0.06 mole (0.69 g) CO2, 0.01 mole (0.3 g) H2S in the hydrothermal fluid and 0.1 mole (0.1 g) H2O lost per 100 g from the least altered phyllite.
Alteration in the albite–ankerite–pyrite zone involved a mass increase of 22.7% and volume decrease of −0.1% compared to the albite–chlorite alteration zone. The reaction is represented by the significant addition of Si, Ca and Na, with the concomitant removal of Mg and K (Table 7 and Figure 6b). The balanced reaction indicates that 100 g precursor sample from the albite–chlorite alteration zone reacted with 0.12 mole (1.45 g) CO2 and 0.11 mole (3.5 g) H2S in the hydrothermal fluid and 0.3 mole (0.3 g) H2O was released.
The general metasomatic process during alteration from the least altered phyllite to the albite–ankerite–pyrite alteration zone involved a mass increase of 40.5% and volume increase of 0.47%. The reaction is represented by the significant addition of Si, Ca and Na, with the concomitant removal of Mg and K (Table 8 and Figure 6c).

4. Discussion

Petrographic analyses of the least altered phyllite and the associated alteration zones testify to hydrothermal mineral alteration reactions. The dominant modal change from the least altered phyllite to the albite–chlorite alteration zone is the replacement of muscovite by albite, indicating infiltration of sodium-rich hydrothermal fluids. Next to albite, Mg chlorite was also a stable component. Elemental gains include Si, Na, Ca, minor Mg, carbonate and minor S, while Ti, Fe and K were depleted.
Comparison of chemical changes in the alteration zones generally indicate addition of O, Si, Ca and particularly Na. Closer to the mineralized zone, the sodium content increases while potassium decreases. The metasomatic reaction leading from the albite–chlorite alteration zone to the albite–ankerite–pyrite alteration zone shows significant addition of Si, Ca, Na, Fe, carbonate and S with the concomitant removal of Mg and K. This results in the formation of albite, ankerite and pyrite mineral assemblage.
Elemental changes between the least altered phyllite and the albite–ankerite–pyrite alteration zone display a similar pattern. There is a significant addition of Si, Ca, Na, carbonate, minor Fe and S, with the related removal of Mg and K. Mineralogically, muscovite was almost totally replaced by albite, with only some rare relics of muscovite sporadically observed in thin sections. Pyrite formed by the reaction of Fe with H2S. Although minor amounts of Fe were introduced by the external fluids, the decomposition of chlorite provided sufficient Fe for pyrite formation [22,23].
The textural preservation and very low volume changes during alteration of wall-rocks may indicate isovolumetric reactions during metasomatism [30,31]. Albitization is the dominant alteration both in the proximal and distal alteration zone followed by variable degrees of carbonatization (ankerite and siderite) and sulfidation (pyrite, minor galena and chalcopyrite).
The orogenic Au literature describes the typical mineralization-associated metasomatic enrichment of potassium and the hydrolysis of feldspar to form mica minerals [32,33,34,35]. In contrast, sodic alteration is not very commonly associated with orogenic gold deposits, but has been noted elsewhere [36,37]. The origin of Na and/or Ca enrichment in some orogenic fluids is still disputed, and interaction of fluids with altered ultramafic rocks in the basement sequence has been suggested [29,38,39]. For Awak Mas, we rather propose the origin of the sodium-rich fluids is from metamorphic dewatering of marine sedimentary sequences and, as the deposits was formed at shallow depths, from related basinal brines [22].
At Awak Mas, albite veining overprints muscovite in the least altered phyllite to form the distal and proximal alteration zones. This may have initiated a failure mode transition from ductile to brittle failure, with consequences for the focusing of fluid flow [22].
If we assume gold transport by the bisulfide complex, as is generally suggested for orogenic gold deposits, the formation of pyrite in the alteration zone could have enabled gold precipitation, since the depletion of sulfur in the fluids may have caused the destabilization of the dissolved Au–S complex [40,41,42,43,44,45]. The presence of ankerite as a result of reaction between CO2-bearing hydrothermal fluids with chlorite in the proximal alteration zone is one of the characteristics of orogenic gold deposits [46,47].

5. Conclusions

Mass balance calculations are useful tools for quantifying element changes during metasomatic processes, relative to the unaltered or least-altered rock, representing the protolith. At Awak Mas, the predominant petrographic manifestation of this process is the replacement of muscovite by albite. Calculated elemental gains and losses allowed conclusions on the chemical make-up of the hydrothermal fluids to be made, which were enriched in Si, Ca, Na, CO2, minor Fe and S, but depleted in Mg and K. This information helped to suggest that the mineralizing fluids originated from metamorphic dewatering of marine sedimentary sequences, and probably from related basinal brines. The very low volume changes indicated by the mass balance calculations are supported by the observed textural preservation, pointing to isovolumetric metasomatic reactions.
In general, this study improves the geochemical understanding of element mobility in epizonal orogenic Au deposits by presenting mass balance calculations that address the compositional heterogeneity of protolith and altered rocks.

Author Contributions

Conceptualization, E.E., A.I. and F.M.M.; methodology, E.E., A.I. and F.M.M.; software, E.E.; validation, E.E., A.I. and F.M.M.; formal analysis, E.E.; investigation, E.E.; writing—original draft preparation, E.E. and A.I.; writing—review and editing, E.E., A.I. and F.M.M.; visualization, E.E. All authors have read and agreed to the published version of the manuscript.

Funding

This research was funded by The Ministry of Energy and Mineral Resources, Republic of Indonesia, letter of assignment number 2917K/69/MEM/2013.

Data Availability Statement

Data available on request due to company confidentiality.

Acknowledgments

The authors thank the management of Masmindo Dwi Area Company for their permission to use their data and samples for this study. For most of the analytical work, the facilities of the Institute of Applied Mineralogy and Economic Geology, RWTH Aachen University were used. Help with QEMSCAN and EPMA measurements from Lars Gronen and Roman Klinghardt is gratefully acknowledged.

Conflicts of Interest

The authors declare no conflict of interest.

References

  1. Gresens, R.L. Composition-volume relationships of metasomatism. Chem. Geol. 1967, 2, 47–65. [Google Scholar] [CrossRef]
  2. Grant, J.A. The isocon diagram; a simple solution to Gresens’ equation for metasomatic alteration. Econ. Geol. 1986, 81, 1976–1982. [Google Scholar] [CrossRef]
  3. Kolb, J.; Meyer, F.M. Balanced mineral reactions for alteration zones developed in auriferous shear zones of the Hutti Mine, Dharwar Craton, India. Z. Dtsch. Ges. Geowiss. 2008, 159, 331–347. [Google Scholar] [CrossRef]
  4. Kerrich, R.; Fyfe, W.S.; German, B.E.; Allison, I. Local modification of rock chemistry by deformation. Contrib. Miner. Petrol. 1977, 65, 183–190. [Google Scholar] [CrossRef]
  5. Baumgartner, L.P.; Olsen, S.N. A least-squares approach to mass transport calculations using the isocon method. Econ. Geol. 1995, 90, 1261–1270. [Google Scholar] [CrossRef]
  6. Mountain, B.W.; Williams-Jones, A.W. Mass transfer and the path of metasomatic reactions in mesothermal gold deposits; an example from Flambeau Lake, Ontario. Econ. Geol. 1996, 91, 302–321. [Google Scholar] [CrossRef]
  7. Kretz, R. Redistribution of major and trace elements during the formation of biotite–plagioclase reaction zones at boundaries between amphibolite and K-feldspar gneiss, Otter Lake area, Quebec, Canada. Canad. Miner. 2000, 38, 525–543. [Google Scholar] [CrossRef]
  8. Idrus, A.; Kolb, J.; Meyer, F.M. Mineralogy, lithogeochemistry and elemental mass balance of the hydrothermal alteration associated with the gold-rich Batu Hijau porphyry copper deposit, Sumbawa Island, Indonesia. Resour. Geol. 2009, 59, 215–230. [Google Scholar] [CrossRef]
  9. Dipple, G.M.; Ferry, J.M. Metasomatism and fluid flow in ductile fault zones. Contrib. Miner. Petrol. 1992, 112, 149–164. [Google Scholar] [CrossRef]
  10. Taylor, H.P., Jr. Oxygen and hydrogen isotope relationships in hydrothermal mineral deposits. Geochem. Hydr. Ore Dep. 1979, 1979, 236–277. [Google Scholar]
  11. de Groot, P.A. Water/Rock Ratio Calculations in Hydrothermal Systems: A Case Study from Bergslagen, Central Sweden; No. 314; Economic Geology Research Unit, Department of Geology, University of the Witwatersrand: Johannesburg, South Africa, 1997. [Google Scholar]
  12. Parkinson, C.D. An outline of the petrology, structure and age of the Pompangano Schist Complex of central Sulawesi, Indonesia. Isl. Arc 1998, 7, 231–245. [Google Scholar] [CrossRef]
  13. Elburg, M.; van Leeuwen, T.M.; Foden, J. Spatial and temporal isotopic domains of contrasting igneous suites in western and northern Sulawesi, Indonesia. Chem. Geol. 2003, 199, 243–276. [Google Scholar] [CrossRef]
  14. van Leeuwen, T.M.; Allen, C.M.; Kadarusman, A.; Elburg, M.; Palin, J.M. Petrologic, isotopic, and radiometric age constraints on the origin and tectonic history of the Malino Metamorphic Complex, NW Sulawesi, Indonesia. J. Asian Earth Sci. 2007, 29, 751–777. [Google Scholar] [CrossRef]
  15. Cottam, M.A.; Hall, R.; Forster, M.A.; Boudagher-Fadel, M.K. Basement character and basin formation in Gorontalo Bay, Sulawesi, Indonesia: New observations from the Togian Islands. J. Geol. Soc. Lond. 2011, 355, 177–202. [Google Scholar] [CrossRef]
  16. White, L.T.; Hall, R.; Armstrong, R.A.; Barber, A.J.; Fadel, M.B.; Baxter, A.; Wakita, K.; Manning, C.; Soesilo, J. The geological history of the Latimojong region of western Sulawesi, Indonesia. J. Asian Earth Sci. 2017, 138, 72–91. [Google Scholar] [CrossRef]
  17. Archibald, N.J.; Power, W.L.; Ketelaar, P.B.; Utley, D.C.; Panizza, N.; Nichols, S.N. Geology of the Awak Mas prospect area, south central Sulawesi, Indonesia. Unpublished Internal Report of PT Masmindo Eka Sakti, Jakarta. 1996. [Google Scholar]
  18. Querubin, C.D.; Waters, S. Geology and mineralization of Awak Mas: A sedimentary hosted gold deposit, South Sulawesi, Indonesia. Maj. Geol. Ind. 2012, 27, 69–85. [Google Scholar]
  19. Djuri, S.; Bachri, S. Geological Map of the Majene and The Western Part of Palopo Sheets, Sulawesi, Scale 1, 250,000; Geological Research and Development Centre: Bandung, Indonesia, 1998. [Google Scholar]
  20. Tuakia, M.Z.; Takahashi, R.; Imai, A. Geological and Geochemical Characteristics of Gold Mineralization in the Salu Bulo Prospect, Sulawesi, Indonesia. Resour. Geol. 2019, 69, 176–192. [Google Scholar] [CrossRef]
  21. Al Hakim, A.Y.; Melcher, F.; Prochaska, W.; Bakker, R.; Rantitsch, G. Formation of epizonal gold mineralization within the Latimojong Metamorphic Complex, Sulawesi, Indonesia: Evidence from mineralogy, Fluid inclusions and Raman spectroscopy. Ore Geol. Rev. 2018, 97, 88–108. [Google Scholar] [CrossRef]
  22. Ernowo, E.; Meyer, F.M.; Idrus, A. Hydrothermal alteration and gold mineralization of the Awak Mas metasedimentary rock-hosted gold deposit, Sulawesi, Indonesia. Ore Geol. Rev. 2019, 113, 103083. [Google Scholar] [CrossRef]
  23. Ernowo. Hydrothermal Alteration and Gold Mineralization of the Awak Mas Gold Deposit, Sulawesi Island, Indonesia. Dissertation’s Thesis, RWTH Aachen University, Aachen, Germany, 2017. [Google Scholar]
  24. Gottlieb, P.; Wilkie, G.; Sutherland, D.; Ho-Tun, E.; Suthers, S.; Perera, K.; Rayner, J. Using quantitative electron microscopy for process mineralogy applications. Jom 2000, 52, 24–25. [Google Scholar] [CrossRef]
  25. Pirrie, D.; Butcher, A.R.; Power, M.R.; Gottlieb, P.; Miller, G.L. Rapid quantitative mineral and phase analysis using automated scanning electron microscopy (QemSCAN); potential applications in forensic geoscience. J. Geol. Soc. Lond. 2004, 232, 123–136. [Google Scholar] [CrossRef]
  26. Sindern, S.; Meyer, F.M. Automated quantitative rare earth elements mineralogy by scanning electron microscopy. In Handbook of Rare Earth Elements: Analytics; Walter de Gruyter GmbH & Co KG: Berlin, Germany, 2017. [Google Scholar]
  27. Bohlen, S.R.; Eric, J.E. Evaluation of coexisting garnet-biotite, garnet-clinopyroxene, and other Mg-Fe exchange thermometers in Adirondack granulites. Geol. Soc. Am. Bull. 1980, 91, 685–719. [Google Scholar] [CrossRef]
  28. Kerr, P.F. Analytical Data on Reference Clay Materials. No. 7; Columbia University: New York, NY, USA, 1950. [Google Scholar]
  29. Böhlke, J.K. Comparison of Metasomatic Reactions Between a Common CO2-Rich Vein Fluid and Diverse Wall Rocks. Intensive Variables, Mass Transfers, and Au Mineralization at Alleghany. Cal. Econ. Geol. 1989, 84, 291–327. [Google Scholar] [CrossRef]
  30. Selverstone, J.; Morteani, G.; Staude, J.M. Fluid channeling during ductile shearing: Transformation of granodiorite into aluminous schist in the Tauern Window, Eastern Alps. J. Metamorph. Geol. 1991, 9, 419–431. [Google Scholar] [CrossRef]
  31. McCaigh, A.M. The geochemistry of volatile fluid flow in shear zones. Deformation enhanced fluid transport in earth’s crust and mantle. M.B. Holnes Miner. Sic. Ser. Lond. 1997, 8, 227–266. [Google Scholar]
  32. Wang, R.; Cudahy, T.; Laukamp, C.; Walshe, J.L.; Bath, A.; Mei, Y.; Young, C.; Roache, T.J.; Jenkins, A.; Roberts, M.; et al. White mica as a hyperspectral tool in exploration for the Sunrise Dam and Kanowna Belle gold deposits, Western Australia. Econ. Geol. 2017, 112, 1153–1176. [Google Scholar]
  33. Bogossian, J.; Hagemann, S.G.; Rodrigues, V.G.; Lobato, L.M.; Roberts, M. Hydrothermal alteration and mineralization in the Faina greenstone belt: Evidence from the Cascavel and Sertão orogenic gold deposits. Ore Geol. Rev. 2020, 119, 103293. [Google Scholar] [CrossRef]
  34. Zoheir, B.; Feigenson, M.; Zi, J.W.; Turrin, B.; Deshesh, F.; El-Metwally, A. Ediacaran (~600 Ma) orogenic gold in Egypt: Age of the Atalla gold mineralization and its geological significance. Int. Geol. Rev. 2019, 61, 779–794. [Google Scholar] [CrossRef]
  35. Wilde, A.R.; Bierlein, F.P.; Pawlitschek, M. Lithogeochemistry of orogenic gold deposits in Victoria, SE Australia: A preliminary assessment for undercover exploration. J. Geochem. Explor. 2004, 84, 35–50. [Google Scholar] [CrossRef]
  36. Morasse, S.; Hodgson, C.J.; Guha, J.; Coulombe, A. Oxidative, alkali-amphibole-bearing alteration and its relation to gold in the senite-associated Lac Shortt deposit, Abitibi greenstone belt, Quebec, Canada. In Bicentennial Gold 88: Extended Abstracts; Geological Society of Australia: Sydney, Australia, 1988; Volume 1, pp. 92–94. [Google Scholar]
  37. Albino, G.V. Sodium metasomatism along the Melones Fault Zone, Sierra Nevada Foothills, California, USA. Miner. Mag. 1995, 59, 383–399. [Google Scholar] [CrossRef]
  38. Coveney, R.M., Jr. Gold quartz veins and auriferous granite at the Oriental mine, Alleghany district, California. Econ. Geol. 1981, 76, 2176–2199. [Google Scholar] [CrossRef]
  39. Böhlke, J.K.; Kistler, R.W. Rb-Sr, K-Ar, and stable isotope evidence for the ages and sources of fluid components of gold-bearing quartz veins in the northern Sierra Nevada foothills metamorphic belt, California. Econ. Geol. 1986, 81, 296–322. [Google Scholar] [CrossRef]
  40. Phillips, G.N.; Groves, D.J. The nature of Archaean gold bearing fluids as deduced from gold deposits of Western Australia. J. Geol. Soc. Aust. 1993, 30, 25–39. [Google Scholar] [CrossRef]
  41. Groves, D.L.; Phillips, G.N.; Ho, S.E.; Houstoun, S.M. The nature, genesis and regional controls of gold mineralization in Archaean greenstone belts of the Western Australian Shield; a brief review. S. Afr. J. Geol. 1985, 88, 135–148. [Google Scholar]
  42. Mikucki, E.J. Hydrothermal transport and depositional processes in Archean lode-gold systems: A review. Ore Geol. Rev. 1998, 13, 307–321. [Google Scholar] [CrossRef]
  43. Stefansson, A.; Seward, T.M. Stability of chloride gold(I) complexes in aqueous solutions from 300 to 600 °C and from 500 to 1800 bar. Geochim. Cosmochim. Acta 2003, 67, 4559–4576. [Google Scholar] [CrossRef]
  44. Stefansson, A.; Seward, T.M. Gold(I) complexing in aqueous sulphide solutions to 500 °C at 500 bar. Geochim. Cosmochim. Acta 2004, 68, 4121–4143. [Google Scholar] [CrossRef]
  45. Phillips, G.N.; Powell, R. Formation of gold deposits: A metamorphic devolatilization model. J. Metamorph. Geol. 2010, 28, 689–718. [Google Scholar] [CrossRef]
  46. McCuaig, T.C.; Kerrich, R. P—T—T—Deformation—Fluid characteristics of lode gold deposits: Evidence from alteration systematics. Ore Geol. Rev. 1998, 12, 381–453. [Google Scholar] [CrossRef]
  47. Craw, D.; Upton, P.; MacKenzie, D.J. Hydrothermal alteration styles in ancient and modern orogenic gold deposits, New Zealand. N. Z. J. Geol. Geophys. 2009, 52, 11–26. [Google Scholar] [CrossRef]
Figure 1. (a) Geology of Sulawesi Island, modified from [12], where the location of study area is shown by the black rectangle, (b) Geology of Awak Mas gold deposit, modified from [16,17,18]. The drillhole 638 location is shown by the red dot.
Minerals 12 01630 g001
Figure 2. Sketch of core log of drill hole number 638 with the gold content [23]. 1 = sample of albite–chlorite alteration zone, 2 = sample of albite–ankerite–pyrite alteration zone.
Minerals 12 01630 g002
Figure 3. Photomicrograph of: (a) Least altered phyllite (b) Albite–chlorite alteration zone, and (c) Albite–ankerite–pyrite alteration zone. Abbreviations: Ab = albite, Ank = ankerite, Bt = biotite, Cal = calcite, Chl = chlorite, Kln = kaolinite, Ms = muscovite, Py = pyrite, Qz = quartz, Sd = siderite.
Minerals 12 01630 g003
Figure 4. Mineral map by QEMSCAN analysis showing the distribution minerals in the (a) least altered phyllite, (b) albite–chlorite alteration zone, and (c) albite–ankerite–pyrite alteration zone. (Plagioclase = albite, white mica = muscovite).
Minerals 12 01630 g004
Figure 5. Mineral assembly in alteration zones. (Abbreviations: Ab = albite, Ank = ankerite, Chl = chlorite and Py = pyrite).
Minerals 12 01630 g005
Figure 6. Gains and losses of elements during alteration of phyllites: (a) least altered phyllite to the albite–chlorite alteration zone, (b) albite–chlorite alteration zone to the albite–ankerite–pyrite alteration zone and (c) least altered phyllite to the albite–ankerite–pyrite alteration zone.
Minerals 12 01630 g006
Table 1. Mineral quantification from different alteration zones measured by QEMSCAN.
Mineral (Mass %)Least Altered PhylliteAlbite–Chlorite Alteration ZoneAlbite–Ankerite–Pyrite Alteration Zone
Muscovite5630
Albite186476
Chlorite12240
Quartz821
Biotite300
Rutile111
Kaolinite101
Calcite050
Ankerite0012
Siderite003
Pyrite116
Table 2. Geochemical data of major oxides from different alteration zones measured by XRF.
NoAlteration ZoneSiO2Fe2O3TiO2Al2O3MnOMgOCaONa2OK2OP2O5SO3Cr2O3LOITotal
1Least altered56.566.830.9018.910.172.060.510.893.370.14bdlbdl8.4899.00
2Albite-chlorite65.018.030.8311.710.223.311.122.390.900.11bdlbdl5.5399.35
3Albite-ankerite-pyrite51.269.380.8318.910.174.123.427.930.340.220.47bdl4.86101.91
Table 3. Mineral formulae calculated from electron microprobe analysis used for the balanced mineral reactions of least altered phyllite.
ElementLeast Altered Phyllite
AlbiteQuartzMuscoviteChloriteBiotiePyriteRutileKaolinite
Si2.9501.0003.3062.9262.8030.0000.0151.978
Al1.0360.0001.9792.8441.3330.0000.0031.991
Ti0.0000.0000.0980.0040.3190.0000.9860.000
Fe0.0190.0000.4862.1851.3981.0010.0110.006
Mg0.0000.0000.3151.5831.1640.0000.0000.010
Ca0.0090.0000.0090.0030.0020.0000.0020.016
Na0.9370.0000.4330.0060.0210.0000.0000.021
K0.0070.0000.3650.0430.9890.0000.0000.023
Mn0.0010.0000.0140.0780.0070.0000.0000.000
O8.0002.00011.00018.00012.0000.0002.0009.000
C0.0000.0000.0000.0000.0000.0000.0000.000
S0.0000.0000.0000.0000.0001.9990.0000.000
H0.0000.0002.0008.0002.0000.0000.0004.000
Table 4. Mineral formulae calculated from electron microprobe analysis used for the balanced mineral reactions of albite–chlorite alteration zone.
ElementAlbite–Chlorite Alteration Zone
AlbiteQuartzMuscoviteChloriteCalcitePyriteRutile
Si2.9601.0003.5342.7580.0000.0000.015
Al1.0710.0001.9892.5530.0000.0000.003
Ti0.0000.0000.0010.0010.0000.0000.986
Fe0.0150.0000.2012.3040.0021.0010.011
Mg0.0000.0000.2992.3040.0010.0000.000
Ca0.0170.0000.0040.0090.9930.0000.002
Na0.9380.0000.0150.0020.0000.0000.000
K0.0180.0000.8640.0050.0000.0000.000
Mn0.0000.0000.0030.0310.0030.0000.000
O8.0002.00011.00018.0003.0000.0002.000
C0.0000.0000.0000.0001.0000.0000.000
S0.0000.0000.0000.0000.0001.9990.000
H0.0000.0002.0008.0000.0000.0000.000
Table 5. Mineral formulae calculated from electron microprobe analysis used for the balanced mineral reactions of albite–ankerite–pyrite alteration zone.
ElementAlbite–Ankerite–Pyrite Alteration Zone
AlbiteQuartzMuscoviteChloriteAnkeriteSideritePyrite
Si3.0011.0003.5342.7580.0020.0130.000
Al0.9990.0001.9892.5530.0000.0000.000
Ti0.0000.0000.0010.0010.0000.0000.000
Fe0.0030.0000.2012.3040.4130.6261.001
Mg0.0000.0000.2992.3040.5370.2960.000
Ca0.0020.0000.0040.0090.9910.0250.000
Na0.9310.0000.0150.0020.0000.0000.000
K0.0020.0000.8640.0050.0000.0000.000
Mn0.0000.0000.0030.0310.0500.0270.000
O8.0002.00011.00018.0006.0003.0000.000
C0.0000.0000.0000.0002.0001.0000.000
S0.0000.0000.0000.0000.0000.0001.999
H0.0000.0002.0008.0000.0000.0000.000
Table 6. Quantified compositional data for the least altered phyllite and the albite–chlorite alteration zone. The calculation was based on modal and mineral compositions balanced for immobile Al and a 14.5% mass increase. The difference indicates gain or loss/100 g for components and in % for volume changes in rock.
ElementLeast Altered PhylliteTotal (g)
AbQzMsChlBtPyRtKn100
Si0.200.130.480.060.020.000.000.010.89
Al0.070.000.280.050.010.000.000.010.43
Ti0.000.000.010.000.000.000.010.000.03
Fe0.000.000.070.040.010.000.000.000.13
Mg0.000.000.050.030.010.000.000.000.08
Ca0.000.000.000.000.000.000.000.000.00
Na0.060.000.060.000.000.000.000.000.13
K0.000.000.050.000.010.000.000.000.06
Mn0.000.000.000.000.000.000.000.000.00
O0.550.271.580.350.080.000.020.032.88
C0.000.000.000.000.000.000.000.000.00
S0.000.000.000.000.000.010.000.000.01
H0.000.000.290.150.010.000.000.020.47
Mole0.070.130.140.020.010.000.010.00
molar vol.100.4522.69140.57210.57152.1023.9518.6999.35
Vol. in rock6.903.0220.234.060.970.120.230.3835.92
ElementAlbite–Chlorite Alteration ZoneTotal (g)Difference
AbQzMsChlCalPyRt114.5moleGram
Si0.820.040.030.120.000.000.001.010.123.34
Al0.300.000.020.110.000.000.000.430.00−0.01
Ti0.000.000.000.000.000.000.010.01−0.01−0.69
Fe0.000.000.000.100.000.010.000.12−0.01−0.62
Mg0.000.000.000.100.000.000.000.100.020.48
Ca0.000.000.000.000.060.000.000.060.062.40
Na0.260.000.000.000.000.000.000.260.133.07
K0.000.000.010.000.000.000.000.01−0.05−1.85
Mn0.000.000.000.000.000.000.000.000.00−0.11
O2.220.080.100.790.170.000.033.380.508.01
C0.000.000.000.000.060.000.000.060.060.69
S0.000.000.000.000.000.020.000.020.010.30
H0.000.000.020.350.000.000.000.37−0.10−0.10
Mole0.240.030.010.040.050.010.01
molar vol.100.4522.69140.57210.5736.9323.9518.69
Vol. in rock24.370.761.108.031.840.200.2336.530.61
Abbreviation: Ab = albite, Bt = biotite, Cal = calcite, Chl = chlorite, Kn = kaolinite, Ms = muscovite, Py = pyrite, Qz = quartz, Rt = rutile.
Table 7. Quantified compositional data for the albite–chlorite alteration zone and the albite–ankerite–pyrite alteration zone. The calculation was based on modal and mineral compositions balanced for immobile Al and a 22.7% mass increase. The difference indicates gain or loss /100 g for components and in % for volume changes in rock.
ElementAlbite–Chlorite Alteration ZoneTotal (g)
AbQzMsChlCalPyRt100
Si0.720.030.030.110.000.000.000.88
Al0.260.000.020.100.000.000.000.37
Ti0.000.000.000.000.000.000.010.01
Fe0.000.000.000.090.000.010.000.10
Mg0.000.000.000.090.000.000.000.09
Ca0.000.000.000.000.050.000.000.05
Na0.230.000.000.000.000.000.000.23
K0.000.000.010.000.000.000.000.01
Mn0.000.000.000.000.000.000.000.00
O1.940.070.090.690.150.000.022.95
C0.000.000.000.000.050.000.000.05
S0.000.000.000.000.000.020.000.02
H0.000.000.020.310.000.000.000.32
Mole0.240.030.010.040.050.010.01
molar vol.100.4522.69140.57210.5736.9323.9518.69
Vol. in rock24.370.761.108.031.840.200.2336.53
ElementAlbite–Ankerite–Pyrite Alteration ZoneTotal (g)Difference
AbQzMsChlAnkSdPy122.7MoleGram
Si1.090.020.010.010.000.000.001.120.246.73
Al0.360.000.010.000.000.000.000.370.000.00
Ti0.000.000.000.000.000.000.000.00−0.01−0.59
Fe0.000.000.000.000.030.020.060.120.020.90
Mg0.000.000.000.000.040.010.000.05−0.04−0.92
Ca0.000.000.000.000.070.000.000.070.010.60
Na0.340.000.000.000.000.000.000.340.112.51
K0.000.000.000.000.000.000.000.00−0.01−0.31
Mn0.000.000.000.000.000.000.000.000.000.17
O2.900.040.040.040.410.110.003.520.579.05
C0.000.000.000.000.140.040.000.170.121.45
S0.000.000.000.000.000.000.120.120.113.40
H0.000.000.010.020.000.000.000.02−0.30−0.30
Mole0.300.020.000.000.060.030.05
molar vol.100.4522.69140.57210.5765.5829.4323.95
Vol. in rock29.640.380.370.333.630.841.2036.38−0.15
Abbreviations: Ab = albite, Ank = ankerite, Bt = biotite, Cal = calcite, Chl = chlorite, Ms = muscovite, Py = pyrite, Qz = quartz, Rt = rutile and Sd—siderite.
Table 8. Quantified compositional data for the least altered phyllite and the albite–ankerite–pyrite alteration zone. The calculation was based on modal and mineral compositions balanced for immobile Al and a 40.5% mass increase. The difference indicates gain or loss /100 g for components and in % for volume changes in rock.
ElementLeast Altered PhylliteTotal (g)
AbQzMsChlBtPyRtKn100
Si0.200.130.480.060.020.000.000.010.89
Al0.070.000.280.050.010.000.000.010.43
Ti0.000.000.010.000.000.000.010.000.03
Fe0.000.000.070.040.010.000.000.000.13
Mg0.000.000.050.030.010.000.000.000.08
Ca0.000.000.000.000.000.000.000.000.00
Na0.060.000.060.000.000.000.000.000.13
K0.000.000.050.000.010.000.000.000.06
Mn0.000.000.000.000.000.000.000.000.00
O0.550.271.580.350.080.000.020.032.88
C0.000.000.000.000.000.000.000.000.00
S0.000.000.000.000.000.010.000.000.01
H0.000.000.290.150.010.000.000.020.47
Mole0.070.130.140.020.010.000.010.00
molar vol.100.4522.69140.57210.57152.1023.9518.6999.35
Vol. in rock6.903.0220.234.060.970.120.230.3835.92
ElementAlbite–Ankerite–Pyrite alt. ZoneTotal (g)Difference
AbQzMsChlAnkSdPy140.5MoleGram
Si1.240.020.010.010.000.000.001.290.3911.05
Al0.410.000.010.010.000.000.000.430.000.00
Ti0.000.000.000.000.000.000.000.00−0.03−1.36
Fe0.000.000.000.010.030.030.070.130.010.41
Mg0.000.000.000.010.040.010.000.06−0.02−0.57
Ca0.000.000.000.000.080.000.000.080.083.09
Na0.390.000.000.000.000.000.000.390.265.95
K0.000.000.000.000.000.000.000.00−0.06−2.20
Mn0.000.000.000.000.000.000.000.010.000.09
O3.320.050.040.040.470.120.004.031.1518.37
C0.000.000.000.000.160.040.000.200.202.35
S0.000.000.000.000.000.000.140.140.134.19
H0.000.000.010.020.000.000.000.03−0.45−0.45
Mole0.300.020.000.000.060.030.05
molar vol.100.4522.69140.57210.5765.5829.4323.95
Vol. in rock29.640.380.370.333.630.841.2036.380.47
Abbreviation: Ab = albite, Ank = ankerite, Bt = biotite, Cal = calcite, Chl = chlorite, Kn = kaolinite, Ms = muscovite, Py = pyrite, Qz = quartz, Rt = rutile, Sd = siderite.
Publisher’s Note: MDPI stays neutral with regard to jurisdictional claims in published maps and institutional affiliations.

