
Optimization of Parameters for Rheological Properties and Strength of Cemented Paste Backfill Blended with Coarse Aggregates

 ,
,
Abstract
:1. Introduction
2. Materials and Methods
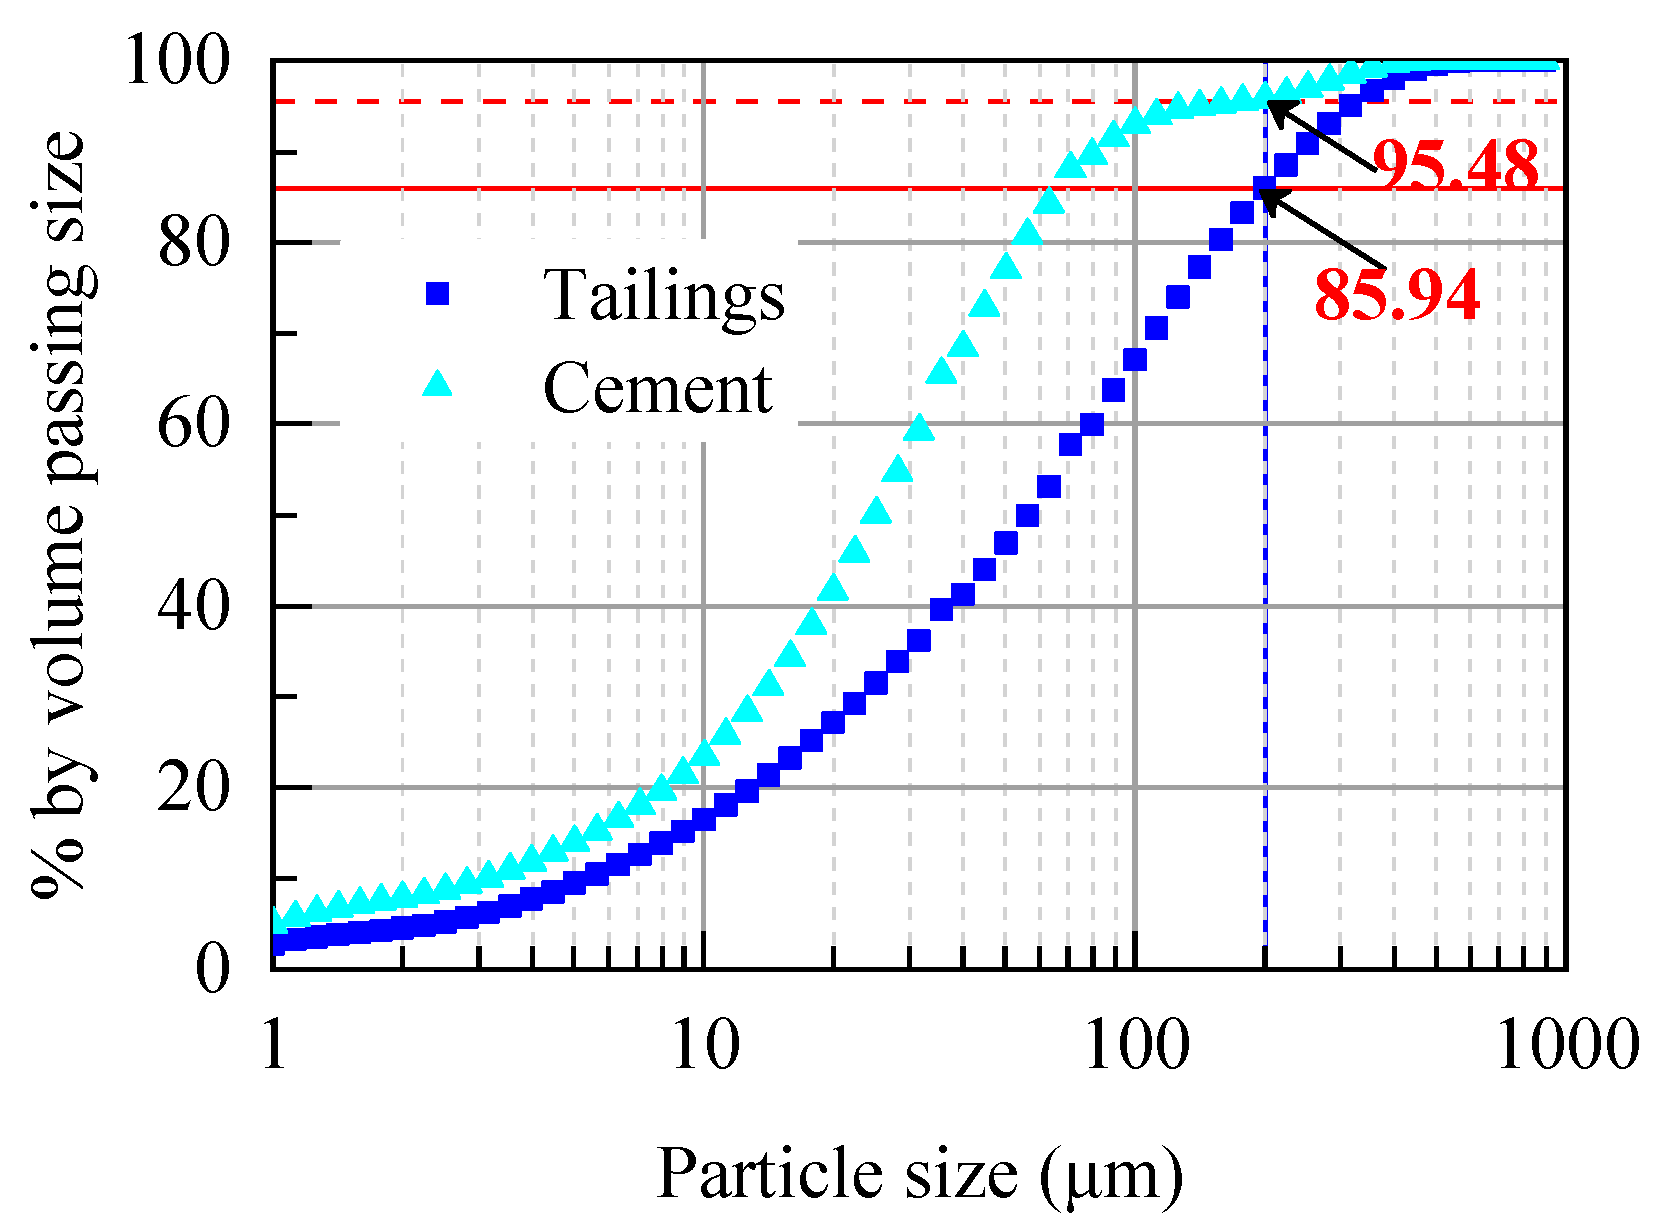
2.1. Materials
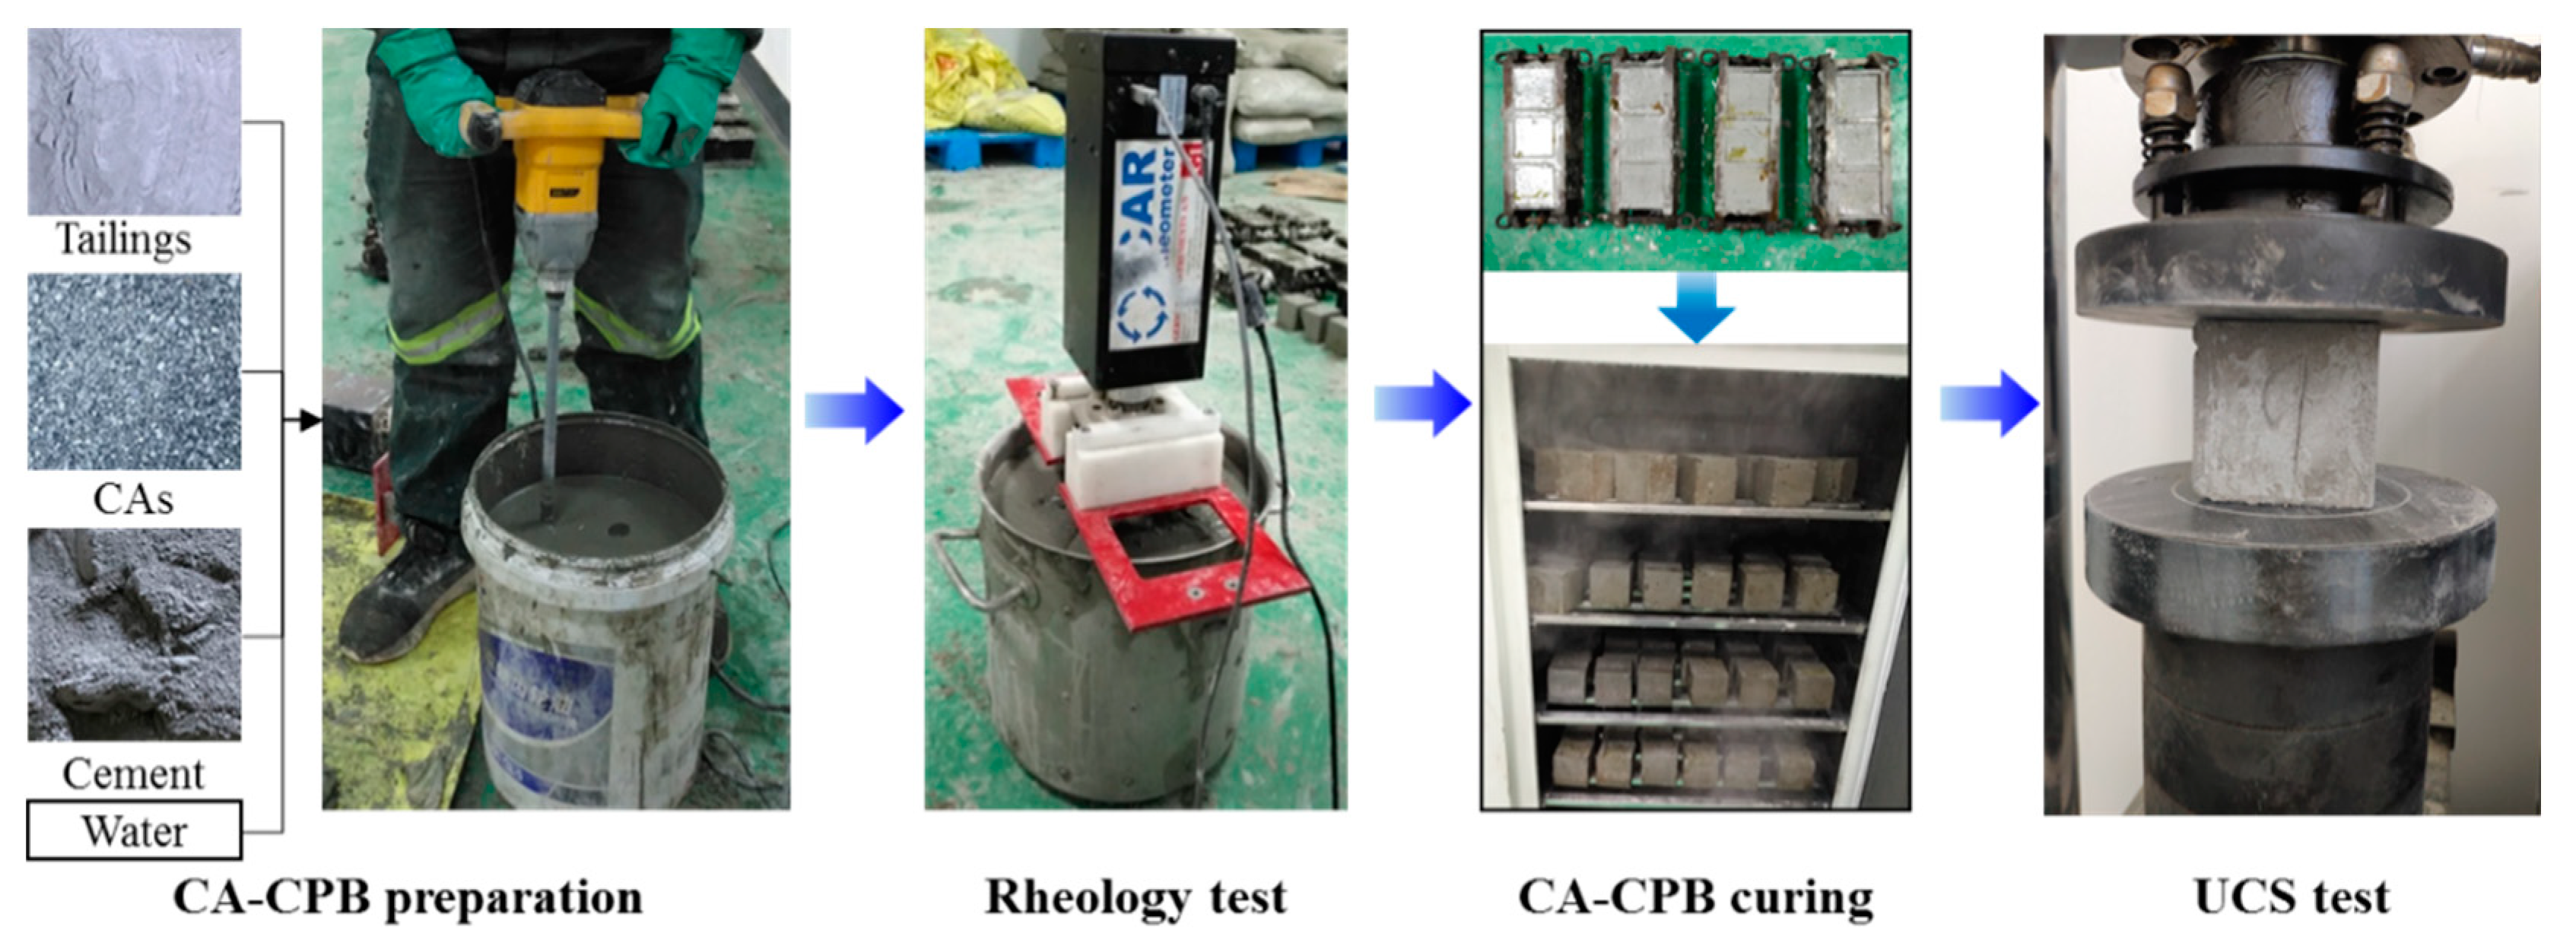
2.2. Test/Methods
2.3. Orthogonal Experiment Design
3. Results and Discussion
3.1. Overall Performance
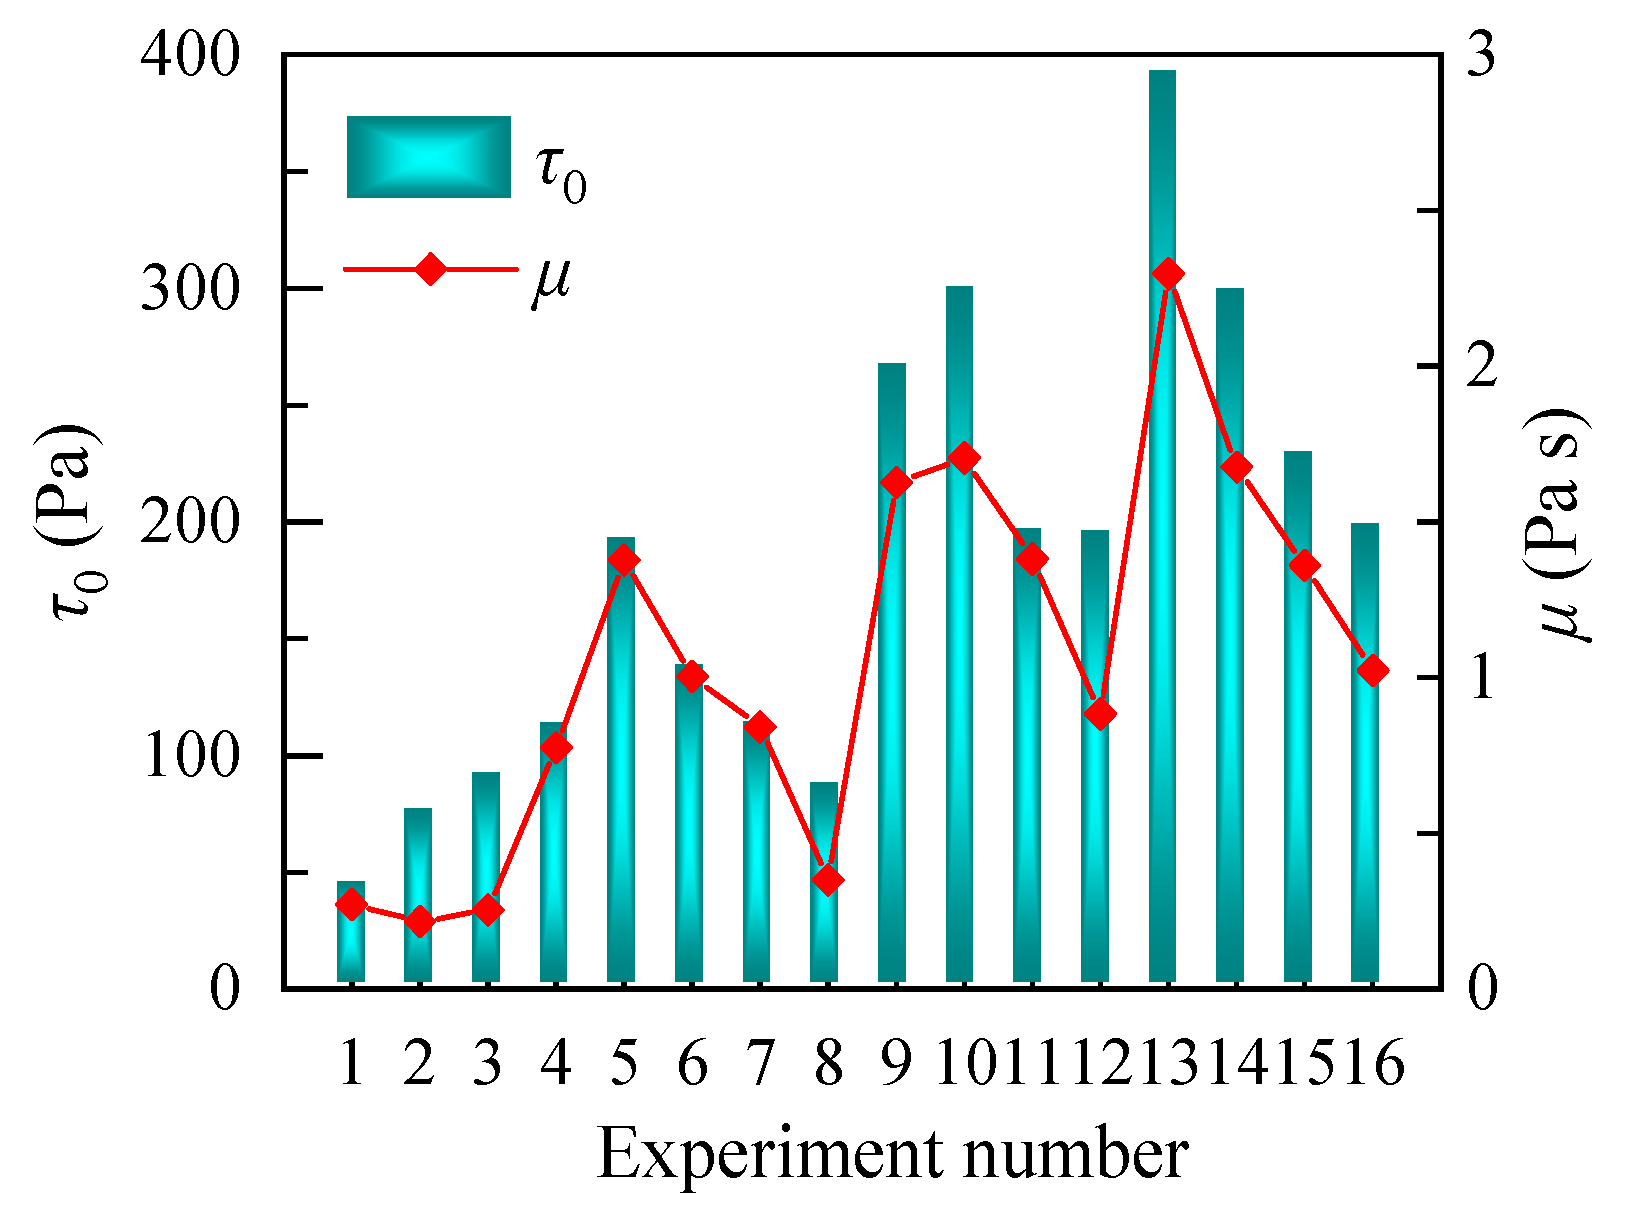
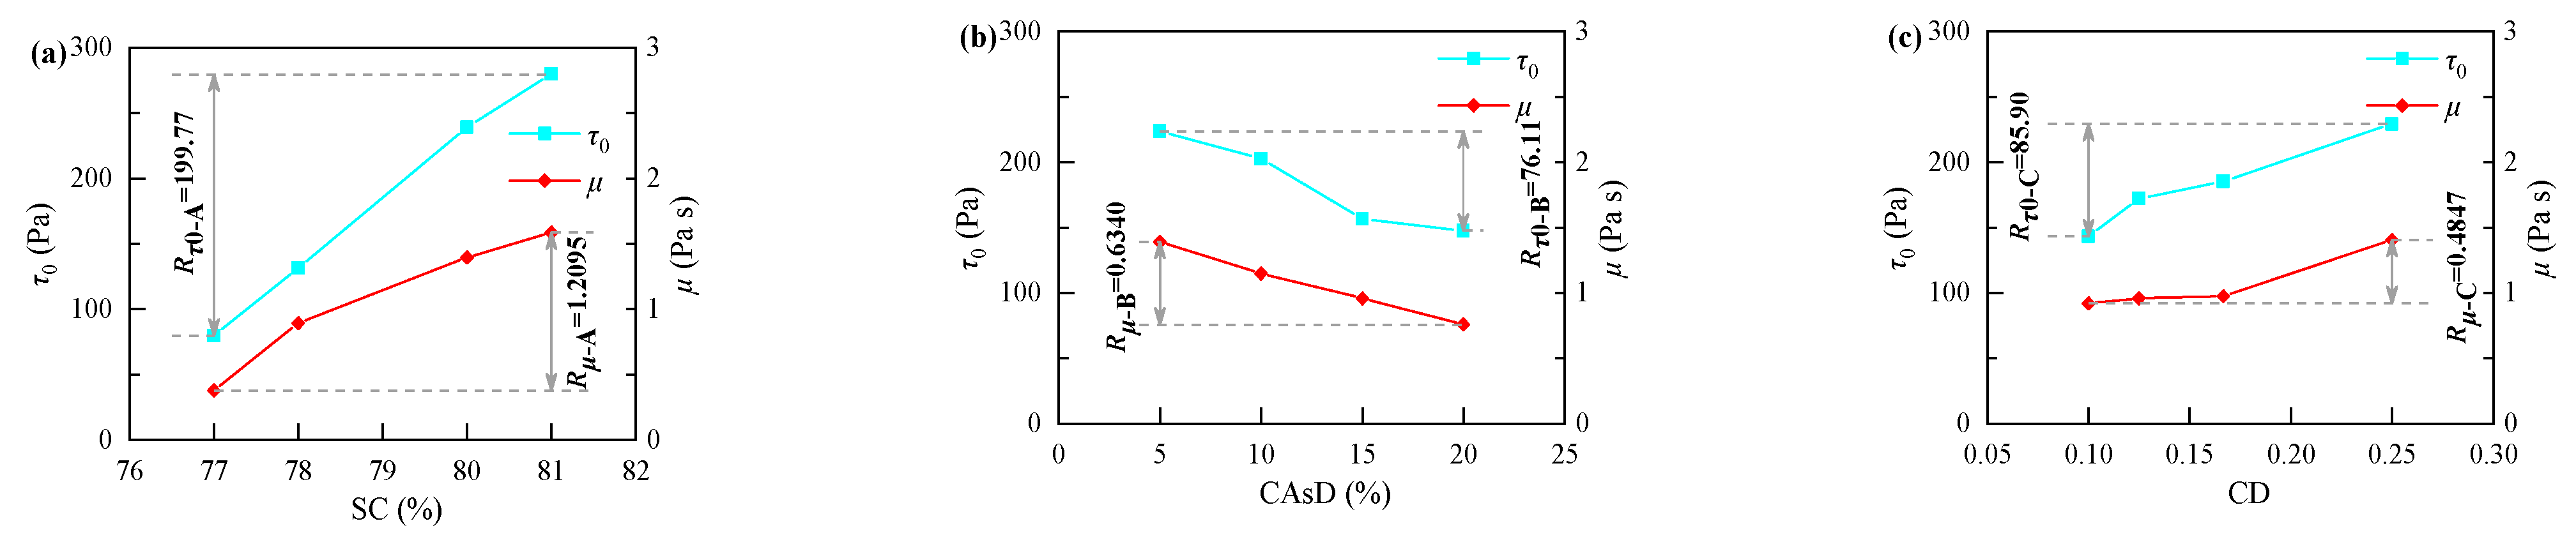
3.2. Range Analysis of Rheological Properties
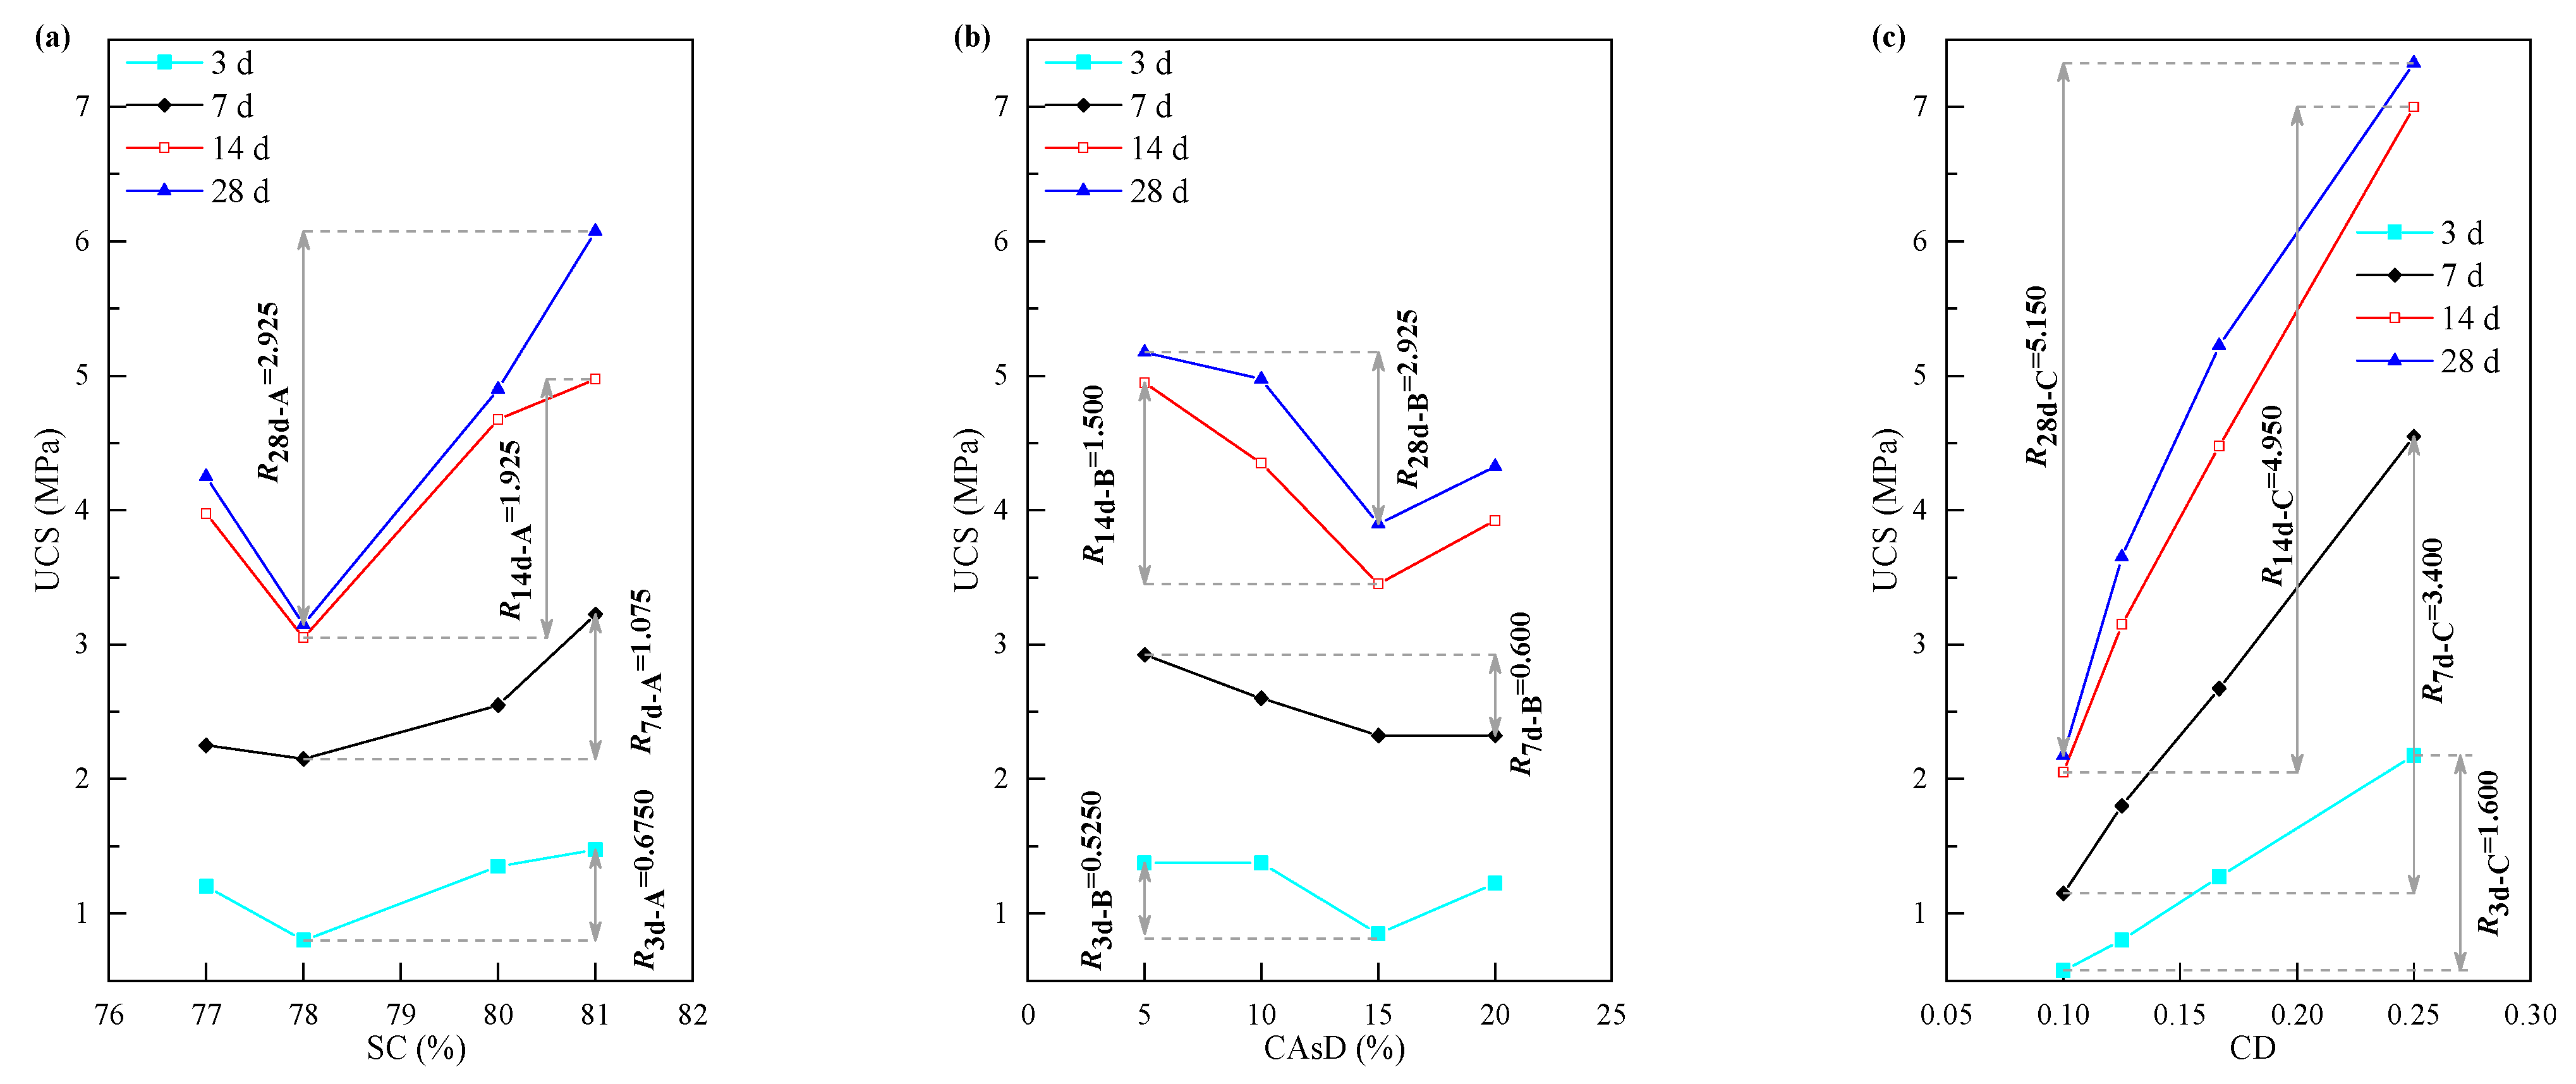
3.3. Range Analysis of UCS
3.4. Multiple Response Optimization and Validation
4. Conclusions
- (1)
- The effects of solid concentration, coarse aggregates dosage, and cement dosage on rheological properties differ from that on UCS. The most significant influences on rheological properties and UCS are solid concentration and cement dosage, respectively.
- (2)
- The optimal combinations for rheological properties and UCS are different.
- (3)
- The overall desirability function is an effective approach for multiple response optimization of CA-CPB.
- (4)
- The optimal conditions for the high fluidity and high strength of CA-CPB in this study are a solid concentration of 77%, coarse aggregates dosage of 20%, and cement dosage of 0.227, producing τ0 of 85.129 Pa, μ of 0.469 Pa s, and 28 d UCS of 6.96 MPa.
Author Contributions
Funding
Data Availability Statement
Acknowledgments
Conflicts of Interest
Abbreviations
| CA-CPB | CPB blended with coarse aggregates |
| CAs | coarse aggregates |
| CAsD | CAs dosage |
| CD | cement dosage |
| CPB | cemented paste backfill |
| OD | overall desirability |
| PSD | particle size distribution |
| SC | solid (tailings, CAs, and cement) concentration |
| UCS | uniaxial compressive strength |
| XRF | X-Ray Fluorescence |
References
- Asif, Z.; Chen, Z. Environmental management in North American mining sector. Environ. Sci. Pollut. Res. 2016, 23, 167–179. [Google Scholar] [CrossRef]
- Wu, D. Mine Waste Management in China: Recent Development; Springer: Singapore, 2020; ISBN 978-981-32-9215-4. [Google Scholar]
- Qi, C.; Fourie, A. Cemented paste backfill for mineral tailings management: Review and future perspectives. Miner. Eng. 2019, 144, 106025. [Google Scholar] [CrossRef]
- Lu, H.; Qi, C.; Chen, Q.; Gan, D.; Xue, Z.; Hu, Y. A new procedure for recycling waste tailings as cemented paste backfill to underground stopes and open pits. J. Clean. Prod. 2018, 188, 601–612. [Google Scholar] [CrossRef]
- Ruan, Z.; Wu, A.; Bürger, R.; Betancourt, F.; Ordoñez, R.; Wang, J.; Wang, S.; Wang, Y. A Population Balance Model for Shear-Induced Polymer-Bridging Flocculation of Total Tailings. Minerals 2021, 12, 40. [Google Scholar] [CrossRef]
- Yang, L.; Yilmaz, E.; Li, J.; Liu, H.; Jiang, H. Effect of superplasticizer type and dosage on fluidity and strength behavior of cemented tailings backfill with different solid contents. Constr. Build. Mater. 2018, 187, 290–298. [Google Scholar] [CrossRef]
- Gao, J.; Fourie, A. Spread is better: An investigation of the mini-slump test. Miner. Eng. 2015, 71, 120–132. [Google Scholar] [CrossRef]
- Li, H.; Wu, A.; Cheng, H. Analysis of conical slump shape reconstructed from stereovision images for yield stress prediction. Cem. Concr. Res. 2021, 150, 106601. [Google Scholar] [CrossRef]
- Li, W.; Guo, L.; Liu, G.; Pan, A.; Zhang, T. Analytical and experimental investigation of the relationship between spread and yield stress in the mini-cone test for cemented tailings backfill. Constr. Build. Mater. 2020, 260, 119770. [Google Scholar] [CrossRef]
- Yin, S.; Wu, A.; Hu, K.; Wang, Y.; Zhang, Y. The effect of solid components on the rheological and mechanical properties of cemented paste backfill. Miner. Eng. 2012, 35, 61–66. [Google Scholar] [CrossRef]
- Zhang, Y.; Gan, D.; Xue, Z.; Lu, H. Novel testing method for thixotropy of paste slurry with respect to influencing factors and rheological parameters. Adv. Powder Technol. 2021, 32, 4744–4753. [Google Scholar] [CrossRef]
- Wu, D.; Yang, B.; Liu, Y. Pressure drop in loop pipe flow of fresh cemented coal gangue-fly ash slurry: Experiment and simulation. Adv. Powder Technol. 2015, 26, 920–927. [Google Scholar] [CrossRef]
- Panchal, S.; Deb, D.; Sreenivas, T. Variability in rheology of cemented paste backfill with hydration age, binder and superplasticizer dosages. Adv. Powder Technol. 2018, 29, 2211–2220. [Google Scholar] [CrossRef]
- Adiguzel, D.; Bascetin, A. The investigation of effect of particle size distribution on flow behavior of paste tailings. J. Environ. Manag. 2019, 243, 393–401. [Google Scholar] [CrossRef] [PubMed]
- Cheng, H.; Wu, S.; Li, H.; Zhang, X. Influence of time and temperature on rheology and flow performance of cemented paste backfill. Constr. Build. Mater. 2020, 231, 117117. [Google Scholar] [CrossRef]
- Xu, W.; Zhang, Y.; Zuo, X.; Hong, M. Time-dependent rheological and mechanical properties of silica fume modified cemented tailings backfill in low temperature environment. Cem. Concr. Compos. 2020, 114, 103804. [Google Scholar] [CrossRef]
- Wu, D.; Fall, M.; Cai, S.J. Coupling temperature, cement hydration and rheological behaviour of fresh cemented paste backfill. Miner. Eng. 2013, 42, 76–87. [Google Scholar] [CrossRef]
- Ouattara, D.; Yahia, A.; Mbonimpa, M.; Belem, T. Effects of superplasticizer on rheological properties of cemented paste backfills. Int. J. Miner. Process. 2017, 161, 28–40. [Google Scholar] [CrossRef]
- Xu, W.; Chen, W.; Tian, M.; Guo, L. Effect of temperature on time-dependent rheological and compressive strength of fresh cemented paste backfill containing flocculants. Constr. Build. Mater. 2021, 267, 2020–2021. [Google Scholar] [CrossRef]
- Zhao, Y.; Taheri, A.; Karakus, M.; Chen, Z.; Deng, A. Effects of water content, water type and temperature on the rheological behaviour of slag-cement and fly ash-cement paste backfill. Int. J. Min. Sci. Technol. 2020, 30, 271–278. [Google Scholar] [CrossRef]
- Yang, L.; Wang, H.; Wu, A.; Li, H.; Tchamba, A.B.; Bier, T.A. Shear thinning and thickening of cemented paste backfill. Appl. Rheol. 2019, 29, 80–93. [Google Scholar] [CrossRef]
- Ruan, Z.; Wu, A.; Bürger, R.; Betancourt, F.; Wang, Y.; Wang, Y.; Jiao, H.; Wang, S. Effect of interparticle interactions on the yield stress of thickened flocculated copper mineral tailings slurry. Powder Technol. 2021, 392, 278–285. [Google Scholar] [CrossRef]
- Deng, X.; Zhang, J.; Klein, B.; Zhou, N.; deWit, B. Experimental characterization of the influence of solid components on the rheological and mechanical properties of cemented paste backfill. Int. J. Miner. Process. 2017, 168, 116–125. [Google Scholar] [CrossRef]
- Tariq, A.; Yanful, E.K. A review of binders used in cemented paste tailings for underground and surface disposal practices. J. Environ. Manag. 2013, 131, 138–149. [Google Scholar] [CrossRef]
- Cheng, H.; Wu, S.; Zhang, X.; Li, J. A Novel Prediction Model of Strength of Paste Backfill Prepared from Waste-Unclassified Tailings. Adv. Mater. Sci. Eng. 2019, 2019, 3574190. [Google Scholar] [CrossRef] [Green Version]
- Wu, A.; Wang, Y.; Wang, H.; Yin, S.; Miao, X. Coupled effects of cement type and water quality on the properties of cemented paste backfill. Int. J. Miner. Process. 2015, 143, 65–71. [Google Scholar] [CrossRef]
- Cao, G.; Wei, Z.; Wang, W.; Zheng, B. Shearing resistance of tailing sand waste pollutants mixed with different contents of fly ash. Environ. Sci. Pollut. Res. 2020, 27, 8046–8057. [Google Scholar] [CrossRef]
- Qiu, J.; Guo, Z.; Yang, L.; Jiang, H.; Zhao, Y. Effect of tailings fineness on flow, strength, ultrasonic and microstructure characteristics of cemented paste backfill. Constr. Build. Mater. 2020, 263, 120645. [Google Scholar] [CrossRef]
- Dong, Q.; Liang, B.; Jia, L.; Jiang, L. Effect of sulfide on the long-term strength of lead-zinc tailings cemented paste backfill. Constr. Build. Mater. 2019, 200, 436–446. [Google Scholar] [CrossRef]
- Sun, W.; Wu, A.; Wang, H.; Li, T.; Liu, S. Experimental study on the influences of sodium sulphide on zinc tailings cement paste backfill in Huize Lead-Zinc Mine. Int. J. Min. Miner. Eng. 2015, 6, 119–138. [Google Scholar] [CrossRef]
- Chen, S.; Wu, A.; Wang, Y.; Wang, W. Coupled effects of curing stress and curing temperature on mechanical and physical properties of cemented paste backfill. Constr. Build. Mater. 2021, 273, 121746. [Google Scholar] [CrossRef]
- Yao, G.; Cui, T.; Zhang, J.; Wang, J.; Lyu, X. Effects of mechanical grinding on pozzolanic activity and hydration properties of quartz. Adv. Powder Technol. 2020, 31, 4500–4509. [Google Scholar] [CrossRef]
- Fu, J.; Wang, J.; Song, W. Damage constitutive model and strength criterion of cemented paste backfill based on layered effect considerations. J. Mater. Res. Technol. 2020, 9, 6073–6084. [Google Scholar] [CrossRef]
- Koohestani, B.; Bussière, B.; Belem, T.; Koubaa, A. Influence of polymer powder on properties of cemented paste backfill. Int. J. Miner. Process. 2017, 167, 1–8. [Google Scholar] [CrossRef]
- Yu, B.; Chen, Y.; Liu, Q. Experimental study on the influence of coarse particle on the yield stress of debris flows. Appl. Rheol. 2016, 26, 10–12. [Google Scholar] [CrossRef]
- Mahaut, F.; Mokéddem, S.; Chateau, X.; Roussel, N.; Ovarlez, G. Effect of coarse particle volume fraction on the yield stress and thixotropy of cementitious materials. Cem. Concr. Res. 2008, 38, 1276–1285. [Google Scholar] [CrossRef] [Green Version]
- Choi, M.S. Numerical prediction on the effects of the coarse aggregate size to the pipe flow of pumped concrete. J. Adv. Concr. Technol. 2014, 12, 239–249. [Google Scholar] [CrossRef] [Green Version]
- Vishalakshi, K.P.; Revathi, V.; Sivamurthy Reddy, S. Effect of type of coarse aggregate on the strength properties and fracture energy of normal and high strength concrete. Eng. Fract. Mech. 2018, 194, 52–60. [Google Scholar] [CrossRef]
- Sun, W.; Wang, H.; Hou, K. Control of waste rock-tailings paste backfill for active mining subsidence areas. J. Clean. Prod. 2018, 171, 567–579. [Google Scholar] [CrossRef]
- Wu, J.; Yin, Q.; Gao, Y.; Meng, B.; Jing, H. Particle size distribution of aggregates effects on mesoscopic structural evolution of cemented waste rock backfill. Environ. Sci. Pollut. Res. 2021, 28, 16589–16601. [Google Scholar] [CrossRef]
- Durgun, M.Y.; Atahan, H.N. Rheological and fresh properties of reduced fine content self-compacting concretes produced with different particle sizes of nano SiO2. Constr. Build. Mater. 2017, 142, 431–443. [Google Scholar] [CrossRef]
- Li, H.; Huang, F.; Xie, Y.; Yi, Z.; Wang, Z. Effect of water–powder ratio on shear thickening response of SCC. Constr. Build. Mater. 2017, 131, 585–591. [Google Scholar] [CrossRef]
- Sethy, K.P.; Pasla, D.; Chandra Sahoo, U. Utilization of high volume of industrial slag in self compacting concrete. J. Clean. Prod. 2016, 112, 581–587. [Google Scholar] [CrossRef]
- Gui, L.; Long, M.; Chen, D.; Zhao, J.; Wang, Q.; Duan, H. Thermodynamic study on the solute partition coefficients on L/δand L/δ+γphase interfaces for 1215 high-sulfur steel solidification by orthogonal design. J. Mater. Res. Technol. 2020, 9, 89–103. [Google Scholar] [CrossRef]
- Fu, Q.; Xu, W.; Bu, M.X.; Guo, B.; Niu, D. Orthogonal experimental study on hybrid-fiber high-durability concrete for marine environment. J. Mater. Res. Technol. 2021, 13, 1790–1804. [Google Scholar] [CrossRef]
- Adeosun, J.T.; Lawal, A. Numerical and experimental studies of mixing characteristics in a T-junction microchannel using residence-time distribution. Chem. Eng. Sci. 2009, 64, 2422–2432. [Google Scholar] [CrossRef]
- Guo, G.; Fall, M. Modelling of preferential gas flow in heterogeneous and saturated bentonite based on phase field method. Comput. Geotech. 2019, 116, 103206. [Google Scholar] [CrossRef]
- Zheng, G.; Huang, J.; Diao, Y.; Ma, A.; Su, Y.; Chen, H. Formulation and performance of slow-setting cement-based grouting paste (SCGP) for capsule grouting technology using orthogonal test. Constr. Build. Mater. 2021, 302, 124204. [Google Scholar] [CrossRef]
- Zhao, Y.; Liang, N.X.; Chen, H.; LI, Y. Preparation and properties of sintering red mud unburned road brick using orthogonal experiments. Constr. Build. Mater. 2020, 238, 117739. [Google Scholar] [CrossRef]
- Yao, C.; Guo, Y.; Shen, A.; Cui, W.; He, Z. Recycling of fine-asphalt-pavement solid waste for low-shrinkage rapid hardening Portland cement concrete pavement. Constr. Build. Mater. 2021, 289, 123132. [Google Scholar] [CrossRef]
- Xia, Q.; Wen, J.; Tang, X.; Zhu, Y.; Xu, Z.; Du, Z.; Liu, X. Optimal preparation and degradation characterization of repair mortar containing waterborne epoxy resin emulsions. Constr. Build. Mater. 2021, 298, 123839. [Google Scholar] [CrossRef]
- Fang, Y.; Ma, B.; Wei, K.; Wang, L.; Kang, X.X.; Chang, X.G. Orthogonal experimental analysis of the material ratio and preparation technology of single-component epoxy resin for asphalt pavement crack repair. Constr. Build. Mater. 2021, 288, 123074. [Google Scholar] [CrossRef]
- Wu, A.; Wang, Y.; Wang, H. Estimation model for yield stress of fresh uncemented thickened tailings: Coupled effects of true solid density, bulk density, and solid concentration. Int. J. Miner. Process. 2015, 143, 117–124. [Google Scholar] [CrossRef]
- Jia, J.; Gu, X. Effects of coarse aggregate surface morphology on aggregate-mortar interface strength and mechanical properties of concrete. Constr. Build. Mater. 2021, 294, 123515. [Google Scholar] [CrossRef]
- He, Y.; Zhang, Q.; Chen, Q.; Bian, J.; Qi, C.; Kang, Q.; Feng, Y. Mechanical and environmental characteristics of cemented paste backfill containing lithium slag-blended binder. Constr. Build. Mater. 2021, 271, 121567. [Google Scholar] [CrossRef]
- Mondal, B.; Srivastava, V.C.; Mall, I.D. Electrochemical treatment of dye-bath effluent by stainless steel electrodes: Multiple response optimization and residue analysis. J. Environ. Sci. Health Part A 2012, 47, 2040–2051. [Google Scholar] [CrossRef] [PubMed]
- Wu, A.; Ruan, Z.; Bürger, R.; Yin, S.; Wang, J.; Wang, Y. Optimization of flocculation and settling parameters of tailings slurry by response surface methodology. Miner. Eng. 2020, 156, 106488. [Google Scholar] [CrossRef]
- Ouattara, D.; Mbonimpa, M.; Yahia, A.; Belem, T. Assessment of rheological parameters of high density cemented paste backfill mixtures incorporating superplasticizers. Constr. Build. Mater. 2018, 190, 294–307. [Google Scholar] [CrossRef]


| Materials | Density (g cm−3) | Bulk Density (g cm−3) | Tapped Density (g cm−3) |
|---|---|---|---|
| Tailings | 2.74 | 1.449 | 1.951 |
| Coarse aggregates | 2.52 | 1.429 | 1.647 |
| Cement | 3.09 | 1.022 | 1.384 |
| Particle Size (μm) | Mass Content (%) |
|---|---|
| +8000–10,000 | 55.69 |
| +7000–8000 | 14.83 |
| +6000–7000 | 6.80 |
| +5000–6000 | 8.87 |
| +2500–5000 | 12.71 |
| +1250–2500 | 0.32 |
| +315–1250 | 0.06 |
| −315 | 0.71 |
| Chemical Component | SiO2 (%) | CaO (%) | MgO (%) | Al2O3 (%) | Fe2O3 (%) | SO3 (%) | K2O (%) | TiO2 (%) | MnO (%) | Others (%) |
|---|---|---|---|---|---|---|---|---|---|---|
| Tailings | 39.18 | 35.89 | 3.49 | 6.99 | 10.23 | 0.19 | 1.28 | 0.32 | 2.42 | 0.01 |
| Coarse aggregates | 23.51 | 59.00 | 2.41 | 5.56 | 7.11 | 0.35 | 1.20 | 0.33 | 0.51 | 0.02 |
| Cement | 29.12 | 50.86 | 2.14 | 9.06 | 3.29 | 3.47 | 1.27 | 0.62 | 0.16 | 0.01 |
| Experiment Number | Solid Concentration (%) | Coarse Aggregates Dosage (%) | Cement Dosage |
|---|---|---|---|
| 1 | 77 (level 1) | 5 (level 1) | 1:10 (level 1) |
| 2 | 77 | 10 (level 2) | 1:8 (level 2) |
| 3 | 77 | 15 (level 3) | 1:6 (level 3) |
| 4 | 77 | 20 (level 4) | 1:4 (level 4) |
| 5 | 78 (level 2) | 5 | 1:8 |
| 6 | 78 | 10 | 1:10 |
| 7 | 78 | 15 | 1:4 |
| 8 | 78 | 20 | 1:6 |
| 9 | 80 (level 3) | 5 | 1:6 |
| 10 | 80 | 10 | 1:4 |
| 11 | 80 | 15 | 1:10 |
| 12 | 80 | 20 | 1:8 |
| 13 | 81 (level 4) | 5 | 1:4 |
| 14 | 81 | 10 | 1:6 |
| 15 | 81 | 15 | 1:8 |
| 16 | 81 | 20 | 1:10 |
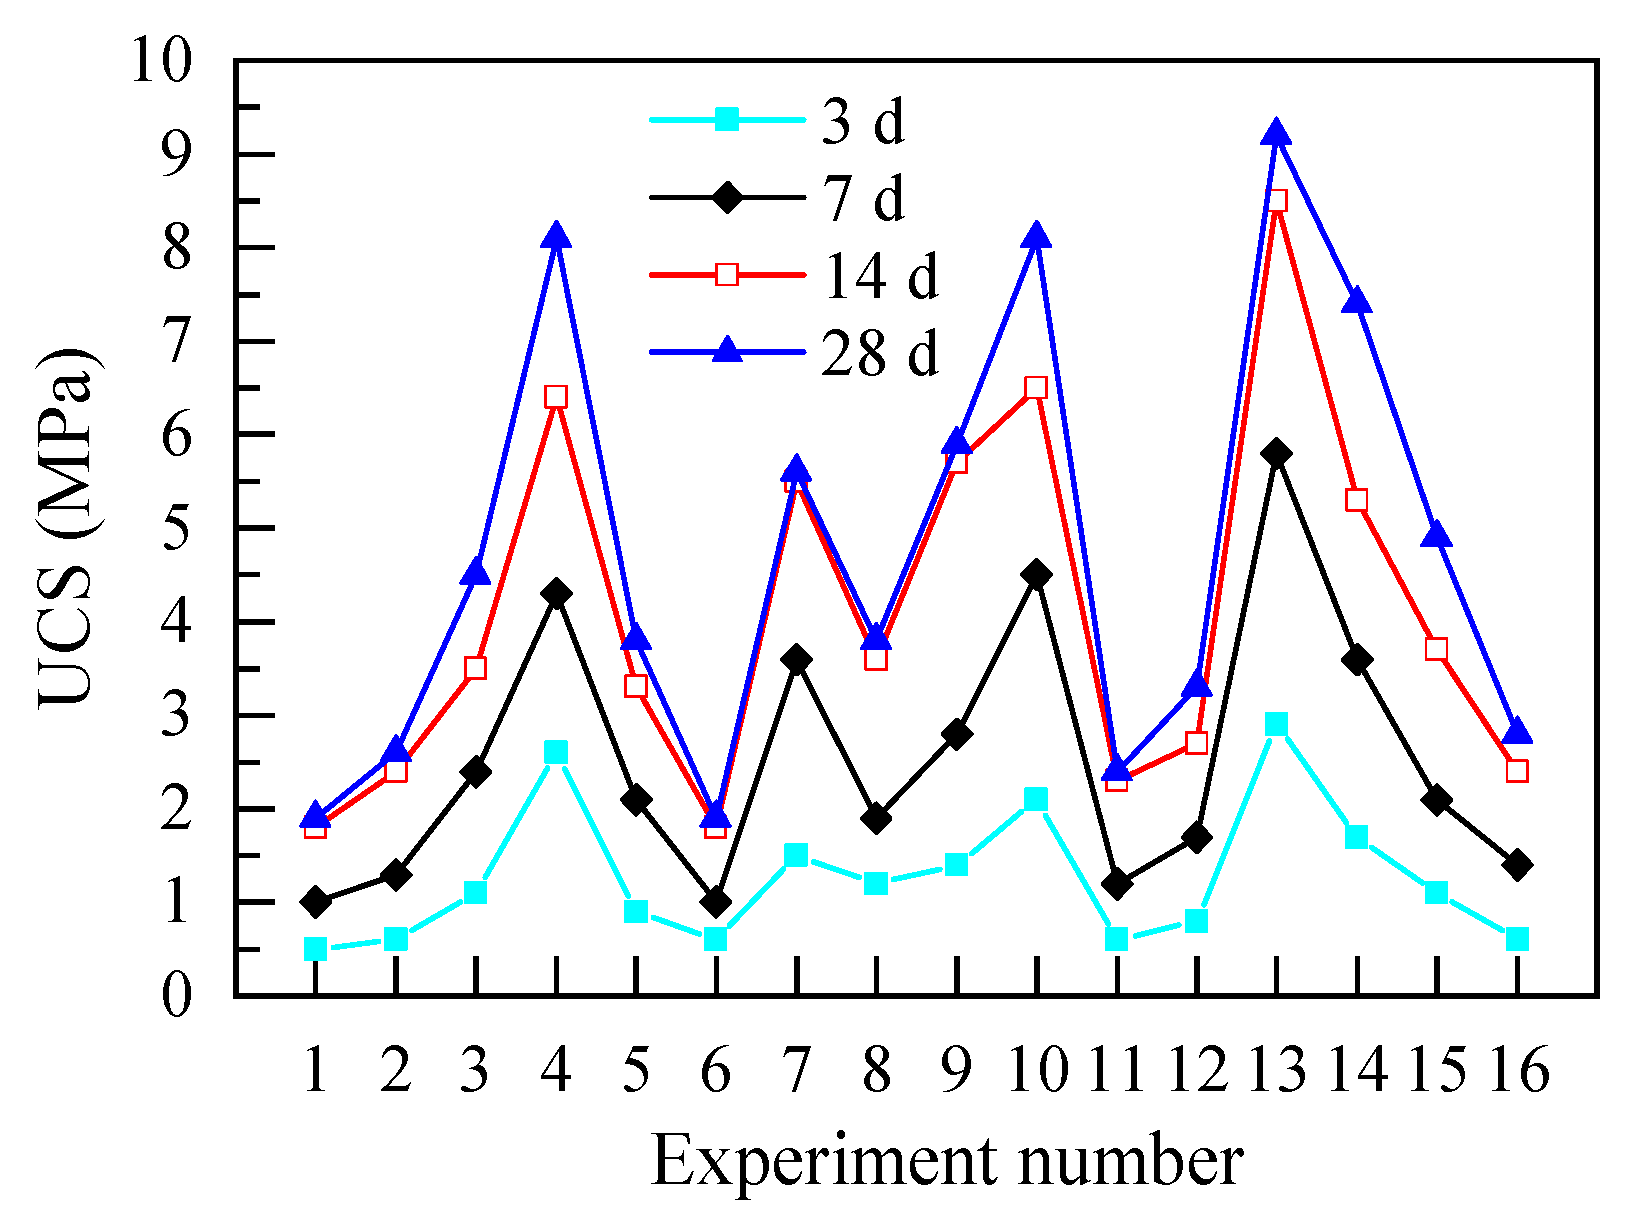
| Experiment Number | τ0 (Pa) | μ (Pa s) | 3 d UCS (MPa) | 7 d UCS (MPa) | 14 d UCS (MPa) | 28 d UCS (MPa) |
|---|---|---|---|---|---|---|
| 1 | 43.36 (18.25) | 0.273 (19.97) | 0.5 (34.64) | 1 (34.64) | 1.8 (19.25) | 1.9 (9.12) |
| 2 | 74.32 (19.67) | 0.215 (25.14) | 0.6 (28.87) | 1.3 (13.32) | 2.4 (18.16) | 2.6 (10.18) |
| 3 | 89.97 (21.93) | 0.254 (18.98) | 1.1 (24.05) | 2.4 (4.17) | 3.5 (7.56) | 4.5 (5.88) |
| 4 | 112.01 (20.95) | 0.776 (17.65) | 2.6 (7.69) | 4.3 (8.39) | 6.4 (5.41) | 8.1 (2.14) |
| 5 | 191.54 (21.93) | 1.377 (30.03) | 0.9 (22.22) | 2.1 (12.60) | 3.3 (13.21) | 3.8 (6.96) |
| 6 | 136.89 (23.66) | 1.004 (26.39) | 0.6 (28.87) | 1 (20.00) | 1.8 (19.25) | 1.9 (9.12) |
| 7 | 112.21 (27.79) | 0.843 (22.87) | 1.5 (11.55) | 3.6 (7.35) | 5.5 (6.56) | 5.6 (4.72) |
| 8 | 85.78 (22.30) | 0.352 (29.77) | 1.2 (22.05) | 1.9 (13.93) | 3.6 (7.35) | 3.8 (9.12) |
| 9 | 266.66 (20.01) | 1.625 (28.18) | 1.4 (14.29) | 2.8 (9.45) | 5.7 (9.28) | 5.9 (5.87) |
| 10 | 299.80 (22.31) | 1.705 (28.17) | 2.1 (12.60) | 4.5 (2.22) | 6.5 (5.33) | 8.1 (2.14) |
| 11 | 195.34 (22.95) | 1.38 (24.55) | 0.6 (16.67) | 1.2 (22.05) | 2.3 (18.95) | 2.4 (14.43) |
| 12 | 194.52 (25.53) | 0.883 (27.06) | 0.8 (21.65) | 1.7 (11.76) | 2.7 (9.80) | 3.3 (8.02) |
| 13 | 392.99 (24.64) | 2.296 (22.03) | 2.9 (3.45) | 5.8 (4.56) | 8.5 (6.55) | 9.2 (1.09) |
| 14 | 299.06 (22.07) | 1.675 (31.96) | 1.7 (5.88) | 3.6 (7.35) | 5.3 (4.99) | 7.4 (3.58) |
| 15 | 228.89 (21.94) | 1.361 (28.26) | 1.1 (24.05) | 2.1 (12.60) | 3.7 (8.11) | 4.9 (3.53) |
| 16 | 197.81 (26.13) | 1.024 (22.63) | 0.6 (28.87) | 1.4 (12.37) | 2.4 (11.02) | 2.8 (3.57) |
Publisher’s Note: MDPI stays neutral with regard to jurisdictional claims in published maps and institutional affiliations. |
© 2022 by the authors. Licensee MDPI, Basel, Switzerland. This article is an open access article distributed under the terms and conditions of the Creative Commons Attribution (CC BY) license (https://creativecommons.org/licenses/by/4.0/).
Share and Cite
Wang, J.; Wu, A.; Ruan, Z.; Bürger, R.; Wang, Y.; Wang, S.; Zhang, P.; Gao, Z. Optimization of Parameters for Rheological Properties and Strength of Cemented Paste Backfill Blended with Coarse Aggregates. Minerals 2022, 12, 374. https://doi.org/10.3390/min12030374
Wang J, Wu A, Ruan Z, Bürger R, Wang Y, Wang S, Zhang P, Gao Z. Optimization of Parameters for Rheological Properties and Strength of Cemented Paste Backfill Blended with Coarse Aggregates. Minerals. 2022; 12(3):374. https://doi.org/10.3390/min12030374
Chicago/Turabian StyleWang, Jiandong, Aixiang Wu, Zhuen Ruan, Raimund Bürger, Yiming Wang, Shaoyong Wang, Pingfa Zhang, and Zhaoquan Gao. 2022. "Optimization of Parameters for Rheological Properties and Strength of Cemented Paste Backfill Blended with Coarse Aggregates" Minerals 12, no. 3: 374. https://doi.org/10.3390/min12030374