
Influence of Urbanization on Groundwater Chemistry at Lanzhou Valley Basin in China


1
China Institute of Geo-Environmental Monitoring, Beijing 100081, China
2
Technical Centre for Soil, Agriculture and Rural Ecology and Environment, Ministry of Ecology and Environment, Beijing 100012, China
3
Hebei Investigation Institute of Hydrogeology and Engineering Geology, Shijiazhuang 050021, China
4
Institute of Hydrogeology and Environmental Geology, CAGS, Shijiazhuang 050061, China
*
Authors to whom correspondence should be addressed.
Minerals 2022, 12(3), 385; https://doi.org/10.3390/min12030385
Submission received: 15 February 2022
/
Revised: 6 March 2022
/
Accepted: 17 March 2022
/
Published: 20 March 2022
(This article belongs to the Special Issue Challenges of Groundwater Quality Degradation in the Past Decades: Clues from Water–Minerals Interaction)
Abstract
:With the rapid development of the economy, urbanization and industrialization gradually become an important driving force of groundwater chemical evolution. In this study, Lanzhou City, which is one of the biggest industrial cities in northwest China, was selected to investigate the impacts of city development on groundwater quality. Several hydrochemical methods together with principal component analysis (PCA) were used for the hydrochemistry evolution characteristics and sensitive factors of groundwater chemistry in different urban functional areas of Lanzhou City. The results show that 96% of the groundwater in the study area cannot meet the groundwater quality standards of China. The main factors affecting the quality are SO42−, TDS, total hardness, Mg2+ and Na+. Urbanization and industrialization lead to further deterioration of the already naturally high TDS groundwater. NO3−, Cl− and NH4+ are the characteristic factors of human input sources for commercial residential areas; total Fe and NO3− are the characteristic factors of new urban areas in the urban-rural junction; and SO42−, NO3−, Cl−, Total Fe, Mn2+, F−, I−, Pb2+, Cr6+ and As3+ are the characteristic factors of industrial areas. Domestic sewage infiltration and manure infiltration are the main driving factors of groundwater quality deterioration in commercial residential areas. Nitrate fertilizer infiltration and sewage irrigation are the main factors leading to the increase in nitrate nitrogen in groundwater in the new urban area. Industrial wastewater leakage and organic pollution that promote the dissolution of minerals in the aquifer (the dissolution of fluorine-containing minerals and reductive dissolution of iron manganese oxides) are the main driving factors for the deterioration of groundwater quality in the petrochemical industrial area.
1. Introduction
China is a country with a lack of water resources [1], and with the rapid development of the economy, water quality degradation and water shortage have been considered as important constraints to the sustainable development of the social economy in China [2]. China has experienced severe water deficiency in the past 40 years, especially in the arid area of northwest China [3,4]. Except for the over exploitation and pollution, a naturally high content of total dissolved solid (TDS), total hardness, sulfate, fluorine, iron and manganese ions also contribute to the shortage of available water resources [5,6]. In order to prevent groundwater from pollution, identifying the sources of contaminants is quite significant, but it is necessary to specify the pollution from the naturally high concentration of SO42−, Cl− and F−, etc.
Urbanization is a strong driving force for changes in regional groundwater chemistry [7,8,9,10], and the change of land-use pattern accompanied by urbanization affect groundwater quality significantly [2,11]. The research of R. S. Gabor et al. [12] showed that concentrations of solutes such as chloride and nitrate increase quickly in the urbanization areas of Salt Lake City, the United States. In turn, in India, the concentration of SO42− and NO3− in the central urban area increases significantly in the Vijayawada urban agglomeration [13]. In the Pearl River Delta (PRD) in China, a significant amount of groundwater samples has a high concentration of nitrate, which accounts for more than 25% milligrams equivalent [14], and was caused by the leakage of septic tanks and domestic sewage. Another study [15] in PRD also shows that industrialization accompanied by the infiltration of industrial wastewater with the infiltration of domestic sewage are the main driving forces for groundwater quality deterioration. Agricultural, industrial and urban wastewater contains various inorganic pollutants, such as nitrate, ammonium and heavy metals, posing a potential threat to the groundwater environment in Chengdu in China [16]. Generally, during the past three decades of urbanization in China, the chemical composition of the groundwater in the urban regions were changed drastically [17,18,19,20]. Nitrate [21,22], COD and Cl− [23,24] are the three main contaminants caused by urbanization. Many scientists have reported this phenomenon but seldom investigated the groundwater pollution caused by different sections of city. The methods used to identify the pollution caused by human activities from different type areas were limited to mathematical statistics and variation coefficient analysis [25,26]. These methods ignored the internal relationship between the ionic components in the water and thus the reliability of the analysis results is questionable. Hydrochemical methods fully takes into account the internal relations among various hydrochemical components, and can reflect hydrochemical evolution processes such as dissolution and precipitation, evaporation, mixing and ion exchange. Hydrochemical methods avoided the influence of a single index extreme value on the evaluation result, and it is more scientific and reasonable [9,27].
Lanzhou city is a typical valley city in the arid area of northwest China. The groundwater quality in Lanzhou city has changed drastically in the past 40 years due to the expansion of urban area. The abnormality in groundwater chemical composition due to hydrochemical methods and the evolution of the groundwater chemical components in different urban functional areas during the urbanization process were systematically studied. The driving factors of this evolution were analyzed, and the both natural causes and human factors were identified as the causes for water quality deterioration.
2. Study Area
2.1. Hydrogeological Condition
Lanzhou city is located in a valley basin with the Yellow River flowing through (Figure 1 and Figure 2), northwest of the Longxi loess plateau, with an area of about 230 km2 with mountains in the south, the loess hills in the north and the Yellow River valley in the middle. The annual average temperature of Lanzhou City is 8.9 °C, and with annual average precipitation of 317.6 mm and annual average evaporation of 1433 mm [28]. The average annual flow of Yellow River across Lanzhou City is 1106.4 m3/s. The tributaries of Yellow River in this valley are all seasonal gullies. The Lanzhou valley basin is surrounded by tectonic faults. Both sides of the basin are Tertiary and Cretaceous uplift. The groundwater in this valley was divided into three types: bedrock fissure water, clastic rock pore fissure water and loose rock pore water. The former two aquifers are low in water conductivity and poor in water quality. The main aquifer in the study area is the Quarternary loose rock pore water. The total thickness of the loose rock aquifer is over 300 m and is thick in the middle and thin at the edge of the valley (or fault basin). The fault basin is divided into north and south parts by a techtonic fault from Fanjiaping to Gongjiawan. The southern part is alluvial-diluvial mud-bearing pebble aquifer overlaid with thick loess. The north is the alluvial thick sand-gravel pebble aquifer. Groundwater flows from the north and south mountains to the Yellow River valley. Precipitation and water from the Yellow River are the main recharge sources of groundwater [29]. Evaporation and human exploitation are the main ways of groundwater discharge (Figure 1 and Figure 2).
2.2. Urbanization
From the 1980s to 2012, the ratio of farmland under study decreased significantly from 70% to 15%, while the proportion of 30% of industrial and commercial land increased to 85% (Figure 1). The remaining farmland is mainly distributed in the areas of Matan, Cuijia Datan and Pengjiaping in the river basin. According to the type of land use, Lanzhou city can be divided into three urban functional areas comprising Xigu industrial areas (XG-areas), Chengguan commercial residential area (CG-areas) and new urban areas (NU-areas). The XG-areas are characterized by rapid developing petrochemical industry and huge levels of production of industrial wastewater. The CG-areas are dominated by commercial facilities and residential area, and with the longest development history, a dense population and huge levels of production of domestic sewage. The NU-areas mainly comprise rapid developing commercial facilities and some rural areas where irrigation with polluted river water often occurs. As urbanization expands, Xigu district, which used to be mainly covered by farmland, has been transformed into a petrochemical industrial base integrating petroleum, chemical and fertilizer production. The east of Qilihe district has developed into the business district. The commercial residential area is located in Chengguan district at the east of the basin. The population of Lanzhou increased from 2.14 million in 1980 to 3.23 million in 2012, and the non-agricultural population increased from 46.7% in 1980 to 62.7% in 2012 [30]. The flowing field and chemistry of the groundwater have changed significantly due to the groundwater exploitation and pollution since the 1980s.
2.3. Sample Collection and Analysis
From September to October in 2011–2012, 53 water samples, including 52 groundwater samples and one surface water sample, were collected in the study area, including 42 groups in 2012 and 11 groups in 2011. Samples were collected from domestic wells, standard monitoring wells and springs. The depths of the sampling wells are 3–50 m and the groundwater level depths were 3–15 m. The sampling equipment includes centrifugal pumps and submersible pumps. Before sampling, the sampling wells were pumped until the discharged water volume exceed 3 times the well tube volume, and sampling shall be conducted after the electric conductivity of the water is stable. The sample bottle was a 2.5 L high-density polyethylene bottle. After sampling, the sample was labeled and store away from light at a low temperature (4 °C) with Parafilm sealing film, and sent it to the laboratory for testing within 7 days. The samples were measured by the Groundwater and Environment Monitoring Center of the Ministry of Natural Resources, according to GB/T 8538-95 [31]. Dx-120 Ion Chromatograph (Dionex, Inc., Sunnyvale, CA, USA) and ICP-AES (Perkin Elmer, MA, USA) were used to determine the concentration of anions and cations. The pH, DO, Eh and EC of the groundwater were tested by a multi-340i/SET (Germany WTW) in the field. The hydrochemical data in 1980 were cited from the environmental geological survey report of Lanzhou city [32].
Principal component analysis (PCA) has proven itself as a powerful tool for analyzing high-dimensional hydrochemical data sets. By linearly combining the measurements of the original variable [15], a large number of variables can be reduced to small number of principal components (PCs). This multistep approach has been applied successfully to extract related variables and infer the underlying natural and/or anthropogenic processes controlling groundwater chemistry [14]. The Gibbs diagram [33] is a semi logarithmic coordinate map showing the chemical composition characteristics, control factors and their relations to surface water. In this study, SPSS and AquaChem software were used to process the hydrochemical data. The hydrochemical types of groundwater were classified according to the Shukalev classification method. The PCA and Gibbs diagram were used to analyze the relationship between the main ions of the groundwater in different urban functional areas of Lanzhou City, to explore the relationship between the main ion components of groundwater in different urban functional areas, and the geological background and different human activities.
3. Results and Discussion
3.1. General Groundwater Chemistry in 2012
In this study, 20, 11 and 21 groundwater samples were collected from the three urban functional areas comprising Xigu industrial district, Chengguan commercial residential district and New urban district, respectively (Table 1). In general, groundwater of Lanzhou city is in a steady-state and slightly oxidized, with a pH of 6.93–8.77 and Eh of 120–255 mV (Figure 3). The main cation of the groundwater in the study area was Na+, and the main anions were SO42− and Cl−. The total dissolved solids (TDS) is in the range of 312.4 to 42,788 mg/L with an average of 3785.3 mg/L. The characteristics of the groundwater in study area is commonly high hardness, high TDS, high SO42− and high F−. The ionic concentration, TDS and total hardness of the groundwater in Xigu industrial park were significantly higher than those of the other two regions (Figure 4). The groundwater in the middle of the basin was recharged by the Yellow River and its quality is significantly better than other regions [29].
3.2. Evolution of Groundwater Hydrochemistry
3.2.1. Groundwater Hydrochemistry in 2012
Along the direction of groundwater flow, the concentration of Na+, Cl− and SO42− of the groundwater gradually increase from the low hills in the south to the central Yellow River basin (Figure 5 and Figure 6). The key controlling factors of the groundwater chemical composition in the region include the evaporation, dissolution, ion exchange and precipitation. Moreover, the input of human activities is superimposed in some regions, especially the areas with intensive human activities in the river valleys. Shallow groundwater in the south hills are the facies of HCO3-Ca·Mg, HCO3·SO4-Ca·Mg and Cl·SO4-Ca·Mg. The chemical facies of groundwater in the valley area are complex, mainly consisting of SO4·Cl-Na·Mg, HCO3·SO4-Ca·Na and Cl·HCO3-Na·Ca with HCO3·Cl-Na·Mg, Cl-Na, SO4·HCO3·Cl-Na and SO4·HCO3·NO3-Na·Ca. The Yellow River water is low TDS water with a salinity of 320.6 mg/L, with a hydrochemical face of HCO3-Ca·Mg. Due to the low TDS water supply of the Yellow River, the fresh water zones with low TDS content are distributed along the Yellow River banks (Figure 6).
3.2.2. Characteristics of Groundwater Hydrochemical Evolution with Time
Over the past three decades, the change in natural conditions and human activities significantly altered the chemical fields of the groundwater in the study area. In the 1980s, the groundwater quality in the north and south river bank areas of the Yellow River was of good quality (Figure 6), and the groundwater quality deteriorated as the distance to the Yellow River increases. Some good-quality groundwater was also distributed in some of the small stream valleys in the mountain areas of south side, an area with a low-quality Cl-Na face water with high TDS distributed in the central part of the basin of the Yellow River south bank. By comparing the hydrochemical maps of 1980 [34] and 2012 (Figure 6), it can be seen that the TDS and total hardness of the groundwater in the Chengguan commercial residential area had risen significantly, characterized with the shrink of areas with SO4·HCO3 face groundwater, and the expansion of the SO4·Cl face groundwater. The ratio of HCO3− in anions decreased and the ratio of Ca2+ ratio slightly increased in Xigu industrial area, but the hydrochemical faces in the area was not changed. The concentration of nitrate increased drastically, which may be caused by the pollution from the Lanzou Petrochemical base [35]. Nevertheless, the concentrations of Cl− and Na+ in the south part of the Yellow river decreased significantly, which is because of the intensive groundwater withdrawal along the south bank of the Yellow river during 1980s stopped in 2000, and the recharge of low TDS Yellow river water diluted the saline groundwater in the south part of the valley. However, the nitrate in the groundwater in the commercial residential area and the industrial area increased significantly due to the pollution from the leakage of the septic tank or sewage channel [28], with a large variety due to the complex distribution of the nitrate pollution sources.
3.3. Identification of Groundwater Chemical Anomalies in Different Urban Functional Areas
3.3.1. Identification of Abnormal Data Based on ‘Hydrochemical’ Method
Recognizing the groundwater chemical component anomaly using the ‘hydrochemical method’ is key to determine the degree of human activities’ influence on groundwater [36]. In this method, five hydrochemical maps [36,37,38] reflecting the evolution process of the hydrochemistry are combined with the Mahalanobis distance [39] to identify the hydrochemical anomalies, quantify the impact of human activities on groundwater quality and predict the potential risk of groundwater contamination. The method can not only identify the naturally high concentration of ions in the groundwater, but also can identify the groundwater contaminated by human activities and the good-quality groundwater with a deterioration trend. The five hydrochemistry diagrams of a series of hydrochemical evolution processes, including reaction dissolution and filtration, evaporation, mixing, and ion exchange, are the hydrochemical piper diagram [37], the ion exchange diagram (Ca2+ + Mg2+ − Na+ − K+) − (HCO3− − SO42− − Cl−) and the three ion ratio diagrams (Ca2+ + Mg2+–HCO3−, Na+ + K+–Cl−, Ca2+ + Mg2+–SO42−) [36,38]. Using five two-dimensional coordinate maps converted from the hydrochemistry map, the Mahalanobis distance of the data set corresponding to each point in the map was calculated to identify abnormal data [9]. The results of the abnormal data based on the five hydrochemical maps are shown in Table 2 and Figure 7.
Piper diagram two-dimensional coordinate conversion formula:
where: mc—the molarity concentration of each cation (Na+, K+, Ca2+, Mg2+);
ma—the molarity concentration of each anion (HCO3−, CO32−, SO42−, Cl−);
mNa+K—sum of the molarity concentration of K+ and Na+;
mHCO3+CO3—sum of the molarity concentration of HCO3− and CO32−;
v—charge number of the corresponding ion;
a = 0.25 × (30.5)/2; b = (30.5)/2.
Mahalanobis distance formula:
where: X represents array milligram equivalent concentration; is the average of array milligram equivalent concentration; S−1 is the covariance inverse matrix; Da is the mahalanobis distance.
After calculating the Mahalanobis distance corresponding to the two-dimensional coordinates of the five hydrochemistry diagrams, we use the mean value of the Mahalanobis distance plus three times the standard deviation as the critical distance (Di2), removing the samples whose Da2 exceeds Di2. Then we recalculated the mean value, covariance matrix and Mahalanobis distance of the remaining samples, compared the size of Di2 and Da2 again, and repeated until the Mahalanobis distance of the remaining samples was less than Di2.
3.3.2. Groundwater Quality in Different Urban Functional Areas
To find out the impact of human activities on groundwater quality, the groundwater quality was assessed using the method of single-factor evaluation of groundwater quality and classified into five classes according to the groundwater quality standards of China (GB/T14848-2017) [32]. The assessment parameters include Na+, Ca2+, Mg2+, Cl−, SO42−, HCO3−, NO3− and NO2−, NH4+, Fe, Mn, Zn, Cu, COD, TDS, total hardness, F−, I−, Cd, Hg, As, Se and Pb2+. Groundwater quality of I, II, III, IV and V accounts for 0%, 0%, 4%, 2% and 94% of the total groundwater samples in Lanzhou city, respectively (Figure 8). Among all the total groundwater samples, 96% samples were poor-quality and undrinkable (classes IV and V). The percentage of class V water in the Xigu industrial zone and Chengguan living area are 100%. Based on the ‘hydrochemistry’ method, 73% of all the of groundwater samples abnormal points were affected by human activities. In Chengguan District, the percentage of class V water and the recognition rate of abnormal points are 100%.
3.4. Main Human Impact Indicators of Poor-Quality Groundwater in Various Urban Functional Areas
The pollution components of groundwater at the study area are complex due to multiple factors, but we can find some relationships between the groundwater pollution and the character of the different urban functional areas. Dominated by the high content of soluble salt in the primary sedimentary strata [29], SO42−, TDS, total hardness, Mg2+ and Na+ of the groundwater in all functional areas are the main impact indicators. The contribution rate of the five main impact indicators of Xigu industrial area and Chengguan commercial and residential area all exceeded 80%, and that of the new urban area in the rural-urban fringe of the faulted basin all exceeded 50%. In addition to the above natural inferior components, the typical pollution components in different urban functional areas are significantly different due to the difference of anthropogenic inputs. The sensitive factors of human input sources in each functional area are described in the following sections.
3.4.1. Influencing Factors of Poor-Quality Groundwater in Chengguan Commercial Residential Area
Chengguan District is the center of Lanzhou city from 1940s and has been the commercial area during all this history. The leakage of urban sewage pipeline and leaching of domestic waste landfill have substantially deteriorated groundwater quality in this district. Nitrate [28], Fe, Mn [40] and F− [41] are the main contaminants. The contribution rates of groundwater chemistry change by TDS, SO42−, total hardness, Na+, Mn and NO3− are all above 80%, followed by Mn, Cl−, Fe, NH4+, F−, Ca2+, I−, NO2−, COD, etc., with contribution rates of 9–18% (Figure 9a).
3.4.2. Influencing Factors of Poor-Quality Groundwater in the Xigu Industrial Zone
Xigu district is a heavy industry base with many petroleum, chemical, machinery and metallurgical factories. The pollution sources are complex, and the pollution loads are generally high. It was found Xigu district has leakages from crude oil storage tank, sewage oil separator and industrial wastewater in the process of petroleum refining, which results in serious organic pollution of groundwater. The detection rate of volatile organic pollutants mainly with chlorinated hydrocarbon and benzene in groundwater samples of this district is 100% [35]. Organic pollution also caused the change in the other chemical composition of the groundwater. For instance, the pH of the groundwater in the oil storage tank area is less than 6.0, and with high concentration of total Fe and total Mn, caused by the reduction in organic pollution. Pollution has caused 16 components in the groundwater to exceed the drinking water standard in this district, which is the most among the three functional areas. Among these components, TDS, SO42−, Mg2+, total hardness, Na+, Mn2+, Total Fe, Cl−, NO3−, F−, etc., are the main impact indicators of poor-quality water in Xigu District, and their contribution rates are all over 50%, of which TDS, SO42−, Mg2+, total hardness, Na+ and Mn exceed 80%; followed by I−, Ca2+, COD, Pb, Cr6+, As, etc., with the contribution rates range from 11% to 32%. Under the influence of industrial pollution, heavy metals (i.e., Pb2+, Cr6+ and As) in 10% of the wells have exceeded the drinking water standard in Xigu District. Moreover, the reduction environment formed by organic pollution caused the increase in F− and I− in groundwater [35,41] (Figure 9b).
3.4.3. Influencing Factors of Poor-Quality Groundwater in New Urban District
Before 1990, more than 90% of new urban district was cultivated land in the new urban–rural area; but, along with the fast urbanization process started in the 1990s, the Santan riverside well field was gradually stopped and many buildings were constructed on this well field. However, the groundwater quality in the riverside area is still relatively good because of the recharge from the Yellow River. However, low quality water is widely distributed outside of the river bank area. Total Fe, total hardness, TDS, SO42−, NO3−, Mn2+, Na+, etc., are the main influencing factors, and their contribution rates are all over 50%, of which the Fe contribution rate is 100%; the Cl−, NH4+, Pb2+ and F− contribution rates are 37.5%, 25%, 25% and 12.5%, respectively. NO3−, Cl− and NH4+ are closely related with human activities such as septic tank and sewage pipeline leakage [42], but a high concentration of SO42−, total hardness, total Fe and total Mn were caused mainly by the natural background high TDS groundwater in this area [29] (Figure 9c).
3.5. Water–Rock Interaction and the Cause of Chemical Evolution of Groundwater
3.5.1. Analysis of Chemical Evolution Processes of Groundwater
According to the Gibbs map [33] (Figure 10), the sample points of the shallow groundwater in Lanzhou city are mainly distributed in two regions with intense evaporation and rock weathering, which are closer to the evaporation concentration control area. Most of the sample sites contained the ρ(Na+)/(ρ(Na+) + ρ(Ca2+)) ratio between 0.5 and 1.0, and TDS over 1000 mg/L. This suggests that the evaporation process dominated the chemical composition of water in Lanzhou city. ρ(Na+)/(ρ(Na+) + ρ(Ca2+)) of a small number of groundwater samples in the faulted basin is concentrated in the range of 0.2–0.5, and the TDS value is relatively low. Relative to other regions, the ionic components of groundwater in faulted basin are more affected by rock weathering.
3.5.2. Driving Factors for Poor-Quality Groundwater in Different Urban Functional Areas
In this study, PCA was used to extract the PCs from groundwater chemical data sets that included 16 major water quality parameters (i.e., TDS, EC, total hardness, Mg2+, Na+, Cl−, Ca2+, NO3−, SO42−, F−, Pb2+, I−, Fe, As, Eh and Mn), which can affect the groundwater quality during analysis. The KMO test and Barrett spherical test were carried out on 53 groups of data. The results showed that the KMO value was 0.754 and Barrett spherical test value was 2408.19 (p < 0.001). Based on the screening requirement that the eigenvalue is greater than 1, the three main control factors causing the deterioration of the groundwater quality in Lanzhou were identified, with the cumulative variance of 80.86%. The factor loading matrix is shown in Table 3.
The contribution rate of the first principal component (PC1) was 57.37%, among which TDS, EC, total hardness, Mg2+, Na+, Cl−, Ca2+, NO3−, SO42− and F− loads were large, showing a strong positive correlation with PC1. The results show that the poor-quality groundwater in the study area was driven by intense rock weathering and evaporation. The study area is mainly formed by tertiary strata, which is composed of neogene mudstone, sandy mudstone and sandy conglomerate, with a large number of soluble rock deposits [29]. The high-TDS groundwater dominated by sulfate and chloride was formed by the dissolution of soluble minerals such as gypsum (Ca2+, SO42−), glauberite (Na+, SO42−), siderite (Mg2+), salt rock (Na+, Cl−), fluorite (F−), etc. Evaporation process played a role in concentrating the fluoride ions and enriching other ion components of the groundwater in the study area [41]. The increase in NO3− reflects the influence of human activities on groundwater. PC1 indicates that the poor-quality water in the study area is controlled by the high content of soluble salt from the strata, together with the impacts of human activities.
The contribution rate of the second principal component (PC2) was 13.57%, and positively correlated with Pb, I−, Fe and Mn. In general, the concentrations of Fe and Mn in the shallow groundwater in Lanzhou city are high, mainly coming from the dissolved strata minerals, but the leakage of industrial wastewater and domestic sewage is also an important contributor [35,40]. The high concentration of iodine in the study area is mainly distributed in the Xigu industrial zone. The aquifer rich in organic matters, clay minerals and iron and aluminum oxides in the river-lake facies of the study area is conducive to the enrichment of I− [43]. There are also some high Pb2+ groundwater samples in the study area, which were distributed in the Xigu industrial zone and the sewage irrigation area in the south of the basin, where maybe the leakage of industrial wastewater containing Pb contribute to the increase in Pb2+ in the groundwater.
The contribution rate of the third principal component (PC3) was 10.61%. As and Mn showed a strong positive correlation with this component, while Eh showed a strong negative correlation with it. Previous studies demonstrated that weak alkaline reductive environment is correlated with high arsenic groundwater [44]. The high As groundwater was only distributed in the Xigu petrochemical industry base, and the organic contaminants from the petrochemical industry might contribute to the dissolution of Fe and Mn containing minerals and released the As ions combined in these minerals.
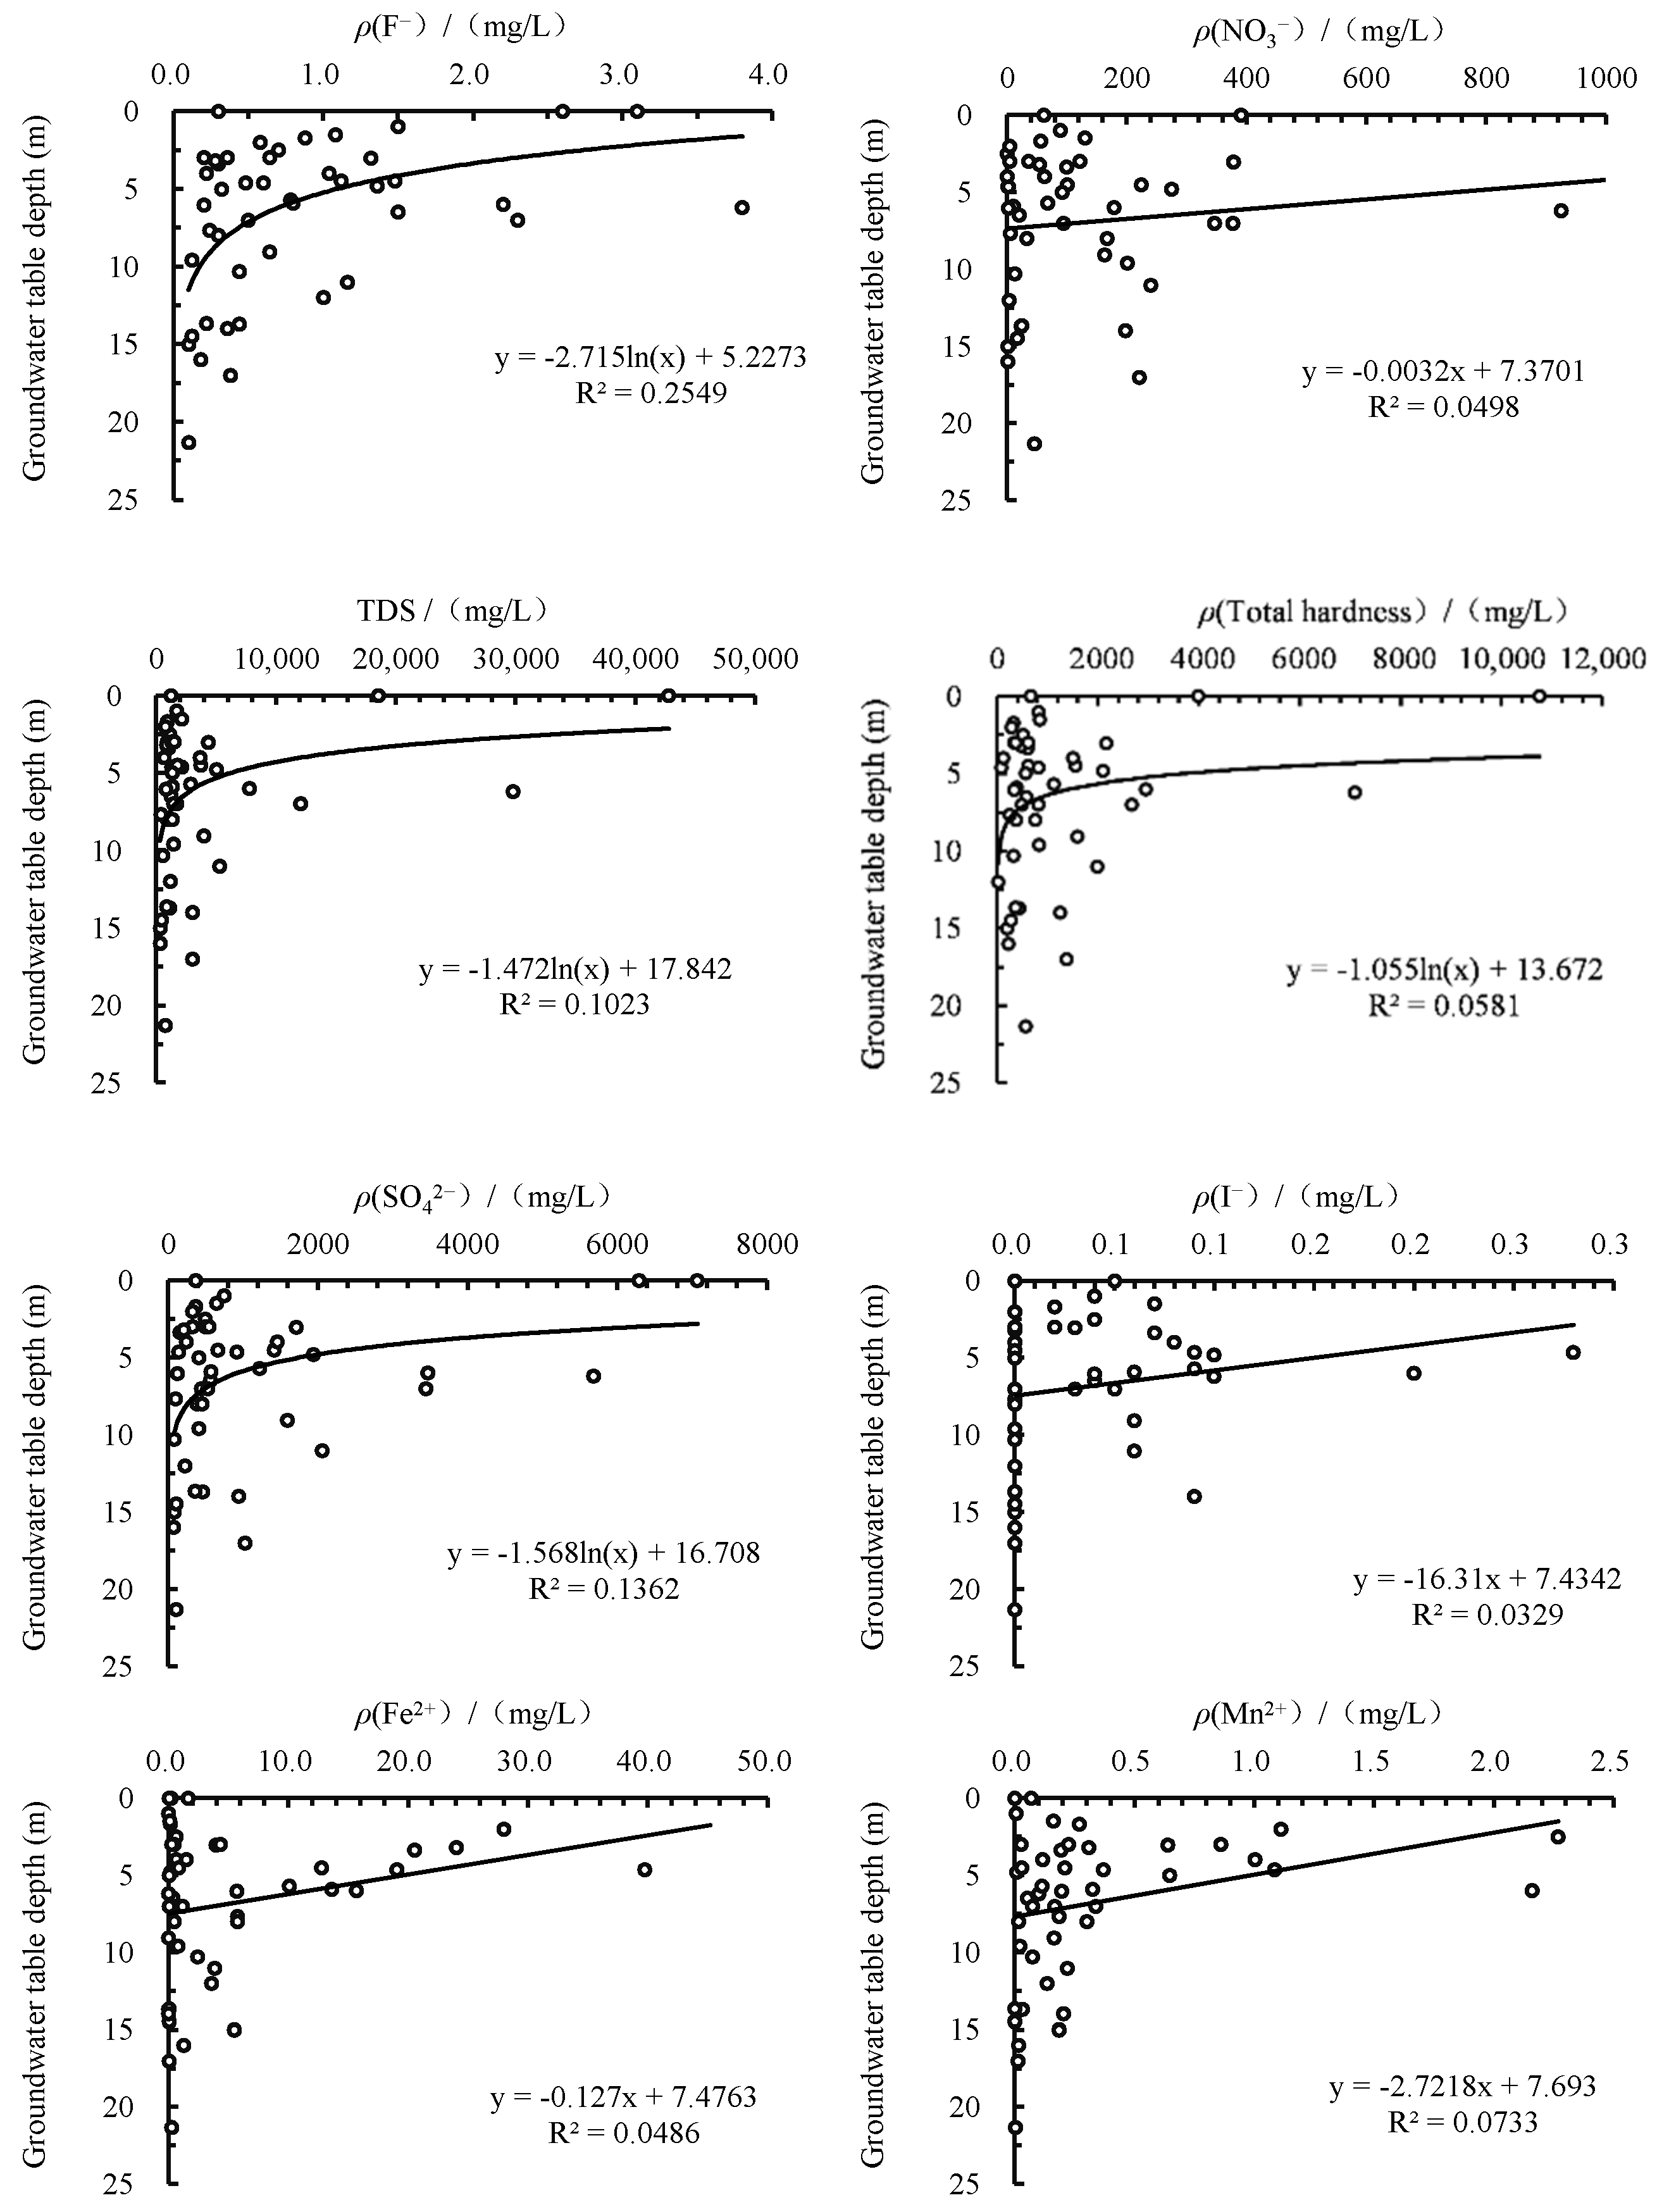
In addition, the depth of groundwater level determines the distance of pollutants into the aquifer. The water-level burial depth in the study area was negatively correlated with Fe, Mn, F−, NO3−, TDS, total hardness and SO42− in groundwater to different degrees, in other words, the ion concentration of each concerned component decreased with the increase of the groundwater depth. This clearly indicated the impacts of human activity on groundwater quality (Figure 11).
4. Conclusions
SO4·Cl-Na·Mg, HCO3·SO4-Ca·Na and Cl·HCO3-Na·Ca are the main types of groundwater chemistry in Lanzhou. SO42−, TDS, total hardness, Mg2+ and Na+ are the major influence indicators. The characteristic pollutants of the various urban functional areas are significantly different. The “three nitrogen” in the old city of Chengguan presents a face pollution. In the Xigu industrial zone, there were 16 highly complex pollution components. On top of the inorganic conventional components exceeding the standard, the heavy metals Pb, Cr6+, As and inorganic toxicological components F− and I− all exceeded the standard to some degrees. In the new urban area of the fault basin, the concentration of Fe2+ and nitrate exceeded the standard significantly.
Due to the influence of urbanization, the contaminants by human activities in different area were intervened with the natural components in the groundwater. The high TDS groundwater in Lanzhou city is mainly caused by rock weathering and evaporation, but the leakage of industrial and domestic sewage also contributes to the increase in Pb2+, I−, Fe and Mn in groundwater. In some area, the organic contaminants also caused the increase of As and Mn in the groundwater due to the reductive reaction. All these results reflect the intense impact of urbanization on the groundwater chemistry, and protecting the groundwater from pollution should be carried out in some urban zones.
Author Contributions
X.L., Y.Z. and J.L. designed the project; Z.H. and H.L. conducted the original literature reviews; X.L., Y.Z. and J.L. wrote and organized the paper with a careful discussion and revision by Z.H. All authors have read and agreed to the published version of the manuscript.
Funding
This research was supported by the China Geological Survey Grant (No.DD20221749, DD20190322, DD20190331) and the National Natural Science Foundation of China (No. 4207071759).
Data Availability Statement
The raw data supporting the conclusions of this article will be made available from the corresponding author upon request, without undue reservation.
Conflicts of Interest
The authors declare that there are no conflict of interest regarding the publication of this paper.
References
- Wu, A.M.; Jing, J.H.; Song, B. Water safety issues of China and ensuring roles of groundwater. Geol. Sin. 2016, 90, 2939–2947. [Google Scholar]
- Zhang, L.Y.; Zhang, Z.; Chen, Y.; Tao, F.L. Spatial pattern of surface water quality in China and its driving factors—Implication for the environment sustainability. Hum. Ecol. Risk Assess. 2019, 25, 1789–1801. [Google Scholar] [CrossRef]
- Chen, Y.N.; Li, W.H.; Deng, H.J.; Fang, G.H.; Li, Z. Changes in central Asia’s water tower: Past, present and future. Sci. Rep. 2016, 6, 35458. [Google Scholar] [CrossRef] [PubMed]
- Lü, X.L.; Liu, J.T.; Han, Z.T.; Zhou, B.; Zhu, L.; Chen, X. Chemical Evolution of Groundwater in the Tacheng Basin of Xinjiang in the Process of Urbanization. Chin. J. Environ. Sci. 2020, 41, 1197–1205. [Google Scholar]
- Wang, Y.X.; Zheng, C.M.; Ma, R. Review: Safe and sustainable groundwater supply in China. Appl. Hydrogeol. 2018, 26, 1301–1324. [Google Scholar] [CrossRef]
- Gao, X.B.; Luo, W.T.; Luo, X.S.; Li, C.C.; Zhang, X.; Wang, Y.X. Indigenous microbes induced fluoride release from aquifer sediments. Environ. Pollut. 2019, 252, 580–590. [Google Scholar] [CrossRef]
- Huang, G.X.; Liu, C.Y.; Sun, J.C.; Zhang, M.; Jing, J.H.; Li, L.P. A regional scale investigation on factors controlling the groundwater chemistry of various aquifers in a rapidly urbanized area: A case study of the Pearl River Delta. J. Sci. Total Environ. 2018, 625, 510–518. [Google Scholar] [CrossRef]
- Li, P.Y.; Qian, H.; Howard, K.W.F.; Wu, J.H. Building a new and sustainable ‘Silk Road economic belt’. Environ. Earth Sci. 2015, 74, 7267–7270. [Google Scholar] [CrossRef]
- Peng, C.; He, J.T.; Liao, L.; Zhang, Z.G. Research on the influence degree of human activities on groundwater quality by the method of geochemistry: A case study from Liujiang Basin. Earth Sci. Front. 2017, 24, 321–331. [Google Scholar]
- Zhang, Q.Q.; Sun, J.C.; Liu, J.T.; Huang, G.X.; Lu, C.; Zhang, Y.X. Driving mechanism and sources of groundwater nitrate contamination in the rapidly urbanized region of south China. J. Contam. Hydrol. 2015, 182, 221–230. [Google Scholar] [CrossRef]
- He, S.; Li, P.Y.; Wu, J.H.; Elumalai, V.; Adimalla, N. Groundwater quality under land use/land cover changes: A temporal study from 2005 to 2015 in xi’an, northwest china. Hum. Ecol. Risk Assess. 2020, 26, 2771–2797. [Google Scholar] [CrossRef]
- Gabor, R.S.; Hall, S.J.; Eiriksson, D.P.; Jameel, Y.; Millington, M.; Stout, T.; Barnes, M.L.; Gelderloos, A.; Tennant, H.; Bowen, G.J. Persistent Urban Influence on Surface Water Quality via Impacted Groundwater. Environ. Sci. Technol. 2017, 51, 9477–9487. [Google Scholar] [CrossRef] [PubMed]
- Rao, P.N.; Prasad, K.M.; Madhusudhan, B.J.; Krishna, V.S.R.; Anand, A.V.S.S.; Madhnure, P. Impact of Urbanization on Groundwater Quality in Vijayawada Urban Agglomeration, the New Capital Region of Andhra Pradesh, India—A Baseline Study. J. Geol. Soc. India 2016, 87, 539–552. [Google Scholar] [CrossRef]
- Huang, G.X.; Sun, J.C.; Zhan, Y.; Chen, Z.Y.; Liu, F. Impact of anthropogenic and natural processes on the evolution of groundwater chemistry in a rapidly urbanized coastal area, South China. J. Sci. Total Environ. 2013, 463–464, 209–221. [Google Scholar] [CrossRef] [PubMed]
- Zhang, F.E.; Huang, G.X.; Hou, Q.X.; Liu, C.Y.; Zhang, Y.; Zhang, Q. Groundwater quality in the Pearl River Delta after the rapid expansion of industrialization and urbanization: Distributions, main impact indicators, and driving forces. J. Hydrol. 2019, 577, 124004. [Google Scholar] [CrossRef]
- Xia, C.C.; Liu, G.D.; Meng, Y.C.; Wang, Z.Y.; Zhang, X.X. Impact of human activities on urban river system and its implication for water-environment risks: An isotope-based investigation in Chengdu, China. Hum. Ecol. Risk Assess. 2021, 27, 1416–1439. [Google Scholar] [CrossRef]
- Li, P.Y.; Tian, R.; Xue, C.Y.; Wu, J.H. Progress, opportunities, and key fields for groundwater quality research under the impacts of human activities in China with a special focus on western China. Environ. Sci. Pollut. Res. 2017, 24, 13224–13234. [Google Scholar] [CrossRef]
- Zhu, G.F.; Su, Y.H.; Huang, C.L.; Feng, Q.; Liu, Z.G. Hydrogeochemical processes in the groundwater environment of Heihe River Basin, northwest China. Environ. Earth Sci. 2010, 60, 139–153. [Google Scholar]
- Gao, X.B.; Su, C.L.; Wang, Y.X.; Hu, Q.H. Mobility of arsenic in aquifer sediments at Datong Basin, northern China: Effect of bicarbonate and phosphate. J. Geochem. Explor. 2013, 135, 93–103. [Google Scholar] [CrossRef]
- Li, C.C.; Gao, X.B.; Liu, Y.S.; Wang, Y.X. Impact of anthropogenic activities on the enrichment of fluoride and salinity in groundwater in the Yuncheng Basin constrained by Cl/Br ratio, δ18O, δ2H, δ13C and δ7Li isotopes. J. Hydrol. 2019, 579, 124211. [Google Scholar] [CrossRef]
- Xue, D.M.; Botte, J.; Baets, B.D.; Accoe, F. Present limitations and future prospects of stable isotope methods for nitrate source identification in surface and groundwater. J. Water Res. 2009, 43, 1159–1170. [Google Scholar] [CrossRef] [PubMed]
- Alberto, R.; Porcel, D.; De, H.; Schuth, L.G.C. Urban impacts analysis on hydrochemical and hydrogeological evolution of groundwater in shallow aquifer Linares, Mexico. J. Environ. Earth Sci. 2012, 66, 1871–1880. [Google Scholar]
- Liu, C.Q.; Li, S.L.; Lang, Y.C.; Xiao, H.Y. Using delta 15N-and delta 18O-values to identify nitrate sources in karst ground water, Guiyang, Southwest China. Environ. Sci. Technol. 2006, 40, 6928. [Google Scholar] [CrossRef] [PubMed]
- Ma, R.; Shi, J.S.; Liu, J.T.; Gui, C.L. Combined Use of Multivariate Statistical Analysis and Hydrochemical Analysis for Groundwater Quality Evolution: A Case Study in North Chain Plain. J. Earth Sci. 2014, 25, 587–597. [Google Scholar] [CrossRef]
- Zhu, D.N.; Zou, S.Z.; Zhou, C.S.; Li, L.J.; Xie, H. Identification of hydeochemical sensitive factors of karst groundwater in different functional urban areas. Chin. J. Carsologica Sin. 2018, 37, 484–492. [Google Scholar]
- Li, J.; Luo, Z.H.; Gu, X.; Ma, Y.H. Effect of urbanization on shallow groundwater in Guiyang area. Chin. J. Saf. Environ. Eng. 2017, 4, 2–9. [Google Scholar]
- Zhang, X.W.; He, J.T.; Peng, C.; Zhang, C.Y.; Ni, Z.H. Comparison of identification methods of main component hydrochemical anomalies in groundwater: A case study of Liujiang basin. Chin. J. Environ. Sci. 2017, 38, 3225–3234. [Google Scholar]
- Lü, X.L.; Liu, J.T.; Zhu, L.; Liu, C.Y.; Liu, J.J. Distribution and source of nitrogen pollution in groundwater of Lanzhou City. J. Arid Land Resour. Environ. 2019, 33, 95–100. [Google Scholar]
- Lü, X.L.; Shao, J.L.; Liu, J.T.; Wen, J.L.; Sun, J.C. Distribution characteristics and origin of total dissolved solids in groundwater under Lanzhou City. J. Arid Land Resour. Environ. 2012, 27, 23–27. [Google Scholar]
- Chin, R. Statistical Yearbook of Lanzhou City; Lanzhou Municipal Bureau of Statistics: Lanzhou, China, 2012. [Google Scholar]
- GB/T8538-1995; Method of Calibration for Natural Mineral Water for Drinking. China Standard Press: Beijing, China, 1996.
- GB/T14848-2017; Environmental Quality Standards for Groundwater. China Standard Press: Beijing, China, 2017.
- Gibbs, R.J. Mechanisms controlling world water chemistry. J. Sci. 1970, 170, 108–1090. [Google Scholar] [CrossRef]
- Bai, F.L.; Shang, R.Y.; Chin. R. Hydrogeology and Engineering Geology Team 1 Bureau of Geology and Mineral Resources of Gansu Province, Lanzhou, Gansu, China. Environmental Geology Exploration Report of Lanzhou City. 1983; Unpublished work. [Google Scholar]
- Lü, X.L.; Shao, J.L.; Liu, J.T.; Huang, G.X.; Zhang, Y.; Cui, H.W.; Wen, J.L.; Liu, J.J.; Sun, J.C. Contamination characteristics and causes of volatile organic compounds in the groundwater at a petrochemical contaminated site. Hydrogeol. Eng. Geol. 2012, 39, 97–102. [Google Scholar]
- Thilagavathi, R.; Chidambaram, S.; Prasanna, M.V.; Thivya, C.; Singaraja, C. A study on groundwater geochemistry and water quality in layered aquifers system of Pondicherry region, southeast India. J. Appl. Water Sci. 2012, 2, 253–269. [Google Scholar] [CrossRef] [Green Version]
- Karmegam, U.; Chidambaram, S.; Peasanna, M.V.; Manikandan, S.; Johnsonbabu, G.; Dheivanayaki, V.; Paramaguru, P.; Manivannan, R.; Srinivasamoorthy, K.; Anandhan, P. A study on the mixing proportion in groundwater samples by using Piper diagram and Phreeqc model. Chin. J. Geochem. 2011, 30, 490495. [Google Scholar] [CrossRef]
- Dogramci, S.; Skrzypek, G.; Dofson, W.; Grierson, P.F. Stable isotope and hydrochemical evolution of groundwater in the semi-arid Harmersley Basin of subtropical northwest Australia. J. Hydrol. 2012, 475, 281–293. [Google Scholar] [CrossRef]
- Song, Y.H. The Processing and the Application of Stream Sediment Data with Mahalanobis Distance in Sangou Area; Jilin University: Changchun, China, 2019. [Google Scholar]
- Lü, X.L.; Liu, J.T.; Zhu, L.; Liu, J.J.; Liu, C.Y. Distribution and source of Fe and Mn in groundwater of Lanzhou City. J. Arid Land Resour. Environ. 2019, 33, 132–138. [Google Scholar]
- Zhu, L.; Sun, J.C.; Liu, J.T.; Zhang, Y.X.; Liu, C.Y. Distributing regularity and influencing factors of fluorine in Lanzhou City. Environ. Sci. Technol. 2015, 38, 144–148. [Google Scholar]
- Zhang, M.; Huang, G.X.; Liu, C.Y.; Zhang, Y.; Chen, Z.Y.; Wang, J.C. Distributions and origins of nitrate, nitrite, and ammonium in various aquifers in an urbanized coastal area, south China. J. Hydrol. 2020, 582, 124528. [Google Scholar] [CrossRef]
- Huang, G.X.; Liu, C.Y.; Li, L.P.; Zhang, F.E.; Chen, Z.Y. Spatial distribution and origin of shallow groundwater iodide in a rapidly urbanized delta: A case study of the Pearl River Delta. J. Hydrol. 2020, 585, 124860. [Google Scholar] [CrossRef]
- Zhang, C.Y.; He, J.T.; Zhang, X.W.; Ni, Z.H. Geochemical Characteristics and Genesis Analyses of High-arsenic groundwater in the Pearl River Delta. Chin. J. Environ. Sci. 2018, 39, 3631–3639. [Google Scholar]
Figure 1.
Urbanization expansion from 1980 to 2012 and distribution of pollution sources in study area. Legends: 1—Urban land of 1980; 2—Urban land added in 2000; 3—Urban land in 2012; 4—Non-urbanized areas. Distribution of pollution sources: 5—Sewage treatment plant; 6—Oil spill site; 7—Discharge point of industrial wastewater; 8—Drainage ditches; 9—Geological fault; 10—Groundwater flow direction; 11—Boundary of study area; 12—Hydrogeological profiles.

Figure 2.
Hydrogeological profile of the study area. (a) Hydrogeological profile of the study area (I-I’). 1—Loess silt; 2—Silt; 3—Grait; 4—Sandy mudstone; 5—Water level; 6—Fault; 7—River bed. (b) Hydrogeological profile of the study area (II-II’). 1—Glutenite; 2—Sandstone; 3—Argillaceous sandstone; 4—Mudstone; 5—Sandy gravel; 6—Sand; 7—Loess silt; 8—Silt; 9—Loess; 10—Water level.

Figure 3.
Eh–pH plots of the water samples in the study area.

Figure 4.
Box plots showing variations in the major indicators of groundwater samples.
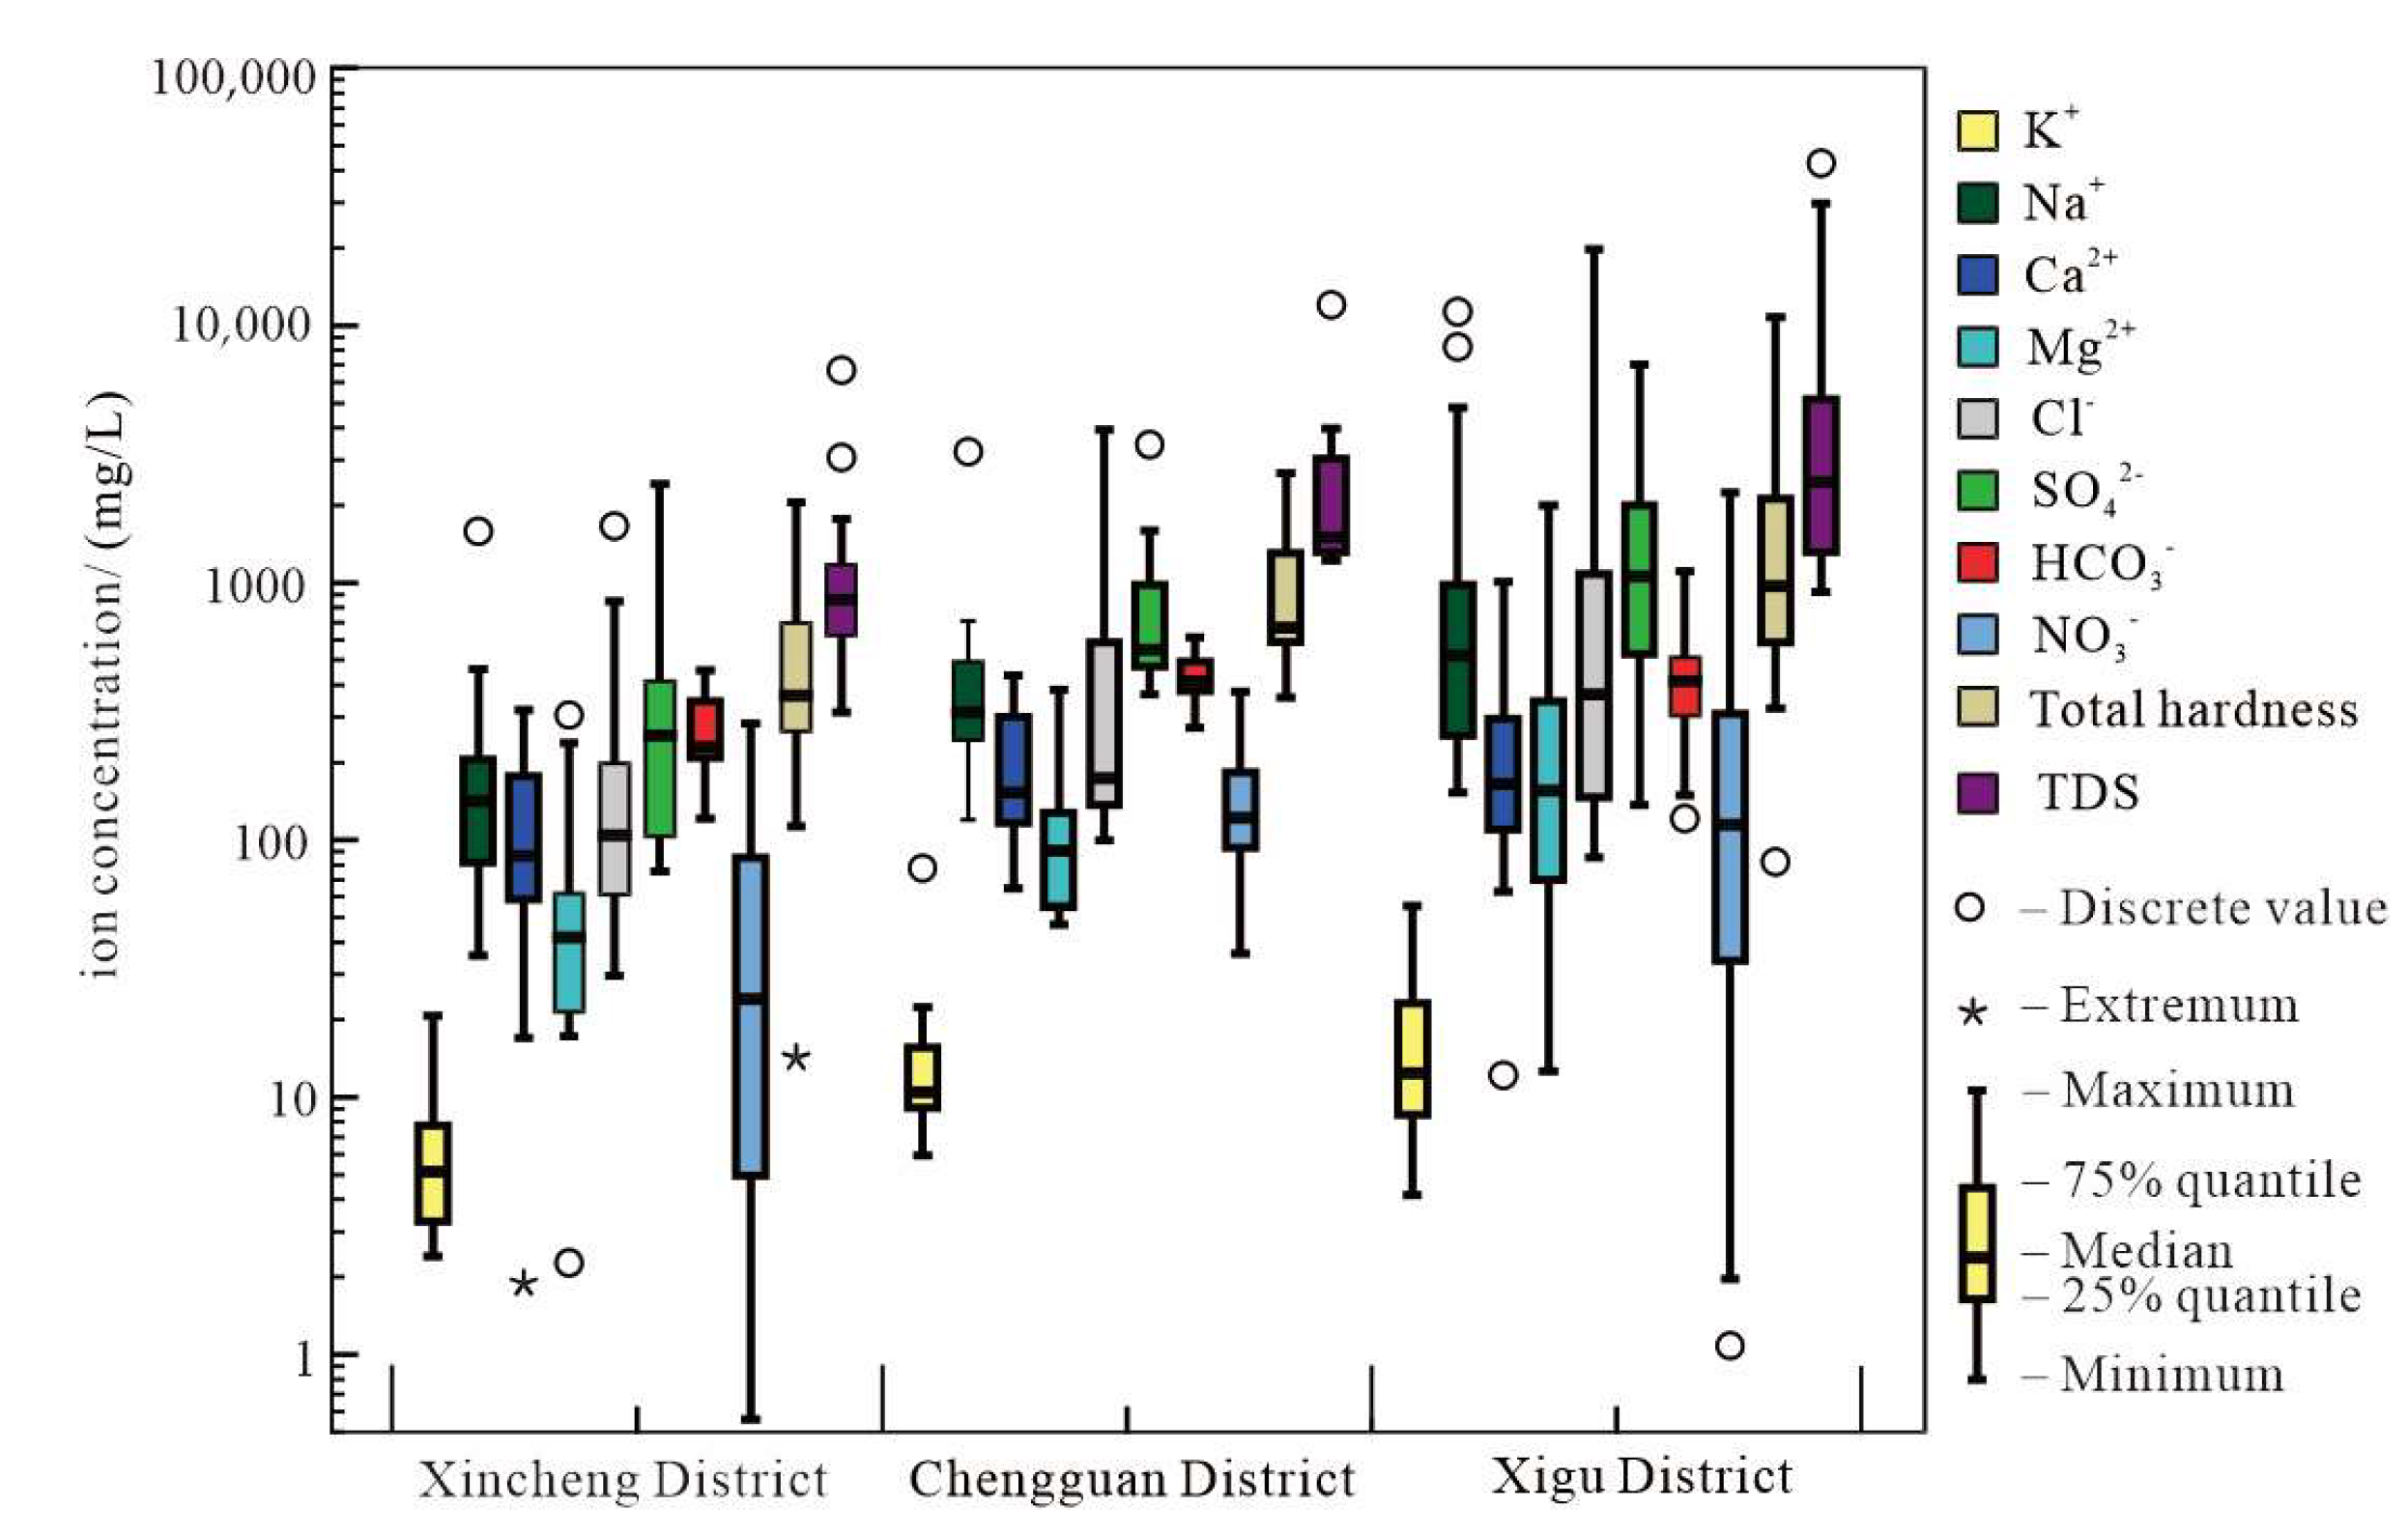
Figure 5.
Piper plots of the groundwater chemistry in various urban functional areas.

Figure 6.
Comparison of hydrochemical type distribution in 1980 and 2012 in the study area (data in 1980 were quoted from the literature [34]). Hydrochemistry faces in 2012: 1—HCO3-Ca·Na (Ca·Mg, Ca·Mg·Na, Mg·Ca·Na); 2—HCO3·SO4-Ca·Na; 3—SO4·HCO3-Na·Mg (Na·Ca·Mg, Ca·Na); 4—SO4·Cl·HCO3-Na·Mg; 5—SO4·Cl-Na·Mg; 6—Cl·SO4-Na·Mg; 7—Cl-Na; 8—Domestic well. Hydrochemical faces in 1980 [34]: 9—HCO3-Ca(Ca·Mg, Ca·Mg·Na, Mg·Ca·Na); 10—HCO3·Cl·SO4-Ca·Mg·Na, HCO3·SO4·Cl-Ca·Mg, 11—SO4·HCO3·Cl-Mg·Ca·Na, SO4·Cl·HCO3-Na·Mg; 12—Cl·HCO3·SO4-Mg Ca·Na, Cl·SO4·HCO3-Na·Mg; 13—Cl-Na(Na·Ca·Mg); 14—Fault zone; 15—TDS in 2012; 16—Groundwater flow direction; 17—Boundary of study area; 18—Hydrogeological profile location.
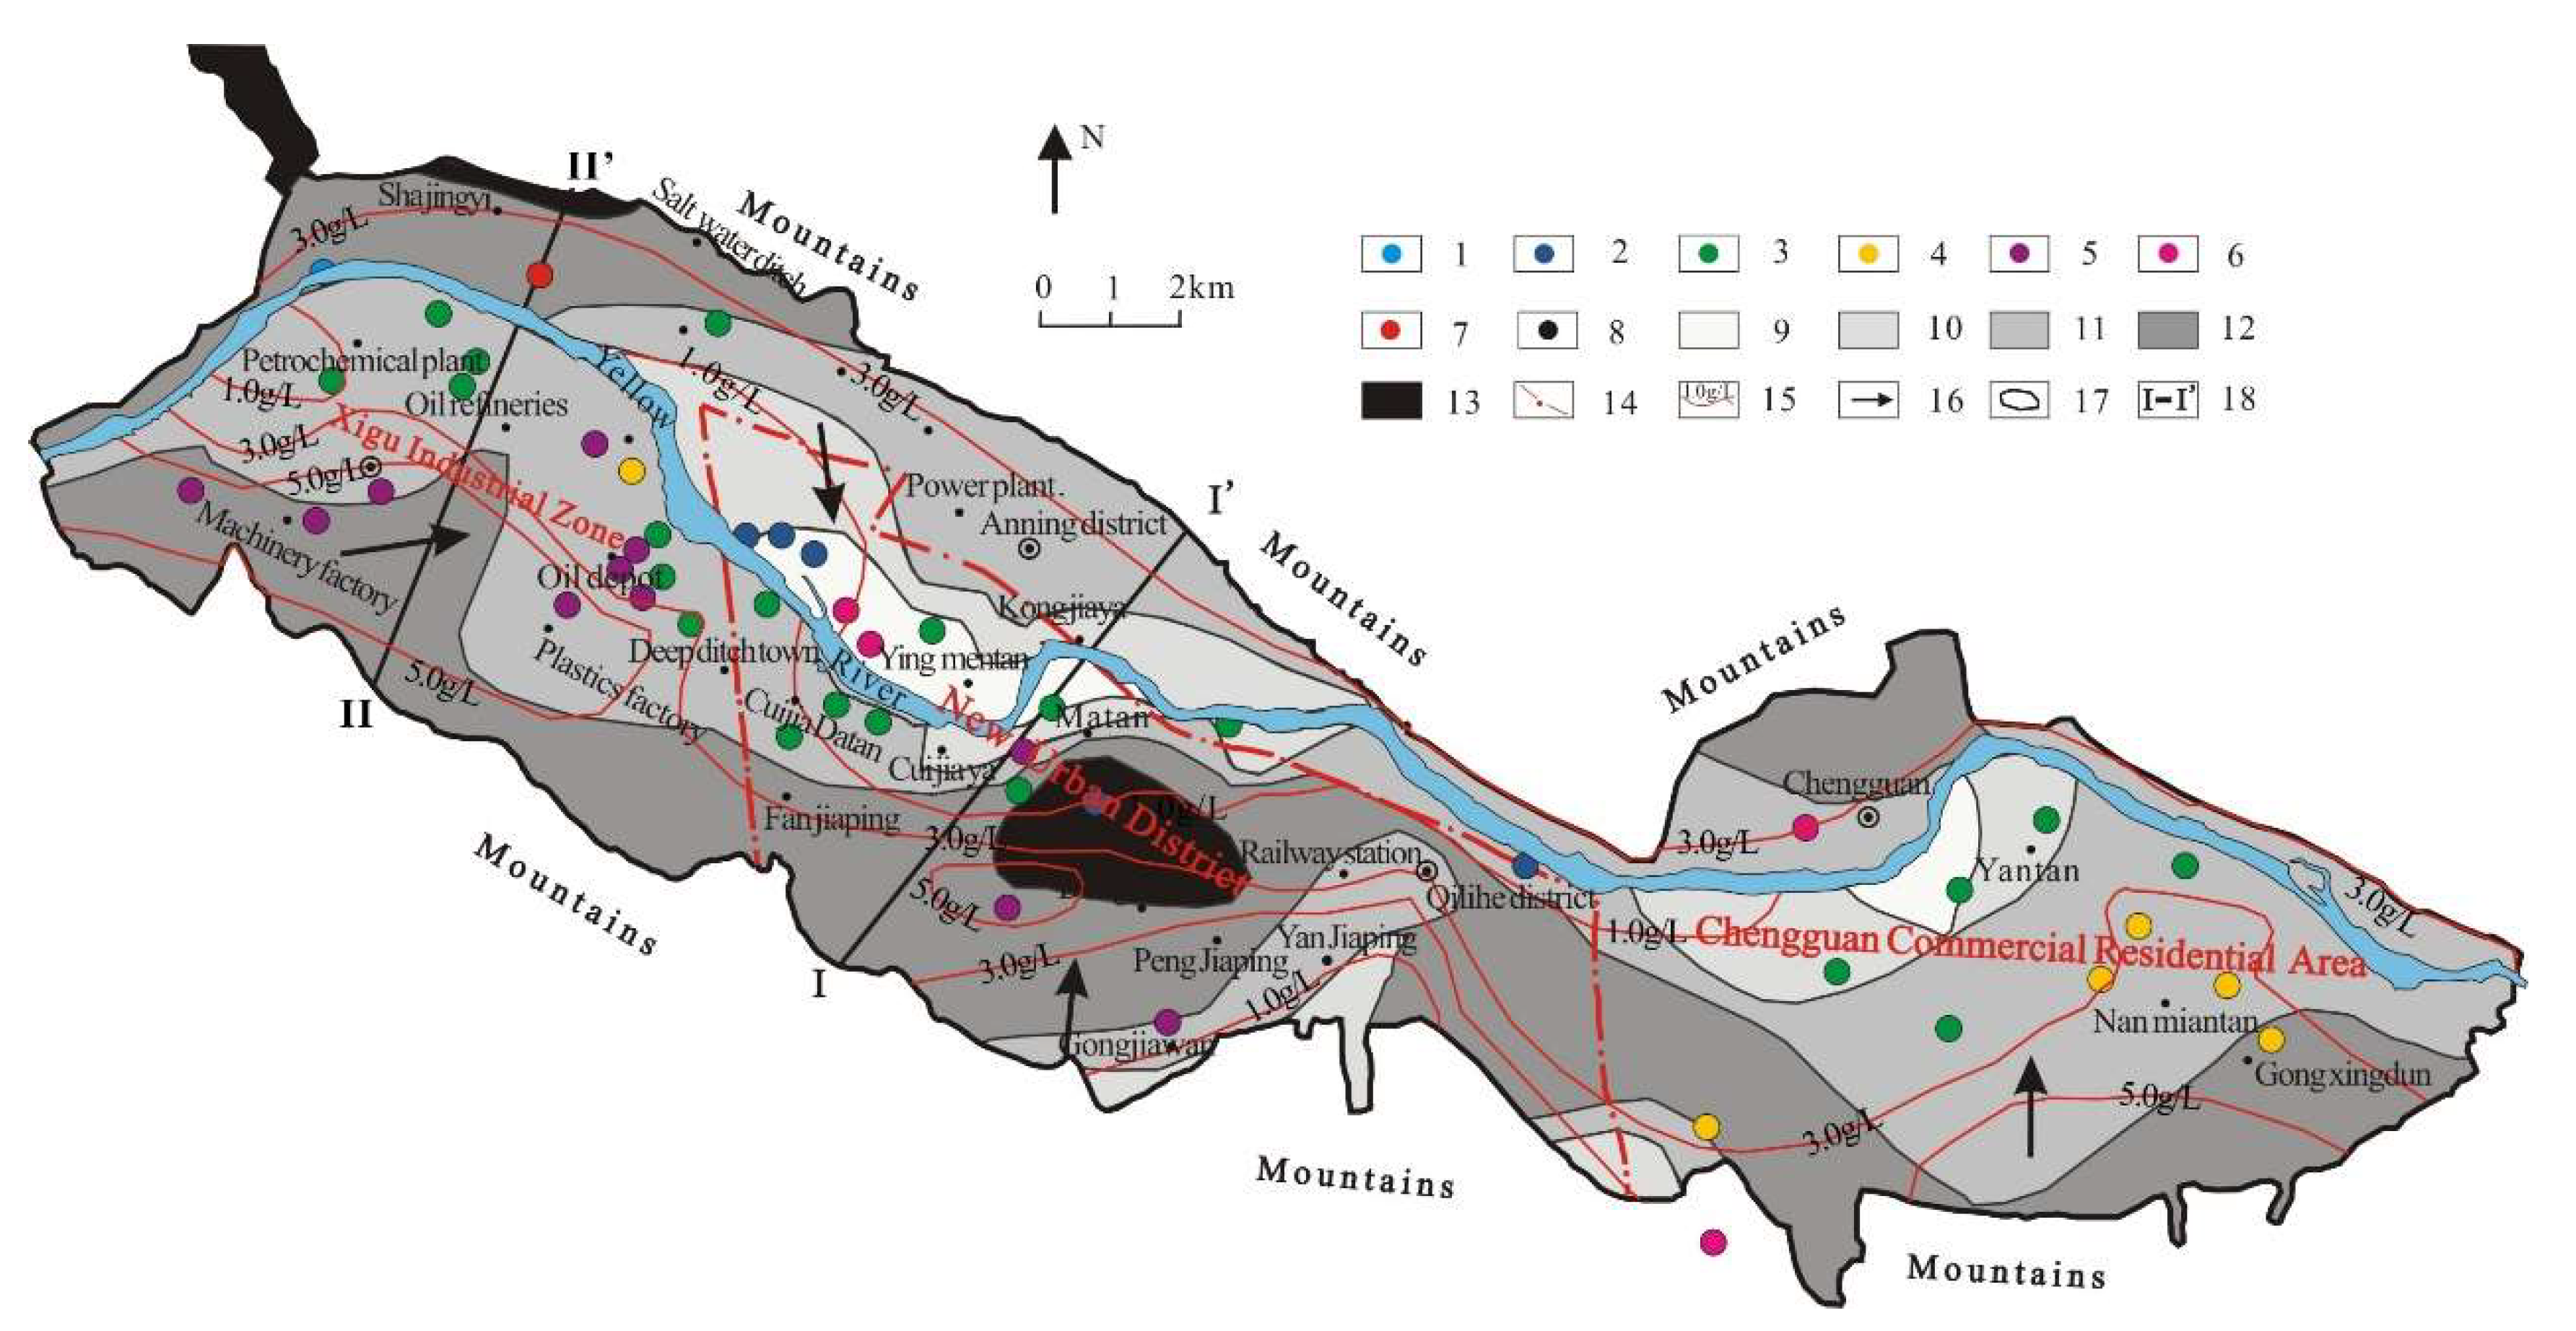
Figure 7.
Identification of abnormal data by five hydrochemical diagrams. (a) Two-dimensional coordinate diagram of the Piper diamond area. (b) Na+ + K+–Cl− diagram. (c) Ion exchange diagram. (d) Ca2+ + Mg2+–HCO3− diagram. (e) Ca2+ + Mg2+–SO42− diagram.
Figure 7.
Identification of abnormal data by five hydrochemical diagrams. (a) Two-dimensional coordinate diagram of the Piper diamond area. (b) Na+ + K+–Cl− diagram. (c) Ion exchange diagram. (d) Ca2+ + Mg2+–HCO3− diagram. (e) Ca2+ + Mg2+–SO42− diagram.


Figure 8.
Evaluation of groundwater quality and identification of hydrochemical abnormal points. Groundwater quality: 1—Class III; 2—Class IV; 3—Class V; 4—Outliters; Distribution of pollution sources: 5—Sewage treatment plant; 6—Oil spill site; 7—Discharge point of industrial wastewater; 8—Drainage ditches; 9—Sewage irrigation area; 10—Class I industrial land; 11—Category II and III industrial land; Boundary and others: 12—Fault zone; 13—TDS in 2012; 14—Groundwater flow direction; 15—Boundary of study area; 16—Hydrogeological profile location.
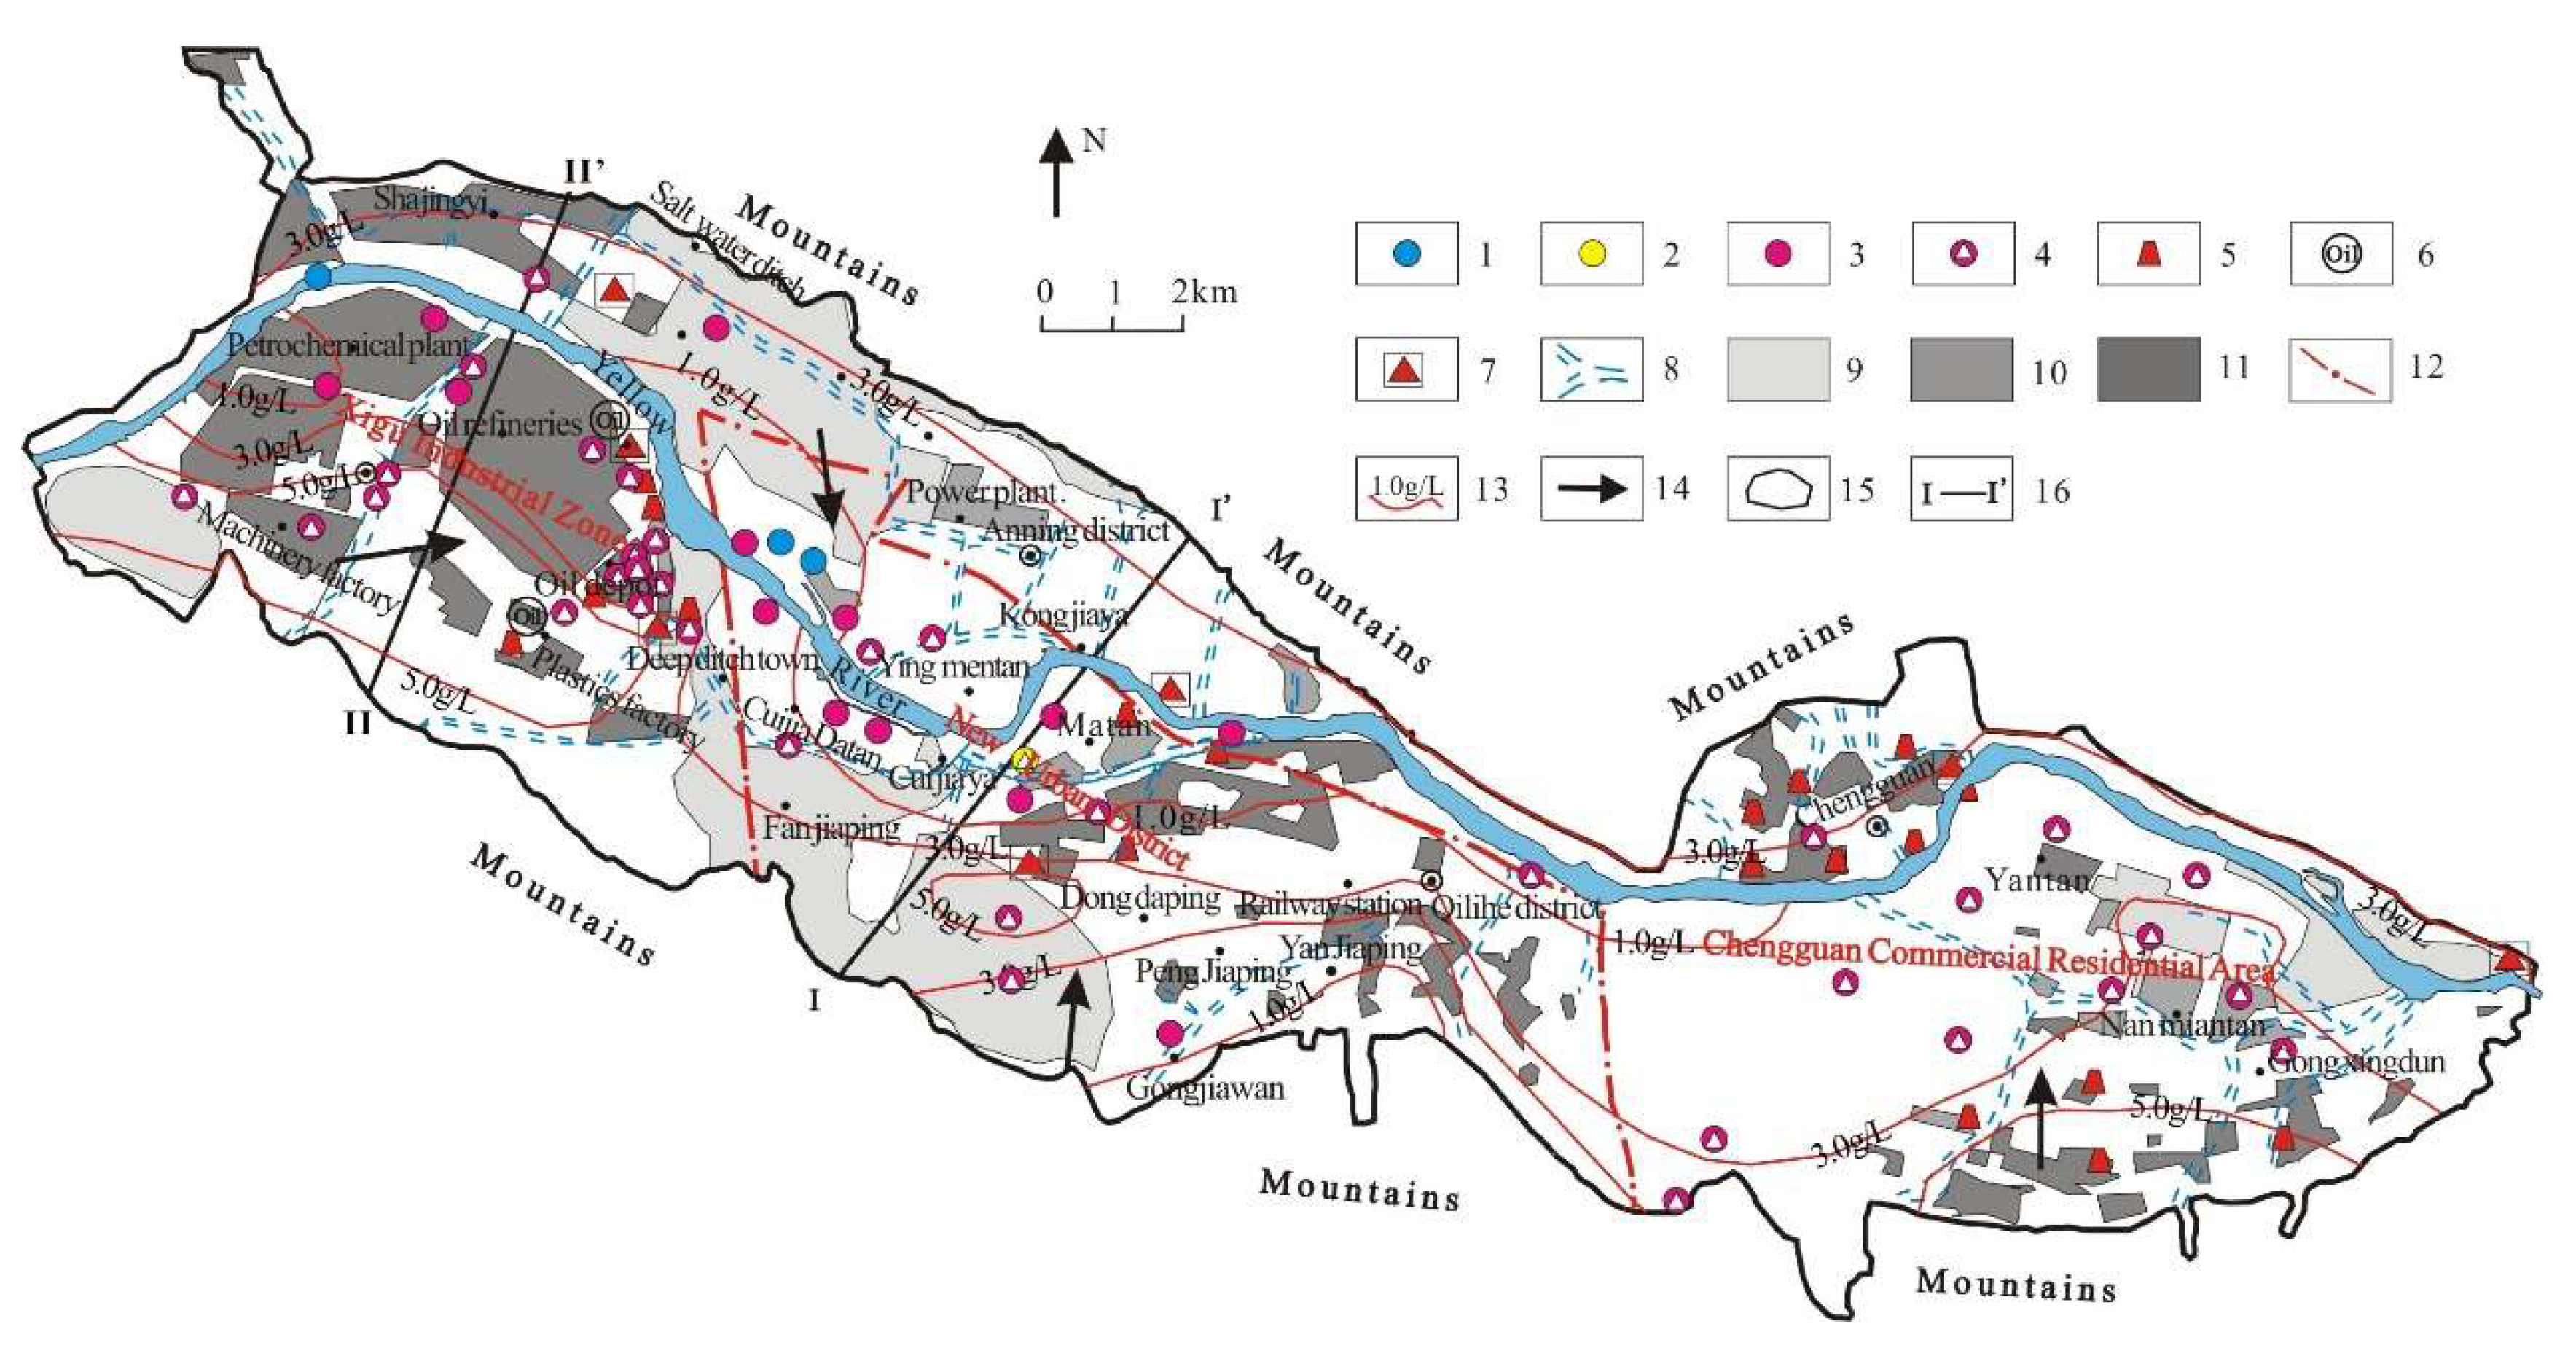
Figure 9.
Contribution rate of the groundwater chemical super class III water index in different urban functional areas. (a) Index contribution rate in Chengguan area. (b) Index contribution rate in Xigu area. (c) Index contribution rate in New urban district.
Figure 9.
Contribution rate of the groundwater chemical super class III water index in different urban functional areas. (a) Index contribution rate in Chengguan area. (b) Index contribution rate in Xigu area. (c) Index contribution rate in New urban district.
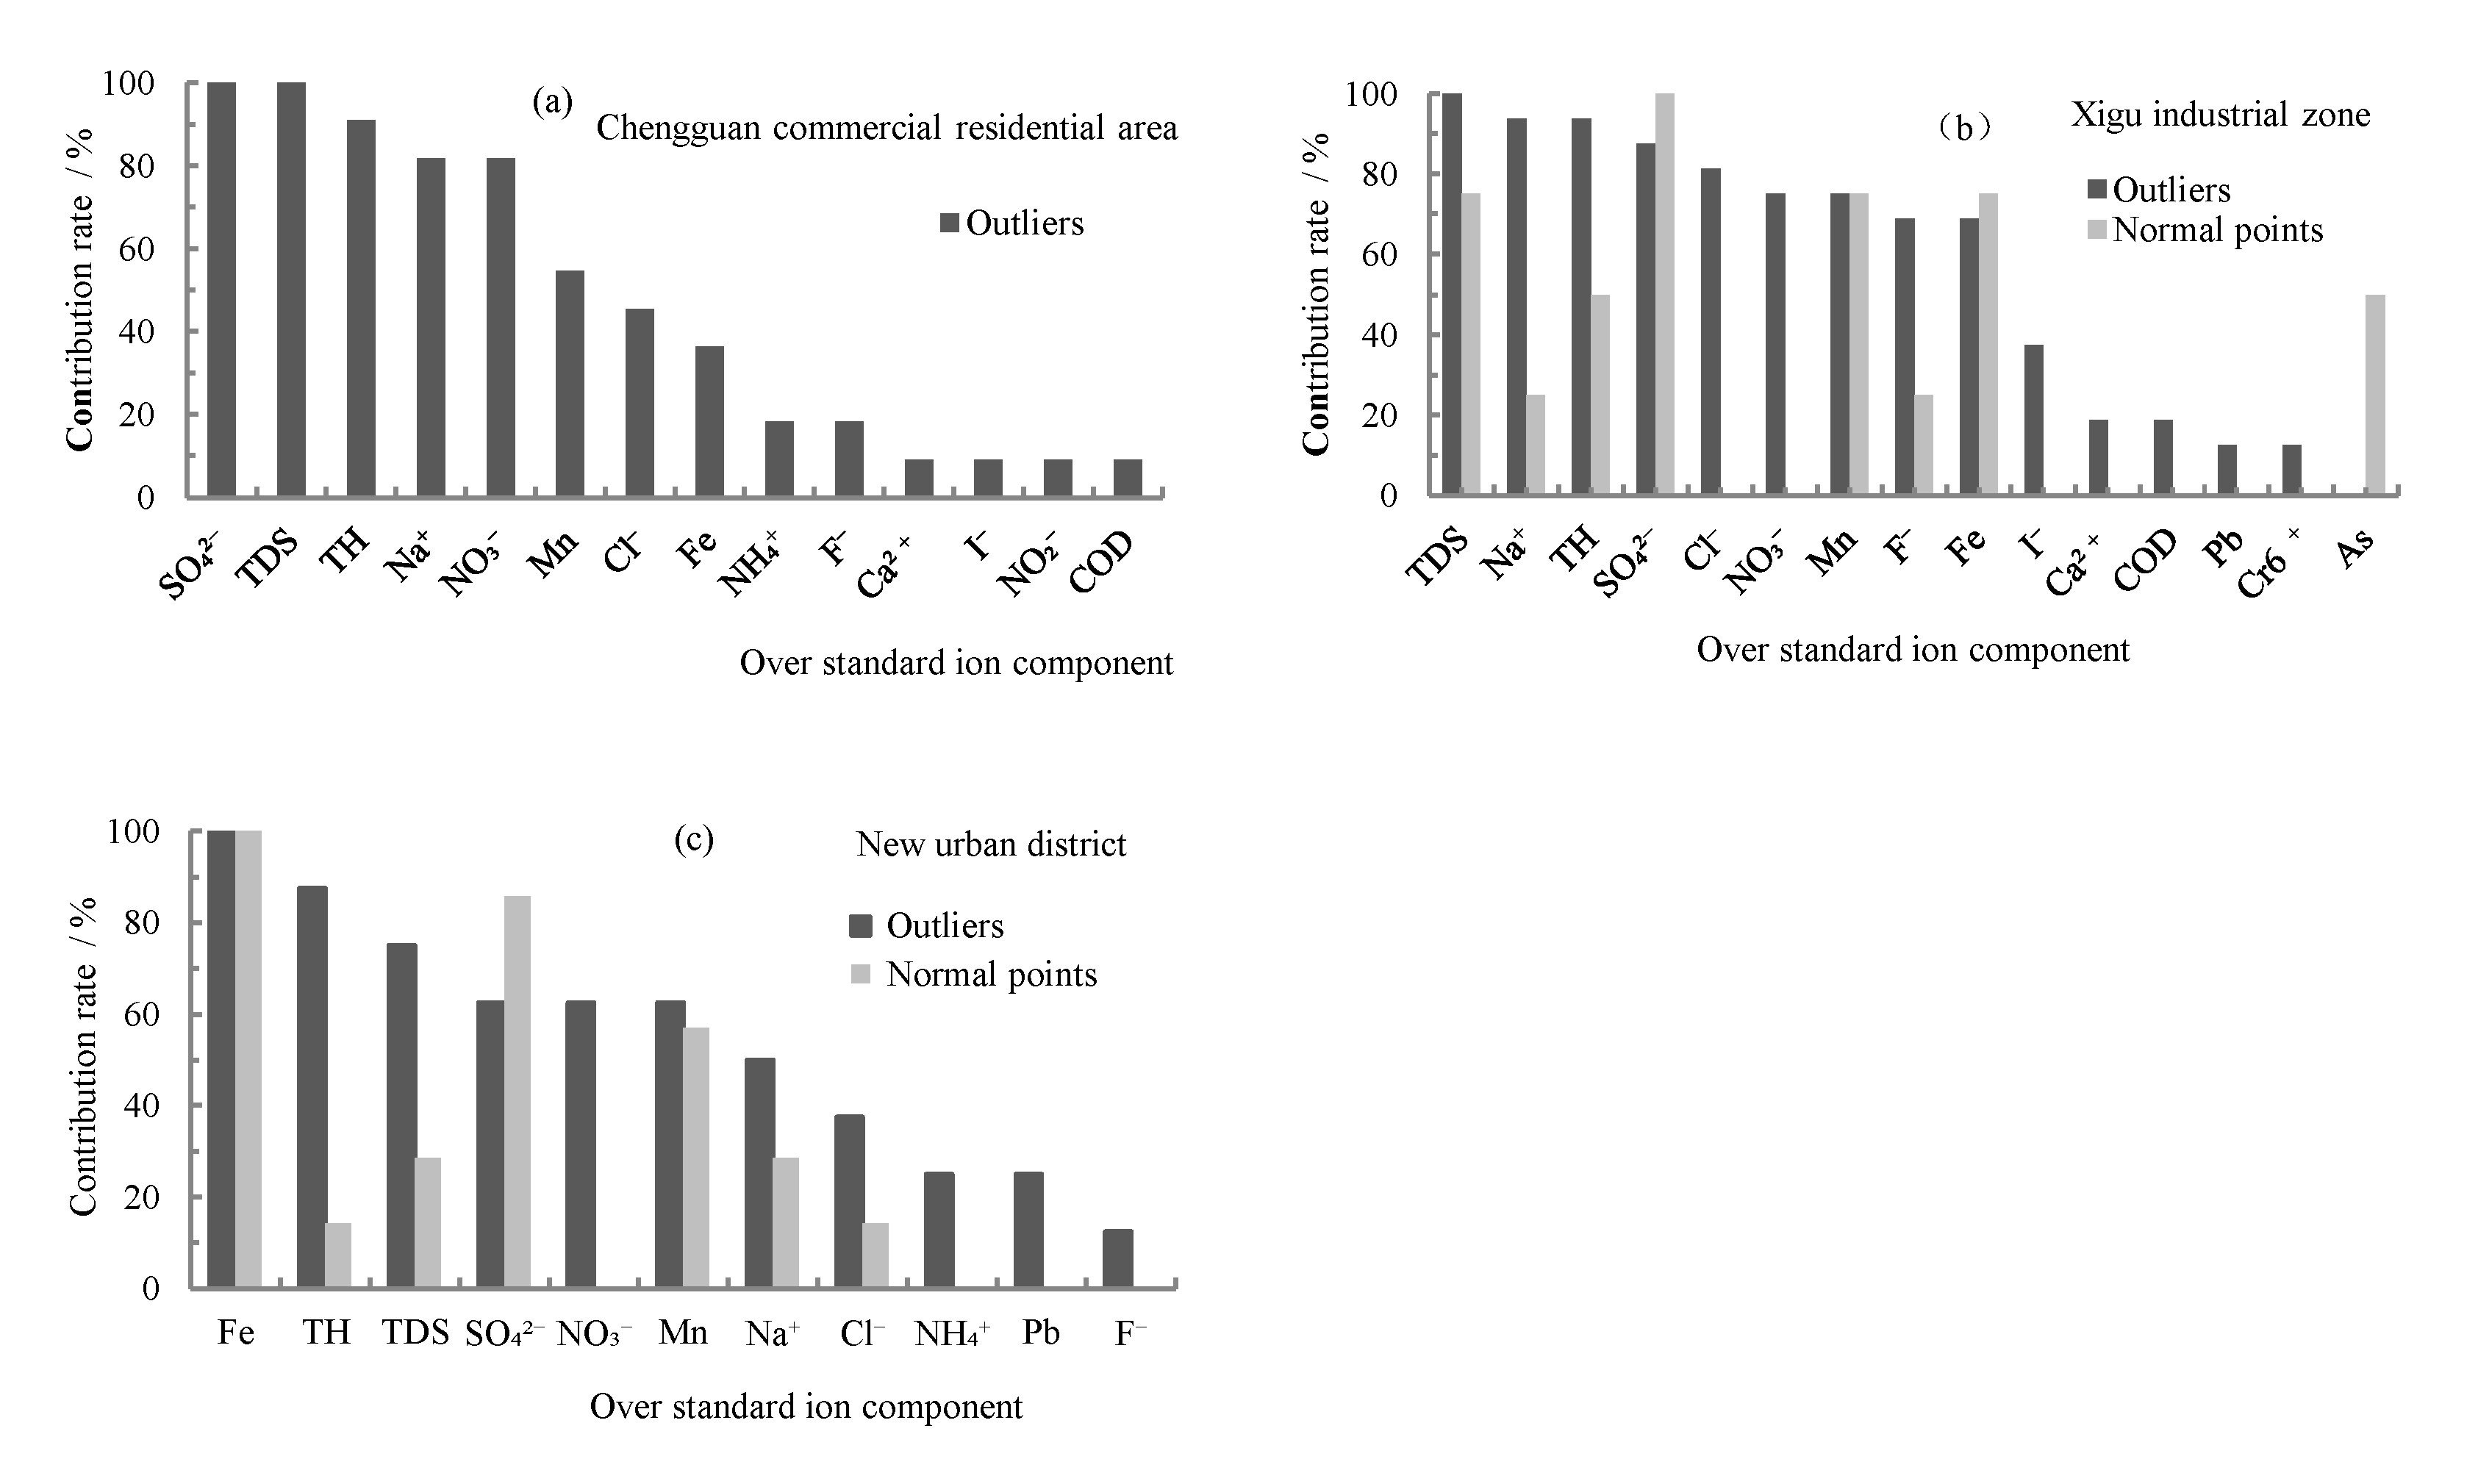
Figure 10.
Gibbs graphs of the water chemical compositions.

Figure 11.
Relationship between groundwater table depth and the concentrations of the impact indicators in the groundwater.
Figure 11.
Relationship between groundwater table depth and the concentrations of the impact indicators in the groundwater.

Table 1.
Chemical composition of the groundwater in study area in 2012.
| Items | Standard (mg/L) | Xigu District (n = 20) | New Urban District (n = 21) | Chengguan District (n = 11) | ||||||||||||
|---|---|---|---|---|---|---|---|---|---|---|---|---|---|---|---|---|
| Min (mg/L) | Max (mg/L) | Average (mg/L) | Cv (%) | ESR (%) | Min (mg/L) | Max (mg/L) | Average (mg/L) | Cv (%) | ESR (%) | Min (mg/L) | Max (mg/L) | Average (mg/L) | Cv (%) | ESR (%) | ||
| K+ | — | 4.3 | 43.2 | 15.3 | 73 | — | 2.5 | 11.6 | 6.2 | 45.7 | — | 7.9 | 77.8 | 19.1 | 110.3 | — |
| Na+ | 200 | 153.2 | 11,315 | 1663.7 | 180.1 | 80 | 35.4 | 1585 | 223.1 | 148.8 | 28.6 | 119.6 | 3235 | 601.8 | 147.9 | 81.8 |
| Ca2+ | 400 | 12.2 | 1008 | 262.2 | 97.9 | 15 | 1.9 | 321.4 | 112.5 | 71.8 | 0 | 65 | 436.4 | 200.4 | 60.6 | 9.1 |
| Mg2+ | 50 | 12.6 | 1999 | 337.6 | 142.6 | 90 | 2.3 | 305.7 | 61.7 | 120.2 | 38.1 | 46.9 | 383.7 | 119.6 | 83.5 | 81.8 |
| Cl− | 250 | 85.8 | 19,822 | 2266 | 222.9 | 65 | 29.8 | 1663 | 227.9 | 164.4 | 19 | 99.8 | 3939 | 626.2 | 178.9 | 45.5 |
| SO42− | 250 | 136.9 | 7072 | 1868.7 | 112.3 | 90 | 75.3 | 2420 | 405.6 | 128.2 | 52.4 | 368.8 | 3443 | 952.1 | 94.8 | 100.0 |
| HCO3− | — | 120.9 | 1106 | 418.4 | 51 | — | 121.5 | 457.7 | 266.4 | 33.4 | — | 272.9 | 613.1 | 436 | 24.2 | — |
| NO3−-N | 20 | 0.2 | 209.1 | 40.2 | 128.9 | 45 | 0.1 | 64.2 | 15.3 | 128.9 | 19 | 8.2 | 85.4 | 35.6 | 60.6 | 81.8 |
| NO2−-N | 1.0 | ND | 0.396 | 0.049 | 227.9 | 0 | ND | 0.183 | 0.011 | 355.6 | 0 | ND | 3.47 | 0.471 | 225.7 | 9.1 |
| NH4+-N | 0.5 | ND | 0.233 | 0.028 | 235.2 | 0 | ND | 19.4 | 1 | 444.8 | 9.5 | 0 | 1.867 | 0.297 | 191 | 18.2 |
| F− | 1.0 | 0.3 | 3.8 | 1.3 | 68.6 | 60 | 0.1 | 1.2 | 0.3 | 88.3 | 9.5 | 0.3 | 2.3 | 0.7 | 91.9 | 18.2 |
| H2SiO3 | — | 2.8 | 31.8 | 15.6 | 42.2 | — | 2 | 22.9 | 12.4 | 39.7 | — | 15.6 | 24.1 | 18.4 | 12.1 | — |
| Fe | 0.3 | 0 | 39.8 | 7.2 | 145.6 | 70 | ND | 45.2 | 6.2 | 187.8 | 71.4 | ND | 5.7 | 0.8 | 217.4 | 36.4 |
| Mn | 0.1 | 0 | 2.3 | 0.5 | 141.9 | 75 | ND | 1.1 | 0.2 | 163.2 | 42.9 | ND | 0.6 | 0.2 | 105.4 | 54.5 |
| TDS | 1000 | 917.3 | 42,788 | 6927.6 | 158.7 | 95 | 312.4 | 6711 | 1254.4 | 111.2 | 38.1 | 1223 | 12053 | 2903.7 | 109.3 | 100 |
| TH | 450 | 82.2 | 10,755 | 2045.3 | 127.6 | 85 | 14.2 | 2062 | 535 | 91.2 | 38.1 | 357.3 | 2669 | 992.8 | 68.8 | 90.9 |
| pH | 6.5–8.5 | 7.2 | 8.8 | 7.6 | 5.8 | 9.5 | 5.7 | 9.7 | 7.7 | 8.6 | 9.5 | 6.9 | 8 | 7.3 | 4.8 | 0 |
Notes: n represents the sample collection quantity (group); ND is lower than detection limit, the calculation of zero processing; ”—” means non-existent; Cv: Coefficient of Variation; ESR: Exceeding standard rate; the standard value is the limit value stipulated in the groundwater quality standard (GB/T14848-2017) [32].
Table 2.
Identification of abnormal water chemical data from the hydrochemical diagrams.
| Hydrochemical Diagram | Abnormal Data Identification (Group) |
|---|---|
| Piper hydrochemistry diagram of piper | 5 |
| Ion exchange diagram | 11 |
| Na+ + K+–Cl− | 9 |
| Ca2+ + Mg2+–HCO3− | 17 |
| Ca2+ + Mg2+–O42− | 7 |
| Total number | 38 |
The total number identified for each method contains duplicates.
Table 3.
Principal component analysis of the major ions in Lanzhou City.
| Chemical Parameters | PC1 | PC2 | PC3 |
|---|---|---|---|
| TDS | 0.996 | 0.000 | −0.013 |
| Electrical conductivity | 0.992 | −0.026 | −0.022 |
| Total hardness | 0.991 | 0.041 | 0.005 |
| Na+ | 0.989 | −0.018 | −0.021 |
| Mg2+ | 0.986 | 0.043 | 0.010 |
| Cl− | 0.973 | −0.083 | −0.015 |
| Ca2+ | 0.957 | 0.031 | −0.010 |
| NO3− | 0.935 | −0.131 | −0.012 |
| SO42− | 0.910 | 0.201 | −0.005 |
| F− | 0.812 | 0.256 | 0.064 |
| Pb | 0.077 | 0.804 | 0.184 |
| I− | 0.134 | 0.702 | −0.049 |
| Fe | −0.092 | 0.655 | −0.101 |
| Mn | −0.033 | 0.648 | 0.645 |
| As | 0.086 | −0.180 | 0.809 |
| Eh | 0.080 | −0.125 | −0.758 |
| Eigenvalue | 9.180 | 2.171 | 1.697 |
| Explained variance (%) | 57.374 | 13.568 | 10.604 |
| Cumulative % of variance | 57.374 | 70.941 | 81.545 |
Publisher’s Note: MDPI stays neutral with regard to jurisdictional claims in published maps and institutional affiliations. |
© 2022 by the authors. Licensee MDPI, Basel, Switzerland. This article is an open access article distributed under the terms and conditions of the Creative Commons Attribution (CC BY) license (https://creativecommons.org/licenses/by/4.0/).
Share and Cite
MDPI and ACS Style
Lü, X.; Han, Z.; Li, H.; Zheng, Y.; Liu, J. Influence of Urbanization on Groundwater Chemistry at Lanzhou Valley Basin in China. Minerals 2022, 12, 385. https://doi.org/10.3390/min12030385
AMA Style
Lü X, Han Z, Li H, Zheng Y, Liu J. Influence of Urbanization on Groundwater Chemistry at Lanzhou Valley Basin in China. Minerals. 2022; 12(3):385. https://doi.org/10.3390/min12030385
Chicago/Turabian StyleLü, Xiaoli, Zhantao Han, Haijun Li, Yuejun Zheng, and Jingtao Liu. 2022. "Influence of Urbanization on Groundwater Chemistry at Lanzhou Valley Basin in China" Minerals 12, no. 3: 385. https://doi.org/10.3390/min12030385
Note that from the first issue of 2016, this journal uses article numbers instead of page numbers. See further details here.