
Comparative Analysis of Dust and Noise Emission in Aggregate Production Systems


Department of Environmental Engineering, Faculty of Civil Engineering and Resource Management, AGH University of Science and Technology, Mickiewicza 30 Av., 30-059 Cracow, Poland
*
Author to whom correspondence should be addressed.
Minerals 2022, 12(4), 452; https://doi.org/10.3390/min12040452
Submission received: 11 February 2022
/
Revised: 12 March 2022
/
Accepted: 4 April 2022
/
Published: 7 April 2022
(This article belongs to the Special Issue Innovative Solutions for Measurements, Modelling and Control in Mineral Processing)
Abstract
:This paper concerns investigations on dust particles and noise emission in mineral aggregate production. Two technological circuits of aggregate production were under investigation. The first circuit was based on a two-stage screening system, while the other was designed on a basis of a patented solution of regular aggregate production. Results of investigations show that an innovative circuit allows for reduction of screening stages which results in shortening the entire circuit. The quality of obtained products is better, while the environmental footprint of the latter circuit is lower. Results of investigations showed that reduction both in terms of dust particle emission and in noise generation was achieved.
1. Introduction
Technology involved in production of mineral aggregates is primarily based on crushing and screening processes, with utilization of other supporting operations like belt transportation, washing, or initial removing of impurities from the feed material. Configuration of an individual circuit that covers application of specific crushing and classifying devices is determined by the type of processed material, its physical and mechanical properties, particle size, composition, and shape, as well as qualitative requirements of final products and components [1,2]. Technological circuits of aggregate production usually utilize more than one crushing stage combined with screening. It is worth underlining that the feed characteristics play a crucial role in configuration of the circuit, especially regarding the complexity degree of a given production system [3]. The more complex the circuit, the higher operational and maintenance costs, along with higher numbers of supporting operations, material transport lines, recycle streams, and multi-stage classifications. An optional multi-stage circuit of aggregate production was presented in Figure 1, where boxes and lines drawn with dashed line are optional, depending on the specifics and operational conditions.
Crushing processes, especially those connected with finer comminution, are very energy consuming, and a major part of processing costs is incurred in comminution processes. They are also a source of other unwelcome environmental effects, mainly extensive dust particle generations and noise emissions [4,5,6]. Apart from that, heat generation and intense vibrations can be also observed. This is due to the nature of the operational characteristics of crushing and screening devices. Both crushers and screens consist of a number of movable parts and components that rotate with a considerable speed, often with eccentric movement, which may contribute to intense vibrations [7,8]. In general, crushing and screening operations are of a high negative impact both on the environment and humans, and due to their high energy consumption they indirectly contribute to higher emission of carbon dioxide CO2 and other nuisances [9,10,11]. Dry grinding opened or semi-opened operations are especially responsible for the high level of dust emission into the atmosphere, which affects deterioration of living conditions, especially for habitants in proximity of processing plants [12,13]. Another drawback of aggregate production operations is excessive noise emission. Apart from living conditions, the dust pollution may cause various diseases connected to a major extent with respiratory and cardiovascular systems. This may be also related to higher level of stress, general feelings of discomfort and malaise or even sleep disorders [14,15,16]. Considering the above, special attention and efforts aiming at limitation of the negative impacts of crushing operations on the environment can be observed in mining and mineral processing sector recently. Even though screening operations are much less energy consuming compared to crushing, their environmental nuisance is also very significant, especially due to dust emissions and vibrations [17,18,19]. The technological importance of the screening operation is indisputable, because the selection of proper technology and the screening operation scheme determine the quality of the final products in terms of the shape and size of particles in individual assortments.
Various investigations on dust and noise emission, including modelling the propagation of these pollutants, can be found in recent publications [20,21,22]. The problem is especially popular in open pit mines and concerns not only aggregates but also other raw materials, like coal [23,24]. Various models, based on neural networks and utilizing advanced statistical modelling procedures, are also available [25,26,27]. Together with modeling, extensive works concerning limitation of industrial noise are applied in aggregate mining and processing plants. Sound protective walls [28] and natural noise reduction barriers like tree belts and specific plants can be examples [29,30].
Both the noise and dust are important factors affecting the significant nuisance of industrial aggregate production circuits. Protection of people and the environment against the noise is hugely meaningful, and these issues are the subject of a number of regulations and decrees in the European Union concerning assessment and management of noise level in the environment [31]. A key domestic document within the issue is Environmental Protection Law [32], while methodology of measurements and measuring procedures have been characterized in Regulation of the Minister of Environment [33]. These documents deal with the problem of noise, noise protection, measurements requirements and procedures, as well as standards defining permissible noise levels in the environment. Exposure of workers to noise in industrial areas, where the noise emission is different depending the area or zone, is especially important. Therefore, the problem of mapping noise emitted by individual machines gains importance in effective health protection of workers in the mineral processing industry [34].
Two types of pollutants have major significance in dust emission problems: PM10 dust particles (fractions finer than 10 microns) and PM2.5 (fractions finer than 2.5 microns). They constitute about 2% of Total Suspended Particles (TSP) emission into the atmosphere [35,36]. Both types of dust particulate matter have negative impacts on human health. PM10 affects the trachea-bronchial section of the respiratory system, while PM 2.5 are classified as respirable particles, because they participate in gas exchange processes in the human body. Industrial processes and operations are responsible for about 5% of total air pollution, which means that in Poland alone, as much as 350,000 mg of dust annually is emitted into the atmosphere from industrial processes [37,38,39].
The optimal selection of the screening circuit is determined by the qualitative and quantitative requirements concerning the final aggregate products, and aims at improving overall work efficiency. Optimization activities cover two primary directions: improvement of the quality of produced aggregates and reduction of processing costs. In terms of improving the quality of final aggregate products, the activities are focused on the selection of appropriate methods and devices along with the determination of material flows between individual operations. Lowering the cost of production is related either to the optimal usage of technological and processing capabilities of devices, or to the reduction of the processing stages. The latter solution may bring tangible savings; however, it is much more difficult to achieve them. One of the methods of reducing the number of technological operations can be an application of innovative solutions, such as the circuit for regular aggregate production consisting of appropriately designed screens operating with a crusher in a closed circuit. The idea of such a solution is presented in Figure 2, and the system itself was successfully implemented in several aggregate production plants.
The aim of the paper is an estimation of potential negative environmental impact in terms of noise and dust emission during operation of an innovative one-stage circuit of regular aggregate production [40], based on multi-deck screening operations. The testing program also included investigations into the classical two-stage system of aggregate production, used as a reference circuit for dust and noise measurements.
2. Research Significance and Novelty
Considering the results of recent investigations within the issue, the problem of environmental impacts of aggregate production sector is very significant. Open pit plants, especially in proximity to residential areas, constitute a significant nuisance mostly, but not only, in terms of noise and dust emissions [4]. Operational practice shows that activities aiming at limitation of dust pollutants are more effective when performed closer to the source of pollution, while sound protective screens and natural barriers can be built along the mine boundaries [41].
The novelty of this paper consists in the determination of dust and noise emission depending on changeable operating parameters of the screening operations and screening device configuration. This approach underlines the significance of technological development in potential dust and noise reduction, thus improving the quality of life of society and plant workers. The authors are aware that environmental impact is connected with many other factors, but the presented investigations focus on dust and noise emissions.
The problem presented in the paper is also significant due to the innovation of the circuit under testing. The screening system presented in Figure 2 has new features and functionality compared to technological circuits available on the domestic and foreign markets, and is based on two patents (PL 233689B1, PL 231748B1). The screening efficiency is connected to the type of slot screen and the size of the slots in relation to the particle size range of the screened fraction. It also depends on the dynamic parameters of the vibrating screen, and the type of crusher used. This has a positive effect on the screening efficiency as well as the yield of finest size fraction (below 2 mm) and dust particulate generation. The energy consumption can be lower for about 1 kWh/t of produced aggregate, and costs savings on spare parts can be reduced by 0.1–0.15 USD/t. On the other hand, the costs associated with the operation of an additional screen are not significant, and equal about 3.7–8.6 USD/1000 t of the screened material, depending on the type of screen and the sieve decks used. By adjusting the appropriate dimensions of the screening device (or sieve decks, depending on the type of invention), it is possible to increase the efficiency of the technological system of comminution and screening by up to 30%. An increase in the efficiency depends on the content of regular particles, which can be moved out from the system as a final product, since there is no need for further regrinding of these particles. The benefit of this innovation, apart from energy saving, is also a possibility of selective division of any particle size fractions into regular and irregular particles. Separated fractions can be combined into any final product (2–8, 8–16, 16–32, 2–16 mm, etc.) in appropriate proportions and maintain the stability of the aggregate mix (stabilization of the grain size curve, with or without the participation of oversize and undersize). As an overall technological result, the quality of the final product is increased due to higher content of regular particles.
3. Materials and Methods
Measurements of dust emission during the testing program were carried out with using of a Casella Microdust Pro meter device (Casella, Sterling, MA, USA) (Figure 3) which was placed on a tripod at a height of approximately150 cm and about 1.5 m away from the screening device. The meter device registers PM10 dust particles, i.e., pollutants with a diameter not exceeding 10 μm. Concentration of PM10 dust particles was measured in milligrams per cubic meter [mg/m3]. All measurements were performed in a continuous mode with raw data recording every 1 s. The measurement duration was between 230 and 270 s, and background measurements lasted 200 s. Current standards do not determine strictly the length of measurements concerning dust [33]. It is advisable to run measurements in continuous mode, if possible, as it is practiced in air monitoring systems, especially those operating in urban areas. On the basis of these requirements, the measurements were run during the total screening process, which lasted from 230 to 270 s, depending on the tested screening system.
The acoustic pressure LAeq emitted to the environment as noise can be calculated from the Equation (1).
where: T—measurement time, [s]; ti—time interval T, [s]; LAi—registered level of noise during time period ti [dB]. The permissible and real noise level emitted by a specific source also depends on the sound frequency. It is assumed that the audible range of sound is within the range of 16 to 20,000 Hz [42], but the human ear is most sensitive to sounds with a frequency between 1000 and 3000 Hz. However, for very high levels of sound pressure, the lower limit of audibility can be reduced even to 4 Hz. Thus, low-frequency noise and infrasounds should be also taken into account in the analysis of noise harmfulness, but the noise measurements consider these both parameters. In order to unify the results, so-called “correction curves” were introduced in the methodological approach. The frequency curve type A, characterized in a standard [43], is used most frequently and its shape is close to the reverse function of human ear sensitivity for the sound level of 40 dB. The curve can be calculated from the Equation (2)
where: f1, f2, f3, f4—parameters determining levels of frequency. The frequency curve of C type, described through Equation (3), can be also utilized for normalization.
A1000 and C1000 are normalizing constants, expressed in [dB], required for obtaining the values of correction characteristics that are equal to 0 dB for the f = 1 kHz, and equal, respectively: A1000 = –0.062 dB and C1000 = –2.0 dB. Approximated values of f1–f4 are: f1 = 20.6 Hz, f2 = 107.7 dB, f3 = 737.9 Hz, f4 = 12194 Hz. [44]. Graphical form of functions (2) and (3) are presented in Figure 4.
The calculated LAeq value is reported together with the extended uncertainty range for k = 2, according to Equation (4).
where: s—standard deviation, n—number of single measurements, t95—value of T-Student distribution for n − 1 degrees of freedom and confidence level 1—α = 95%.
Measurements were carried out for one- and two-stage screening processes in a multi-deck screen. If the productivities of both circuits are different, the noise emission level for each tested circuit can be calculated per its productivity (5), in order to obtain the comparable noise emission factors.
where: Q—productivity of the circuit/device.
Each single noise measurement was carried out during t = 3 min, and four measurements were made for each tested circuit. The applied methodology and measurement technique was convergent with [33]. This norm requires that a single measurement should be continuously registered for not less than one minute. The measurement has been carried out in a way to achieve data registered during a maximum possible number of continuous and complete minutes.
The laboratory circuits under investigation are presented in Figure 5 and Figure 6. The feed material size was identical in the two tested circuits and constituted aggregate particles between 2 and 8 mm (Figure 5 and Figure 6). Four final products from both circuits were obtained, each with different particle sizes and regularity of particles. The two upper decks in the screen consist of two types of sieves: an ordinary screen with square mesh 6.3 × 6.3 or 4 × 4 mm in the first section, and the bar sieves with rectangular mesh 5 × 50 and 3 × 40 mm in the second section. The third deck consists of only a bar sieve with a mesh 2 × 35 mm (Figure 5). The screening system presented in Figure 6 is similar in principle, but ordinary and bar sieves are installed in separate frames. The term PI means that irregular particles dominate this product, while PR means that regular particles constitute the majority. The tests were carried out in the manner maintaining equal or similar productivity. On the basis of the obtained results, average values of dust and noise emissions were calculated along with standard deviations. Background emissions prior to each single test were also determined.
4. Results
4.1. Noise Level Measurements
The background noise level was determined prior to the core measurements of noise emission during the operation of both circuits. One single measurement was performed for a duration of 300 s. As mentioned in the previous chapter, a single measurement should not be less than one minute. However, having calculated characteristics on the basis of the longer data sequence, their statistical significance is higher. Therefore, a 5 min period was arbitrarily for background noise measurement. Results are presented in Figure 7 and Figure 8.
The average level of registered noise in the laboratory, when no operation was carried out, was 46.5 dB, with a standard deviation of 1.51 dB. The value of an extended uncertainty, calculated according to Equation (2), equaled 0.34 dB. Therefore, the 95% range of emission calculated from Equation (4) is presented below (6).
The width of this range is lower than 1 dB, so the background can be assumed as stable from the scope of the noise emission.
Results of noise emission during the operation of one-stage and two-stage screening circuits are presented in Table 1. Four single measurements were carried out for each configuration of the circuit. Individual values of noise and corresponding values of extended uncertainty were calculated according to Equations (1) and (4). Specific values of standard deviation, calculated on the basis of four measurements, are also provided.
The results show an average noise LAeq generated by the one-stage circuit equaled 87.80 dB, which was nearly 4 dB lower compared to the two-stage circuit. However, the values of standard deviations calculated for both circuits indicate that a lower value was achieved for two-stage circuit. This may indicate that the noise generated during operation of the two-stage innovative screening circuit can be less burdensome for operators and persons in the proximity of the device, despite its higher value. This is due to registered lower variations of values during measurements. It was also confirmed by obtained values of calculated extended uncertainties. Exemplary single measurements for both circuits were presented in Figure 9.
On the basis of the obtained results, it can be stated that operational characteristics of the innovative aggregate production circuit are more beneficial in terms of generated noise compared to the two-stage aggregate production system. It is also worth mentioning that the productivities of both tested circuits were similar. However, the results of preliminary investigations [40] show that it is possible to increase the capacity of the one-stage system. For the higher productivity of the innovative system, the index of noise level per productivity (Equation (5)) would be even lower compared to the conventional circuit. As a result, the environmental footprint of the one-stage circuit would be much less negative with regard to noise emission.
4.2. Dust Pollution Results
Table 2 presents dust pollution achieved during operation of both types of screening circuits.
Analysis of dust emission (Figure 10, Table 2) shows that the one-stage circuit generates a much lower amount of dust particles compared to the two-stage system. Average dust pollution for the one-stage production system equaled 1.20 mg/m3 and was more than two times lower than the analogous average value for the two-stage circuit (3.42 mg/m3). Standard deviation of dust emission was about three times lower for the one-stage circuit compared to the two-stage system. Peak values were also much higher for the two-stage circuit and equaled nearly nine mg/m3, while the analogous value for the one-stage circuit did not exceed 3 mg/m3. The obtained results show that the one-stage system is much more effective, considering the lower dust pollution compared with the typical two-stage circuit. Even if the achieved results are calculated per processing stage, a theoretical unit dust emission for the two-stage system would equal 1.71 mg/m3. This value is as much as 30% higher than the dust pollution for the one-stage circuit. The results are convergent with the findings presented in literature [40] and confirm the higher quality of products produced in the analyzed innovative circuit. Its additional benefits can be seen in the lower environmental footprint from the scope of dust and noise emissions.
The results are especially interesting when the entire circuit of aggregate production is taken into consideration. The crushing stage in the innovative circuit can be reduced to one crusher operating in a closed cycle. Energy savings of such a circuit configuration were proved [4,13], together with lower negative environmental effect [23,38]. The presented results are also in line with domestic and international regulations concerning the environmental impact of the mining industry [33,39]; therefore, the potential application of the one-stage aggregate production system may bring both technological and economic benefits, together with lowering the negative environmental impact.
5. Discussion
It is noteworthy that the noise level registered during laboratory experiments is relatively high. It can be seen that the operational staff is exposed to the harmful effects of noise not only on an industrial scale but also in the laboratory. When it is impossible to reduce the noise of individual processing devices, people are left with the use of hearing protectors, which seems to be a too-little appreciated method of hearing protection.
It is also worth mentioning that threshold permissible values of noise level emitted into the environment are different for the day and night time. They also differ depending on the type of noise, divided into traffic noise and noise from other sources (Table 3). These values are specified in [33], and selected numbers are presented in Table 3.
For dust emissions, the applicable standards for PM10 and PM2.5 concentration in the air, provided by WHO equal as 50 and 25 μg/m3, are definitely exceeded [45].
However, for industrial plant conditions, these standards were specified in the Regulation of Polish Minister of Labor and Social Policy [46] on the highest permissible concentrations and intensities of factors harmful to health in the work environment. They were calculated as weighted average concentration values, the impact of which on an employee during the 8 h daily and average weekly working time specified in the Labor Code, for the period of their professional activity, should not cause negative changes in their health condition. Exemplary values of permissible dust concentrations are given in Table 4. These values are much higher, even by one order of magnitude, than in the standards.
Considering that the material under investigation contained less than 2% of silica, the standards were not exceeded. Nevertheless, dust protective equipment should be used in order to minimize negative effects of dust particles on humans in industrial plants.
6. Summary
It is a generally known fact that the configuration of an individual mineral processing circuit, especially its complexity, greatly influences technological and economic performance. The analysis presented in the paper also shows that the number of crushing and screening operations has a negative impact on the natural environment, too. If a circuit operates at a fixed and demanded capacity, a reduction in the number of operations and devices appears more beneficial from technological and economic scopes. The original circuit can be modified accordingly through suitable design of material flows and recycle streams between crushing and grinding operations. The improved circuit can operate at higher capacity, and what is more important, with higher qualitative characteristics of final products, such as more regular particles, minimal contents of oversize and undersize particles in individual size fractions, narrow particle size composition of individual products, etc. But the aim of our investigations was to show that environmental benefits of innovation are evident even without improving the production.
The results of our investigations showed that an aggregate production circuit that utilizes an innovative screening system produces significantly lower amounts of dust particles and emits less noise, especially when it is calculated per operation or per capacity. This is beneficial not only for the reason of lower numbers of processing operations, but also the unit dust and noise emissions per its capacity are lower. Reduction of the environmental nuisance of mining and processing circuits is in lines with modern world trends, but it is also demanded by the policy of domestic and international regulations. This paper’s analysis of screening systems, however, concerned the complete aggregate production system consisting of crushing and grinding devices. The analysis of the total environmental impact of a complete circuit in plant scale is the subject of constant consideration of the authors, and is planned to be covered by further investigations and publications. The authors are aware that such investigations are much more complex and some additional aspects need to be considered, such as changeable productivity, more complex systems of material flow, and various atmospheric conditions, especially for open pit processing plants [47].
7. Patents
Two patents granted in Poland are related to this paper:
- Author: Gawenda T.: Układ urządzeń do produkcji kruszyw foremnych, AGH w Krakowie. Patent No. PL233689B1 granted on 7 August 2019.
- Author: Gawenda T.: Wibracyjny przesiewacz wielopokładowy, AGH w Krakowie. Patent No. PL 231748 B1 granted on 12 June 2018.
Author Contributions
Conceptualization, D.S.; methodology, A.S., T.G. validation, D.S.; formal analysis, A.S., T.G., D.S.; investigation, A.S., T.G., D.S.; data curation, A.S., D.S.; writing—original draft preparation, D.S.; writing—review and editing, A.S., T.G. All authors have read and agreed to the published version of the manuscript.
Funding
This research received no external funding.
Acknowledgments
The article is the result of the National Center for Research and Development (NCBiR) project: competition No. 1 under Sub-measure 4.1.4 “Application projects” of POIR in 2017, entitled: “Opracowanie i budowa zestawu prototypowych urządzeń technologicznych do budowy innowacyjnego układu technologicznego do uszlachetniania kruszyw mineralnych wraz z przeprowadzeniem ich testów w warunkach zbliżonych do rzeczywistych”. Project is co-financed by the European Union from the sources of European Regional Development Fund under Measure 4.1 of the Intelligent Development Operational Program 2014–2020. ![Minerals 12 00452 i001]()

Conflicts of Interest
The authors declare no conflict of interest.
References
- Rajan, B.; Singh, D. Understanding influence of crushers on shape characteristics of fine aggregates based on digital image and conventional techniques. Constr. Build. Mater. 2017, 150, 833–843. [Google Scholar] [CrossRef]
- Jamkar, S.S.; Rao, C.B.K. Index of Aggregate Particle Shape and Texture of coarse aggregate as a parameter for concrete mix proportioning. Cem. Concr. Res. 2004, 34, 2021–2027. [Google Scholar] [CrossRef]
- Naziemiec, Z. Processing and Testing of Mineral Aggregates; AGH Publishing House: Cracow, Poland, 2019. (In Polish) [Google Scholar]
- Lilic, N.; Cvjetic, A.; Knezevic, D.; Milisavljevic, V.; Pantelic, U. Dust and Noise Environmental Impact Assessment and Control in Serbian Mining Practice. Minerals 2018, 8, 34. [Google Scholar] [CrossRef] [Green Version]
- Saramak, A.; Naziemiec, Z.; Saramak, D. Analysis of noise emission for selected crushing devices. Min. Sci. 2016, 23, 145–154. [Google Scholar] [CrossRef]
- Gawenda, T. The influence of rock raw materials comminution in various crushers and crushing stages on the quality of mineral aggregates. Gospod. Surowcami Miner.-Miner. Resour. Manag. 2013, 29, 53–65. [Google Scholar] [CrossRef]
- Tomach, P. Study of intensification of the milling process in the vibratory mill. Przemysł Chem. 2017, 96, 1893–1897. [Google Scholar]
- Feliks, J.; Tomach, P.; Foszcz, D.; Gawenda, T.; Olejnik, T. Research on the New Drive of a Laboratory Screen with Rectilinear Vibrations in Transient States. Energies 2021, 14, 8444. [Google Scholar] [CrossRef]
- Jeswiet, J.; Szekeres, A. Energy Consumption in Mining Comminution. Procedia CIRP 2016, 48, 140–145. [Google Scholar] [CrossRef] [Green Version]
- Lindqvist, M. Energy considerations in compressive and impact crushing of rock. Miner. Eng. 2008, 21, 631–641. [Google Scholar] [CrossRef]
- Baruti, B.; Peci, N.; Vitaku, A.; Malollari, I.; Zeqiri, R.; Kelmendi, M. Analysis of the possibilities of decreasing the impact of crushing operations on environment. J. Environ. Prot. Ecol. 2011, 12, 2056–2061. [Google Scholar]
- Zawada, J. Introduction to Mechanics of Crushing Operations; Publishing House and Printing Institute of Department of Operation Technology: Radom, Poland, 1998. [Google Scholar]
- Naziemiec, Z.; Gawenda, T. Assessment of Comminution Effects in Various Crushers. In Scientific Papers of the Institute of Mining; Wrocław University of Technology: Wrocław, Poland, 2006. [Google Scholar]
- Chief Environmental Protection Inspectorate. Analysis of Air Pollution with PM10 and PM 2.5 Particles, with Consideration of Chemical Composition of Dust and Influence of Natural Pollutions; Report of Inspection of Environmental Protection; Chief Environmental Protection Inspectorate: Warsaw, Poland, 2009.
- Environment Condition in Poland—Signals 2011. In Central Inspectorate of Environmental Protection; Library of Environmental Monitoring: Warsaw, Poland, 2011.
- Ohrstrom, E. Longitudinal survey on effects of changes in road traffic noise annoyance, activity disturbances, and psychosocial well being. J. Acoust. Soc. Am. 2006, 115, 719–729. [Google Scholar] [CrossRef]
- Sairanen, M.; Rinne, M. Dust emission from crushing of hard rock aggregates. Atmos. Pollut. Res. 2019, 10, 656–664. [Google Scholar] [CrossRef]
- Sidor, J.; Feliks, J.; Mazur, M.; Tomach, P. Vibration technique in mineral processing. In Proceedings of the Mechanizacja, Automatyzacja i Robotyzacja w Górnictwie 2015, International Conference, Cracow, Poland, 23–27 February 2015; pp. 102–111. [Google Scholar]
- Wodziński, P. Fine screening and screens. Inżynieria Miner. J. Pol. Miner. Eng. Soc. 2001, 1, 41–57. [Google Scholar]
- Siewior, J.; Tumidajski, T.; Foszcz, D.; Niedoba, T. Prediction of air pollutants concentrations in GOP using statistical models. Annu. Set Environ. Prot. 2011, 13, 1261–1274. [Google Scholar]
- Tumidajski, T.; Foszcz, D.; Niedoba, T.; Siewior, J. Stochastic models of air pollution in industrial agglomerations. In Proceedings of the Air Protection 2008, International Conference, Kosice, Slovakia, 26–28 November 2008; pp. 128–132. [Google Scholar]
- National Pollutant Inventory. Emission Estimation Technique Manual for Mining; Report 2012; Department of Sustainability, Environment, Water Population and Communities: Melbourne, Australia, 2012.
- Lal, B.; Tripathy, S.S. Prediction of dust concentration in open cast coal mine using artificial neural network. Atmos. Pollut. Res. 2012, 3, 211–218. [Google Scholar] [CrossRef] [Green Version]
- Roy, S.; Adhikari, G.; Renaldy, T.; Jha, A. Development of Multiple Regression and Neural Network Models for Assessment of Blasting Dust at a Large Surface Coal Mine. J. Environ. Sci. Technol. 2011, 4, 284–301. [Google Scholar] [CrossRef]
- Chelani, A.B.; Gajghate, D.; Hasan, M. Prediction of Ambient PM10 and Toxic Metals Using Artificial Neural Networks. J. Air Waste Manag. Assoc. 2002, 52, 805–810. [Google Scholar] [CrossRef]
- McKendry, I.G. Evaluation of Artificial Neural Networks for Fine Particulate Pollution (PM10 and PM2.5) Forecasting. J. Air Waste Manag. Assoc. 2002, 52, 1096–1101. [Google Scholar] [CrossRef] [Green Version]
- Nagendra, S.M.S.; Khare, M. Modelling urban air quality using artificial neural network. Clean Technol. Environ. Policy 2005, 7, 116–126. [Google Scholar] [CrossRef]
- Suhanek, M.; Grubesa, S. Innovative Approaches to Noise Reduction. In Noise and Environment; Siano, D., González, A.E., Eds.; IntechOpen: London, UK, 2020. [Google Scholar] [CrossRef]
- Fang, C.-F.; Ling, D.-L. Guidance for noise reduction provided by tree belts. Landsc. Urban Plan. 2005, 71, 29–34. [Google Scholar] [CrossRef]
- Martínez-Sala, R.; Rubio, C.; Garcia-Raffi, L.M.; Sánchez-Pérez, J.V.; Pérez, E.A.S.; Llinares, J. Control of noise by trees arranged like sonic crystals. J. Sound Vib. 2006, 291, 100–106. [Google Scholar] [CrossRef]
- Assessment and Management of Noise Level in Environment. Council of Europe and European Parliament Directive 2002/49/WE; Commission in the Conciliation Committee: Brussels, Belgium, 2002. [Google Scholar]
- Environmental Protection Law. Act of 27 of April 2001. J. Laws 2001, 62, item 627. [Google Scholar]
- Regulation of the Minister of the Environment w sprawie wymagań w zakresie prowadzenia pomiarów wielkości emisji oraz pomiarów ilości pobranej wody. J. Laws 2008, 206, item 1291.
- Susanto, A.; Setyawan, D.O.; Setiabudi, F.; Savira, Y.M.; Listiarini, A.; Putro, E.K.; Muhamad, A.F.; Wilmot, J.C.; Zulfakar, D.; Kara, P.; et al. GIS-based mapping of noise from mechanized minerals ore processing industry. Noise Mapp. 2021, 8, 1–15. [Google Scholar] [CrossRef]
- Air Quality in Europe-2018; Report 12/2018; EEA European Environmental Agency: København, Denmark, 2018.
- Air Pollution Fact Sheet 2014—Poland; EEA European Environmental Agency: København, Denmark, 2014.
- Saramak, A. Comparative analysis of indoor and outdoor concentration of PM10 particulate matter on example of Cracow City Center. Int. J. Environ. Sci. Technol. 2019, 16, 6609–6616. [Google Scholar] [CrossRef] [Green Version]
- Saramak, A.; Naziemiec, Z. Determination of Dust Emission Level for Various Crushing Devices. Min. Sci. 2019, 26, 45–54. [Google Scholar] [CrossRef]
- Technical Guide for Industrial Emissions Reduction; Report 26; AIRUSE: Mississauga, ON, Canada, 2016.
- Gawenda, T. Układ Urządzeń do Produkcji Kruszyw Foremnych. Patent PL 233689 B1; AGH UST: Mississauga, ON, Canada, 2019. [Google Scholar]
- Fan, Y.; Zhiyi, B.; Zhujun, Z.; Jiani, L. The investigation of noise attenuation by plants and the corresponding noise-reducing spectrum. J. Environ. Health 2010, 72, 8–15. [Google Scholar] [PubMed]
- Stopczyk, M. (Ed.) Elektrodiagnostyka Medyczna; PZWL: Warsaw, Poland, 1984. [Google Scholar]
- International Standard IEC 61672-1, 2002–2005: Sound Level Meters. Available online: https://webstore.iec.ch/preview/info_iec61672-1%7Bed1.0%7Den_d.pdf (accessed on 1 January 2022).
- Yszkowski, Z. Miernictwo Akustyczne; WNT: Warsaw, Poland, 1987. [Google Scholar]
- WHO Air Quality Guidelines. 2005. Available online: https://www.euro.who.int/__data/assets/pdf_file/0005/78638/E90038.pdf (accessed on 1 January 2022).
- Regulation of the Minister of Labour and Social Policy on Maximum Permissible Concentration and Intensity of Agents Harmful to Health in the Working Environment. J. Laws 2014, 817, 1–8. (In Polish)
- Jullien, A.; Proust, C.; Martaud, T.; Rayssac, E.; Ropert, C. Variability in the environmental impacts of aggregate production. Resour. Conserv. Recycl. 2012, 62, 1–13. [Google Scholar] [CrossRef] [Green Version]
Figure 1.
Typical multi-stage circuit of aggregate production.
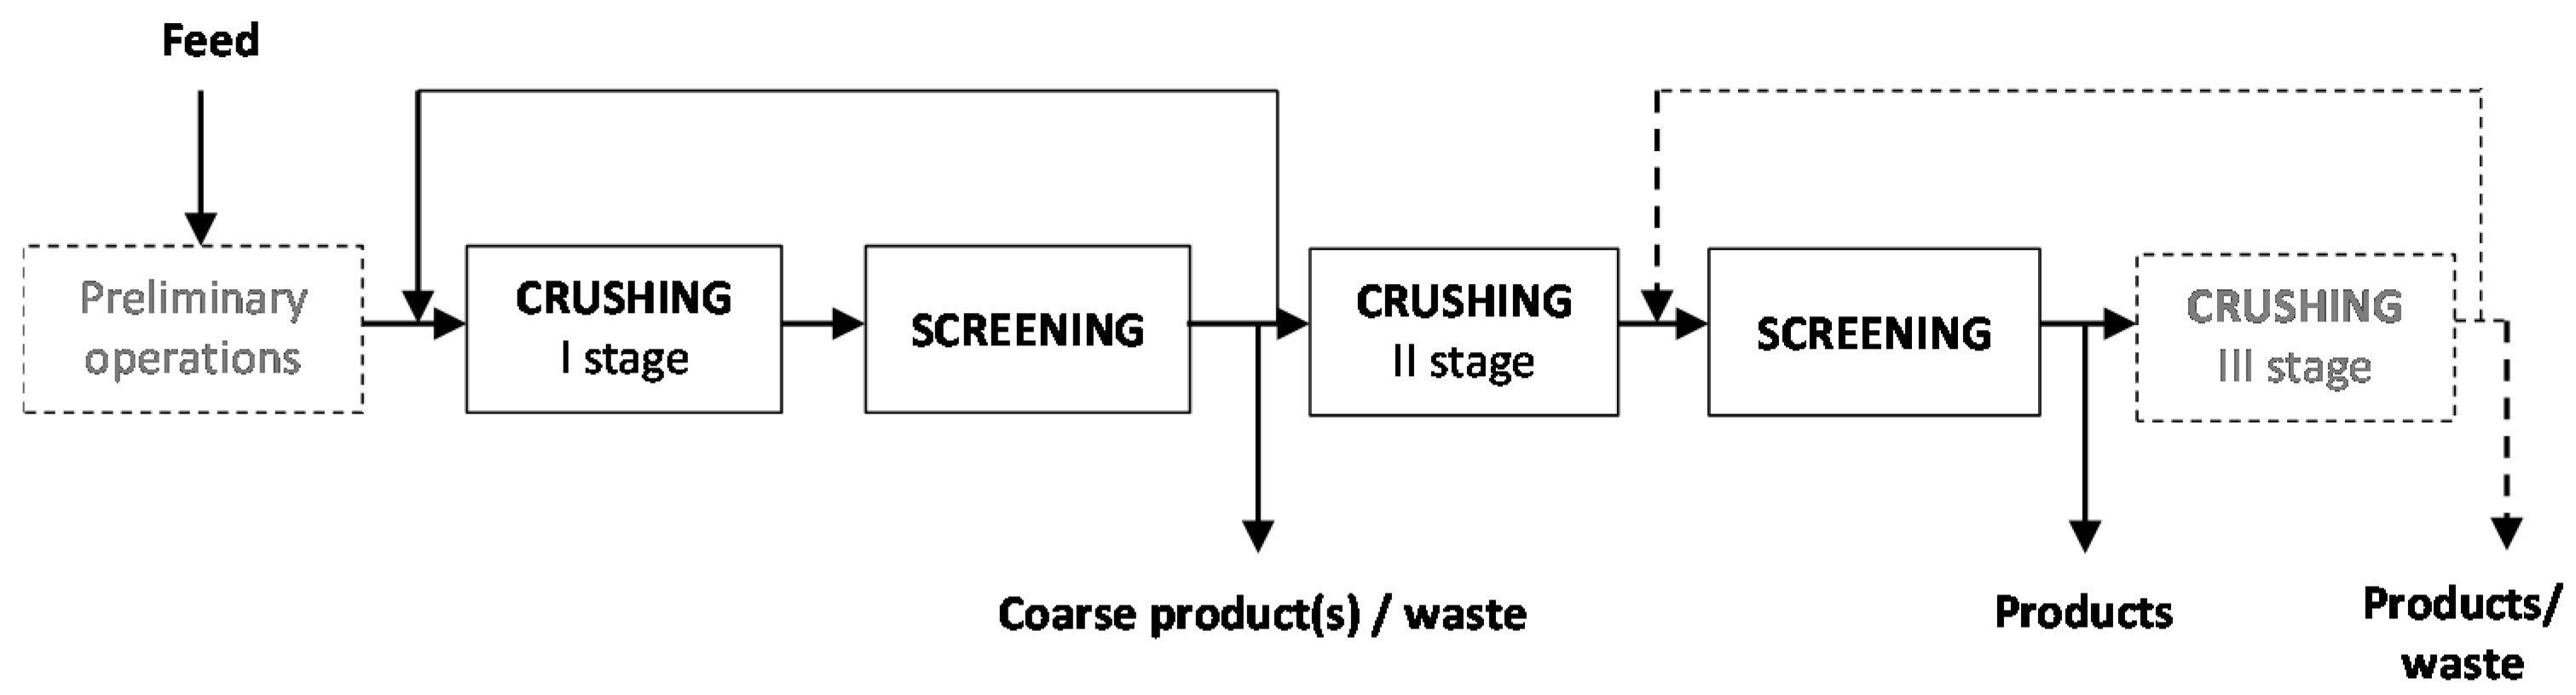
Figure 2.
Scheme of regular aggregate production system [25].
Figure 2.
Scheme of regular aggregate production system [25].
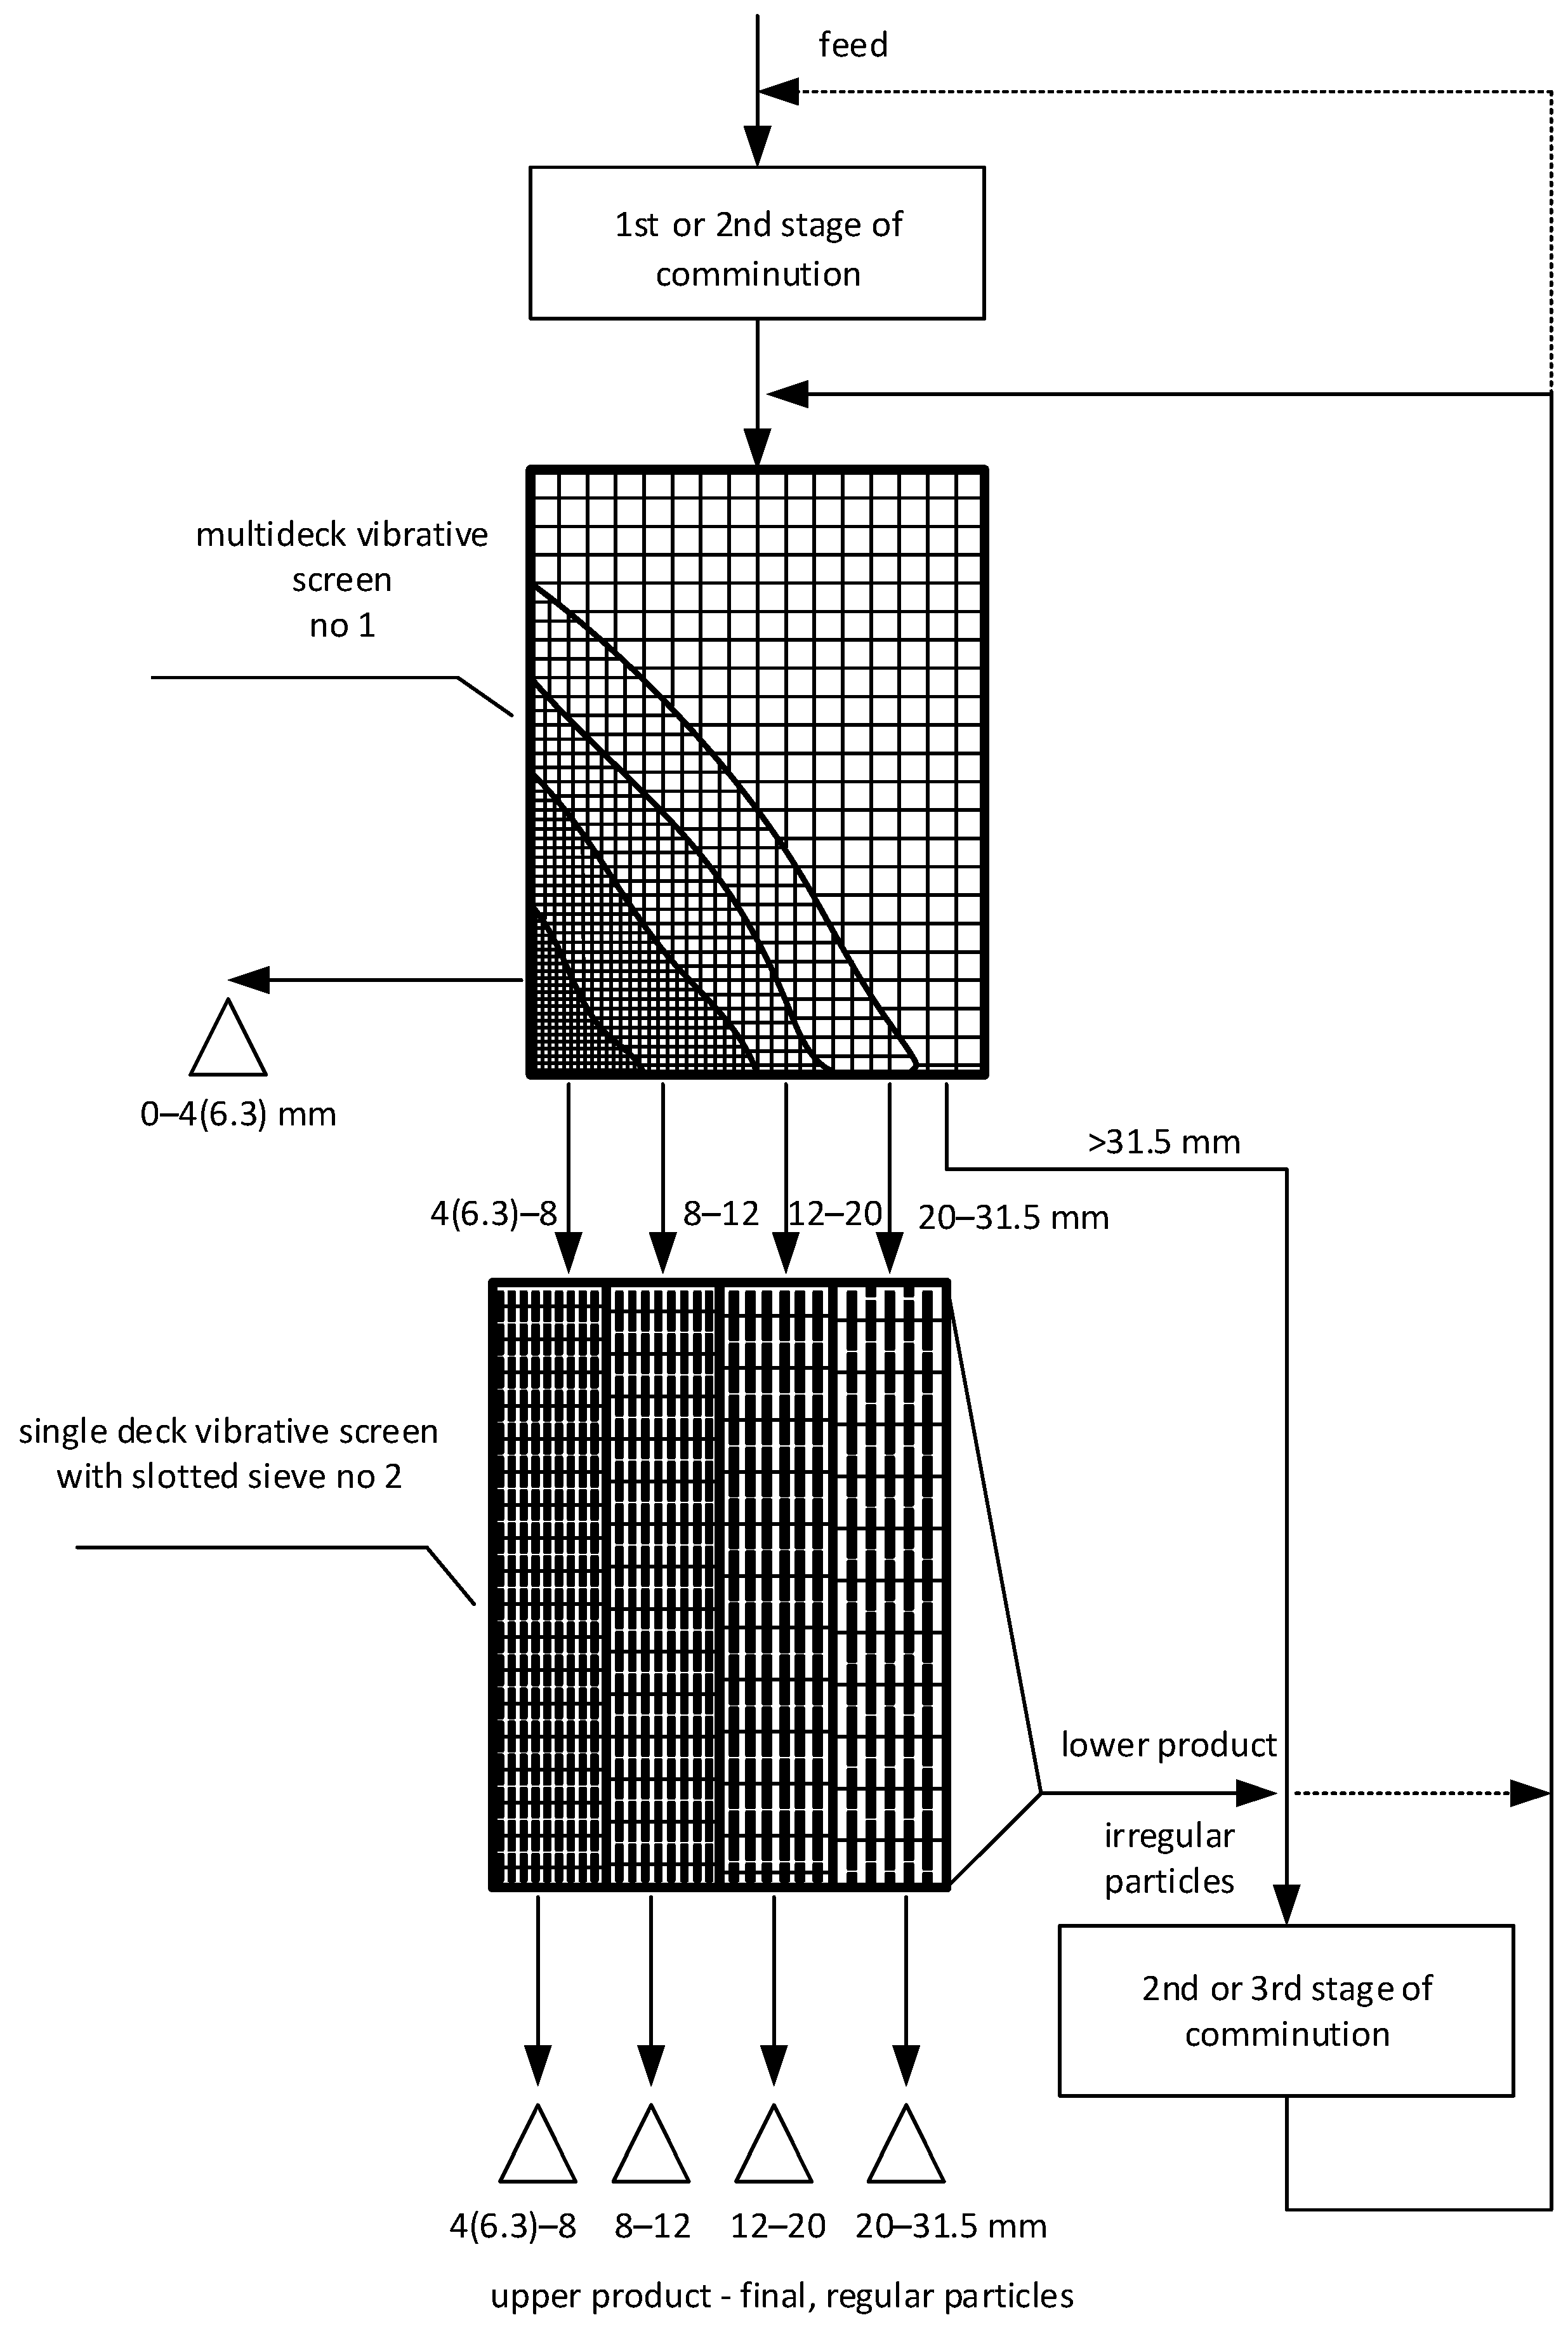
Figure 3.
Dust measuring device.
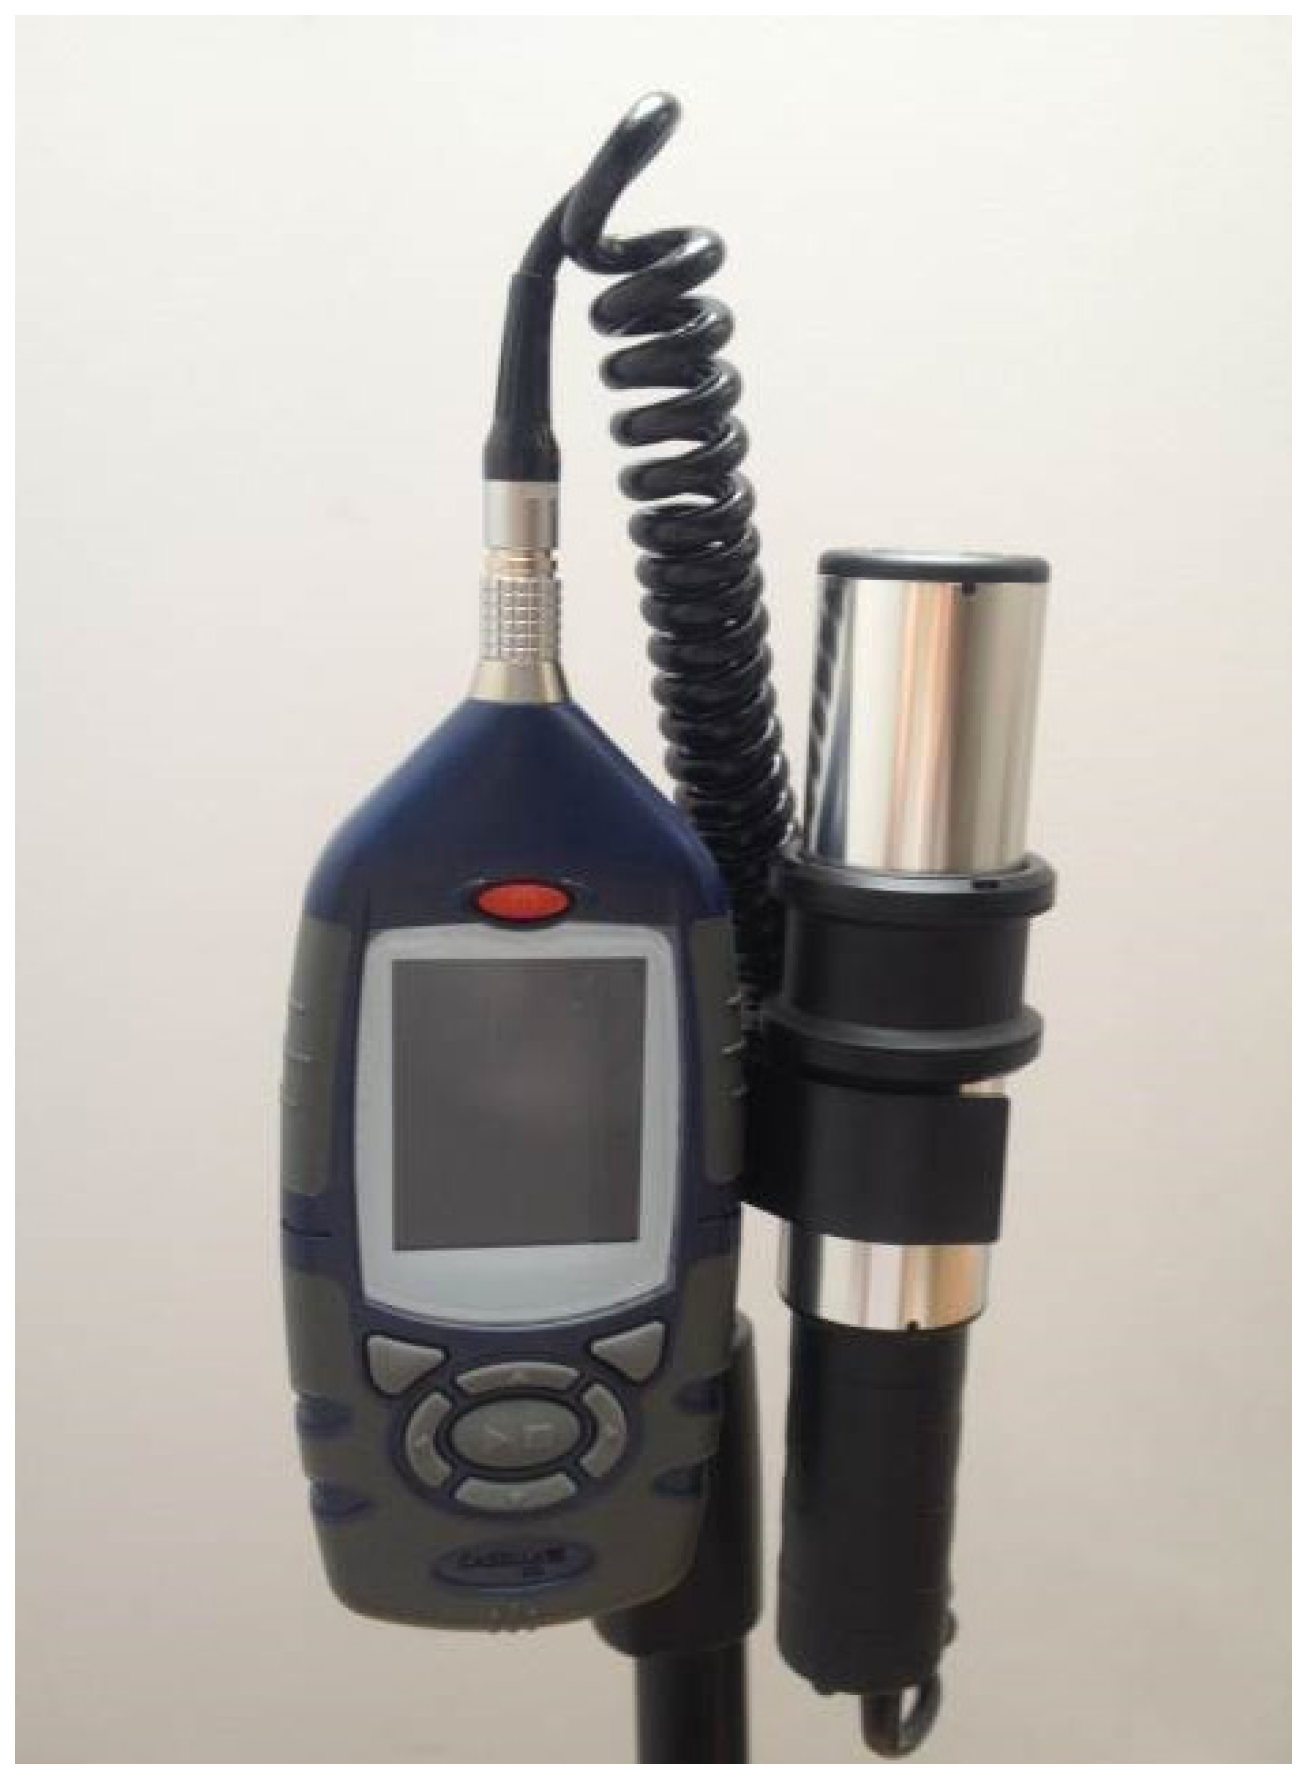
Figure 4.
Frequency curves type A and C.

Figure 5.
Scheme of investigations according to the innovative circuit of regular aggregate production.
Figure 5.
Scheme of investigations according to the innovative circuit of regular aggregate production.

Figure 6.
Scheme of investigations according to typical multi-stage circuit of regular aggregate production.
Figure 6.
Scheme of investigations according to typical multi-stage circuit of regular aggregate production.
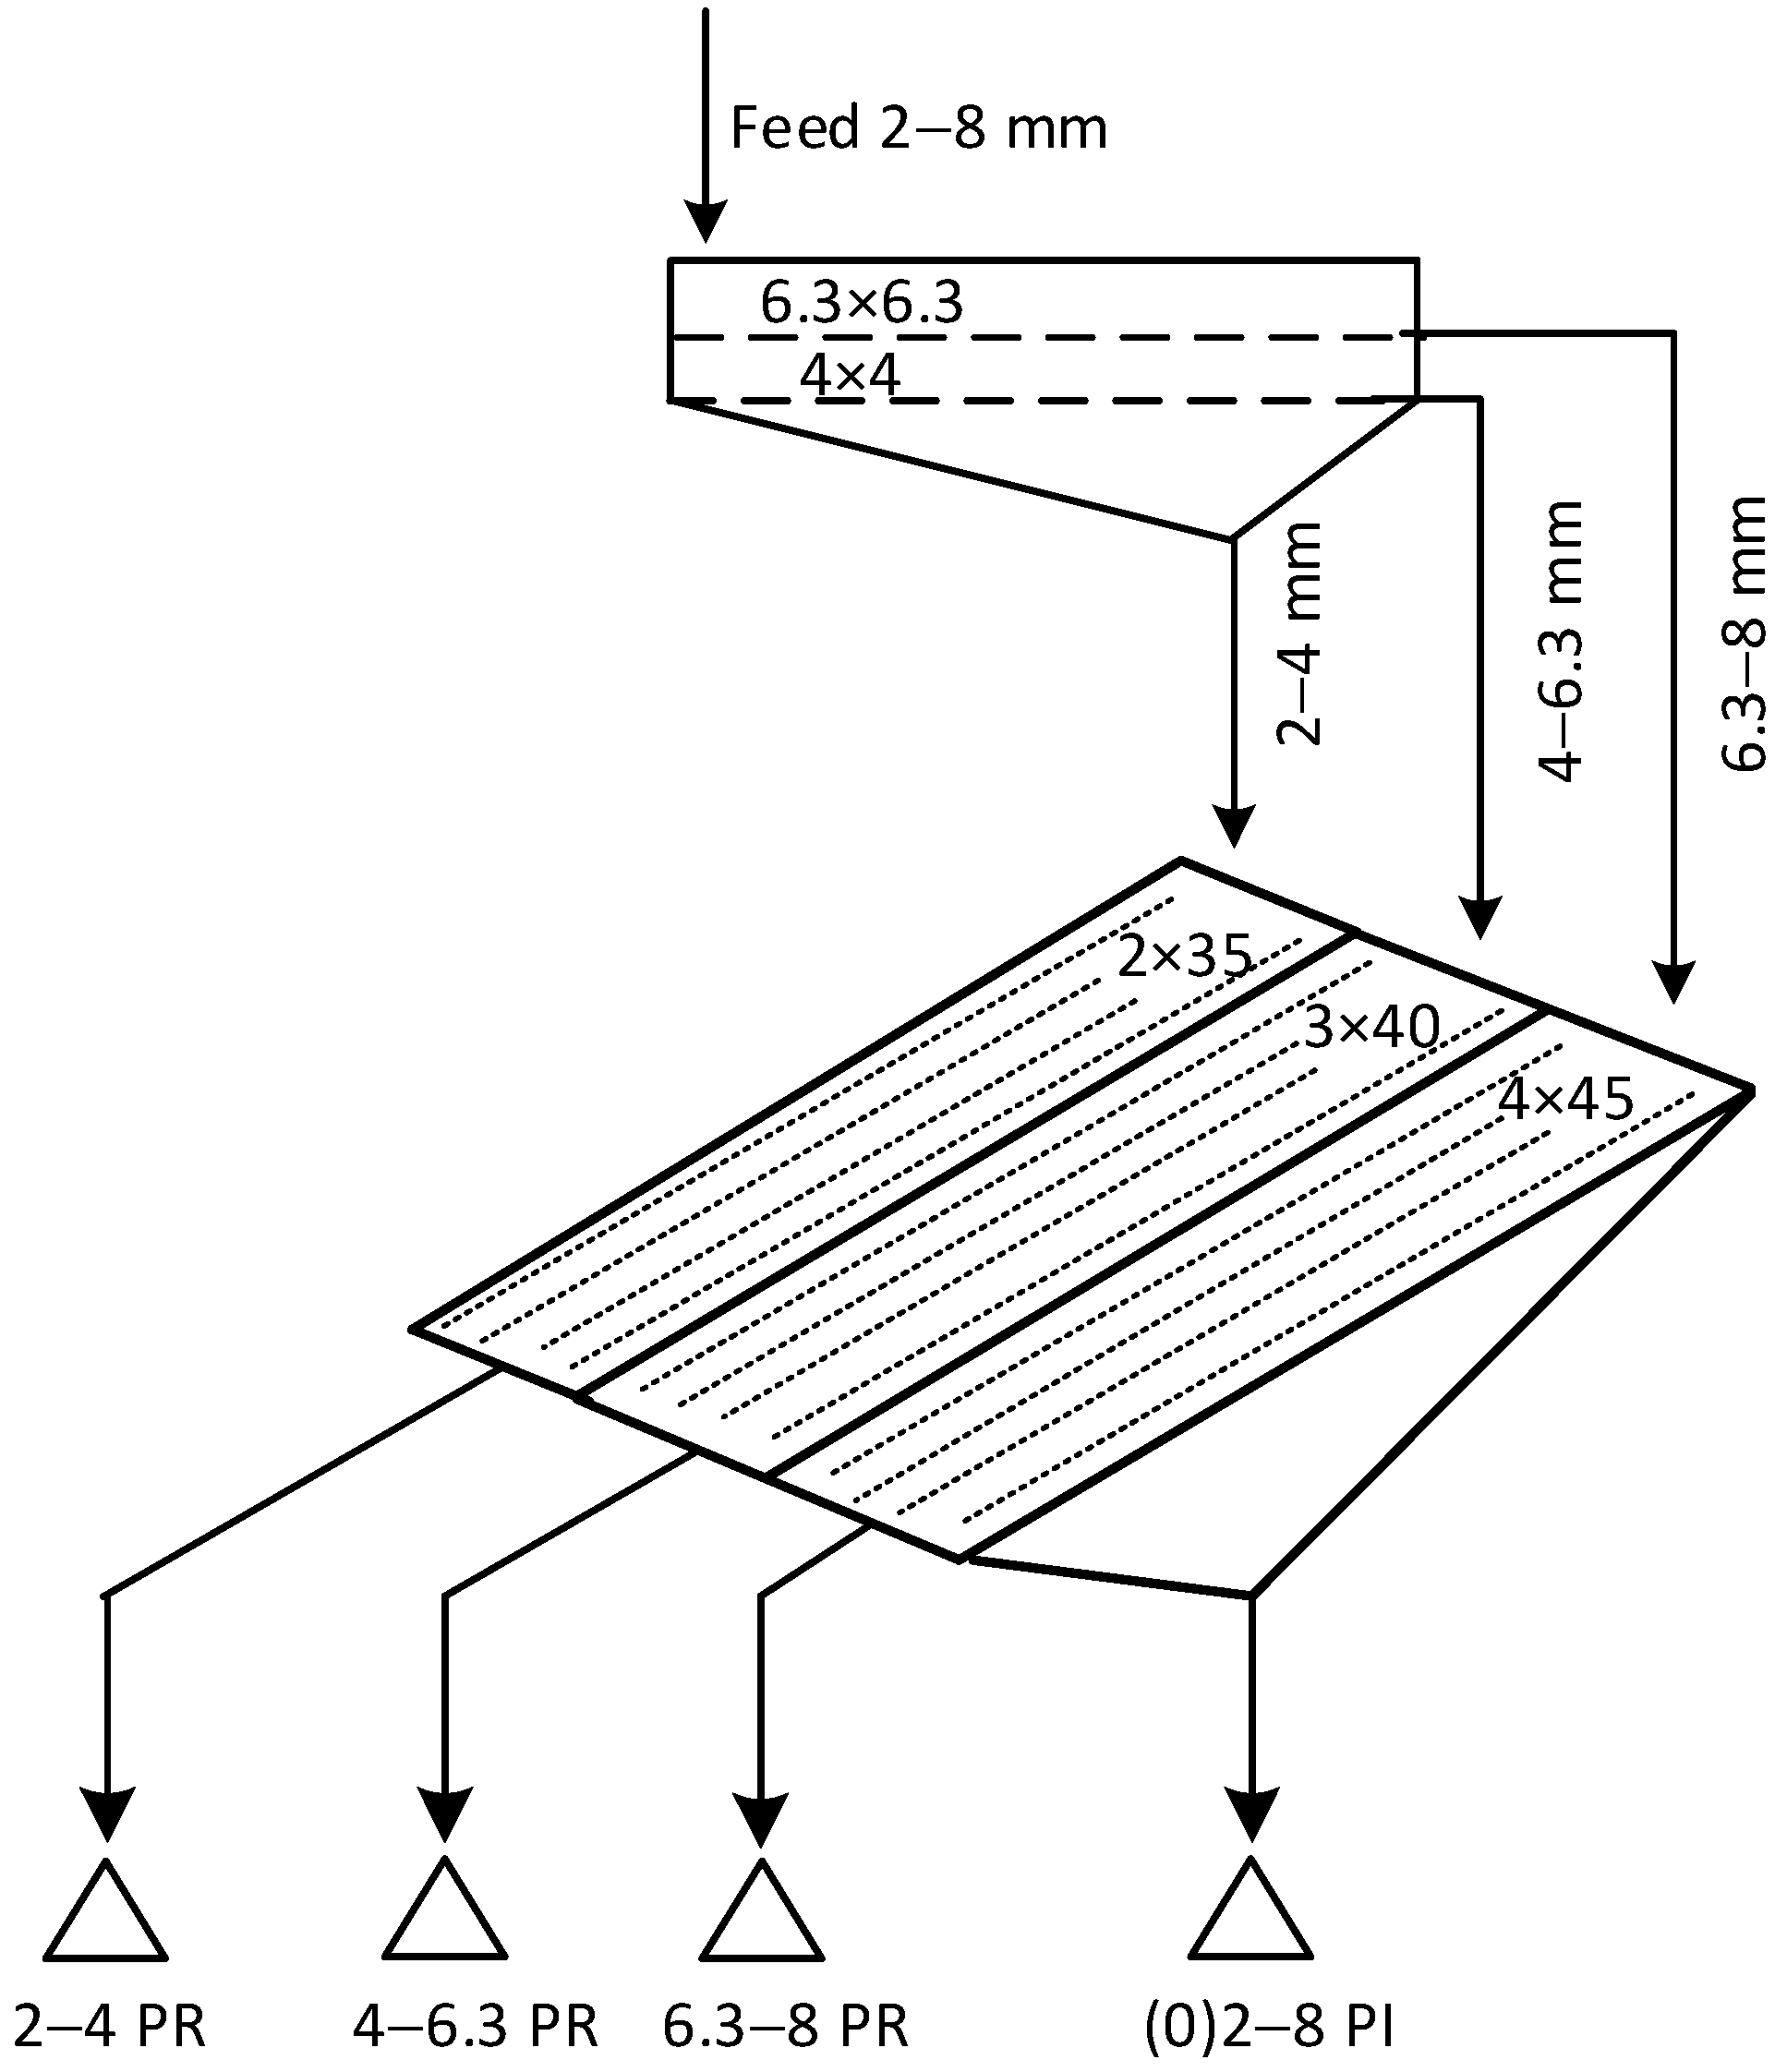
Figure 7.
Background noise emission.
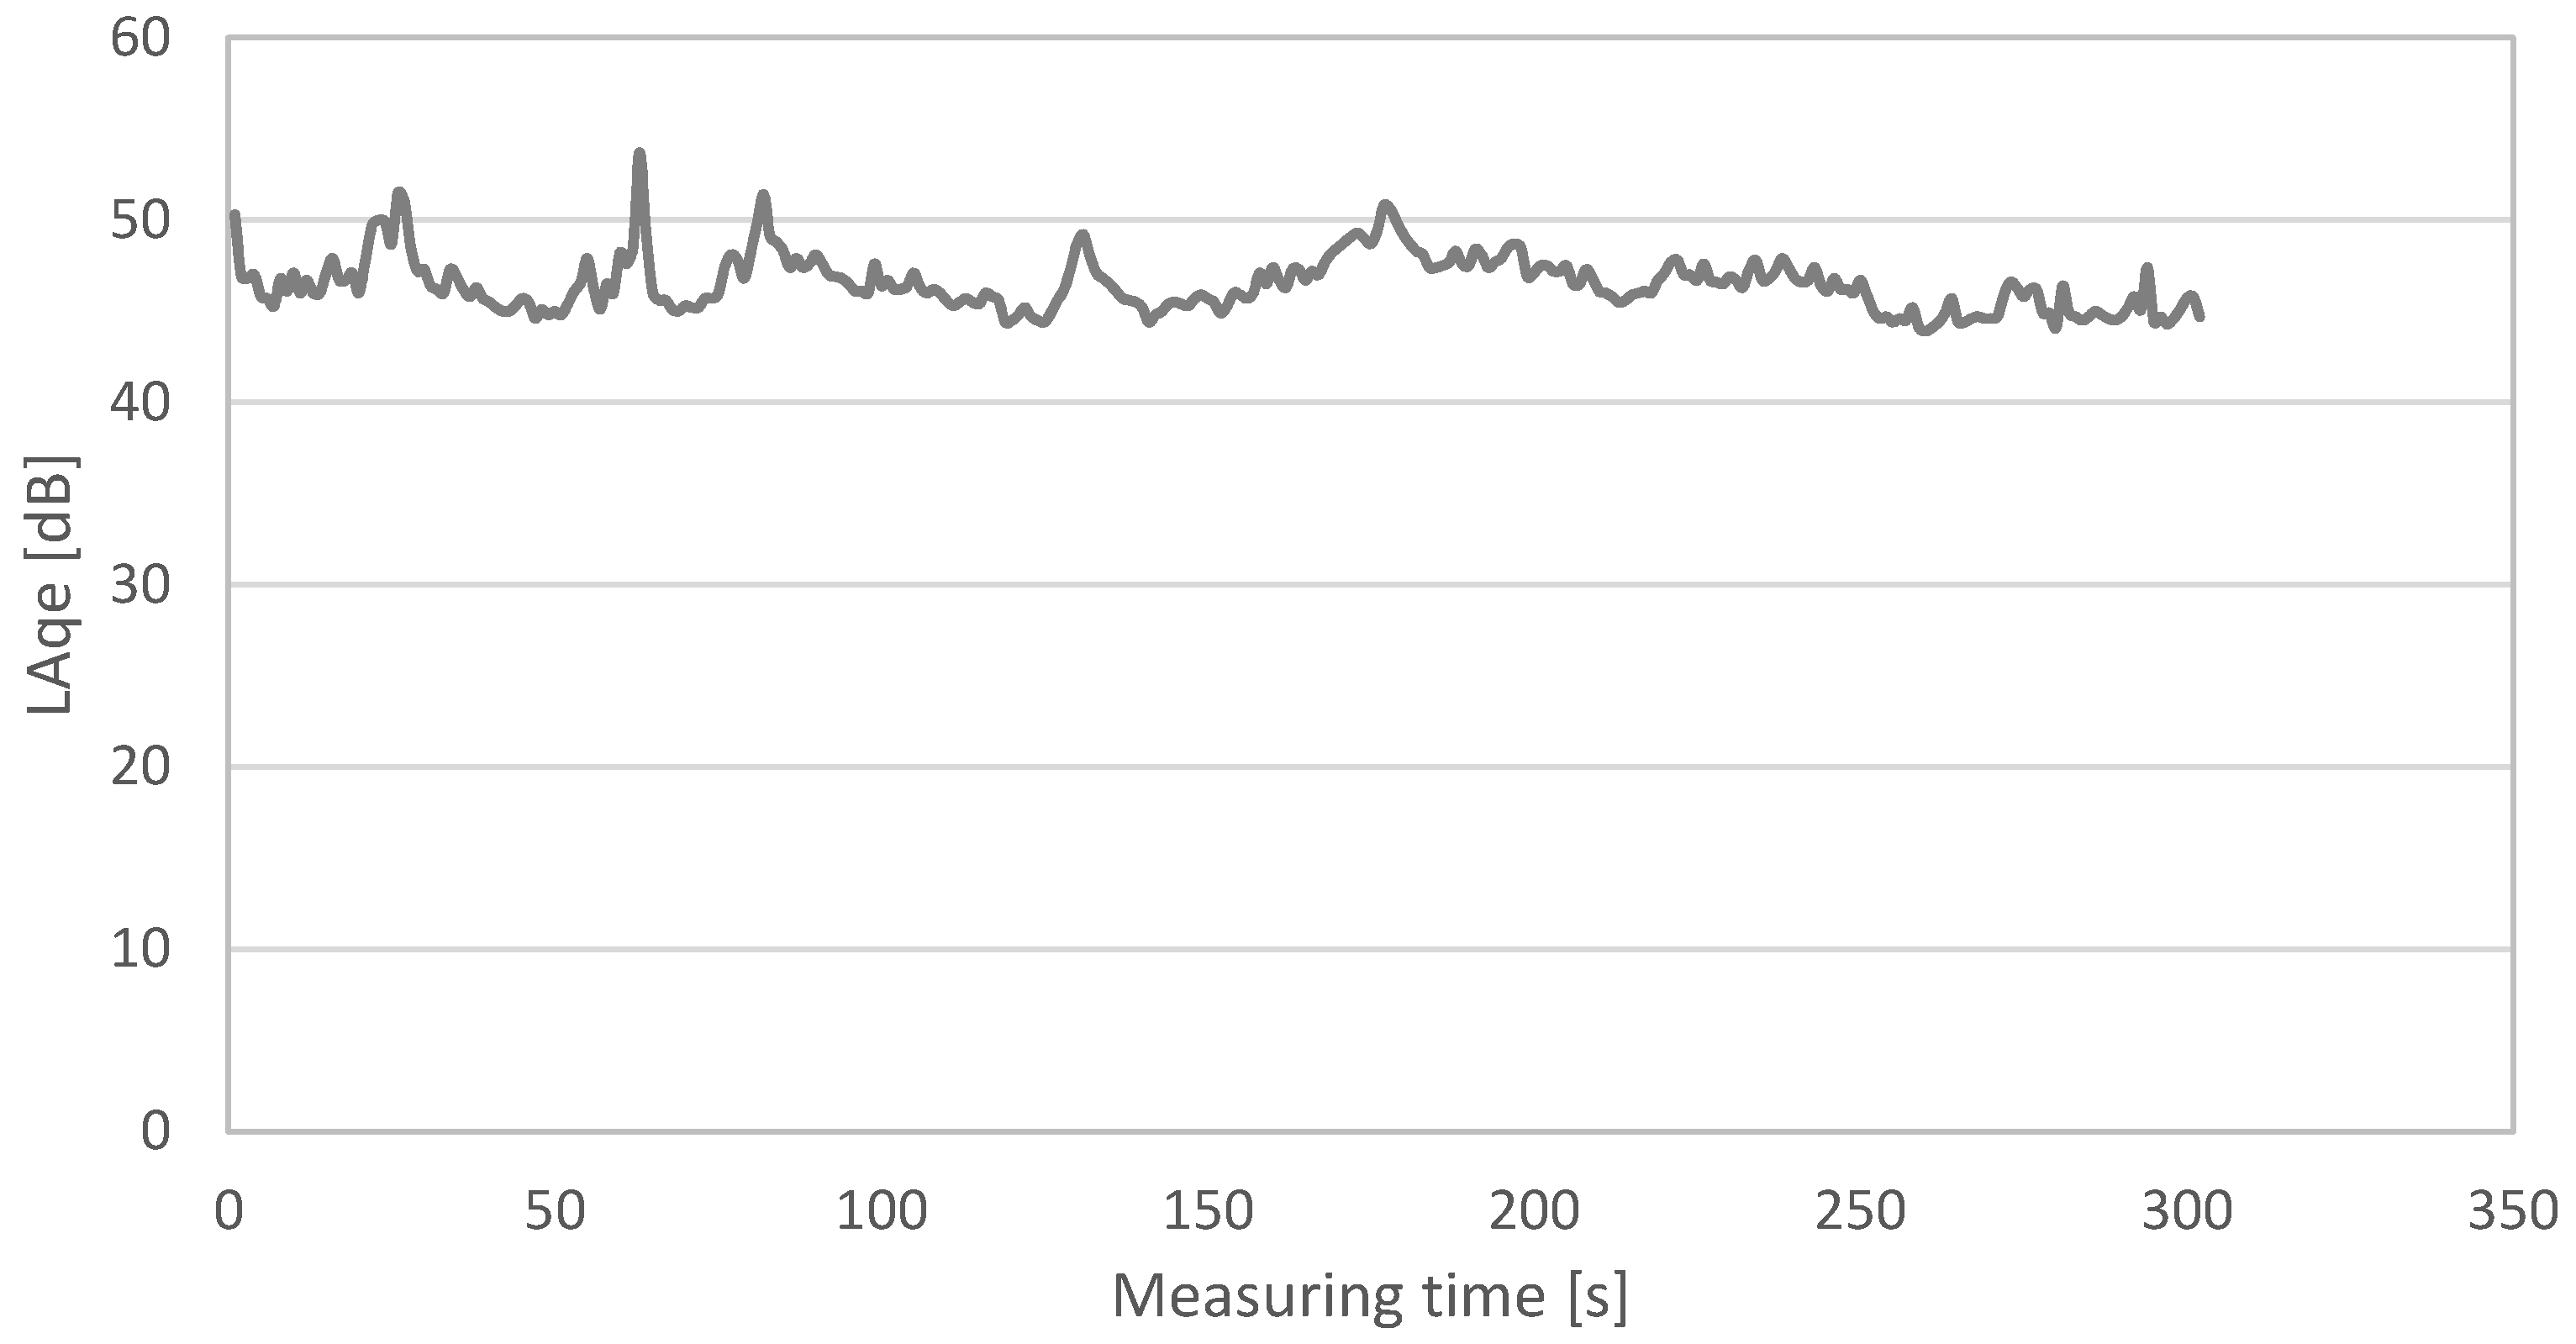
Figure 8.
Histogram of background noise level.
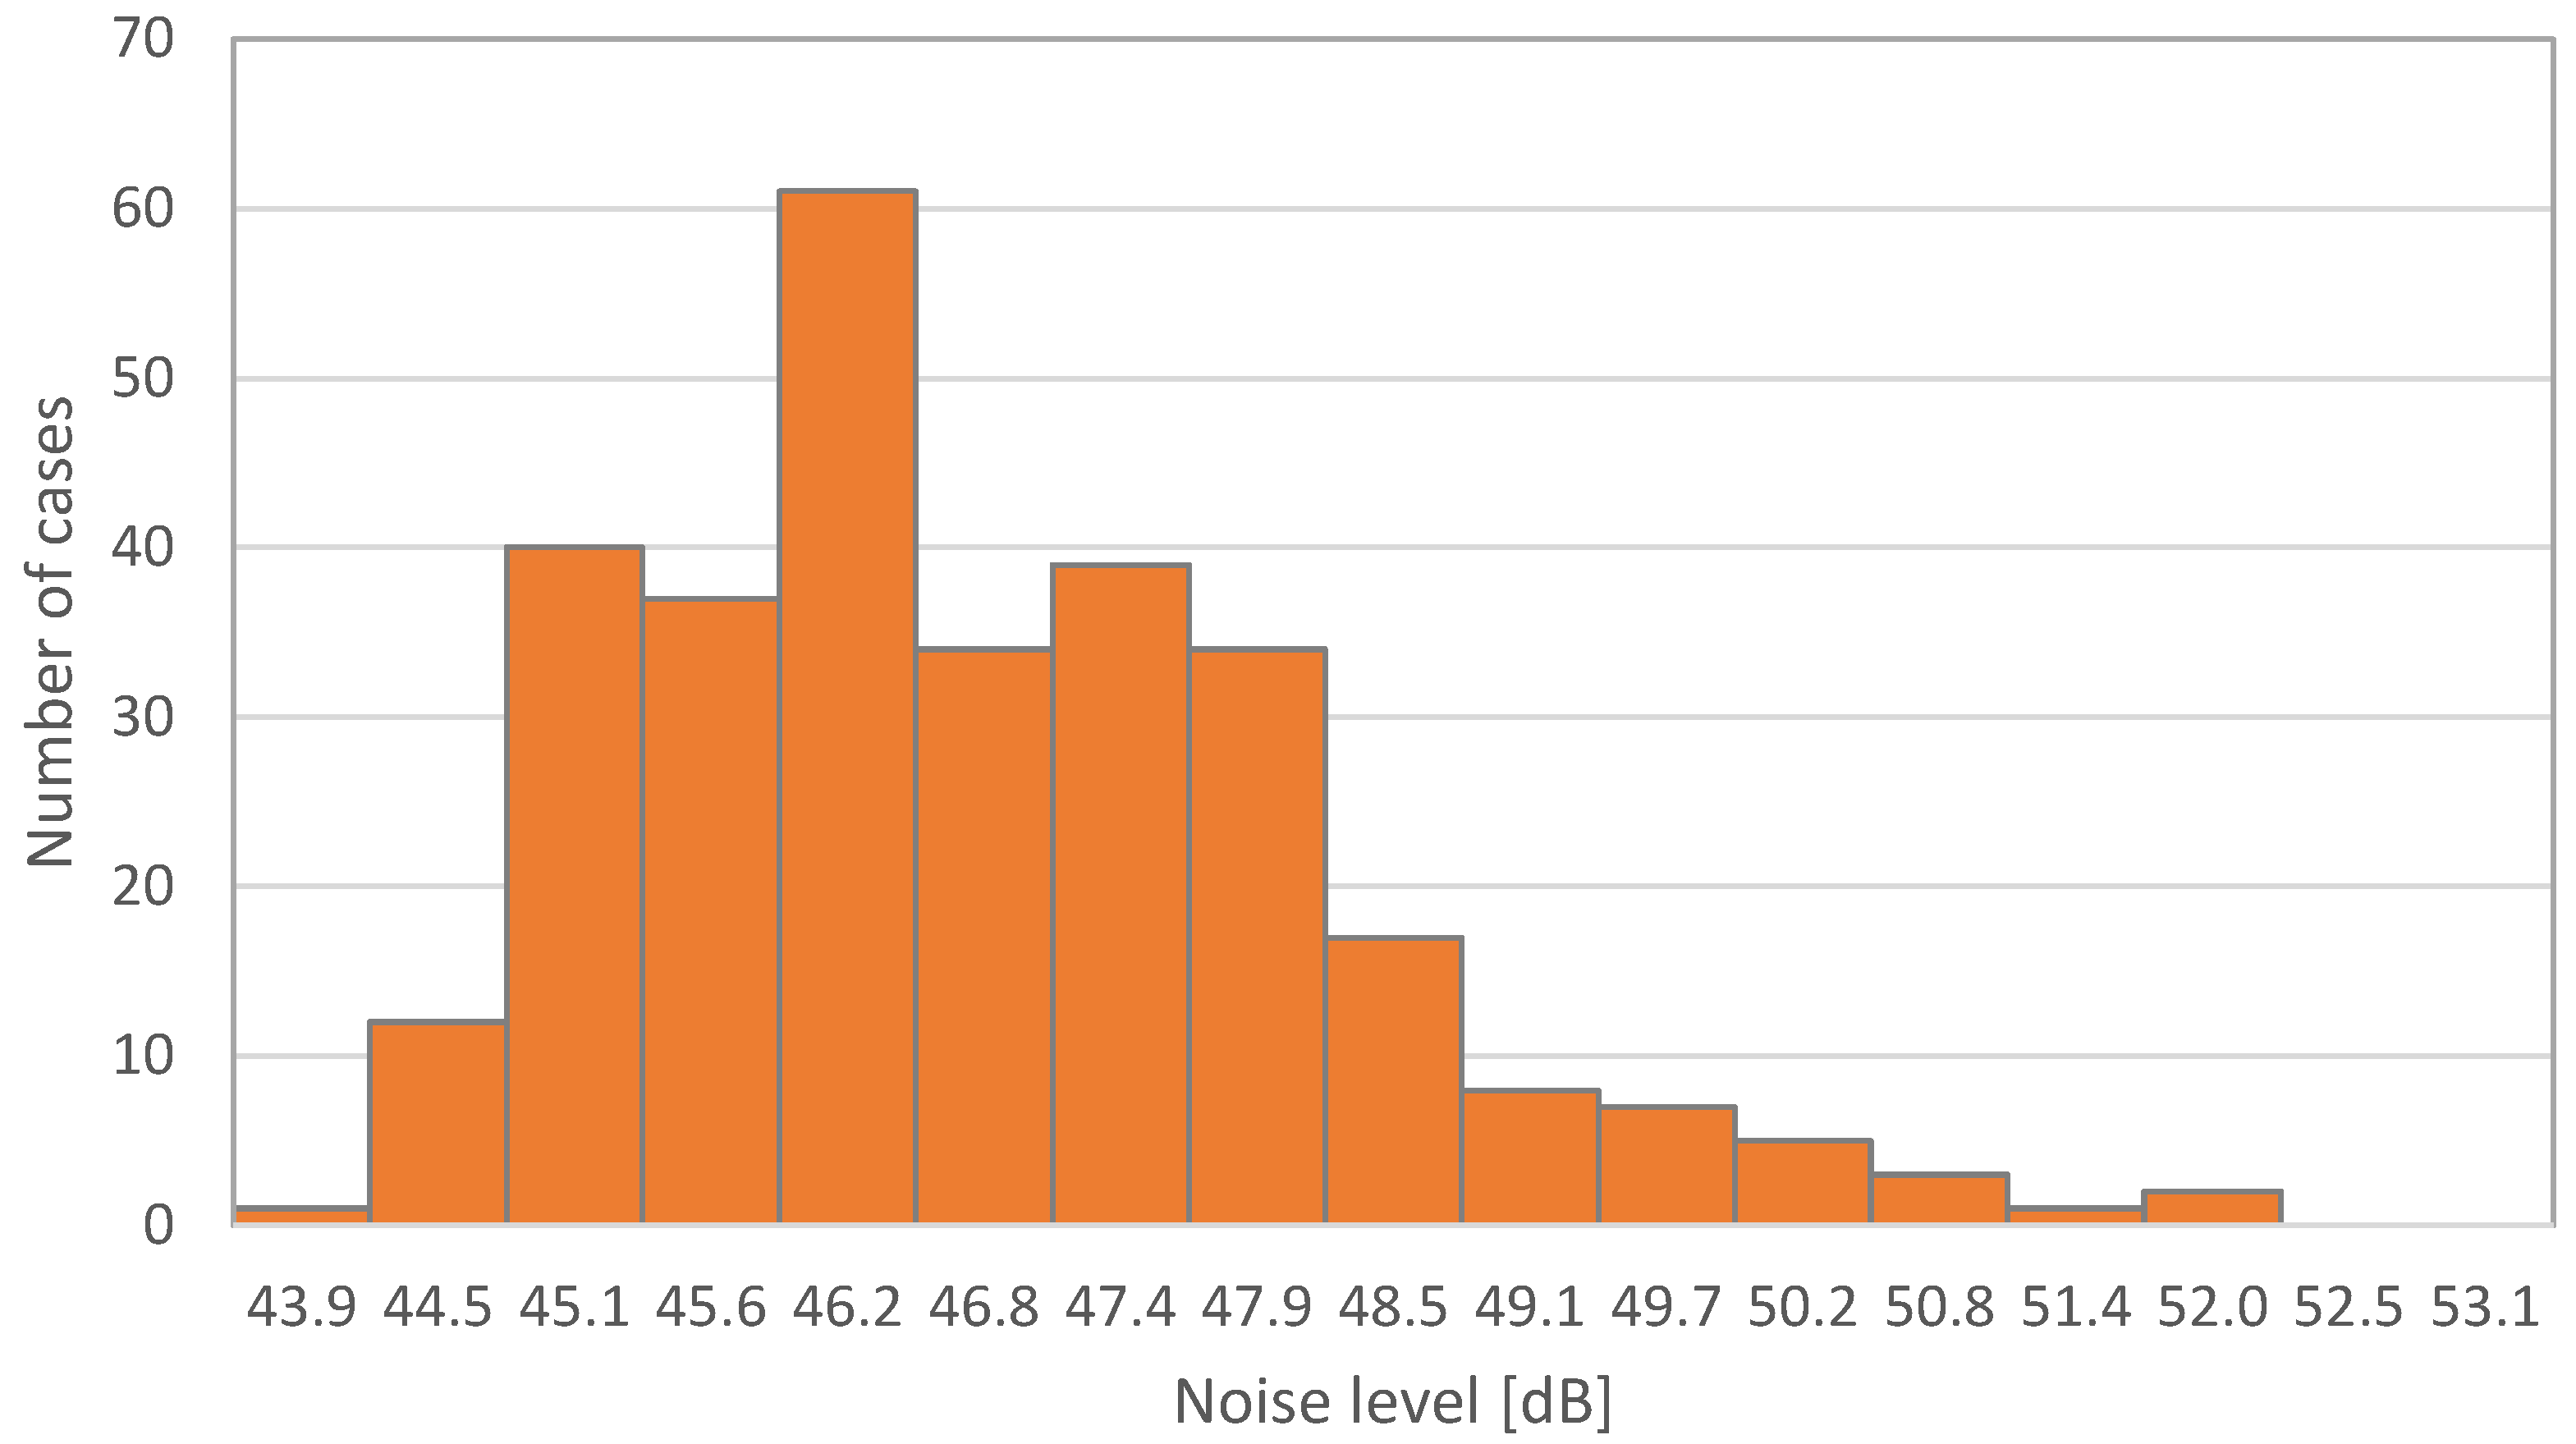
Figure 9.
Details of exemplary measurements for both configurations of circuits.
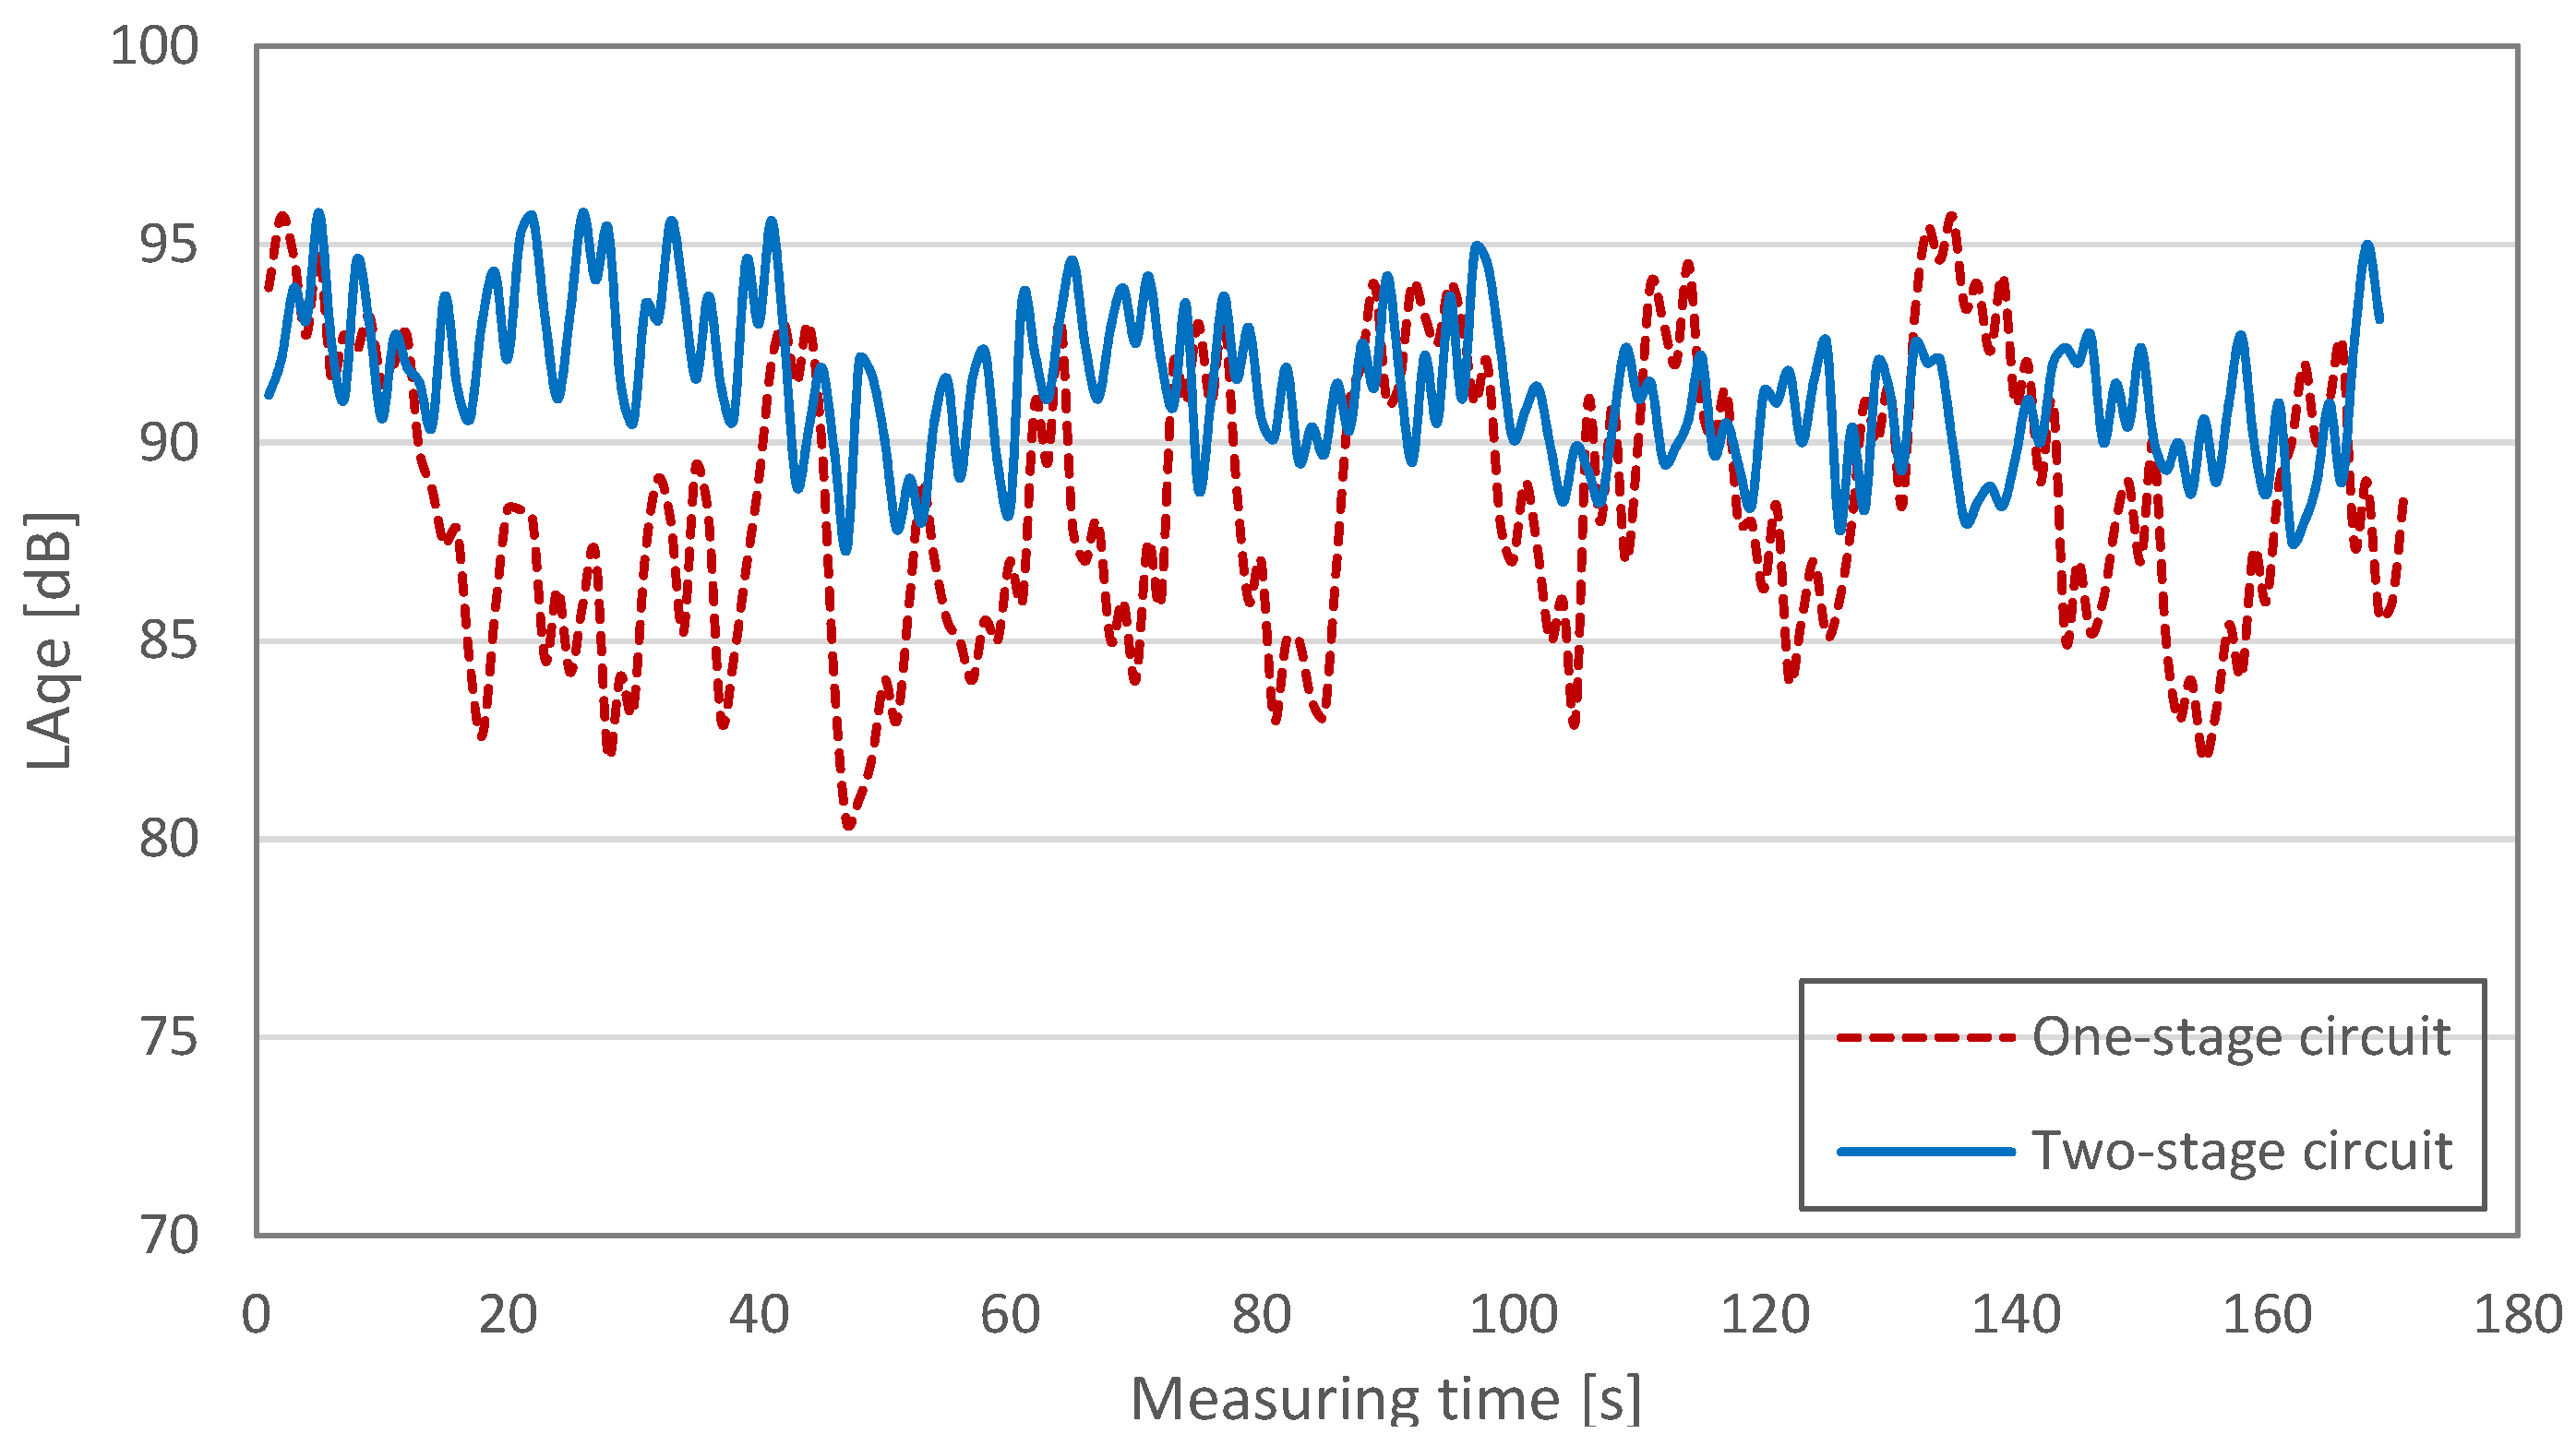
Figure 10.
Measurements of dust emission.


Table 1.
Noise level emissions achieved for the tested circuits of aggregate production.
| Type of Measurement | LAeq [dB] | Extended Uncertainty Range [dB] | ||
|---|---|---|---|---|
| Measurements | Average | St. Dev | ||
| Background (number of single data points: 300) | 46.5 | 1.51 | 0.34 | |
| One-stage circuit (number of single data points: 180) | 88.50 87.18 87.52 88.01 | 87.80 | 0.50 | 1.83 |
| Two-stage circuit (number of single data points: 180) | 91.40 91.47 90.81 91.75 | 91.35 | 0.34 | 1.26 |
Table 2.
Dust pollution achieved for the tested circuits of aggregate production.
| Average Value [mg/m3] | St. Dev. [mg/m3] | Maximum Value [mg/m3] | |
|---|---|---|---|
| Background (1) | 0.16 | 0.10 | 0.42 |
| One-stage circuit | 1.20 | 0.46 | 2.93 |
| Background (2) | 0.21 | 0.10 | 0.92 |
| Two-stage circuit | 3.42 | 1.47 | 8.71 |
Table 3.
Permissible noise level in environment for specific types and sources of noise.
| Type of Area | Traffic Noise [dB] | Noise from Other Sources [dB] | ||
|---|---|---|---|---|
| LAeqD Day | LAeqN Night | LAeqD Day | LAeqN Night | |
| Spas and hospitals, outside the city borders | 50 | 45 | 45 | 40 |
| Single-family housing, schools, nursing homes, hospitals, within the city borders | 61 | 56 | 50 | 40 |
| Multi-family housing, recreational and leisure areas, residential and service areas | 65 | 56 | 55 | 45 |
| City over 100,000 residents | 68 | 60 | 55 | 45 |
Table 4.
Permissible values of selected types of dust in industrial plants.
| Type of Dust | Inhalable Fraction PM10 [mg/m3] | Respirable Fraction PM2.5 [mg/m3] |
|---|---|---|
| Dust particles containing free (crystalline) silica, over 50% | 2 | 0.3 |
| Dust particles containing free (crystalline) silica, between 2 and 50% | 4 | 1 |
| Other non-toxic dust particles—including those containing free (crystalline) silica, below 2% | 10 |
Publisher’s Note: MDPI stays neutral with regard to jurisdictional claims in published maps and institutional affiliations. |
© 2022 by the authors. Licensee MDPI, Basel, Switzerland. This article is an open access article distributed under the terms and conditions of the Creative Commons Attribution (CC BY) license (https://creativecommons.org/licenses/by/4.0/).
Share and Cite
MDPI and ACS Style
Saramak, A.; Gawenda, T.; Saramak, D. Comparative Analysis of Dust and Noise Emission in Aggregate Production Systems. Minerals 2022, 12, 452. https://doi.org/10.3390/min12040452
AMA Style
Saramak A, Gawenda T, Saramak D. Comparative Analysis of Dust and Noise Emission in Aggregate Production Systems. Minerals. 2022; 12(4):452. https://doi.org/10.3390/min12040452
Chicago/Turabian StyleSaramak, Agnieszka, Tomasz Gawenda, and Daniel Saramak. 2022. "Comparative Analysis of Dust and Noise Emission in Aggregate Production Systems" Minerals 12, no. 4: 452. https://doi.org/10.3390/min12040452
Note that from the first issue of 2016, this journal uses article numbers instead of page numbers. See further details here.