
Rock Mass and Pore Fluid Response in Deep Mining: A Field Monitoring Study at Inclined Longwalls

1
Commonwealth Scientific and Industrial Research Organisation (CSIRO), Brisbane, QLD 4069, Australia
2
School of Safety Science and Engineering, Anhui University of Science and Technology, Huainan 232001, China
3
National Research Institute for Coal Mining Engineering and Technology, Huainan Mining Group, Huainan 232000, China
*
Author to whom correspondence should be addressed.
Minerals 2022, 12(4), 463; https://doi.org/10.3390/min12040463
Submission received: 6 March 2022
/
Revised: 27 March 2022
/
Accepted: 5 April 2022
/
Published: 10 April 2022
(This article belongs to the Special Issue Green Mining of Coal Mine in China)
Abstract
:The dynamics of stress, deformation and pore pressure in the surrounding strata of underground mines are of fundamental importance to groundwater and gas emission management. Compared to numerous studies on the overlying strata, there are significantly fewer investigations concerning the underlying strata, particularly involving large-scale field monitoring. This paper presents a comprehensive field monitoring study conducted at two longwall panels with a depth of around 800 m and an inclination angle of 21°. The monitoring program focused on the floor strata within 50 m below the mining operation, but also covered the roof strata close to the longwall roadway. The purpose was to characterise the favourable zone for gas extraction from the floor coal seams. A combination of stressmeters, extensometers and piezometers were deployed and installed underground. The monitored results demonstrated that the stress change exhibited a three-stage variation—increase, decrease and recovery—during which the strata deformed and the pore pressure changed correspondingly. Strata expansion in the floor occurred primarily in the region 0–35 m behind the longwall face and vertically to at least 42 m below. Some predictive methods of the depth of the failure zone used in shallow mines were analysed to determine if they were still applicable for mining at a depth of around 800 m.
1. Introduction
Underground longwall mining induces deformation and breakage in the surrounding strata and the potential discharge of pore fluids (e.g., groundwater and methane gas) trapped in the pores and fractures of the strata. Several environmental and operational issues are directly related to these mining disturbances, including water inflow and inrush, excessive methane emissions and gas outbursts. Some of these issues can lead to fatal accidents, causing significant consequences. A clear understanding of the dynamic responses of strata and pore fluids is of fundamental importance to effective engineering designs that improve the environmental and safety performances of mining.
The general patterns of mining-induced stress distribution and strata deformation and fractures have been well appreciated and described in the literature. As mining advances, the stress is redistributed to the solid coal ahead and along the sides of the mining panel (the so-called front and side abutments). The front abutment stress increases from the faceline, attains a peak value at a certain distance into the solid strata and gradually reduces to the in-situ value at a distance as far as 300 m [1,2,3,4]. In the goaf region, stresses are initially reduced in the disturbed strata, then gradually recover as the overburden strata subside and eventually stabilise at a certain distance into the goaf [1,5]. In terms of fracture characteristics, overburden strata are generally divided into various zones, for example, the caved zone, the fractured zone and the continuous deformation zone [1,2]. As mining and geological conditions vary from site to site, strata behaviours remain a research focus. Several research methods have been used in this study area, including field-scale extensometer monitoring [6], microseismic monitoring [7], numerical modelling [4,8], experimental simulations [9] and analytical analysis [10].
The response of pore fluids to mining has also been extensively investigated for mine water management [11,12,13,14] and methane emission control [4,15,16,17,18,19,20]. Booth [11], through monitoring water levels in boreholes, pointed out that water levels in upper aquifers above the constrained zone decline due to fracture dilation, and drawdown expands outward a few hundred meters. Guo et al. [4] conducted a comprehensive field monitoring of pore pressure change on different levels at a longwall panel; they found that the pore pressure started to increase at 300 m ahead of the face, began to decrease about 70 m ahead and stabilised at approximately 120 m behind the longwall face. Zhang et al. [13] investigated engineering approaches to protect underground aquifers by optimising mining parameters, such as mining height and advance rate, and found that the soft aquiclude below aquifers was the key to controlling the extension of connective fracturing. Regarding methane emissions from the adjacent seams and gas-bearing strata, the fractured zone in the overburden is often termed the “gas emission zone” [15,16]. Qu et al. [18] found that the breakage of key strata in the overburden led to a stepwise increase in gas emission as the longwall advanced in the initial mining stage. Qu et al. [19] further established a “three-zone” concept with respect to gas desorption and migration patterns and strata fracturing characteristics. Palchik [20] investigated the location of mining-induced fractures by measuring gas emissions from different levels in the overburden strata. Based on correlations between strata fracturing and gas migration patterns, Yuan [21,22] developed an innovative engineering system for the integrated extraction of coal and methane, which has been adopted in many low-permeability coal mines in China.
However, most existing studies on rock mass and pore fluid responses are based on longwall mining in horizontal or nearly horizontal coal seams (dipping angle less than 8°). In comparison, there are substantially fewer studies about longwall mining in inclined coal seams (dipping angle greater than 8°), which can be further classified into gently inclined coal seams (8–25°), moderately inclined coal seams (25–45°) and steeply inclined coal seams (>45°) in China. Some studies [23,24,25,26,27,28] have suggested that the seam dipping angle has a remarkable impact on strata behaviour. Zhang and Shen [23], in their study based on borehole hydraulic tests, pointed out that the seam dipping angle had a considerable influence on the shape and size of the fractured zone. Using microseismic monitoring, Sun et al. [24] found that mining-induced fractures in the lower side of the longwall extended further into the roof than in the upper side. Wei et al. [25] investigated the evolution of the mining-induced fracture network in the overburden strata of an inclined coal seam through experimental simulations and proposed a relationship between the fractal dimension and the pressure in the overburden strata. To improve the understanding of rock mass response in inclined longwalls, field-scale investigations of the coupled response of the strata and pore fluids are still much needed.
This paper presents the results of a comprehensive field monitoring study on the behaviour of floor strata at a deep coal mine in China. The mine extracts coal from multiple coal seams between 700 and 900 m. The coal seams are gassy and have outburst risks.
2. Mine Conditions and the Monitoring Program
The studied mine is located in Anhui Province, China. Its designed production capacity is 3.0 Mt per annum. Key geological features present at the mine include relatively thin alluvium layers (30 m), deep mining operations (700–900 m), dipping seams (about 21°), low permeability (approximately 0.001 mD) and high gas content (6.2–11 m3/t). The maximum and minimum horizontal stresses are about 0.97 and 0.83 times the vertical stress, respectively. Figure 1 shows a typical stratigraphy of the mine.
Field monitoring was set up at two longwall panels: LW 5121(5) and LW 5111(0). LW 5121(5) extracted the C15 seam with an overburden depth of 725–808 m. The seam dipped between 20 and 22°. The panel was 240 m wide in the monitoring domain and used a “Y” ventilation system. The coal seam was 1.0 m thick on average; however, the extraction thickness was set at 1.5 m in order to adequately destress the C13 seam below the working seam. The immediate roof was sandy mudstone with a thickness varying between 2.9 m and 4.2 m, and the main roof was siltstone with an average thickness of 2.5 m. The immediate floor was interbedded with mudstone and fine sandstone layers. The other longwall panel studied, LW 5111(0), had similar mining conditions to LW 5121(5), except that it extracted coal from the B10 seam. The length of the longwall face was 139 m, and the extraction thickness was 1.5 m.
Figure 2 shows the designed monitoring plan at LW5121(5) and LW5111(0), which were chosen to capture strata stress change, displacement and pore pressure in different regions of the longwall panels. All instrument boreholes were designed to be drilled from underground roadways. However, due to the challenging situations associated with drilling in underground roadways, some of the designed instrument boreholes failed to be drilled or were of inadequate quality for installation. Eventually, 24 boreholes at LW 5121(5) and 16 boreholes at LW 5111(0) were drilled and instrumented. Table 1 provides a summary of the instruments installed in each of the monitoring roadways.
The vibrating wire soft inclusion stress cell (model 4360-1-1), manufactured by GEOKON (Lebanon, NH, USA) was employed for monitoring stress change. The stress cell utilises a vibrating wire strain gauge to measure the deformation of a steel ring. Changing rock stresses impose changing loads on the steel ring, causing a change in the frequency of vibration of the vibrating wire. With a high preload, the soft inclusion stressmeter can measure both tensile and compression stress changes.
GEOKON vibrating wire piezometers (model 4500SH) were selected to measure the pore pressure in the rock strata. The instrument utilises a sensitive stainless steel diaphragm to which a vibrating wire element is connected. Fluid pressure acting upon the diaphragm causes the deflection of the diaphragm and changes in the tension and frequency of the vibrating wire. The changes in frequency are sensed and transmitted to the monitoring data logger. The square of the vibrating frequency is directly proportional to the pore pressure. The piezometer boreholes were fully sealed with cement-benitoite grout after the piezometers were placed in their designated locations.
For displacement monitoring, five-channel extensometers (manufactured by GEL in Brisbane, Australia) with a measurement range of 95 mm were used. In operation, torsion spring type anchors were swaged to flexible stainless steel anchor wire and installed into designed depths of boreholes.
The instruments installed at each longwall panel were connected to a data logger placed in a safe and suitable place underground. All the monitoring data were continuously recorded every 20–30 min.
3. Monitoring Results
3.1. 5121(5) Roadway Roof
Figure 3 shows the actual positions of the instruments and the relevant monitoring results. The stressmeters were positioned to monitor stress changes in the longitudinal and transverse directions of the roadway (Figure 3a).
It should be noted that the calibration of the GEOKON stressmeters depends upon several factors, including the modulus of the host rock, pre-stress, orientation with respect to the direction of the principal stress and the platen contact area. Thus, the accuracy of the readings is indeterminate, and the indicated stress magnitude is only approximate. For this reason, the monitored data were analysed with a focus on the trend of the change rather than the magnitude.
Figure 3b,c shows the stress change as monitored by the various stressmeters. The stress started to change at least 300 m ahead of the longwall face. The lateral stress in the longitudinal direction decreased as the longwall advanced, suggesting that the roadway roof was relaxing in this direction. In contrast, the stress in the transverse direction increased as the longwall advanced and peaked at about 50 m ahead of the longwall face. From that distance on, the stress began to decrease.
The extensometers installed in the roadway recorded very messy data due to significant disturbance by roadway operations, including reinforcement in the front abutment zone. Figure 3d displays a group of reasonable results, which show that the roof strata started to deform at about 210 m ahead of the longwall face. The deformation rate increased at about 100 m ahead of the face and reached the maximum measuring range (95 mm) of the extensometers at about 70–80 m ahead of the face. Bed separations between different anchors, as reflected by the difference of the displacement curves, occurred in the 1–2 m interval and the 2–4 m interval along the length of the borehole.
3.2. 5121(5) Roof Strata in the Side Abutment Zone
Figure 4a shows the stressmeters and piezometers installed in the boreholes drilled from the rock roadway above the mining seam, approximately 31 m outside the longwall panel. Figure 4b,c show the monitored results. According to the relative location of these instruments to the longwall panel, the monitored data reflect the strata behaviour in the side abutment region.
The stressmeter was located 15 m (horizontal distance) outside the longwall panel and 11 m (perpendicular distance) above the working seam. According to the orientation of the stressmeter, the monitored data primarily reflect stress changes in the direction perpendicular to the seam dipping. Figure 4b shows that the stress kept increasing when the monitored site was between 150 and 60 m ahead of the face. The stress decreased slightly after it peaked and then stabilised, indicating the strata might have yielded under the abutment stress.
Three piezometers, marked as RP1, RP2 and RP3, were placed at depths of 13 m, 23 m and 33 m along the borehole, respectively. Their perpendicular distances above the working seam were 18 m, 25 m and 32 m, respectively. Of them, RP2 and RP3 monitored the reasonable change of the pore pressure in the roof strata (Figure 4c). The pore pressure increased as the longwall face advanced, peaked at about 95 m ahead of the face and then decreased until the longwall face passed the instrument hole by about 70 m. After that, the pore pressure appeared to stabilise (RP3) or recover slightly before stabilising (RP2).
RP1 recorded a significantly different pore pressure change than that of the other two piezometers. The data show that the pore pressure dropped to a negative value shortly after the piezometer was installed. Mikkelsen and Green [29] suggested that a vibrating wire piezometer fully grouted within cement-bentonite grout can be expected to measure negative pore water pressure or suction. In this regard, the recorded negative pore pressure suggests that water had become unsaturated in the pore spaces around RP1. The reason for this is likely due to the newly created cracks in this area that may have enhanced the drawdown effect of the goaf.
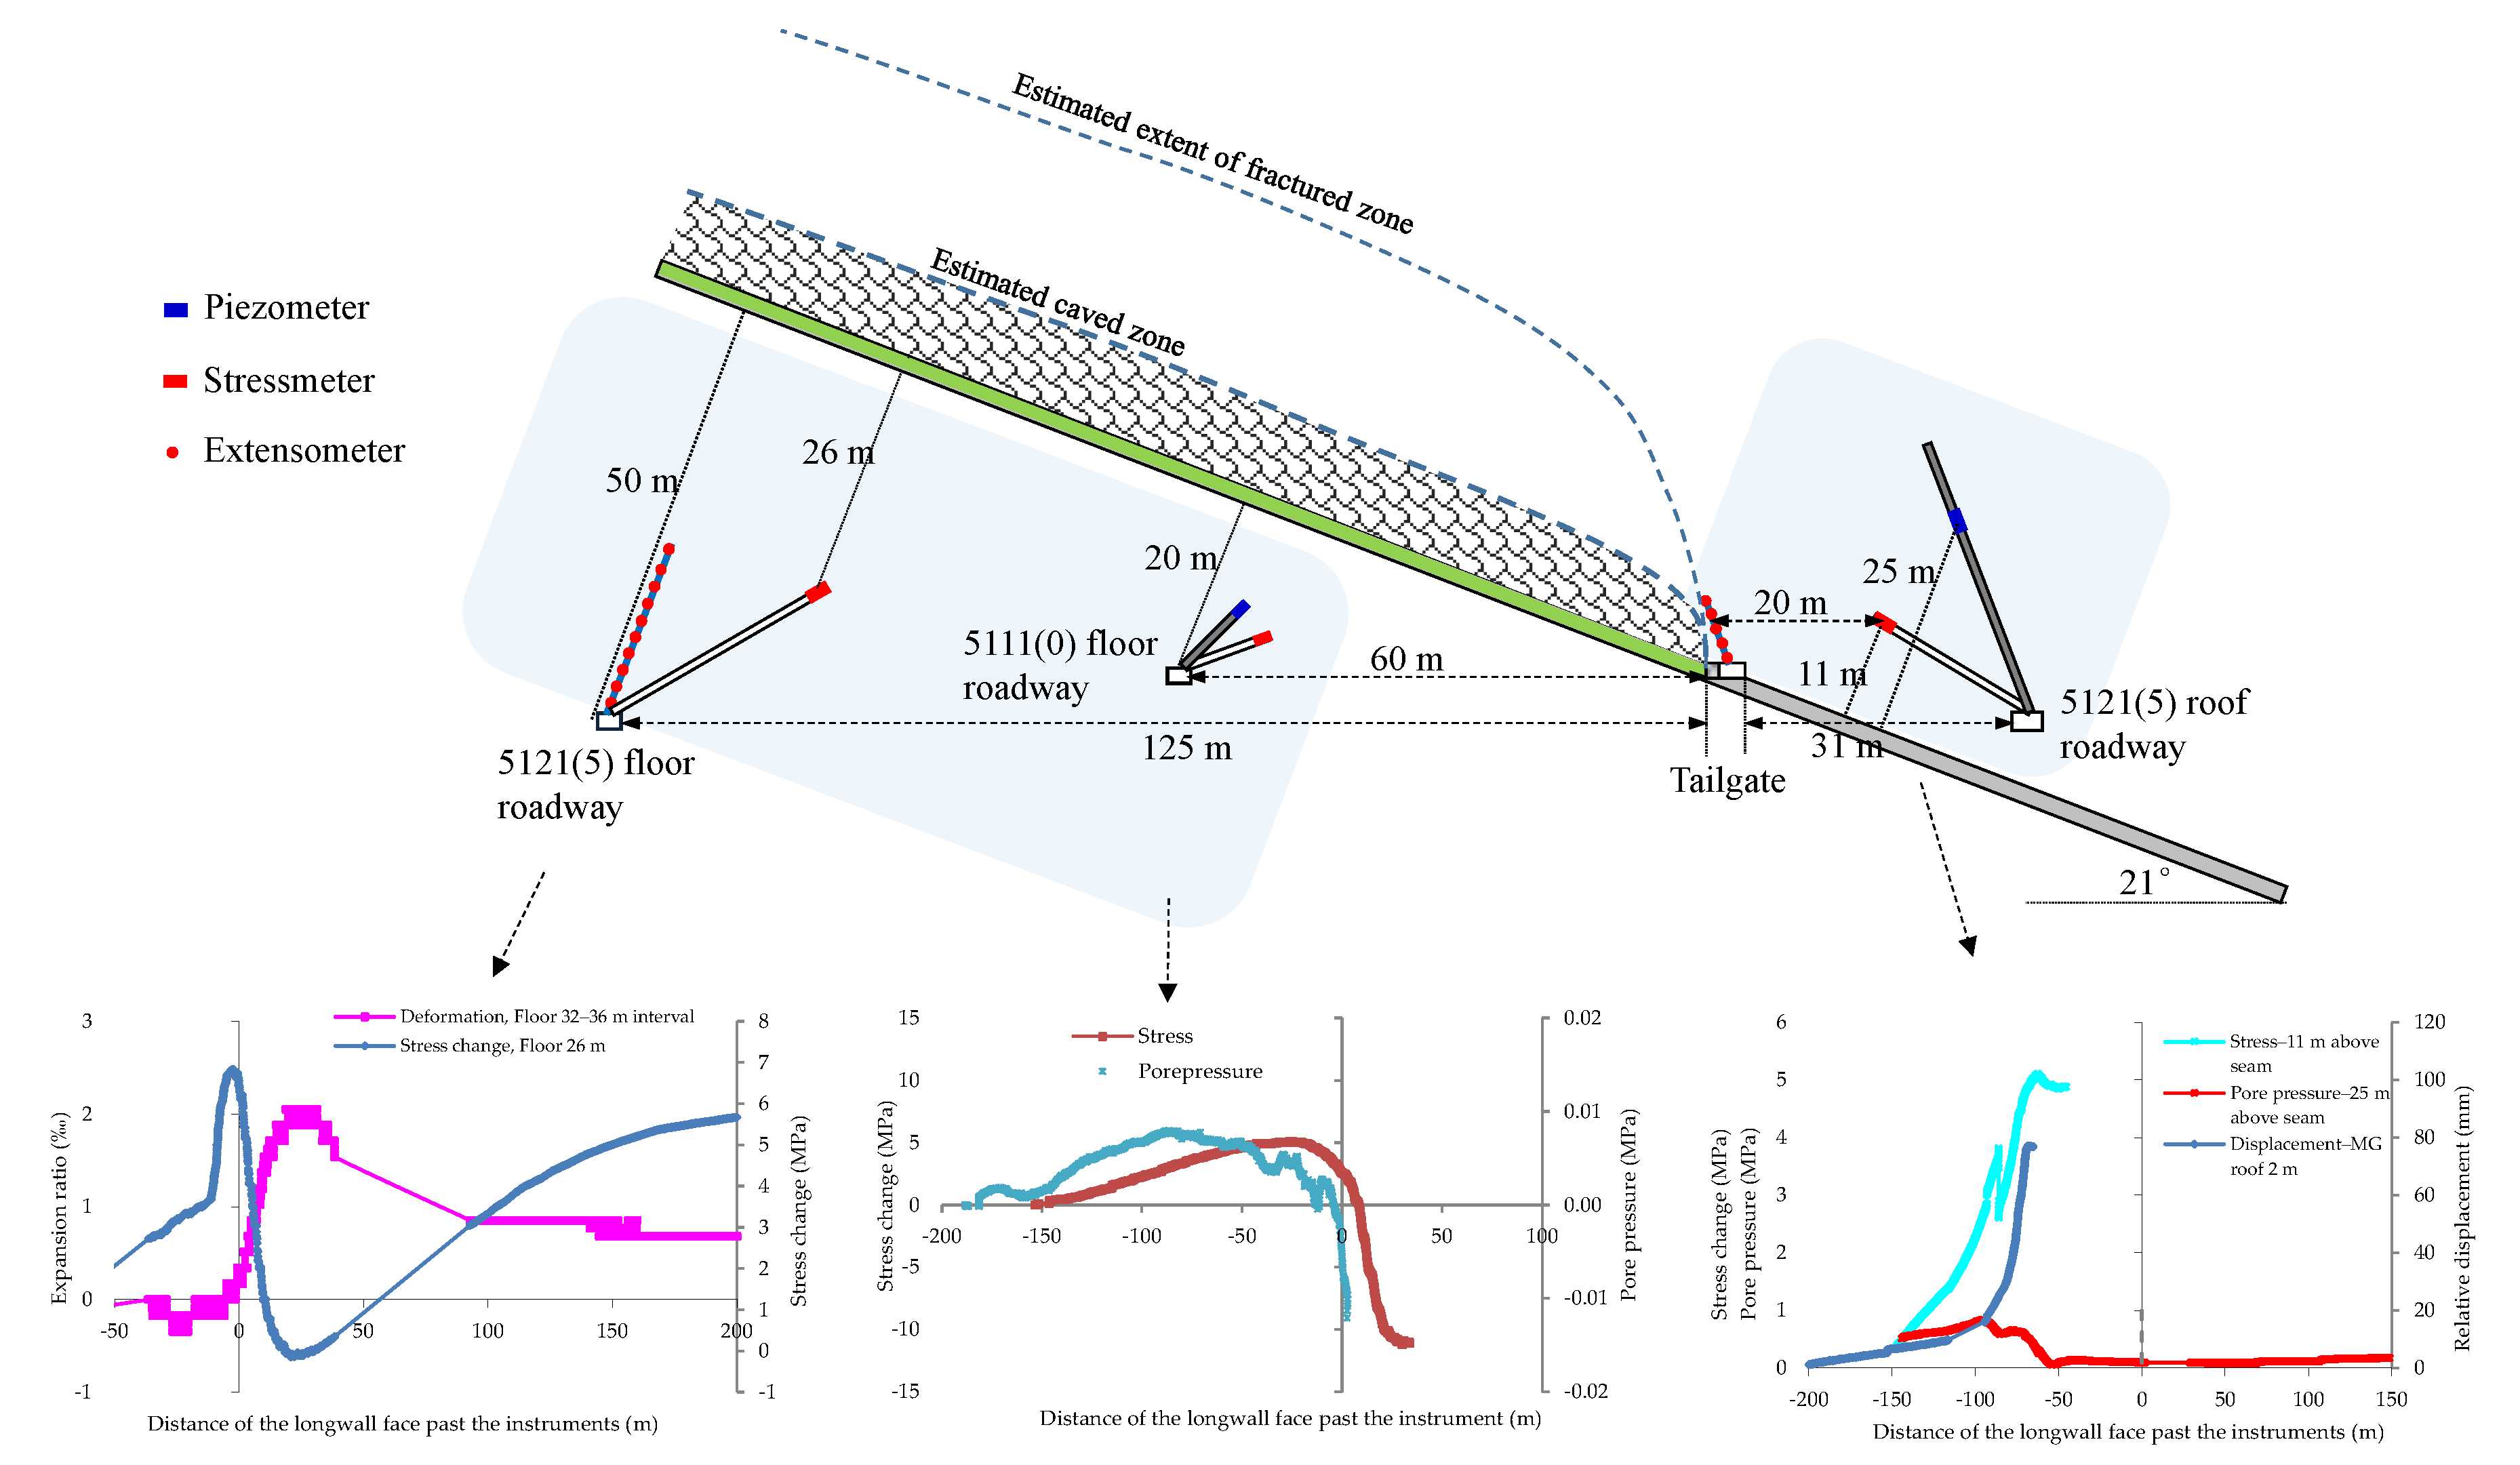
3.3. 5121(5) Floor Strata
Three stressmeters and two extensometers were installed in the roadway below the working seam, as shown in Figure 5a. The perpendicular distance between the stressmeters and the working seam were 23 m, 26 m and 29 m, respectively. The 10 extensometer anchors were evenly distributed in two boreholes, and their perpendicular distances from the working seam ranged between 28 and 49 m.
The stressmeter FS2, which monitored the stress change in the direction 30° from the vertical, captured a relatively complete process of stress change. As the longwall advanced, the strata stress started to increase at about 150 m ahead of the face, peaked near the faceline and then decreased for about 25 m of longwall advance before its recovery. The recovery slowed down at about 170 m behind the longwall face, indicating the longwall goaf was almost consolidated. The stressmeter FS3, installed into the C13 seam, captured only a minor change in stress (Figure 5b). However, this minor change could be a result of the soft nature of the coal seam.
The monitoring of strata displacement by extensometers (Figure 5c,d) was relatively successful at this monitoring site. The data show that the floor strata started to deform at about 80 m ahead of the longwall face. The deformation rate increased at the faceline and stabilised at about 30 m behind the longwall face. The deformation process appeared to correlate with the stress change recorded by stressmeter FS2.
Relative displacements between different anchors occurred both ahead of and behind the longwall face. The displacement ahead of the longwall face was recorded by anchors closer to the roadway (Figure 5c), and was therefore related to the roadway deformation due to abutment stress. The relative displacement between the deep anchors (Figure 5d) occurred only behind the longwall face; thus, it was the expansion of the floor strata that resulted from stress relief. The results also indicated that the expansion zone in the floor strata could extend to 42 m (the perpendicular distance between the #1–5 m anchor and the working seam).
A few piezometers were also installed in the floor roadway. However, no reasonable pore pressure was monitored. We concluded that the reason for this could be that the nearby gas drainage boreholes drilled from the roadway into the C13 seam had de-saturated the interburden.
3.4. 5111(0) Floor Strata
Figure 6 shows the stressmeter FS1 and the four piezometers installed in the rock roadway underneath the LW 5111(0) panel along with the recorded results. According to the orientation of the stressmeter, the data (Figure 6b) reflect a stress change in the direction 20° from the vertical. The data show a similar trend of stress change to that monitored in the floor strata at LW 5121(5), i.e., increase, decrease and recovery. However, the stress change rate and the peak location were different.
Figure 6c shows the pore pressure change recorded by the four piezometers. Piezometer FP2, located 16 m below the longwall panel, recorded a reasonable pore pressure change as the longwall advanced. The data show that the pore pressure started to increase at 150 m, peaked at about 85 m and then decreased. The pore pressure quickly dropped to a negative value at about the face line, indicating that the pore space had become unsaturated with water.
The piezometers FP1, FP3 and FP4 recorded minor or negative pore pressures. These piezometers were positioned only 4–5 m from the roadway, and it was deemed that the failure and damage in the surrounding strata of the roadway had made the pore space unsaturated.
4. Integrated Analysis and Characterisation
4.1. Characteristics of Stress Change and Deformation in the Floor Strata
One of the key objectives of this field monitoring study was to characterise the stress change and deformation characteristics in the floor region to delineate the methane extraction zone. Figure 7a compares the stress change at LW 5121(5) and LW 5111(0) monitored by stressmeters positioned in similar orientations (30° and 20° from the vertical, respectively) but at different proximities. The monitored stress primarily reflected the vertical stress. In comparison, the trends of the stress change at the two longwall panels were similar, showing the three-stage variation: increase, decrease and recovery. This trend agrees with the general understanding of stress changes induced in the strata by longwall mining [1,2] and observations in the roof strata in other mines [4].
A notable difference between the monitoring results at the two longwall panels is the location of the peak stress at different proximities from the worked seam and the level of stress reduction, which could potentially infer the extent of the failure zone on the basis of theoretical models. Figure 7b shows an interpretation based on the theoretical model developed by Zhang and Liu [30] that analyses the critical slip line of the plastic zone under abutment stress. The LW 5111(0) data suggest that the rock 14 m below the mining seam yielded at approximately 20 m ahead of the longwall face, whereas the LW 5121(5) data show the rock 26 m below attained peak stress only at about the faceline. This difference indicates that the extent of the failure zone in the floor strata could reach 14–26 m vertically.
The distance of the peak stress from the faceline appears to be much greater than that reported in shallow longwall panels with a mining depth lower than 500 m [31,32]. For instance, Cao et al. [31] reported that the peak pressure at a longwall panel with a mining depth of 270 m was located at about 4–6 m from the faceline. However, a field monitoring study at a 1 km deep mine conducted by Xie et al. [33] also showed that the peak abutment pressure was located at 20.5–29 m from the faceline, which was consistent with this field study. The large distance of the peak pressure in the abutment zone likely primarily results from the great mining depth. This inference is supported by the empirical formula used by Zhang and Liu [30] for predicting the distance of the peak stress, which is a linear function of the mining depth.
The level of strata stress relief can also be quantified by strata expansion. In China, vertical expansion is used as an indicator to evaluate the destressing effect of mining on adjacent coal seams for outburst control. If the vertical expansion ratio of an adjacent seam is measured to be greater than 3‰ (3 mm/m), the seam is regarded as adequately destressed. The compliance re-assessment of outburst risks after pre-drainage, using either residual gas content or residual gas pressure as an index, can be minimised in areas with similar mining conditions [34].
Figure 8a shows the calculated strata expansion ratio of the 32–36 m interval and the 40–42 m interval (perpendicular distance) below the LW 5121(5) panel, based on the data shown in Figure 5c,d. The trends between the two curves are similar. However, the 32–36 m interval data were more accurate as it was not affected by the deformation owing to the roadway. The maximum expansion ratio for the 32–36 m interval was around 2‰, lower than the threshold of 3‰. This result suggests that the stratum 34 m below the mining seam was de-stressed to some level but not adequately enough to be exempt from the compliance assessment of outburst risks in each mining area.
The change of strata expansion correlated closely with the stress change, as shown in Figure 8b. Within 30 m ahead of the longwall face, the rapid increase in stress and the compression of the floor strata were concurrent. The stress started to decrease after it peaked around the faceline, and almost at the same time, the strata began to expand. At about 25 m behind the longwall face, the stress was reduced to its lowest level, coinciding with the occurrence of maximum expansion. As the stress was recovering, the strata expansion gradually reduced until it stabilised.
4.2. Monitoring Results vs. Predictive Methods
Zhang and Liu [30] presented a systematic study on the depth and profile of the failure zone in floor strata by theoretical and empirical analyses. They proposed three equations (Equation (1) to Equation (3)) to estimate the depth of the failure zone. Equation (1) was derived based on the Mohr–Coulomb failure criterion of elasticity; Equation (2) was based on the slip-line theory (which is often used to analyse plastic deformation in plane problems for a rigid-plastic body) of plasticity; and Equation (3) was regressed from field measurement data for coal seams with a depth of cover between 100 m and 450 m and a dipping angle between 5 and 26°. In the development of Equations (1) and (2), Zhang and Liu [30] assumed that the maximum depth of the plastic zone in the floor strata due to abutment stress represented the maximum depth of the failure zone.
In the above equations, is the estimated depth of the failure zone (m);
is the depth of cover (m);
and
are the average cohesion (KPa) and internal friction angle, respectively;
is the coefficient of stress concentration;
is the coefficient of recovered stress in the goaf;
is the average unit weight of the overlying strata (KN/m3); and
is the length of the mining face (m).
Zhang and Liu [30] provided an example to verify the three equations. For a mining panel with the parameters
= 300 m,
= 2.5,
= 0.01,
= 490 kPa,
= 45°,
= 24.5 KN/m3 and
= 140 m, the above three equations estimated the depths of the failure zone to be 13 m, 13.5 m and 16 m, respectively. These estimates were close to the field measurement value of
= 17 m. Zhang [35] further refined Equation (3) to Equation (4) for applications in mining depths ranging from 103 m to 560 m.
The three equations are fundamentally different. While the theoretical methods function the mining depth and rock mass properties, the empirical method (Equation (3)) is related to the mining width only. Between the two theoretical methods, . in Equation (1) increases with an increasing angle of internal friction, whereas . decreases with the friction angle in Equation (2). Further, a simple test suggests that Equation (1) is very sensitive to the parameters of m and φ, which can vary significantly in different mining conditions. For instance, increasing m = 0.01 to 0.05 results in an unreasonable decrease in . from 13 m to 1 m; furthermore, reducing φ from 45 to 30° leads to a sharp increase in from 13 m to 77 m. In a later paper published by Zhang [35], only Equations (2) and (4) are recommended.
By applying H = 750 m, l = 240 m and φ = 35° and assuming that the other parameters for Equation (1) were the same as those in the case study described by Zhang and Liu [30], the estimated depths of the failure zone were calculated by Equation (1) to Equation (3) as 160.0 m, 21.4 m and 24.9 m, respectively. The two latter methods appear to still be applicable for mining at a depth of 750 m when compared to the analysis of the monitored data, as discussed in Section 4.1. However, given that the two methods are fundamentally different, further parametric studies using the numerical modelling approach would be beneficial to refine the predictive methods for better applications.
4.3. Coupled Response of Strata Stress, Deformation and Pore Pressure
The dynamics of strata stress, deformation and pore pressure and their interactions are fundamental to understanding gas desorption and the emission environment in adjacent coal seams. Figure 9 and Figure 10 compare the key results recorded by the extensometers, stressmeters and piezometers at the two longwalls.
It can be seen that the trends of strata stress change, deformation and pore pressure are correlated. The increase in stress ahead of the face was concurrent with the strata deformation and rising pore pressure, whereas the decrease in stress after the peak value coincided with a drop in pore pressure. This verifies that using the stress relief ratio as an index to assess gas desorption and emission status [36] is feasible. It is worth noting that the pore pressure started to drop (about 100 m ahead of the longwall face) before the stress started to decrease (at about 75 m ahead of the longwall face), likely due to the groundwater drawdown by the goaf.
4.4. Strata Behaviour in Different Regions along the Face Direction
The monitored results at the two studied longwall panels reflected the strata behaviour in two specific regions: the roof strata in the side abutment zone and the floor strata directly below the longwall panel. Figure 11 presents the key results from the two regions. Since the two longwall panels were in similar mining conditions, their results were compared.
The trend and dynamics of the stress and pore pressure change in the roof and floor strata were similar, and showed the same three-stage variation of increase, decrease and recovery. The interactions between the stress and pore pressure were similar: the pore pressure increased with increasing stress and dropped when the stress decreased. However, the change rates of stress and pore pressure and the distance of the stress peak were different. These differences are related to the relative location of the monitored region and the localised properties of the rock mass.
5. Summary and Conclusions
A comprehensive field monitoring study comprising strata stress change, deformation and pore pressure dynamics was carried out at two inclined longwall panels. The longwalls had a depth of about 800 m and an average dipping angle of 21°. Stressmeters, extensometers and piezometers were deployed and installed from underground roadways. The purposes of this study were to understand the responses of the strata and pore pressure to mining and to characterise the optimal zone of gas extraction from floor coal seams. The following understandings were drawn:
- The mining-induced stress change in the floor strata exhibited a three-stage variation as the longwall advanced: increase, decrease and recovery. The stress started to increase at about 150 m away from the longwall face, peaked at about 0–20 m away and began to decline afterwards. The stress started to recover at about 35 m behind the longwall face and became almost stable at around 200 m.
- Mining-induced strata deformation and pore pressure change occurred correspondingly with stress change. Stress concentration in the front abutment zone caused roadways to deform and the pore pressure to rise. Stress relief in the initial goafing stage led to strata expansion and pore pressure reduction. Stress recovery was correlated with strata re-compaction and pore pressure recovery.
- Stress relief and strata expansion occurred primarily in the region 0–35 m behind the face and vertically to at least 42 m below the mining seam. This zone marks the optimal zone of gas extraction. At 34 m below the mining seam, the maximum expansion ratio of strata was about 2 mm/m in this mining condition.
- The two predictive methods for estimating the depth of the floor failure zone in shallow mines, proposed by Zhang [35], could still predict approximate results for mining at a depth of about 800 m.
- In the roof strata of the longwall roadway, the lateral stress parallel to the roadway decreased as the longwall advanced, whereas the lateral stress perpendicular to the roadway increased. Roof strata in the side abutment zone within 20 m of the goaf edge and 11 m above the mining seam showed a similar trend in stress change and pore pressure to that in the floor strata.
Author Contributions
Conceptualization, H.G. and L.Y.; methodology, H.G., B.S. and Q.Q.; formal analysis, Q.Q. and B.S.; investigation, B.S., Q.Q., J.Q. and G.Y.; writing—original draft preparation, Q.Q.; writing—review and editing, Q.Q., H.G. and B.S.; project administration, B.S. and G.Y.; funding acquisition, L.Y. and H.G. All authors have read and agreed to the published version of the manuscript.
Funding
This research was funded by Huainan Mining Group, China.
Data Availability Statement
Not applicable.
Acknowledgments
The authors would like to thank the Huainan Mining Group, China, for funding this research. The authors are also very grateful to the mine management and personnel for the tremendous support provided during the implementation of the field monitoring. The authors would also like to thank GEL, Australia, for undertaking the field installation work and our colleagues who have contributed to this research.
Conflicts of Interest
The authors declare no conflict of interest.
References
- Peng, S.S. Longwall Mining, 2nd ed.; West Virginia University: Morgantown, WV, USA, 2006. [Google Scholar]
- Qian, M.; Shi, P.; Xu, J. Mine Pressure and Ground Control; China University of Mining and Technology Press: Xuzhou, China, 2010. [Google Scholar]
- Guo, H.; Qu, Q.; Adhikary, D. Overburden response to longwall mining. In Advances in Coal Mine Ground Control; Peng, S.S., Ed.; Woodhead Publishing: Sawston, UK, 2017; pp. 111–155. [Google Scholar]
- Guo, H.; Yuan, L.; Shen, B.; Qu, Q.; Xue, J. Mining-induced strata stress changes, fractures and gas flow dynamics in multi-seam longwall mining. Int. J. Rock Mech. Min. Sci. 2012, 54, 129–139. [Google Scholar] [CrossRef]
- Yavuz, H. An estimation method for cover pressure re-establishment distance and pressure distribution in the goaf of longwall coal mines. Int. J. Rock Mech. Min. Sci. 2004, 41, 193–205. [Google Scholar] [CrossRef]
- Qu, Q.; Guo, H.; Khanal, M. Monitoring and analysis of ground movement from multi-seam mining. Int. J. Rock Mech. Min. Sci. 2021, 148, 104949. [Google Scholar] [CrossRef]
- Cheng, G.; Ma, T.; Tang, C.; Liu, H.; Wang, S. A zoning model for coal mining-induced strata movement based on microseismic monitoring. Int. J. Rock Mech. Min. Sci. 2017, 94, 123–138. [Google Scholar] [CrossRef]
- Zhu, W.; Qi, X.; Ju, J.; Xu, J. Mechanisms behind strong strata behaviour in high longwall mining face-ends under shallow covers. J. Geophys. Eng. 2019, 16, 559–570. [Google Scholar] [CrossRef] [Green Version]
- Zhu, W.; Chen, L.; Zhou, Z.; Shen, B.; Xu, Y. Failure Propagation of Pillars and Roof in a Room and Pillar Mine Induced by Longwall Mining in the Lower Seam. Rock Mech. Rock Eng. 2019, 52, 1193–1209. [Google Scholar] [CrossRef]
- Majdi, A.; Hassani, F.P.; Nasiri, M.Y. Prediction of the height of distressed zone above the mined panel roof in longwall coal mining. Int. J. Coal Geol. 2012, 98, 62–72. [Google Scholar] [CrossRef]
- Booth, C.J. Groundwater as an environmental constraint of longwall coal mining. Environ. Geol. 2006, 49, 796–803. [Google Scholar] [CrossRef]
- Newman, C.; Agioutantis, Z.; Leon, G. Assessment of potential impacts to surface and subsurface water bodies due to longwall mining. Int. J. Min. Sci. Technol. 2017, 27, 57–64. [Google Scholar] [CrossRef]
- Zhang, D.; Fan, G.; Ma, L.; Wang, X. Aquifer protection during longwall mining of shallow coal seams: A case study in the Shendong Coalfield of China. Int. J. Coal Geol. 2011, 86, 190–196. [Google Scholar] [CrossRef]
- Xu, J.; Zhu, W.; Wang, X. New method to predict the height of fractured water-conducting zone by location of key strata. J. China Coal Soc. 2012, 37, 762–769. [Google Scholar]
- Karacan, C.Ö.; Esterhuizen, G.S.; Schatzel, S.J.; Diamond, W.P. Reservoir simulation-based modelling for characterising longwall methane emissions and gob gas venthole production. Int. J. Coal Geol. 2007, 71, 225–245. [Google Scholar] [CrossRef]
- Karacan, C.Ö.; Goodman, G. Probabilistic modelling using bivariate normal distributions for identification of flow and displacement intervals in longwall overburden. Int. J. Rock Mech. Min. Sci. 2011, 48, 27–41. [Google Scholar] [CrossRef]
- Schatzel, S.J.; Karacan, C.Ö.; Dougherty, H.; Goodman, G.V.R. An analysis of reservoir conditions and responses in longwall panel overburdenduring mining and its effect on gob gas well performance. Eng. Geol. 2012, 127, 65–74. [Google Scholar] [CrossRef]
- Qu, Q.; Xu, J.; Qian, M. Study of the influence of key strata movement on gas emission from overlying coal seams. Chin. J. Rock Mech. Eng. 2007, 26, 1479–1484. [Google Scholar]
- Qu, Q.; Xu, J.; Wu, R.; Qin, W.; Hu, G. Three-zone characterisation of coupled strata and gas behaviour in multi-seam mining. Int. J. Rock Mech. Min. Sci. 2015, 78, 91–98. [Google Scholar] [CrossRef]
- Palchik, V. Localization of mining-induced horizontal fractures along rock layer interfaces in overburden: Field measurements and prediction. Environ. Geol. 2005, 48, 68–80. [Google Scholar] [CrossRef]
- Yuan, L. The technique of integrated coal and methane extraction with retaining roadway and drainage boreholes. J. China Coal Soc. 2008, 33, 898–902. [Google Scholar]
- Yuan, L. Theory and practice of integrated pillarless coal production and methane extraction in multi-seams of low permeability. Eng. Sci. 2009, 11, 72–80. [Google Scholar]
- Zhang, J.; Shen, B. Coal mining under aquifers in China: A case study. Int. J. Rock Mech. Min. Sci. 2004, 41, 629–639. [Google Scholar] [CrossRef]
- Sun, J.; Wang, L.; Wang, Z.; Hou, H.; Shen, Y. Determining areas in an inclined coal seam floor prone to water-inrush by micro-seismic monitoring. Min. Sci. Technol. 2011, 21, 165–168. [Google Scholar]
- Wei, X.; Gao, M.; Lv, Y.; Shi, X.; Gao, H.; Zhou, H. Evolution of a mining-induced fracture network in the overburden strata of an inclined coal seam. Int. J. Min. Sci. Technol. 2012, 22, 779–783. [Google Scholar] [CrossRef]
- Wu, Y.; Liu, K.; Yun, D.; Jie, P.; Wang, G. Research progress on the safe and efficient mining technology of steeply dipping seam. J. China Coal Soc. 2014, 39, 1611–1618. [Google Scholar]
- Yao, Q.; Li, X.; Sun, B.; Ju, M.; Chen, T.; Zhou, J.; Liang, S.; Qu, Q. Numerical investigation of the effects of coal seam dip angle on coal wall stability. Int. J. Rock Mech. Min. Sci. 2017, 100, 298–309. [Google Scholar] [CrossRef]
- Rak, Z.; Stasica, J.; Burtan, Z.; Chlebowski, D. Technical Aspects of Mining Rate Improvement in Steeply Inclined Coal Seams: A Case Study. Resources 2020, 9, 138. [Google Scholar] [CrossRef]
- Mikkelsen, P.E.; Green, G.E. Piezometers in Fully Grouted Boreholes. In Proceedings of the 6th International Symposium on Field Measurements in Geomechanics, Oslo, Norway, 15–18 September 2013. [Google Scholar]
- Zhang, J.; Liu, T. On depth of fissured zone in seam floor resulted from coal extraction and its distribution characteristics. J. China Coal Soc. 1990, 15, 46–55. [Google Scholar]
- Cao, M.; Yin, S.; Xu, B. Water inrush and failure characteristics of coal seam floor over a confined aquifer. Energy Rep. 2021, 7, 8298–8311. [Google Scholar] [CrossRef]
- Islavath, S.A.; Deb, D.; Kumar, H. Numerical analysis of a longwall mining cycle and development of a composite longwall index. Int. J. Rock Mech. Min. Sci. 2016, 89, 43–54. [Google Scholar] [CrossRef]
- Xie, J.; Xu, J.; Wang, F. Mining-induced stress distribution of the working face in a kilometer-deep coal mine—A case study in Tangshan coal mine. J. Geophys. Eng. 2018, 15, 2060–2070. [Google Scholar] [CrossRef] [Green Version]
- State Administration of Work Safety of China (SAWSC). Regulations for Prevention and Control of Outbursts of Coal and Gas; China Coal Industry Publishing House: Beijing, China, 2009. [Google Scholar]
- Zhang, J. Investigations of water inrushes from aquifers under coal seams. Int. J. Rock Mech. Min. Sci. 2005, 42, 350–360. [Google Scholar] [CrossRef]
- Qu, Q.; Guo, H.; Wilkins, A. Using stress relief ratio to delineate optimal methane drainage zone in longwall goaf. In Proceedings of the 11th International Mine Ventilation Congress, Xi’an, China, 14–20 September 2018; Chang, X., Ed.; Springer: Berlin/Heidelberg, Germany, 2019. [Google Scholar]
Figure 1.
A simplified stratigraphic section of the studied mine. B8, B9, B10, B11, C13, C14 and C15 are coal seams; SS12, SS14, SS24, SS26, SS32, SS34 and SS36 are sandstone units used to correlate stratigraphy between different boreholes.
Figure 1.
A simplified stratigraphic section of the studied mine. B8, B9, B10, B11, C13, C14 and C15 are coal seams; SS12, SS14, SS24, SS26, SS32, SS34 and SS36 are sandstone units used to correlate stratigraphy between different boreholes.
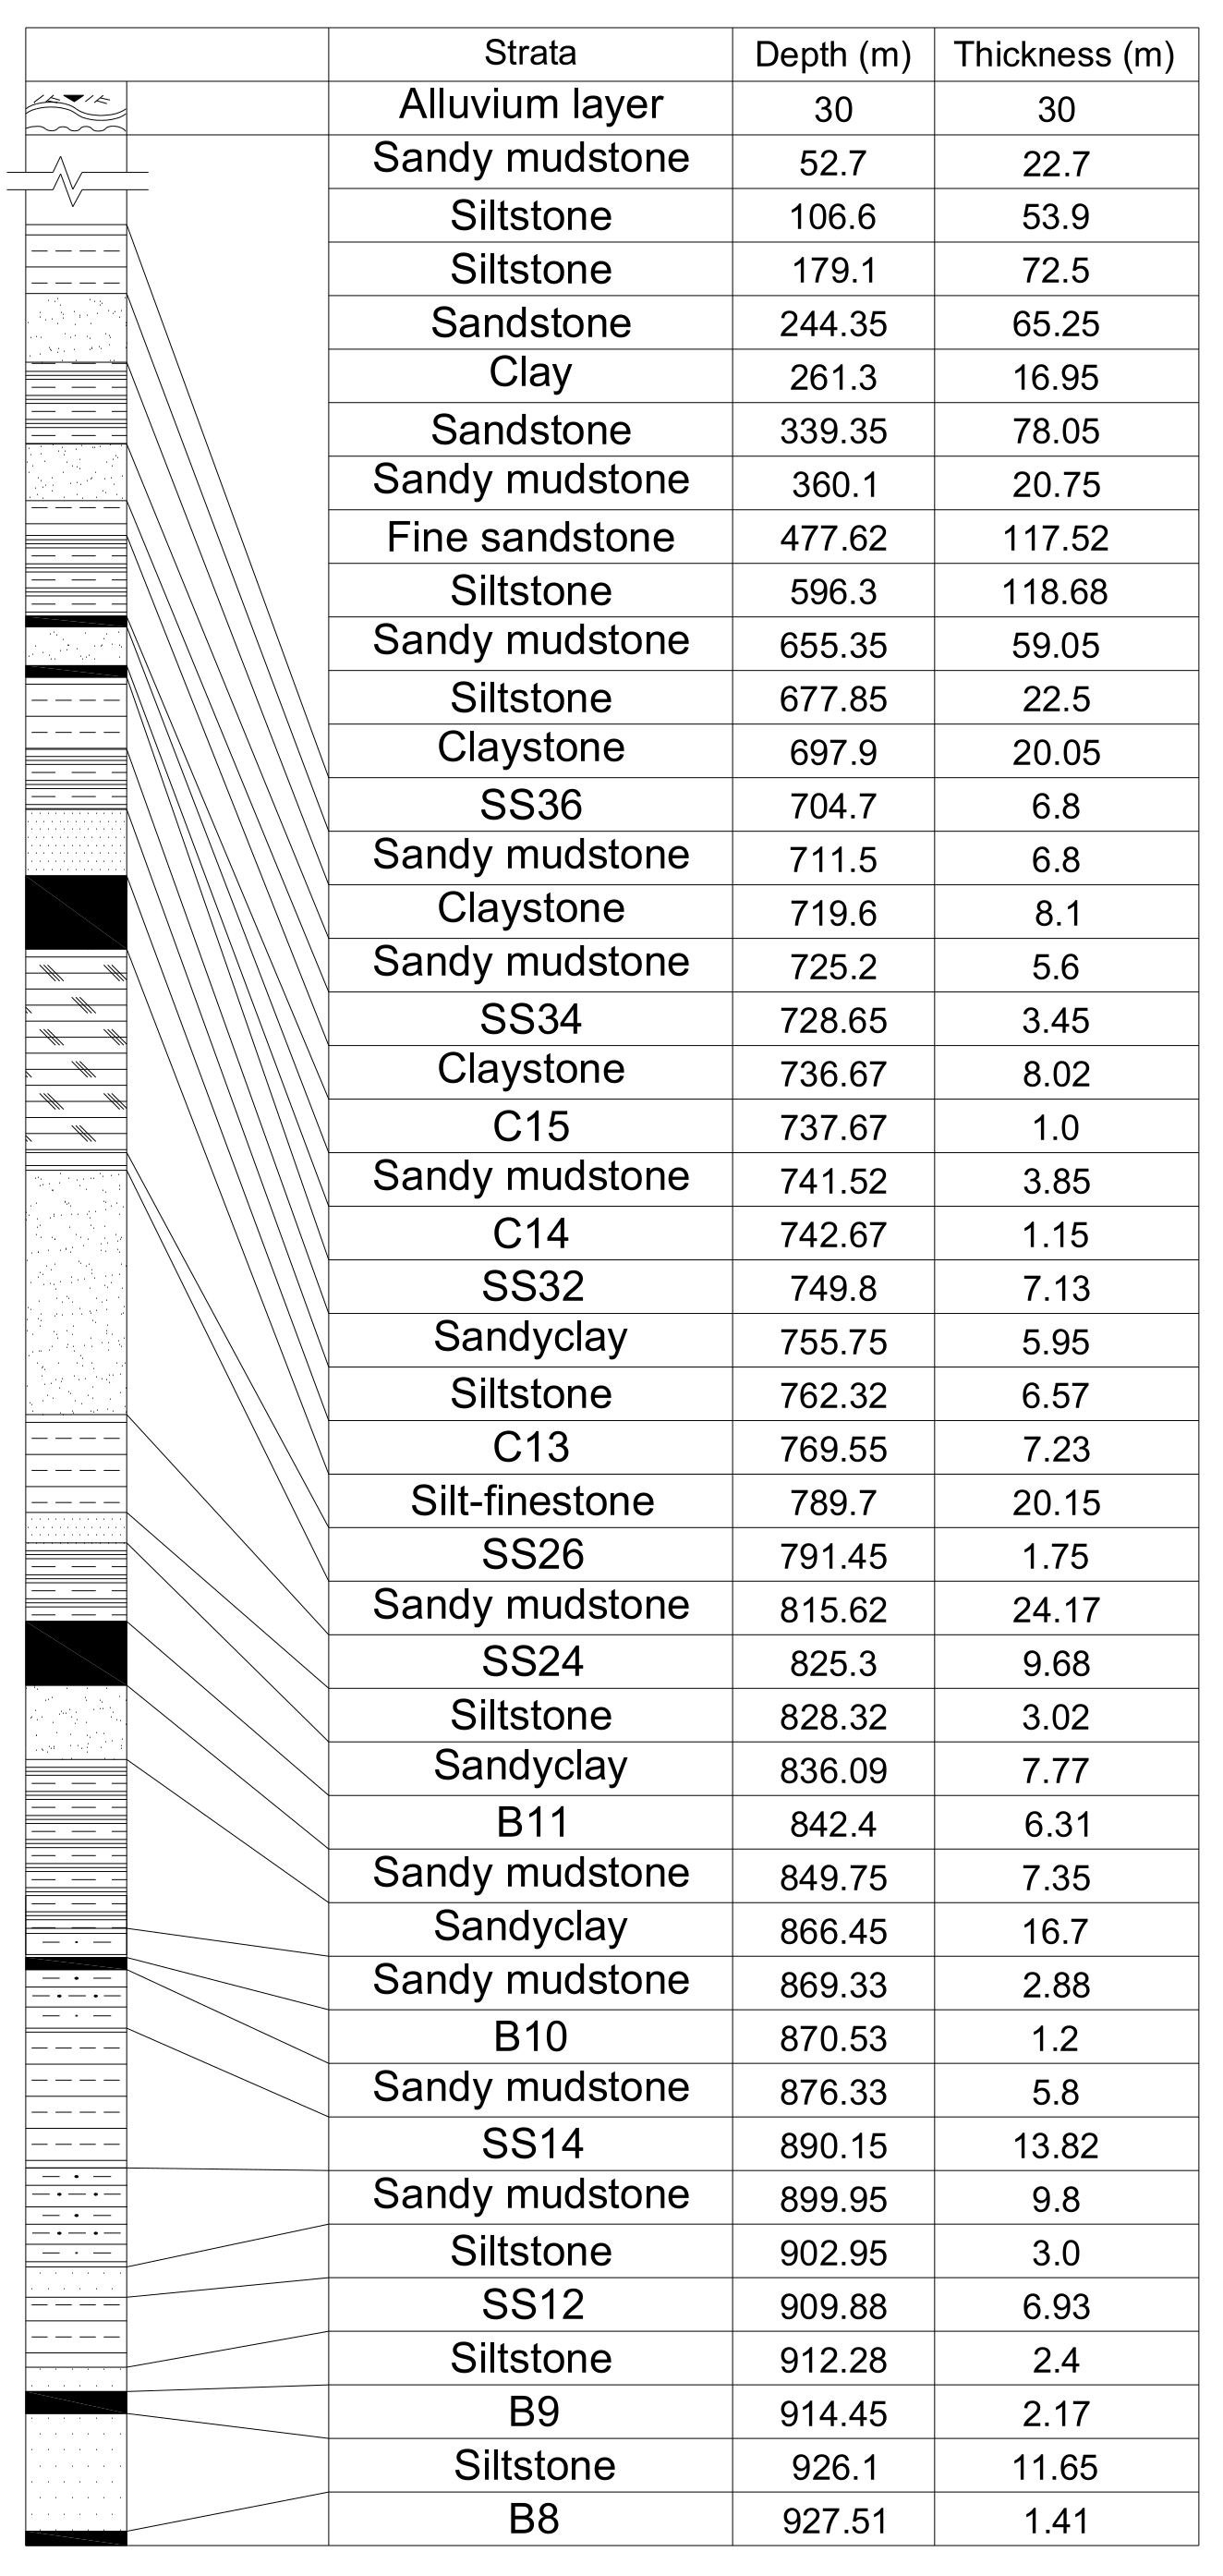
Figure 2.
The designed monitoring plan at (a) LW 5121(5) and (b) LW 5111(0). Note that the number and positions of the instruments were slightly altered due to site conditions.
Figure 2.
The designed monitoring plan at (a) LW 5121(5) and (b) LW 5111(0). Note that the number and positions of the instruments were slightly altered due to site conditions.

Figure 3.
The key results from the belt road of LW 5121(5): (a) location of the instruments; (b) stress change in the longitudinal direction of the roadway; (c) stress change in the transverse direction of the roadway; (d) relative displacement monitored by extensometer #3.
Figure 3.
The key results from the belt road of LW 5121(5): (a) location of the instruments; (b) stress change in the longitudinal direction of the roadway; (c) stress change in the transverse direction of the roadway; (d) relative displacement monitored by extensometer #3.
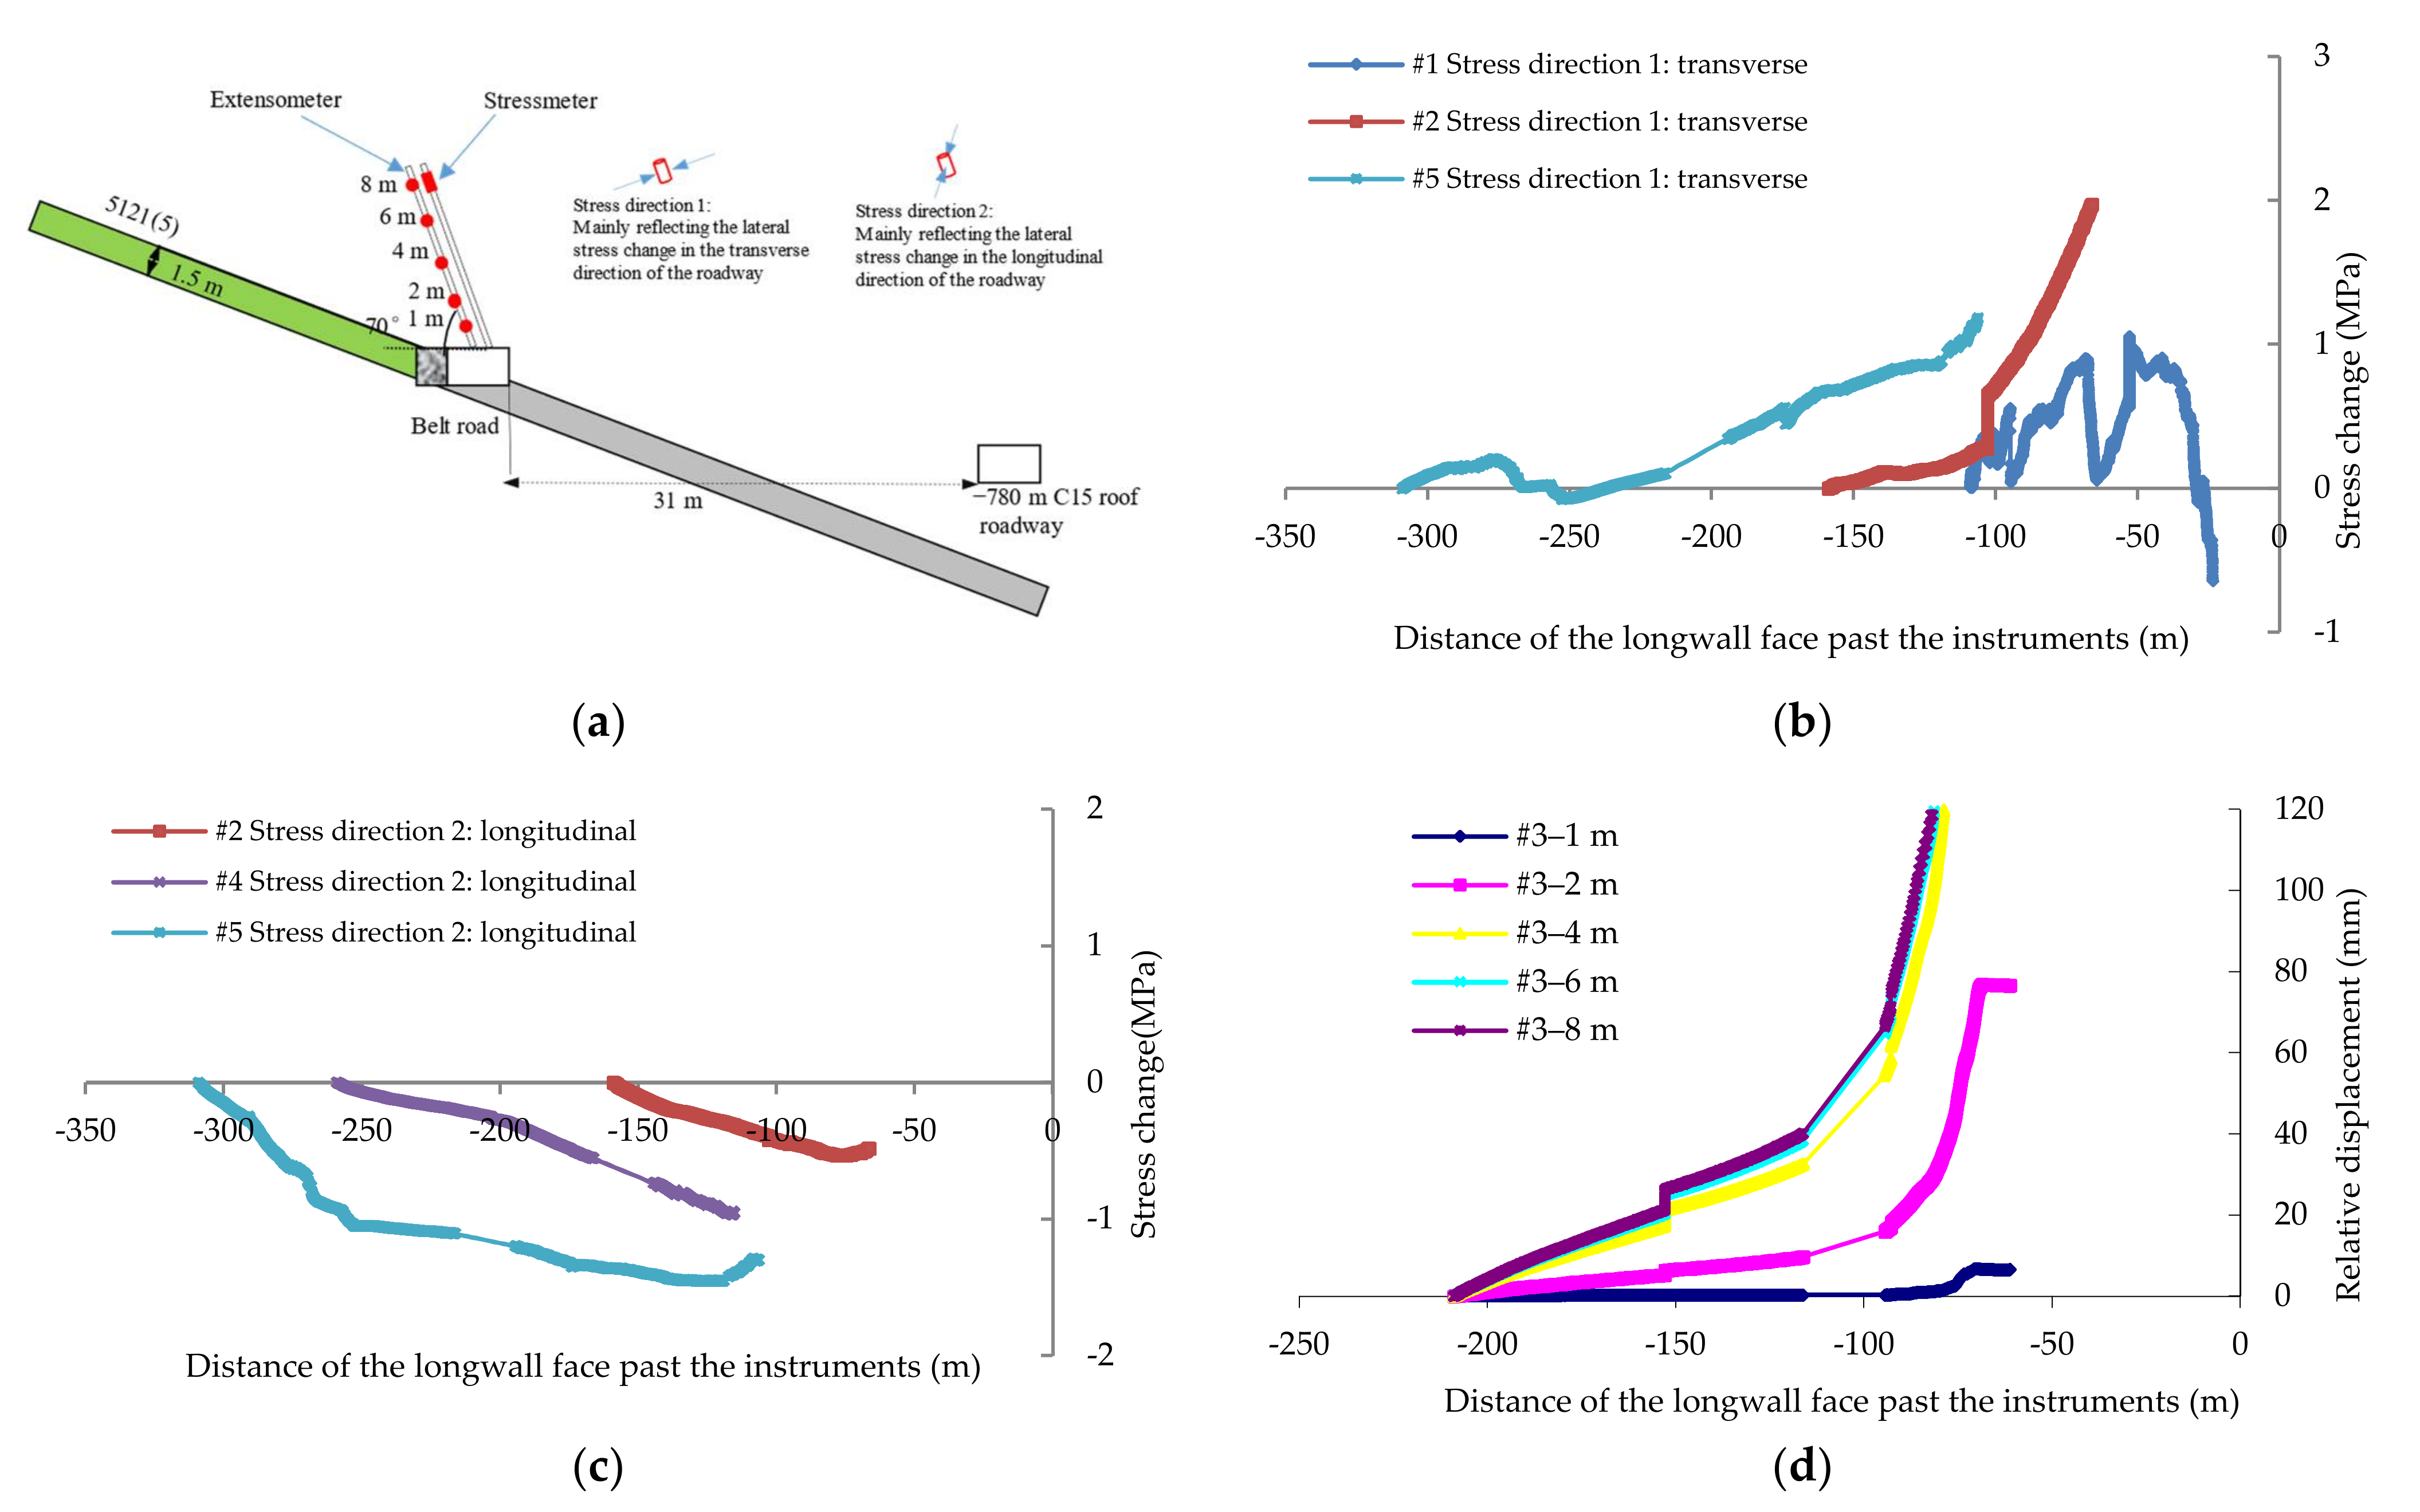
Figure 4.
Recorded results from the roof roadway above LW 5121(5): (a) the locations of the instruments; (b) monitored roof stress change; (c) monitored pore pressure changes.
Figure 4.
Recorded results from the roof roadway above LW 5121(5): (a) the locations of the instruments; (b) monitored roof stress change; (c) monitored pore pressure changes.
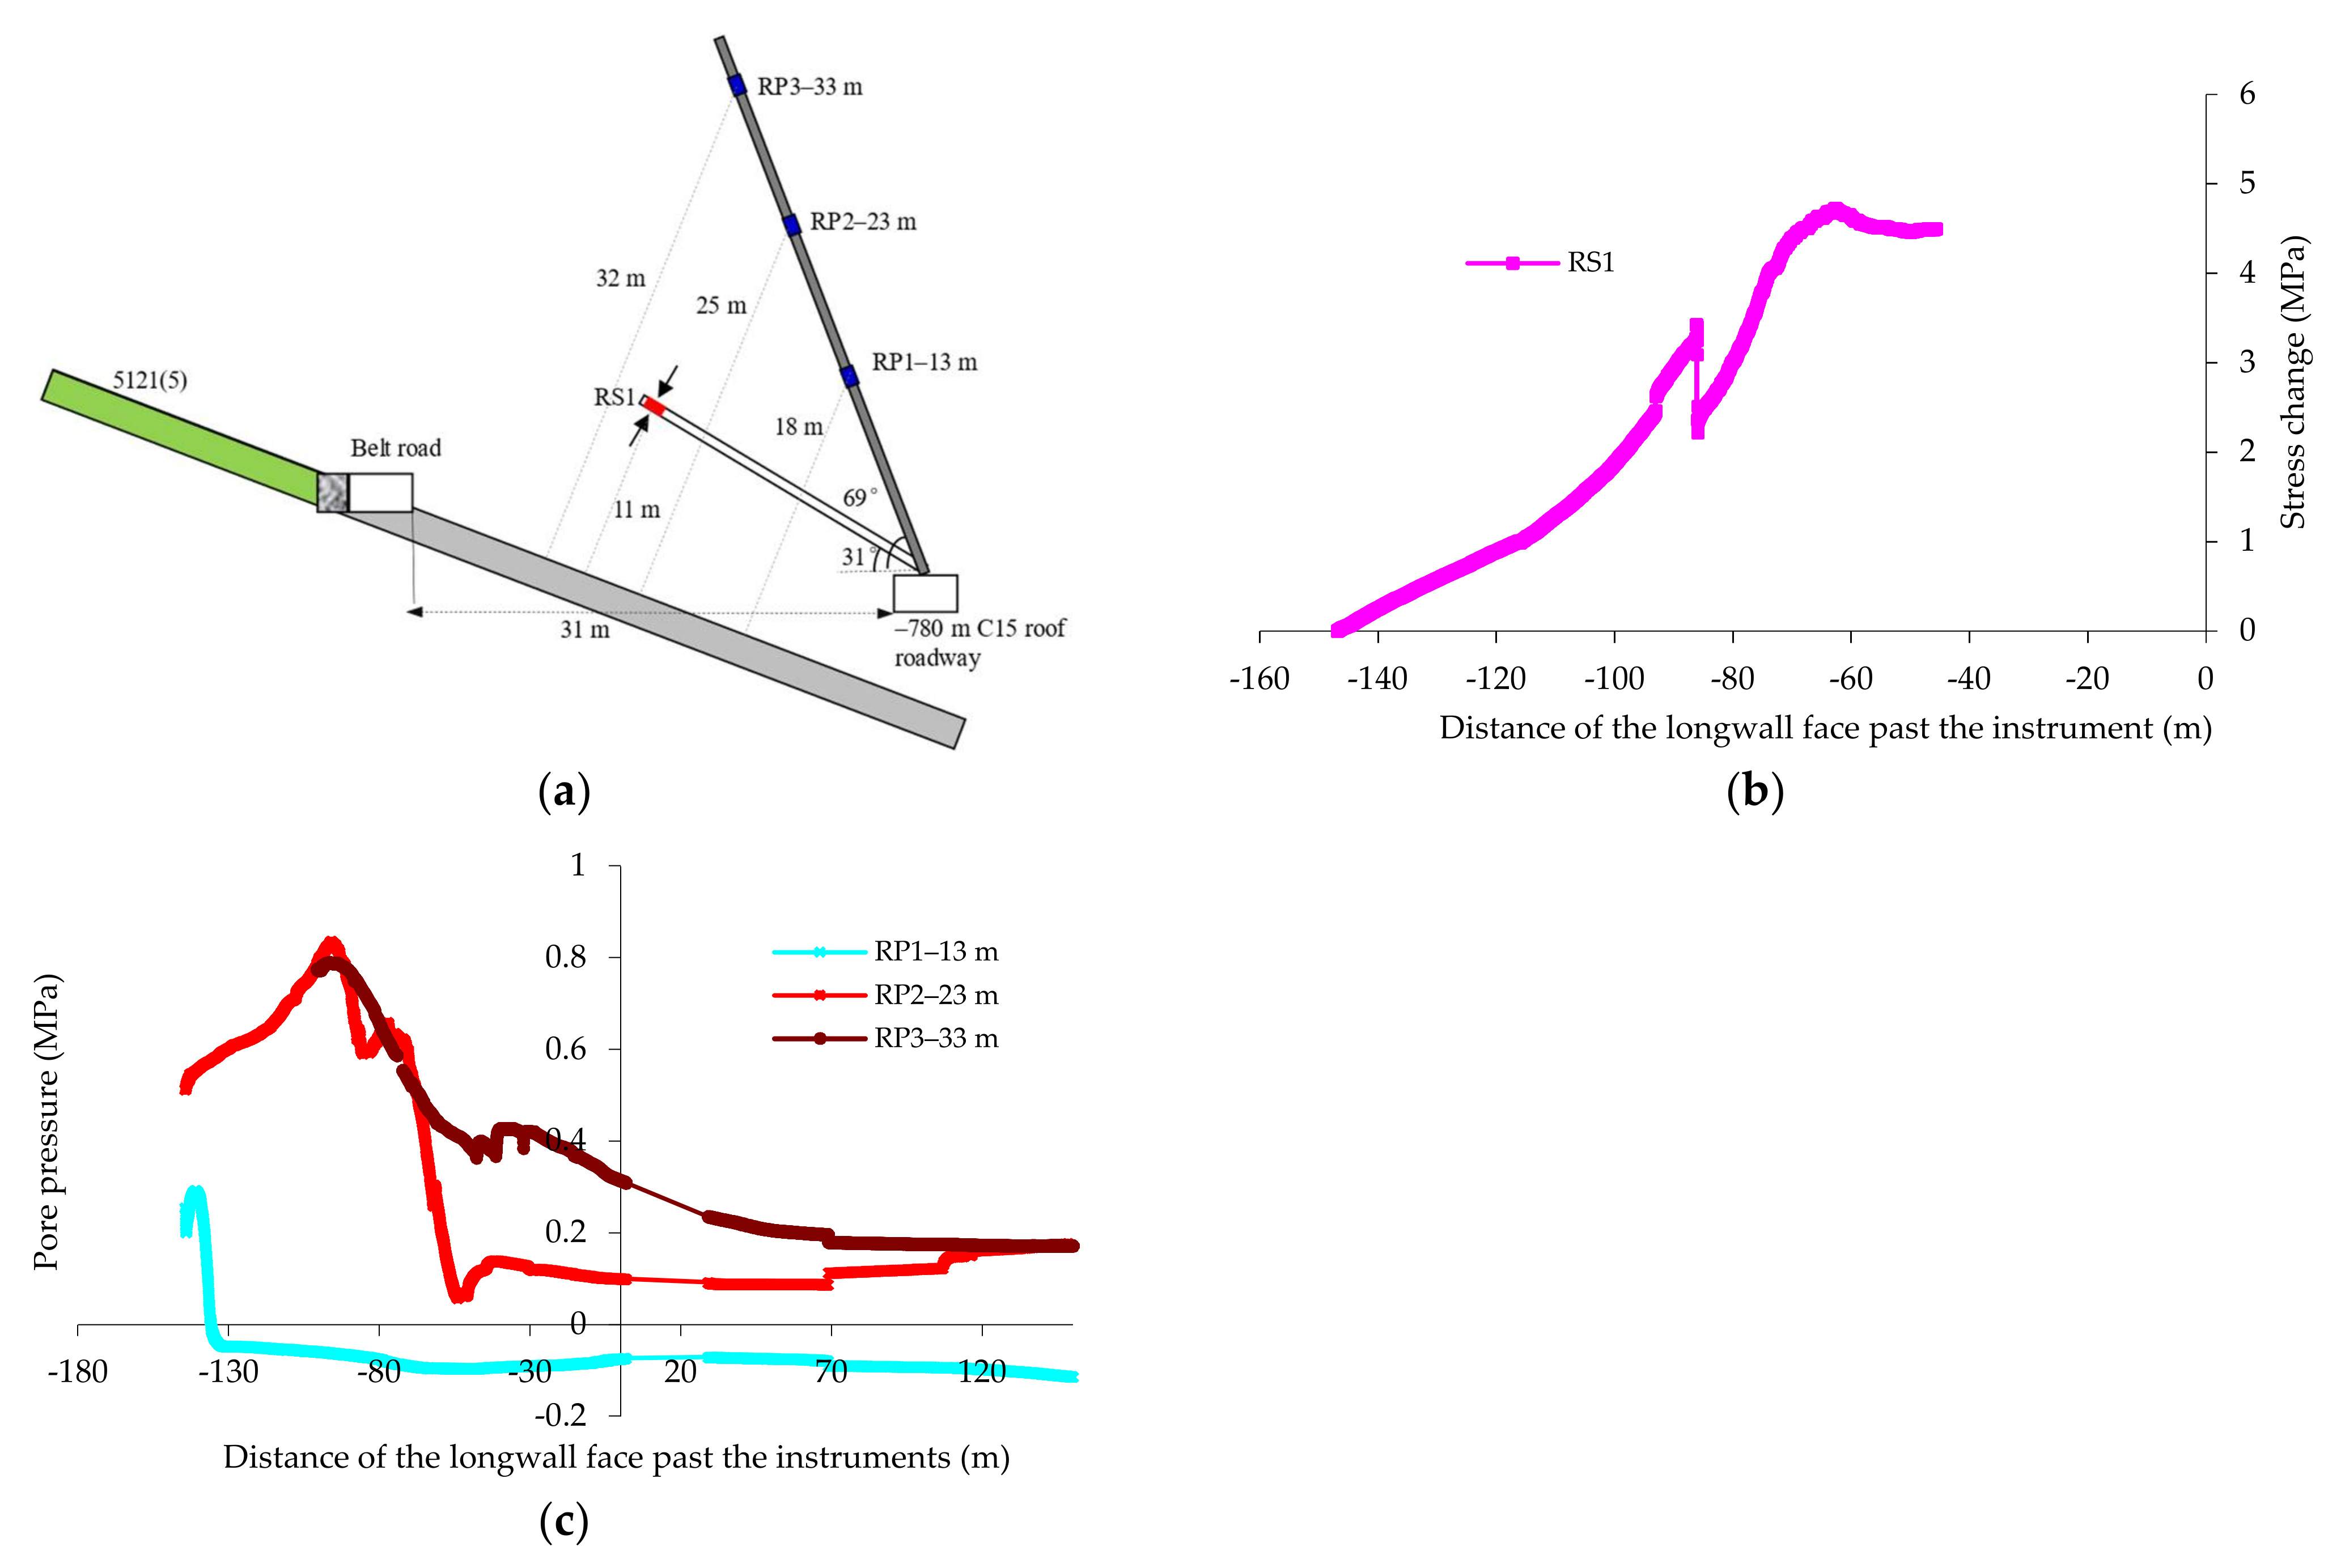
Figure 5.
The key results from the −780 m C13 floor roadway: (a) location of the instruments; (b) monitored stress changes in the floor strata; (c) monitored strata deformation by #1 extensometer (#1–1 m denotes the anchor was located 1 m from the borehole collar); (d) monitored strata deformation by #2 extensometer.
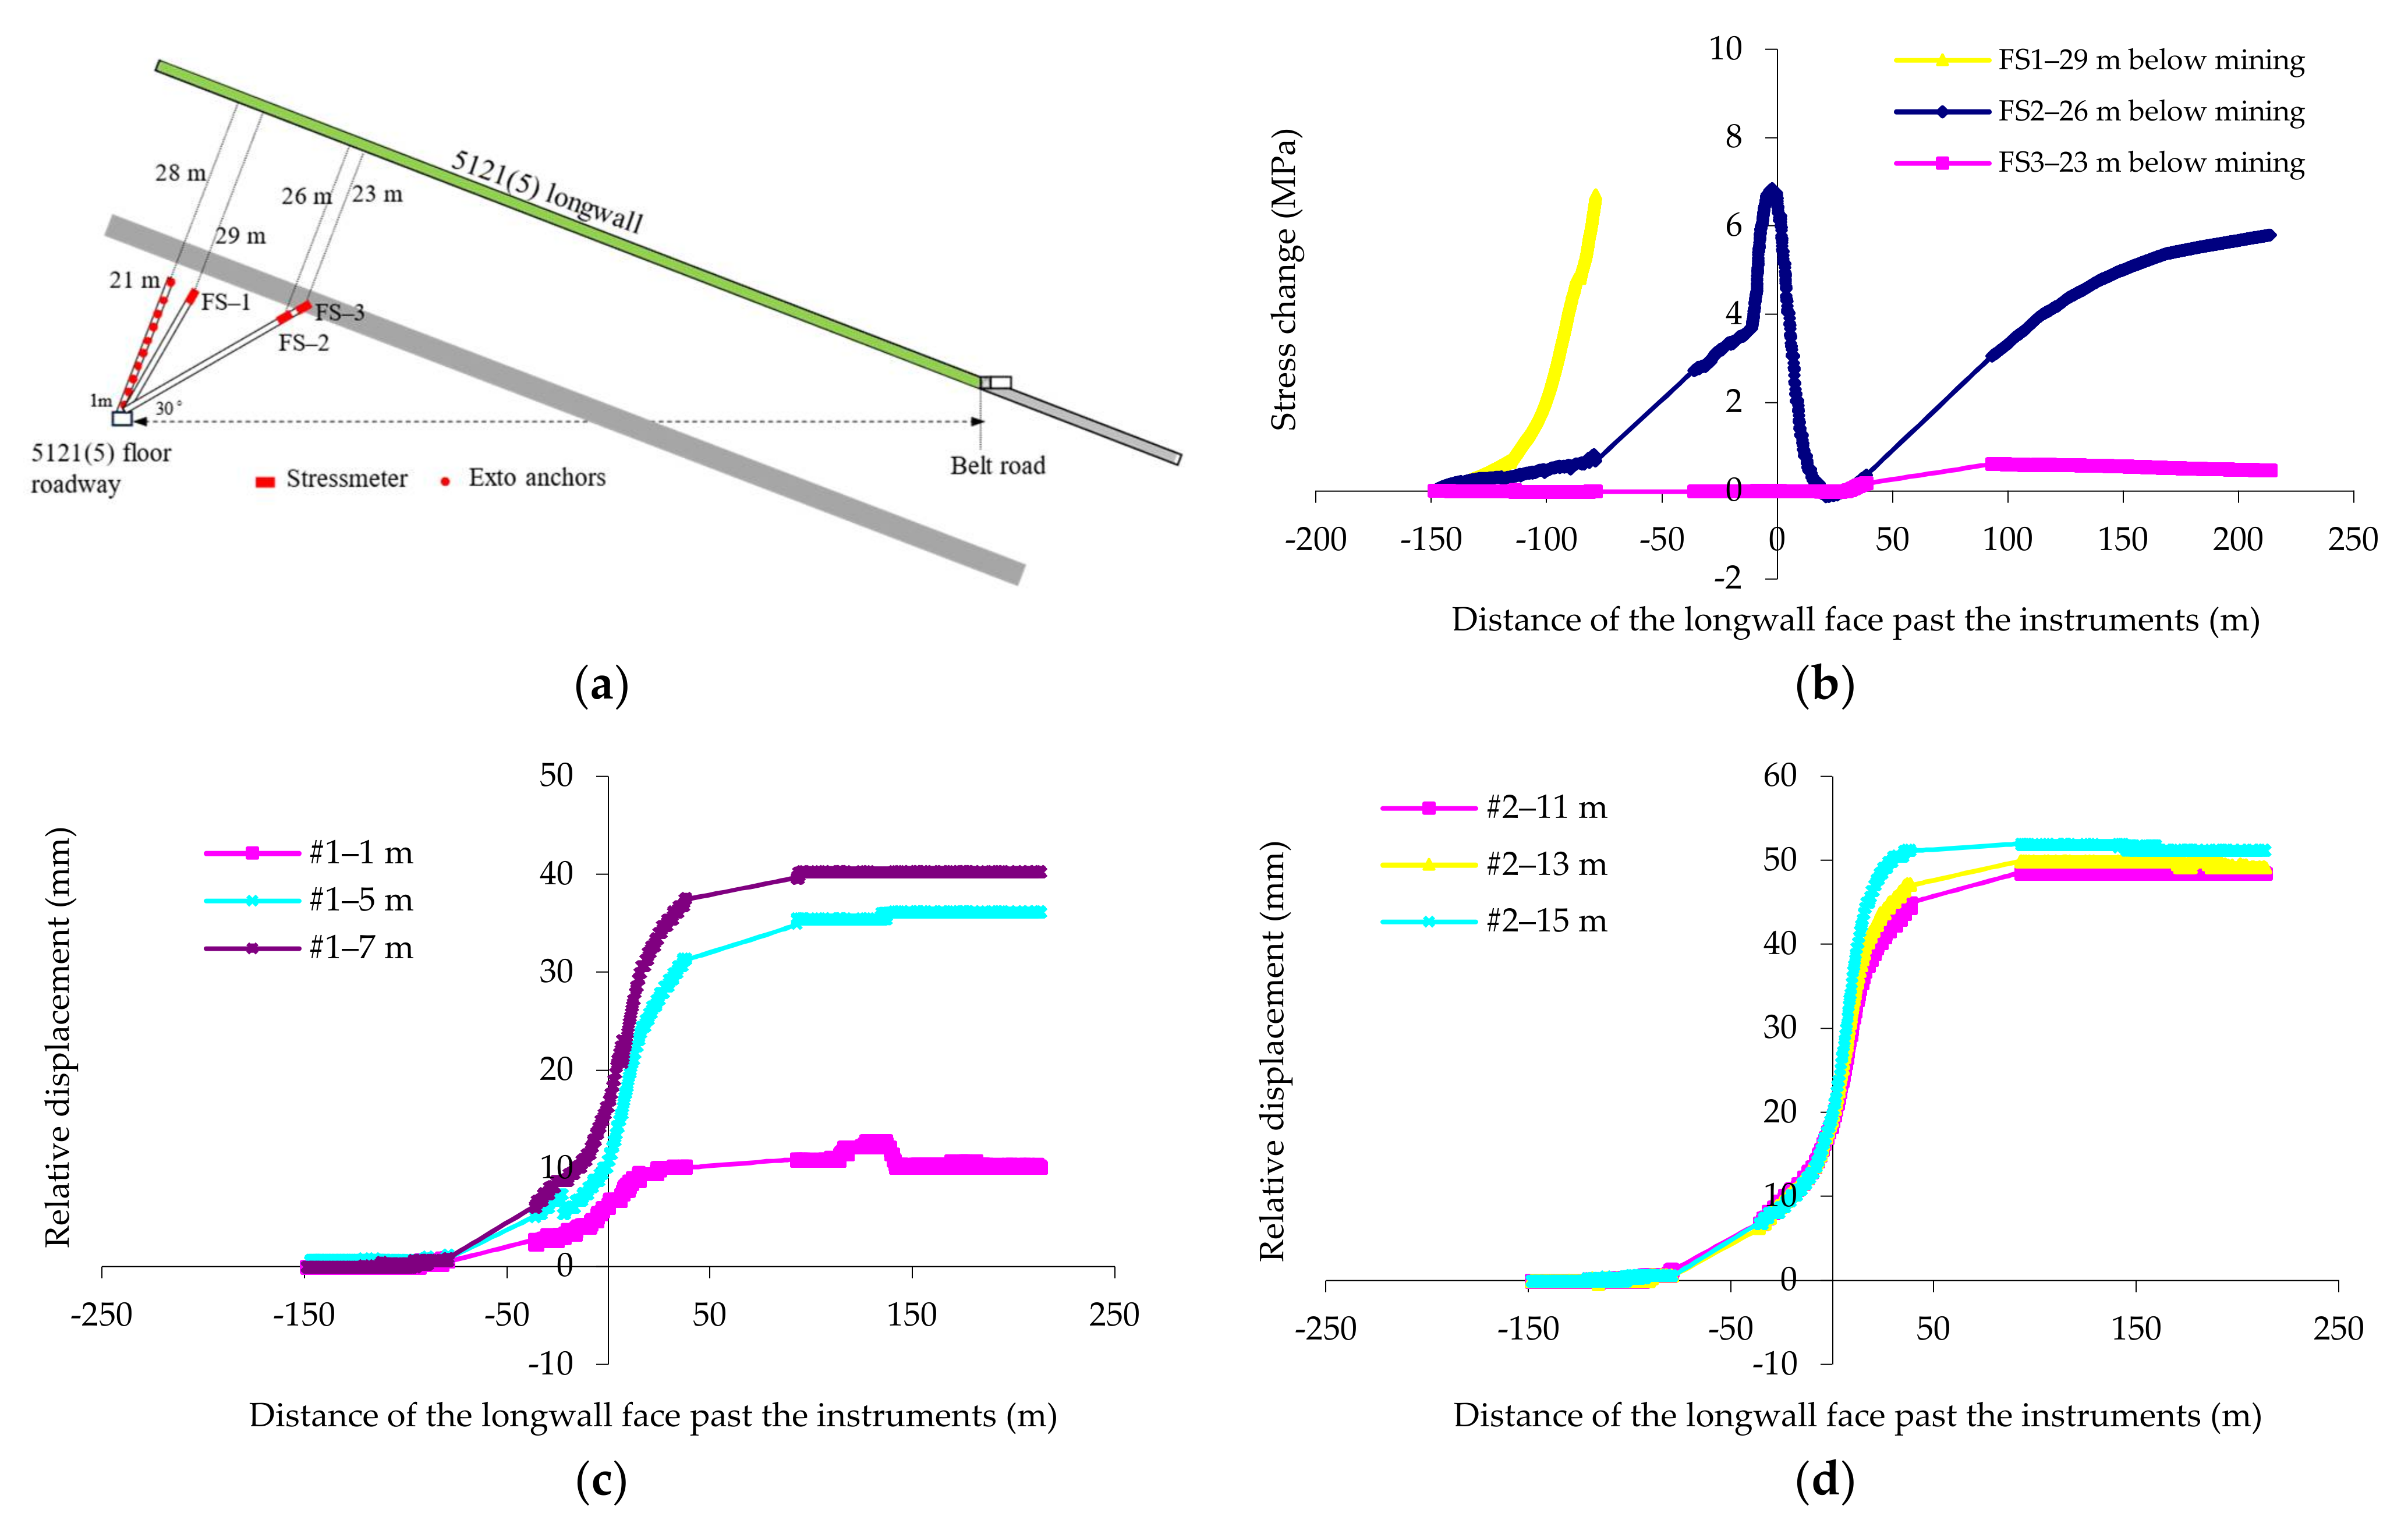
Figure 6.
The key results from the rock roadway underneath the LW 5111(0) panel: (a) location of the instruments; (b) stress change monitored by the stressmeter FS-1; (c) monitored pore pressure change.
Figure 6.
The key results from the rock roadway underneath the LW 5111(0) panel: (a) location of the instruments; (b) stress change monitored by the stressmeter FS-1; (c) monitored pore pressure change.

Figure 7.
(a) Comparison of monitored stress change at LW 5121(5) and LW 5111(0). (b) Interpreted stress change and strata failure zone in the floor strata (the profile of the floor failure zone is based on Zhang and Liu [30]).
Figure 7.
(a) Comparison of monitored stress change at LW 5121(5) and LW 5111(0). (b) Interpreted stress change and strata failure zone in the floor strata (the profile of the floor failure zone is based on Zhang and Liu [30]).
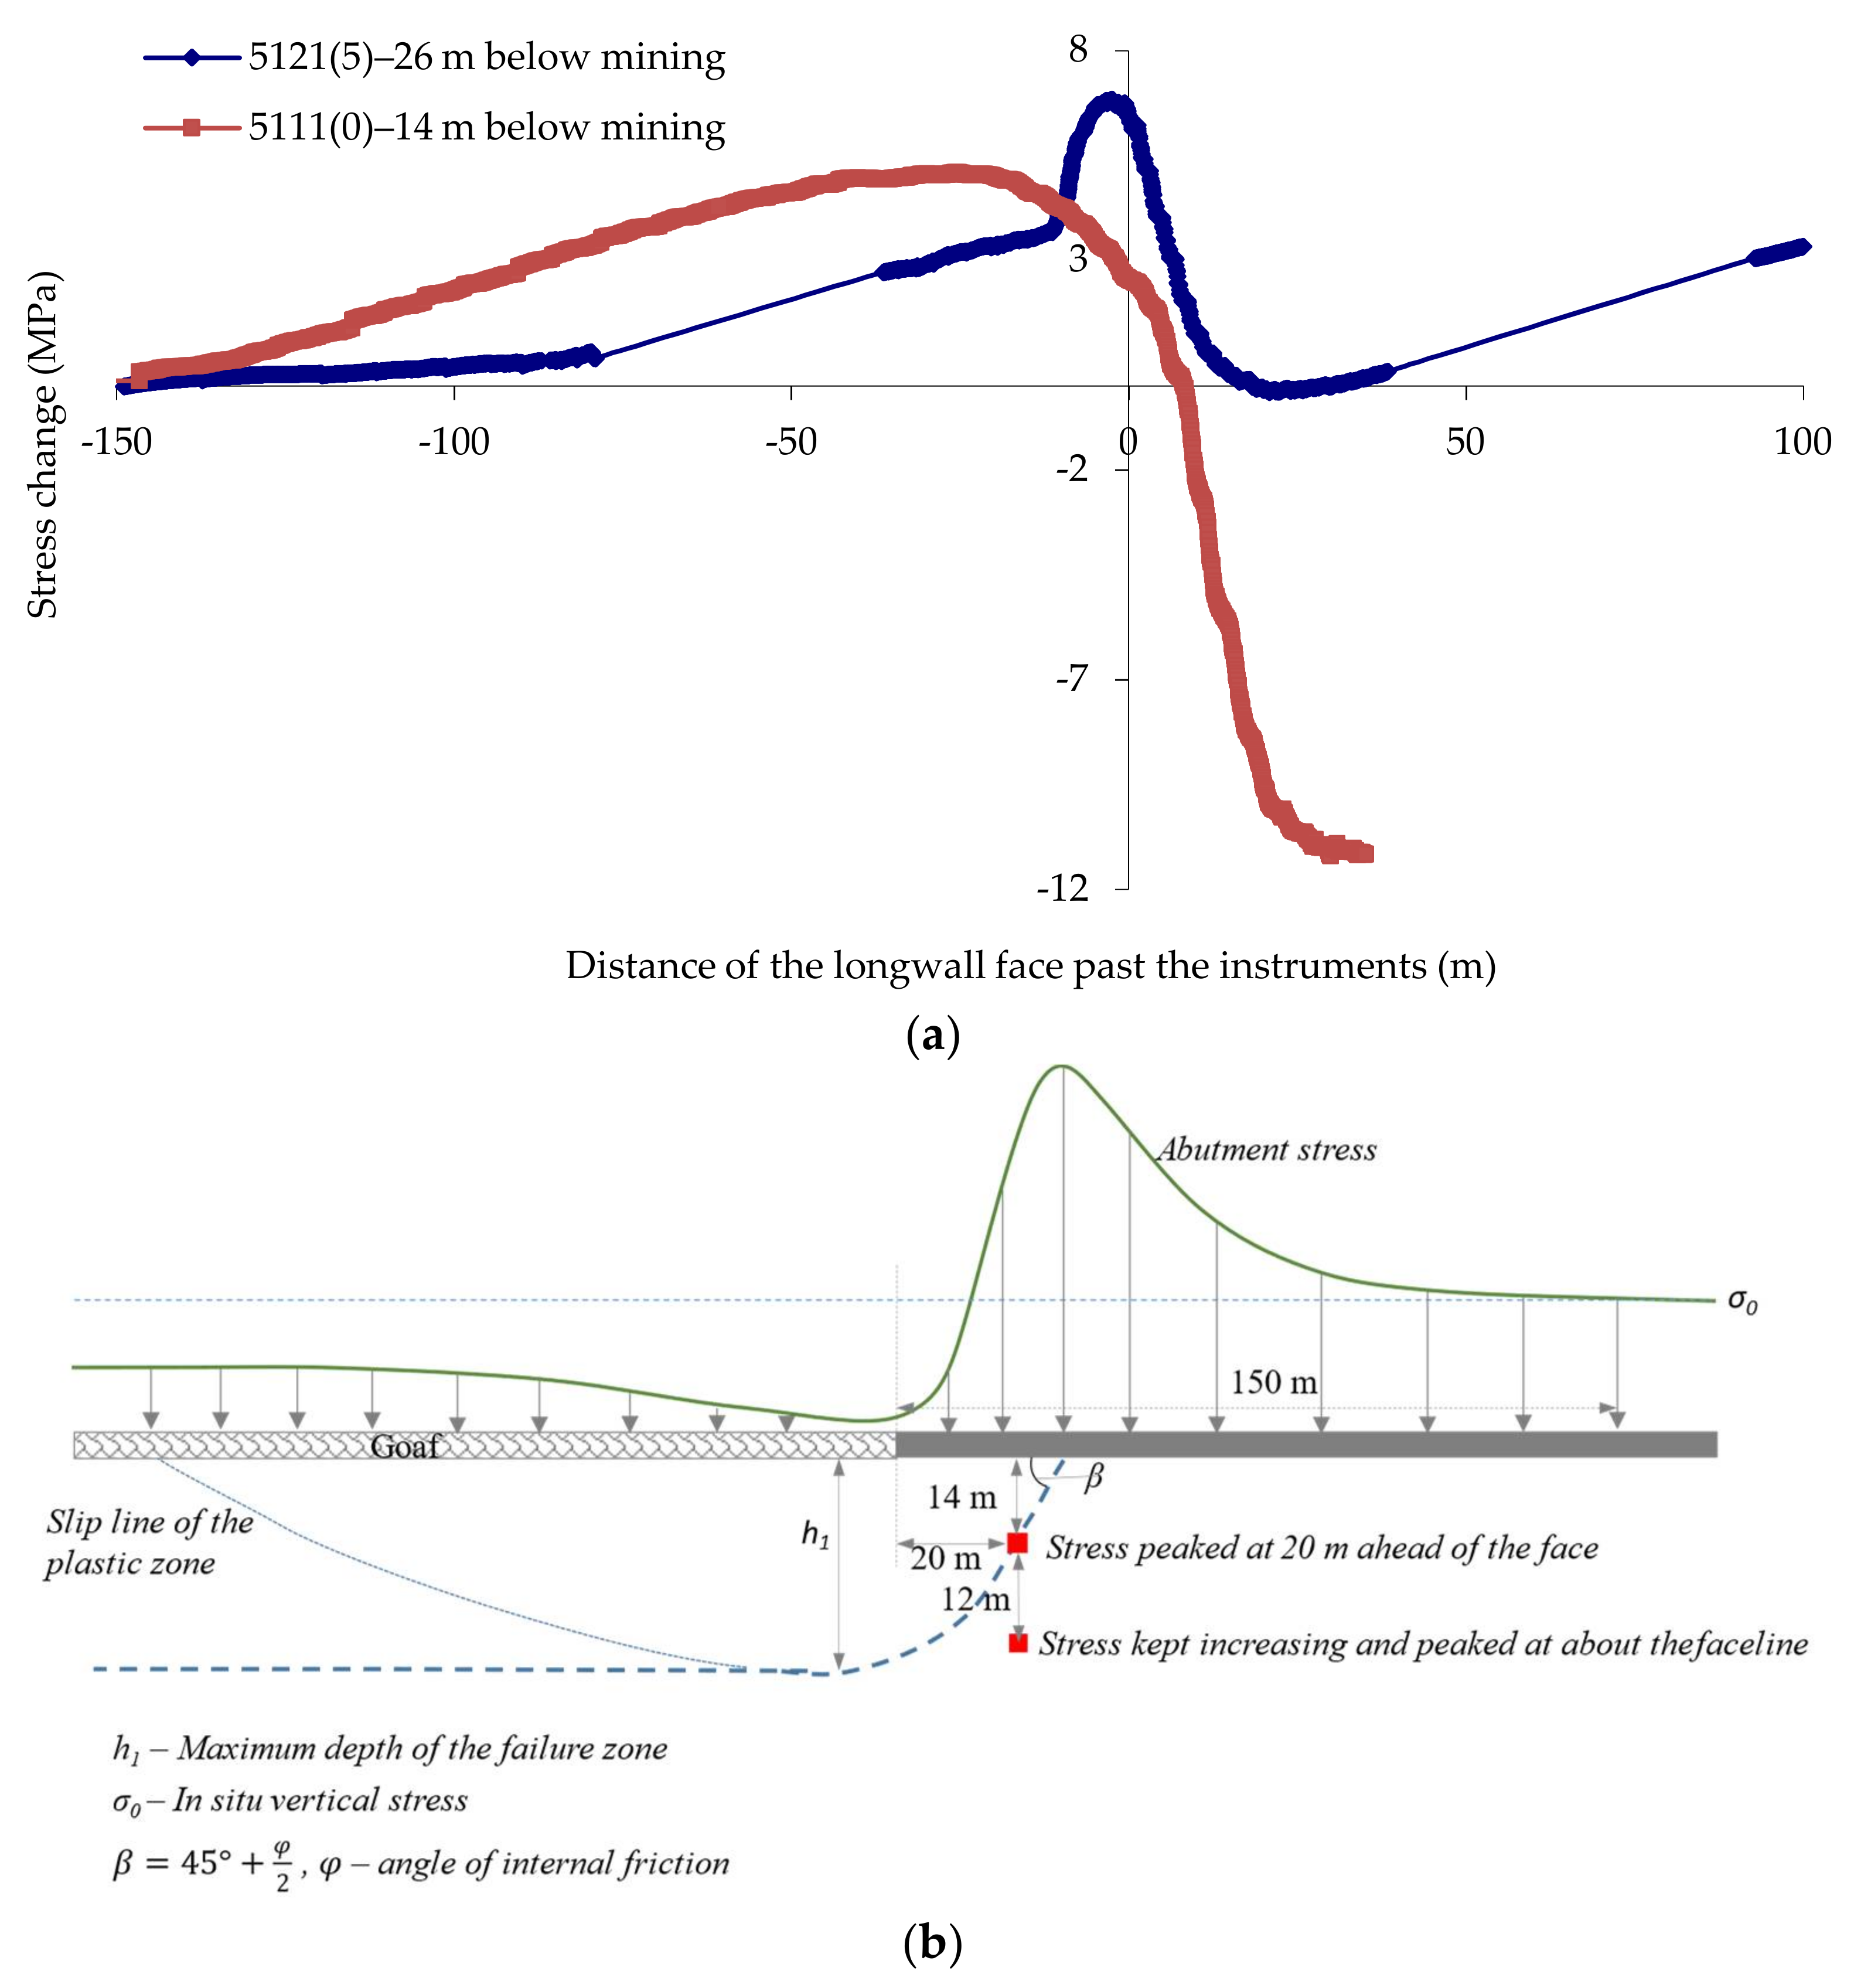
Figure 8.
(a) The dynamics of strata expansion as LW 5121(5) advanced. (b) The correlation between the strata expansion ratio and stress change in the floor strata.
Figure 8.
(a) The dynamics of strata expansion as LW 5121(5) advanced. (b) The correlation between the strata expansion ratio and stress change in the floor strata.

Figure 9.
Corresponding changes of strata stress, deformation and pore pressure monitored at LW 5121(5).
Figure 9.
Corresponding changes of strata stress, deformation and pore pressure monitored at LW 5121(5).

Figure 10.
Corresponding changes of strata stress and pore pressure monitored at LW 5111(0).
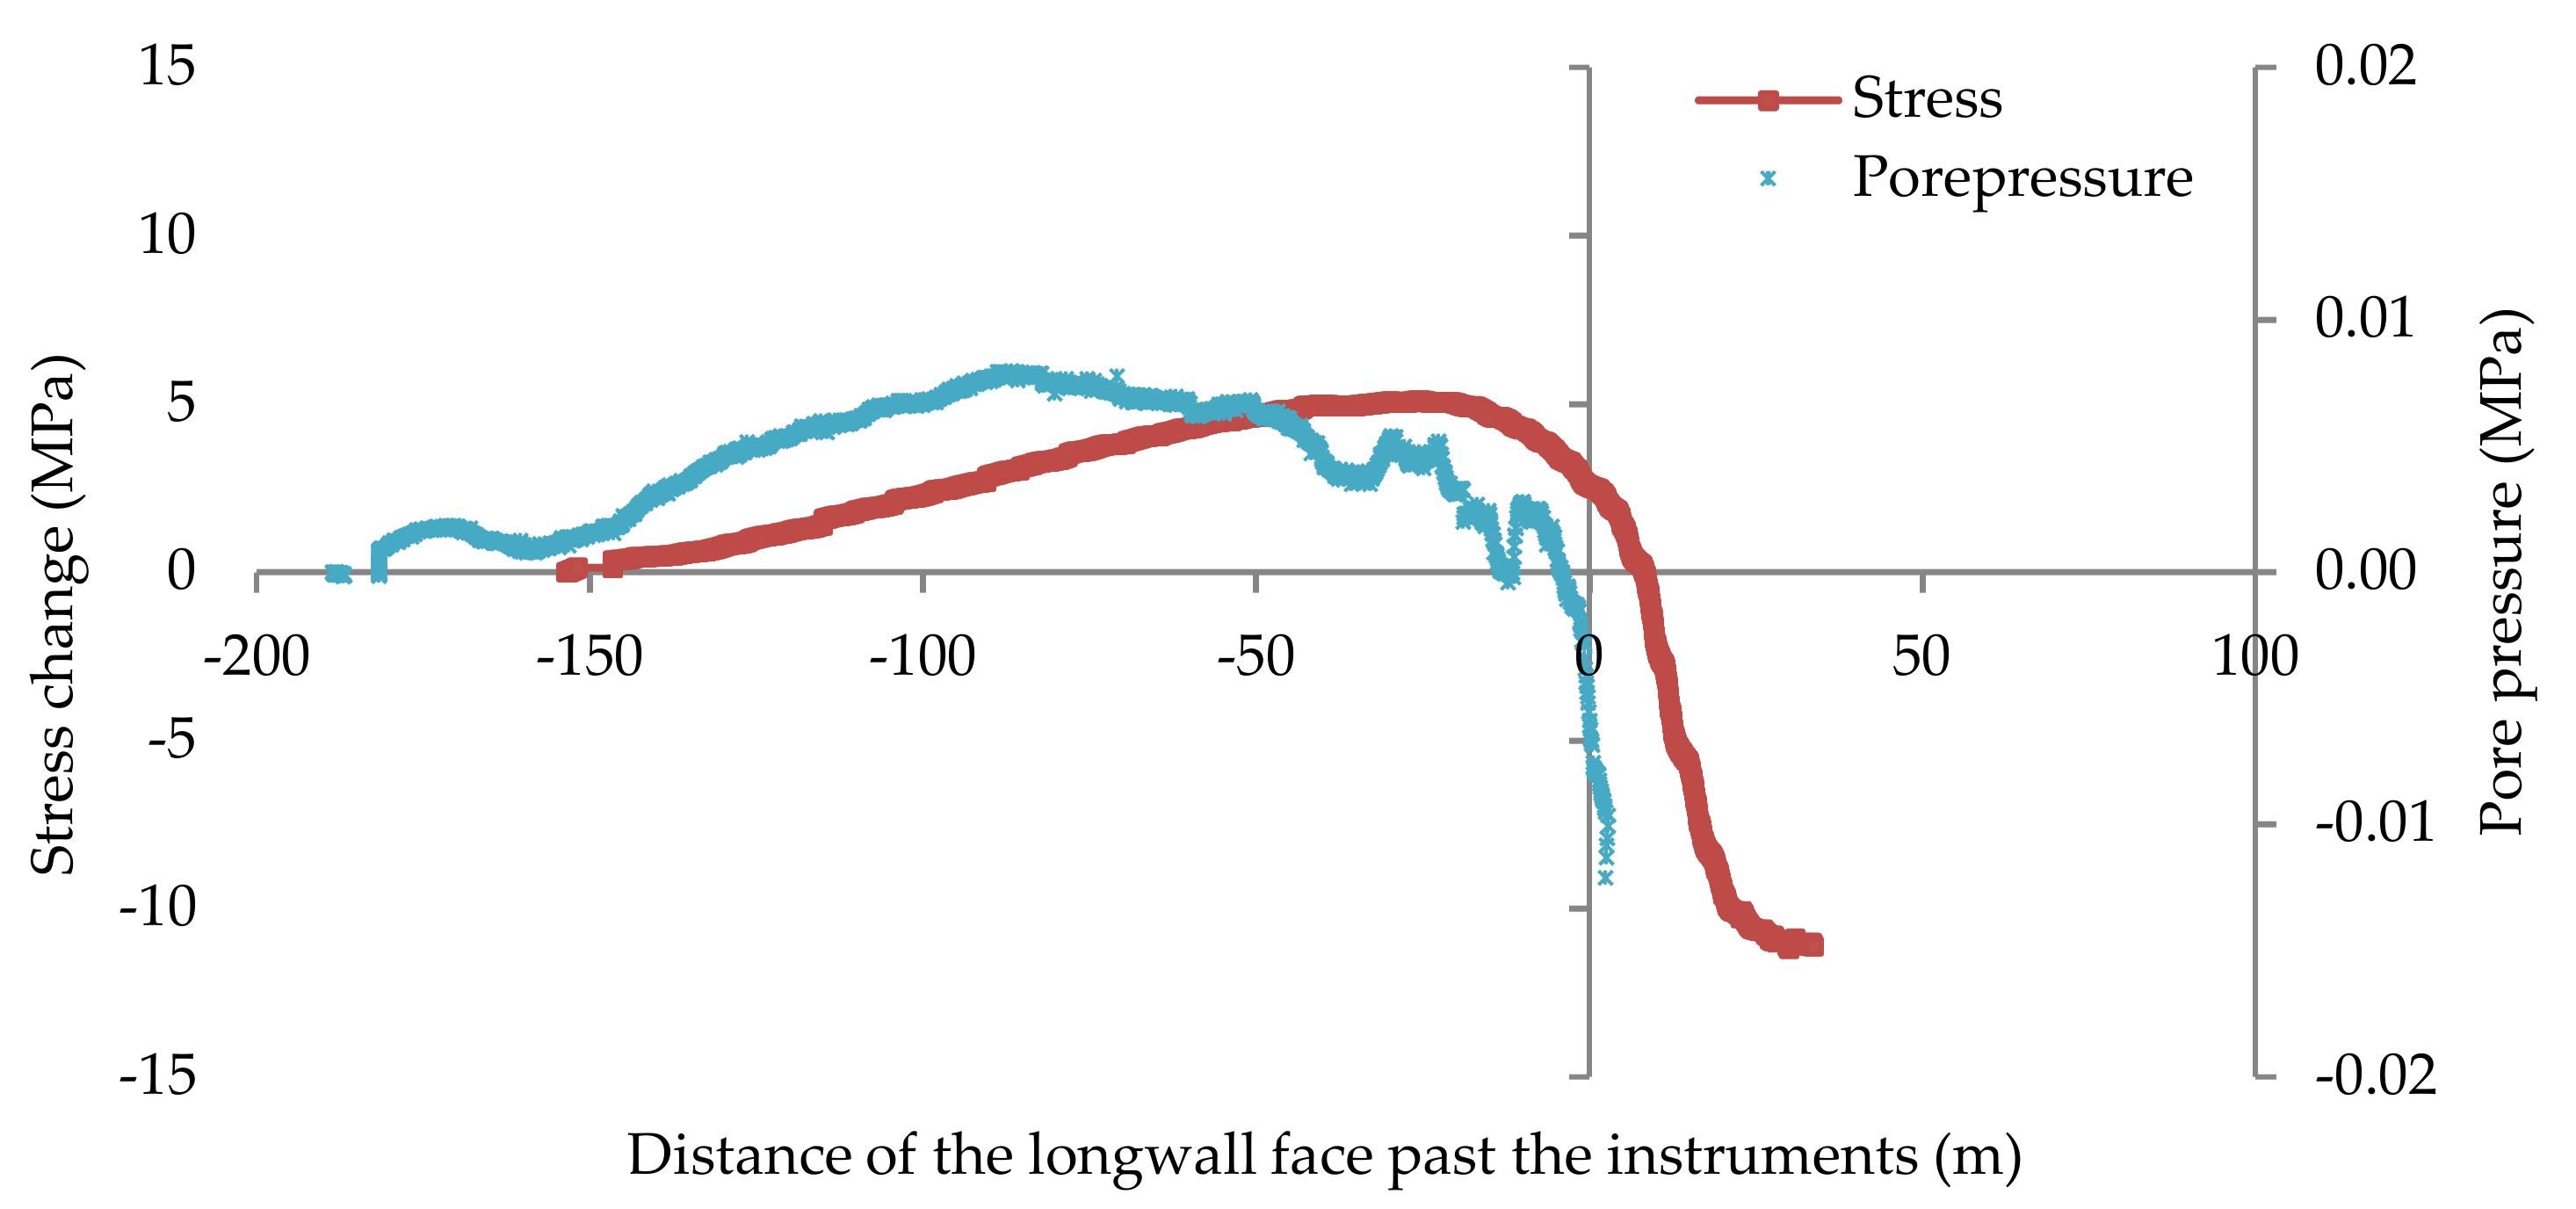
Figure 11.
Stress, displacement and pore pressure changes in different regions in the studied longwall panels.
Figure 11.
Stress, displacement and pore pressure changes in different regions in the studied longwall panels.

Table 1.
Installed instruments in roadways surrounding LW 5121(5) and LW 5111(0).
| Longwall | Installation Roadway | Installed Instruments | Instruments Depths or Depth Range |
|---|---|---|---|
| LW 5121(5) | Longwall belt roadway | 5 extensometers | 1–8 m |
| 9 stressmeters | 1–8 m | ||
| C13 floor roadway (−780 m) | 2 extensometers | 1–21 m | |
| 3 stressmeters | 20 m, 28 m, 30 m | ||
| 10 piezometers | 3–16 m | ||
| C15 roof roadway (−780 m) | 2 stressmeters | 20 m, 21 m | |
| 3 piezometers | 13 m, 23 m, 33 m | ||
| LW 5111(0) | Longwall intake roadway | 5 extensometers | 2–25 m |
| 4 stressmeters | 19–35 m | ||
| B10 floor roadway (−720 m) | 3 extensometers | 2–25 m | |
| 2 stressmeters | 9 m, 10 m | ||
| 2 piezometers | 4–16 m |
Publisher’s Note: MDPI stays neutral with regard to jurisdictional claims in published maps and institutional affiliations. |
© 2022 by the authors. Licensee MDPI, Basel, Switzerland. This article is an open access article distributed under the terms and conditions of the Creative Commons Attribution (CC BY) license (https://creativecommons.org/licenses/by/4.0/).
Share and Cite
MDPI and ACS Style
Qu, Q.; Guo, H.; Yuan, L.; Shen, B.; Yu, G.; Qin, J. Rock Mass and Pore Fluid Response in Deep Mining: A Field Monitoring Study at Inclined Longwalls. Minerals 2022, 12, 463. https://doi.org/10.3390/min12040463
AMA Style
Qu Q, Guo H, Yuan L, Shen B, Yu G, Qin J. Rock Mass and Pore Fluid Response in Deep Mining: A Field Monitoring Study at Inclined Longwalls. Minerals. 2022; 12(4):463. https://doi.org/10.3390/min12040463
Chicago/Turabian StyleQu, Qingdong, Hua Guo, Liang Yuan, Baotang Shen, Guofeng Yu, and Johnny Qin. 2022. "Rock Mass and Pore Fluid Response in Deep Mining: A Field Monitoring Study at Inclined Longwalls" Minerals 12, no. 4: 463. https://doi.org/10.3390/min12040463
Note that from the first issue of 2016, this journal uses article numbers instead of page numbers. See further details here.