
Application of a Superplasticizer in Scheelite Selective Flotation from Calcite


School of Minerals Processing and Bioengineering, Central South University, Changsha 410083, China
*
Author to whom correspondence should be addressed.
Minerals 2022, 12(4), 483; https://doi.org/10.3390/min12040483
Submission received: 22 March 2022
/
Revised: 11 April 2022
/
Accepted: 12 April 2022
/
Published: 15 April 2022
(This article belongs to the Topic Advances in Separation and Purification Techniques)
Abstract
:The superplasticizer sulfonated acetone formaldehyde condensate (SAF) was first used as a depressant in the selective flotation of scheelite and calcite in this paper. First, single mineral flotation tests were performed to compare the depressing performance of SAF and the traditional depressant water glass. Results showed that both −0.074 + 0.037 mm and −0.037 mm particles could be well treated by SAF with more satisfactory results than that of water glass. Contact angle test results showed that SAF could amplify the wettability difference between scheelite and calcite surfaces. Then, the effect of SAF on the surface electrical properties of scheelite and calcite was studied by zeta-potential tests. SAF could negatively charge the calcite surface before adding the collector and hinder the subsequent adsorption of the collector while having little effect on the scheelite. Moreover, microscopic analysis of slurry suspensions showed that SAF could prevent calcite particles from forming hydrophobic agglomerates to achieve the dispersion of gangue minerals. Finally, the selective adsorption effect of the SAF on the calcite and scheelite surfaces was studied by surface analysis using FTIR (Fourier transform infrared) and XPS (X-ray photoelectron spectroscopy). Results showed that Ca2+ on the calcite surface was the main adsorption site for the chemisorption of sulfonic acid groups in SAF.
1. Introduction
Tungsten is a transition metal element with noticeable physicochemical properties for industrial applications [1,2]. It is the metal with the highest melting point of 3340 °C and lowest thermal dilatation coefficient, which makes it become an excellent refractory material [3]. Notably, tungsten carbide (WC) dominates the industrial applications of tungsten (about 55%) due to its substantial hardness (9 on the Mohs scale) [4].
Scheelite is an important source of tungsten in industry, which is mainly beneficiated by flotation [5,6]. However, the efficient separation of scheelite from its gangue minerals has been beset with difficulties, because of their highly similar surface physicochemical properties in flotation suspension systems [7,8]. Industrially, it is necessary to add water glass (sodium silicate as the main ingredient) to depress gangue minerals in flotation [9,10,11,12,13,14].
In recent years, the research and applications of organic depressants of calcium-containing minerals have been widely reported [15,16]. Jiao et al. studied the effect of polymer polysaccharide pectin in the separation of scheelite and calcite [17]. At pH values of 7–9, pectin could strongly depress calcite but has little depressive effect on scheelite. Pectin exhibited selective adsorption on the surface of calcite through the interaction of carboxyl groups in the molecule with Ca species on the calcite surface. Dong et al. verified that xanthan gum could selectively adsorb on the calcite during the flotation process, and prevented the collector from interacting with the calcite surface [18]. In the research of Chen et al., dextran sulfate sodium was used as a depressant to achieve selective flotation of scheelite from calcite and fluorite in a sodium oleate system [19].
The above studies showed that organic depressants always chemically reacted with the surface of gangue minerals and hindered the interaction of collectors and the mineral surface, relying on the characteristic functional groups in the molecules (such as hydroxyl, carboxyl, phosphate, and sulfonic acid groups) [20,21]. Similar to these depressants, superplasticizers in the concrete industry have these functional groups as well. Figure 1 shows the chemical structure of the superplasticizer sulfonated acetone formaldehyde condensate (SAF), an anionic linear polymer, with a molecular weight of 4000–10,000, formed by the polycondensation of sulfonated acetone and formaldehyde. Numerous studies had shown that superplasticizers could greatly improve the wettability of silicate and carbonate minerals, which made them become a potential depressant in flotation [22,23]. Moreover, SAF has proven to be an excellent dispersant in CWS (coal water slurry) preparation. Zhou et al. found that SAF could significantly optimize the surface physicochemical characteristic of coal particles and provide satisfactory properties of CWS, such as good stability for storage and low viscosity for transportation and combustion [24,25]. Good pulp dispersion was also critical for flotation.
In this paper, the superplasticizer SAF was used as a depressant in the flotation separation of scheelite from calcite. Single mineral flotation tests were performed to compare the depressing performance of SAF and the traditional depressant water glass. Zeta-potential tests and contact angle tests were conducted to investigate the effect of SAF on the surface electrical properties and wettability of scheelite and calcite. Micrographs of the mineral suspension were taken to study the effect of the depressant SAF and collector NaOL on mineral dispersion and aggregation during flotation. Finally, the adsorption mechanism of the depressant on calcite and scheelite surfaces was investigated by FTIR (Fourier transform infrared) and XPS (X-ray photoelectron spectroscopy) spectra analysis.
2. Materials and Method
2.1. Samples
Well-crystallized scheelite and calcite crystals were obtained from Yaoxiangang Tungsten Mine (Hunan, China) and Bamian Mountain Fluorite Mine (Zhejiang, China), respectively. Chunks of ore were broken by a hammer and then purified by hand selection. The purity of the samples was characterized by XRD and chemical analysis. As shown in Table 1, 95% purity of the samples was achieved as the chemical content of WO3 and CaCO3 in scheelite and calcite samples were 79.50% and 97.41%, respectively. In addition, there were no characteristic peaks of other minerals in the XRD pattern of the sample (Figure 2), which proved the high purity of the samples as well. Samples were crushed and sieved for tests in this investigation as the following two size fractions: −0.074 + 0.037 mm and −0.037 mm.
2.2. Chemicals
The effect of sulfonated acetone formaldehyde condensate (SAF) on the selective flotation of scheelite from calcite is investigated in this study. Figure 3 shows the IR spectra of SAF (industrial grade with purity higher than 90%). The characteristic peak at 3470 cm−1 is the stretching vibration absorption peak of O-H. The peaks at 2864 cm−1 and 2936 cm−1 are attributed to the symmetric and asymmetric stretching vibration of H-C-H. The absorption peaks due to the stretching vibration and out-of-plane bending vibration of C=O are found at 1615 cm−1 and 613 cm−1, respectively. The peaks at 1184 cm−1 and 1043 cm−1 belong to the asymmetric stretching vibration of −SO3− and S=O, and the absorption peaks of C-O-C are at this wave number as well. The other two peaks at 753 cm−1 and 650 cm−1 are attributed to the stretching vibration of C-S and S-O [26,27].
During the tests, NaOH and HCl solution with a concentration of 2% were used as the pH regulator. Sodium oleate (NaOL, >97% purity) was chosen as the collector. Industrial grade water glass was used as a depressant in the flotation test and its depressing effect was compared with that of SAF. Deionized water (DI water) with a resistivity of 18.2 MΩ·cm was used in the whole test described in this paper.
2.3. Method
2.3.1. Single Mineral Flotation Tests
The depressing performance of SAF and water glass on scheelite and calcite in the NaOL flotation system was studied by a series of single flotation tests in an XFG-CII flotation machine with an effective volume of 40 cm3. The flotation process was shown in Figure 4. The pulp system with 2 g mineral samples and 35 mL DI water was agitated at the rate of 1800 rpm. Based on our exploring test, the pH was regulated at about 9. Then, the depressant water glass or SAF with the desired concentration was introduced into the suspension. Three minutes later, the collector NaOL was added with 3 min stirring. It took 3 min to collect the concentrates (froth product). Finally, the concentrates and tailings were filtered, dried, and weighed respectively to obtain the flotation recovery.
2.3.2. Contact Angle Tests
The contact angle of scheelite and calcite surfaces treated with different dosages of SAF and NaOL were measured by the Mini-Lab ILMS contact angle analyzer (GBX Corporation, Romans-sur-Isère, France). The mineral crystals were cut into 2 cm × 2 cm flakes using a slicing machine to obtain fresh cleavage surfaces. Then the surfaces were polished with 2.6 μm sandpaper. In the case of the surfaces treated with the reagents, the samples were immersed in the desired concentration of SAF or NaOL solution for 10 min, respectively, and then dried naturally in the N2 gas atmosphere before being tested.
2.3.3. Zeta-Potential Tests
The effect of SAF on the surface electrical properties of scheelite and calcite was compared and analyzed by surface zeta-potential measurement. First, mineral particles were ground to −5 μm in an agate mortar. In each test, 20 mg samples were conditioned with different concentrations of SAF in a 50 mL potassium nitrate solution background (0.01 M) at the flotation pH (9 ± 0.1). After 5 min agitation, coarse particles in the suspension were removed by 5 min settling. The supernatant liquor was transferred into a ZSP micro-electrophoresis instrument (Malvern Corporation, Malvern, Worcestershire, UK) to be tested. Each experiment was repeated 3 times with good repeatability.
2.3.4. Fourier Transform Infrared (FTIR) Measurements
The FTIR spectra of the depressant SAF and scheelite and calcite reacted with SAF or without SAF were obtained by an IRAffinity-1 FTIR spectrometer. First, the samples of −0.037 mm were ground in an agate mortar for 30 min to obtain the −5 um powders. Second, the suspension of 2 g mineral powder and 35 mL DI water was processed according to the procedure of the single mineral flotation tests until the addition of the depressants. Then, the powder treated with SAF or without SAF was washed 5 times by agitating in 100 mL DI water for 5 min. Afterward, the sample was dried and 0.2 g powder was taken and mixed with 1.8 g potassium bromide (KBr) powder. Finally, pellets of the mixture were built and tested by the FTIR spectrometer.
2.3.5. X-ray Photoelectron Spectroscopy Analysis
The X-ray photoelectron spectra of SAF, scheelite, and calcite surface treated with SAF or untreated with SAF were acquired by an ESCALAB 250Xi X-ray photoelectron spectrometer. Sample preparation is similar to that of the FTIR test. After being treated with SAF or without SAF, the samples were rinsed 5 times with 100 mL DI water and then dried in a vacuum drying oven to be measured.
2.3.6. Microscope Observation Tests
The effect of SAF on particle aggregation and dispersion was investigated using a polarized light microscope (DMLA, Leica, Wetzlar, Germany). Sample preparation was consistent with the flotation process. The suspension in the presence and absence of SAF was diluted 10 times and then transferred to a glass slide by a pipette. After the coverslip is in place, the sample was placed on the microscope stage. At last, the pictures of mineral grains in the suspension could be obtained by the microscope.
3. Results and Discussion
3.1. Single Mineral Flotation Tests
The performance of sulfonated acetone formaldehyde condensate (SAF) and water glass (WG) in the sodium oleate system is compared by a single mineral flotation test in this section. The dosage of collector NaOL is 50 mg/L with the solution pH at 9. Figure 5 presents the effect of two depressants (SAF and WG) on the floatability of scheelite and calcite particles with different size fractions. The indicators of ΔR, the recovery differences between two minerals, are shown in Figure 6.
SAF, as well as water glass, show good performances when dealing with coarse particles of −0.074 + 0.037 mm. From Figure 5a, significant decreases in the flotation recovery of calcite relative to scheelite are observed with an increasing depressant dosage of either SAF or water glass. However, compared with traditional water glass, SAF is more effective to depress calcite. Although the calcite recovery can be reduced to 25.82% with high doses of WG (1800 mg/L), more satisfactory flotation results can be obtained by SAF at only 200–300 mg/L. The recovery differences between scheelite and calcite (ΔR), shown in Figure 6a, can be achieved at approximately 70.00% with 200–300 mg/L SAF, while only 53.12% is obtained by water glass at 1800 mg/L.
It is important to stress that SAF performed surprisingly well when dealing with −0.037 mm samples. As is shown in Figure 5b, the traditional depressant water glass shows poor performance in inhibiting fine calcite particles. When the amount of water glass increases from 0 to 1800 mg/L, the recovery of calcite only drops from 86.17% to 43.67%, at the expense of the recovery of scheelite decreasing by 14.15% as well. The ΔR of only 26.50% (Figure 6b) indicates an inferior efficiency of separation. However, SAF can expand the recovery difference between scheelite and calcite to 41.83% at the dosage of 200 mg/L, relying on the stronger depressant effect of calcite.
3.2. Contact Angle Test
In this section, the wettability deference of the mineral surfaces treated with SAF or without SAF were analyzed in different dosages of NaOL at pH 9. The functional relationships between contact angles of minerals surfaces and collector dosage in the presence and absence of 200 mg/L SAF are shown in Figure 7.
In the absence of SAF, the contact angles of scheelite and calcite surface increase significantly with the increase of the collector dosage and show little difference. This indicates that without depressants, the adsorption of the collectors on the surfaces of the two minerals has no selectivity. Flotation separation of scheelite from the calcite is difficult to achieve. However, things become better as the SAF is introduced. In the presence of SAF, although the contact angles of both scheelite and calcite decreased compared to those without inhibitors, the contact angle of the calcite surface decreases more significantly. The contact angle difference between the two minerals reaches the maximum (34.1°) at the collector dosage of 50 mg/L. The difference gradually decreased with the increase of collector dosage, and almost disappeared when the collector dosage reached 200 mg/L. This indicates that there may be a competitive adsorption relationship between SAF and NaOL on the surface of calcite so that the inhibitory effect of SAF on calcite decreases when the collector concentration becomes higher.
3.3. Zeta-Potential Tests
The main objective of this part is to study the effect of SAF on the surface electrical properties of scheelite and calcite, and then to analyze the effect of SAF on the interaction between collectors and mineral particles. Figure 8 shows the zeta potential as a function of NaOL dosage in the presence and absence of 200 mg/L SAF at pH 9.
Pure scheelite with an isoelectric point (IEP) of about 9 is shown in Figure 8. After the collector with the negative ion group of –COO- is introduced, the surface of scheelite begins to be negatively charged. The zeta potential (ζ) of −40.2 mV for pure scheelite is obtained when the dosage of sodium oleate reaches 200 mg/L, suggesting bulk adsorption of NaOL on the mineral surface. Further, the ζ potential of the scheelite particle treated by SAF decreased by about 10.0 mV relative to the pure crystal in the absence of NaOL, indicating the adsorption of SAF on the surface. However, this adsorption did not appear to affect the subsequent reaction between collectors and the mineral surfaces as the ζ potential still significantly decreased with the increase of NaOL dosage.
It is not the case for calcite. Although significant zeta-potential changes (similar to scheelite) occurred on the pure calcite surfaces as we increased the NaOL dosage, the calcite surface treated by SAF is heavily negatively charged (−33.1 mV) and exhibits a sluggish response to the collector NaOL. Only an 11.1 mV decrease of zeta potential for SAF treated surface is acquired with the increase of collector dosage from 0 to 200 mg/L. It indicates that there is competitive adsorption between SAF and the collector molecules on the surface of calcite, but not on the surface of scheelite, which leads to the selective depression of calcite by SAF.
3.4. FTIR Analysis
Based on the above observations, SAF preferentially adsorbs on the calcite surface and competes with the collector for adsorption. Infrared spectroscopy is employed to analyze the interaction mechanism of the major functional groups in the SAF with the calcite and scheelite surfaces in this section. Figure 9 presents the FTIR spectra of the minerals treated with SAF and without SAF at pH 9.
The infrared spectrum of scheelite (Figure 9a) mainly shows the vibration bands of the [WO4]2− group, where 1250~800 cm−1 and 650~300 cm−1 are attributed to the strong stretching and bending vibration of [WO4]2−, respectively [28]. The infrared spectrum of the scheelite treated with SAF was unchanged compared to that of pure scheelite. This indicates that DI water washing can remove the depressants on the mineral surface during the sample preparation process, that is, SAF cannot be chemically adsorbed on the surface of scheelite.
The peaks observed at 1435, 876, and 712 cm−1 belong to the characteristic peaks of the [CO3]2− group in the pure calcite [29]. After being treated with the depressant SAF, new peaks are observed in the IR spectrum (Figure 9b). The characteristic peak at 3446 cm−1 is attributed to the stretching vibration of O-H. A hypsochromic shift of 24 cm−1, relative to the O-H adsorption peak at SAF (Figure 3), is likely to be caused by the formation of hydrogen bonds between hydroxyl groups in SAF and water molecules adsorbed on mineral surfaces. The other two absorption peaks at 2934 and 2864 cm−1 are assigned to the stretching vibration of H-C-H in SAF. Additionally, the new peak at 672 cm−1 represents the S-O bond of the –SO3− group in SAF. The bathochromic shift of 22 cm−1, compared with the wavenumber of the S-O peak in SAF (Figure 3), is likely to be caused by the inductive effect of cations on mineral surfaces, indicating chemisorption of the depressant on calcite surface.
3.5. X-ray Photoelectron Spectroscopy (XPS) Analysis
XPS analyses were conducted to provide supplemental evidence of the chemical bonding between SAF and species (adsorption sites) on the mineral surface. The relative contents of main elements on two mineral surfaces treated with and without SAF are displayed in Table 2. There are no significant changes in the relative element content on the scheelite surface, as it is treated by SAF. The sulfur element belonging to the SAF molecular does not appear on the scheelite surface which is in accordance with the FTIR analysis. However, the content of sulfur element on the calcite surface is increased from 0 to 0.4%, after the calcite is treated by the depressant SAF, suggesting that the SAF molecules are selectively adsorbed on the calcite surface.
Based on the analyses of the infrared spectra, it is the –SO3− group that interacts with cations on the mineral surface. Therefore, the chemical state of S 2p and Ca 2p are analyzed by high-resolution spectra to give an in-depth understanding of the interaction between SAF and the mineral surface. The S 2p and Ca 2p spectra of scheelite before and after being treated by SAF are shown in Figure 10. Only one chemical state with a binding energy of 168.45 eV (Figure 10a) is observed for the S element in the SAF corresponding to the –SO3− group. Moreover, there is no characteristic peak of S on the mineral surface, regardless of whether the scheelite is treated with SAF or not.
The spin-orbit splitting of Ca 2p peak (Ca 2p3/2 and Ca 2p1/2 components by about 3.55 eV, with an intensity ratio of 2:1) in pure CaWO4 is observed in Figure 10b. Compared with pure scheelite, there are few obvious changes in the Ca 2p signals of the samples treated by SAF, indicating that SAF cannot chemisorb on the scheelite surface. Combined with the results of infrared spectroscopy in Section 3.4, the adsorption of SAF on the scheelite surface can be attributed to physical attraction forces (such as electrostatic attraction).
Similar to scheelite, pure calcite surface is free of sulfur as well (Figure 11a and Table 2). However, the characteristic peak of S 2p is observed at 168.45 eV in the XPS spectrum after SAF reacted with calcite. A binding energy shift of +0.24 eV indicates the formation of new bonds between the −SO3− group and the surface. Further, for Ca2+ on the calcite, peaks of Ca 2p3/2 and Ca 2p1/2 orbital with BEs of 350.58 and 347.02 eV are observed in the Ca 2p spectrum. After the sample was treated by SAF, a BE shift of −0.21 eV is observed, compared to the pure calcite with a higher BE of Ca 2p. This demonstrated that Ca2+ is the main adsorption site for the chemisorption of SAF, and this process is accompanied by the decrease in the electron density of the −SO3− group and the increase of Ca2+. Combined with the results of infrared spectroscopy in Section 3.4, the adsorption mechanism of SAF on the calcite surface becomes clear. The chemical bonds are formed between the −SO3− group in SAF and the Ca2+ on the calcite surface, providing stronger adsorption than that of SAF on the scheelite surface.
3.6. Microscope Analysis
The flotation efficiency is closely related to the dispersion and aggregation of particles in the suspension system. Micrographs of the scheelite suspension in the presence and absence of SAF with 100 mg/L NaOL are shown in Figure 12.
The extended DLVO theory is popular in explaining the dispersion and aggregation behavior of particles in flotation systems [28,29]. In this theory, the total barrier energy (V) of solid particles in the flotation suspension can be expressed in Equation (1).
where VE is the surface energy of the electrostatic double layer, VW represents the London–Van der Waals energy, and VH contains the hydration repulsive energy and hydrophobic attraction energy [30,31]. In the flotation system, the electrostatic force between particles, hydration repulsion force, and hydrophobic attraction force dominate the aggregation and dispersion of particles [32].
Zeta-potential tests in Section 3.2 showed that the zeta potentials of the particles in Figure 12a,b are −30.0 and −37.1 mV, respectively. Both negatively charged surfaces indicate that electrostatic forces on the surfaces of the particles make them repel each other. However, scheelite samples, whether treated with SAF or not, display good aggregation in suspension. This is because the addition of oleic acid reduces the wettability of the mineral surface, and increases the hydrophobic attraction force of scheelite particles, resulting in the formation of hydrophobic aggregates. It further indicated that, for scheelite, the addition of the depressant SAF has little effect on the subsequent adsorption of the collector.
The calcite particles that were not treated with the depressant SAF exhibited similar properties to scheelite. Although the particle surface was strongly negatively charged (Figure 8), the hydrophobic aggregates (shown in Figure 13a) are still formed under the effect of sodium oleate. However, the calcite suspension displays good dispersion properties in the presence of SAF (shown in Figure 13b). This is because SAF hinders the adsorption of collectors on calcite surfaces and increases the wettability of the mineral surface (shown in Section 3.2), which enlarges the hydration repulsion force between calcite particles. Therefore, the particles are dispersed in the pulp under the action of electrostatic and hydration repulsion.
4. Conclusions
This paper introduced sulfonated acetone formaldehyde condensate (SAF), a superplasticizer in the concrete industry, as a potential depressant for scheelite selective flotation from calcite. The performance of this novel depressant and its adsorption mechanism on mineral surfaces were investigated. The main conclusions are as follows.
(a) Single mineral flotation experiments of scheelite and calcite demonstrated that the depressing performance of SAF on calcite is more satisfactory than that of traditional depressant water glass. The recovery differences of scheelite and calcite can be achieved at approximately 70.00% with 200–300 mg/L SAF, while only 53.12% is obtained by water glass at 1800 mg/L.
(b) At 200 mg/L SAF, the surface of the calcite particles is negatively charged and it becomes difficult to interact subsequently with collectors, so that the particles are dispersed in the pulp under the action of electrostatic repulsion. However, scheelite is less affected by SAF. Under the action of collectors, scheelite particles exist in the form of hydrophobic aggregates in the pulp.
(c) It is observed in FTIR and XPS spectra that −SO3− groups in SAF can form chemisorption bonds with Ca2+ on the calcite surface, while it is a physical force that makes SAF adsorb on the scheelite surface.
Author Contributions
Y.W.: conceptualization, methodology, validation. G.P.: data curation, writing—original draft. H.C.: writing—review and editing, validation. D.L.: software. X.Z.: conceptualization, methodology. All authors have read and agreed to the published version of the manuscript.
Funding
This research was funded by the National Natural Science Funds of China (Grant No. 52174267, 52174270), National Key Research and Development Program of China (No. 2021YFC2903202), Independent Exploration and Innovation of Central South University (No. 2020zzts202), Key Laboratory of Comprehensive Utilization of Vanadium and Titanium Resources (No. 2021P4FZG05A), Open Foundation of State Key Laboratory of Mineral Processing, and Center for Clean and Efficient Utilization of Strategic Metal Mineral Resources.
Data Availability Statement
Not applicable.
Conflicts of Interest
The authors declare no conflict of interest.
References
- ITIA. Tungsten Properties. 2017. Available online: https://www.itia.info/tungsten-properties.html (accessed on 28 January 2016).
- Jewell, S.; Kimball, S.M. Mineral Commodity Summaries 2016. pp. 180–181. Available online: https://www.usgs.gov/centers/national-minerals-information-center/mineral-commodity-summaries (accessed on 28 January 2016).
- Yang, X. Beneficiation studies of tungsten ores—A review. Miner. Eng. 2018, 125, 111–119. [Google Scholar] [CrossRef]
- Foucaud, Y.; Filippov, L.; Filippov, I.; Badawi, M. The challenge of tungsten skarn processing by froth flotation: A review. Front. Chem. 2020, 8, 230. [Google Scholar] [CrossRef] [PubMed]
- Kupka, N.; Rudolph, M. Froth flotation of scheelite—A review. Int. J. Min. Sci. Technol. 2018, 28, 373–384. [Google Scholar] [CrossRef]
- Filippov, L.O.; Shokhin, V.N.; Yenbaeva, L.I.; Ignatkina, V.A. Improvement of engineering data for flotation of scheelite using combination of sodium oleate and Exol-B. Tsvetnye Met. 1993, 1, 60–64. [Google Scholar]
- Filippova, I.V.; Filippov, L.O.; Lafhaj, Z.; Barres, O.; Fornasiero, D. Effect of calcium minerals reactivity on fatty acids adsorption and flotation. Colloids Surf. A Physicochem. Eng. Asp. 2018, 545, 157–166. [Google Scholar] [CrossRef]
- Gao, Z.; Li, C.; Sun, W. Anisotropic surface properties of calcite: A consideration of surfacebroken bonds. Colloids Surf. A Physicochem. Eng. Asp. 2017, 520, 53–61. [Google Scholar] [CrossRef]
- Kupka, N.; Rudolph, M. Role of sodium carbonate in scheelite flotation-A multi-faceted reagent. Miner. Eng. 2018, 129, 120–128. [Google Scholar] [CrossRef]
- Feng, B.; Guo, W.; Xu, H.; Peng, J.; Luo, X.; Zhu, X. The combined effect of lead ion and sodiumsilicate in the flotation separation of scheelite from calcite. Sep. Sci. Technol. 2016, 52, 567–573. [Google Scholar] [CrossRef]
- Wei, Z.; Hu, Y.; Han, H.; Sun, W.; Wang, R.; Wang, J. Selective flotation of scheelite from calcite using Al-Na2SiO3 polymer as depressant and Pb-BHA complexes as collector. Miner. Eng. 2018, 120, 29–34. [Google Scholar] [CrossRef]
- Wei, Z.; Hu, Y.; Han, H.; Sun, W.; Wang, R.L.; Sun, W.J.; Wang, J.J.; Gao, Z.Y.; Wang, L.; Zhang, C.Y. Selective Separation of Scheelite from Calcite by Self-Assembly of H2SiO3 Polymer Using Al3+ in Pb-BHA Flotation. Minerals 2019, 9, 43. [Google Scholar] [CrossRef] [Green Version]
- Ilhan, S.; Kalpakli, A.O.; Kahruman, C.; Yusufoglu, I. The investigation of dissolution behavior of gangue materials during the dissolution of scheelite concentrate in oxalic acid solution. Hydrometallurgy 2013, 136, 15–26. [Google Scholar] [CrossRef]
- Dong, L.; Jiao, F.; Qin, W. Effect of acidified water glass on the flotation separation of scheelite from calcite using mixed cationic/anionic collectors. Appl. Surf. Sci. 2018, 444, 747–756. [Google Scholar] [CrossRef]
- Zhang, C.; Sun, W.; Hu, Y. Investigation of two-stage depressing by using hydrophilic polymer to improve the process of fluorite flotation. J. Clean. Prod. 2018, 193, 228–235. [Google Scholar] [CrossRef]
- Oliveira, M.S.; Santana, R.C.; Ataíde, C.H.; Barrozo, M.A. Recovery of apatite from flotation tailings. Sep. Purif. Technol. 2011, 79, 79–84. [Google Scholar] [CrossRef]
- Jiao, F.; Dong, L.; Qin, W.; Liu, W.; Hu, C. Flotation separation of scheelite from calcite using pectin as depressant. Miner. Eng. 2019, 136, 120–128. [Google Scholar] [CrossRef]
- Dong, L.; Jiao, F.; Qin, W.; Liu, W. Selective flotation of scheelite from calcite using xanthan gum as depressant. Miner. Eng. 2019, 138, 14–23. [Google Scholar] [CrossRef]
- Chen, W.; Feng, Q.; Zhang, G.; Yang, Q.; Zhang, C.; Xu, F. The flotation separation of scheelite from calcite and fluorite using dextran sulfate sodium as depressant. Int. J. Miner. Process. 2017, 169, 53–59. [Google Scholar] [CrossRef]
- Chen, W.; Feng, Q.; Zhang, G.; Yang, Q.; Zhang, C. The effect of sodium alginate on the flotation separation of scheelite from calcite and fluorite. Miner. Eng. 2017, 113, 1–7. [Google Scholar] [CrossRef]
- Wang, J.; Bai, J.; Yin, W.; Liang, X. Flotation separation of scheelite from calcite using carboxyl methyl cellulose as depressant. Miner. Eng. 2018, 127, 329–333. [Google Scholar] [CrossRef]
- Zhang, T.; Gao, J.; Deng, X.; Liu, Y. Graft copolymerization of black liquor and sulfonated acetone formaldehyde and research on concrete performance. Constr. Build. Mater. 2015, 83, 308–313. [Google Scholar] [CrossRef]
- Xu, Y.; Hua, M.; Chen, D.; Liu, Z.; Yu, Y.; Zhang, H.; Guo, J. Performance and working mechanism of amphoteric polycarboxylate-based dispersant and sulfonated acetone formaldehyde polycondensate-based dispersant in oil well cement. Constr. Build. Mater. 2020, 233, 117147. [Google Scholar] [CrossRef]
- Zhou, M.; Qiu, X.; Yang, D.; Ouyang, X. Physicochemical Behavior of Sulphonated Acetone-Formaldehyde Resin and Naphthalene Sulfonate-Formaldehyde Condensate in Coal-Water Interface. J. Dispers. Sci. Technol. 2009, 30, 353–360. [Google Scholar] [CrossRef]
- Zhang, G.; Li, J.; Zhu, J.; Qu, Q.; Xiong, W. Syntheses and evaluations of three sulfonated polycondensate dispersants for coal–water slurries. Powder Technol. 2014, 254, 572–578. [Google Scholar] [CrossRef]
- Thongtem, T.; Phuruangrat, A.; Thongtem, S. Haracterization of MeWO4 (Me = Ba, Sr and Ca) nanocrystallines prepared by sonochemical method. Appl. Surf. Sci. 2008, 254, 7581–7585. [Google Scholar] [CrossRef]
- Cheng, Y.L.; Kuz’kin, S.F.; Solynshkin, V.I. Infrared spectra of calcite, scheelite and apatite after treatment with flotation regulators. Izv. Vyssh. Uchebn. Zaved. Tsvetn. Metall. 1963, 6, 28–32. [Google Scholar]
- Yoon, R.H.; Mao, L. Application of extended DLVO theory, IV: Derivation of flotation rate equation from first principles. J. Colloid Interface Sci. 1996, 181, 613–626. [Google Scholar] [CrossRef]
- Ninham, B.W. On progress in forces since the DLVO theory. Adv. Colloid Interface Sci. 1999, 83, 1–17. [Google Scholar] [CrossRef]
- Claesson, P.M.; Blom, C.E.; Herder, P.C.; Ninham, B. Interactions between water–stable hydrophobic Langmuir–Blodgett monolayers on mica. J. Colloid Interface Sci. 1986, 114, 234–242. [Google Scholar] [CrossRef]
- Mishchuk, N.A. The model of hydrophobic attraction in the framework of classical DLVO forces. Adv. Colloid Interface Sci. 2011, 168, 149–166. [Google Scholar] [CrossRef]
- Choi, J.; Choi, S.; Park, K.; Han, Y.; Kim, H. Flotation behaviour of malachite in mono- and di-valent salt solutions using sodium oleate as a collector. Int. J. Miner. Process. 2016, 146, 38–45. [Google Scholar] [CrossRef]
Figure 1.
Chemical structure diagram of sulfonated acetone formaldehyde condensate (SAF).
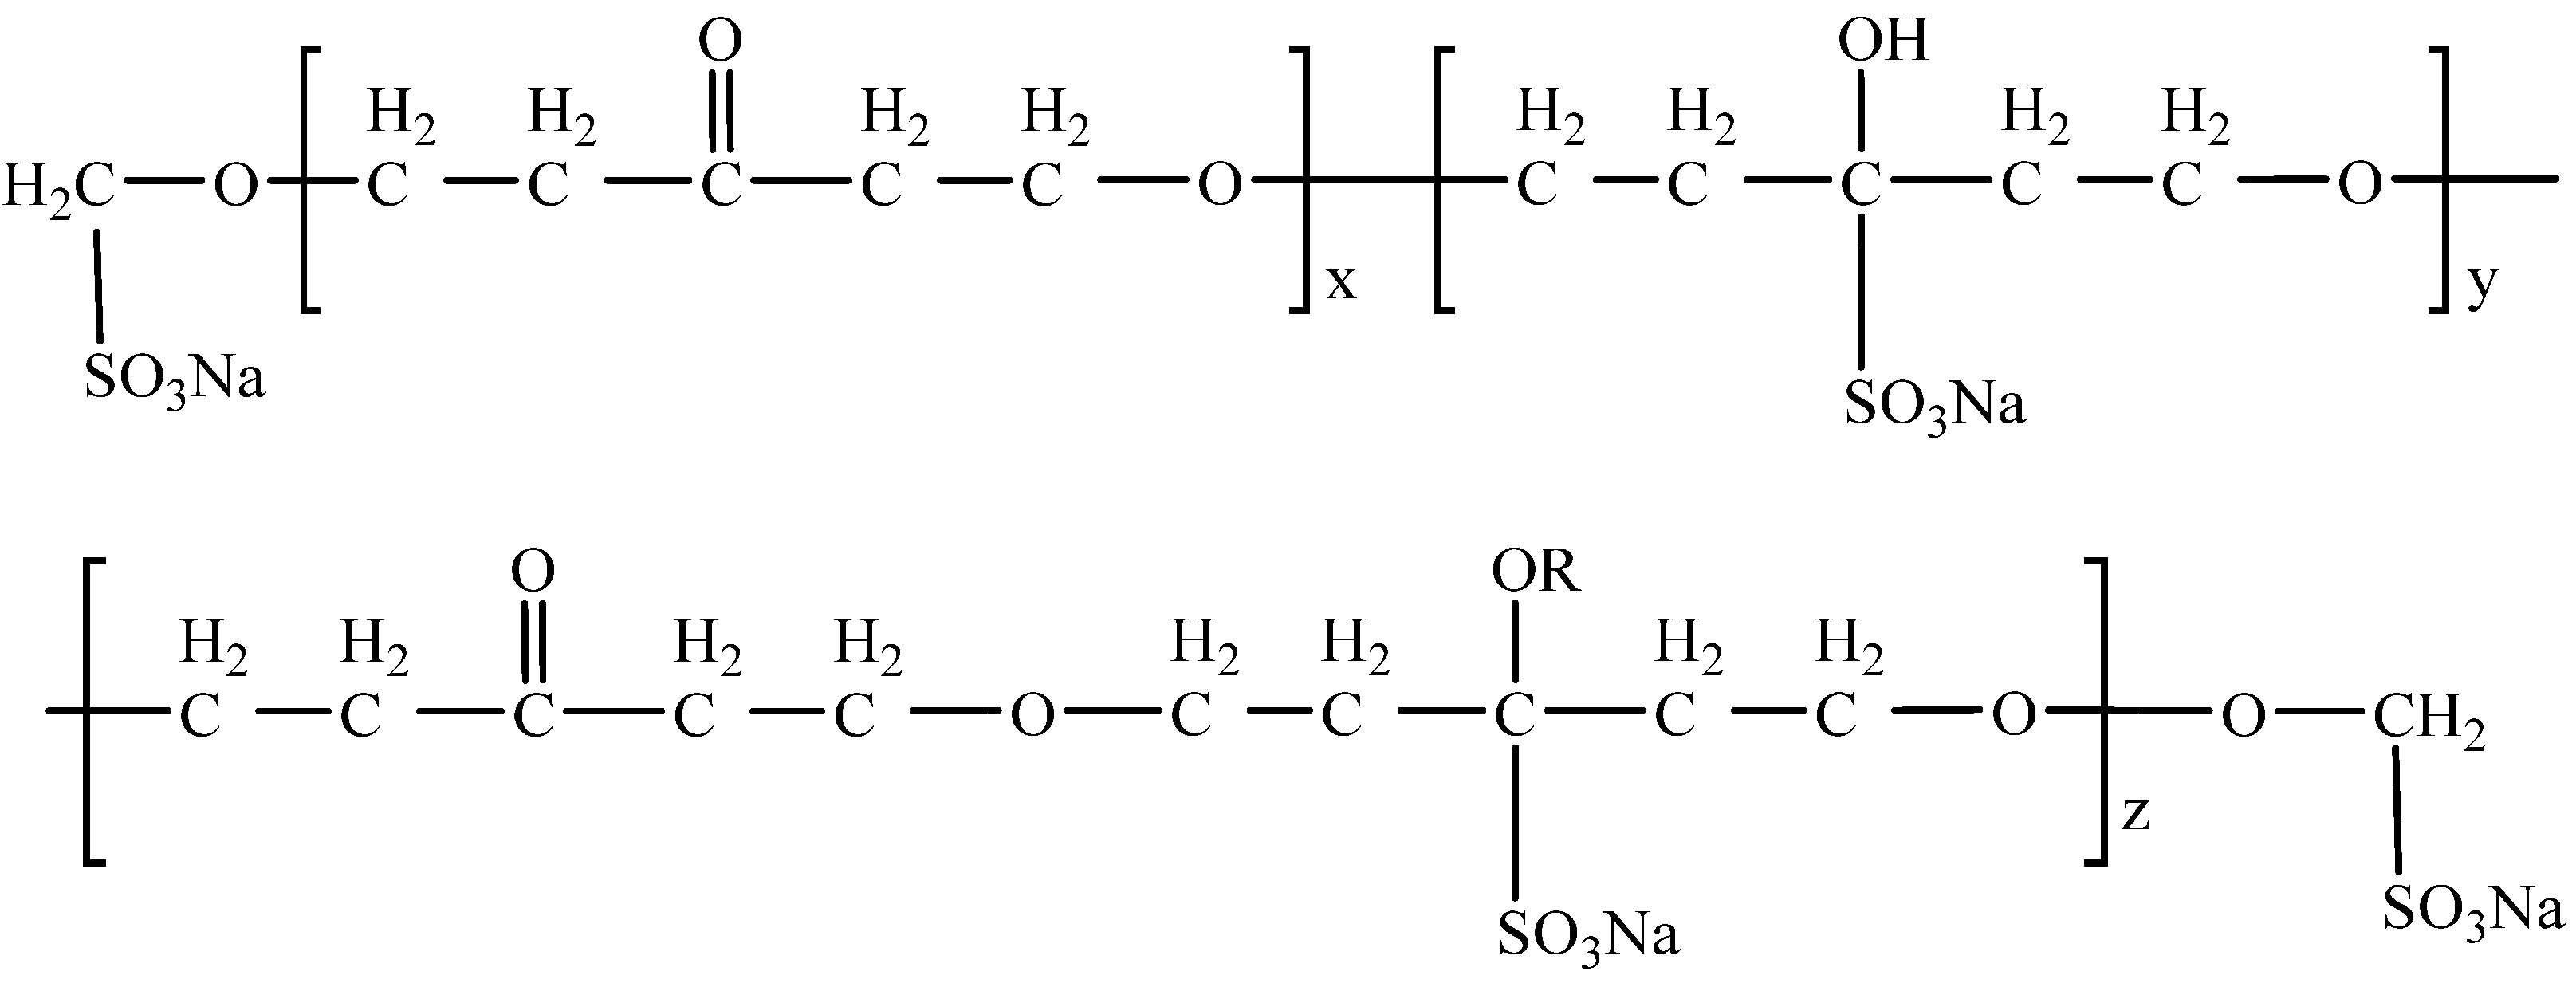
Figure 2.
X-ray diffractometry patterns of (a) scheelite and (b) calcite samples.

Figure 3.
FTIR spectra of the sulfonated acetone formaldehyde condensate (SAF).

Figure 4.
Flowsheet of the single mineral flotation test.
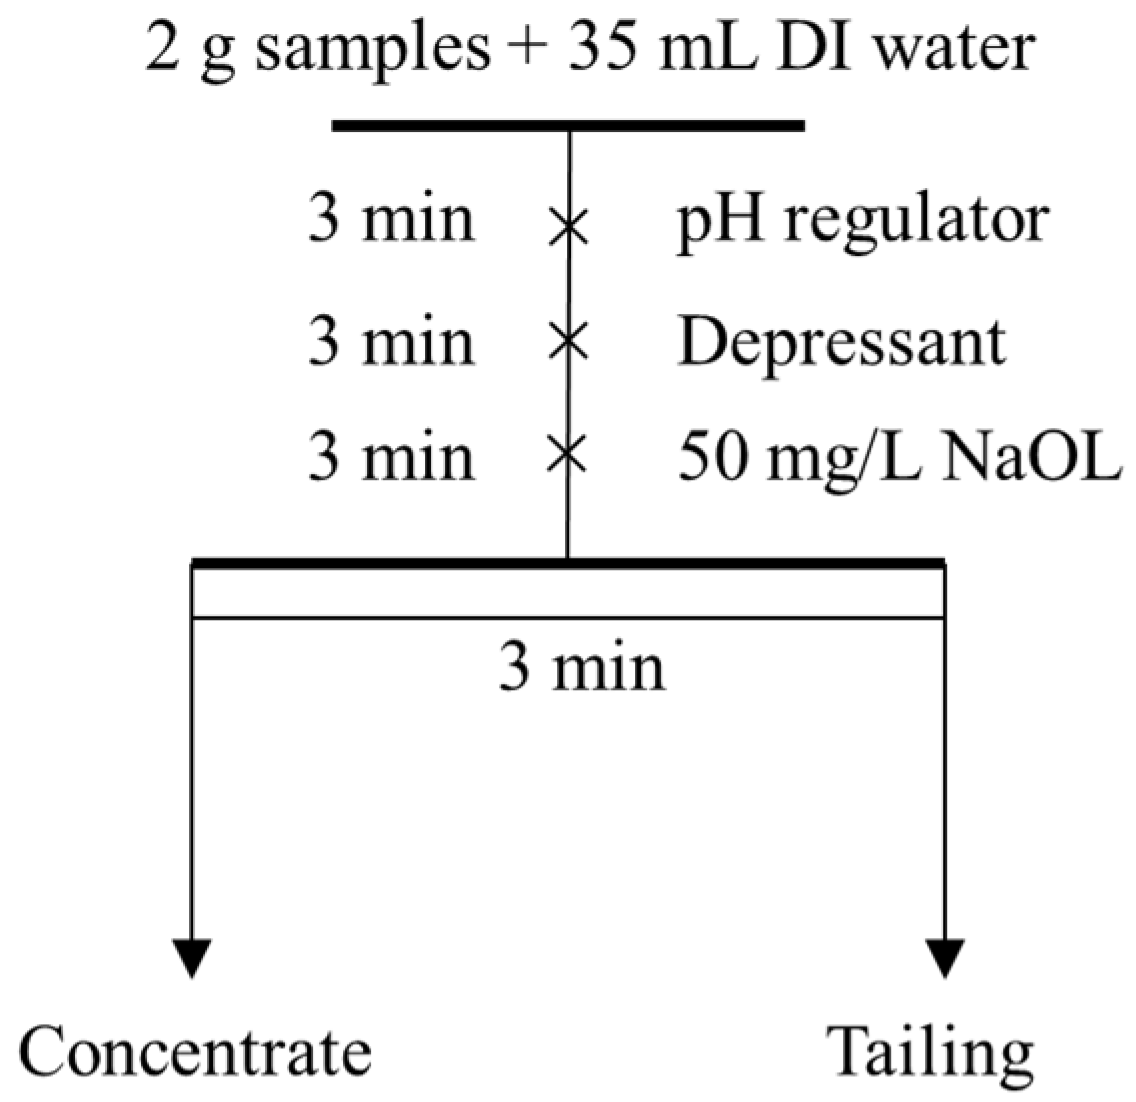
Figure 5.
Recoveries of scheelite and calcite as functions of depressant dosage in the presence of 50 mg/L NaOL at pH 9. (a) −0.074 + 0.037 mm particles, (b) −0.037 mm particles.
Figure 5.
Recoveries of scheelite and calcite as functions of depressant dosage in the presence of 50 mg/L NaOL at pH 9. (a) −0.074 + 0.037 mm particles, (b) −0.037 mm particles.

Figure 6.
Recovery difference of (a) −0.074 + 0.037 mm (b) −0.037 mm particles in different depressant systems with 50 mg/L NaOL at pH 9.
Figure 6.
Recovery difference of (a) −0.074 + 0.037 mm (b) −0.037 mm particles in different depressant systems with 50 mg/L NaOL at pH 9.
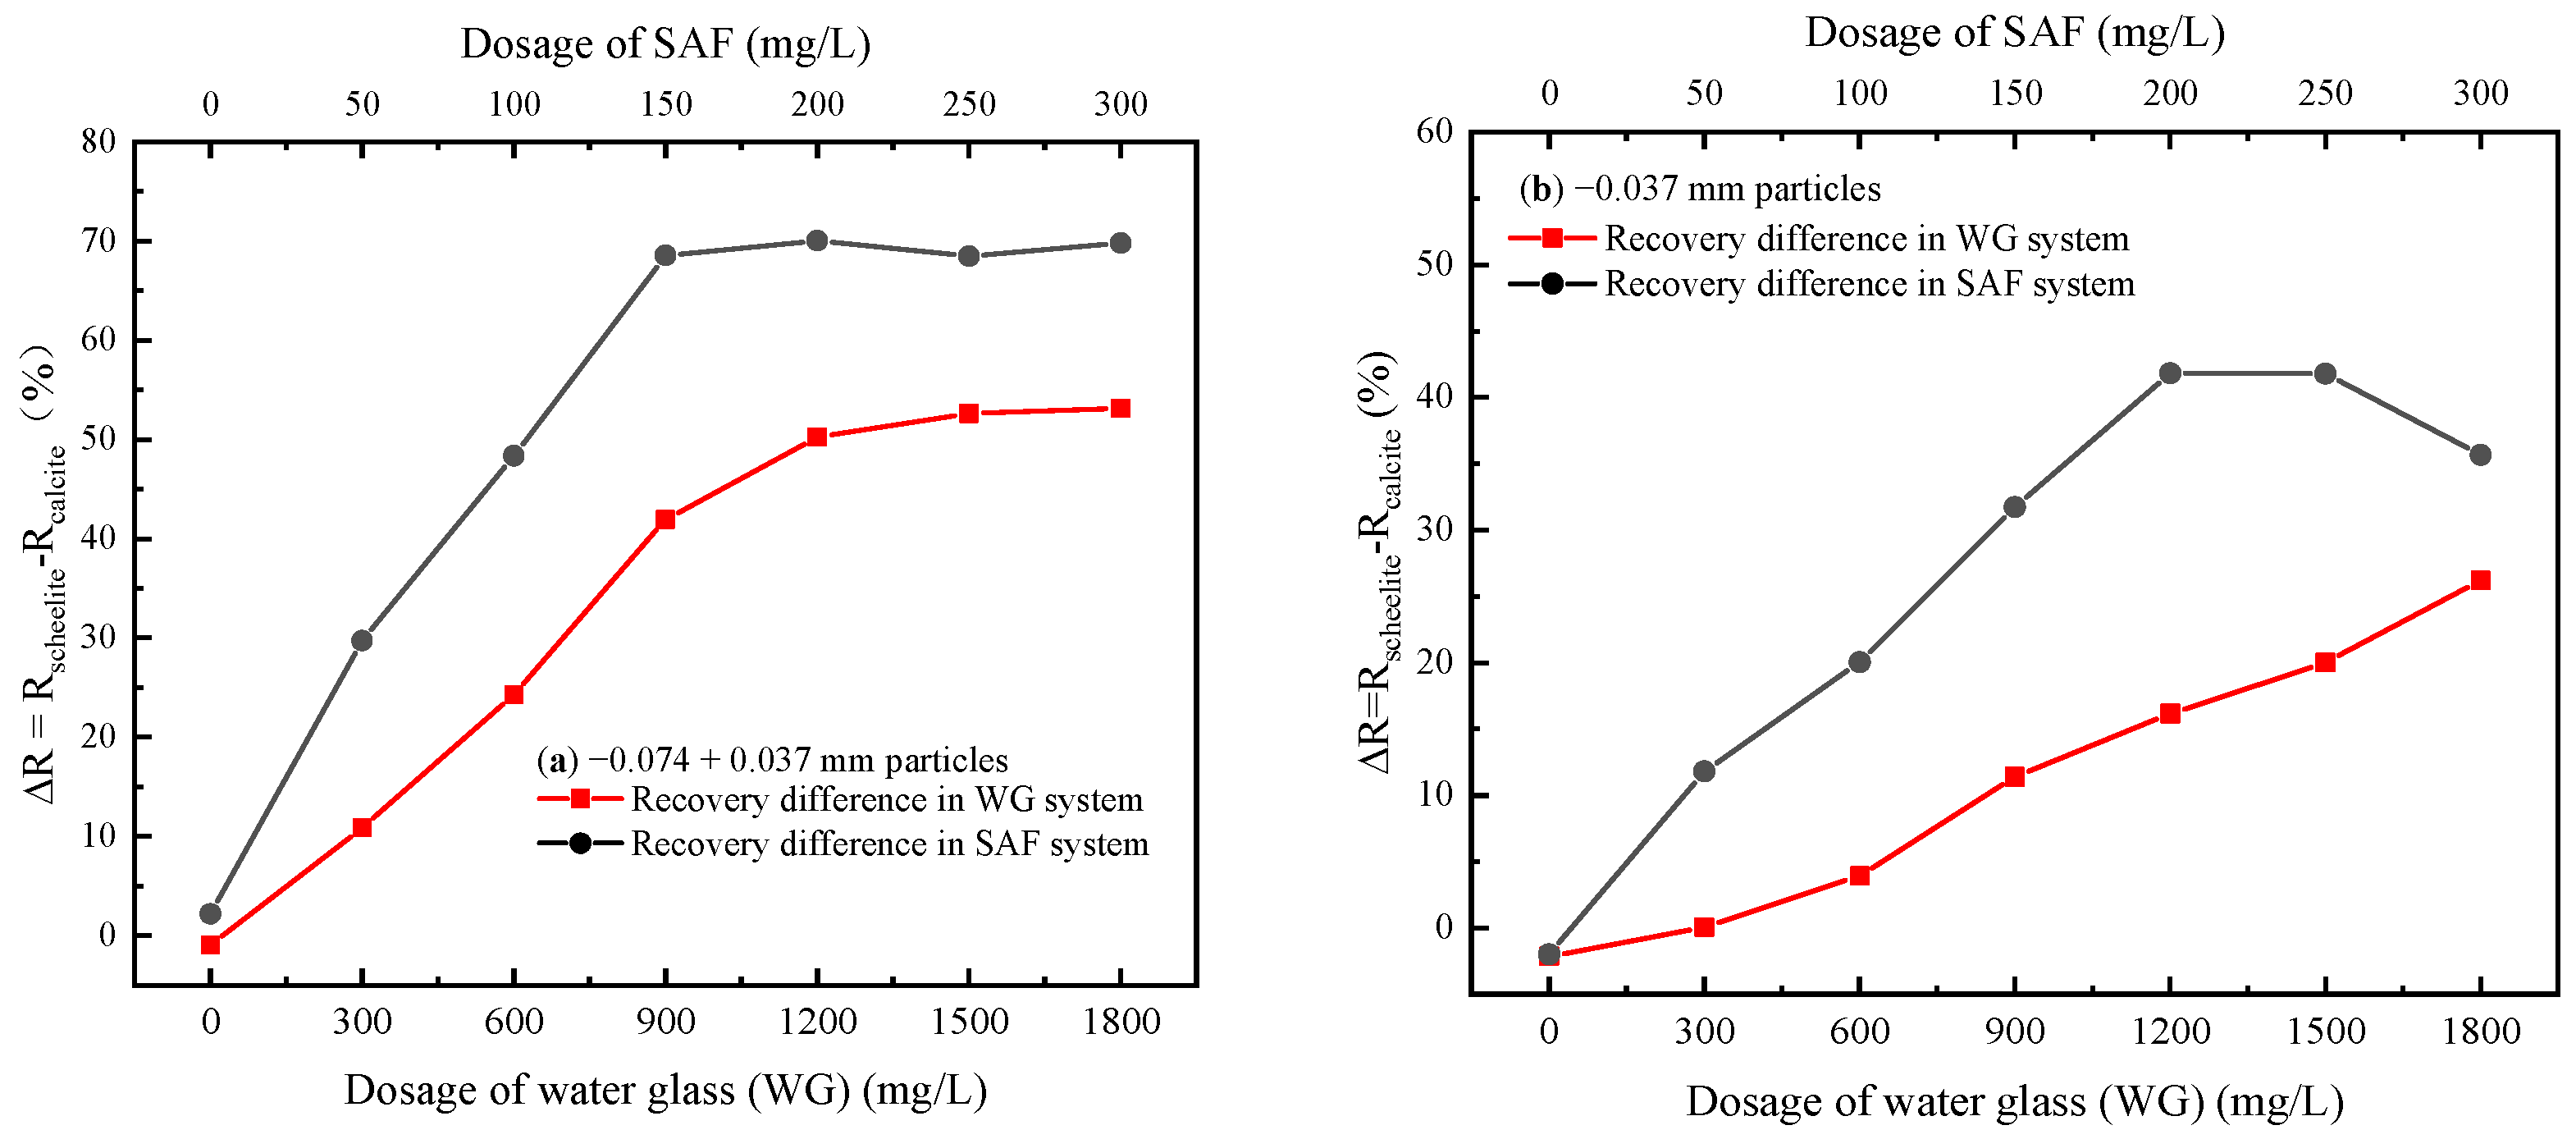
Figure 7.
Contact angle of the mineral surfaces as functions of the sodium oleate dosage in the presence and absence of 200 mg/L SAF at pH 9.
Figure 7.
Contact angle of the mineral surfaces as functions of the sodium oleate dosage in the presence and absence of 200 mg/L SAF at pH 9.

Figure 8.
Zeta potential vs. collector dosage in the presence and absence of 200 mg/L SAF at pH 9.
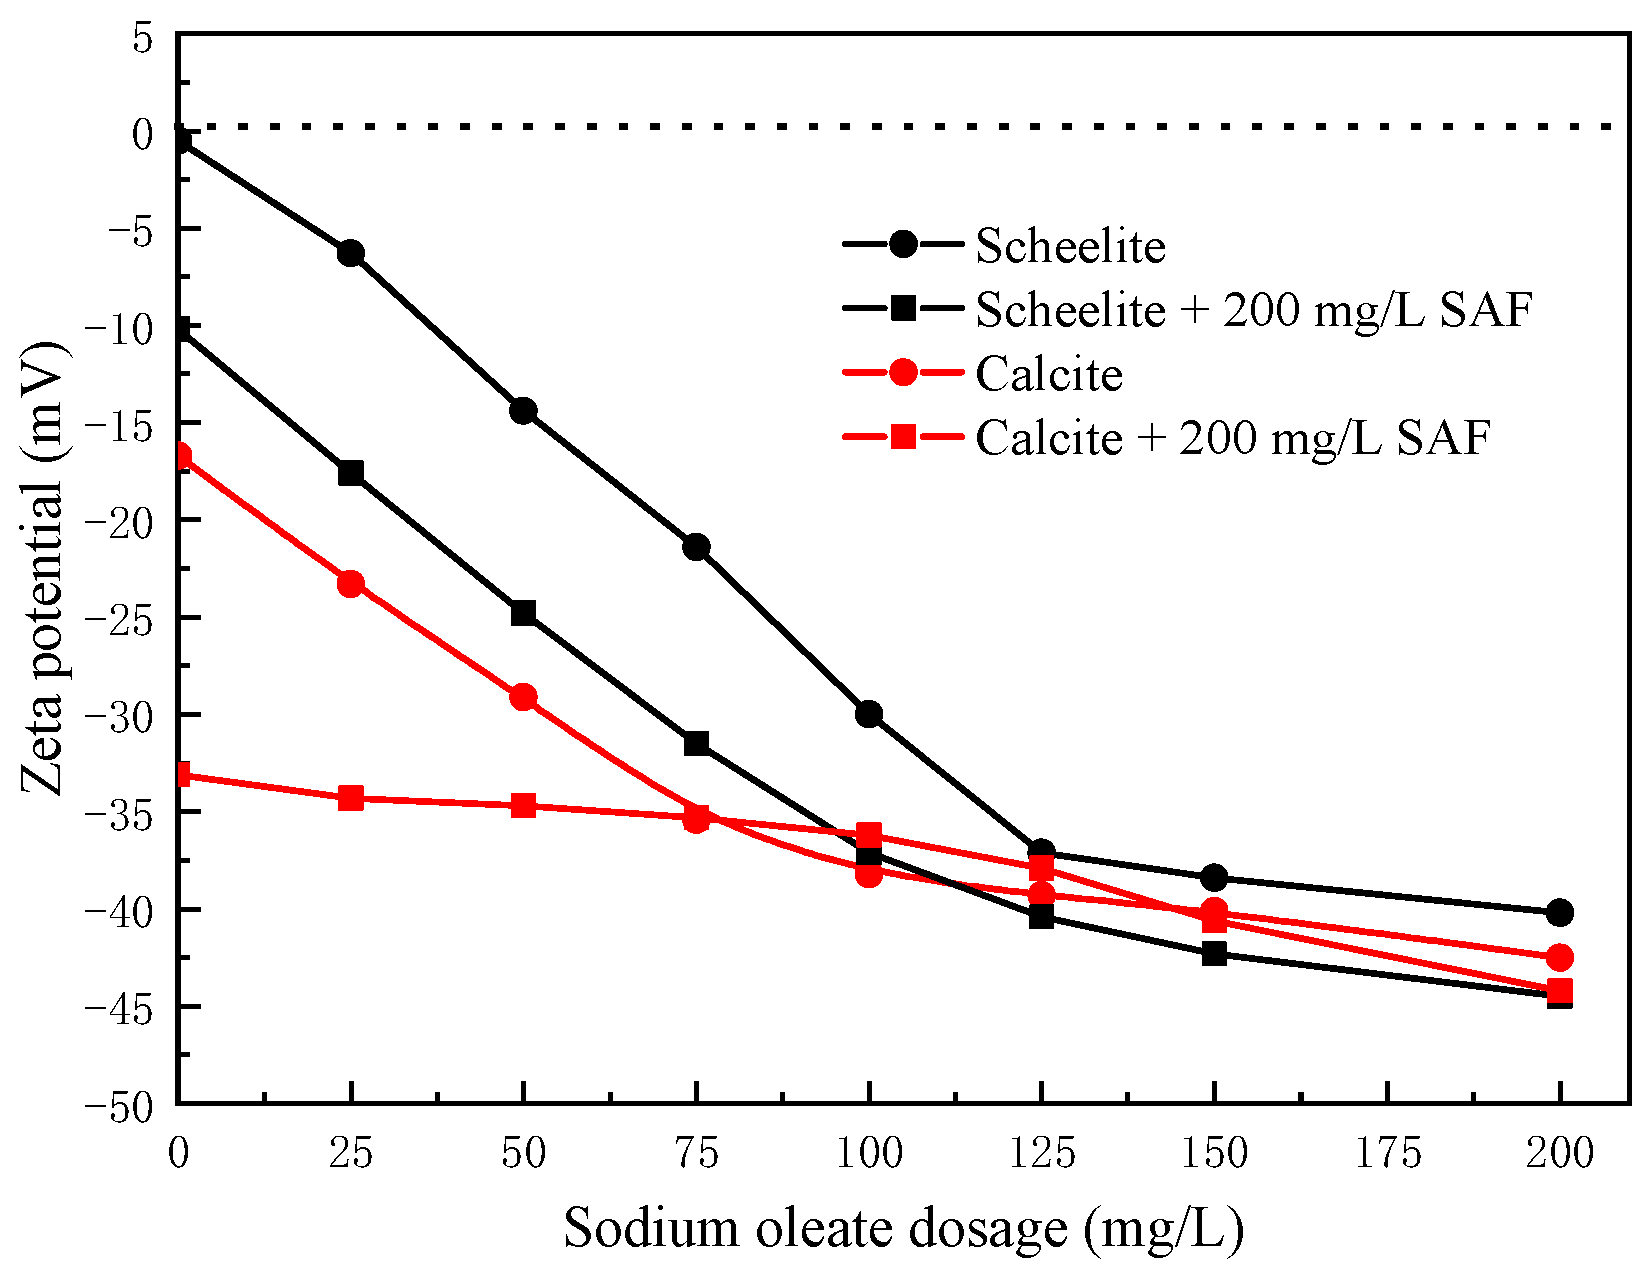
Figure 9.
FTIR spectra of (a) scheelite and (b) calcite treated with and without SAF at pH 9.
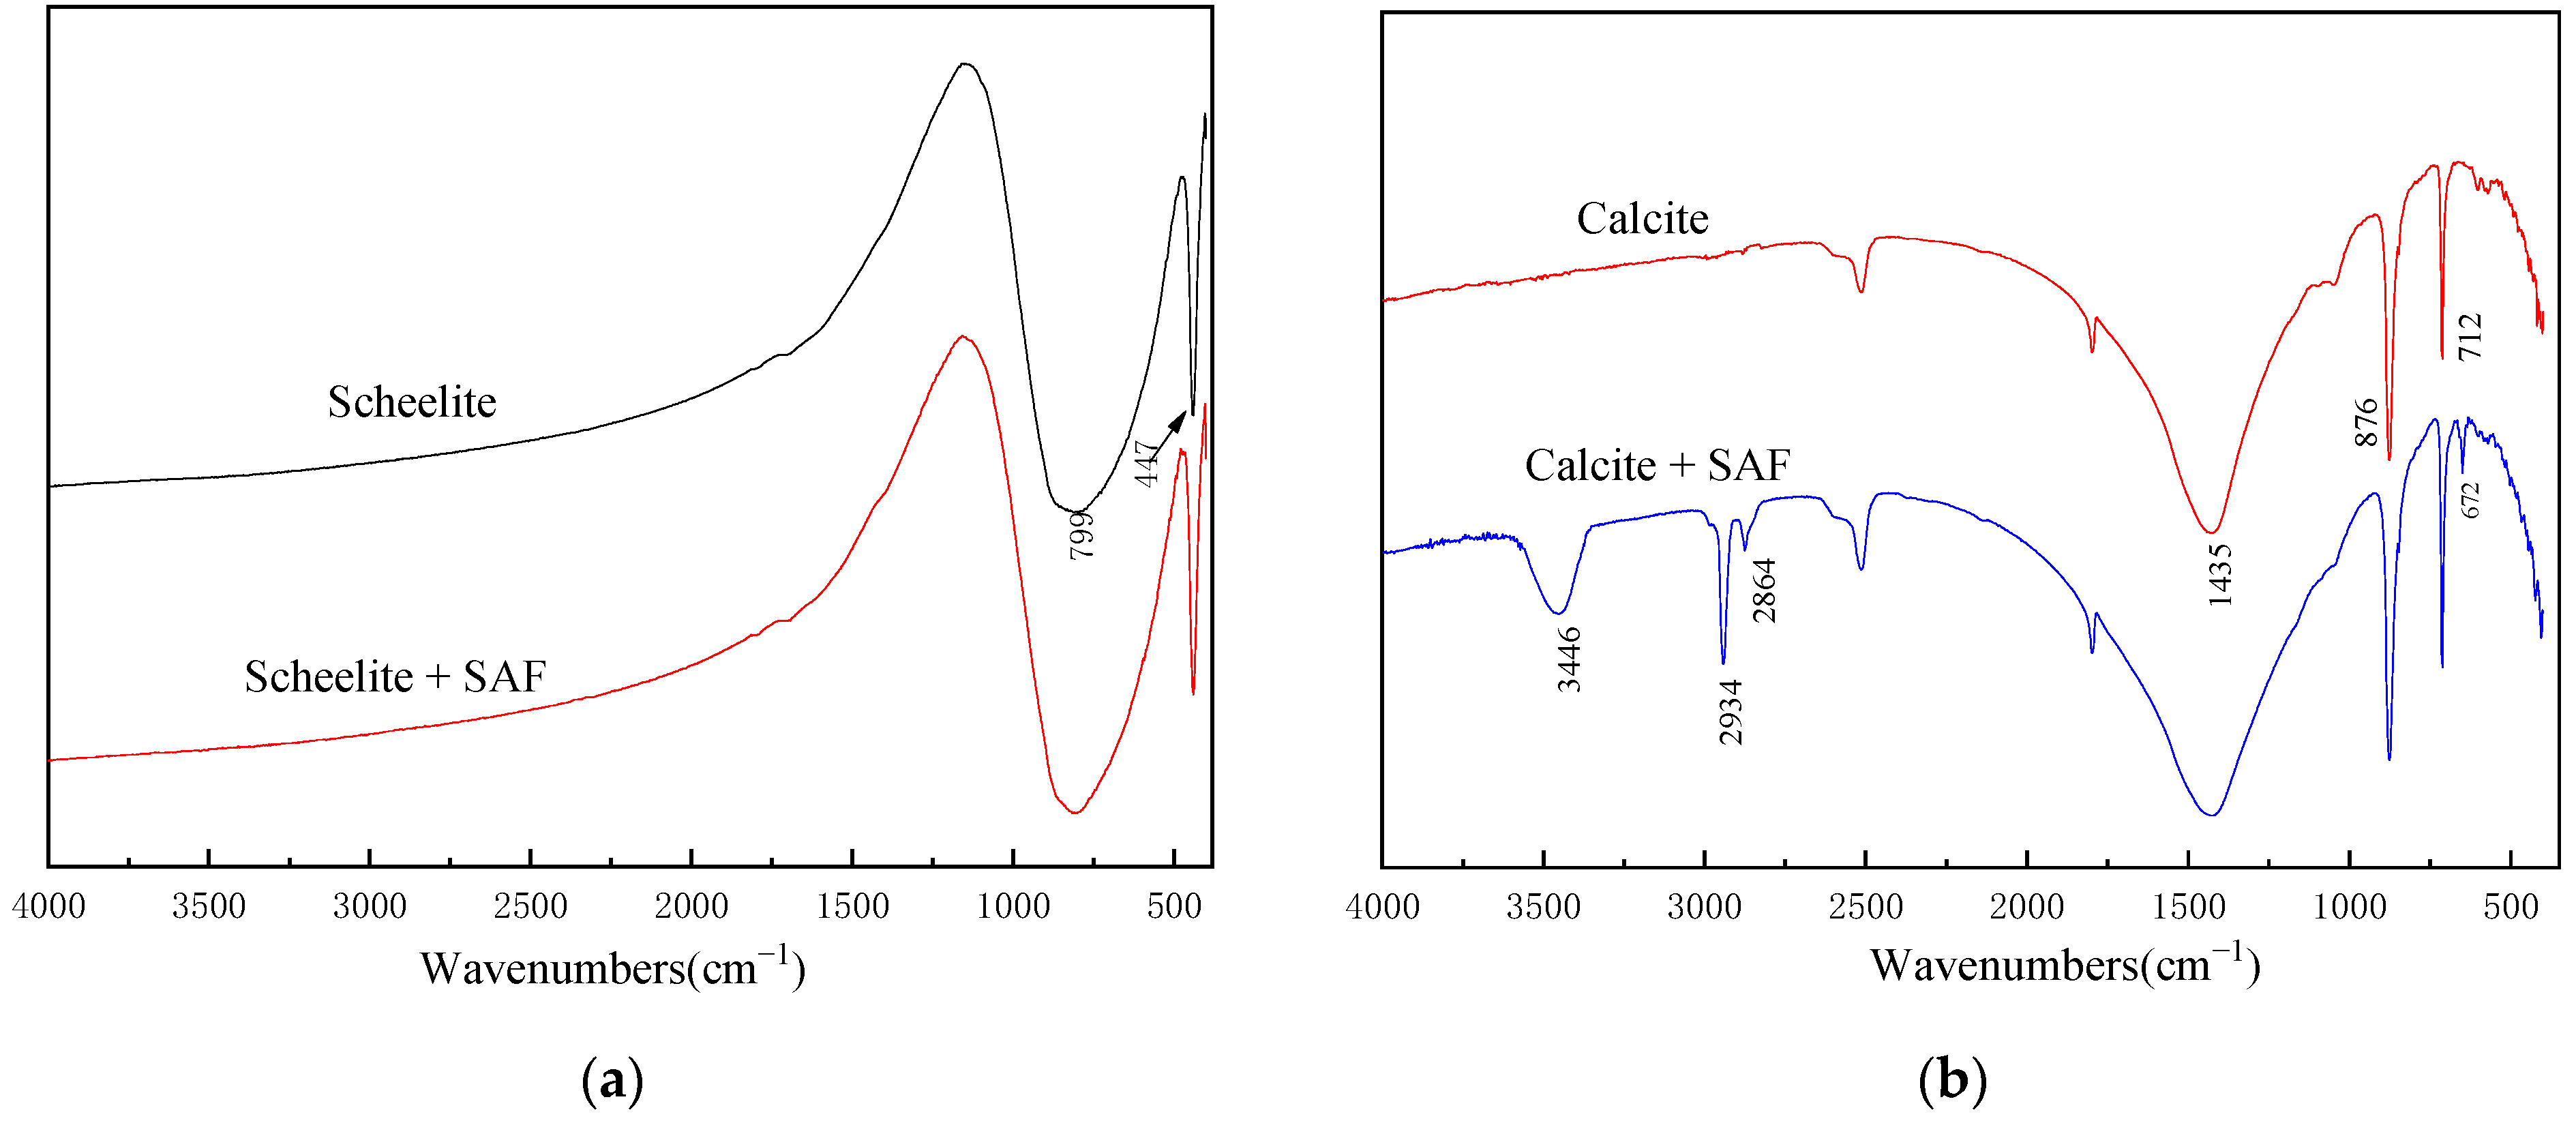
Figure 10.
XPS of (a) S 2p and (b) Ca 2p signal of scheelite treated with and without SAF at pH 9.
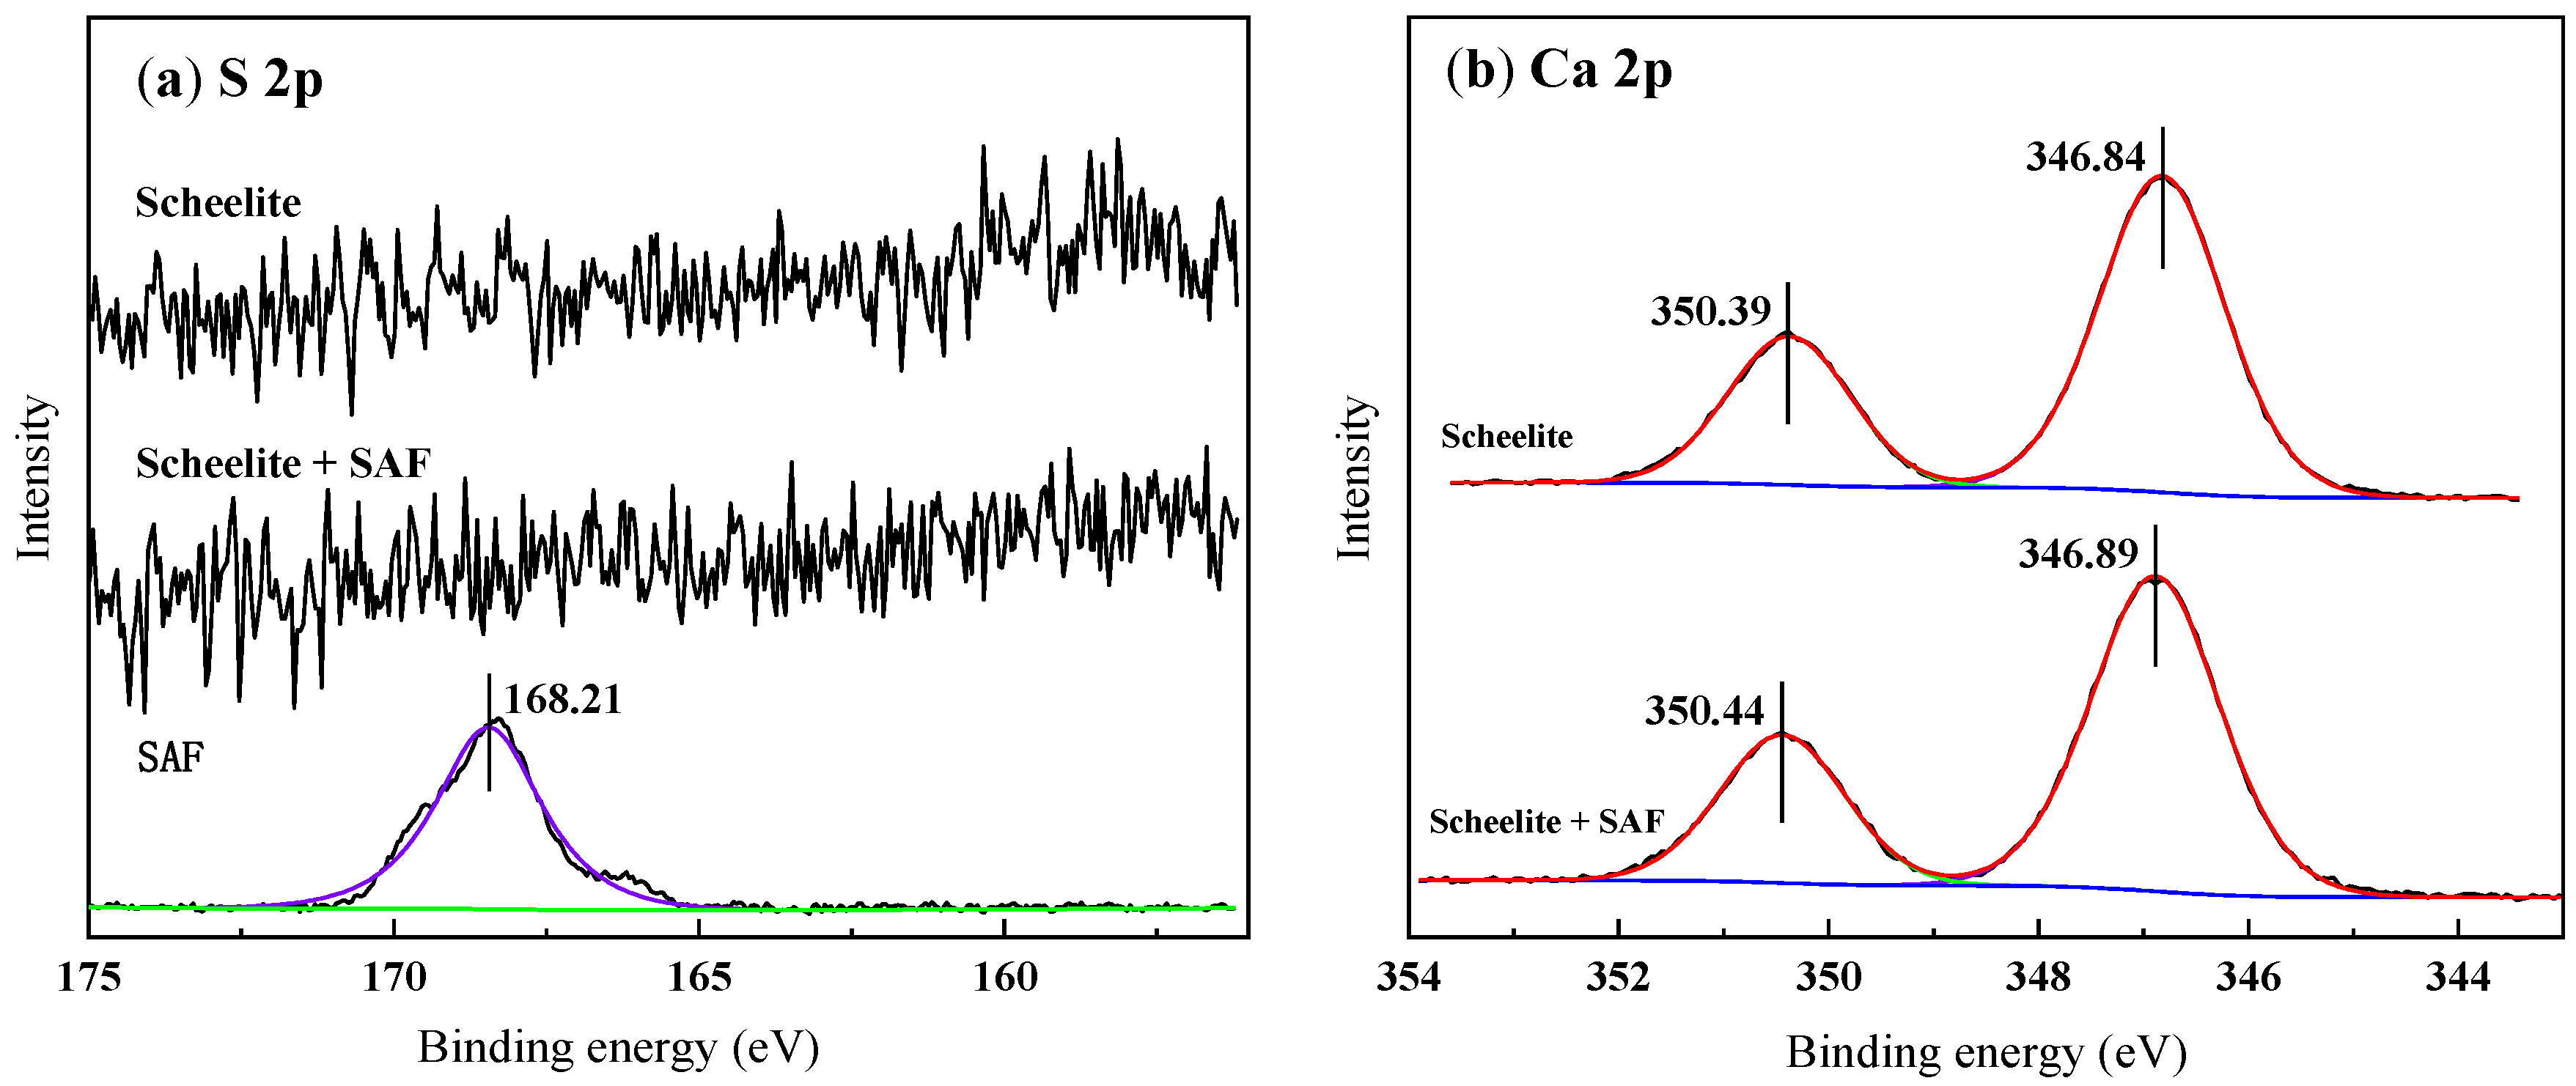
Figure 11.
XPS of (a) S 2p and (b) Ca 2p signal of calcite treated with SAF and without SAF at pH 9.
Figure 11.
XPS of (a) S 2p and (b) Ca 2p signal of calcite treated with SAF and without SAF at pH 9.
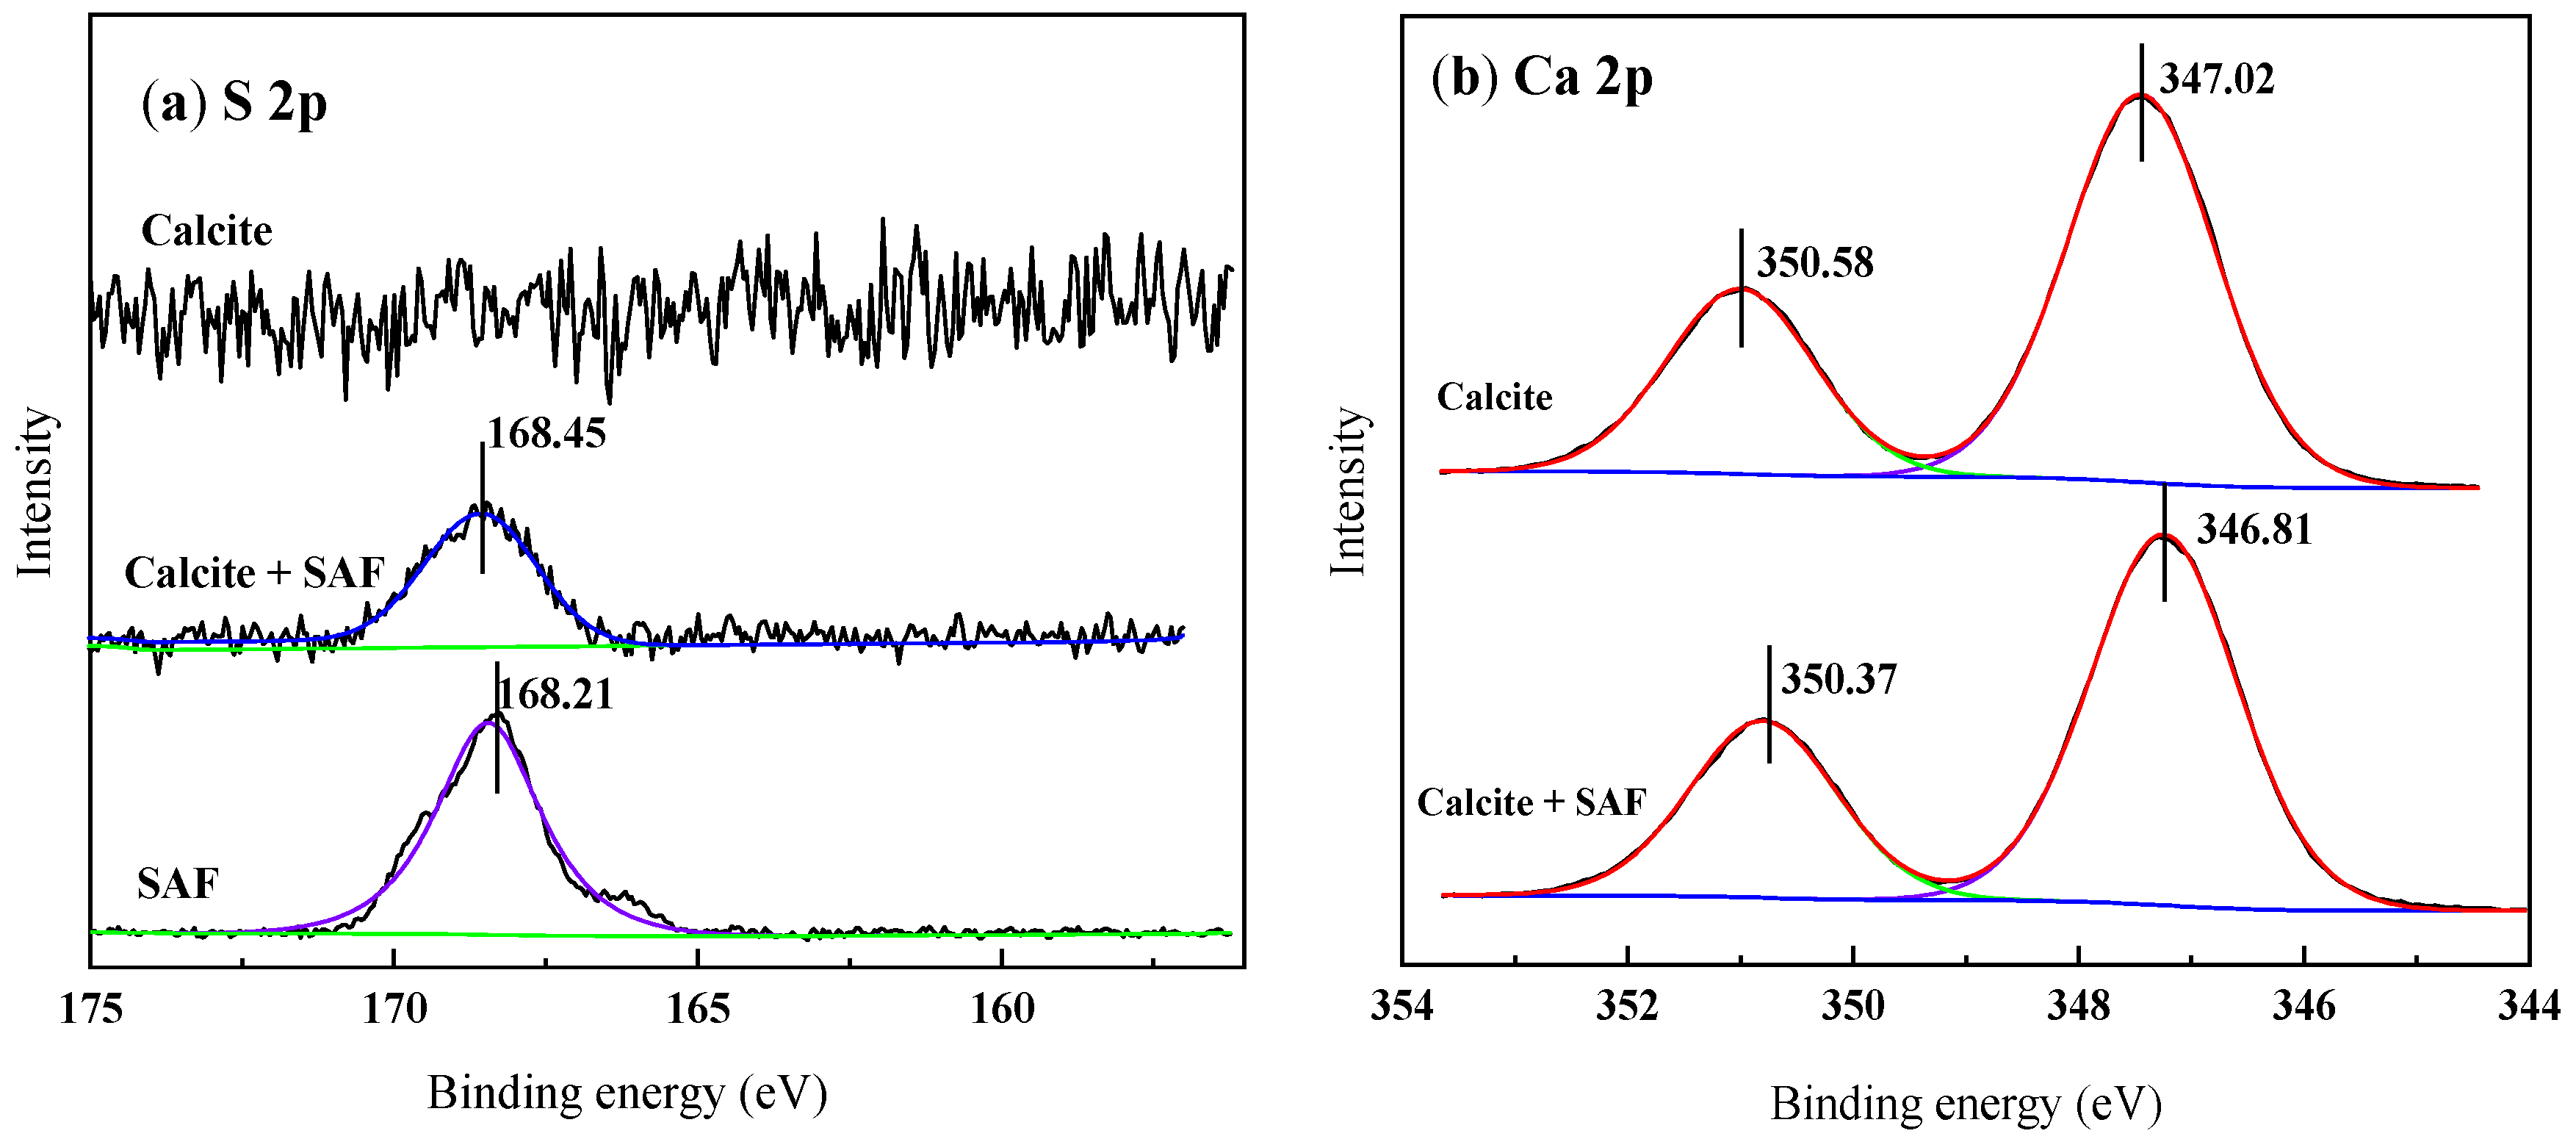
Figure 12.
Micrographs of the scheelite suspension in the presence and absence of SAF at pH 9. (a) scheelite + 100 mg/L NaOL, (b) scheelite + 200 mg/L SAF + 100 mg/L NaOL.
Figure 12.
Micrographs of the scheelite suspension in the presence and absence of SAF at pH 9. (a) scheelite + 100 mg/L NaOL, (b) scheelite + 200 mg/L SAF + 100 mg/L NaOL.

Figure 13.
Micrographs of the calcite suspension in the presence and absence of SAF at pH 9. (a) scheelite + 100 mg/L NaOL, (b) scheelite + 200 mg/L SAF + 100 mg/L NaOL.
Figure 13.
Micrographs of the calcite suspension in the presence and absence of SAF at pH 9. (a) scheelite + 100 mg/L NaOL, (b) scheelite + 200 mg/L SAF + 100 mg/L NaOL.


Table 1.
Chemical content of the scheelite and calcite samples.
| Minerals | Content (%) | ||||||||
|---|---|---|---|---|---|---|---|---|---|
| CaO | WO3 | CaF2 | CaCO3 | P2O5 | Al2O3 | MgO | Fe | SiO2 | |
| Scheelite | 16.74 | 79.50 | — | — | — | — | — | — | 3.76 |
| Calcite | — | — | — | 97.41 | — | — | — | — | 2.59 |
Table 2.
Element concentrations on the scheelite and calcite surface. treated with and without SAF.
| Samples | Element Content (%) | ||||
|---|---|---|---|---|---|
| C 1s | O 1s | S 2p | W 4f | Ca 2p | |
| Scheelite | 27.93 | 45.29 | - | 12.54 | 14.25 |
| Scheelite + SAF | 29.51 | 44.21 | - | 12.40 | 13.88 |
| Calcite | 42.41 | 40.70 | - | - | 16.89 |
| Calcite + SAF | 41.98 | 41.07 | 0.40 | - | 16.55 |
Publisher’s Note: MDPI stays neutral with regard to jurisdictional claims in published maps and institutional affiliations. |
© 2022 by the authors. Licensee MDPI, Basel, Switzerland. This article is an open access article distributed under the terms and conditions of the Creative Commons Attribution (CC BY) license (https://creativecommons.org/licenses/by/4.0/).
Share and Cite
MDPI and ACS Style
Wang, Y.; Pan, G.; Chu, H.; Lu, D.; Zheng, X. Application of a Superplasticizer in Scheelite Selective Flotation from Calcite. Minerals 2022, 12, 483. https://doi.org/10.3390/min12040483
AMA Style
Wang Y, Pan G, Chu H, Lu D, Zheng X. Application of a Superplasticizer in Scheelite Selective Flotation from Calcite. Minerals. 2022; 12(4):483. https://doi.org/10.3390/min12040483
Chicago/Turabian StyleWang, Yuhua, Gaochan Pan, Haoran Chu, Dongfang Lu, and Xiayu Zheng. 2022. "Application of a Superplasticizer in Scheelite Selective Flotation from Calcite" Minerals 12, no. 4: 483. https://doi.org/10.3390/min12040483
Note that from the first issue of 2016, this journal uses article numbers instead of page numbers. See further details here.