
Mineralized Zones of the Shizhuyuan Ore Field and Their Genetic Relationship with the Qianlishan Granite Complex, NE China: Evidence from Pyrite In Situ Geochemistry

Abstract
:1. Introduction
2. Geological Setting
2.1. Tectonic Setting
2.2. Stratigraphy

2.3. Geology and Mineralization of the Three Zones
3. Sampling and Analytical Methods
In Situ Trace Element Analyses of Pyrite
4. Results
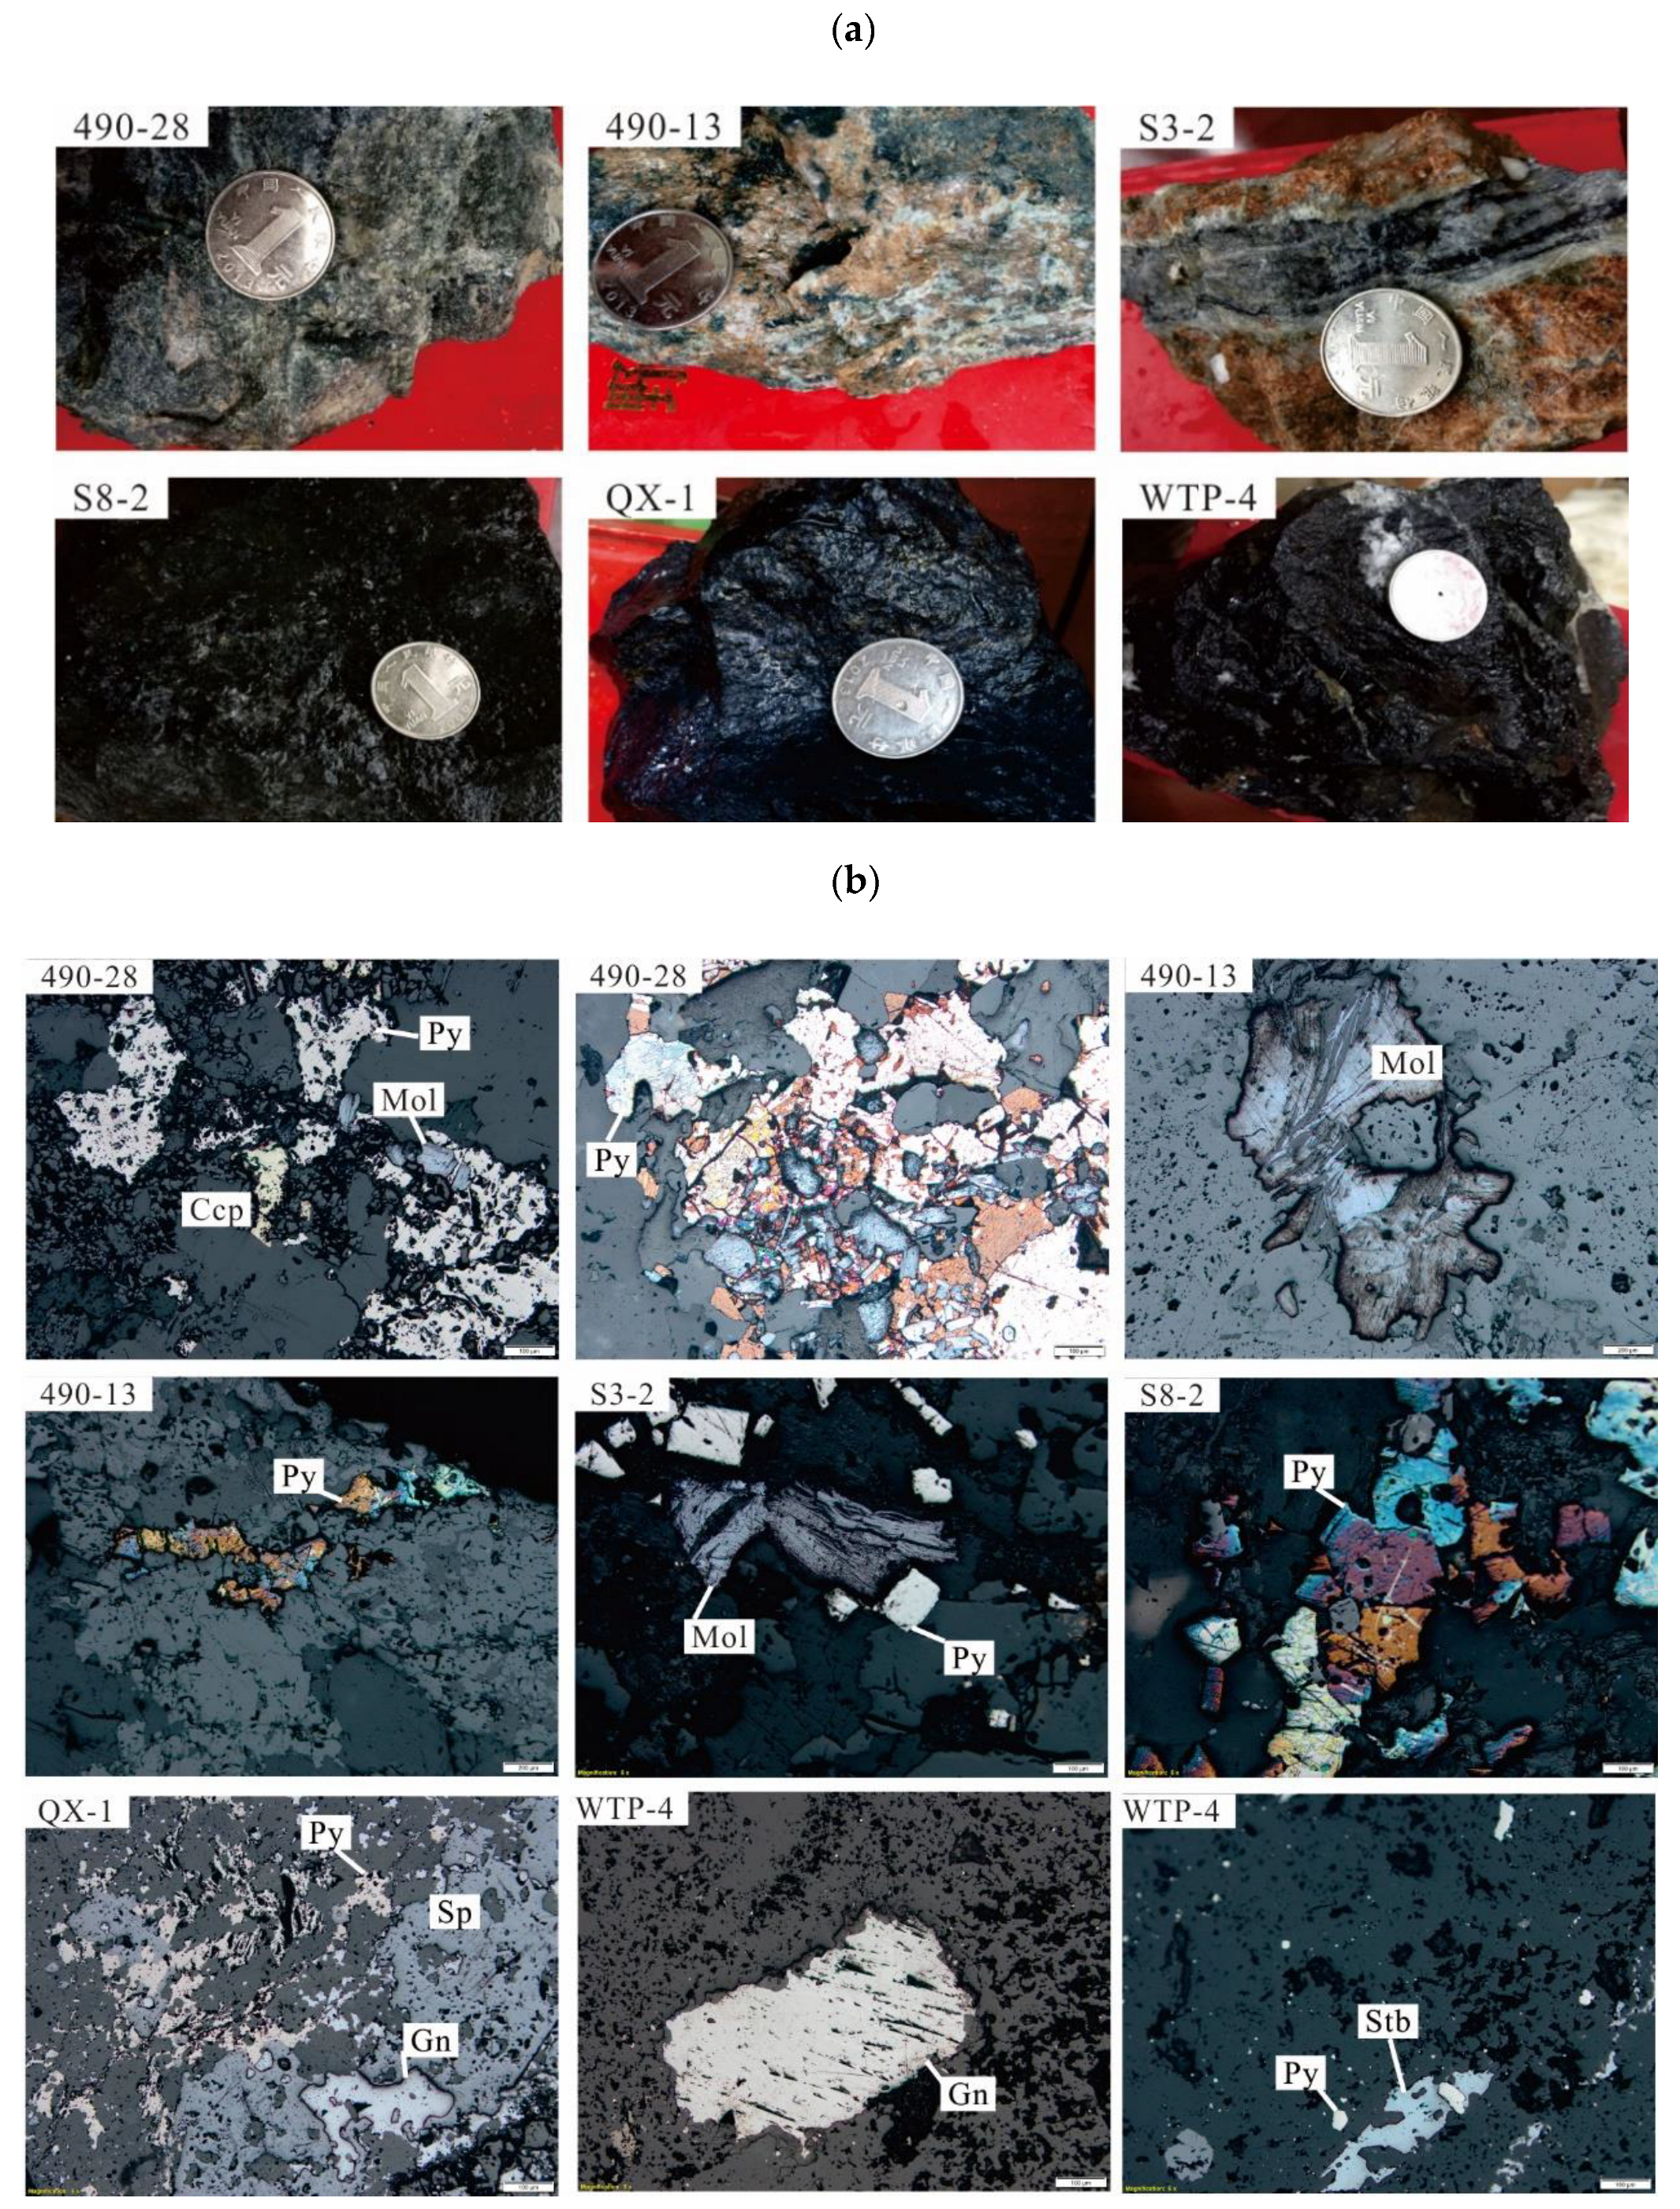
4.1. Petrography
4.2. Mineralization
4.3. In Situ Spot Analysis
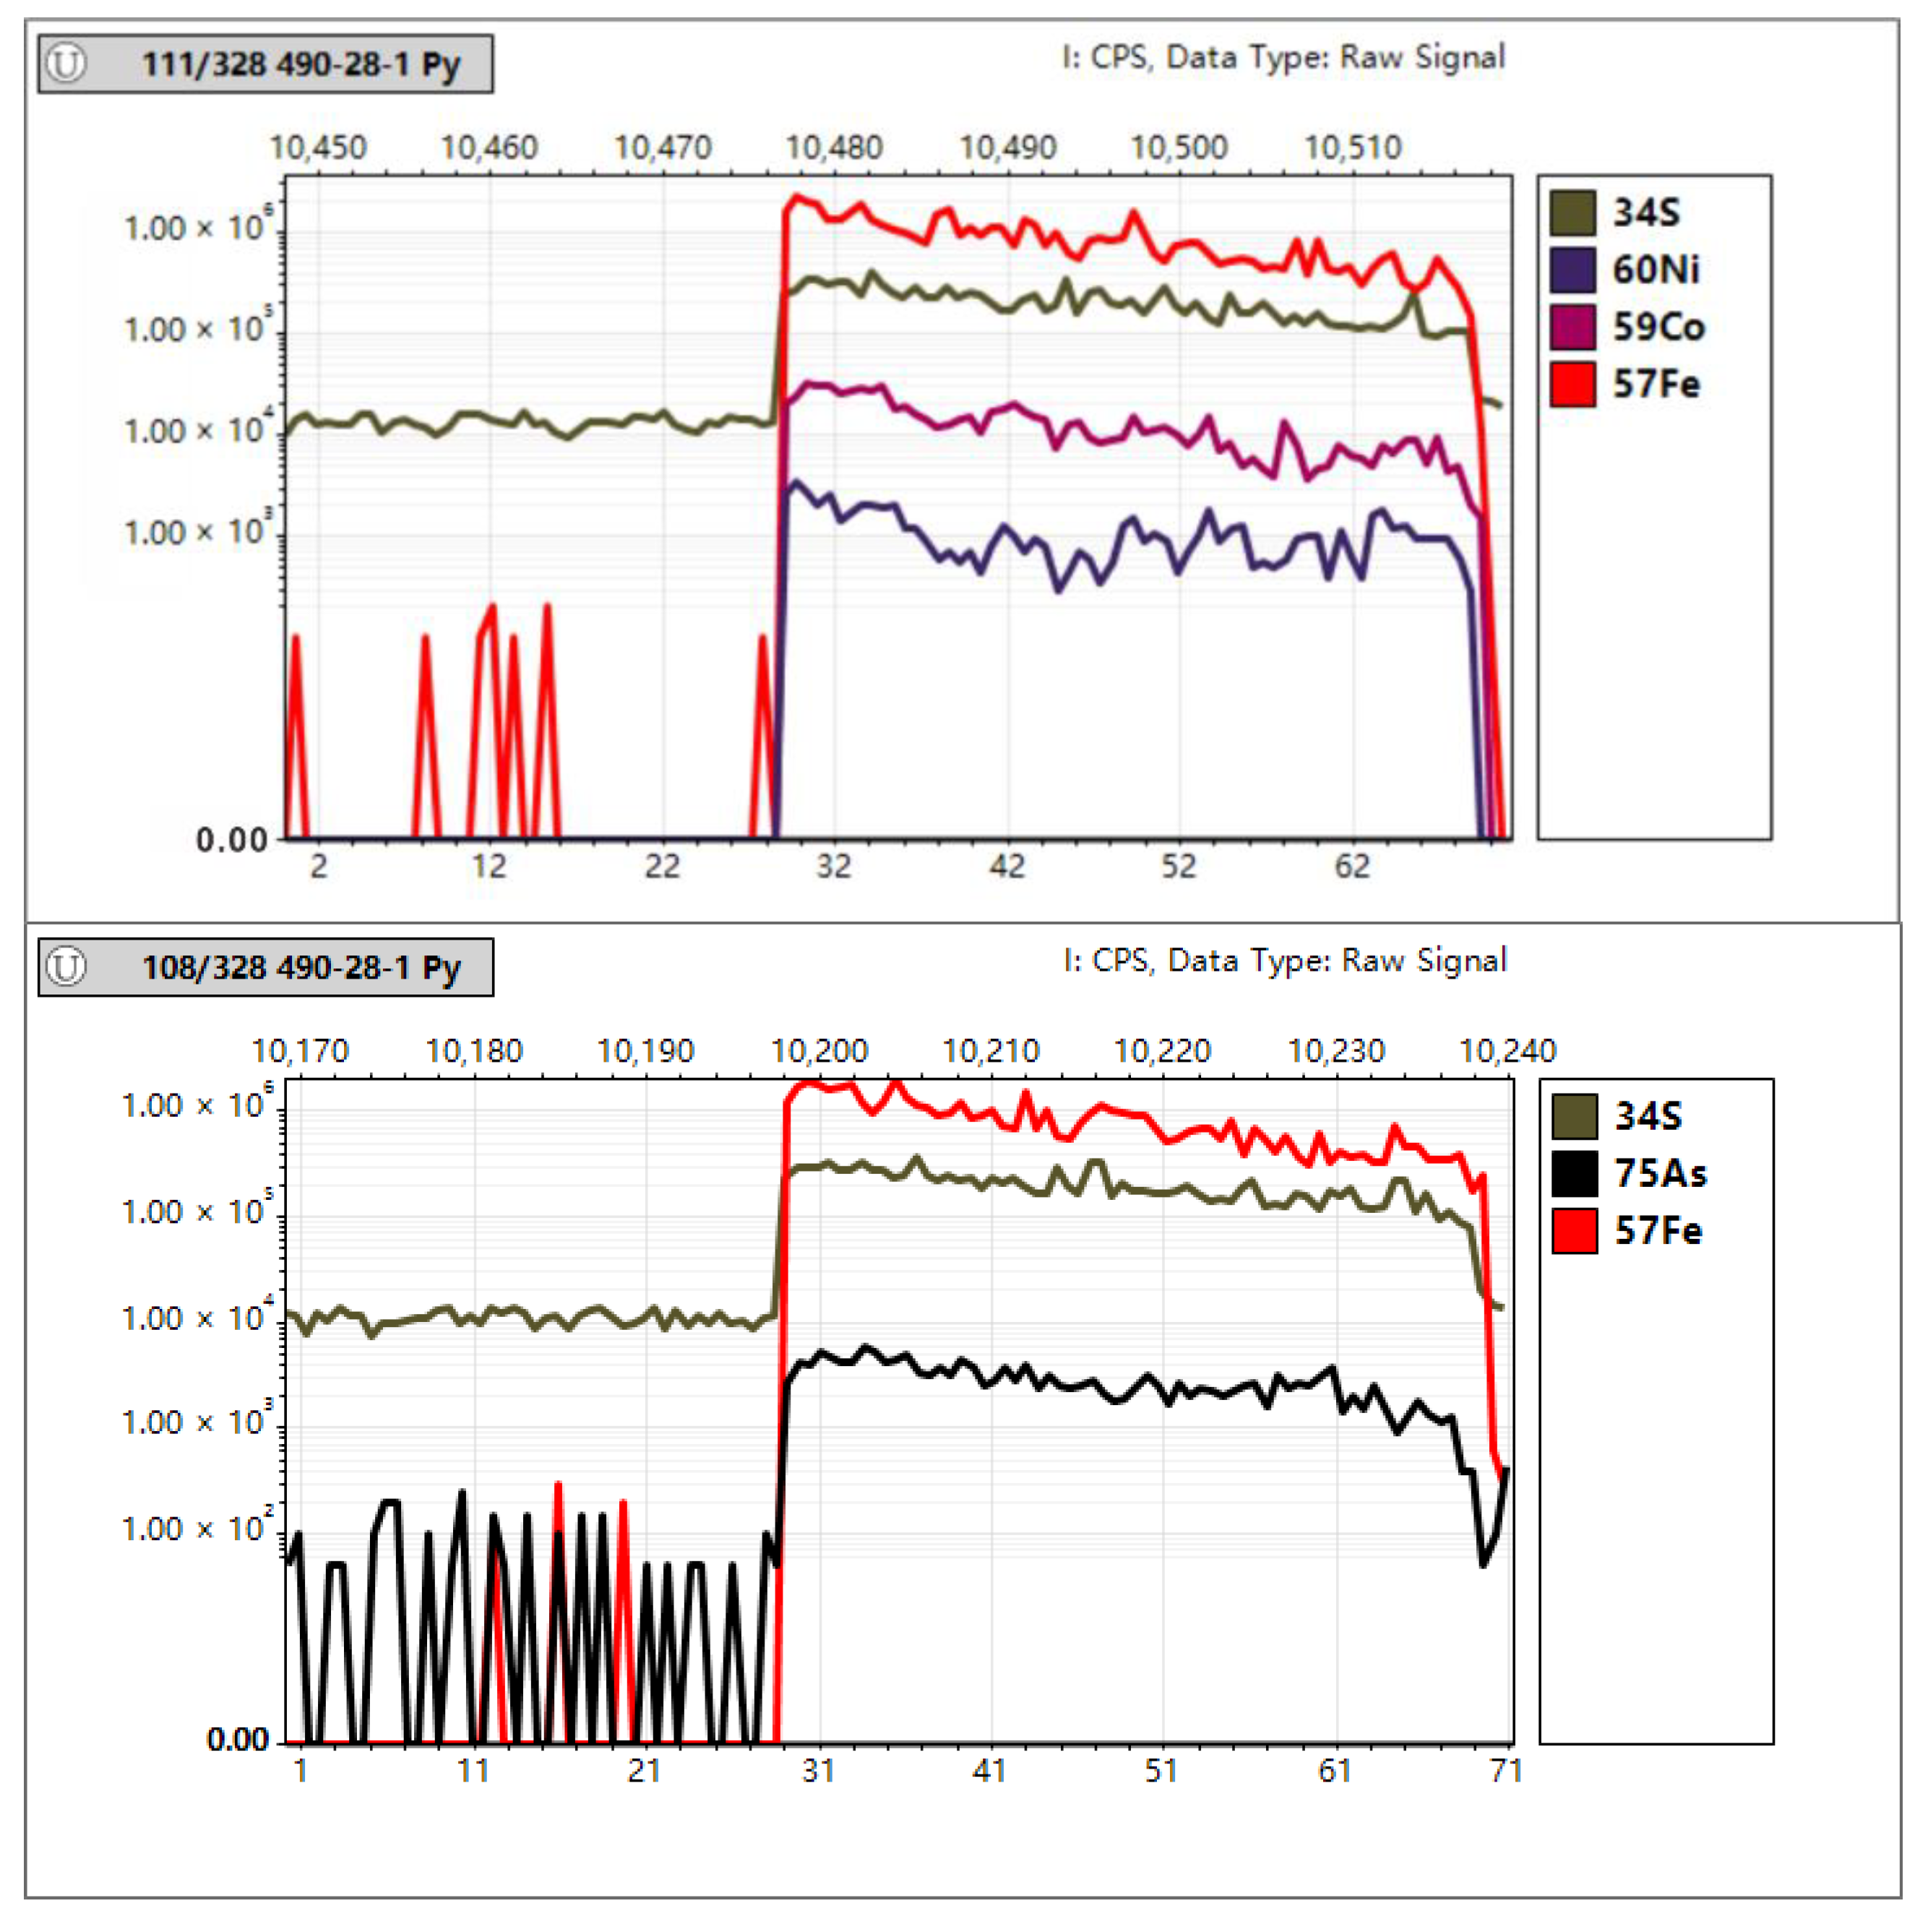
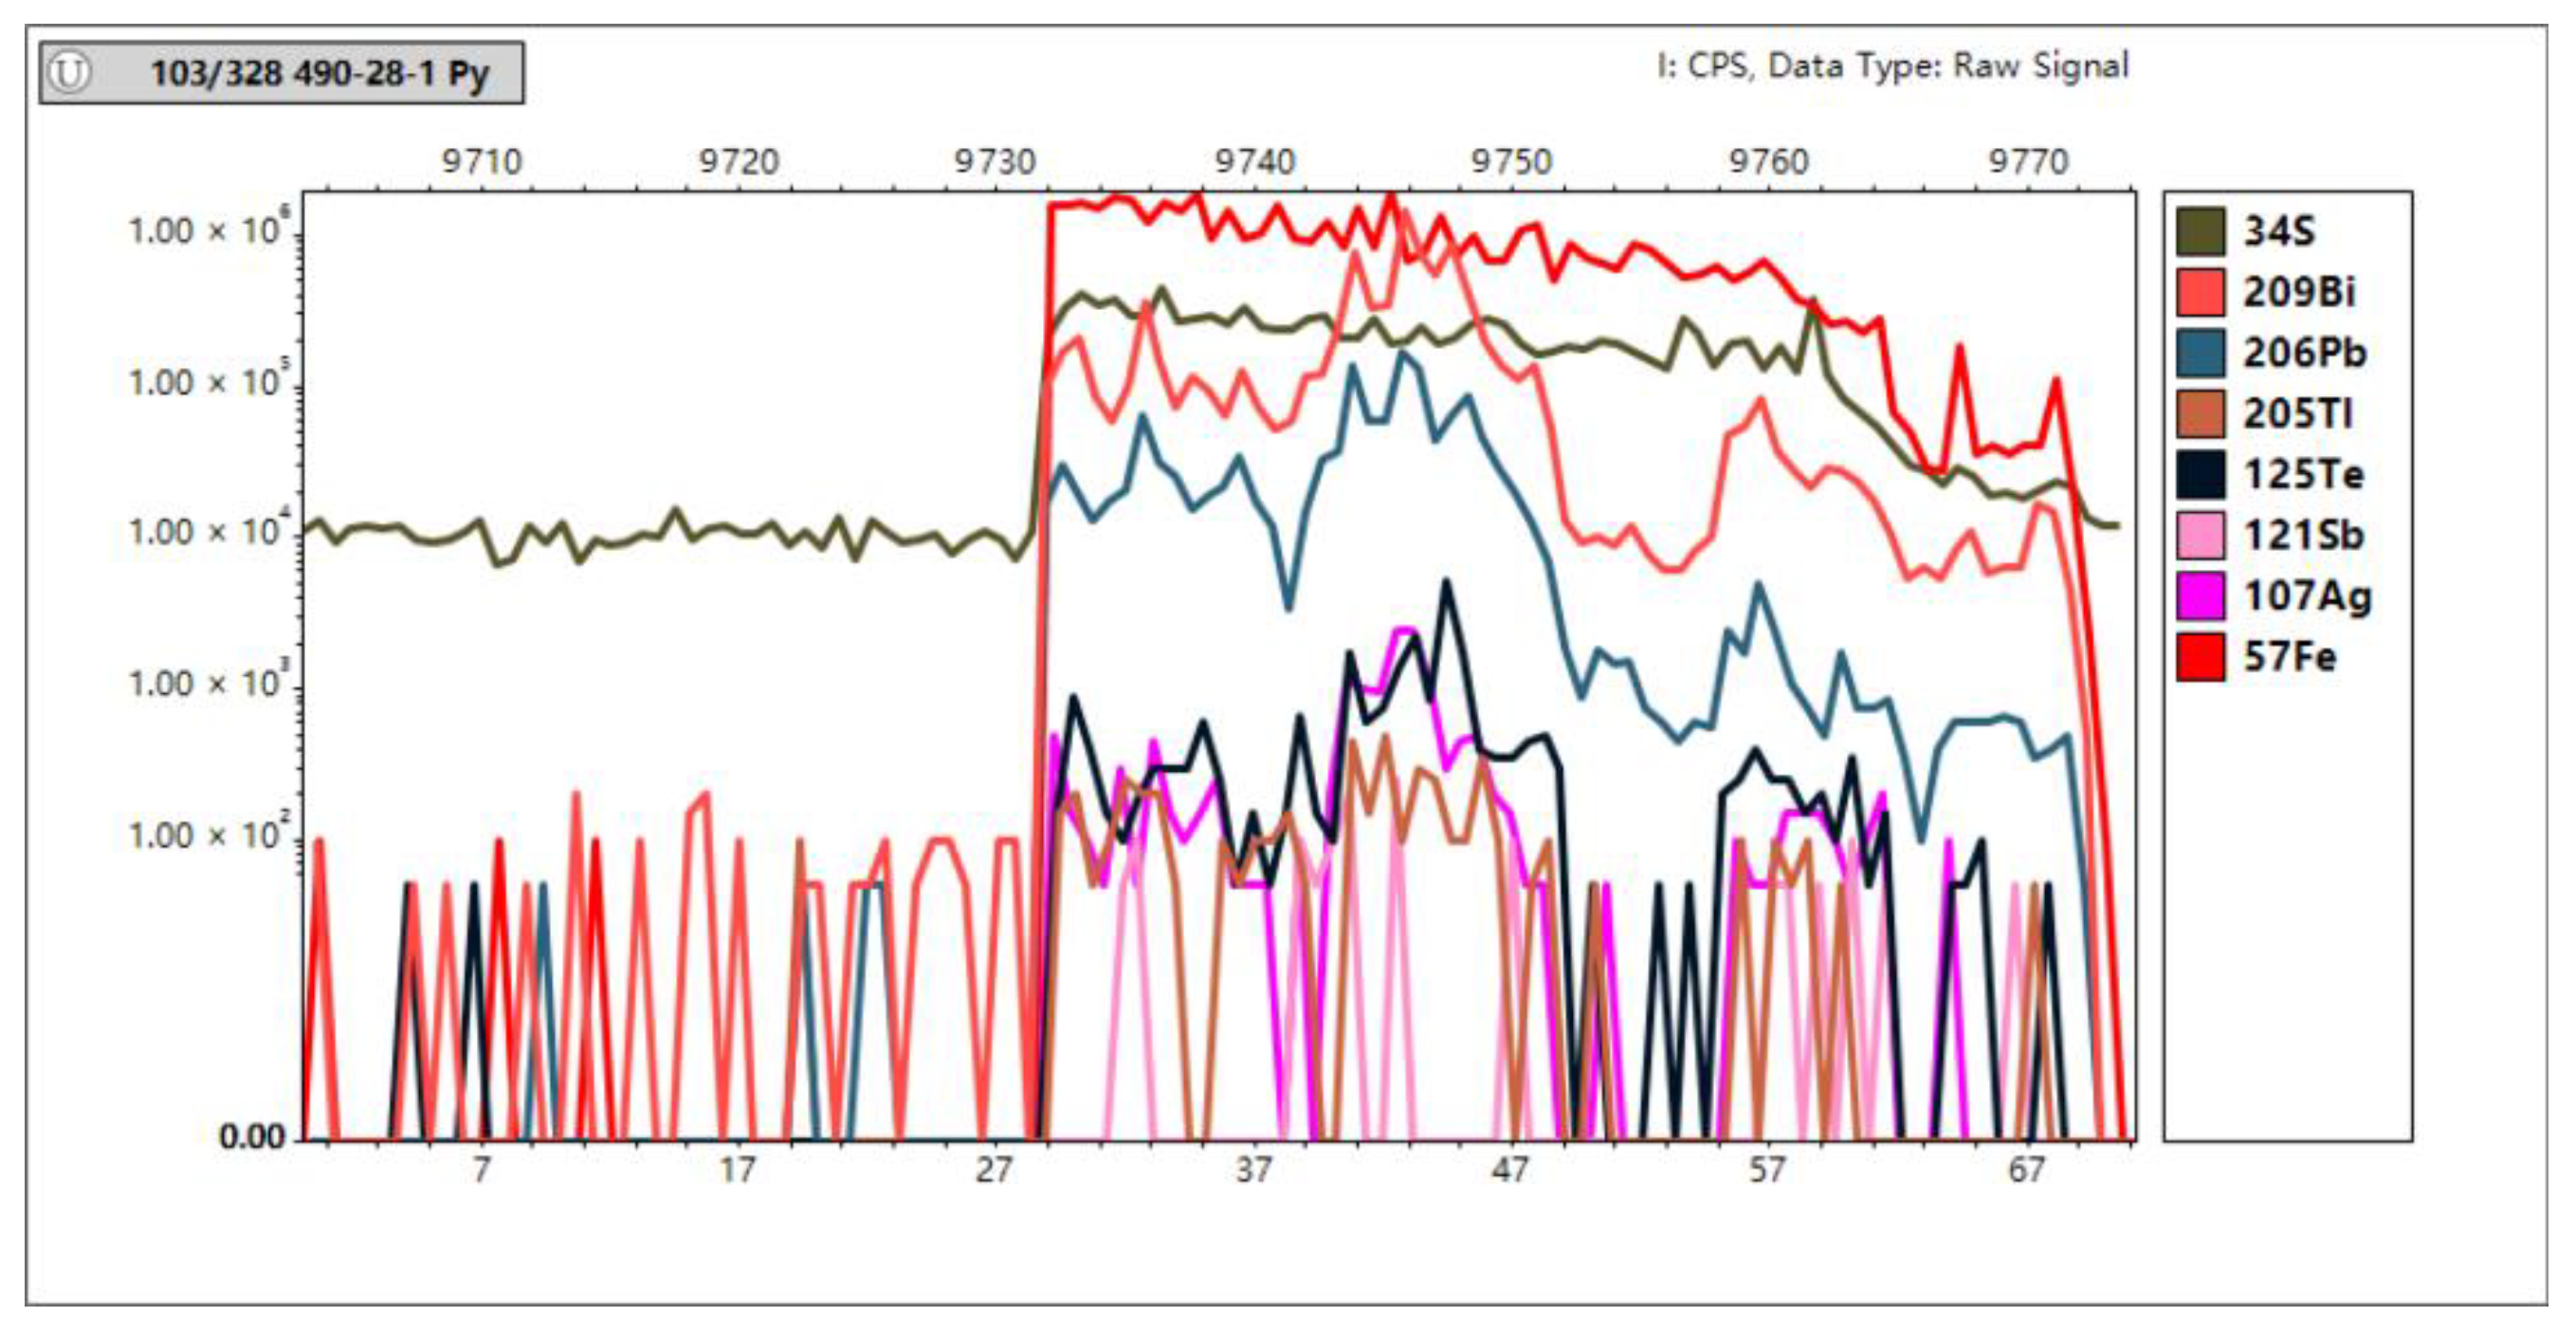
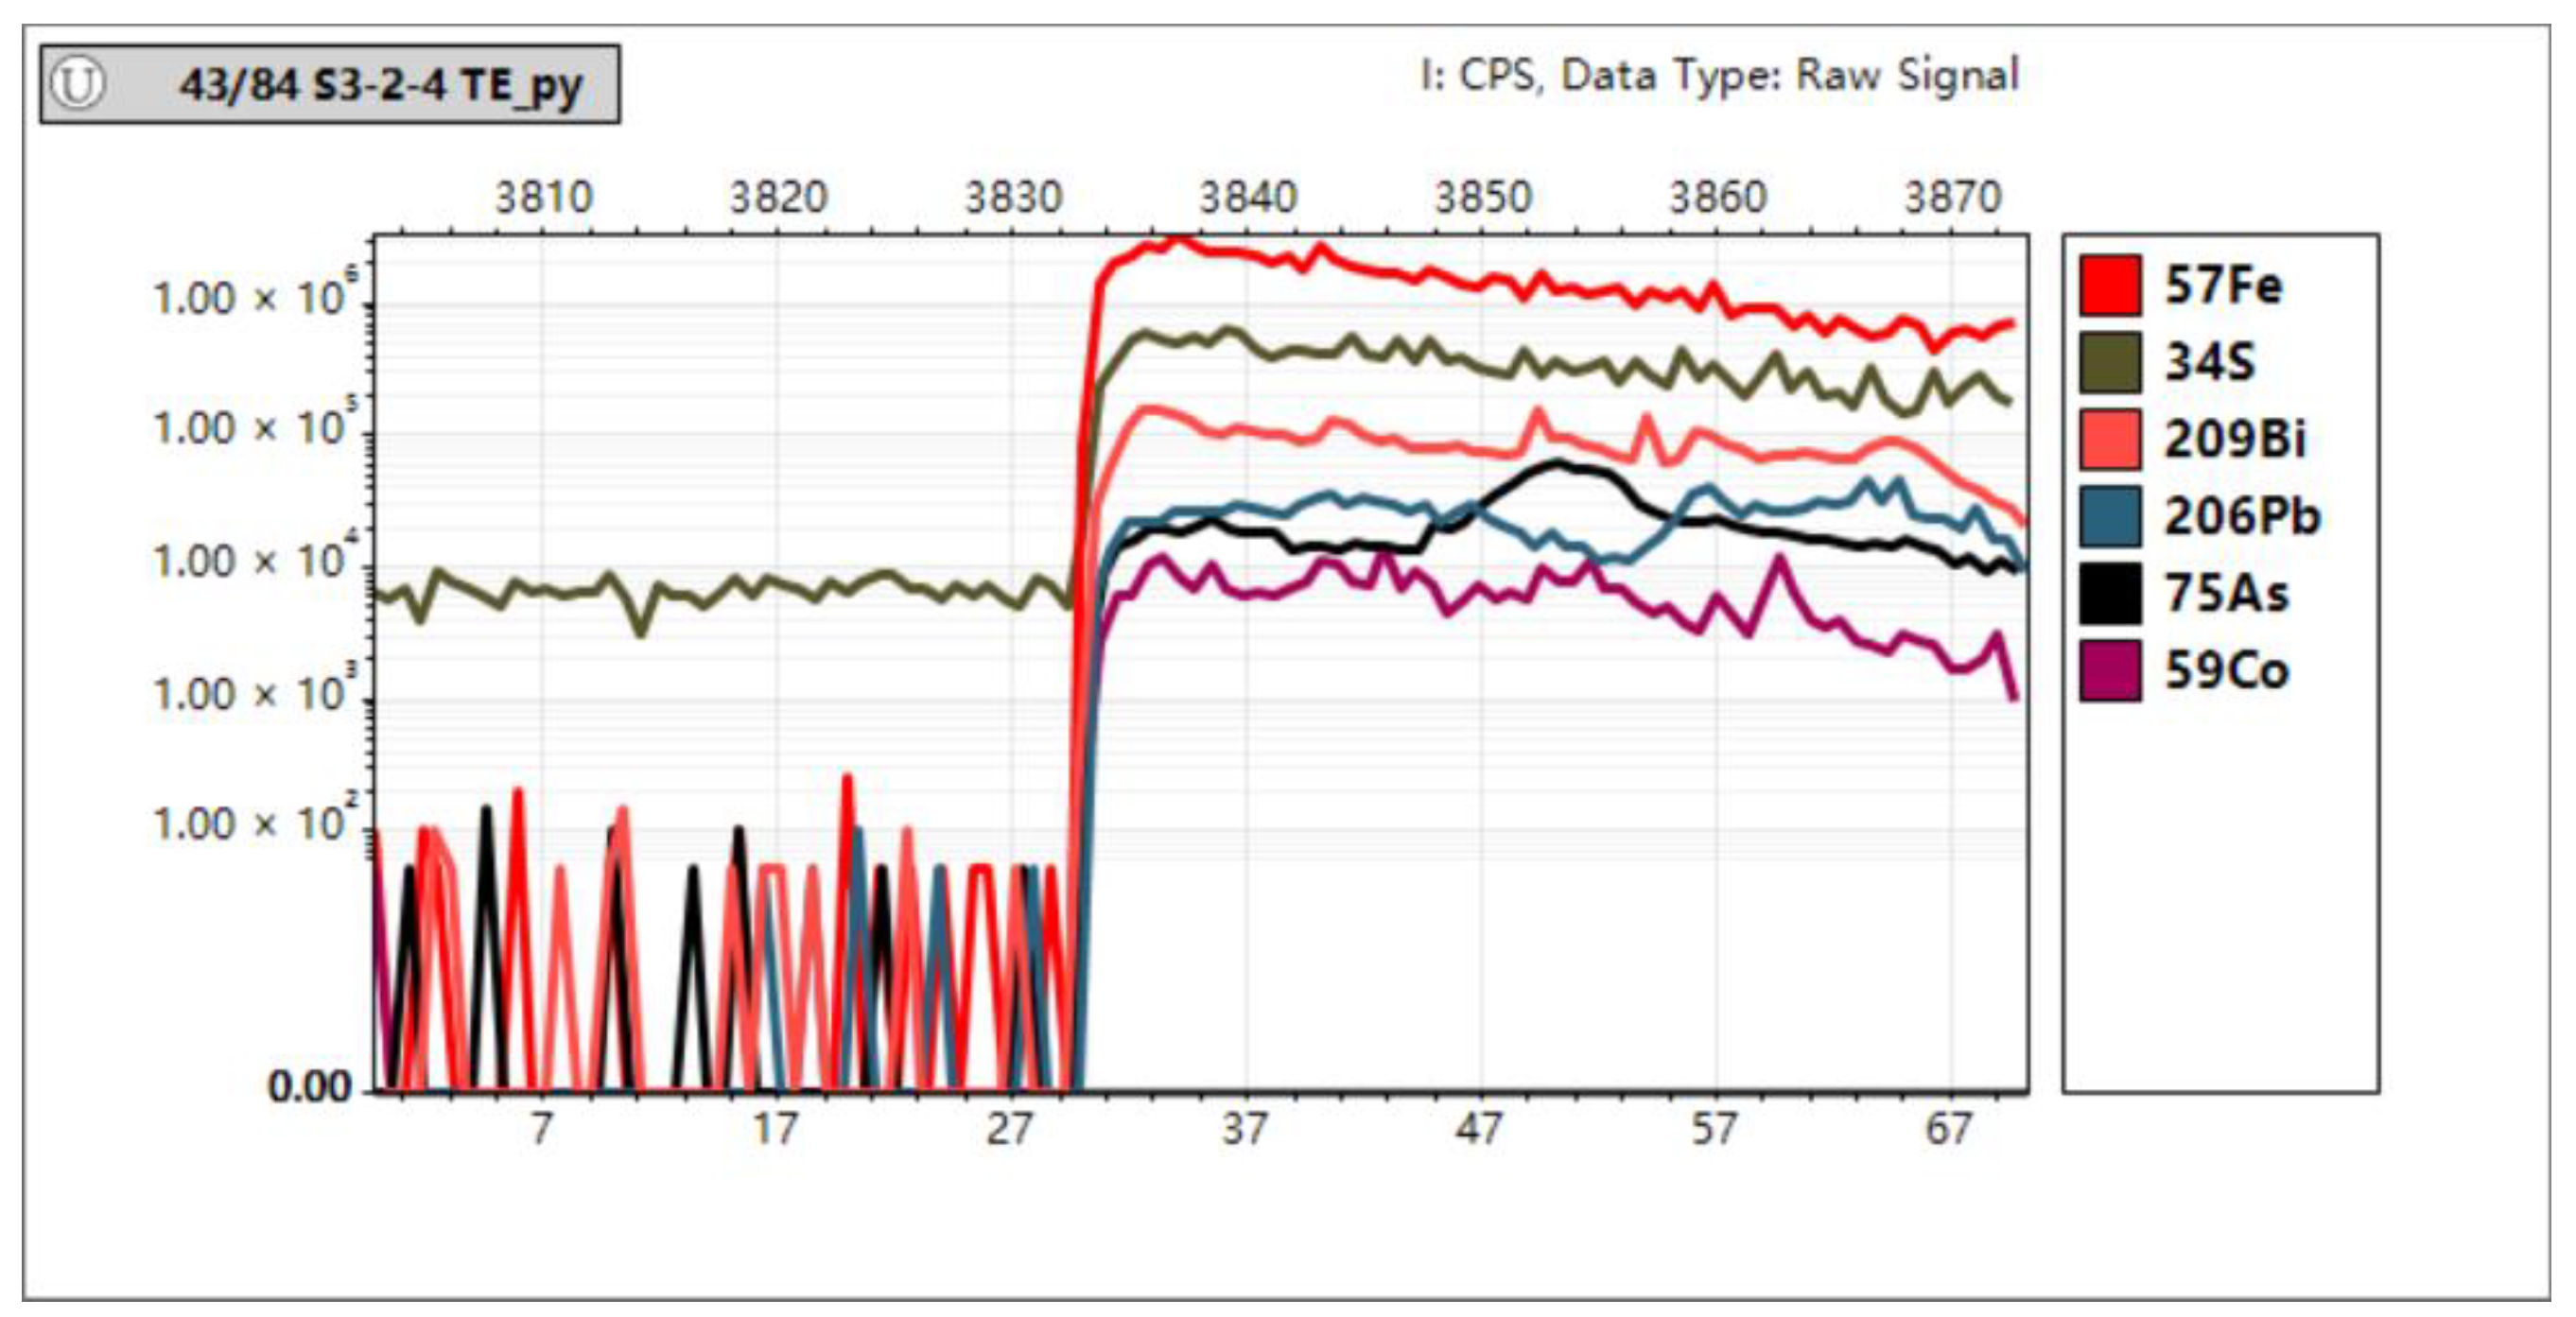
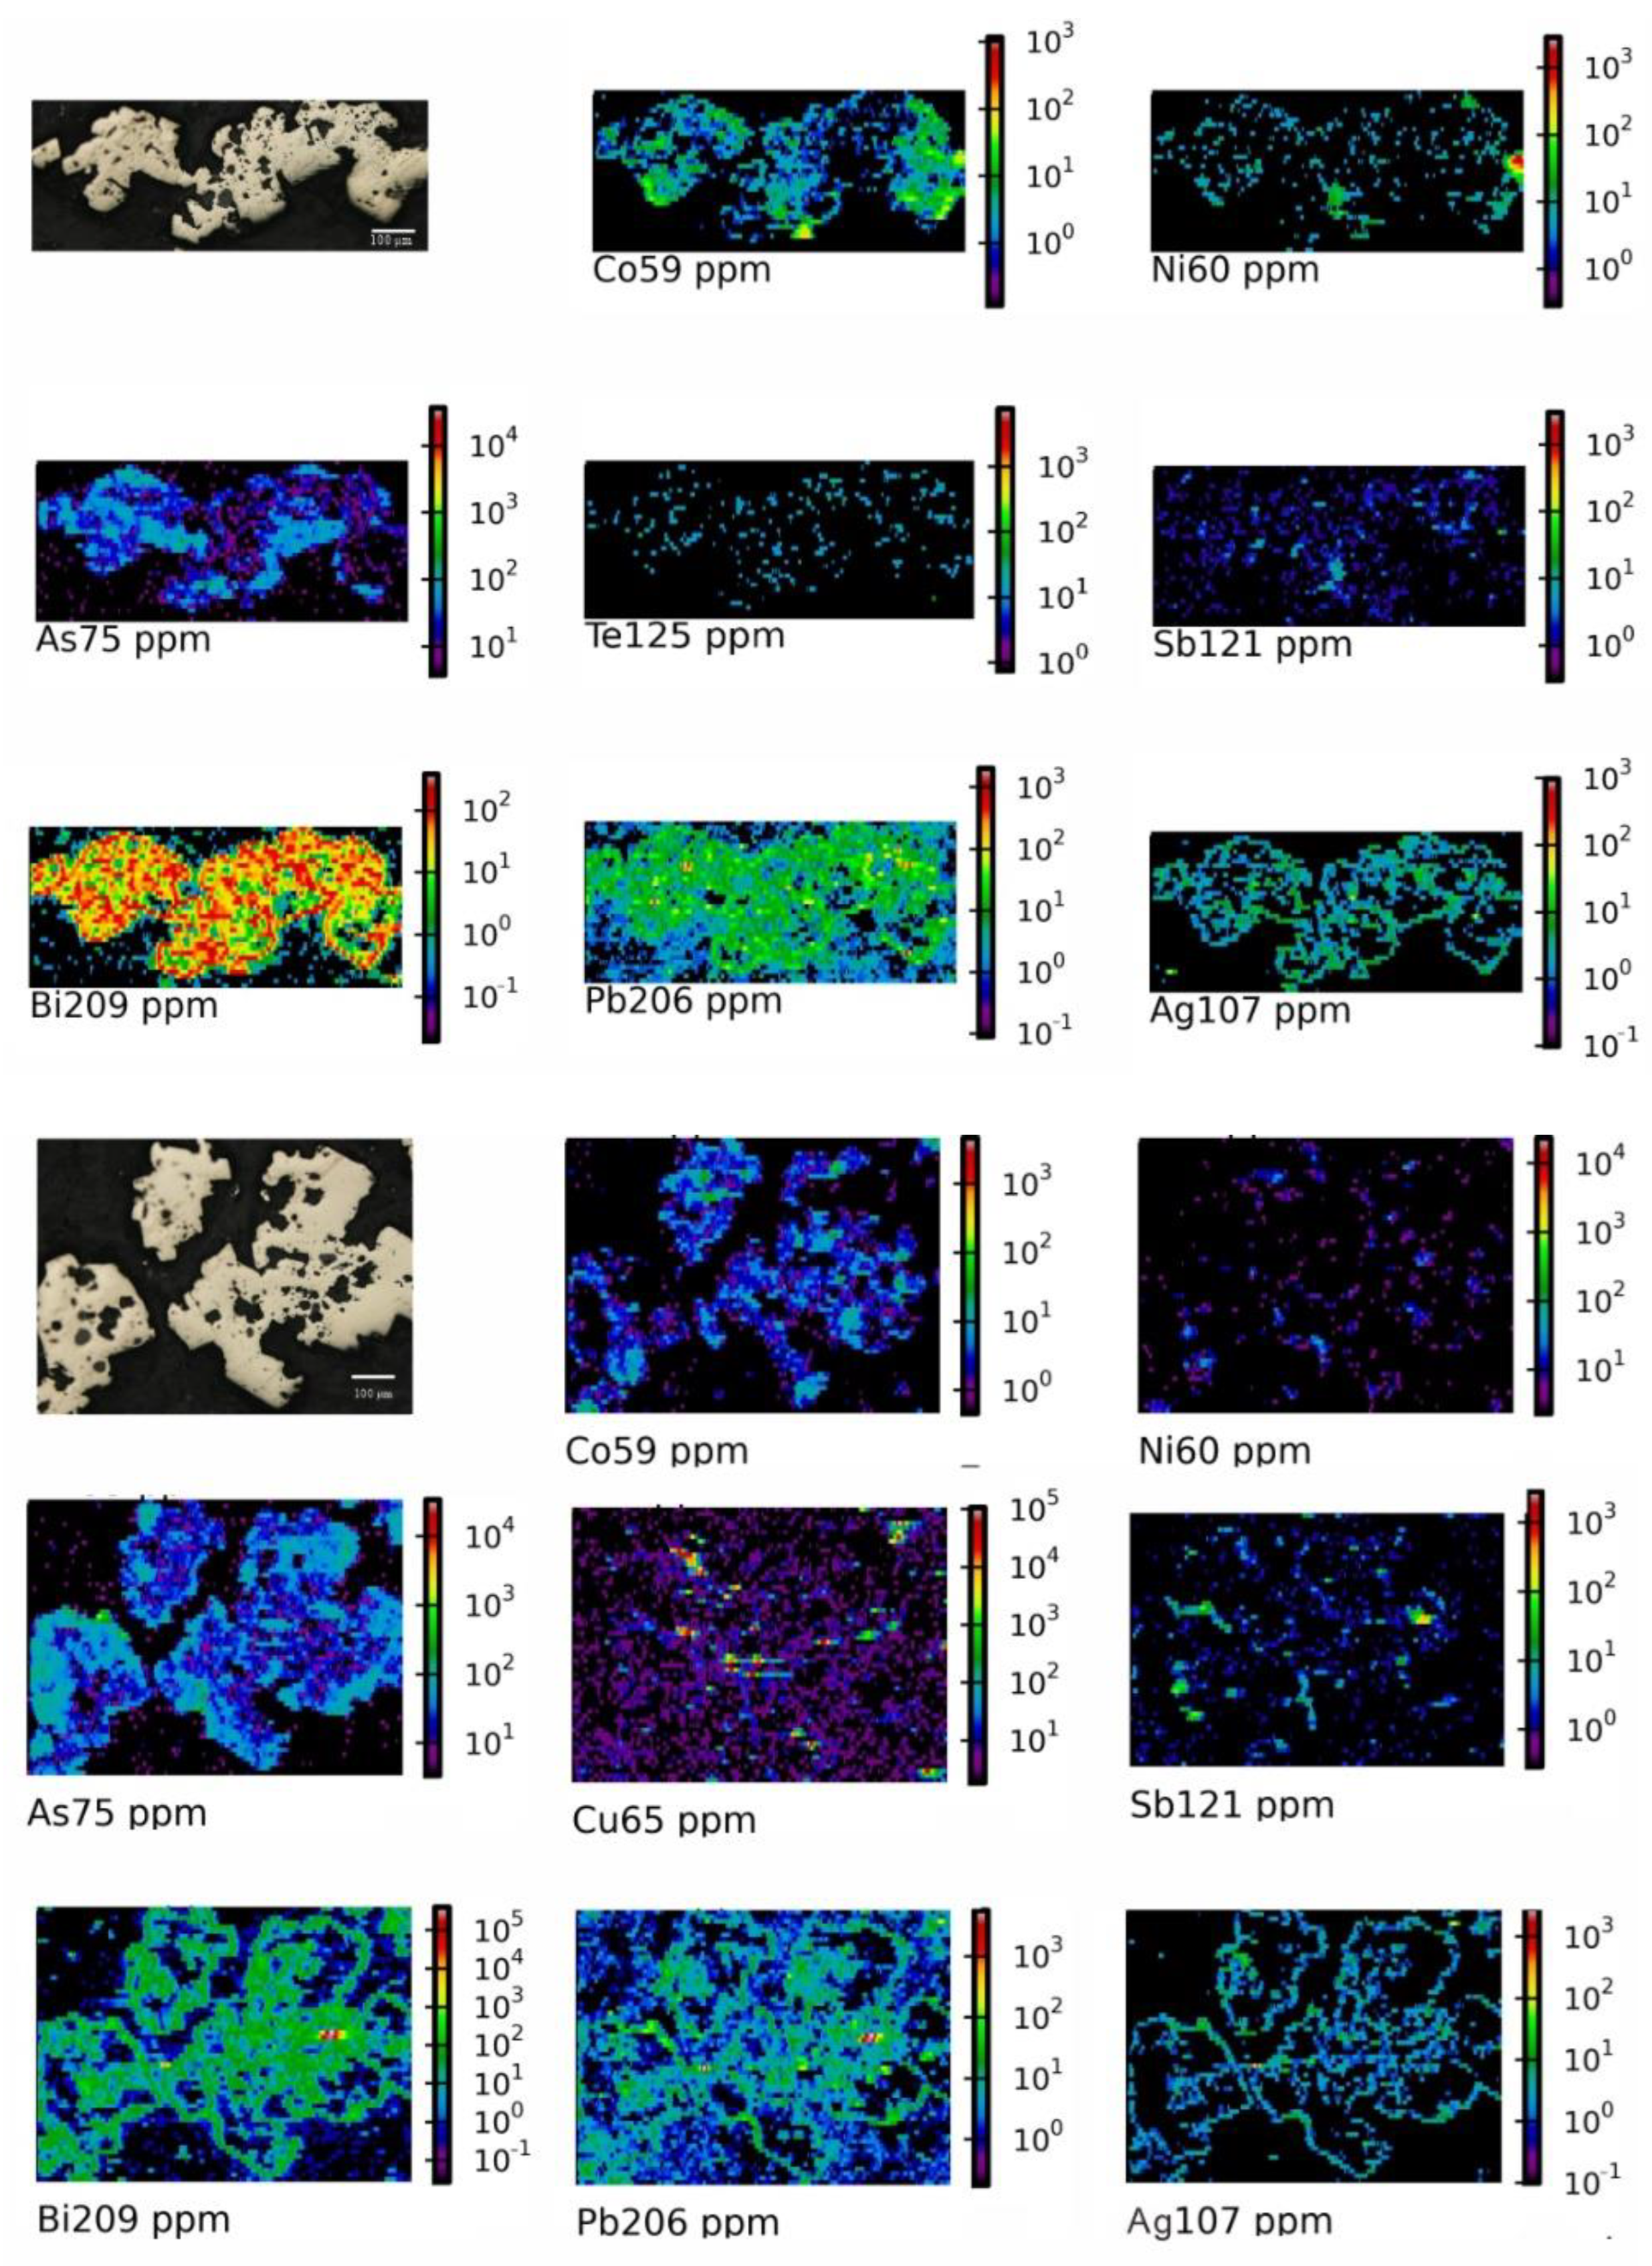
4.4. Mapping Analysis
5. Discussion
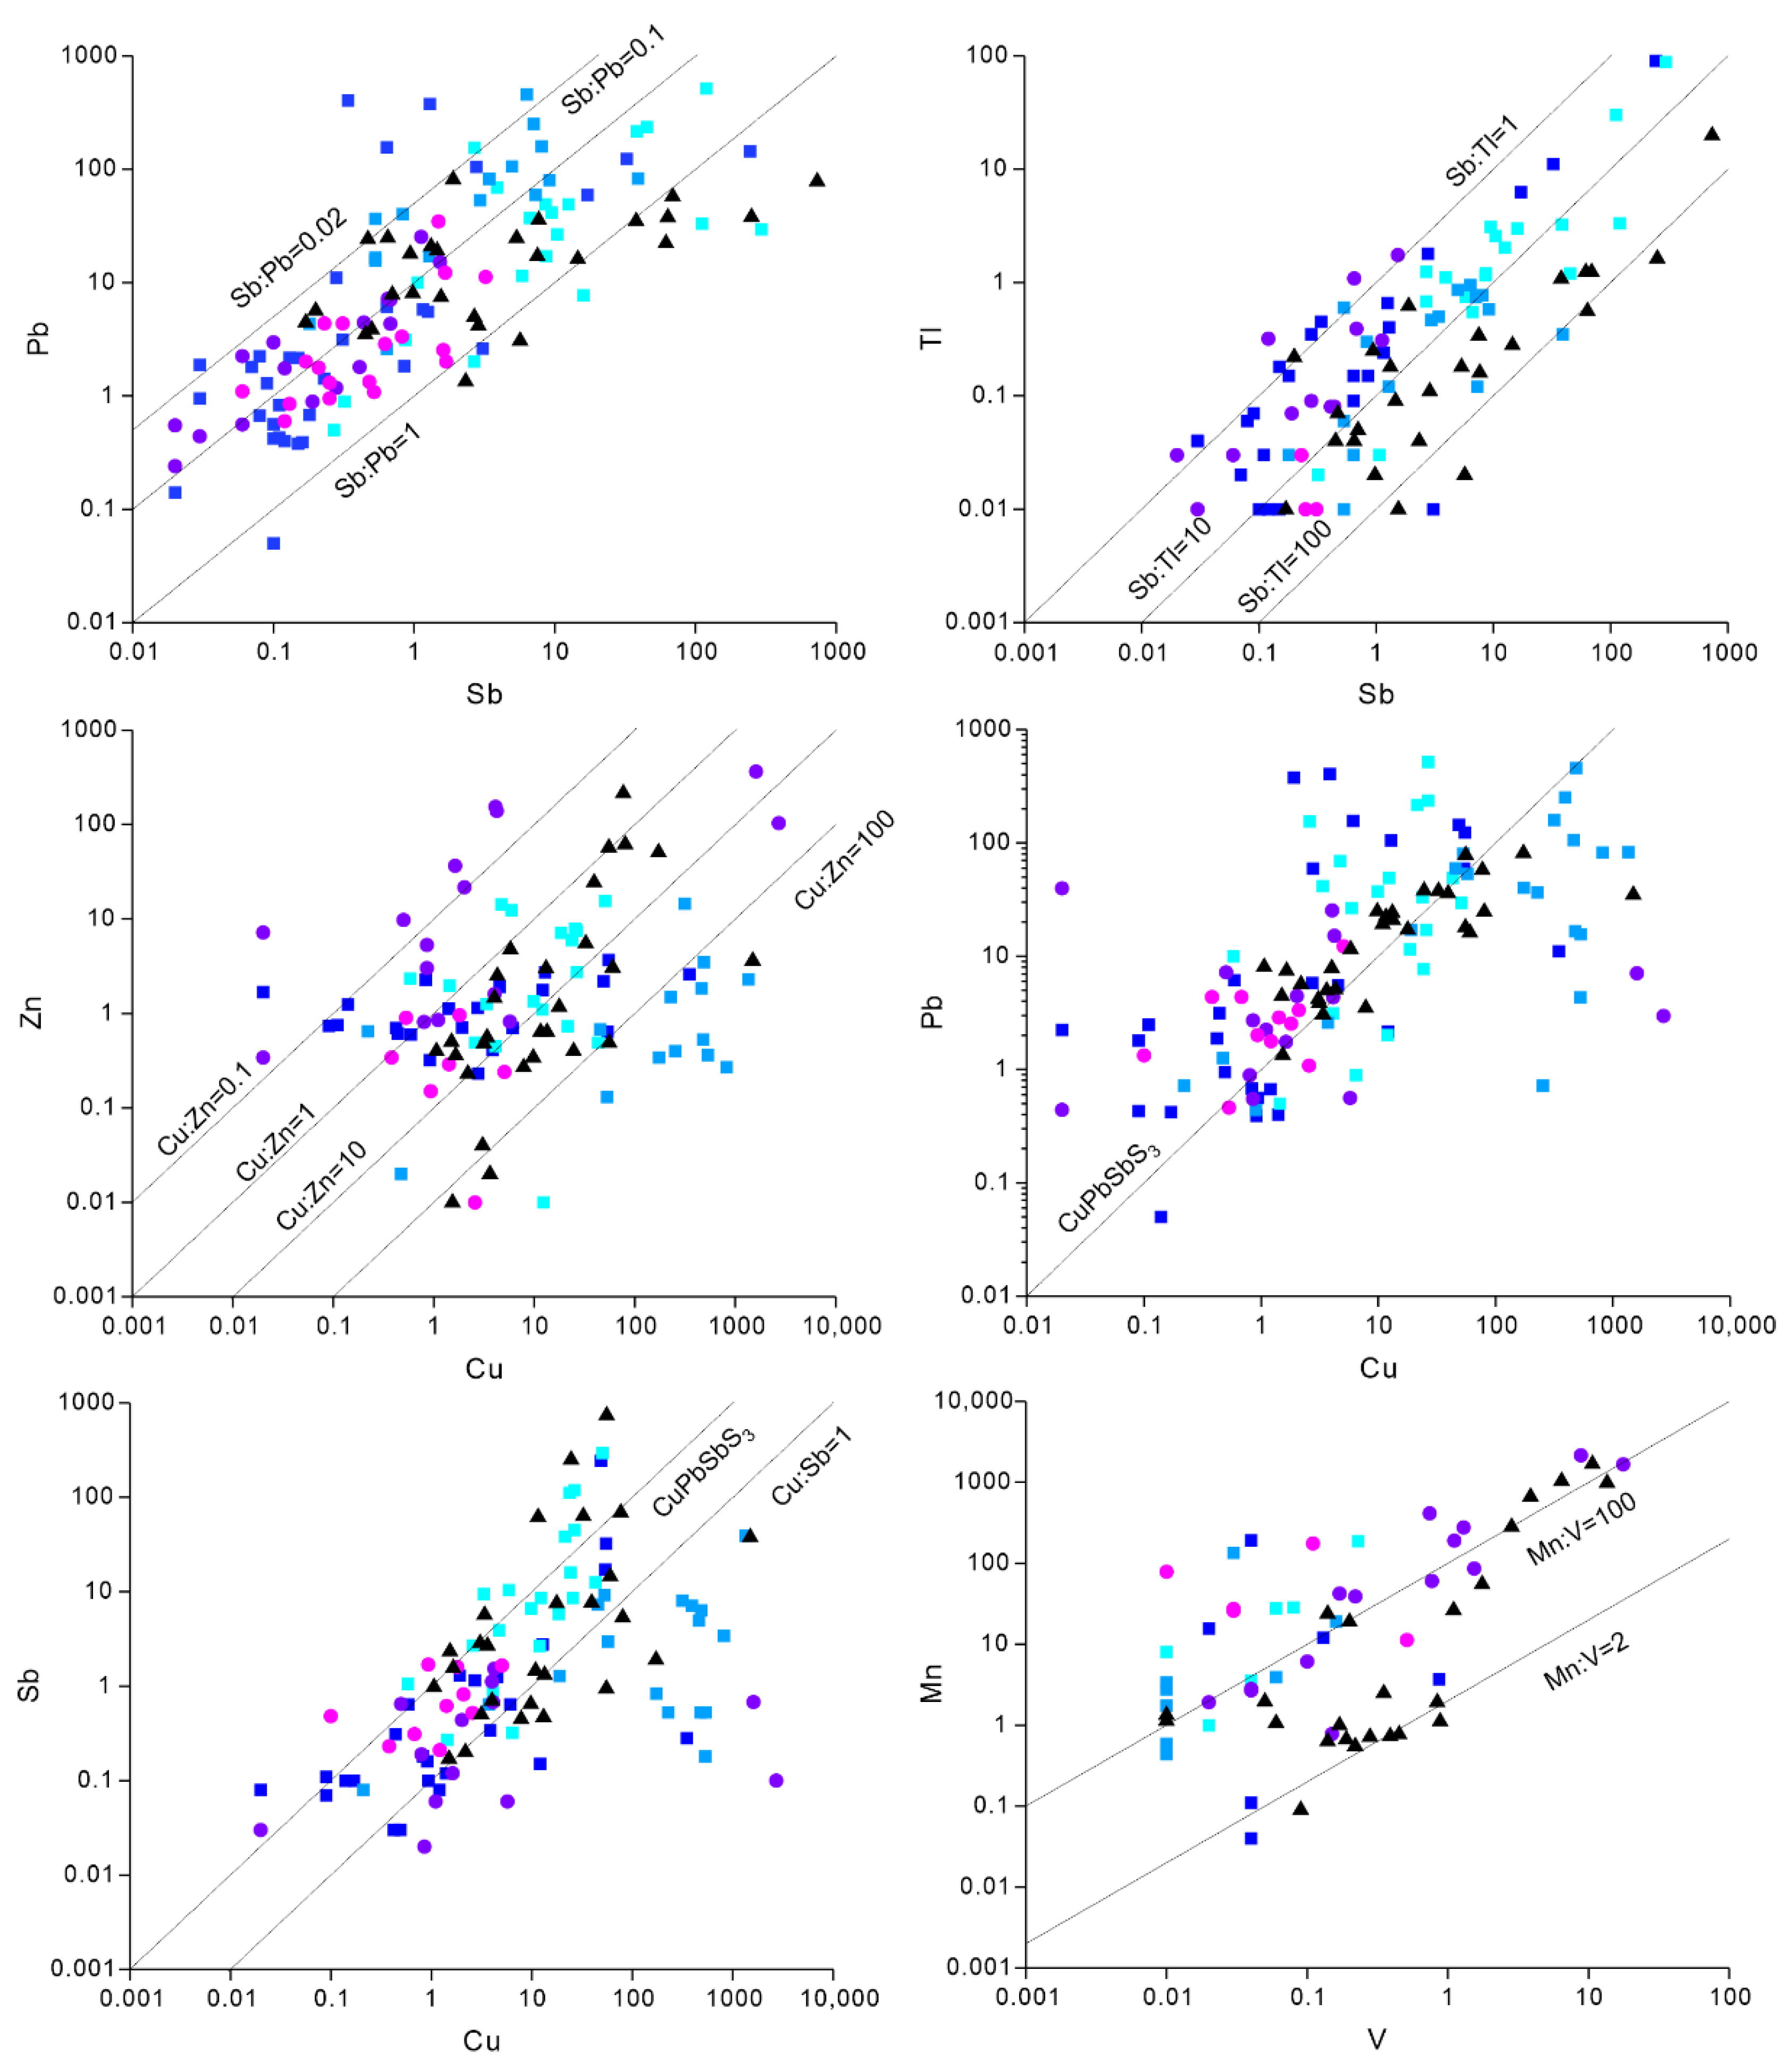
5.1. Element Combinations and Features
5.1.1. Bi, Pb, Te and Tl
5.1.2. Au, Ag, Te, and As
5.1.3. Sb, Cu, Pb, Tl, and Zn
Mn and V
5.2. Ore Forming Environment
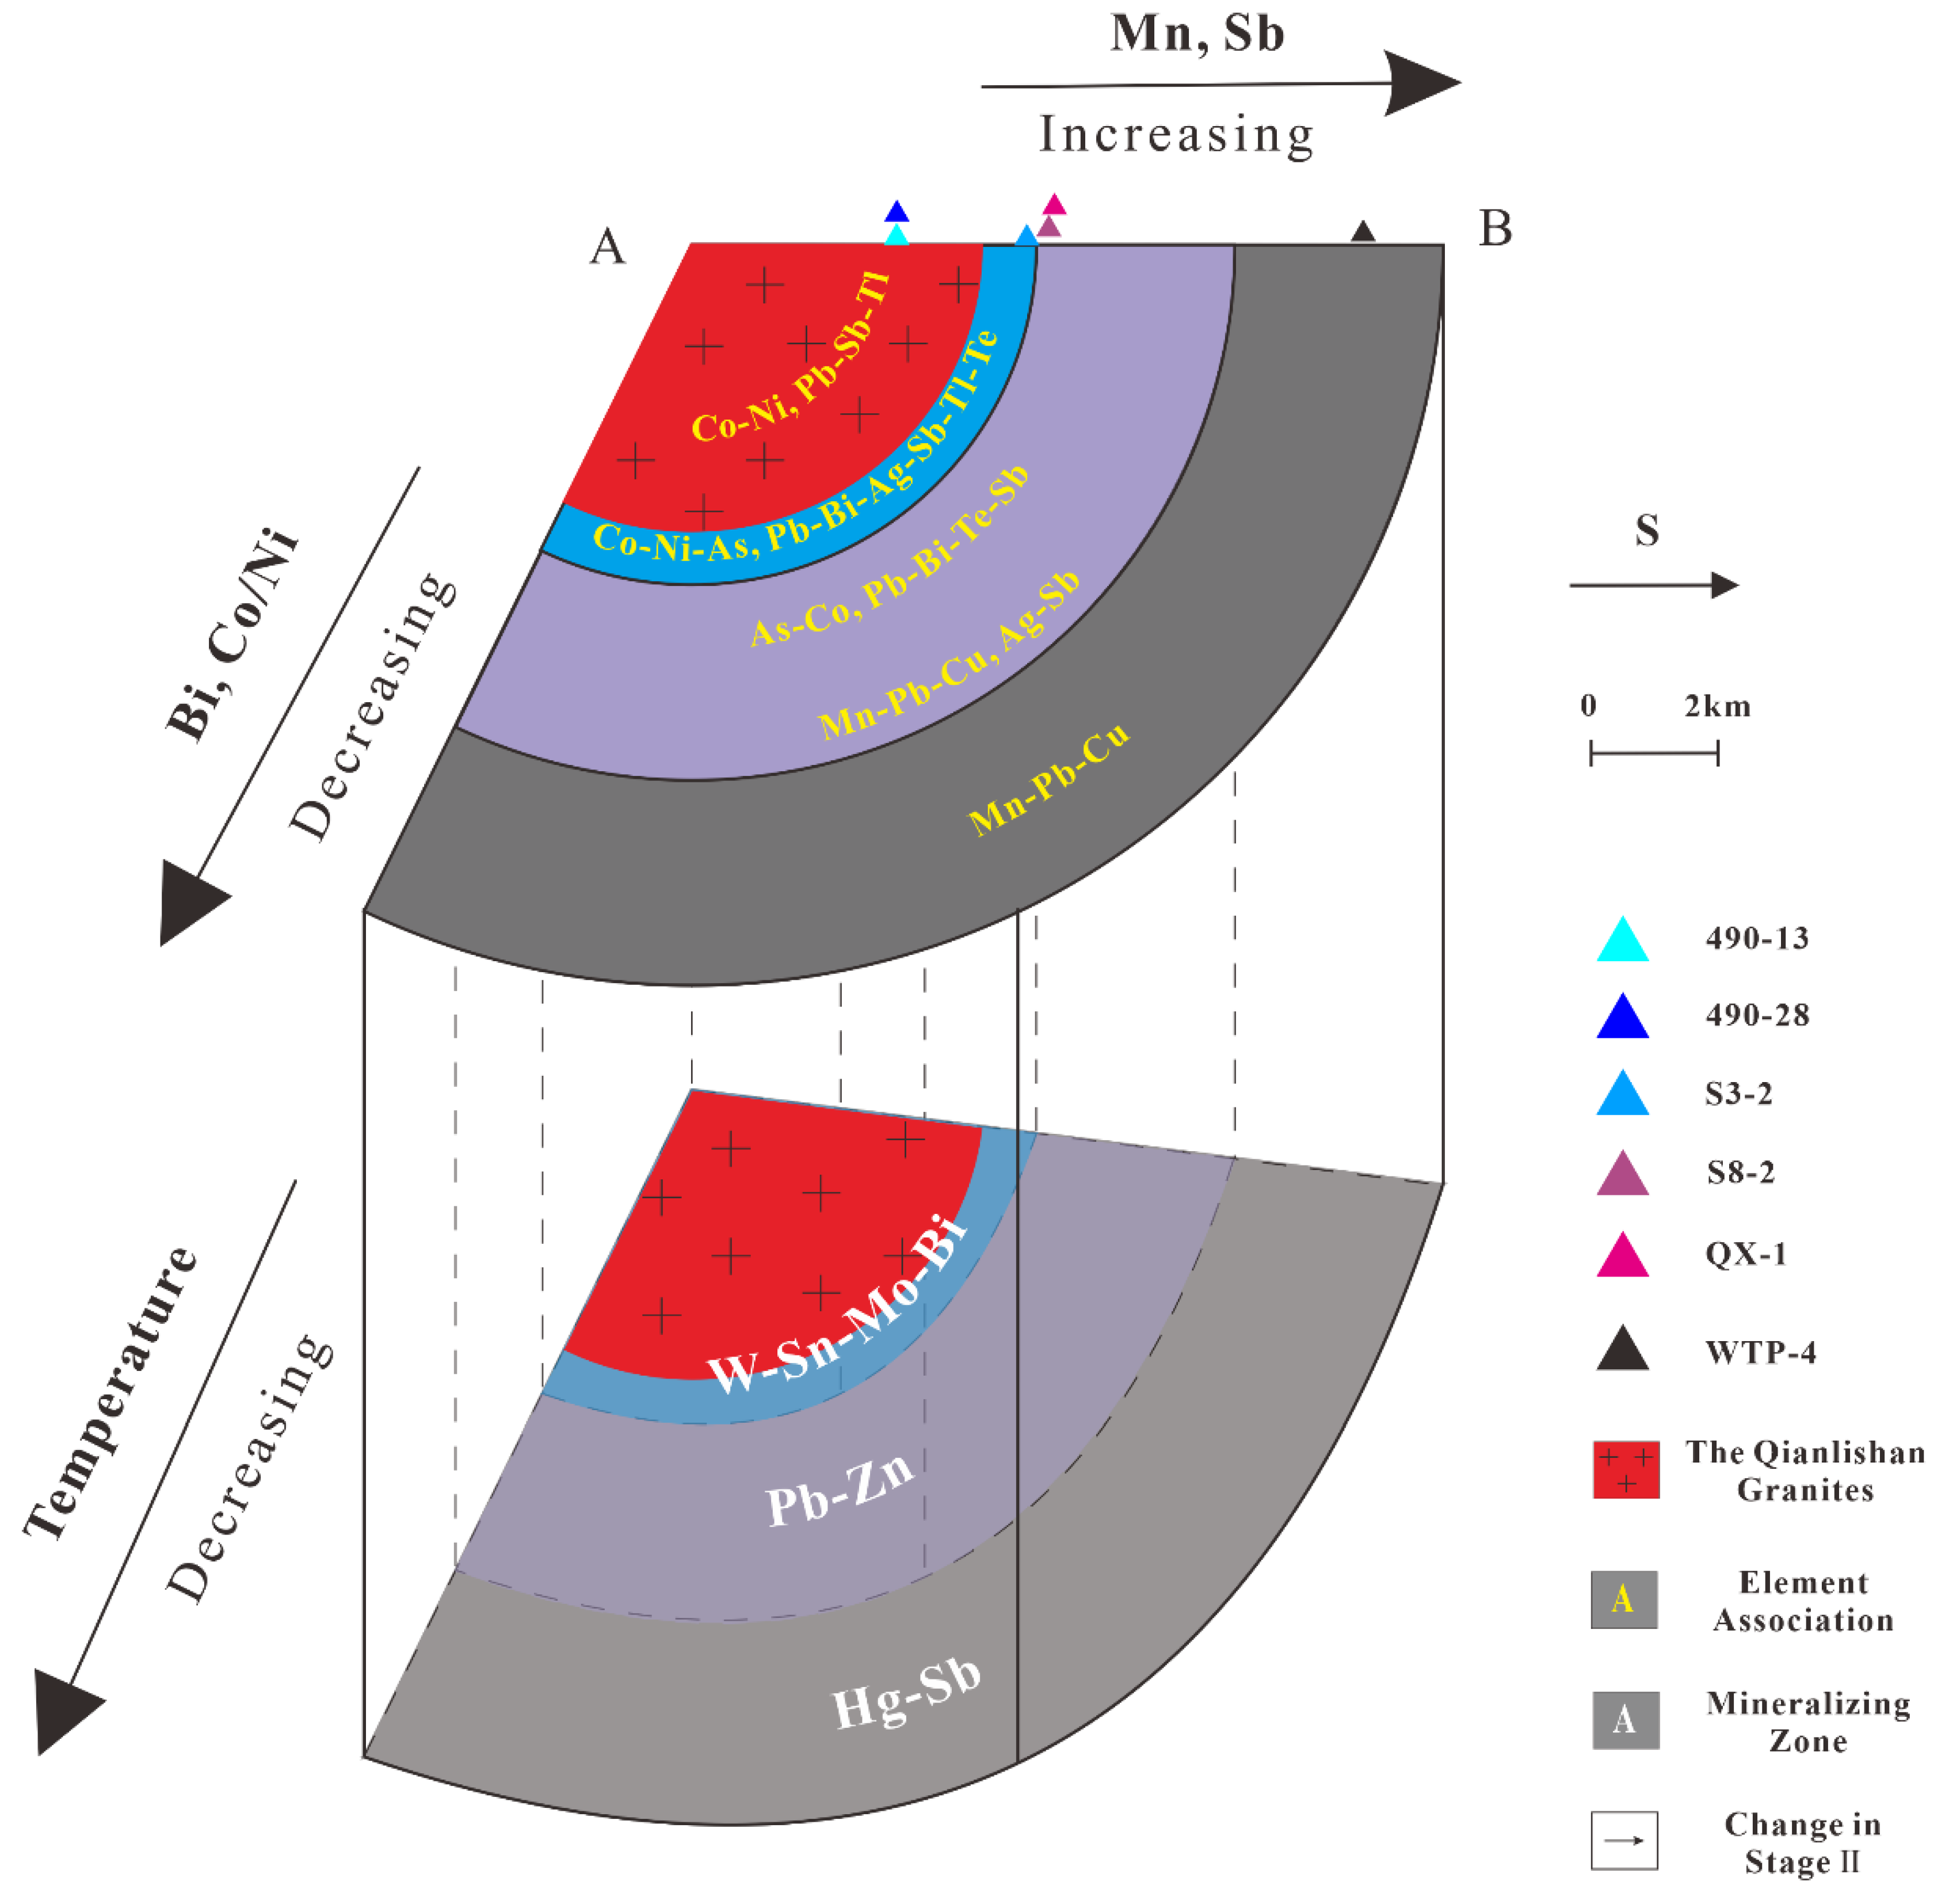
5.3. Trace Element Distribution Characteristics
5.3.1. W-Sn-Mo-Bi zone
5.3.2. Pb-Zn zone
5.3.3. Hg-Sb zone
6. Conclusions
- The gradual changes in pyrite trace elements from the inner mineralization zone to the outermost zone reflect the compositional variations in the corresponding hydrothermal fluids.
- Pyrites in each mineralized zone are distributed in distinct regions in the Co/Ni-Bi binary diagram, suggesting that this diagram is an effective discrimination tool for the degree of hydrothermal alteration.
- All three mineralized zones probably constitute a whole ore-forming hydrothermal system, and the hydrothermal fluids originated from the Qianlishan granites.
Author Contributions
Funding
Data Availability Statement
Acknowledgments
Conflicts of Interest
References
- Chen, B.; Ma, X.; Wang, Z. Origin of the fluorine-rich highly differentiated granites from the Qianlishan composite plutons (South China) and implications for polymetallic mineralization. J. Asian Earth Sci. 2014, 93, 301–314. [Google Scholar] [CrossRef]
- Chen, Y.; Li, H.; Sun, W.; Ireland, T.; Tian, X.; Hu, Y.; Yang, W.; Chen, C.; Xu, D. Generation of Late Mesozoic Qianlishan A2-type granite in Nanling Range, South China: Implications for Shizhuyuan W–Sn mineralization and tectonic evolution. Lithos 2016, 266, 435–452. [Google Scholar] [CrossRef]
- Li, X.H.; Li, Z.X.; Li, W.X.; Wang, Y. Initiation of the Indosinian Orogeny in South China: Evidence for a Permian Magmatic Arc on Hainan Island. J. Geol. 2006, 114, 341–353. [Google Scholar] [CrossRef]
- Liao, Y.Z.; Zhao, B.; Zhang, D.H.; Li, Z.J.; Li, Y.C.; Xv, D.Z. Metallogenic Efficiency associated with the Magmatic Hydrothermal Fluid-focusing Process. J. Guilin Univ. Technol. 2017, 37, 1–12. [Google Scholar]
- Mao, J.; Cheng, Y.; Chen, M.; Franco, P. Major types and time–space distribution of Mesozoic ore deposits in South China and their geodynamic settings. Miner. Depos. 2012, 48, 267–294. [Google Scholar] [CrossRef]
- Mao, J.W.; Chen, M.H.; Yuan, S.D.; Guo, C.L. Geological Characteristics of the Qinhang (or Shihang) Metallogenic Belt in South China and Spatial-Temporal Distribution Regularity of Mineral Deposits. ACTA Geol. Sin. 2011, 85, 636–658. [Google Scholar]
- Wu, M.Q.; Samson, I.M.; Zhang, D.H. Textural and Chemical Constraints on the Formation of Disseminated Granite-hosted W-Ta-Nb Mineralization at the Dajishan Deposit, Nanling Range, Southeastern China. Econ. Geol. 2017, 112, 855–887. [Google Scholar] [CrossRef]
- Zhao, B.; Han, L.; Pilz, J.; Wu, J.J.; Khan, F.; Zhang, D.H. Metallogenic Efficiency from Deposit to Region—A Case Study in Western Zhejiang Province, Southeastern China. Ore Geol. Rev. 2017, 86, 957–970. [Google Scholar] [CrossRef]
- Zhang, Z.; Xie, G.; Olin, P. Texture, in-situ geochemical, and S isotopic analyses of pyrite and arsenopyrite from the Longshan Sb-Au deposit, southern China: Implications for the genesis of intrusion-related Sb-Au deposit. Ore Geol. Rev. 2022, 143, 104781. [Google Scholar] [CrossRef]
- Liao, Y.; Zhao, B.; Zhang, D.; Danyushevsky, L.V.; Li, T.; Wu, M.; Liu, F. Evidence for temporal relationship between the late Mesozoic multistage Qianlishan granite complex and the Shizhuyuan W–Sn–Mo–Bi deposit, SE China. Sci. Rep. 2021, 11, 5828. [Google Scholar] [CrossRef]
- Liao, Y.; Zhang, D.; Danyushevsky, L.V.; Li, T.; Liu, Y. Protracted lifespan of the late Mesozoic multistage Qianlishan granite complex, Nanling Range, SE China: Implications for its genetic relationship with mineralization in the Dongpo ore field. Ore Geol. Rev. 2021, 139, 104445. [Google Scholar] [CrossRef]
- Laznicka, P. Giant metallic deposits—A century of progress. Ore Geol. Rev. 2014, 62, 259–314. [Google Scholar] [CrossRef]
- Mao, J.; Li, H.; Hidehiko, S.; Louis, R.; Bernard, G. Geology and Metallogeny of the Shizhuyuan Skarn-Greisen Deposit, Hunan Province, China. Int. Geol. Rev. 1996, 38, 1020–1939. [Google Scholar]
- Mao, J.; Li, H.; Song, X.; Rui, B.; Xv, Y.; Wang, D.; Lan, X.; Zhang, J. Geology and Geochemistry of the Shizhuyuan W-Sn-Mo-Bi Polymetallic Deposit, Hunan, China; Geological Publishing House: Beijing, China, 1998; p. 215. [Google Scholar]
- Lu, H.; Liu, Y.; Wang, C.; Xu, Y.; Li, H. Mineralization and Fluid Inclusion Study of the Shizhuyuan W-Sn-Bi-Mo-F Skarn Deposit, Hunan Province, China. Econ. Geol. 2003, 98, 955–974. [Google Scholar] [CrossRef]
- Yin, J.W.; Sang, J.K.; Lee, H.K.; Itay, T. K–Ar Ages of Plutonism and Mineralization at the Shizhuyuan W–Sn–Bi–Mo Deposit, Hunan Province, China. J. Asian Earth Sci. 2002, 20, 151–155. [Google Scholar] [CrossRef]
- Wu, S.; Mao, J.; Yuan, S.; Dai, P.; Wang, X. Mineralogy, fluid inclusion petrography, and stable isotope geochemistry of Pb–Zn–Ag veins at the Shizhuyuan deposit, Hunan Province, southeastern China. Miner. Depos. 2018, 53, 89–103. [Google Scholar] [CrossRef]
- Roberts, F.I. Trace element chemistry of pyrite: A useful guide to the occurrence of sulfide base metal mineralization. J. Geochem. Explor. 1982, 17, 49–62. [Google Scholar] [CrossRef]
- Li, Z.K.; Li, J.W.; Cooke, D.R.; Danyushevsky, L.; Zhang, L.; O’Brien, H.; Lahaye, Y.; Zhang, W.; Xu, H.J. Textures, trace elements, and Pb isotopes of sulfides from the Haopinggou vein deposit, southern North China Craton: Implications for discrete Au and Ag–Pb–Zn mineralization. Contrib. Mineral. Petrol. 2016, 171, 99. [Google Scholar] [CrossRef]
- Loftus-Hills, G.; Solomon, M. Cobalt, nickel and selenium in sulphides as indicators of ore genesis. Miner. Depos. 1967, 2, 228–242. [Google Scholar] [CrossRef]
- Hu, R.Z.; Chen, W.T.; Xu, D.R.; Zhou, M.F. Reviews and new metallogenic models of mineral deposits in South China: An introduction. J. Asian Earth Sci. 2017, 137, 1–8. [Google Scholar] [CrossRef]
- Li, X.H.; Li, W.X.; Li, Z.X.; Lo, C.H.; Wang, J.; Ye, M.F.; Yang, Y.H. Amalgamation between the Yangtze and Cathaysia Blocks in South China: Constraints from SHRIMP U–Pb zircon ages, geochemistry and Nd–Hf isotopes of the Shuangxiwu volcanic rocks. Precambrian Res. 2009, 174, 117–128. [Google Scholar] [CrossRef]
- Mao, J.; Xie, G.; Guo, C.; Chen, Y. Large-scale tungsten-tin mineralization in the Nanling region, South hina:Metallogenic ages and corresponding geodynamic processes. Acta Petrol. Sin. 2007, 23, 2329–2338. [Google Scholar]
- Wang, C.L.; Luo, S.W.; Xv, Y.Z.; Sun, Y.H.; Xie, C.G.; Zhang, C.M.; Xv, W.G. Geology of the Shizhuyuan Tungsten Polymetallic Deposit; Geological Publishing House: Beijing, China, 1987. [Google Scholar]
- Chen, Y.C.; Pei, R.F.; Zhang, H.L. The Geology of Non-Ferrous and Rare Metal Deposits Related to Mesozoic Granitoids in Nanling Region; Geological Publishing House: Beijing, China, 1990; pp. 79–85. [Google Scholar]
- Wang, M.; Bai, X.J.; Yun, J.B.; Zhao, L.H.; Li, Y.L.; Wang, Z.Y.; Pu, Z.P.; Qiu, H. 40Ar/30Ar dating mineralization of Shizhuyuan polymetallic deposit. Geochemica 2016, 45, 41–51. [Google Scholar]
- Guo, C.L.; Wang, R.C.; Yuan, S.D.; Wu, S.H.; Yin, B. Geochronological and geochemical constraints on the petrogenesis and geodynamic setting of the Qianlishan granitic pluton, Southeast China. Mineral. Petrol. 2015, 109, 253–282. [Google Scholar] [CrossRef]
- Krupp, R.E. Solubility of stibnite in hydrogen sulfide solutions, speciation, and equilibrium constants, from 25 to 350 °C. Geochim. Cosmochim. Acta 1988, 52, 3005–3015. [Google Scholar] [CrossRef]
- Danyushevsky, L.; Robinson, P.; Gilbert, S.E.; Norman, M.; Large, R.; Mcgoldrick, P.; Shelley, M. Routine quantitative multi-element analysis of sulphide minerals by laser ablation ICP-MS: Standard development and consideration of matrix effects. Geochem. Explor. Environ. Anal. 2011, 11, 51–60. [Google Scholar] [CrossRef]
- Longerich, H.P.; Jackson, S.E. Laser Ablation Inductively Coupled Plasma Mass Spectrometric Transient Signal Data Acquisition and Analyte Concentration Calculation. J. Anal. At. Spectrom. 1996, 11, 899–904. [Google Scholar] [CrossRef]
- Guillong, M.; Hametner, K.; Reusser, E.; Wilson, S.A.; Günther, D. Preliminary Characterisation of New Glass Reference Materials (GSA-1G, GSC-1G, GSD-1G and GSE-1G) by Laser Ablation-Inductively Coupled Plasma-Mass Spectrometry Using 193 nm, 213 nm and 266 nm Wavelengths. Geostand. Geoanal. Res. 2010, 29, 315–331. [Google Scholar] [CrossRef]
- Jiang, Y.H.; Jiang, S.Y.; Zhao, K.D.; Ling, H.F. Petrogenesis of Late Jurassic Qianlishan granites and mafic dykes, Southeast China: Implications for a back-arc extension setting. Geol. Mag. 2006, 143, 457–474. [Google Scholar] [CrossRef] [Green Version]
- Whitney, D.L.; Evans, B.W. Abbreviations for names of rock-forming minerals. Am. Mineral. 2010, 95, 185–187. [Google Scholar] [CrossRef]
- Genna, D.; Gaboury, D. Deciphering the Hydrothermal Evolution of a VMS System by LA-ICP-MS Using Trace Elements in Pyrite: An Example from the Bracemac-McLeod Deposits, Abitibi, Canada, and Implications for Exploration. Econ. Geol. 2015, 110, 2087–2108. [Google Scholar] [CrossRef]
- Maslennikov, V.; Maslennikova, S.; Large, R.; Danyushevsky, L. Study of trace element zonation in vent chimneys from the Silurian Yaman-Kasy volcanic-hosted massive sulfide deposit (Southern Urals, Russia) using laser ablation-inductively coupled plasma mass spectrometry (LA-ICPMS). Econ. Geol. 2009, 104, 1111–1141. [Google Scholar] [CrossRef]
- Craig, J.R.; Vokes, F.M.; Solberg, T.N. Pyrite: Physical and chemical textures. Miner. Depos. 1998, 34, 82–101. [Google Scholar] [CrossRef]
- Abraitis, P.K.; Pattrick, R.A.D.; Vaughan, D.J. Variations in the compositional, textural and electrical properties of natural pyrite: A review. Int. J. Miner. Processing 2004, 74, 41–59. [Google Scholar] [CrossRef]
- Ciobanu, C.L.; Cook, N.J.; Spry, P.G. Preface—Special Issue: Telluride and selenide minerals in gold deposits—How and why? Mineral. Petrol. 2006, 87, 163–169. [Google Scholar] [CrossRef]
- Large, R.; Dayushevsky, L.; Hollit, C.; Maslennikov, V.; Meffre, S.; Gilbert, S.; Bull, S.; Scott, R.; Emsbo, P.; Thomas, H.; et al. Gold and Trace Element Zonation in Pyrite Using a Laser Imaging Technique: Implications for the Timing of Gold in Orogenic and Carlin-Style Sediment-Hosted Deposits. Econ. Geol. 2009, 104, 635–668. [Google Scholar] [CrossRef]
- Reich, M.; Kesler, S.E.; Utsunomiya, S.; Palenik, C.S.; Chryssoulis, S.L.; Ewing, R.C. Solubility of gold in arsenian pyrite. Geochim. Cosmochim. Acta 2005, 69, 2781–2796. [Google Scholar] [CrossRef]
- Laflamme, J.H.G.; de Villiers, J.P.R.; Buseck, P.R.; Chryssoulis, S.L.; Cabri, L.J. The nature of “invisible” gold in arsenopyrite. Can. Mineral. 1989, 27, 353–362. [Google Scholar]
- Majzlan, J.; Chovan, M.; Andráš, P.; Newville, M.; Wiedenbeck, M. The nanoparticulate nature of invisible gold in arsenopyrite from Pezinok (Slovakia). Neues Jahrb. Für Mineral.-Abh. J. Mineral. Geochem. 2010, 187, 1–9. [Google Scholar] [CrossRef]
- Foord, E.E.; Daniel, R.; Conklin, N.M. Coexisting galena, PbSss and sulfosalts: Evidence for multiple episodes of mineralization in the round mountain and manhattan gold districts, Nevada. Can. Mineral. 1988, 26, 355–376. [Google Scholar]
- Li, Z.; Li, X. Formation of the 1300-km-wide intracontinental orogen and postorogenic magmatic province in Mesozoic South China: A flat-slab subduction model. Geology 2007, 35, 179. [Google Scholar] [CrossRef]
- Shikazono, N.; Nakata, M.; Tokuyama, E. Pyrite with high Mn content from the Nankai Trough formed from subduction-induced cold seepage. Mar. Geol. 1994, 118, 303–313. [Google Scholar] [CrossRef]


| Sample | Mineralizing Zone | Location | Location | Longitude | Latitude | Sample |
|---|---|---|---|---|---|---|
| 490-28 | W-Sn-Mo-Bi | Shizhuyuan | Tunnel 490–516 | 25°44′ | 113°10′ | Complex Skarn |
| 490-13 | Shizhuyuan | Tunnel 490 P2C2 eastern 10 m | 25°44′ | 113°10′ | Simple Skarn | |
| S3-2 | Chaishan | Tunnel 500 in Chaishan | 25°43′ | 113°09′ | Complex Skarn | |
| S8-2 | Pb-Zn | Chaishan | Tunnel 640 in Chaishan | 25°43′ | 113°09′ | Pb-Zn Ore |
| QX-1 | Shexingping | 81-3 Ore Tunnel 450 in Shexingping | 25°43′ | 113°08′ | Pb-Zn Ore | |
| WTP-4 | Hg-Sb | Wutongping | Wutongping | 25°40′ | 113°09′ | Hg-Sb Ore |
| Zone | Sample | Rock | Mineral Assembly | Extreme Enrichment (1000–500 ppm) | Strong Enrichment (500–100 ppm) | Middle Enrichment (100–10 ppm) | Slight Enrichment (10–1 ppm) |
|---|---|---|---|---|---|---|---|
| W-Sn-Mo-Bi | 490-28 | Complex Skarn | Py+Cpy+Mo | As-Bi-Co-Pb-Ni-Cu-Sn-Mn-Ti | Sb-Cr-Se-Zr-Te-Tl-Ag-Zn | ||
| 490-13 | Simple Skarn | Py+Mo | As | Ni | Pb-Co-Sb-Mn-Mo-Bi-Cu | Ti-Se-Tl-Cr-Zn-W-Te-Sn-Ag | |
| S3-2 | Complex Skarn | Py+Mo | As | Cu | Pb-Th -Bi-Co | Mn-Te-Se-Mo-Sb-Ti-Ag-Ni-Zn-Zr-U | |
| Pb-Zn | S8-2 | Ore | Py+AsPy+Ga+Sp | Ta | Cu-Co-Mn-Sn-As | Ti-Zn-Th-Bi-W-Se-Ni | Pb-Mo-Cr-V-Ag-Te |
| QX-1 | Ore | Ga+Sp+Py | Mn | Pb-Ti-Zr-Ag-Se-Cu-As-Sn | |||
| Hg-Sb | WTP-4 | Ore | Ga+St+Py | As-Mn-Ni | Cu-Sb-Co-Ti-Pb-Zn-Cr-Se | Mo-Zr-V-Tl |
| Sample | No | Minimum | Maximum | Average | Median |
|---|---|---|---|---|---|
| 490-28 | 37 | 0.3 | 10 | 4 | 4 |
| 490-13 | 20 | 0.02 | 3 | 0.4 | 0.2 |
| S3-2 | 23 | 1 | 535 | 69 | 15 |
| S8-2 | 20 | 0.04 | 289 | 21 | 2 |
| QX-1 | 19 | 0.04 | 0.4 | 0.2 | 0.1 |
| WTP-4 | 29 | 0.01 | 3 | 0.4 | 0.09 |
| Sample | Parameter | Ti | V | Cr | Mn | Fe | Co | Ni | Cu | Zn | As | Se |
|---|---|---|---|---|---|---|---|---|---|---|---|---|
| 490-28 | Median | 2 | 0.04 | 0.5 | 0.9 | 465,341 | 48 | 13 | 1 | 0.7 | 3 | 7 |
| Average | 12 | 0.12 | 7 | 15 | 464,380 | 54 | 27 | 21 | 1 | 79 | 7 | |
| Minimum | 0.1 | 0.01 | 0.03 | 0.04 | 458,563 | 0.3 | 0.07 | 0.02 | 0.2 | 0.02 | 0.3 | |
| Maximum | 247 | 0.87 | 136 | 193 | 465,431 | 429 | 432 | 348 | 4 | 494 | 13 | |
| 490-13 | Median | 1.5 | 0.06 | 1.3 | 2 | 464,733 | 8.7 | 39 | 12 | 2 | 288 | 8 |
| Average | 9.8 | 0.07 | 4.5 | 26 | 464,233 | 67 | 348 | 16 | 5 | 654 | 8 | |
| Minimum | 0.3 | 0.01 | 0.23 | 0.36 | 460,809 | 1 | 4 | 0.58 | 0.01 | 20 | 3 | |
| Maximum | 158 | 0.23 | 32 | 187 | 465,410 | 462 | 3466 | 51 | 15 | 4294 | 17 | |
| S3-2 | Median | 3 | 0.01 | 0 | 2 | 464,921 | 30 | 0.5 | 174 | 0.6 | 167 | 7 |
| Average | 3 | 0.04 | 0.26 | 11 | 464,245 | 47 | 2 | 270 | 2 | 1045 | 7 | |
| Minimum | 0.12 | 0.01 | 0.02 | 0.15 | 454,416 | 0.1 | 0.07 | 0.01 | 0.02 | 0.28 | 0.32 | |
| Maximum | 6.8 | 0.16 | 1.4 | 134 | 465,461 | 254 | 16 | 1348 | 15 | 5914 | 16 | |
| S8-2 | Median | 9 | 0.5 | 0.48 | 6 | 462,168 | 3.6 | 1 | 2 | 5 | 58 | 13 |
| Average | 53 | 2 | 2.3 | 261 | 457,515 | 275 | 11 | 289 | 45 | 109 | 12 | |
| Minimum | 1 | 0.02 | 0.03 | 0.04 | 408,641 | 0.1 | 0.09 | 0.02 | 0.3 | 1.8 | 2.4 | |
| Maximum | 624 | 18 | 15 | 2152 | 465,448 | 3803 | 142 | 2699 | 364 | 817 | 19 | |
| QX-1 | Median | 1 | 0.03 | 0 | 21 | 465,450 | 0.04 | 0.2 | 1 | 0.34 | 1 | 2 |
| Average | 3 | 0.14 | 0.29 | 62 | 465,104 | 0.04 | 0.3 | 2 | 0.55 | 1 | 2 | |
| Minimum | 0.3 | 0.01 | 0.07 | 5 | 459,566 | 0.01 | 0.09 | 0.1 | 0.01 | 0.06 | 0.1 | |
| Maximum | 7 | 0.5 | 2.08 | 485 | 465,467 | 0.07 | 0.77 | 5.1 | 2.2 | 3 | 2.9 | |
| WTP-4 | Median | 24 | 0.3 | 3.02 | 2 | 464,997 | 8.8 | 101 | 11 | 0.64 | 43 | 9.8 |
| Average | 42 | 2 | 12 | 185 | 463,936 | 43 | 119 | 76 | 15 | 188 | 10 | |
| Minimum | 1 | 0.01 | 0.02 | 0.02 | 457,672 | 0.04 | 1.1 | 1.1 | 0.01 | 10 | 0.66 | |
| Maximum | 306 | 14 | 133 | 1687 | 465,407 | 387 | 473 | 1490 | 214 | 2801 | 19 | |
| Sample | Parameter | Zr | Nb | Mo | Ag | Cd | Sn | Sb | Te | Gd | Hf | Ta |
| 490-28 | Median | 0.04 | 0.1 | 0.08 | 0.4 | 0.09 | 0.2 | 0.2 | 0.2 | 0.06 | 0.03 | 0.01 |
| Average | 7 | 1 | 0.2 | 2 | 0.1 | 17 | 9 | 5 | 0.06 | 0.4 | 0.07 | |
| Minimum | 0.02 | 0.03 | 0.03 | 0.03 | 0.05 | 0.01 | 0.02 | 0.03 | 0.04 | 0.01 | 0.01 | |
| Maximum | 56 | 4 | 0.6 | 11 | 0.2 | 330 | 243 | 83 | 0.06 | 2 | 0.18 | |
| 490-13 | Median | 0.04 | 0.01 | 0.2 | 0.7 | 0.06 | 0.2 | 9 | 0.3 | 0.02 | 0.01 | 0.01 |
| Average | 0.5 | 0.1 | 26 | 1 | 0.07 | 2 | 35 | 3 | 0.03 | 0.04 | 0.01 | |
| Minimum | 0.01 | 0.01 | 0.01 | 0.07 | 0.01 | 0.04 | 0.3 | 0.03 | 0.02 | 0.01 | 0.01 | |
| Maximum | 1.8 | 0.60 | 217 | 6 | 0.17 | 33 | 295 | 20 | 0.05 | 0.11 | 0.01 | |
| S3-2 | Median | 0.2 | 0.02 | 0.05 | 1 | 0.1 | 0.5 | 3 | 3 | 0.2 | 0.03 | 0.03 |
| Average | 2 | 0.07 | 6 | 2 | 0.1 | 0.7 | 5 | 10 | 1 | 0.3 | 0.04 | |
| Minimum | 0.03 | 0.01 | 0.01 | 0.02 | 0.02 | 0.01 | 0.08 | 0.01 | 0.02 | 0.01 | 0.01 | |
| Maximum | 4 | 0.2 | 35 | 11 | 0.4 | 2 | 39 | 113 | 3 | 0.71 | 0.09 | |
| S8-2 | Median | 0.2 | 0.09 | 0.07 | 0.3 | 0.1 | 1 | 0.2 | 1 | 0.1 | 0.02 | 0.01 |
| Average | 0.4 | 0.2 | 3 | 2 | 0.2 | 135 | 0.4 | 1 | 0.11 | 0.04 | 613 | |
| Minimum | 0.04 | 0.04 | 0.03 | 0.02 | 0.05 | 0.03 | 0.02 | 0.01 | 0.05 | 0.02 | 0.01 | |
| Maximum | 1 | 0.7 | 10 | 6 | 0.54 | 1425 | 2 | 4 | 0.20 | 0.08 | 4900 | |
| QX-1 | Median | 0.1 | 0.02 | 0.1 | 0.9 | 0.1 | 0.1 | 0.4 | 0.3 | 0.15 | 0.2 | 0 |
| Average | 2 | 0.02 | 0.1 | 2 | 0.1 | 1 | 0.8 | 0.3 | 0.15 | 0.2 | 0 | |
| Minimum | 0.03 | 0.02 | 0.02 | 0.13 | 0.08 | 0.01 | 0.06 | 0.01 | 0.15 | 0.09 | 0 | |
| Maximum | 8 | 0.02 | 0.2 | 8 | 0.3 | 7 | 3 | 0.56 | 0.15 | 0.3 | 0 | |
| WTP-4 | Median | 0.3 | 0.08 | 0.7 | 0.07 | 0.3 | 0.2 | 2 | 0.2 | 0.05 | 0.05 | 0.02 |
| Average | 6 | 0.1 | 9 | 0.7 | 0.6 | 0.6 | 47 | 0.2 | 0.2 | 0.5 | 0.02 | |
| Minimum | 0.02 | 0.01 | 0.02 | 0.01 | 0.05 | 0.01 | 0.2 | 0.03 | 0.04 | 0.01 | 0.01 | |
| Maximum | 115 | 0.6 | 136 | 7 | 4 | 2 | 736 | 0.43 | 0.9 | 4 | 0.05 | |
| Sample | Parameter | W | Pt | Au | Tl | Pb206 | Pb207 | Pb208 | Bi | Th | U | |
| 490-28 | Median | 0.04 | 0.02 | 0.03 | 0.2 | 2 | 2 | 2 | 3 | 0.01 | 0.01 | |
| Average | 0.3 | 0.02 | 0.05 | 4 | 41 | 35 | 37 | 79 | 0.04 | 0.1 | ||
| Minimum | 0.01 | 0.01 | 0.01 | 0.01 | 0.05 | 0.01 | 0.1 | 0.09 | 0.01 | 0.01 | ||
| Maximum | 3 | 0.02 | 0.21 | 90 | 403 | 378 | 386 | 937 | 0.27 | 0.7 | ||
| 490-13 | Median | 0.1 | 0.02 | 0.06 | 1 | 31 | 30 | 30 | 5 | 0.03 | 0.03 | |
| Average | 4 | 0.02 | 0.08 | 8 | 76 | 71 | 74 | 17 | 0.03 | 0.1 | ||
| Minimum | 0.01 | 0.01 | 0.01 | 0.02 | 0.5 | 0.3 | 0.6 | 0.05 | 0.01 | 0.01 | ||
| Maximum | 26 | 0.06 | 0.29 | 88 | 519 | 488 | 496 | 131 | 0.04 | 0.4 | ||
| S3-2 | Median | 0.03 | 0.02 | 0.06 | 0.4 | 38 | 27 | 19 | 24 | 0.17 | 0.02 | |
| Average | 0.1 | 0.02 | 0.11 | 0.4 | 73 | 59 | 60 | 47 | 66 | 1 | ||
| Minimum | 0.01 | 0.01 | 0.02 | 0.01 | 0.4 | 0.01 | 0.02 | 0.05 | 0.01 | 0.01 | ||
| Maximum | 0.69 | 0.03 | 0.34 | 0.95 | 456 | 361 | 397 | 288 | 372 | 6.2 | ||
| S8-2 | Median | 0.05 | 0.01 | 0.03 | 0.09 | 2 | 2 | 2 | 5 | 2 | 0.03 | |
| Average | 16 | 0.01 | 0.03 | 0.3 | 6 | 9 | 8 | 21 | 26 | 0.1 | ||
| Minimum | 0.01 | 0.01 | 0.01 | 0.01 | 0.2 | 0.3 | 0.05 | 0.2 | 0.01 | 0.01 | ||
| Maximum | 248 | 0.02 | 0.08 | 1.8 | 40 | 53 | 50 | 125 | 100 | 0.51 | ||
| QX-1 | Median | 0.02 | 0.02 | 0.01 | 0.01 | 2 | 2 | 3 | 0.1 | 0.01 | 0.03 | |
| Average | 0.03 | 0.02 | 0.02 | 0.02 | 5 | 3 | 4 | 0.1 | 0.02 | 0.05 | ||
| Minimum | 0.02 | 0.02 | 0.01 | 0.01 | 0.5 | 0.1 | 0.7 | 0.04 | 0.01 | 0.01 | ||
| Maximum | 0.06 | 0.02 | 0.03 | 0.03 | 35 | 14 | 14 | 0.17 | 0.03 | 0.14 | ||
| WTP-4 | Median | 0.05 | 0.02 | 0.03 | 0.2 | 17 | 18 | 17 | 0.05 | 0.03 | 0.025 | |
| Average | 0.1 | 0.02 | 0.06 | 1 | 22 | 21 | 21 | 0.2 | 0.07 | 0.22 | ||
| Minimum | 0.01 | 0.01 | 0.01 | 0.01 | 1 | 1.6 | 1 | 0.01 | 0.01 | 0.01 | ||
| Maximum | 0.6 | 0.02 | 0.27 | 20 | 81 | 78 | 81 | 1 | 0.5 | 2 | ||
| Mineralizing Zones | Sample | Isomorphism | Micro-Inclusion | Inclusion |
|---|---|---|---|---|
| W-Sn-Mo-Bi | 490-28 | Co, Ni, As | Bi, Pb, Ag, Tl, Te | |
| 490-13 | Co, Ni, As | Pb, Sb, Tl | ||
| S3-2 | As, Co | Pb, Bi | Bi, Pb, As | |
| Pb-Zn | S8-2 | Co, Ni, As | Pb, Bi | |
| QX-1 | Mn, Pb | Pb, Ag | ||
| Hg-Sb | WTP-4 | Mn, Pb | Pb-Zn-Cu | Pb, Zn, Cu, Sb; V, As |
| Mineralizing Zones | Sample | Core | Rim |
|---|---|---|---|
| W-Sn-Mo-Bi | 490-28 | Co, Ni | Pb, Ag, Sb, Bi |
| Pb-Zn | S8-2 | As, Co | Co, Ni, As, Te, Sb, Ag, Pb, Bi, Cu |
| QX-1 | Pb, Mn, Cu | Mn, Sb, Pb, Ag |
| Element | Content vs. Temperature | Comparison | Combination | DV | HT(ppm) | MT(ppm) | LT(ppm) |
|---|---|---|---|---|---|---|---|
| Bi | Positively related | LT and OZ: Te-Bi; MT-HT: Pb-Bi | Tl/Bi | >20 | 2< and <20 | <2 | |
| Pb | IZ >OZ>MZ | Bi, Sb, Cu, Tl | Pb/Bi | >1.5 | 0.01< and <1.5 | <0.01 | |
| Cu | IZ >OZ>MZ | Pb, Zn, Sb | |||||
| Co/Ni | Positively related | Co/Ni | >1 | <1 | <1 | ||
| Au | IZ >OZ>MZ | Ag, Te, As | |||||
| IZ (ppm) | MZ(ppm) | OZ(ppm) | |||||
| Ag | Variation in orders | IZ >MZ>OZ | Au, Te, Sb, Pb | Average | 1.2–2.1 | 0.5 | |
| Sb | Variation in orders | MZ<IZ <OZ | Sb, Tl, Pb, Cu | Average | 4–8.3 | 0.3 | 44.1 |
| Mn | IZ <MZ<OZ | Average | 16 | 102 | 166 | ||
| V | Average | 0.03 | 0.54 | 1.54 | |||
| Rim | Location | Sample | Rock | Combination | Variation |
|---|---|---|---|---|---|
| W-Sn-Mo-Bi | Shizhuyuan | 490-13 | Simple Skarn | Co-Ni-As, Pb-Sb-Tl | Bi: gradually increase |
| 490-28 | Complex Skarn | Co-Ni-As, Pb-Bi-Ag-Sb-Tl-Te | |||
| Chaishan | S3-2 | Complex Skarn | Bi: gradually decrease; Mn, Sb: gradually increase; Pb, Cu: decrease after increase | ||
| Pb-Sb | Chaishan | S8-2 | Galena Ore | As-Co, Pb-Bi-Te-Sb | |
| Shexingping | QX-1 | Galena Ore | Mn-Pb-Cu, Ag-Sb | ||
| Hg-Sb | Wutongping | WTP-4 | stibnite Ore | Mn-Pb-Cu, Sb-Zn |
Publisher’s Note: MDPI stays neutral with regard to jurisdictional claims in published maps and institutional affiliations. |
© 2022 by the authors. Licensee MDPI, Basel, Switzerland. This article is an open access article distributed under the terms and conditions of the Creative Commons Attribution (CC BY) license (https://creativecommons.org/licenses/by/4.0/).
Share and Cite
Liao, Y.; Zhang, D.; Li, T.; Lu, C.; Liu, F. Mineralized Zones of the Shizhuyuan Ore Field and Their Genetic Relationship with the Qianlishan Granite Complex, NE China: Evidence from Pyrite In Situ Geochemistry. Minerals 2022, 12, 489. https://doi.org/10.3390/min12040489
Liao Y, Zhang D, Li T, Lu C, Liu F. Mineralized Zones of the Shizhuyuan Ore Field and Their Genetic Relationship with the Qianlishan Granite Complex, NE China: Evidence from Pyrite In Situ Geochemistry. Minerals. 2022; 12(4):489. https://doi.org/10.3390/min12040489
Chicago/Turabian StyleLiao, Yuzhong, Dehui Zhang, Tonglin Li, Chuan Lu, and Feng Liu. 2022. "Mineralized Zones of the Shizhuyuan Ore Field and Their Genetic Relationship with the Qianlishan Granite Complex, NE China: Evidence from Pyrite In Situ Geochemistry" Minerals 12, no. 4: 489. https://doi.org/10.3390/min12040489