
Apatite, Ca10(PO4)6(OH,F,Cl)2: Structural Variations, Natural Solid Solutions, Intergrowths, and Zoning


Department of Geoscience, University of Calgary, Calgary, AB T2N 1N4, Canada
*
Author to whom correspondence should be addressed.
Minerals 2022, 12(5), 527; https://doi.org/10.3390/min12050527
Submission received: 8 March 2022
/
Revised: 6 April 2022
/
Accepted: 21 April 2022
/
Published: 23 April 2022
(This article belongs to the Section Crystallography and Physical Chemistry of Minerals & Nanominerals)
Abstract
:Thirty-three samples from natural apatite (Ap) solid solutions, ideal structural formula [9]Ca12[7]Ca23([4]PO4)3[3](F,OH,Cl), (Z = 2) were examined with electron-probe microanalysis, synchrotron high-resolution powder X-ray diffraction (HRPXRD), and Rietveld refinements. Apatite has space group P63/m for the general chemical formula above. In Ap, the two different Ca sites are generally occupied by Ca, Mn, Sr, Na, or REE3+ cations; the P site is occupied by P, Si, or S, and the X is occupied by F, OH, Cl, O2−, or (CO3)2− anions. However, it may be possible for CO32− + F− anions to partially replace PO43− groups. In this study, the unit-cell parameters a, c, and c/a ratio, vary smoothly and non-linearly with the unit-cell volume, V. The data falls on two distinct trend lines. The average <P-O>[4] distance is nearly constant across the Ap series, whereas the average <O-P-O>[6] angle decreases linearly. The coordination numbers for the atoms are given in square brackets in the general chemical formula above. The average <Ca1-O>[9], <Ca2-O>[6], <Ca2-O,X>[7], and Ca2-X distances change non-linearly with increasing V. Although Cl− anion is larger than OH− and F− anions, the c unit-cell parameter in F-Ap is larger than that in Cl-Ap. In Cl-Ap, the Ca2 polyhedra are larger than in F-Ap, so the O and Cl anions are under-bonded, which cause the Ca1 polyhedra to contract and charge balance the anions. Alternatively, the Ca1 polyhedra are smaller in Cl-Ap than in F-Ap, so the Ca1 polyhedra in Cl-Ap cause the c axis to contract compared to that in F-Ap.
1. Introduction
Common apatite (Ap) supergroup minerals have the general chemical formula Ca5(PO4)3(OH,F,Cl), Z = 2. The ideal structural formula for natural apatite solid solutions is [9]Ca14[7]Ca26([4]PO4)6[3](F,OH,Cl)2, (Z = 1). Apatite samples are of interest in various fields, including geology. Hydroxyapatite, OH-Ap, Ca10[PO4]6(OH)2, is well-known in biological sciences as the main constituent of dental enamel and human bones. Apatite (Ap) is an accessory mineral and is the main phosphorous host in crustal rocks [1]. Fluorapatite, F-Ap, Ca10[PO4]6F2, is the most common member of the apatite-group minerals. Murayama et al. [2] indicated that F- and OH-Ap end members are stable to pressures exceeding 10 GPa, i.e., down to ca. 350 km depth in the Earth’s mantle, where Ap could also be a potential phosphorous host. However, little is known about apatite structure under mantle conditions or at high temperatures.
The crystal structure of Ap is known for many natural and synthetic samples that make up apatite solid solutions, M10(TO4)6X2. The M site usually contains Ca2+ metal cations that may be substituted by Mn2+, Sr2+, Na+, or REE3+ cations to various extents. The tetrahedral T site commonly contains P5+ cations that may be substituted by S6+ or Si4+ cations [3]. The X site may contain F−, Cl−, OH−, O2−, S2−, or (CO3)2− anions [4,5]. Examination of data from room-temperature structure refinements may provide information about systematic structural relations across Ap solid solutions. For example, how and why do the unit-cell parameters vary across apatite solid solutions? The Cl atom is considerably larger than the F and OH anions that have nearly the same size, but OH is slightly larger than F, yet the c unit-cell parameter in Cl-Ap is smaller than that in either F- or OH-Ap. Why?
Previous structural studies did not show any systematic trends across natural Ap solid solutions, even for the unit-cell parameters. For Ca-Ap samples, plots of unit-cell volume, V, versus the c/a ratio show considerable scatter (see Figures 10 and 17 in White et al. [6]). They also examined 25 data sets for OH-Ap samples and showed that there is a substantial spread of data in c versus a plot (their Figure 17). In both cases, no clear trends were evident, which may arise from disequilibrium or compositional effects.
Optical anomalies were observed in sector-zoned Ap crystals from Japan and Bolivia [7,8]. Instead of uniaxial hexagonal character, biaxial optical features with different 2V angles were observed, which indicates low symmetry groups. However, electron and X-ray diffraction data showed no reflections inconsistent with P63/m symmetry. The above authors suggested that the lowering of the optical symmetry from hexagonal may arise from F and OH anion ordering in Ap. Optical anomalies and zoning were observed in many garnet crystals that are made up of a few slightly different garnet phases that cause strain-induced optical anomalies, e.g., [9,10]. Ap crystals may contain a few slightly different apatite phases that may also cause strain-induced optical anomalies. Slightly different apatite phases were reported for an Ap crystal from Brazil [3].
This study examines systematic relations across Ap solid solutions based on the crystal structure of 33 natural samples obtained using synchrotron high-resolution powder X-ray diffraction (HRPXRD) data and Rietveld refinements. Some data from the literature are included for comparison to data from this study.
2. Crystal Structure of Ap, Ca10(PO4)6(OH,F,Cl)2
The crystal chemistry of Ap-group minerals has been reviewed by several researchers as its importance has increased with regards to mineralogical, materials, environmental, and biological issues [1,5,6,11,12,13,14,15].
A good structure for apatite was obtained by Beevers and McIntyre [16]. Thereafter, several structure refinements were carried out on many different apatite-type materials [6]. F-Ap, Ca10(PO4)6F2, is hexagonal with space group P63/m [17]. Some OH-Ap, Ca10(PO4)6(OH)2, and Cl-Ap, Ca10(PO4)6C12, are monoclinic with space group P21/b [18,19]. All three natural end-members were refined with space group P63/m [17,20,21]. White et al. [6] listed structural and chemical information for an extremely large number of apatite-type materials that were previously published.
The apatite structure is based on PO4 tetrahedron and polyhedra of CalO9 and Ca2O6X (X = OH, F, Cl) (Figure 1 and Figure 2). The X anions are located in channels parallel to the hexagonal 63 axis (Figure 1). In F-Ap, the F anions lie on the mirror planes at z = ¼ and z = ¾, and are surrounded by three Ca cations that form a triangle within the mirror planes with a F-Ca distance of 2.311 Å [20]. In Cl-Ap, because the Cl ions are larger than the F ions, the Cl ions do not fit in the Ca triangle, so the Cl ions occur at 1.2 Å either below or above the mirror planes [20]. Note the following radii: [3]F = 1.30 Å; [3]OH = 1.34 Å; [6]Cl = 1.81 Å [22]. From one column to the other, the Cl ions are successively all ordered above and all ordered below the plane [19]. This leads to a lowering of the symmetry from hexagonal (P63/m) to monoclinic (P21/b) with a doubling of the b cell-edge in Cl-Ap, so bmono = 2 × bhex [19]. Such a monoclinic superstructure is also encountered in OH-Ap, where the OH groups are displaced along c by 0.35 Å from the 2a position [23].
3. Experimental Methods
3.1. Electron-Probe Microanalysis (EPMA)
The Ap samples were analyzed using a JEOL JXA-8200 WD-ED electron-probe microanalysis (EPMA). The JEOL operating program on a Solaris platform was used for ZAF (atomic number, Z; absorption, A; fluorescence, F) correction and data reduction. The wavelength-dispersive (WD) analyses were conducted quantitatively using an accelerated voltage of 15 kV, a beam current of 20 nA, and a beam diameter of 5 μm. Relative analytical errors were 1% for major elements and 5% for minor elements. Various standards were used: fluorapatite (Ca, P, F), CePO4 (Ce), LaPO4 (La), NdPO4 (Nd), YPO4 (Y), hornblende (Fe, Mg), rhodonite (Mn), scapolite (Cl), strontianite (Sr), barite (Ba, S), albite (Na), and orthoclase (Si). About 10 data points were collected for each sample. Table 1 contains the sample localities and their average chemical compositions are given in Table S1. Tables S1–S5 are available online as Supplementary Materials.
3.2. Synchrotron High-Resolution Powder X-ray Diffraction (HRPXRD)
Single crystals of apatite, about 0.2 mm in diameter, were hand-picked under a binocular microscope, and finely ground in a corundum mortar and pestle for synchrotron high-resolution powder X-ray diffraction (HRPXRD) experiments that were performed at beamline 11-BM, Advanced Photon Source, Argonne National Laboratory. Each sample was loaded into a Kapton capillary (0.8 mm internal diameter) and rotated during the experiment at a rate of 90 rotations per second. The data were collected to a maximum 2θ of about 50° with a step size of 0.001° and a step time of 0.1 s per step. The HRPXRD traces were collected with a unique multi-analyzer detection assembly consisting of twelve independent silicon (111) crystal analyzers and LaCl3 scintillation detectors that reduce the angular range to be scanned and allow for rapid acquisition of data. A silicon (NIST 640c) and alumina (NIST 676a) standard (ratio of ⅓ Si: ⅔ Al2O3 by weight) was used to calibrate the instrument and to refine the monochromatic wavelength [λ ≈ 0.41 Å] used in the experiment (see Table 1 for λ values). Additional details of the experimental set-up are given elsewhere [24,25,26]. The experimental techniques used in this study are well established [27,28,29,30,31,32,33,34].
3.3. Rietveld Structural Refinement
The crystal structure was modeled using the Rietveld method [35] that is incorporated in the GSAS program [36] and using the EXPGUI interface [37]. For the room-T structure of F-Ap, the starting atom coordinates, unit-cell parameters, and space group P63/m were taken from Sudarsanan et al. [17]. The background was modeled with a Chebyshev polynomial (8 terms). In the GSAS program, the reflection-peak profiles were fitted using type-3 profile pseudo-Voigt; [38,39]. The structure refinements were carried out by varying parameters in the following sequence: scale factor, background, unit-cell parameters, zero shift, profile, atom positions, isotropic, and then anisotropic displacement parameters, U. The site-occupancy factor (sofs) for the Ca1, Ca2, P, and X sites were also refined. Finally, all variables were refined simultaneously. No constraints were used for single-phase Ap samples. For the multi-phase Ap samples, U for similar atoms were constrained to be equal.
Table 1 contains unit-cell parameters and other information regarding data collection and structure refinements. Table S2 contains the atom coordinates and isotropic displacement parameters. Table S3 contains the anisotropic displacement parameters, Uij. Table S4 contains the bond distances and angles.
4. Results and Discussion
4.1. Chemical Analyses
The chemical compositions for the Ap samples are given in Table S1. The atom per formula unit (apfu) are based on 10 M cations, and OH was calculated by assuming OH = 2 − (F + Cl). This method gives good apfu that are expected for Ap. In the P site, the dominant ion is P that varies from 5.72 (sample-4b) to 6.13 apfu (sample-32). Minor amounts of Si and S exist in the P site. Sample-17 contains the most S (0.13 apfu) and sample-22 contains the most Si (0.12 apfu).
In Table 1, the unit-cell V are generally listed in increasing order, so sample-1 has the smallest and sample-32 has the largest V. Sample-1 contains a significant amount of Mn ions (0.47 apfu), so it has the smallest unit-cell V. Samples-2, -3, and -9 also contain minor amounts of Mn ions. Small amounts of Sr ions are present in samples-2, -3, and -8, but in general, the amount of Sr ions in our samples is insignificant. Samples-32, -30, and -20 contain a significant amount of Na ions. Ca ions are dominant in the M sites and their total amounts vary from 9.41 to 9.99 apfu. Other cations in the M site are insignificant.
Fluorine ions vary from 0.25 to 2.00 apfu. Sample-30 contains the least amount of (0.245 apfu) F ions and the maximum amount of Cl ions (1.727 apfu). Sample-32 also contains a significant amount of Cl ions (0.88 apfu). Samples-2, -3, -19, -22, -23, -24, -26, and -29 contain significant amounts of OH anions. Sample-30b contains a small amount of an (OH,Cl)-rich Ap phase (7 wt.%; Table 1), so OH and Cl are not reflected in the chemical analyses. Sample-33 contains three F-Ap phases (Table 1 and Table S1). Except for the Cl-rich samples-30a and -32, there is an inverse relation between F and OH ions. It is not clear why the chemical analyses for sample-4 does not show any OH group, but the refinement indicates 56% of OH-Ap and 44% of F-Ap.
Back-scattered electron (BSE) images for five samples with different features of compositional zoning are shown (Figure 3). Sample-4 contains a two-phase intergrowth of F-Ap and OH-Ap where the contrast differences arise from variations in cations instead of O and F anions (see Figure 4a). Zoning occurs in single-phase samples-5 and -6 where the contrast differences arise from variations in cations (see Figure 4b,c). Zoning occurs in a two-phase sample-31 where the contrast differences arise from variations in cations (see Figure 4d). A three-phase intergrowth consisting of three slightly different F-Ap hexagonal phases occur in sample-33 where the contrast differences arise from variations in cations (see Figure 4d). The multiple phases are recognized by splitting of reflections in the HRPXRD traces as shown below for samples-4, -29, -30, and -33. Splitting of reflections and multiple phases were observed in other minerals [40,41,42,43,44,45,46].
The variations of the cations for the M sites in the above five samples are shown (Figure 4). There is a reciprocal relation between Ca and Mn cations in sample-4 (Figure 4a), sample-5 (Figure 4b), and sample-33 (Figure 4e). The sum of Mn and Sr cations are high when the amount of Ca cations is low in sample-6 (Figure 4c) and sample-31 (Figure 4d). Separate Ap phases are clearly observed in diffraction traces for samples-4, -31, and -33, as discussed below. However, diffraction data show that sample-5 and -6 are single hexagonal phases.
4.2. High-Resolution Powder X-ray Diffraction (HRPXRD) Traces and Intergrowths in Apatite-Group Minerals
Ap-group minerals crystallize well with excellent crystal faces. Many are of gem quality, so Ap samples are prominently displayed in museums. Most Ap samples used in this study are pure, hexagonal single phases that are F-rich (Table 1 and Table S1). Some samples contain intergrowths of either two different phases (samples 4, 8, 29, 30, and 31) or three such phases (sample 33). Sample-4 contains a two-phase intergrowth of F-Ap phase-4a (44 wt.%) and OH-Ap phase-4b (56 wt.%), respectively (Table 1). The unit-cell parameters for OH-Ap are slightly larger than those for F-Ap because OH is slightly larger than the F anion (Table 1). Sample-30 contains a two-phase intergrowth of Cl-Ap phase-30a (93 wt.%) and a (Cl, F)-rich Ap phase-30b (7 wt.%). Phase-30b has unit-cell parameters that are nearly mid-way between those for F-Ap and Cl-Ap (Table 1). Except for the unit-cell parameters, good structural data are not possible for phase-30b because of the small amount.
Figure 5 shows a comparison of HRPXRD traces for a single-phase F-Ap (sample-2) and a two-phase intergrowth of Cl-Ap phase-30a and (Cl, F)-rich Ap phase-30b (sample-30). In a transition from hexagonal to monoclinic apatite, the 300 hexagonal peak is split into three monoclinic peaks (300, 360, 060). Alternatively, those three monoclinic peaks merge into one hexagonal 300 peak as shown (inserts in Figure 5a,c) [47]. The F-Ap sample-2 contains sharp and symmetrical peaks (Figure 5b), whereas the intergrowth in sample-30 gives rise to separate reflection peaks because of the large differences in unit-cell parameters (Figure 5d). The c axis is smallest in Cl-Ap, so some reflections switch positions when compared to F-Ap (e.g., 112 and 300 reflections). Other studies have examined the Cl-Ap sample from Norway, but the (Cl, F)-rich Ap phase-30b was not observed in single-crystal studies [20]. Due to the small amount of the (Cl,F)-rich Ap phase-30b (7.4 wt.%), the crystal structure was not refined well, but good unit-cell parameters were obtained (Table 1). For phase-30b, the sofs and U values could not be refined, so the sofs for all the sites were set to 1, and the U values were fixed to similar atoms in Cl-Ap phase-30a. The structural parameters for phase-30b are listed (Tables S2 and S3), but these parameters are not shown in the graphs below.
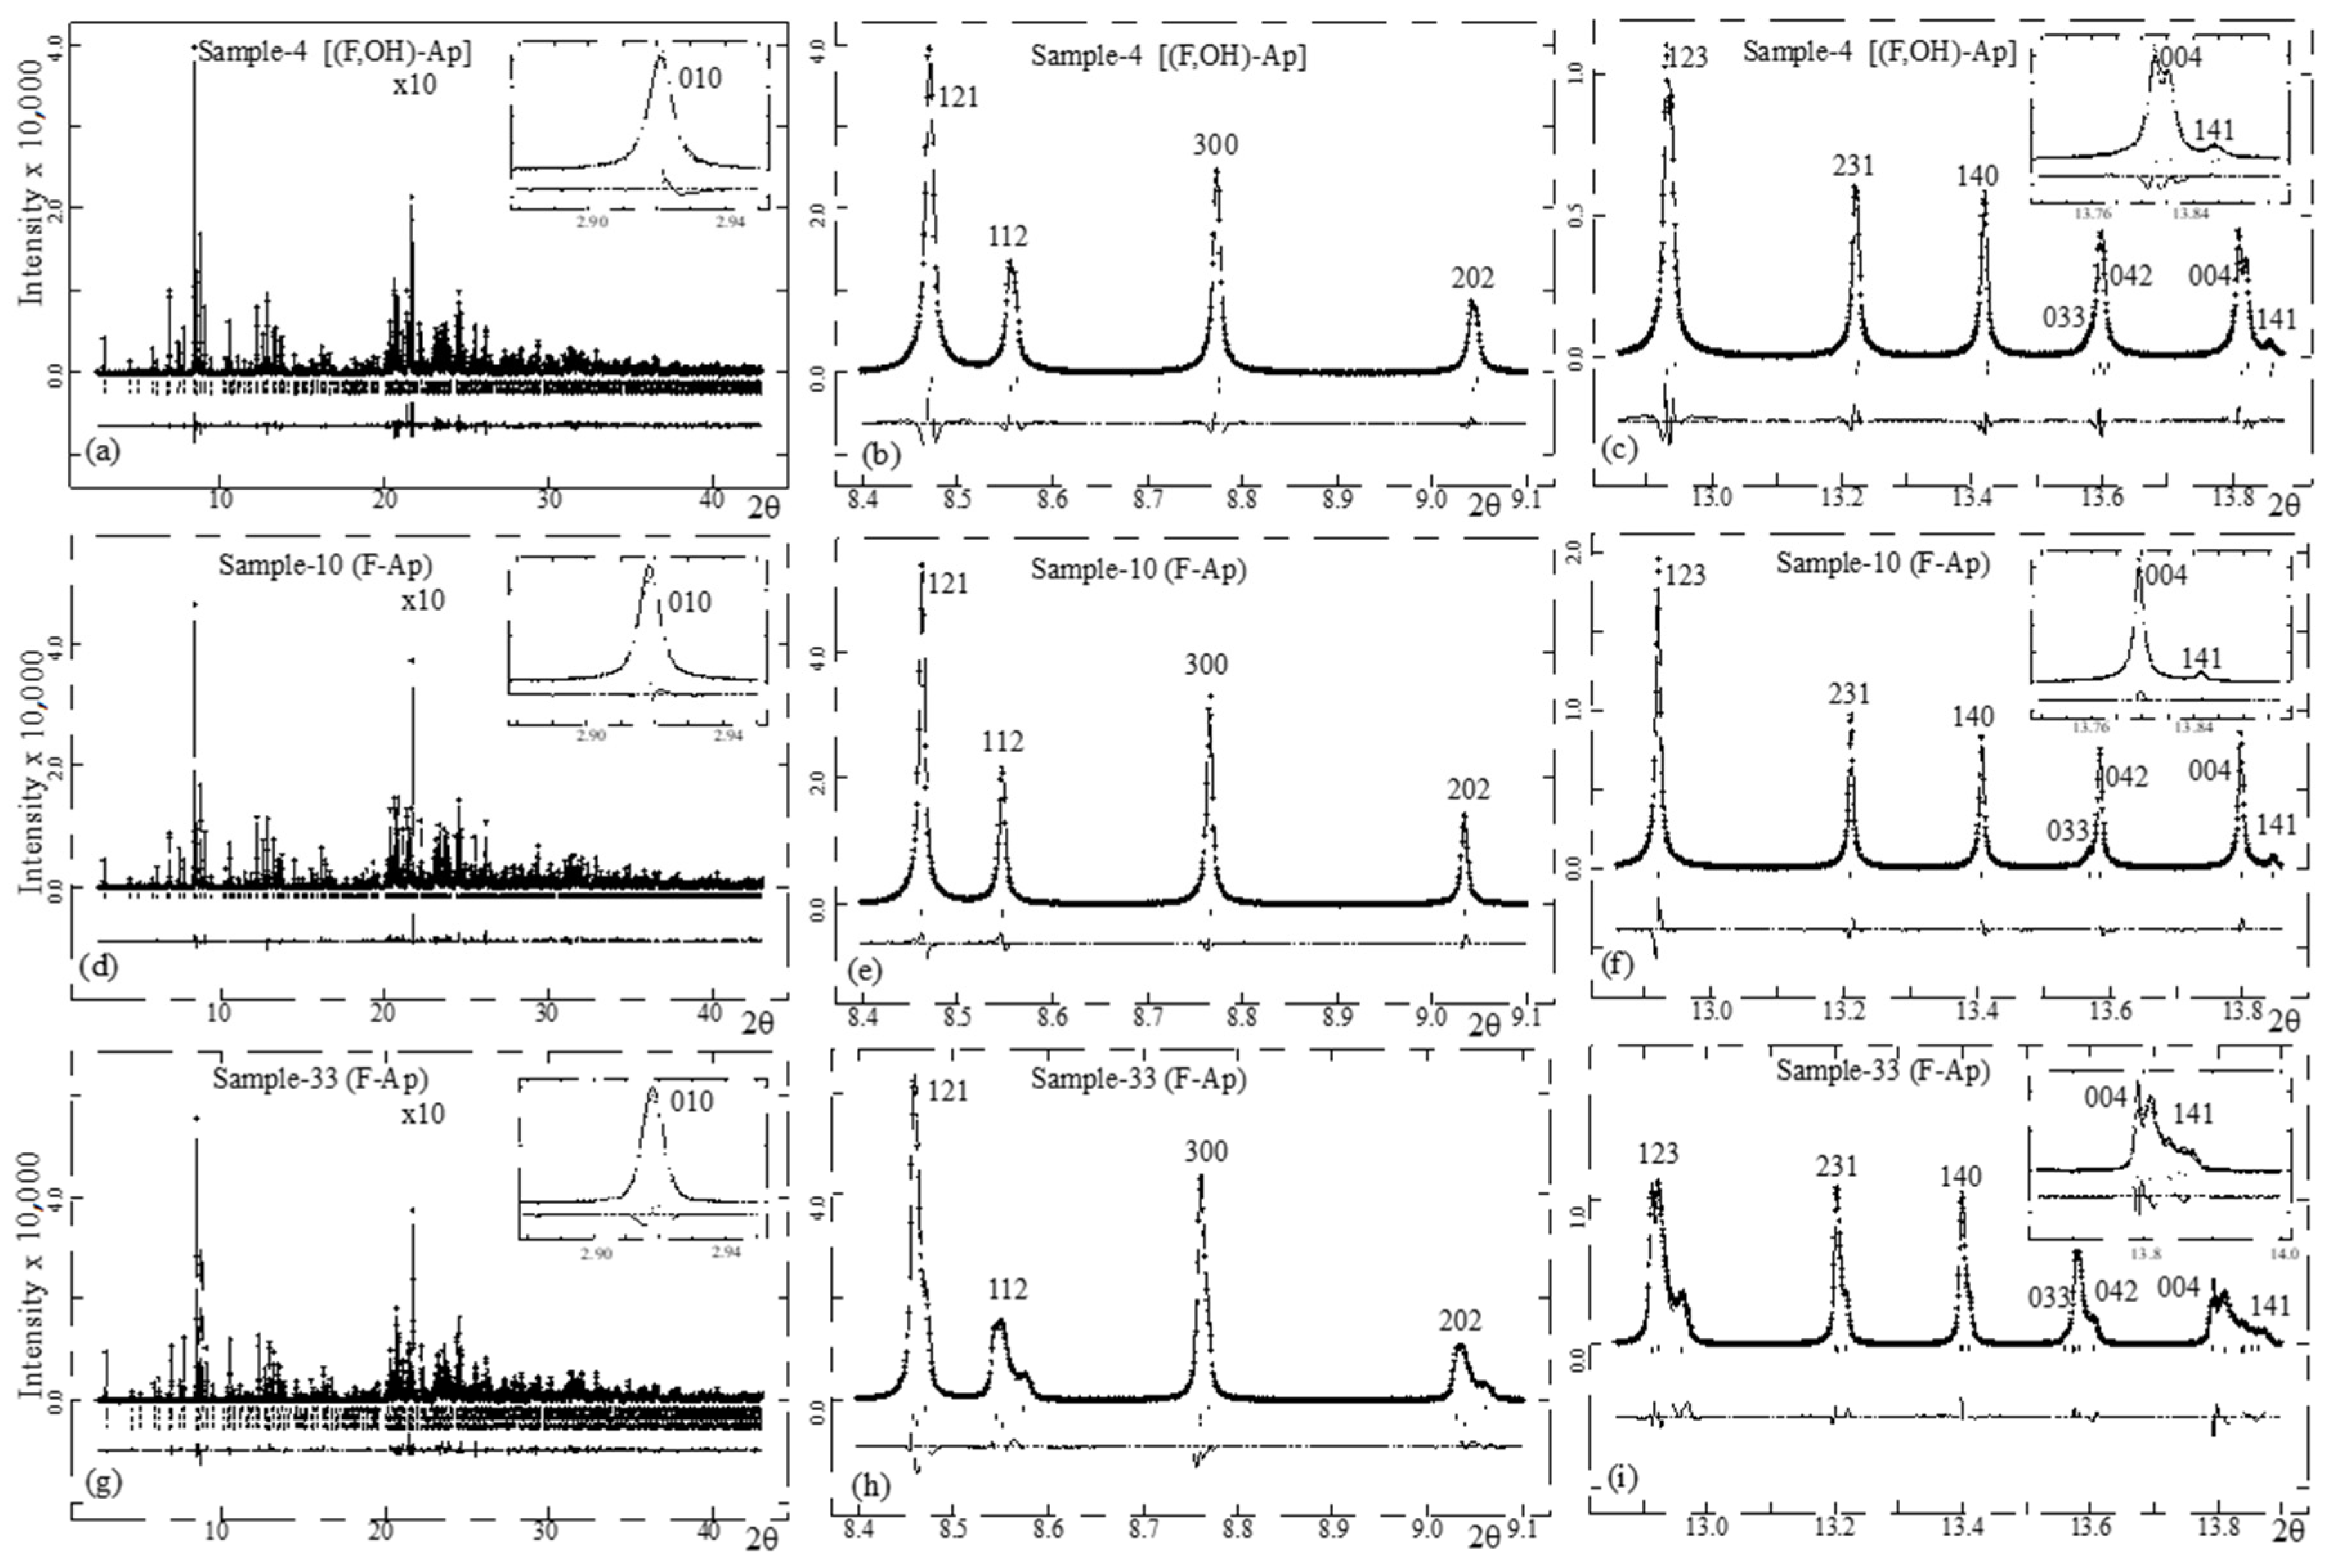
Figure 6 shows a comparison of HRPXRD traces for a two-phase intergrowth of F-Ap and OH-Ap (Figure 6a–c for sample-4), a single-phase F-Ap (Figure 6d,e,f for sample-10), and a three-phase intergrowth of three different F-Ap phases (Figure 6g–i for sample-33). The two-phase intergrowth of F-Ap (44 wt.%) and OH-Ap (56 wt.%) in sample-4 gives rise to split reflections (e.g., 004 in Figure 6c), instead of sharp, symmetrical, un-split reflections, as in the single-phase F-Ap sample-10 (Figure 6d–f). In sample-4, reflections that involve the c axis are split (e.g., 004, 121, 202 in Figure 6b,c), whereas their a axes are similar and give rise to un-split reflections (e.g., 300 in Figure 6b,h).
Sample-33 from Sapo Mine, Brazil, contains a three-phase intergrowth of three slightly different F-Ap phases (Figure 6g–i; Table 1). Additional split reflections in other samples are shown in Figure 7. The unit-cell parameters for the apatite samples are shown in graphs below (Figure 8 and Figure 9) and are listed in Table 1.
A cm-sized blue gem-quality crystal of Ap from Ipirá, Brazil, with an average composition of (Ca3.95Na0.05)Ca5.99(P5.69Si0.18S0.13)O24(F1.52Cl0.12OH0.34) also contains a three-phase Ap intergrowth [3,6,48]. The separate domains were observed with HRTEM, and in combination with AEM analyses, it was established that two phases are F- and Cl-rich apatites, and the third is an ellestadite-type apatite phase. The authors concluded that the crystal contains three apatite phases with distinct chemical compositions. A Pawley fit to their synchrotron powder XRD trace (Rwp = 21%) gave unit-cell parameters corresponding to F-Ap [a = 9.4246(4), c = 6.8816(2) Å, V = 529.354 Å3], OH-Ap [a = 9.4118(2), c = 6.8855(3) Å, V = 528.216 Å3], and a monoclinic OH-ellestadite-type phase [a = 9.4122(3), b = 9.3999(1), c = 6.8940(2) Å, γ = 119.877(3)°, V = 528.875 Å3 in space group P1121/m]. Based on the combined TEM and XRD data, the authors concluded that the Ipirá crystal contains a total of four phases: the above three phases and Cl-Ap [3]. However, the Cl-Ap phase seems questionable because it has quite distinct unit-cell parameters, as also noted by the authors. The authors indicated that the complex nanostructure of the Ipirá crystal arises from consecutive, or nested, spinodal decompositions, but this description remains unproven. Although our sample-33 contains three F-Ap phases that appear to be similar to that observed for the Ipirá crystal, our unit-cell parameters are different (see Table 1). The intergrowths in Ipirá Ap described above are quite different from a simple overgrowth of an Ap crystal core by another Ap crystal on the rim, so that single crystals can be separated and studied from each part [49].
Many minerals have unit-scale inhomogeneities or phase separations that accommodate nonstoichiometry, especially when equilibrium is slow to achieve. Surprisingly, apatites, especially those of some chemical complexity, have stood apart as true “solid solutions” having statistical distributions of cations, notwithstanding that long-range ordering of the X anions is known [6]. Although multiphase apatite intergrowths were first detected with HRTEM-AEM, such features are much easier to detect with powder XRD [3,48]. Synchrotron HRPXRD were also used to observe multiphase intergrowths in minerals such as genthelvite [41] and many birefringent garnet-group minerals, e.g., [9,10]. The multiphase intergrowths observed in these zoned minerals give rise to strain-induced optical anomalies. Such intergrowths may also be the cause for the observed optical anomalies in some Ap samples, which was mentioned in the Section 1.
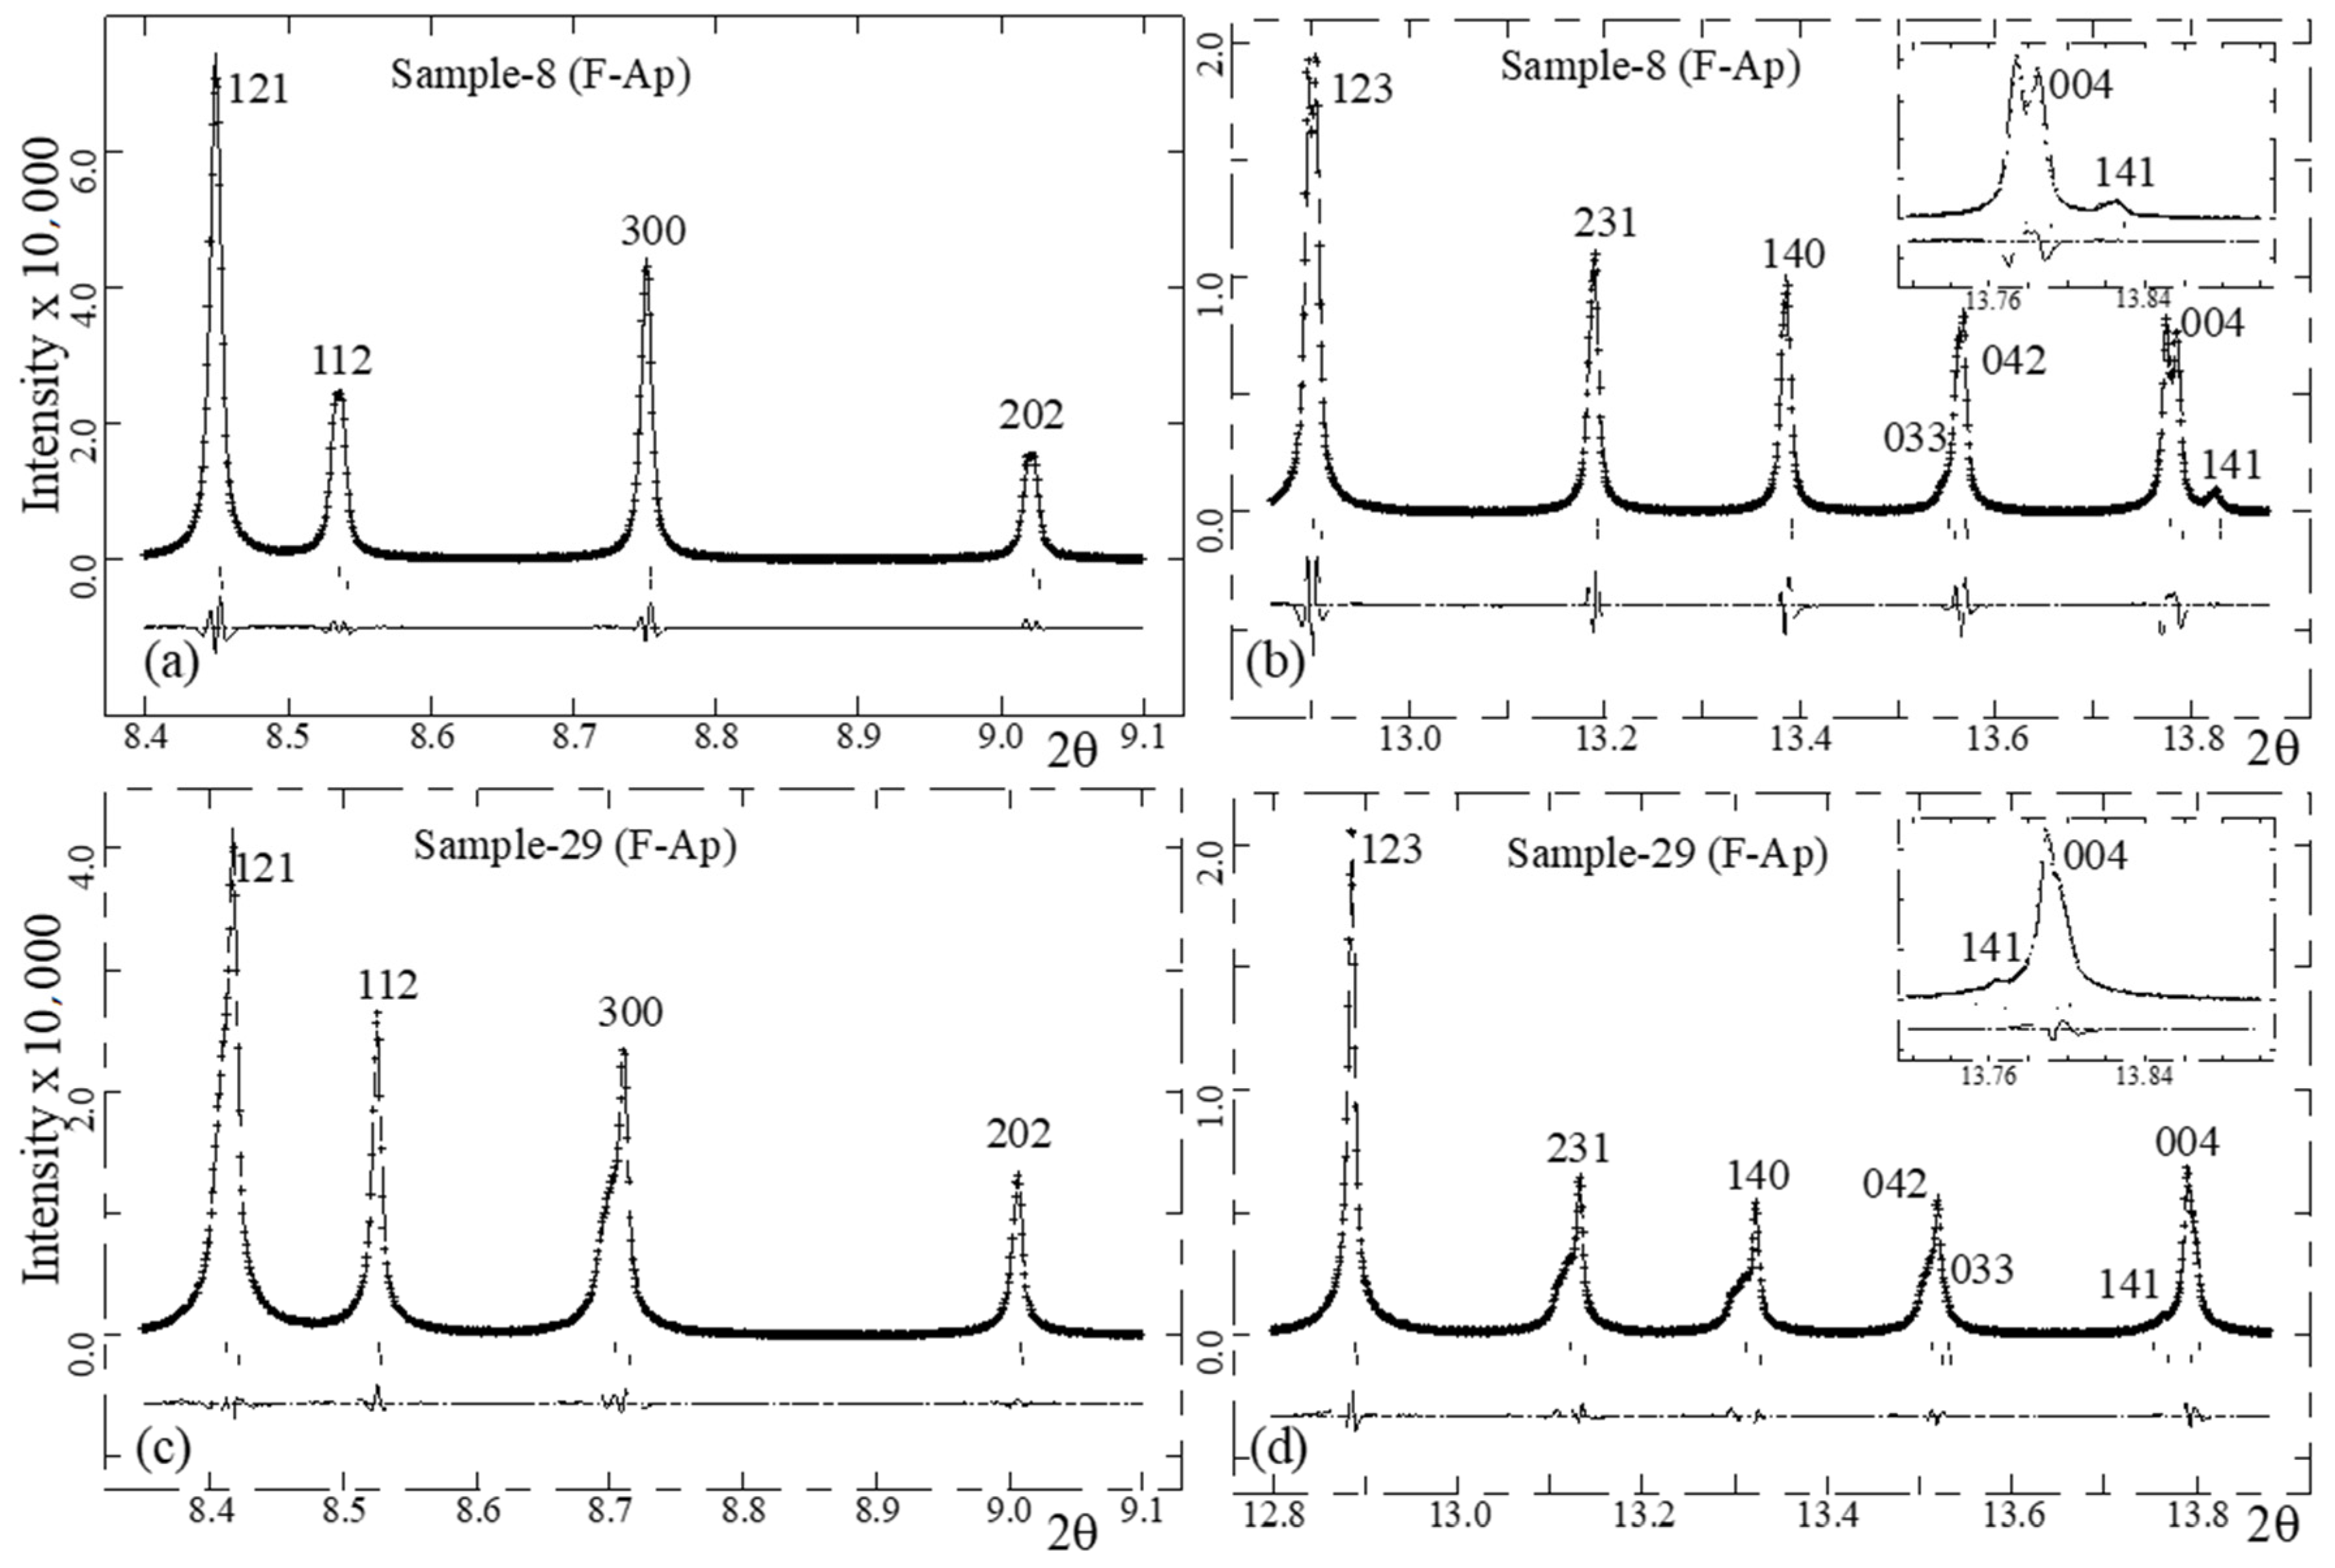
Figure 7 shows a comparison of HRPXRD traces for an intergrowth of two different F-Ap phases (48 and 52 wt.%) in sample-8 (Figure 7a,b), as well as an intergrowth of two different F-Ap phases (55 and 45 wt.%) in sample-29 (Figure 7c,d). The detection of the two-phase intergrowths are based on the structure refinement and split reflections, especially the 004 reflection (Figure 7b). In each sample, the unit-cell parameters for both phases are close to each other (Table 1). In sample-29, one phase occurs as a sharp peak and the other as a broad hump (e.g., 140 reflection in Figure 7d).
4.3. Variations of Unit-Cell Parameters across Natural Apatite Solid Solutions
Across natural Ap solid solutions, the unit-cell parameters a, c, and c/a ratio vary smoothly and non-linearly with volume, V, and appear to fall on two different trend lines (Table 1, Figure 8 and Figure 9). The a axis increases non-linearly with increasing V (Figure 8a), whereas both the c axis and c/a ratio increase and then decrease with increasing V (Figure 8b,c). The c unit-cell parameter varies non-linearly with the a unit-cell parameter (Figure 9). The red trend lines are based on data only from this study (Figure 8 and Figure 9).
For comparison to data from this study, data from several other studies (see legend in Figure 8 and Table S5) are combined into four groups and shown as triangles (Figure 8 and Figure 9). The studies indicated by triangles are mainly from one research group. Group-1 contains four synthetic binary (F1,Cl1)-Ap samples and are indicated by open blue triangles [50]. Group-2 contains three natural Ap end-member samples and is indicated by solid black triangles [20]. Group-3 contains a natural ternary Ap sample from Utah and is indicated by a solid blue triangle [51]. Group-4 contains five Mn- and Sr-rich natural Ap samples [52,53,54]. Our (Cl,OH)-rich Ap sample-30b has unit-cell parameters that are about mid-way between the end-members F-Ap and Cl-Ap, and are similar to the synthetic group-1 samples.
Additional literature data are also shown [55,56,57]. The comparison shows that the data for the larger a unit-cell parameter agrees quite well with data from this study (Figure 8a). However, there is less agreements for the smaller c unit-cell parameter and that for the c/a ratio (Figure 8b,c). This disagreement is clear in the graph of c versus a (Figure 9). If the literature data, indicated by triangles, for example, were to be fitted by a single curve, the relation would be quite complex and viewed with suspicion for solid solutions that are generally expected to show simple relations among unit-cell data, as indicated by the fitted red trend lines shown for data from this study (Figure 8 and Figure 9). Some group-4 data (black open triangles) appear to follow different black trend lines (Figure 8 and Figure 9). Unit-cell parameters from Hovis et al. [56,57] were obtained from ion-exchange samples. Unit-cell and structural data from Fleet et al. [55] are based on synthetic REE-bearing Cl-Ap samples.
Our samples are generally listed with increasing V, except for sample-33 (Table 1). The Mn-rich F-Ap sample-1 has the smallest V, which increases to F-Ap, OH-Ap, and then Cl-Ap. This trend follows the size of the ions: Mn < Ca < Sr and Cl > OH > F. Our phase-30b (Table 1) is a (Cl,OH)-rich Ap, which has unit-cell parameters that plot nearly mid-way between the OH-Ap and Cl-Ap end-members (Figure 8 and Figure 9). This observation indicates that (Cl,OH)-rich Ap solid solutions exist in nature. However, the separate F-Ap and OH-Ap phases found in sample-4 indicate that (F,OH)-Ap solid solutions may not be stable, or exist to limited extent in nature. Many of our samples contain two- (samples-4, -8, -29, -30, -31) or three-phase intergrowths (sample-33), which brings the natural Ap solid solutions into question, however, the synthetic series do exist (Figure 8 and Figure 9).
4.4. Crystal Structure of Natural Apatite Solid Solutions
The essential features of the Ap structure obtained in this study are the same as those observed in previous studies. The Ap structure consists of three main structural units (Figure 1 and Figure 2). In our refinements of the Ap structure, the site occupancy factors (sofs) were set to 1 for the O atoms, but the sofs were refined for the Ca1, Ca2, P, and X sites (Table S2). The refined sofs provide an independent check on the EPMA data (Table S1). The sof for the Ca1 site range from 0.939(1) for sample-18 to 1.081(4) for sample-33c. The sof for the Ca2 site range from 0.947(1) for samples-22 and -3 to 1.034(4) for sample-8b. These results, together with the chemical analyses, indicate that these sites are essentially filled with Ca atoms. However, samples -1, -2, -3 and -9 contain some Mn atoms (Table S1).
The sof for the P site range from 0.907(2) (sample-22) to 0.958(2) (sample-25), and in some cases, the sof was fixed to 1. However, sample-17 contains the most S atoms, whereas sample-22 contains the most Si atoms, and the sof of P for sample-25 is the largest (Table S1).
In F-Ap, z = ¼ and the sof for the F atom ranges from 0.932(3) in sample-3 to 1.038(4) in sample-27. In OH-Ap (sample-4b), z = 0.2272(12) and OH(sof) = 0.598(7). In Cl-Ap (sample-30a), z = 0.4347(2) and Cl(sof) = 0.452(1). The chemical analyses show significant amounts of OH ions in samples-2, -3, -19, -22, -23, -24, -26, and -29 (Table S1).
In F-Ap, the equivalent isotropic displacement parameter (Ueq.) for the F atom increases with V. In terms of the anisotropic displacement parameters for the F atom, the U33/U11 ratio increases with V (Table S3, Figure 10). The large increase in U33 over the U11 value indicates some positional disorder of the F atom out of the mirror plane at z = 1/4 and 3/4, or subtle disorder among F and OH ions. However, the chemical analyses does not show OH ions in all the samples. In sample-4, Ca2-F = 2.295(1) and Ca2-O(H) = 2.308(2) Å. Although F and OH ions occur on different sites in Ap, their distances from the Ca2 site are only slightly different. However, Ca2-Cl = 2.7718(5) Å is a much larger distance (sample-30a).
Regarding the large U33 value, Fleet et al. [55] noted that in both end-member F-Ap and REE-doped F-Ap [17,58,59,60], the thermal parameter of F ion parallel to the c axis is large (U33 ≈ 10 × U11) beyond that expected for thermal motion alone, indicating that the F anion is also displaced out of the mirror plane and is disordered. We observed similar features in this study (Figure 11).
4.5. Variations of Structural Parameters across Natural Apatite Solid Solutions
The PO4 tetrahedron is characterized by the average <P-O> <4> distance and average <O-P-O> <6> angles. The former linearly increases slightly with V, whereas the latter decreases linearly with V (Figure 12a,b).
The average <Ca1-O> <9> distance for the 9-coordinated Ca1 cation polyhedra increases and then decreases with increasing V (Figure 12c). However, the Ca2-X distance, average <Ca2-O> <6>, and average <Ca2-O,X> <7> distances of the 7-coordinated cation polyhedra increase with increasing volume in a similar manner (Figure 12d–f). The average <Ca2-O,X> <7> distance has a high correlation factor, R2 = 0.9992 (Figure 12f).
Data from the literature (see legends in Figure 12a and Table S5) match the data from this study to varying extents. For example, the data for the four group-1 samples (open blue triangle) are quite off (Figure 12a–c), but close to the red trend line (Figure 12f). The data represented by the four solid triangles (groups-2 and -3) appear to fall on a linear line Figure 12a,c,d,f), but not in Figure 12e. In any case, if all the single-crystal data, indicated by triangles, were taken as a group to show the relations across apatite solid solutions, a complex picture may arise, instead of the simple relation indicated by the red and black trend lines (Figure 12).
Although Cl is larger than OH and F anions, the c axis in F-Ap is larger than that in Cl-Ap (Figure 8b). In Cl-Ap, the Ca2 polyhedra is larger than in F-Ap as judged from the average <Ca2-O,X> <7> distance (Figure 12f), so the O and Cl anions are under-bonded in Cl-Ap, therefore, the Ca1 polyhedra contract to charge balance the O anions, as judged from the average <Ca1-O> <9> distance. The average <Ca1-O> <9> distance in Cl-Ap is smaller than in F-Ap (Figure 12c). The smaller Ca1 polyhedron in Cl-Ap causes the c axis to contract compared to that in F-Ap. As the average <Ca1-O> <9> distance in (F,OH)-Ap is larger than in Cl-Ap (Figure 12c), the O atoms in the Ca1 polyhedron are under-bonded, so the average <P-O> <4> is shorter in (F,OH)-Ap and is larger in Cl-Ap.
Shannon [22] gives the following radii for atoms in various co-ordinations in Ap: [9]Ca = 1.18 and [3]O = 1.36 Å, so the radii sum gives Ca-O = 2.54 Å, which is nearly the same as in Cl-Ap (Figure 12e,f), and is close to the average <Ca1-O>[9] ≈ 2.555 Å in (F,OH)-Ap (Figure 12c). The average <Ca1-O> <9> distance decreases from F-Ap to Cl-Ap. The Cl atom in the X site causes a contraction in the Ca1 polyhedron in Cl-Ap. The univalent anions have the following radii: [3]F = 1.30; [3]OH = 1.34 Å; [6]Cl = 1.81 Å [22], so the Ca2-X distance increases in a similar manner (Figure 12d). If [7]Ca = 1.06 Å is used [22], the radii sum gives Ca2-O = 2.42 Å compared to the average <Ca2-O>[6] ≈ 2.46 Å in (F,OH)-Ap (Figure 12e).
5. Concluding Remarks
Understanding natural apatite solid solutions requires good structural data across the series. Although single-crystal structure refinements are available for many members across the series, it may not be possible to examine the structural variations across the series using those studies. This study shows that good structural information can be obtained with synchrotron HRPXRD data and Rietveld method to show systematic variations across the apatite solid solutions. The structural data in Figure 12 appears to fall on two different trend lines: exchange of cations for the Ca atoms (black trend line) and mixing of F, OH, and Cl anions (red trend line).
Supplementary Materials
The following supporting information can be downloaded at: https://www.mdpi.com/article/10.3390/min12050527/s1, Table S1: Chemical compositions for 33 apatite samples with general formula close to Ca10(PO4)6X2.; Table S2: Atom coordinates and equivalent isotropic displacement parameters (Ueq × 102 Å2) for 33 apatite samples; Table S3: Apatite samples: anisotropic displacement parameters (Uij × 102 Å2) and Ueq × 102 Å2, and the ratio (U33/U11); Table S4: Bond distances (Å), angles (°), and averages for 33 apatite samples; Table S5: Information for some apatite samples from the literature, which are included in some Figures below for comparison to data from this study.
Author Contributions
K.S.H. performed the EPMA experiment, calculated the chemical compositions, and carried out some HRPXRD data analyses. S.M.A. conceived the project and analyzed some HRPXRD data. All authors have read and agreed to the published version of the manuscript.
Funding
This research was funded by an NSERC Discovery Grant to S.M.A., grant number 10013896.
Acknowledgments
The three anonymous reviewers are thanked for their comments which helped to improve this manuscript. The Natural History Museum of Los Angeles is thanked for providing some of the samples used in this study. Robert Marr is thanked for his help in obtaining EPMA data. The HRPXRD data were collected at the X-ray Operations and Research beamline 11-BM, Advanced Photon Source (APS), Argonne National Laboratory (ANL). Use of the APS was supported by the U.S. Dept. of Energy, Office of Science, Office of Basic Energy Sciences, under Contract No. DE-AC02-06CH11357.
Conflicts of Interest
The authors declare no conflict of interest.
References
- McConnell, D. Apatite: Its Crystal Chemistry, Mineralogy, Utilization, and Geologic and Biologic Occurrences; Springer: New York, NY, USA, 1973. [Google Scholar]
- Murayama, J.K.; Nakai, S.; Kato, M.; Kumazawa, M. A dense polymorph of Ca3(PO4)2: A high pressure phase of apatite decomposition and its geochemical significance. Phys. Earth Planet. Inter. 1986, 44, 293–303. [Google Scholar] [CrossRef]
- Baikie, T.; Schreyer, M.K.; Wong, C.L.; Pramana, S.S.; Klooster, W.T.; Ferraris, C.; McIntyre, G.J.; White, T.J. A multi-domain gem-grade Brazilian apatite. Am. Mineral. 2012, 97, 1574–1581. [Google Scholar] [CrossRef]
- Hovis, G.L.; Harlov, D. Solution calorimetric investigation of fluorchlorapatite crystalline solutions. Am. Mineral. 2010, 95, 946–952. [Google Scholar] [CrossRef]
- Pan, Y.; Fleet, M.E. Composition of the apatite-group minerals: Substitution mechanism and controlling factors. In Phosphates Geochemical, Geobiological, and Materials Importance; Kohn, M.L., Rakovan, J., Hughes, J.M., Eds.; Reviews in Mineralogy and Geochemistry, Mineralogical Society of America: Chantilly, VA, USA, 2002; Volume 48, pp. 13–49. [Google Scholar]
- White, T.J.; Ferraris, C.; Kim, J.; Madhavi, S. Apatite—An adaptive framework structure. In Micro- and Mesoporous Mineral Phases; Ferraris, G., Merlino, S., Eds.; Reviews in Mineralogy and Geochemistry, Mineralogical Society of America: Chantilly, VA, USA, 2005; Volume 57, p. 307. [Google Scholar]
- Akizuki, M.; Nisidoh, H.; Kudoh, Y.; Watanabe, T.; Kurata, K. Sector growth and symmetry of (F,OH) apatite from the Asio mine, Japan. Mineral. Mag. 1994, 58, 307–314. [Google Scholar] [CrossRef]
- Rakovan, J.; Reeder, R.J. Differential incorporation of trace elements and dissymmetrization in apatite: The role of surface structure during growth. Am. Mineral. 1994, 79, 892–903. [Google Scholar]
- Antao, S.M.; Mohib, S.; Zaman, M.; Marr, R.A. Ti-rich andradites: Chemistry, structure, multi-phases, optical anisotropy, and oscillatory zoning. Can. Mineral. 2015, 53, 133–158. [Google Scholar] [CrossRef]
- Antao, S.M.; Zaman, M.; Gontijo, V.L.; Camargo, E.S.; Marr, R.A. Optical anisotropy, zoning, and coexistence of two cubic phases in andradites from Quebec and New York. Contrib. Mineral. Petrol. 2015, 169, 10. [Google Scholar] [CrossRef]
- Nriagu, J.O.; Moore, P.B. Phosphate Minerals; Springer: New York, NY, USA, 1984. [Google Scholar]
- Wyckoff, R.W.G. Inorganic compounds Rx(MX4)y, Rx(MnXp)y, Hydrates and Ammoniates. In Crystal Structures; John Wiley and Sons: New York, NY, USA, 1965; Volume 3, pp. 228–234. [Google Scholar]
- Brown, P.W.; Constantz, B. Hydroxyapatite and Related Materials; CRC Press: Boca Raton, FL, USA, 1994. [Google Scholar]
- Elliott, J.C. Structure and Chemistry of the Apatites and Other Calcium Orthophosphates; Elsevier: Amsterdam, The Netherlands, 1994. [Google Scholar]
- Hughes, J.M.; Rakovan, J. The crystal structure of apatite Ca5(PO4)3(F, OH, Cl). Rev. Mineral. Geochem. 2002, 48, 1–12. [Google Scholar] [CrossRef]
- Beevers, C.A.; McIntyre, D.B. The atomic structure of fluor-apatite and its relation to that of tooth and bone material. Mineral. Mag. 1946, 27, 254–257. [Google Scholar]
- Sudarsanan, K.; Mackie, P.E.; Young, R.A. Comparison of synthetic and mineral fluorapatite, Ca5(PO4)3,F, in crystallographic detail. Mater. Res. Bull. 1972, 7, 1331–1338. [Google Scholar] [CrossRef]
- Elliott, J.C.; Mackie, P.E.; Young, R.A. Monoclinic hydroxylapatite. Science 1973, 180, 1055–1057. [Google Scholar] [CrossRef] [PubMed]
- Mackie, P.E.; Elliott, J.C.; Young, R.A. Monoclinic structure of synthetic Ca5(PO4)3CI, chlorapatite. Acta Crystallogr. 1972, B28, 1840–1948. [Google Scholar] [CrossRef]
- Hughes, J.M.; Cameron, M.; Crowley, K.D. Structural variations in natural F,OH, and Cl apatites. Am. Mineral. 1989, 74, 870–876. [Google Scholar]
- Sudarsanan, K.; Young, R.A. Significant precision in crystal structural details: Holly Springs hydroxyapatite. Acta Crystallogr. 1969, B25, 1534–1543. [Google Scholar] [CrossRef]
- Shannon, R.D. Revised effective ionic radii and systematic studies of interatomic distances in halides and chalcogenides. Acta Crystallogr. 1976, A32, 751–767. [Google Scholar] [CrossRef]
- Kay, M.I.; Young, R.A.; Posner, A.S. Crystal structure of hydroxyapatite. Nature 1964, 204, 1050–1052. [Google Scholar] [CrossRef]
- Lee, P.L.; Shu, D.; Ramanathan, M.; Preissner, C.; Wang, J.; Beno, M.A.; Von Dreele, R.B.; Ribaud, L.; Kurtz, C.; Antao, S.M.; et al. A twelve-analyzer detector system for high-resolution powder diffraction. J. Synchrotron Radiat. 2008, 15, 427–432. [Google Scholar] [CrossRef]
- Wang, J.; Toby, B.H.; Lee, P.L.; Ribaud, L.; Antao, S.M.; Kurtz, C.; Ramanathan, M.; Von Dreele, R.B.; Beno, M.A. A dedicated powder diffraction beamline at the advanced photon source: Commissioning and early operational results. Rev. Sci. Instrum. 2008, 79, 085105. [Google Scholar] [CrossRef]
- Antao, S.M.; Hassan, I.; Wang, J.; Lee, P.L.; Toby, B.H. State-of-the-art high-resolution powder X-ray diffraction (HRPXRD) illustrated with Rietveld structure refinement of quartz, sodalite, tremolite, and meionite. Can. Mineral. 2008, 46, 1501–1509. [Google Scholar] [CrossRef]
- Skinner, L.B.; Benmore, C.J.; Antao, S.M.; Soignard, E.; Amin, S.A.; Bychkov, E.; Rissi, E.; Parise, J.B.; Yarger, J.L. Structural changes in vitreous GeSe4 under pressure. J. Phys. Chem. C 2011, 116, 2212–2217. [Google Scholar] [CrossRef]
- Ehm, L.; Antao, S.M.; Chen, J.H.; Locke, D.R.; Michel, F.M.; Martin, C.D.; Yu, T.; Parise, J.B.; Lee, P.L.; Chupas, P.J.; et al. Studies of local and intermediate range structure in crystalline and amorphous materials at high pressure using high-energy X-rays. Powder Diffr. 2007, 22, 108–112. [Google Scholar] [CrossRef] [Green Version]
- Zaman, M.; Schubert, M.; Antao, S. Elevated radionuclide concentrations in heavy mineral-rich beach sands in the Cox’s Bazar region, Bangladesh and related possible radiological effects. Isot. Environ. Health Stud. 2012, 48, 512–525. [Google Scholar] [CrossRef] [PubMed]
- Martin, C.D.; Antao, S.M.; Chupas, P.J.; Lee, P.L.; Shastri, S.D.; Parise, J.B. Quantitative high-pressure pair distribution function analysis of nanocrystalline gold. Appl. Phys. Lett. 2005, 86, 061910. [Google Scholar] [CrossRef]
- Hassan, I.; Antao, S.M.; Parise, J.B. Haüyne: Phase transition and high-temperature structures obtained from synchrotron radiation and Rietveld refinements. Mineral. Mag. 2004, 68, 499–513. [Google Scholar] [CrossRef]
- Hassan, I.; Antao, S.M.; Hersi, A.A. Single-crystal XRD, TEM, and thermal studies of the satellite reflections in nepheline. Can. Mineral. 2003, 41, 759–783. [Google Scholar] [CrossRef]
- Antao, S.M.; Hassan, I.; Mulder, W.H.; Lee, P.L. The R-3c→R-3m transition in nitratine, NaNO3, and implications for calcite, CaCO3. Phys. Chem. Miner. 2008, 35, 545–557. [Google Scholar] [CrossRef]
- Antao, S.M.; Cruickshank, L.A. Crystal structure refinements of tetragonal (OH,F)-rich spessartine and henritermierite garnets. Acta Crystallogr. 2018, B74, 104–114. [Google Scholar] [CrossRef]
- Rietveld, H.M. A profile refinement method for nuclear and magnetic structures. J. Appl. Crystallogr. 1969, 2, 65–71. [Google Scholar] [CrossRef]
- Larson, A.C.; Von Dreele, R.B. General Structure Analysis System (GSAS); Los Alamos National Laboratory Report LAUR 86-748; Los Alamos National Laboratory: Los Alamos, NM, USA, 1987.
- Toby, B.H. EXPGUI, a graphical user interface for GSAS. J. Appl. Crystallogr. 2001, 34, 210–213. [Google Scholar] [CrossRef] [Green Version]
- Cagliotti, G.; Paoletti, A.; Ricci, F.P. Choice of collimators for a crystal spectrometer for neutron diffraction. Nucl. Instrum. 1958, 3, 223–228. [Google Scholar] [CrossRef]
- Thompson, P.; Cox, D.E.; Hastings, J.B. Rietveld refinement of Debye-Scherrer synchrotron X-ray data from alumina. J. Appl. Crystallogr. 1987, 20, 79–83. [Google Scholar] [CrossRef] [Green Version]
- Antao, S.M. The mystery of birefringent garnet: Is the symmetry lower than cubic? Powder Diffr. 2013, 28, 281–288. [Google Scholar] [CrossRef]
- Antao, S.M.; Hassan, I. A two-phase intergrowth of genthelvite from Mont Saint-Hilaire, Quebec. Can. Mineral. 2010, 48, 1217–1223. [Google Scholar] [CrossRef]
- Antao, S.M.; Klincker, A.M. Crystal structure of a birefringent andradite-grossular from Crowsnest Pass, Alberta, Canada. Powder Diffr. 2014, 29, 20–27. [Google Scholar] [CrossRef]
- Antao, S.M. Is near-endmember birefringent grossular non-cubic? New evidence from synchrotron diffraction. Can. Mineral. 2013, 51, 771–784. [Google Scholar]
- Antao, S.M. Crystal structure of morimotoite from Ice River, Canada. Powder Diffr. 2014, 29, 325–330. [Google Scholar] [CrossRef] [Green Version]
- Antao, S.M.; Round, S.A. Crystal chemistry of birefringent spessartine. Powder Diffr. 2014, 29, 233–240. [Google Scholar] [CrossRef] [Green Version]
- Antao, S.M.; Cruickshank, L.A. Two cubic phases in kimzeyite garnet from the type locality Magnet Cove, Arkansas. Acta Crystallogr. 2016, B72, 846–854. [Google Scholar] [CrossRef]
- Bauer, M.; Klee, W.E. The monoclinic-hexagonal phase transition in chlorapatite. Eur. J. Mineral. 1993, 5, 307–316. [Google Scholar] [CrossRef] [Green Version]
- Ferraris, C.; White, T.J.; Plévert, J.; Wegner, R. Nanometric modulation in apatite. Phys. Chem. Miner. 2005, 32, 485–492. [Google Scholar] [CrossRef]
- Kelly, S.R.; Rakovan, J.; Hughes, J.M. Column anion arrangements in chemically zoned ternary chlorapatite and fluorapatite from Kurokura, Japan. Am. Mineral. 2017, 102, 720–727. [Google Scholar] [CrossRef]
- Hughes, J.M.; Nekvasil, H.; Ustunisik, G.; Lindsley, D.H.; Coraor, A.E.; Vaughn, J.; Phillips, B.L.; McCubbin, F.M.; Woerner, W.R. Solid solution in the fluorapatite-chlorapatite binary system: High-precision crystal structure refinements of synthetic F-Cl apatite. Am. Mineral. 2014, 99, 369–376. [Google Scholar] [CrossRef]
- Hughes, J.M.; Cameron, M.; Crowley, K.D. Crystal structures of natural ternary apatites: Solid solution in the Ca5(PO4)3X (X = F, OH, Cl) system. Am. Mineral. 1990, 75, 295–304. [Google Scholar]
- Hughes, J.M.; Cameron, M.; Mariano, A.N. Rare-earth element ordering and structural variations in natural rare-earth-bearing apatites. Am. Mineral. 1991, 76, 1165–1173. [Google Scholar]
- Hughes, J.M.; Ertl, A.; Bernhardt, H.-J.; Rossman, G.R.; Rakovan, J. Mn-rich fluorapatite from Austria: Crystal structure, chemical analysis, and spectroscopic investigations. Am. Mineral. 2004, 89, 629–632. [Google Scholar] [CrossRef]
- Rakovan, J.; Hughes, J.M. Strontium in the apatite structure: Strontian fluorapatite and belovite-(Ce). Can. Mineral. 2000, 38, 839–845. [Google Scholar] [CrossRef]
- Fleet, M.E.; Liu, X.; Pan, Y. Rare-earth elements in chlorapatite [Ca10(PO4)6Cl2]: Uptake, site preference, and degradation of monoclinic structure. Am. Mineral. 2000, 85, 1437–1446. [Google Scholar] [CrossRef]
- Hovis, G.L.; Abraham, T.; Hudacek, W.; Wildermuth, S.; Scott, B.; Altomare, C.; Medford, A.; Conlon, M.; Morris, M.; Leaman, A.; et al. Thermal expansion of F-Cl apatite crystalline solutions. Am. Mineral. 2015, 100, 1040–1046. [Google Scholar] [CrossRef]
- Hovis, G.L.; Scott, B.T.; Altomare, C.M.; Leaman, A.R.; Morris, M.D.; Tomaino, G.T. Thermal expansion of fluorapatite-hydroxylapatite crystalline solutions. Am. Mineral. 2014, 99, 2171–2175. [Google Scholar] [CrossRef] [Green Version]
- Mackie, P.E.; Young, R.A. Location of Nd dopant in fluorapatite, Ca5(PO4)3F:Nd. J. Appl. Crystallogr. 1973, 6, 26–31. [Google Scholar] [CrossRef]
- Fleet, M.E.; Pan, Y. Site preference of rare earth elements in fluorapatite. Am. Mineral. 1995, 80, 329–335. [Google Scholar] [CrossRef]
- Fleet, M.E.; Pan, Y. Site preference of rare earth elements in fluorapatite: Binary (LREE+HREE)-substituted crystals. Am. Mineral. 1997, 82, 870–877. [Google Scholar] [CrossRef]
Figure 1.
Structure of F-Ap (space group P63/m) projected down [001]. The structure contains PO4 tetrahedra (gray), Ca1O9 polyhedra (red), and Ca2O6F polyhedra (not shown). The F ions (green spheres) are in the 63 channels and form F-Ca23 triangles (green). The Ca1 (red) and Ca2 (orange) sites contain mainly Ca ions. The O (black) ion sites are shown. The hexagonal unit-cell edges are outlined and their corners contain the 63 channels.

Figure 2.
Coordinations of (a) Ca1 site by nine O ions, and (b) Ca2 site by one F and six O ions in F-Ap. The average <Ca1-O>[9] and <Ca2-O,X>[7] distances are compared across natural Ap solid solutions below.
Figure 2.
Coordinations of (a) Ca1 site by nine O ions, and (b) Ca2 site by one F and six O ions in F-Ap. The average <Ca1-O>[9] and <Ca2-O,X>[7] distances are compared across natural Ap solid solutions below.

Figure 3.
Back-scattered electron (BSE) images for five different Ap samples that contain different features of zoning. OH and F differ by only one electron, so the observed zoning is not based on these anions, but based on cations replacing Ca cations: (a,b) A two-phase intergrowth of F-Ap and OH-Ap occurs in samples-4 and -5 where the contrast differences arise from variations in Ca and Mn cations (see Figure 4a,b); (c,d) Zoning in a single-phase sample-6 and a two-phase sample-31 where the contrast differences arise from variations in Mn + Sr replacing Ca cations (see Figure 4c,d); (e) A three-phase intergrowth of three slightly different F-Ap phases in sample-33 where the contrast differences arise from variations in Ca and Mn cations (see Figure 4d). The multiple phases are recognized by splitting of reflections in the HRPXRD traces, as discussed below.

Figure 4.
Variations of cations from different points (horizontal axis) in five different Ap samples (right-vertical axes are for Ca cations, and left-vertical axes are for the other cations). There are reciprocal relations between Ca and Mn cations in sample-4 (a), sample-5 (b), and sample-33 (e). The small amount of Fe cations is nearly constant in sample-4 and -33. The sum of Mn and Sr cations are high when the amount of Ca cations is low in sample-6 (c) and sample-31 (d).
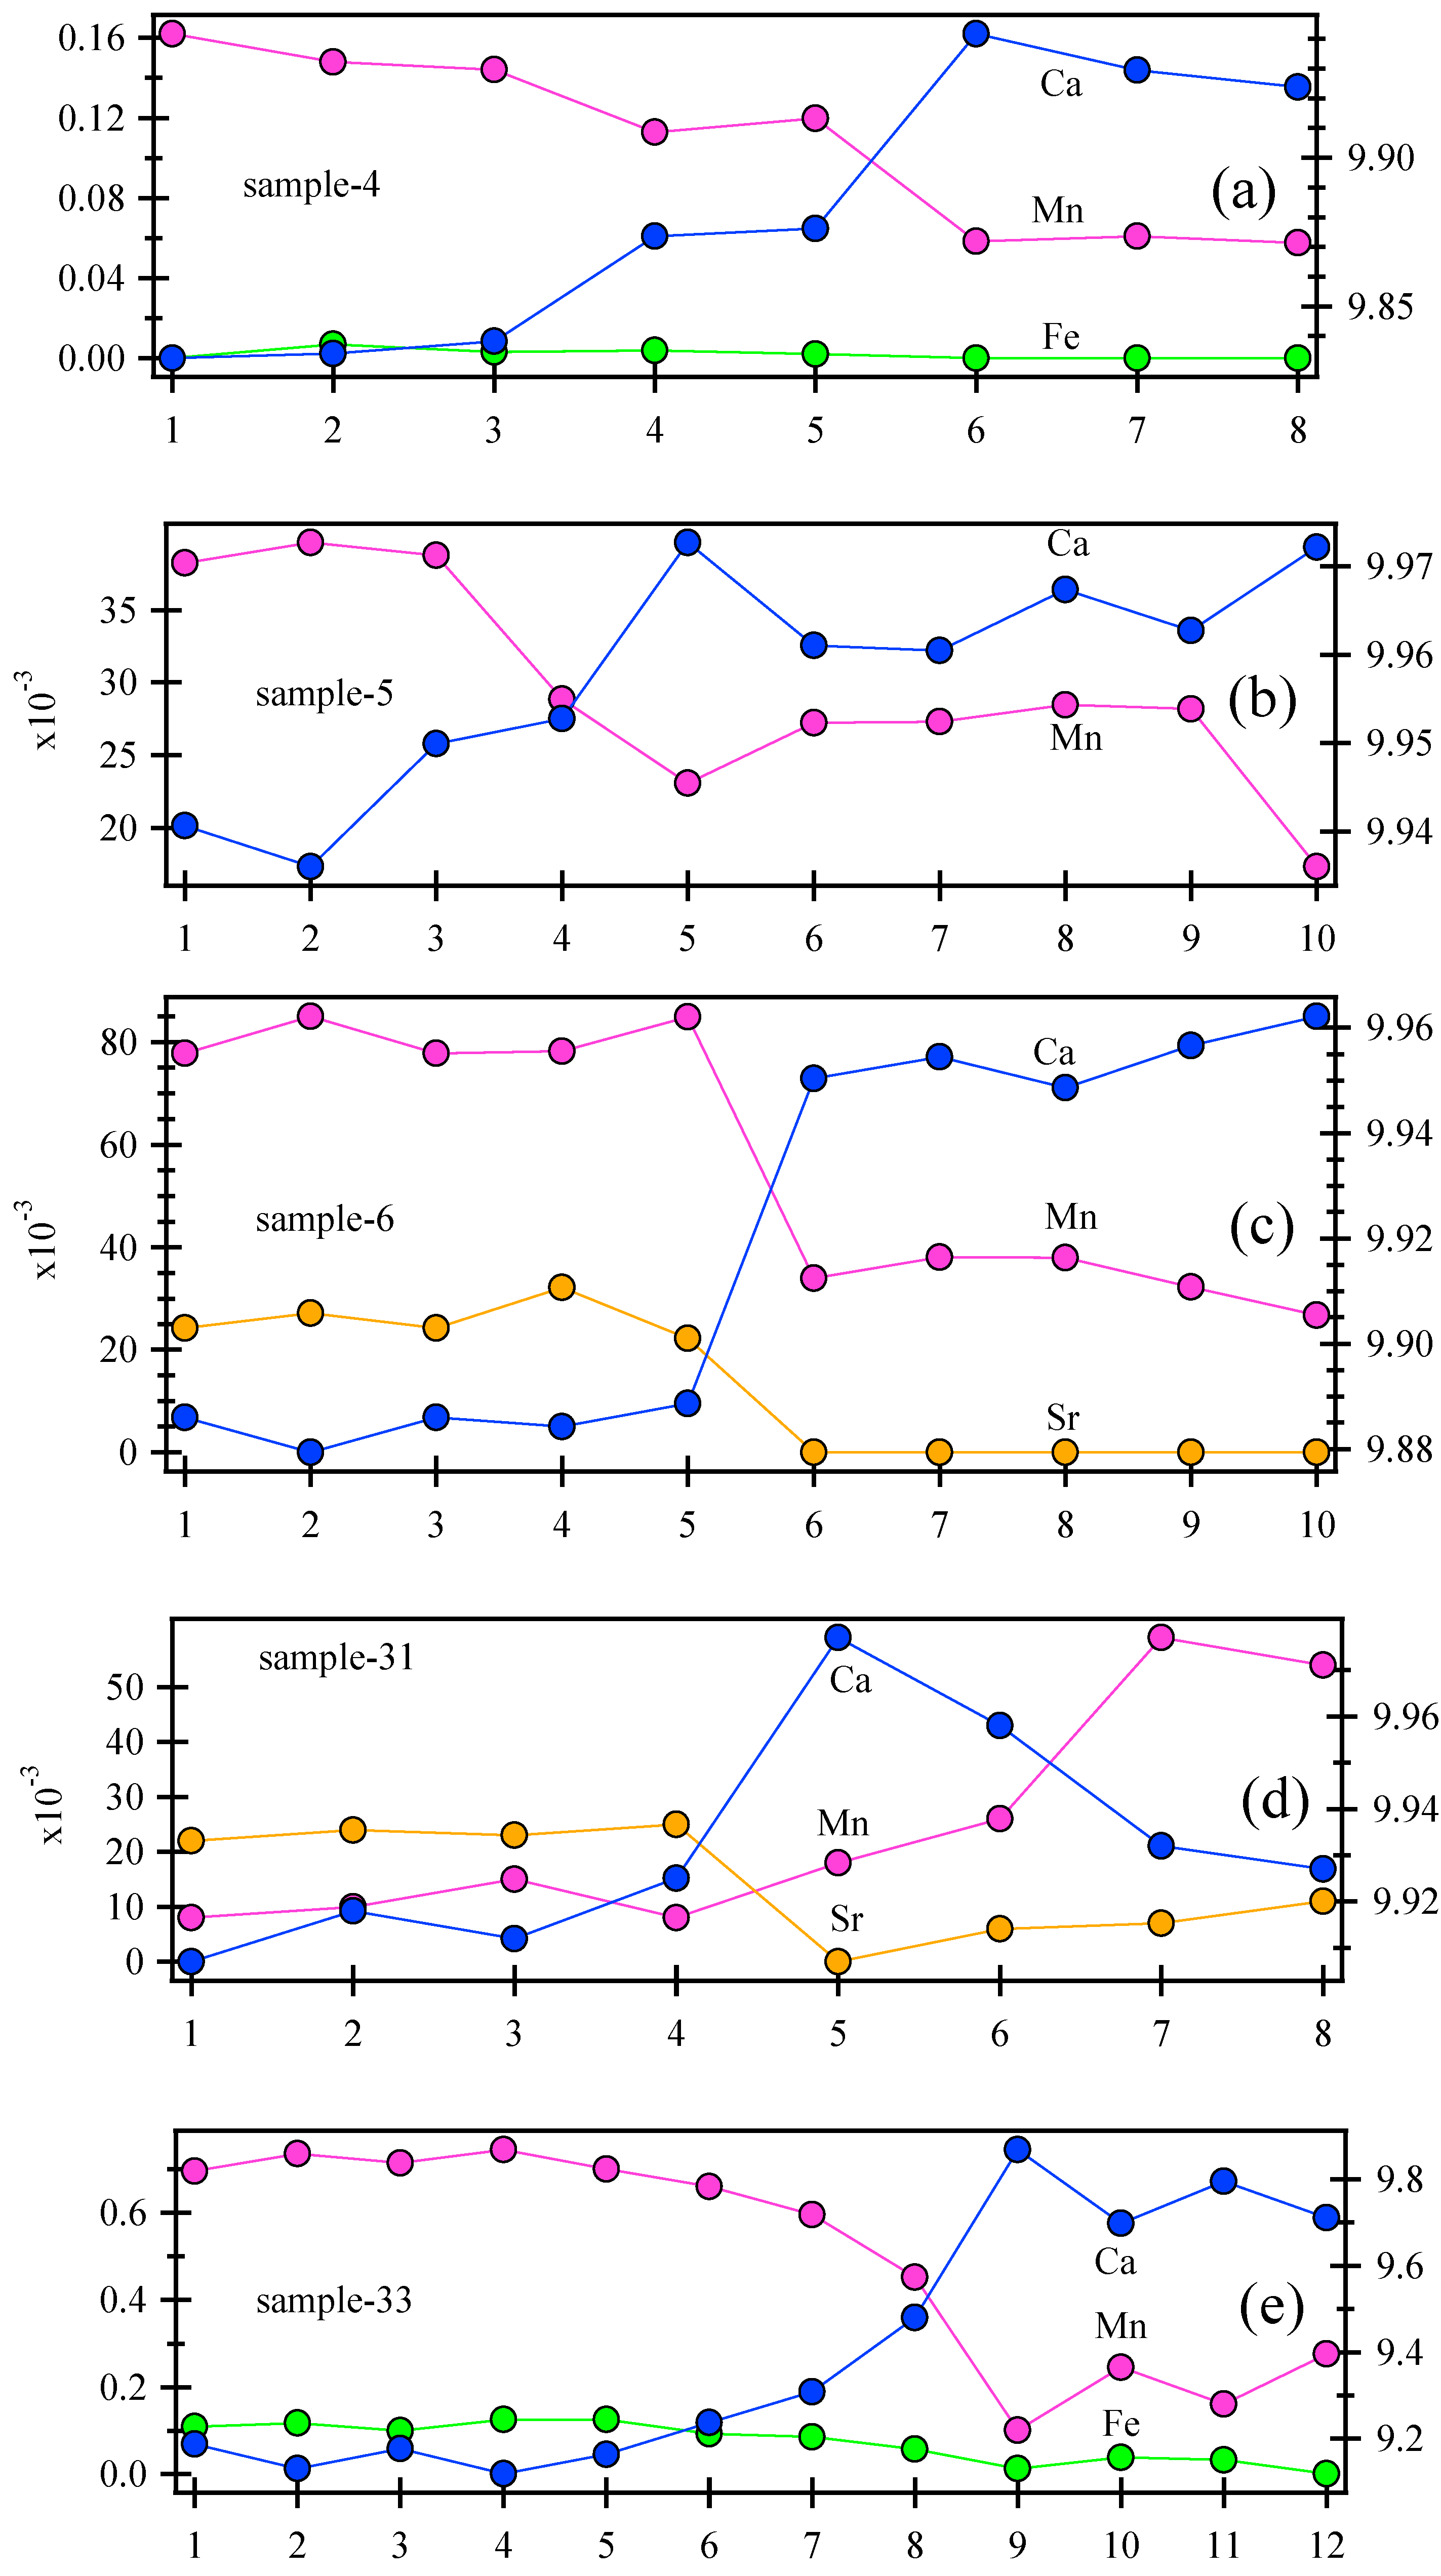
Figure 5.
HRPXRD traces at 20 °C together with the calculated (continuous line) and observed (crosses) profiles. The difference curve (Iobs − Icalc) with the same intensity scale is shown at the bottom of the trace. Short vertical lines indicate allowed reflection positions. The intensities for the trace and difference curve that are above 20° 2θ are multiplied by 10. A single-phase F-Ap in sample-2 is shown where (a) contains the full trace with two inserts and (b) is an expanded part of the same (a) trace. For comparison, a two-phase Ap in sample-30 is shown in (c,d) that contains Cl-Ap (phase-30a) and OH-Ap (phase-30b). Inserts in (a,c) show an expanded area of the 010, 112, and 300 reflection peaks. Sample-30 contains an intergrowth of a Cl-Ap (92 wt.%) and a minor amount of OH-Ap (8 wt.%), as indicated in (c,d). The c axis is smallest in Cl-Ap, so some reflections switch positions when compared to F-Ap.

Figure 6.
HRPXRD traces at 20 °C together with the calculated (continuous line) and observed (crosses) profiles for three different Ap samples. The difference curve (Iobs − Icalc) with the same intensity scale is shown at the bottom of the trace. Short vertical lines indicate allowed reflection positions. The intensities for the trace and difference curve that are above 20° 2θ are multiplied by 10 in (a,d,g), which also contain inserts of the 010 reflection; (a–c) are a two-phase intergrowth of F-Ap and OH-Ap in sample-4; (d–f) are a single-phase F-Ap sample-10; (g–i) are a three-phase intergrowth of three slightly different F-Ap (68.1, 14.5, and 17.4 wt.%) in sample-33 from Sapo, Brazil. The expanded scales (b,c) show that sample-4 is a two-phase intergrowth of F-Ap (44 wt.%) and OH-Ap (56 wt.%), which gives rise to split reflections instead of un-split reflections, as in the single-phase sample-10 (e,f). The split peaks are easily observed for the 004 reflection in (c,i), as well as other reflections such as 123 and 202 in (h,i). In (i), locations for 004 and 141 reflections are for phases-33a and -33b, but these peaks are reversed in phase-33c.

Figure 7.
Comparison of HRPXRD traces at 20 °C: (a,b) is a two-phase intergrowth of two different F-Ap phases (48 and 52 wt.%) in sample-8; (c,d) is a two-phase intergrowth of F-Ap in sample-29 (55 and 45 wt.%). The two-phase samples are based on the structure refinement and split reflections, especially the 004 reflection in (b). In sample-29, one phase occurs as a sharp peak, and the other as a broad hump (e.g., 140 reflection in (d)).

Figure 8.
Variations of the unit-cell parameters (a) a, (b) c, and (c) c/a with volume, V, across natural Ap solid solutions. The a axis increases non-linearly with increasing V, whereas both the c axis and the c/a ratio increase and then decrease in a convex-up manner. The red trend lines (equations inserted) are based on data only from this study (red circles) for Ca-rich Ap. Sample-30b, which is an (OH,Cl)-rich Ap, has a V that plots about midway between OH-Ap and Cl-Ap. Data indicated by triangles are from one group of researchers (see Table S5). The literature data for the larger a unit-cell parameter are close to the red trend line in (a), but these are further apart in (b,c), as smaller values are more difficult to measure. The data for group-4 samples (black open triangles) are for (Sr,Mn)F-Ap and these give rise to the black trend lines. Our samples-1 and -33 (yellow symbols) fall close to the black trend lines, so these are not included in the red-trend line computation.

Figure 9.
Variation of the unit-cell parameters a with c across natural Ap solid solutions. The red trend line (equation inserted) is based on the data from this study (red circles). Data from the literature plots close to the red trend line. Sample-30b, which is a (OH,Cl)-rich Ap, has a V that plots about midway between OH-Ap and Cl-Ap. Group-4 samples (black open triangles) are for (Sr,Mn)F-Ap and these give rise to the black trend line. Our samples-1 and -33 (yellow symbols) fall close to the black trend line, so these are not included in the red-trend line computation.

Figure 10.
The U33/U11 ratio of the F/Cl/OH atom with V for some of our Ap samples. For F-Ap samples, a large increase in U33/U11 ratio indicates possible positional disorder of the F atom from the z = ¼ mirror plane, or disorder of the F and OH as their positions are close to each other. Cl-Ap and many of the other samples have normal U33/U11 ratios.

Figure 11.
Small anisotropic displacement parameters for the F atom in sample-3 (a,b) compared to much larger parameters in sample-27 (c,d), which contains possible positional disorder of the F atom, or disorder of the F and OH as their positions are close to each other; (a,c) are for the 3-coordinated F site and (b,d) are for the 7-coordinated Ca2 site.

Figure 12.
Structural variations across natural Ap solid solutions with increasing volume, V: (a) the average <P-O>[4] distance is nearly constant; (b) the average <O-P-O>[6] angle decreases slightly; (c) the average <Ca1-O>[9] distance increases and then decreases in a convex-up manner; (d) The Ca2-X distance; (e) average <Ca2-O>[6] distance, and more importantly, (f) the average <Ca2-O,X>[7] distance, which is the full coordination for the Ca2 site, increases non-linearly in a convex-down manner and has the highest R2 correlation factor. Some average <O-P-O>[6] angles from the literature were calculated as these were not provided by some authors. All the red trend lines (equations inserted) are based on data only from this study. Group-1 synthetic binary-Ap samples (blue open triangles) from the literature are significantly off the red trend lines in (a–c), but are close to the red trend lines in (d–f). Group-4 samples (black open triangles) give rise to the black trend lines. Our data points for samples-1, -33, and minor phases -30b and -31b are not included in the red-trend line computation.


Table 1.
Locality †, wt.%, unit-cell parameters, and Rietveld refinement statistical indicators, R (F2), χ2, Nobs, Npts, and λ for 33 apatite samples.
Table 1.
Locality †, wt.%, unit-cell parameters, and Rietveld refinement statistical indicators, R (F2), χ2, Nobs, Npts, and λ for 33 apatite samples.
| No. | Localities | wt.% | a/Å | c/Å | V/Å3 | χ2 | *R (F2) | Nobs | Npts | λ/Å |
|---|---|---|---|---|---|---|---|---|---|---|
| 1 | Strickland Quary, CT, USA (NHMLAC4493) | 100 | 9.35897(1) | 6.85549(1) | 520.026(1) | 1.798 | 0.0502 | 1702 | 48065 | 0.41279(2) |
| 2 | Golconda Mine, Coroaci, MG, Brazil | 100 | 9.36862(1) | 6.87927(1) | 522.907(1) | 2.284 | 0.0634 | 1688 | 47900 | 0.41330(2) |
| 3 | Chongyi, Jiangxi Province, China | 100 | 9.36940(1) | 6.87969(1) | 523.025(1) | 2.977 | 0.0608 | 1683 | 47900 | 0.41330(2) |
| 4a | Dara Pech, Kunar, Afg: phase-4a (F-Ap) | 43.6(3) | 9.36892(2) | 6.87739(1) | 522.797(1) | 2.608 | 0.0709 | 3378 | 47906 | 0.41374(2) |
| 4b | Dara Pech, Kunar, Afg: phase-4b (OH-Ap) | 56.4(2) | 9.37018(2) | 6.88303(1) | 523.367(1) | |||||
| 5 | Ashio Mine, Tochi, Japan (NMHLAC4478) | 100 | 9.37058(1) | 6.88356(1) | 523.452(1) | 1.228 | 0.0327 | 1707 | 47975 | 0.41279(2) |
| 6 | Portugal-c | 100 | 9.36938(1) | 6.88393(1) | 523.346(1) | 1.916 | 0.0680 | 1836 | 47975 | 0.41283(2) |
| 7 | Portugal-b | 100 | 9.37048(1) | 6.88450(1) | 523.512(1) | 1.763 | 0.0460 | 1804 | 47975 | 0.41283(2) |
| 8a | Portugal-a: phase-8a (F-Ap) | 47.1(2) | 9.37216(1) | 6.88002(1) | 523.360(1) | 4.109 | 0.0776 | 3402 | 47474 | 0.41283(2) |
| 8b | Portugal-a: phase-8b (F-Ap) | 52.9(2) | 9.37216(1) | 6.88602(1) | 523.816(1) | |||||
| 9 | Sapo Mine, MG, Brazil (Ap6) | 100 | 9.37453(1) | 6.88315(1) | 523.862(1) | 1.845 | 0.0484 | 1797 | 47975 | 0.41283(2) |
| 10 | Golconda Mine, Coroaci, MG, Brazil (BR1) | 100 | 9.37190(1) | 6.88527(1) | 523.729(1) | 1.578 | 0.0520 | 1766 | 47906 | 0.41351(2) |
| 11 | Ontario, Canada | 100 | 9.37124(1) | 6.88901(1) | 523.940(1) | 2.857 | 0.0549 | 1744 | 47906 | 0.41330(2) |
| 12 | unknown | 100 | 9.37305(1) | 6.88929(1) | 524.163(1) | 1.999 | 0.0505 | 1695 | 47906 | 0.41330(2) |
| 13 | Sceptre Claims, Emerald Lake, Yukon, Canada | 100 | 9.37674(1) | 6.88587(1) | 524.316(1) | 2.834 | 0.0524 | 1701 | 47299 | 0.41330(2) |
| 14 | Madagascar (4856) | 100 | 9.37854(1) | 6.88853(1) | 524.720(1) | 1.777 | 0.0554 | 1731 | 47975 | 0.41279(2) |
| 15 | unknown (UC9075) | 100 | 9.37958(1) | 6.88978(1) | 524.931(1) | 3.188 | 0.0534 | 1705 | 46080 | 0.41330(2) |
| 16 | Otter Lake, Quebec, Canada (UC8761) | 100 | 9.37890(1) | 6.89495(1) | 525.249(1) | 2.861 | 0.0566 | 1733 | 46080 | 0.41330(2) |
| 17 | Slyudijanka, Irkutsk, Russia (NMHLAC4460) | 100 | 9.38673(1) | 6.88710(1) | 525.527(1) | 1.905 | 0.0468 | 1719 | 47547 | 0.41279(2) |
| 18 | Durango, Mexico, USA (W15) | 100 | 9.39369(1) | 6.88199(1) | 525.918(1) | 1.758 | 0.0591 | 1673 | 47989 | 0.41416(2) |
| 19 | Perth, Ontario, Canada (UC9308) | 100 | 9.39154(1) | 6.88674(1) | 526.040(1) | 3.132 | 0.0548 | 1721 | 47900 | 0.41330(2) |
| 20 | New Mexico, USA (vc) | 100 | 9.39792(1) | 6.88037(1) | 526.267(1) | 6.724 | 0.0783 | 1607 | 46873 | 0.41283(2) |
| 21 | Godfrey, Ontario, Canada (UC6513) | 100 | 9.40215(1) | 6.88309(1) | 526.949(1) | 4.156 | 0.0623 | 1756 | 47376 | 0.41330(2) |
| 22 | Ipirá Mine, Bahia, Brazil | 100 | 9.40013(1) | 6.89006(1) | 527.256(1) | 3.140 | 0.0774 | 1697 | 47900 | 0.41330(2) |
| 23 | Morocco (Ap12) | 100 | 9.40979(1) | 6.88159(1) | 527.690(1) | 4.403 | 0.0565 | 2151 | 47975 | 0.41283(2) |
| 24 | Ipirá Mine, Bahia, Brazil (Ap7) | 100 | 9.40461(1) | 6.88963(1) | 527.729(1) | 2.964 | 0.0743 | 1789 | 47975 | 0.41283(2) |
| 25 | Madagascar (0013) | 100 | 9.40929(1) | 6.88314(1) | 527.753(1) | 2.367 | 0.0655 | 1701 | 47900 | 0.41399(2) |
| 26 | Morocco (Ap14) | 100 | 9.41649(1) | 6.87817(1) | 528.180(1) | 2.262 | 0.0522 | 1777 | 47975 | 0.41283(2) |
| 27 | Unknown (UC1500) | 100 | 9.41703(1) | 6.87845(1) | 528.262(1) | 3.444 | 0.0767 | 1698 | 45907 | 0.41330(2) |
| 28 | Snarum, Norway (NMHLAC55112) | 100 | 9.42195(5) | 6.88126(4) | 529.030(5) | 3.263 | 0.0447 | 1855 | 46219 | 0.41279(2) |
| 29a | Morocco (Ap13) (F-Ap): phase-29a | 55.0(2) | 9.41633(1) | 6.87809(1) | 528.156(1) | 1.424 | 0.0483 | 3666 | 47975 | 0.41283(2) |
| 29b | Morocco (Ap13) (F-Ap): phase-29b | 45.0(2) | 9.42812(3) | 6.87489(2) | 529.232(3) | |||||
| 30a | Sarnum, Norway (7/56-1): phase-30a (Cl-Ap) | 92.6(4) | 9.621766(6) | 6.77735(1) | 543.376(1) | 2.091 | 0.0620 | 3619 | 47685 | 0.41330(2) |
| 30b | Sarnum, Norway (7/56-1): phase-30b (OH-Ap) | 7.4(1) | 9.48894(13) | 6.85755(9) | 534.73(1) | |||||
| 31a | Kola Penin., Russia (NHMLAC4476): Ph 31a (F-Ap) | 89.7(1) | 9.36816(3) | 6.89137(3) | 523.774(3) | 1.535 | 0.0619 | 3494 | 47524 | 0.41279(2) |
| 31b | Kola Penin., Russia (NHMLAC4476): Ph 31b (OH-Ap) | 10.3(1) | 9.4018(1) | 6.8889(2) | 527.35(2) | |||||
| 32 | Snarum, Norway (NMHLAC55114) | 100 | 9.61883(1) | 6.78310(1) | 543.505(1) | 1.478 | 0.0610 | 1814 | 47975 | 0.41279(2) |
| 33a | Sapo Mine, MG, BZ: phase-33a (F-Ap) | 68.1(1) | 9.37207(1) | 6.87491(2) | 522.960(2) | 3.908 | 0.0693 | 4998 | 47450 | 0.41330(2) |
| 33b | Sapo Mine, MG, BZ: phase-33b (F-Ap) | 14.5(1) | 9.37367(2) | 6.88436(1) | 523.858(2) | |||||
| 33c | Sapo Mine, MG, BZ: phase-33c (F-Ap) | 17.4(1) | 9.36464(2) | 6.85001(4) | 520.240(4) |
† BR = Brazil, Afg = Afghanistan, MG = Minas Gerais. All samples were refined in space group P63/m. *R (F2) = R-structure factor based on observed and calculated structure amplitudes = [∑(Fo2 − Fc2)/∑(Fo2)]1/2. The 2θ range for each sample is from 2 to 50°. The values for the monochromatic wavelength, λ, and Nobs (number of observed reflections) are given. Npts (number of data points) ≈ 48,000 for each sample. Samples-1, -5, -17, -28, -31, and -32 were obtained from the Natural History Museum of Los Angeles. Samples-4, -8, -29, -30, -31, and -33 contain two or three different apatite phases and their weight percentages (wt.%) are given. All the other samples are pure (no extra peaks occur in the diffraction traces).
Publisher’s Note: MDPI stays neutral with regard to jurisdictional claims in published maps and institutional affiliations. |
© 2022 by the authors. Licensee MDPI, Basel, Switzerland. This article is an open access article distributed under the terms and conditions of the Creative Commons Attribution (CC BY) license (https://creativecommons.org/licenses/by/4.0/).
Share and Cite
MDPI and ACS Style
Hazrah, K.S.; Antao, S.M. Apatite, Ca10(PO4)6(OH,F,Cl)2: Structural Variations, Natural Solid Solutions, Intergrowths, and Zoning. Minerals 2022, 12, 527. https://doi.org/10.3390/min12050527
AMA Style
Hazrah KS, Antao SM. Apatite, Ca10(PO4)6(OH,F,Cl)2: Structural Variations, Natural Solid Solutions, Intergrowths, and Zoning. Minerals. 2022; 12(5):527. https://doi.org/10.3390/min12050527
Chicago/Turabian StyleHazrah, Kaveer S., and Sytle M. Antao. 2022. "Apatite, Ca10(PO4)6(OH,F,Cl)2: Structural Variations, Natural Solid Solutions, Intergrowths, and Zoning" Minerals 12, no. 5: 527. https://doi.org/10.3390/min12050527
Note that from the first issue of 2016, this journal uses article numbers instead of page numbers. See further details here.