Article

Ductile vs. Brittle Strain Localization Induced by the Olivine–Ringwoodite Transformation

1
Laboratoire de Géologie CNRS-École Normale Supérieure, PSL Research University, 75005 Paris, France
2
Laboratoire de Géologie de Lyon, CNRS-Université Lyon 1, 69634 Lyon, France
3
Department of Geoscience, University of Nevada in Las Vegas, Las Vegas, NA 89154, USA
*
Author to whom correspondence should be addressed.
Minerals 2022, 12(6), 719; https://doi.org/10.3390/min12060719
Submission received: 11 March 2022 / Revised: 10 May 2022 / Accepted: 17 May 2022 / Published: 4 June 2022

Abstract

:
As it descends into the Earth’s mantle, the olivine that constitutes the lithosphere of subducting slabs transforms to its high-pressure polymorphs, wadsleyite and ringwoodite, in the so-called transition zone. These transformations have important rheological consequences, since they may induce weakening, strain localization, and, in some cases, earthquakes. In this study, germanium olivine (Ge-olivine) was used as an analogue material to investigate the rheology of samples undergoing the olivine–ringwoodite transformation. Ge-olivine adopts a ringwoodite structure at pressures ~14 GPa lower than its silicate counterpart does, making the transformation accessible with a Griggs rig. Deformation experiments were carried out in a new-generation Griggs apparatus, where micro-seismicity was recorded in the form of acoustic emissions. A careful analysis of the obtained acoustic signal, combined with an extensive microstructure analysis of the recovered samples, provided major insights into the interplay between transformation and deformation mechanisms. The results show that significant reaction rates cause a weakening via the implementation of ductile shear zones that can be preceded by small brittle precursors. When kinetics are more sluggish, mechanical instabilities lead to transformational faulting, which stems from the unstable propagation of shear bands localizing both strain and transformation. The growth of these shear bands is self-sustained thanks to the negative volume change and the exothermic nature of the reaction, and leads to dynamic rupture, as attested by the acoustic emissions recorded. These micro-earthquakes share striking similarities with deep focus earthquakes, which may explain several seismological observations such as magnitude frequency relations and the occurrence of deep repeating earthquakes and foreshocks.

1. Introduction

The transition zone of the Earth’s mantle corresponds to depths at which olivine, the main mineral constituent of the uppermost mantle, is no longer stable. The denser wadsleyite and ringwoodite polymorphs are found at depths > 410 km, as notoriously shown by a seismic discontinuity [1,2]. Consequently, when a subducting slab descends into the mantle, the olivine that composes it undergoes a polymorphic transformation that is critical for the dynamics of the entire subduction zone, since it induces densification. The olivine–wadsleyite–ringwoodite transformations are therefore important because they affect the buoyancy of the slab and can have dramatic rheological consequences [3,4]. In particular, a softening induced by the transformation may cause important strain localization at the top of the slab [5,6]. This is controlled both by the contrasting strength of olivine and ringwoodite as well as by the difference in grain size between the reacting slab and the stable ringwoodite mantle in the transition zone. The kinetics of these reactions have therefore been of interest to experimental petrologists [2,7]. Some of these studies tend to limit the survival of metastable olivine to depths of 500–600 km in the core of the coldest and fastest subducting slabs (e.g., Tonga) [3,8]. However, these transformations are extremely sensitive to water and iron content [7,9]. A recent study showed that dry olivine can coexist with hydrous phases under transition zone conditions [10]. This study therefore partly explains the many recent seismological observations of metastable olivine wedges (MOW) that have since confirmed that slabs of the ancient (i.e., colder) lithosphere and/or descending fast enough do indeed show the presence of an MOW [11,12,13].
The thermal state of the slab, and therefore the possible presence of an MOW, seems to be closely related to deep focus earthquakes (DFEs), which occur in the transition zone. Indeed, unlike their shallow counterparts, DFEs are only observed in slabs with high thermal parameters (i.e., fast and cold), and are thus more propitious to the preservation of metastable olivine [1]. In addition, in slabs that do present DFEs, seismicity progressively decreases until depths of ~300 km and peaks again in the transition zone with DFEs [14]. This second burst of seismicity is somehow abnormal because it occurs at Pressure and Temperature (PT) conditions that should preclude brittle failure. Experimental evidence for transformational faulting related to the olivine–ringwoodite transformation at high pressures provided a good explanation [15,16]. However, a few seismological observations have cast doubt on the transformational faulting hypothesis. Firstly, the estimated fault plane dimensions of the largest DFEs seem to exceed those of MOWs [17]. Secondly, the detection of repeating DFEs suggested that another mechanism may be at play, since the irreversible nature of the olivine polymorphic transformations should preclude fault reactivation [18]. A few seismology studies have proposed the reconciliation of these observations via the coexistence of transformational faulting and shear instabilities in the mantle [19,20]. However, experimental studies are scarce and, although conceptual models for transformational faulting have been developed, several unknowns remain regarding the physical mechanisms behind it [15,16,21,22,23].
To further constrain the relations between transformational faulting, seismicity, and the physical processes behind them, we performed a series of deformation experiments on sintered Ge-olivine (Mg2GeO4) samples in a Griggs apparatus [24]. Ge-olivine undergoes a transformation to Ge-spinel (the ringwoodite–structure analogue) at much lower pressures (by ~14 GPa) than the silicate counterpart, making the transformation achievable in the Griggs rig [25]. This synthetic mineral proved to be a good analogue to natural olivine and ringwoodite, since both structures are crystallographically equivalent to the natural silicate ones. We thereby extended the seminal work of Burnley and coauthors (1991) and used newly available techniques to further constrain transformational faulting [15]. The micro-seismicity of the samples was recorded with the help of an ultrasonic transducer and processed with seismological algorithms. The recovered samples were analyzed using a scanning electronic microscope (SEM) and electron backscatter diffraction (EBSD) to better assess the mechanisms at the microscopic level that lead to macroscopic failure.

2. Materials and Methods

2.1. Starting Material

A powder of Mg2GeO4 (Ge-olivine) and MgGeO3 (Ge-pyroxene) was first synthesized in a furnace at 1300 °C by mixing and heating MgO and GeO2 oxide powders together. The molar proportions were calculated to obtain ~6 vol.% Ge-pyroxene. The obtained powder was later used to sinter a densified germanium peridotite analogue by hot isostatic pressing (HIP) at the ETH of Zurich (Zurich, Switzerland). The powder was packed in a cylindrical steel canister and isolated from the canister by a Mo foil. The canister was then placed in a gas apparatus at 200 MPa and 1200 °C for 9 h. The obtained cylindrical HIP sample is about 5 cm long and 2.5 cm in diameter. A microstructural analysis of the HIP sample revealed an equilibrium texture with low porosity (<1%). Ge-olivine grains have a tabular shape and an average grain size of ~38 µm (Figure 1a). A slight crystallographic preferred orientation (CPO) is observed, dominated by a point concentration of the c-axis parallel to the length of the cylinder. It is clear that this CPO reflects a mere SPO rather than crystal plastic mechanisms, as the grains show no evidence of internal plasticity in the HIP sample (Figure 1b,c). Ge-pyroxene has a higher density than Ge-olivine because of its higher Ge content. Ge-pyroxene grains therefore serve as a strain markers since they initially have a low aspect ratio (i.e., their shape shows little elongation) and appear brighter on the images of the samples recovered after the deformation experiments (see Section 2.4 below for further detail). The proportion of Ge in the starting powder was adjusted so that only a few percent of Ge-pyroxene compose the final aggregate. The rheology of the samples therefore remains largely controlled by the mechanical properties of Ge-olivine, and in some cases, its transformation to Ge-spinel.
Samples for Griggs deformation experiments, 10 mm long and 4.3 mm in diameter, were then cored in the HIP sample. One of these cores was subsequently reacted to Ge-spinel in the Griggs apparatus at 1.5 GPa and 930 °C under hydrostatic conditions. Two 2.5 mm long cylinders were then sawed from the obtained sintered Ge-spinel core. Those were used in experiment G22 to sandwich a shorter (5 mm long) Ge-olivine sample.

2.2. Deformation Experiments
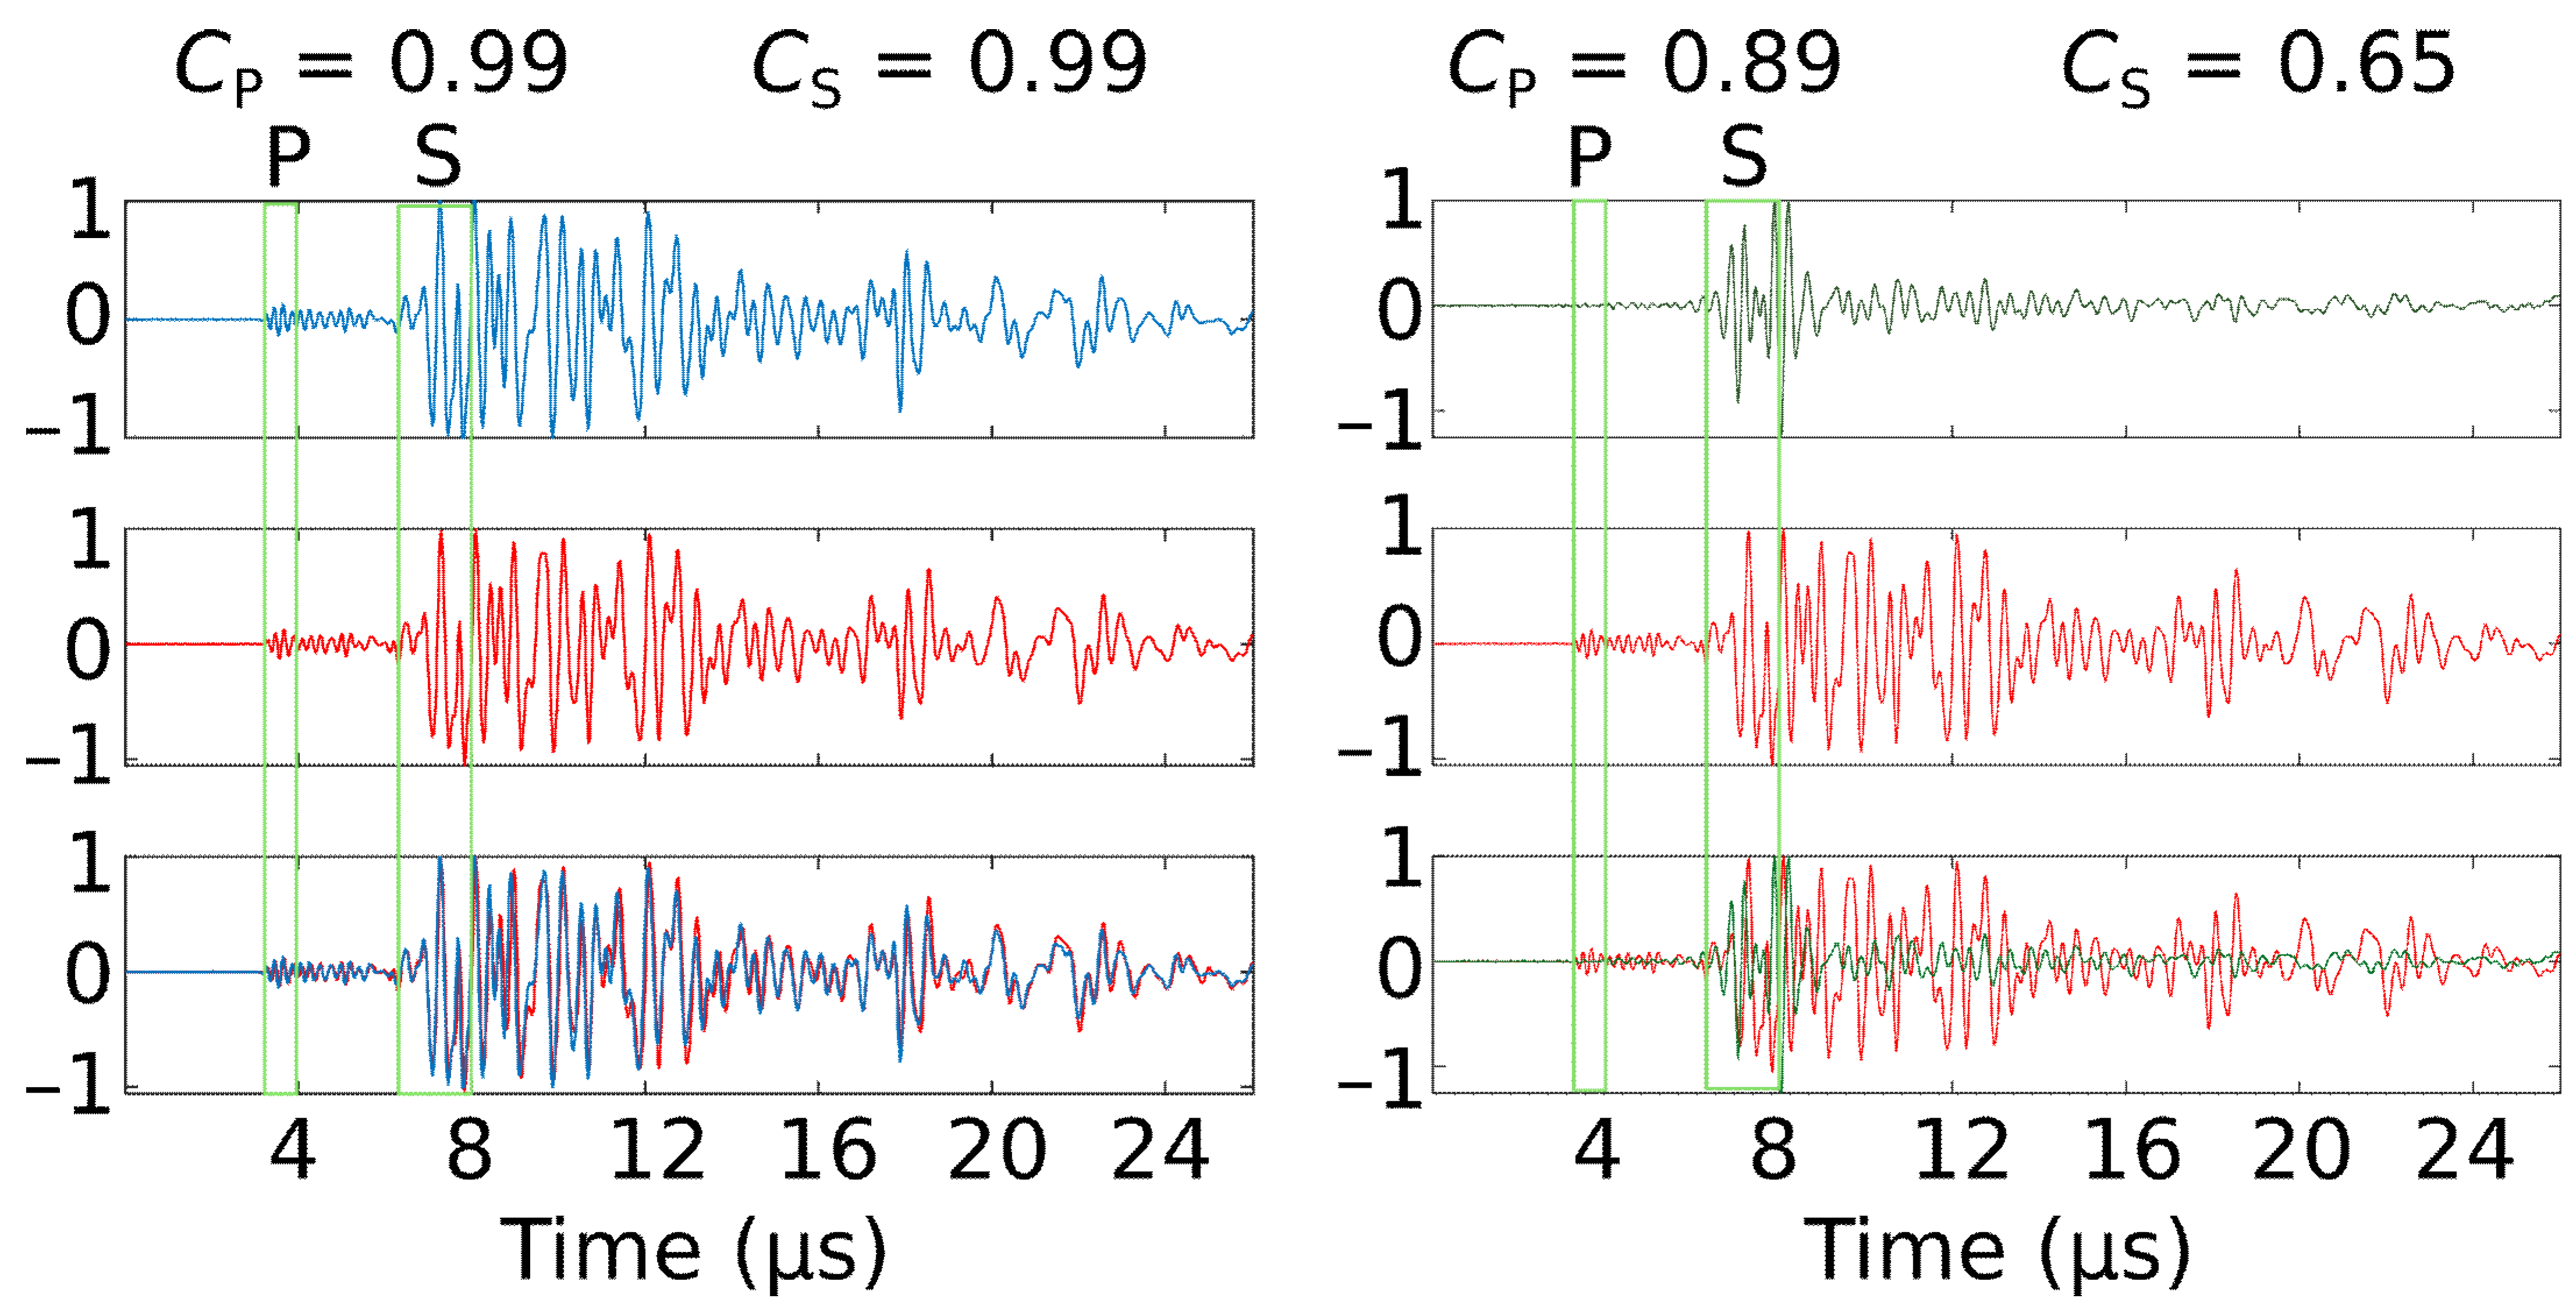
High Pressure and Temperature (PT) deformation experiments were performed in a new-generation Griggs rig (Sanchez Technologies, Frepillon, France) equipped with Acoustic Emission (AE) recording capability [24,26]. Details about the full experimental setup are available in [24]. Like its silicate counterpart, Ge-olivine undergoes a transition to a high-pressure phase with a modified-spinel structure, Ge-spinel. In the germanate case, the transition occurs at pressures about 14 GPa lower than for silicate olivine [25,27]. The synthetic rock samples were deformed at constant PT conditions at 1.5 GPa and temperatures of 506–843 °C, i.e., in the Ge-spinel field. Axial shortening was performed at strain rates of ~0.6–4 × 10⁻⁵ s–1.
The acoustic transducer used, an Olympus® V156 (Tokyo, Japan), has a center frequency of 5 MHz and is typically sensitive to µm- to mm-sized cracks. The signal was recorded both plain and low-pass filtered and amplified at 30 dB. AE collection was triggered using a threshold value manually set above the background electrical noise of the setup. Waveforms were collected over 8192 data points using the maximum sampling frequency capability of the oscilloscopes, i.e., 50 MHz. The signal is constantly buffered by the system and when the threshold level is hit, the waveform collected includes a pre-trigger duration of 20% of the time window recorded so that the full AE, including its arrival, is visible.

2.3. AE Analysis

The transducer used is a PZT ceramic glued under the carbide base plate where the high-pressure cell assembly sits during the experiment. The rigid column used for deformation that includes the sample serves as a waveguide since the adjacent NaCl used as pressure medium is much softer, i.e., the impedance contrast between the rigid column and the soft pressure medium prevents most of the acoustic energy from escaping the column. AEs recorded by the transducer therefore travel through the sample, the underlying alumina pedestal and the carbide base plate.
The transducer is cylindrical and polarized normal to its long axis for shear wave (s-wave) detection. However, it is also, to a smaller extent, sensitive to p-wave arrivals, which are therefore less impulsive but clearly identified in the AEs. This allowed to compute the arrival time difference between the S and P waves, tstp = Δtsp, which were picked manually. The velocities of p and s-waves, vs and vp, in the parts between the sample and the transducer, as well as the length of these parts are known and, on first approximation, remain constant during an experiment. The minimum Δtsp, for events occurring at the very bottom of the sample, thus corresponding to the travel times between the bottom sample interface and the sensor and, is ~3.5 μs. Knowing vs and vp in the sample, the theoretical maximum Δtsp = tstp values corresponding to events occurring at the top of the sample can be also calculated. This was taken into account by calculating the maximum Δtsp induced in the sample using the estimated vp and vs for the sample, as well as the length of the sample, L:
Δ t s p = L [ ( v p v s ) / v p × v s ]
At the beginning of the experiment, according to the vp and vs given for room conditions, the Δtsp difference due to travel times in the sample (10 mm long) is ~1 µs. Therefore AEs originating from the top part of the sample are expected to present Δtsp values of ~4.5 μs [28]. Within the 3.5–4.5 µs range, the Δtsp values obtained may thus be interpreted in terms of 1D location in the sample. However, this latter value decreases during deformation due to both shortening of the sample (i.e., while the upper sample interface moves closer to the transducer) and increase of velocities upon the olivine–ringwoodite transformation.
For every experiment, we also searched for similar waveforms by computing the coherency C between pairs of AEs in the frequency domain, between 2 and 8 MHz, as:
C A B ( ω ) = A ( ω ) B ( ω ) ¯ A ( ω ) A ( ω ) ¯ B ( ω ) B ( ω ) ¯
Each AE signal is composed of several successive wave arrivals, corresponding to p/s and s/p conversions at the interfaces separating the transducer from the sample. Therefore, we narrowed the coherency computation to 50 and 100 time-sample windows (1 and 2 μs) centered on P and S wave arrivals, respectively (Figure 2). However, unlike the s-wave, the p-wave, as the first impulsive arrival, is by definition not sensitive to conversions and thus yields a more reliable coherency analysis. Coherency was calculated for all pairs of events (Figure 3). AEs with C ≥ 0.97 for p-waves are considered highly similar (Figure 2) and were clustered based on that criterion.
The clustering algorithm uses pairs of events ij with C ≥ 0.97 as nuclei. Any other event, k, that meets the coherency criterion with either i or j is added to the cluster, and so on. Consequently, not all pairs of events in the resulting cluster satisfy C ≥ 0.97, i.e., either ik or jk does, but not necessarily both. Finally, the relative energy of each AE was assessed by comparing their Root Mean Square (RMS) value, obtained by computing the discrete sum of the absolute value of the signals as [29]:
R M S = s i g n a l 2 ¯

2.4. SEM Imaging and Processing

All samples were recovered within their gold capsule after the deformation experiments and were then cut along their long axis, parallel to the shortening direction. In some cases, a clear fault offset was visible outside the gold capsule. In such cases, the cross-section was performed perpendicular to the fault plane. The cross-sections obtained were then polished with diamond pastes of decreasing grain size and finalized with 25 nm colloidal silica.
Scanning electron microscopy (SEM, Zeiss®, White Plains, NY, USA) images were collected on all samples after recovery from deformation experiments. Images were acquired with back-scattered electrons (BSE, Oxford Instruments®, Abingdon, UK), where the contrast obtained is indicative of phase density. Since Ge-pyroxene is denser than Ge-olivine, it appears brighter and serves as a visual strain marker in the BSE images. Electron back-scatter diffraction (EBSD) maps were collected on several deformed samples, as well as on the undeformed HIP sample. The step size used varied depending on the map dimensions, diffraction quality, and nature of the sample. On the starting material, i.e., the HIP sample, where the grain size is large, a bigger step size of 1.5 µm was used. On the recovered deformed samples, step size varied from 0.3 to 0.8 µm. EBSD maps were processed and analyzed using the MTEX matlab toolbox (MTEX 5.7.0) [30]. In addition to visualizing phase distribution, this allows determining grain and subgrain boundaries, and therefore analyzing grain size and shape parameters as well as crystal plastic mechanisms. Grain boundaries were determined using a threshold misorientation of 13° between neighbouring pixels. Pole figures showing orientation distribution functions (ODFs) for Ge-olivine, Ge-pyroxene, and Ge-spinel were then calculated using one point per grain (as opposed to one point per pixel) densities to avoid overrepresentation by large grains.

3. Results

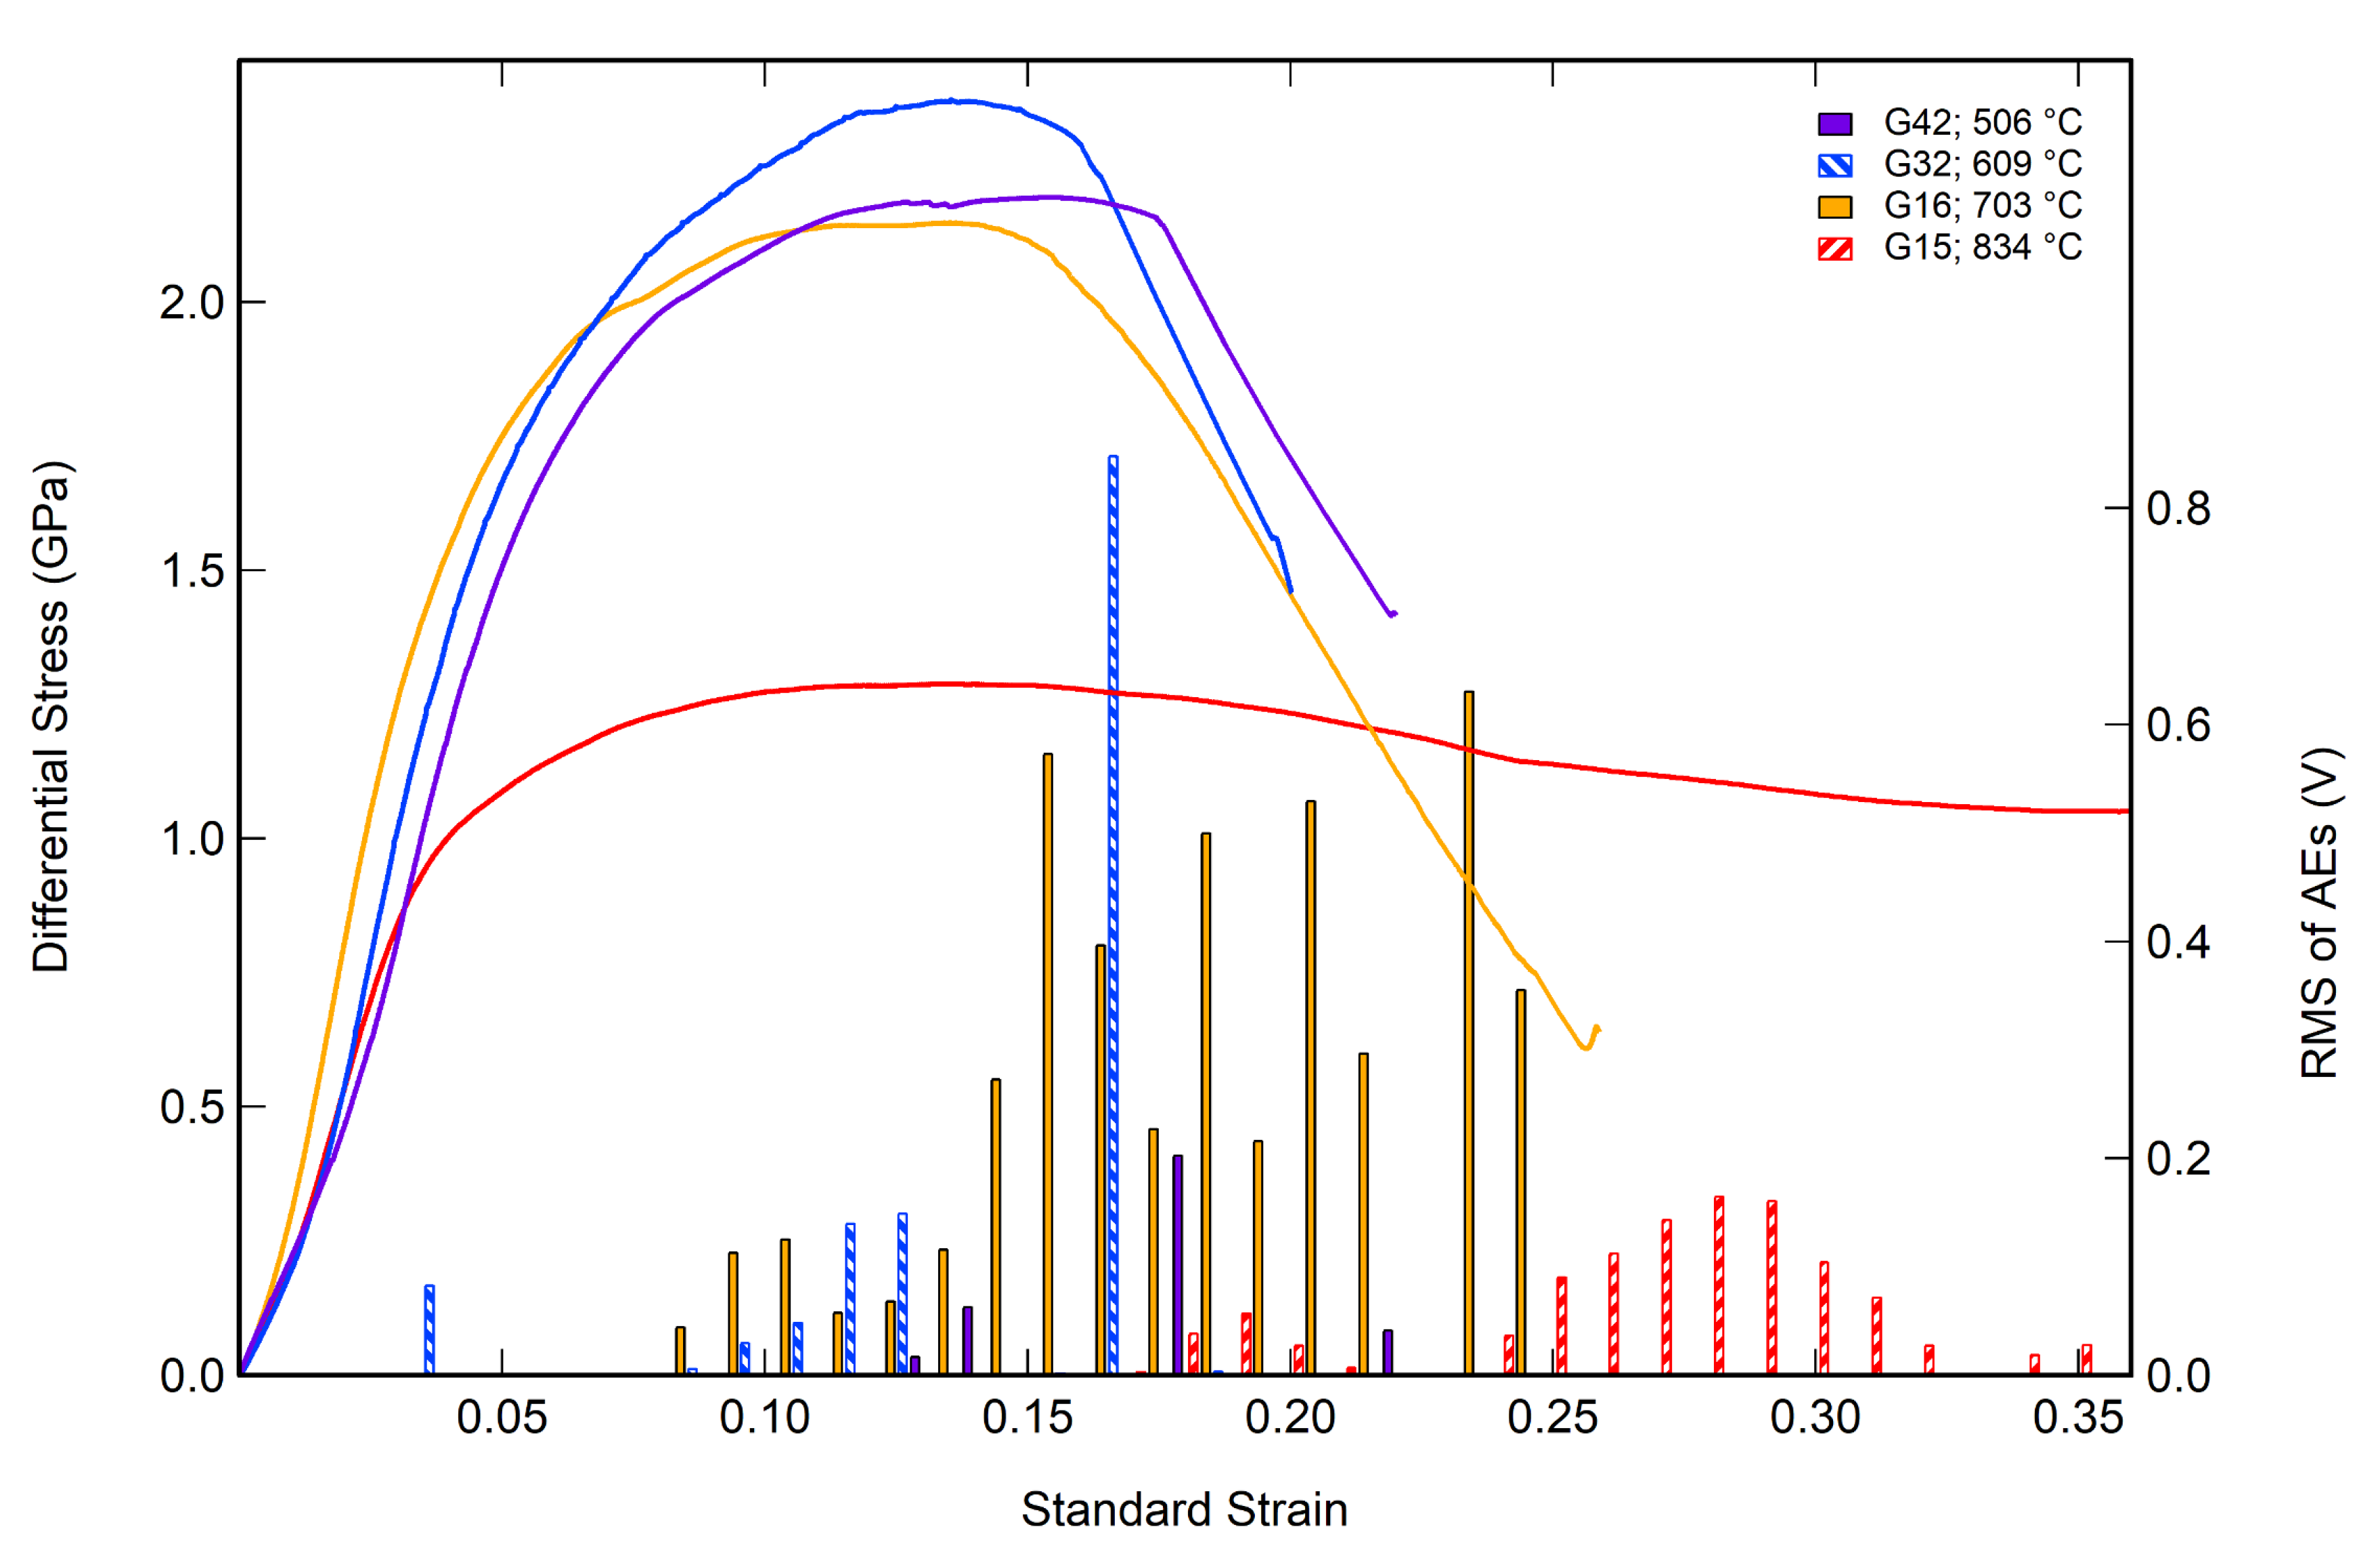
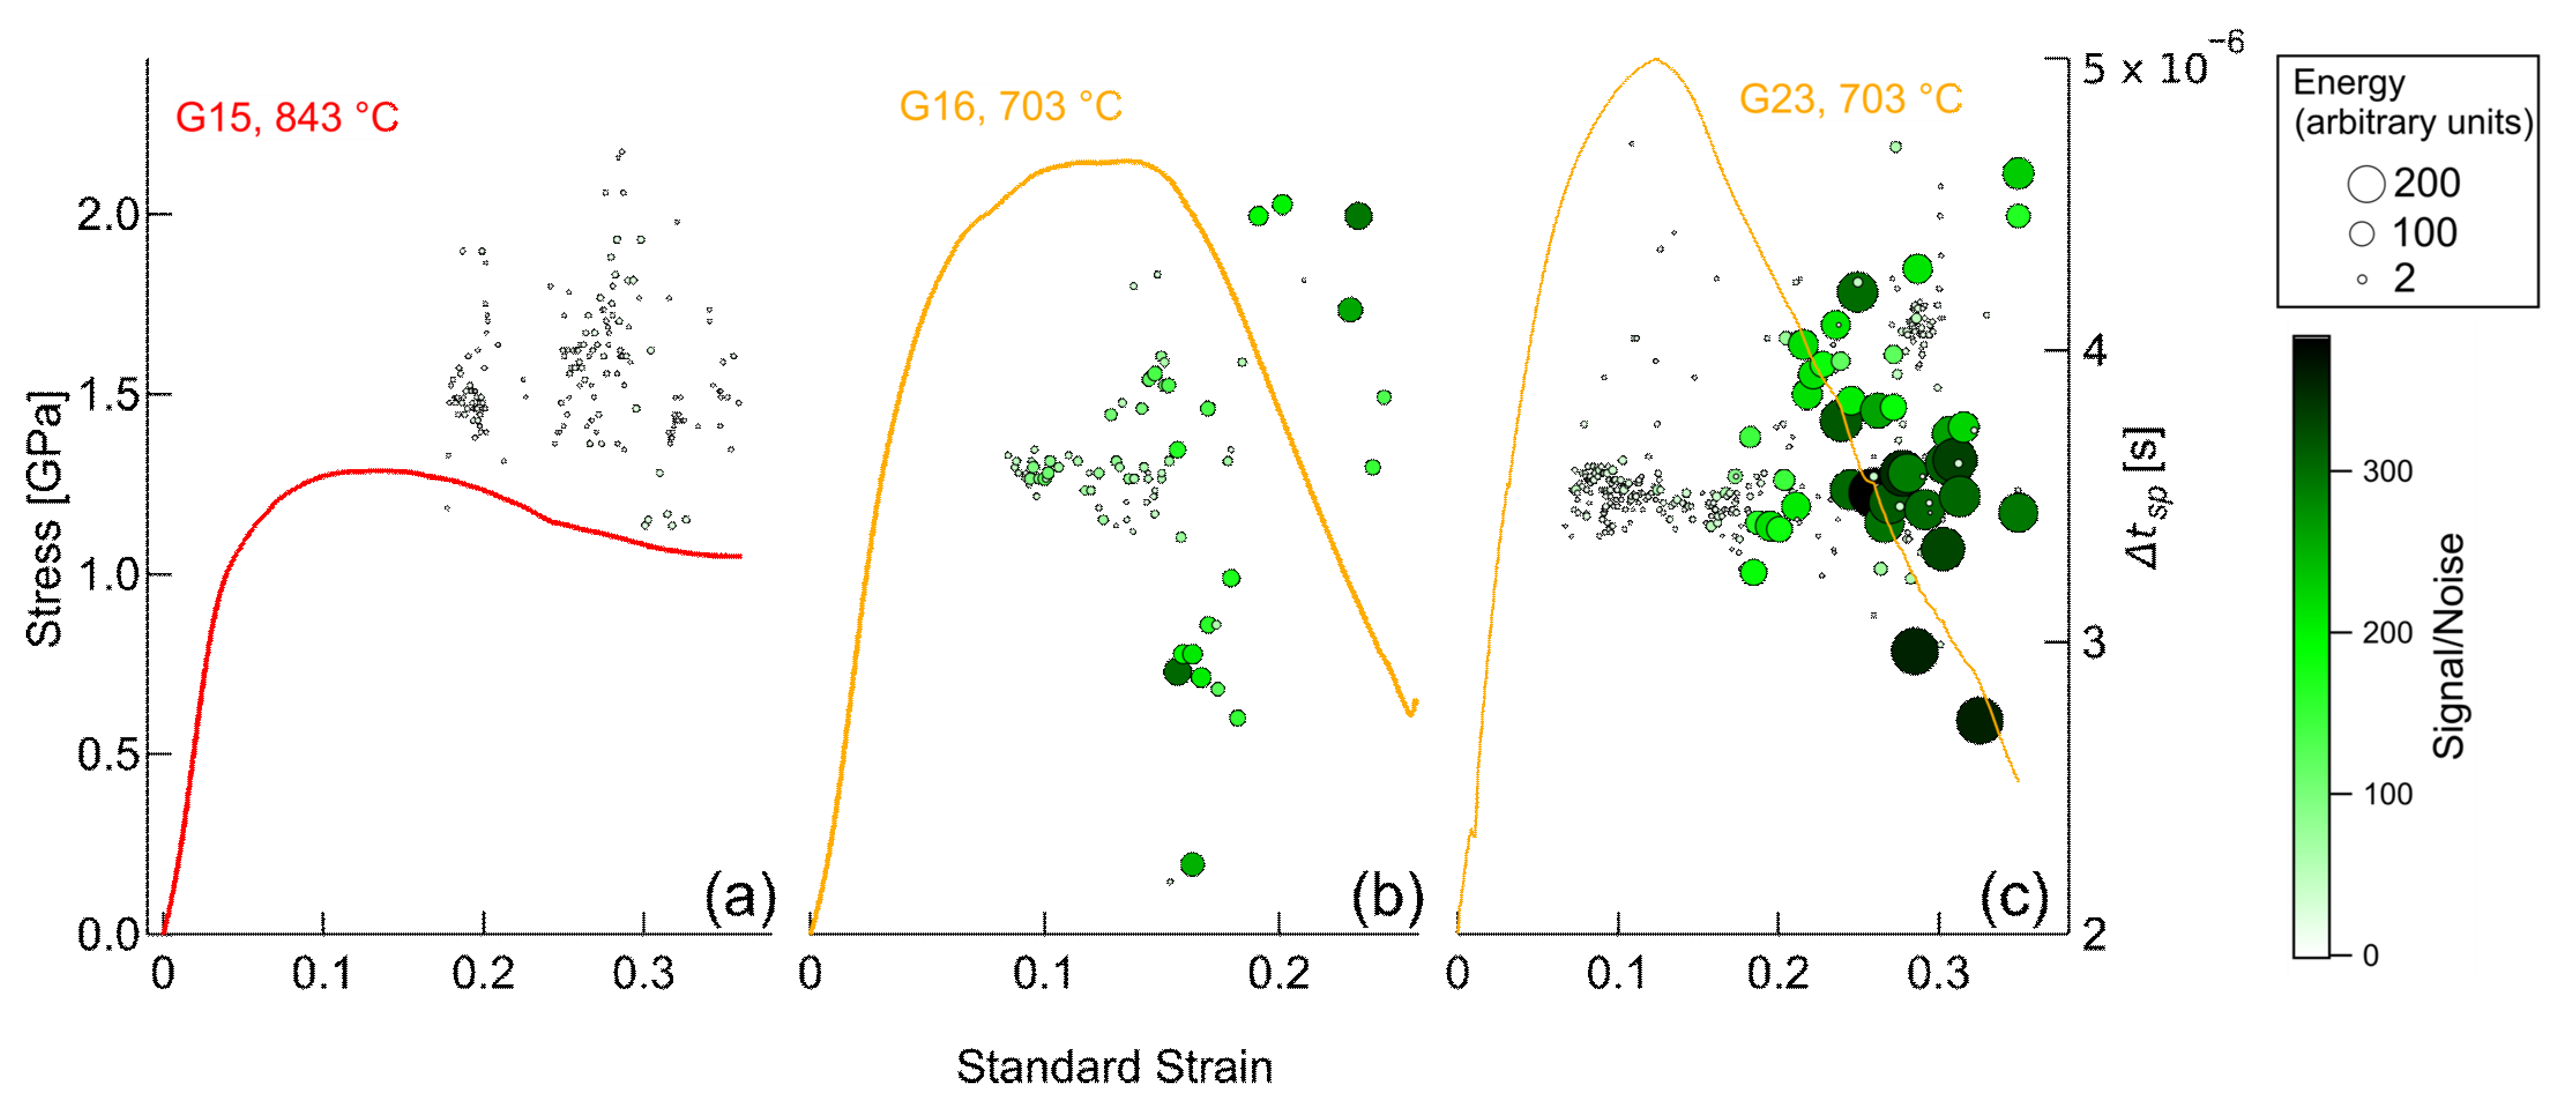
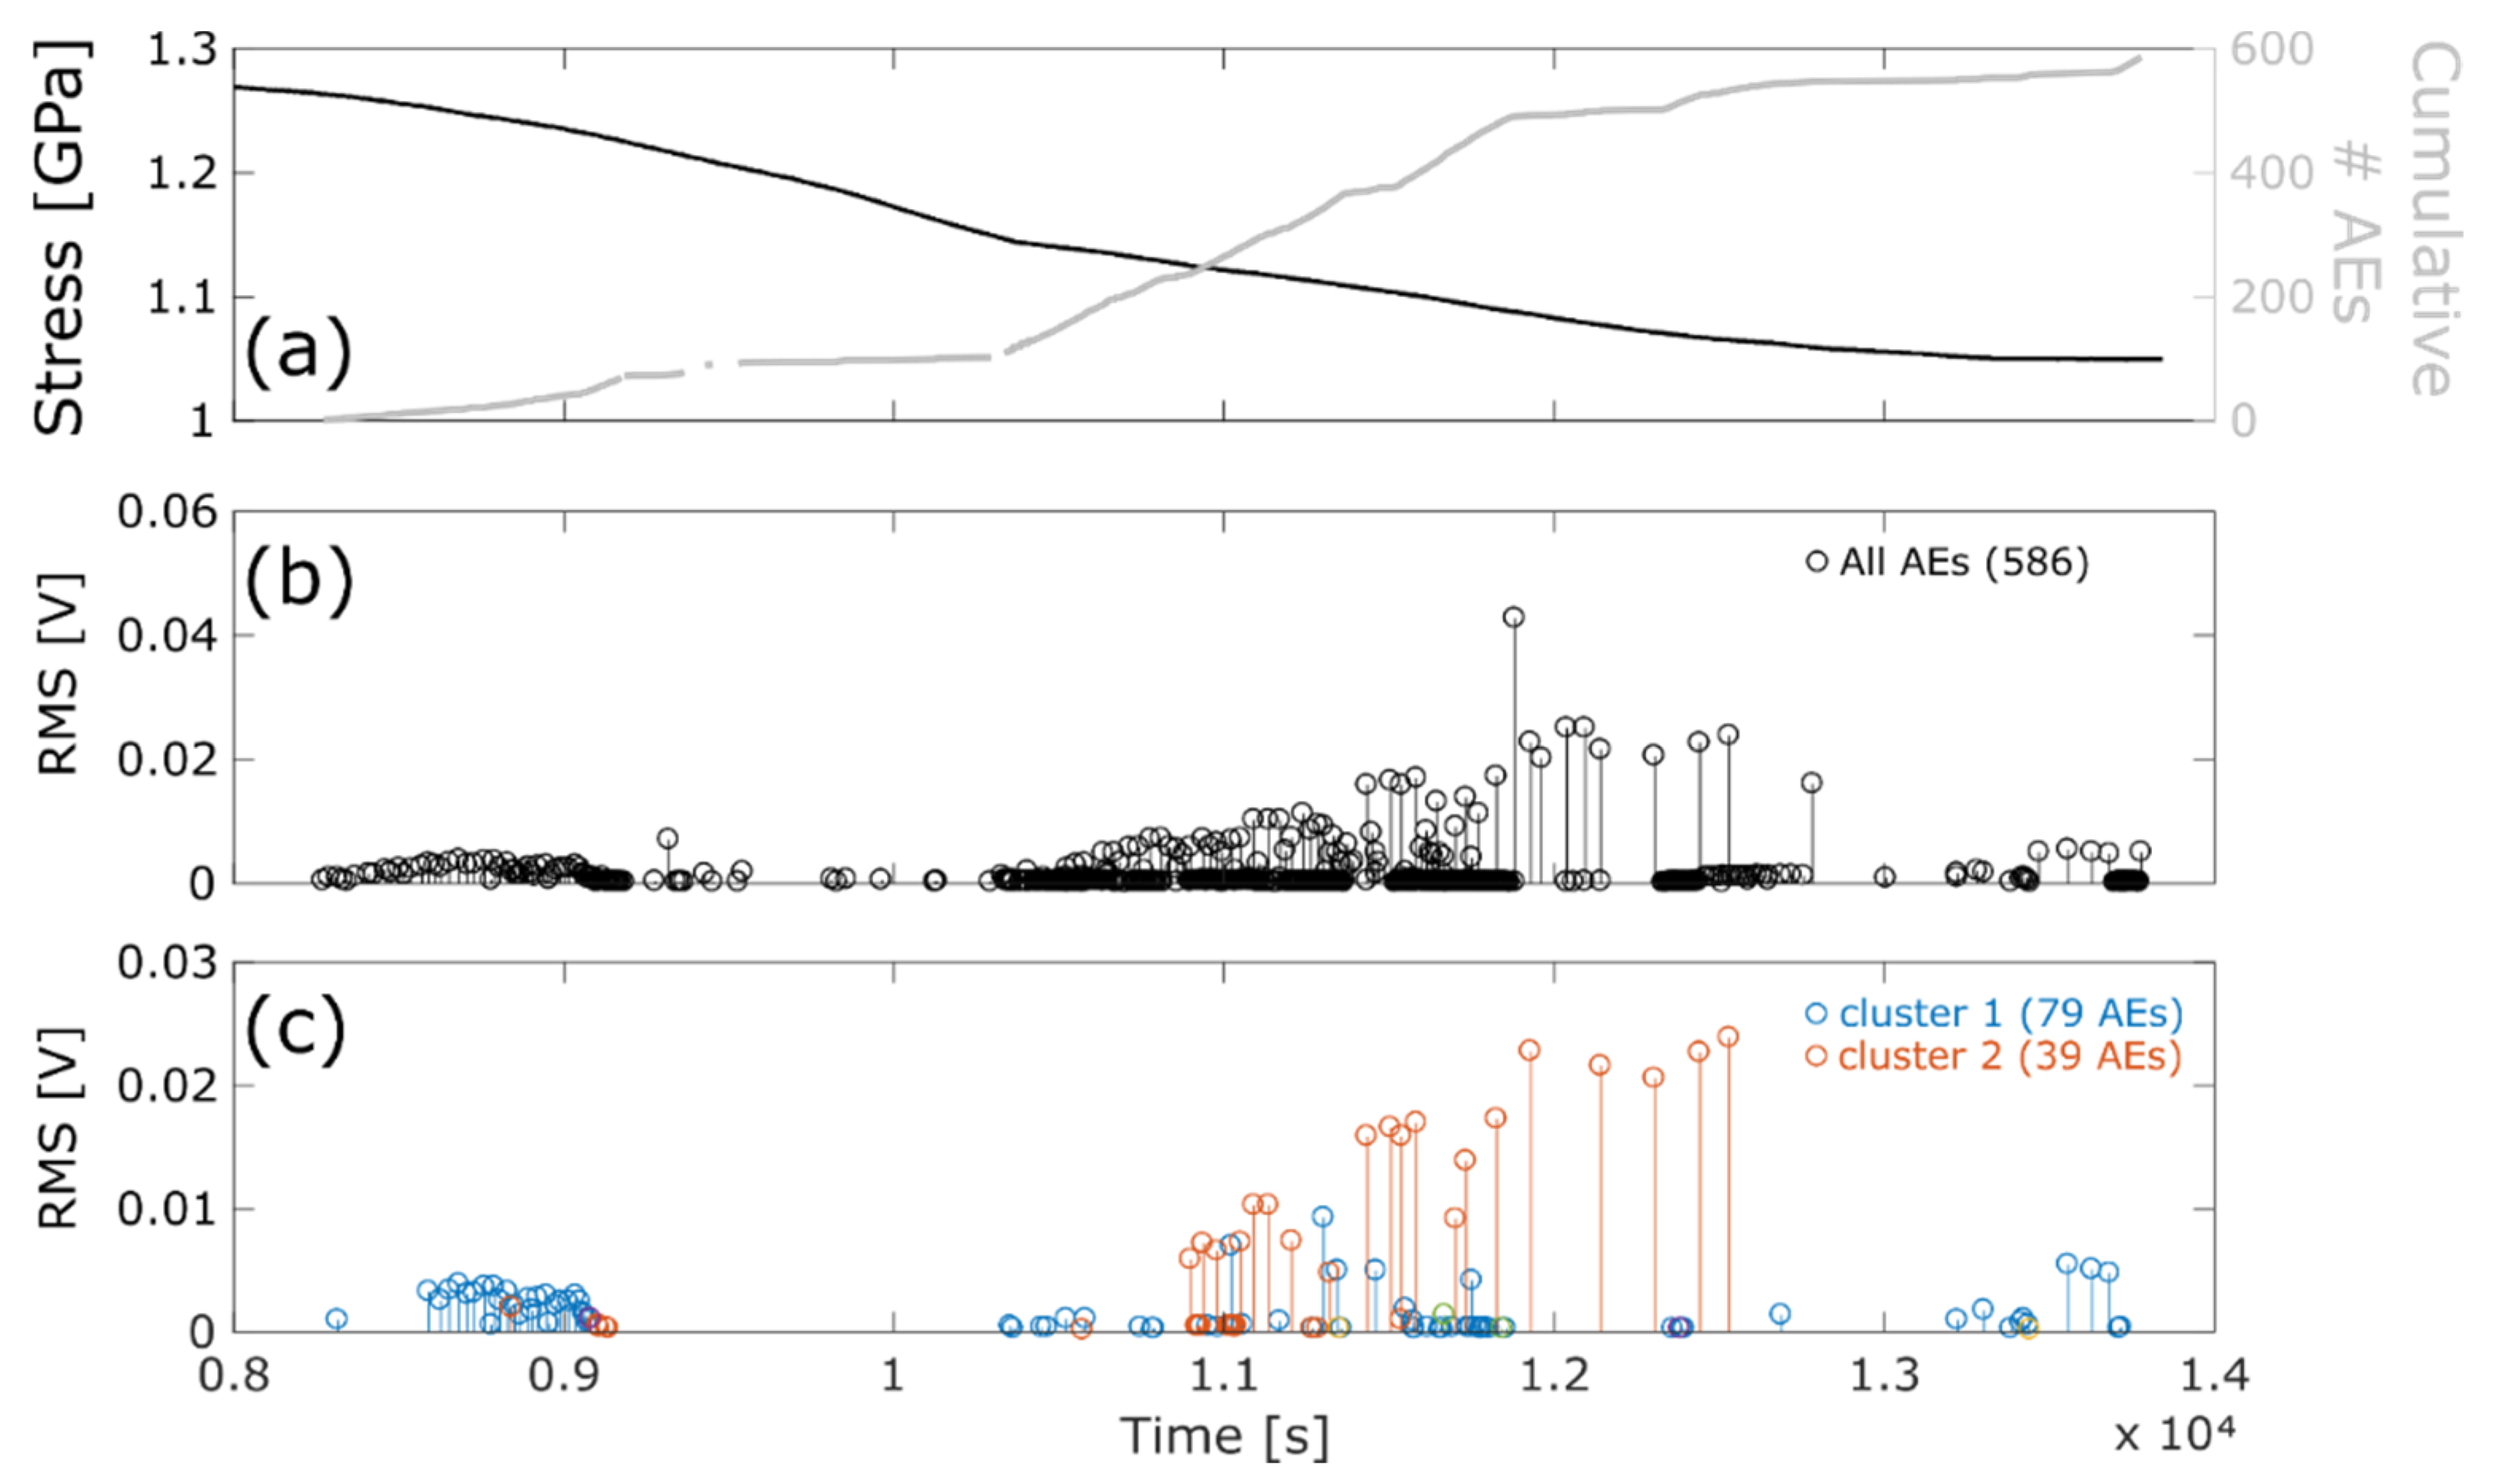
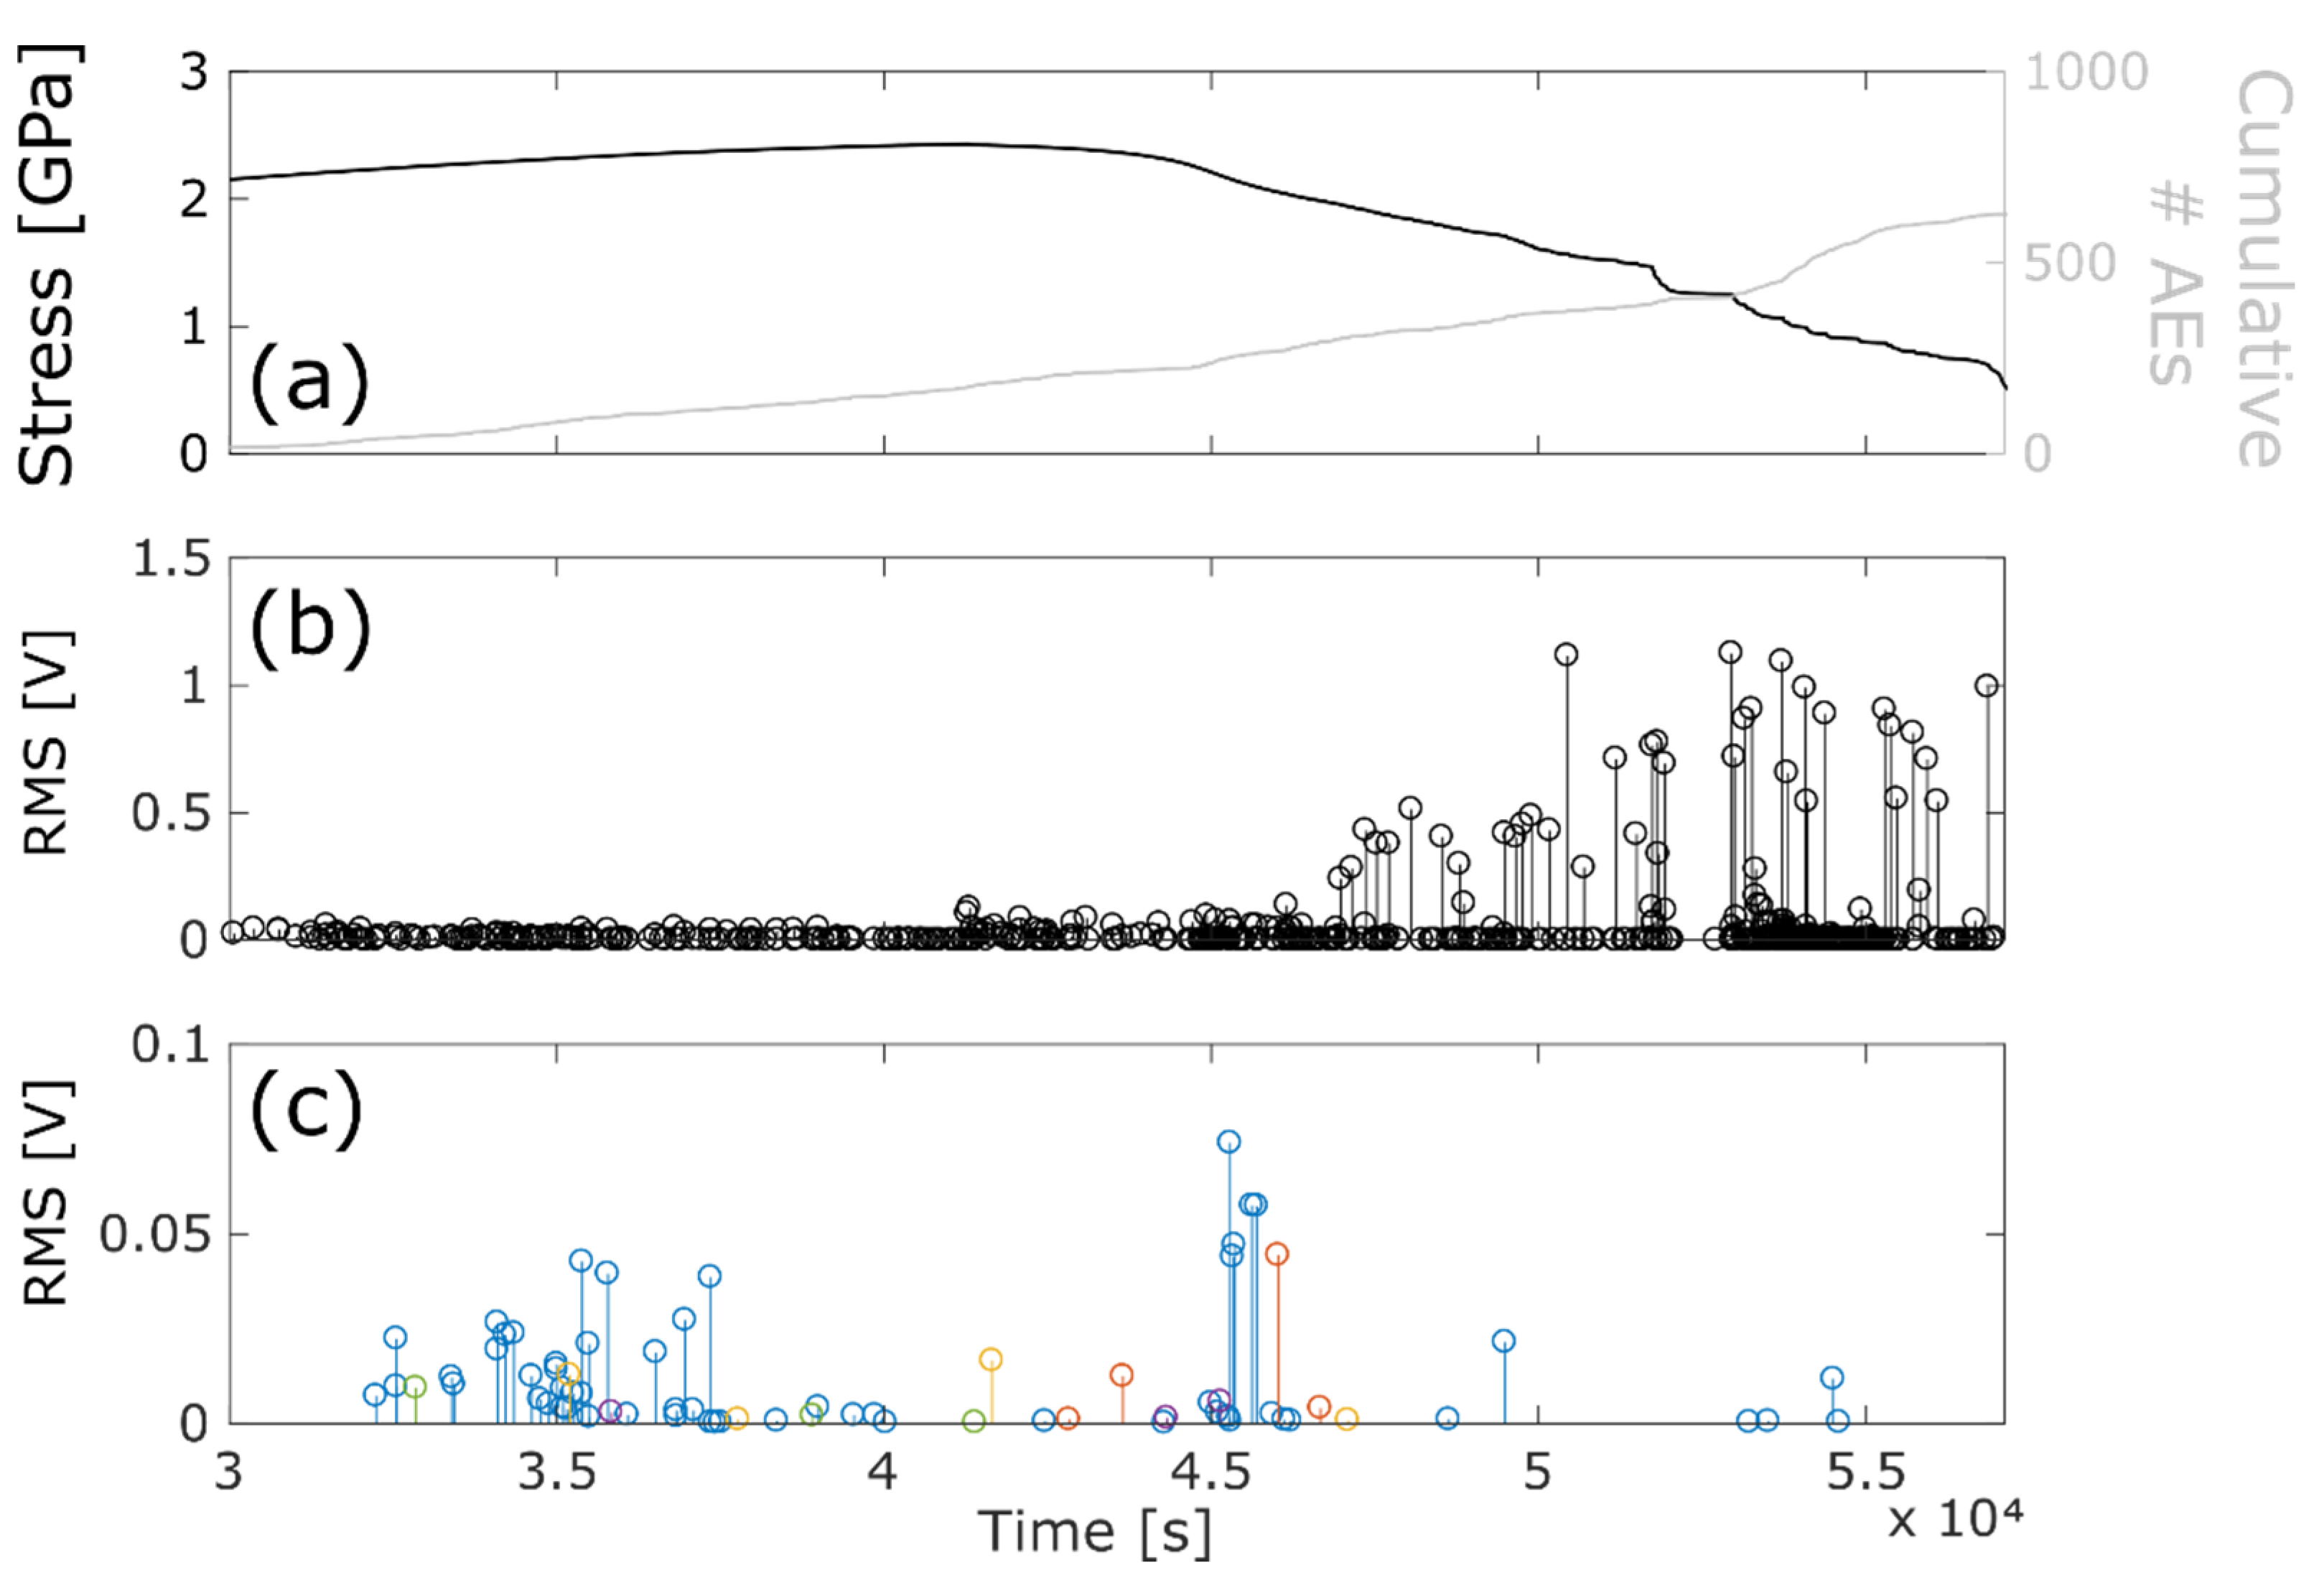
3.1. Mechanical Data and Acoustic Emissions

In total, seven experiments were performed at temperatures ranging from 506 to 843 °C, including experiment G22, where a shorter Ge-olivine sample was used, sandwiched between two Ge-spinel bits. High-temperature experiments showed ductile behaviour, while other experiments ended with sample failure. However, AE records vary significantly depending on strain rate and temperature. Results are summarized in Figure 4 and Table 1, where they are sorted by order of decreasing temperature. The degree of transformation varies greatly across the temperature range investigated. The samples at high temperature (>800 °C) are almost fully reacted, while the transformation is nearly completely inhibited at 500 °C.

3.1.1. High-Temperature Regime

Two samples, G15 and G43, were deformed at high temperature (~840 °C) under different strain rates. Both mechanical curves show a peak stress of 1.3 GPa, followed by a softening (Figure 4a). Experiment G43 was run at a strain rate of ~5 × 10⁻⁶ s–1, the lowest of the present data set. For technical reasons, it was not possible to run the experiment long enough to reach a plateau beyond the softening stage. No AEs were recorded during the deformation. Sample G15 was deformed approximately ten times faster. Although the stress-strain curve is similar to that of G43, this sample yielded two bursts of numerous but small AEs. AEs appeared beyond the peak stress after ~17% shortening and accompanied the entire softening phase. Within each burst, several successions of AEs present increasing RMS, attesting to increasingly large rupture lengths.

3.1.2. Intermediate Temperature Range

Samples G16, G22, and G23 were deformed at 703 °C and eventually failed in a brittle way, accompanied by numerous and large AEs. Sample G22 was constituted of a Ge-olivine core sandwiched by two pre-sintered Ge-spinel cores. The shorter Ge-olivine sample length impacts both the number of AEs as well as the stress-strain curve (Figure 4). For the other two experiments, the first part of the curves presented in Figure 4b is extremely similar up to ~1.7 GPa. Sample G23 then reaches a greater peak stress despite a lower strain rate (Table 1). In addition, G16 displays some, albeit limited, ductility with a stress plateau near peak stress, whereas G23 displays a typical brittle behaviour, despite a significantly slower strain rate, where rupture immediately follows peak stress. As expected, peak stresses are higher than for high-temperature experiments. However, similar to the observation made at higher temperatures (Figure 4a), the lower strain rate curve does not show lower peak stress. Peak stress is followed by catastrophic failure for G16 and G22 and by a series of small stick-slip events for G23. For this latter experiment, the number of events is similar to that of G15 at a higher temperature, although AEs are considerably larger. AEs for G16 and G22 at faster strain rates are less numerous, but the low b-values obtained (see Table 1) indicate a similar magnitude-frequency distribution with an important proportion of large events. In comparison to the higher temperature/lower stress experiment G15 (843 °C), at 703 °C, AEs are present from the beginning of the deformation stage, but their RMS, a proxy for the seismic moment, ramps up to reach maximum values upon rupture that are 1–2 orders of magnitude larger than those of G15 (Figure 5).

3.1.3. Low-Temperature Regime

Samples G32 and G42 were deformed at lower temperatures and exhibited some, albeit limited, ductility. Both samples failed with an abrupt stress drop before reaching 20% strain. However, in contrast with the intermediate temperature samples, deformation was accompanied by very few AEs and sample failure yielded no more than a couple of events. Here again, in a counterintuitive fashion, the sample deformed faster and at lower temperature, G42, displayed a lower peak stress and more ductility with a short stress plateau (Figure 4c).
In summary, experiments in the intermediate temperature range (~600–700 °C) show a lack of ductility and the concomitant occurrence of faulting and large and numerous AEs, characteristic of dynamic fault propagation. It is not the case in the high temperature experiments where samples are fully reacted (~840 °C), nor is it the case at the lowest temperature where the transformation is inhibited (~500 °C). Taken together, these mechanical and acoustic data are therefore a strong indication that it is the transformation that causes brittleness, faulting, and results in large AEs when kinetics are favourable, i.e., when the samples only partly transform during deformation.

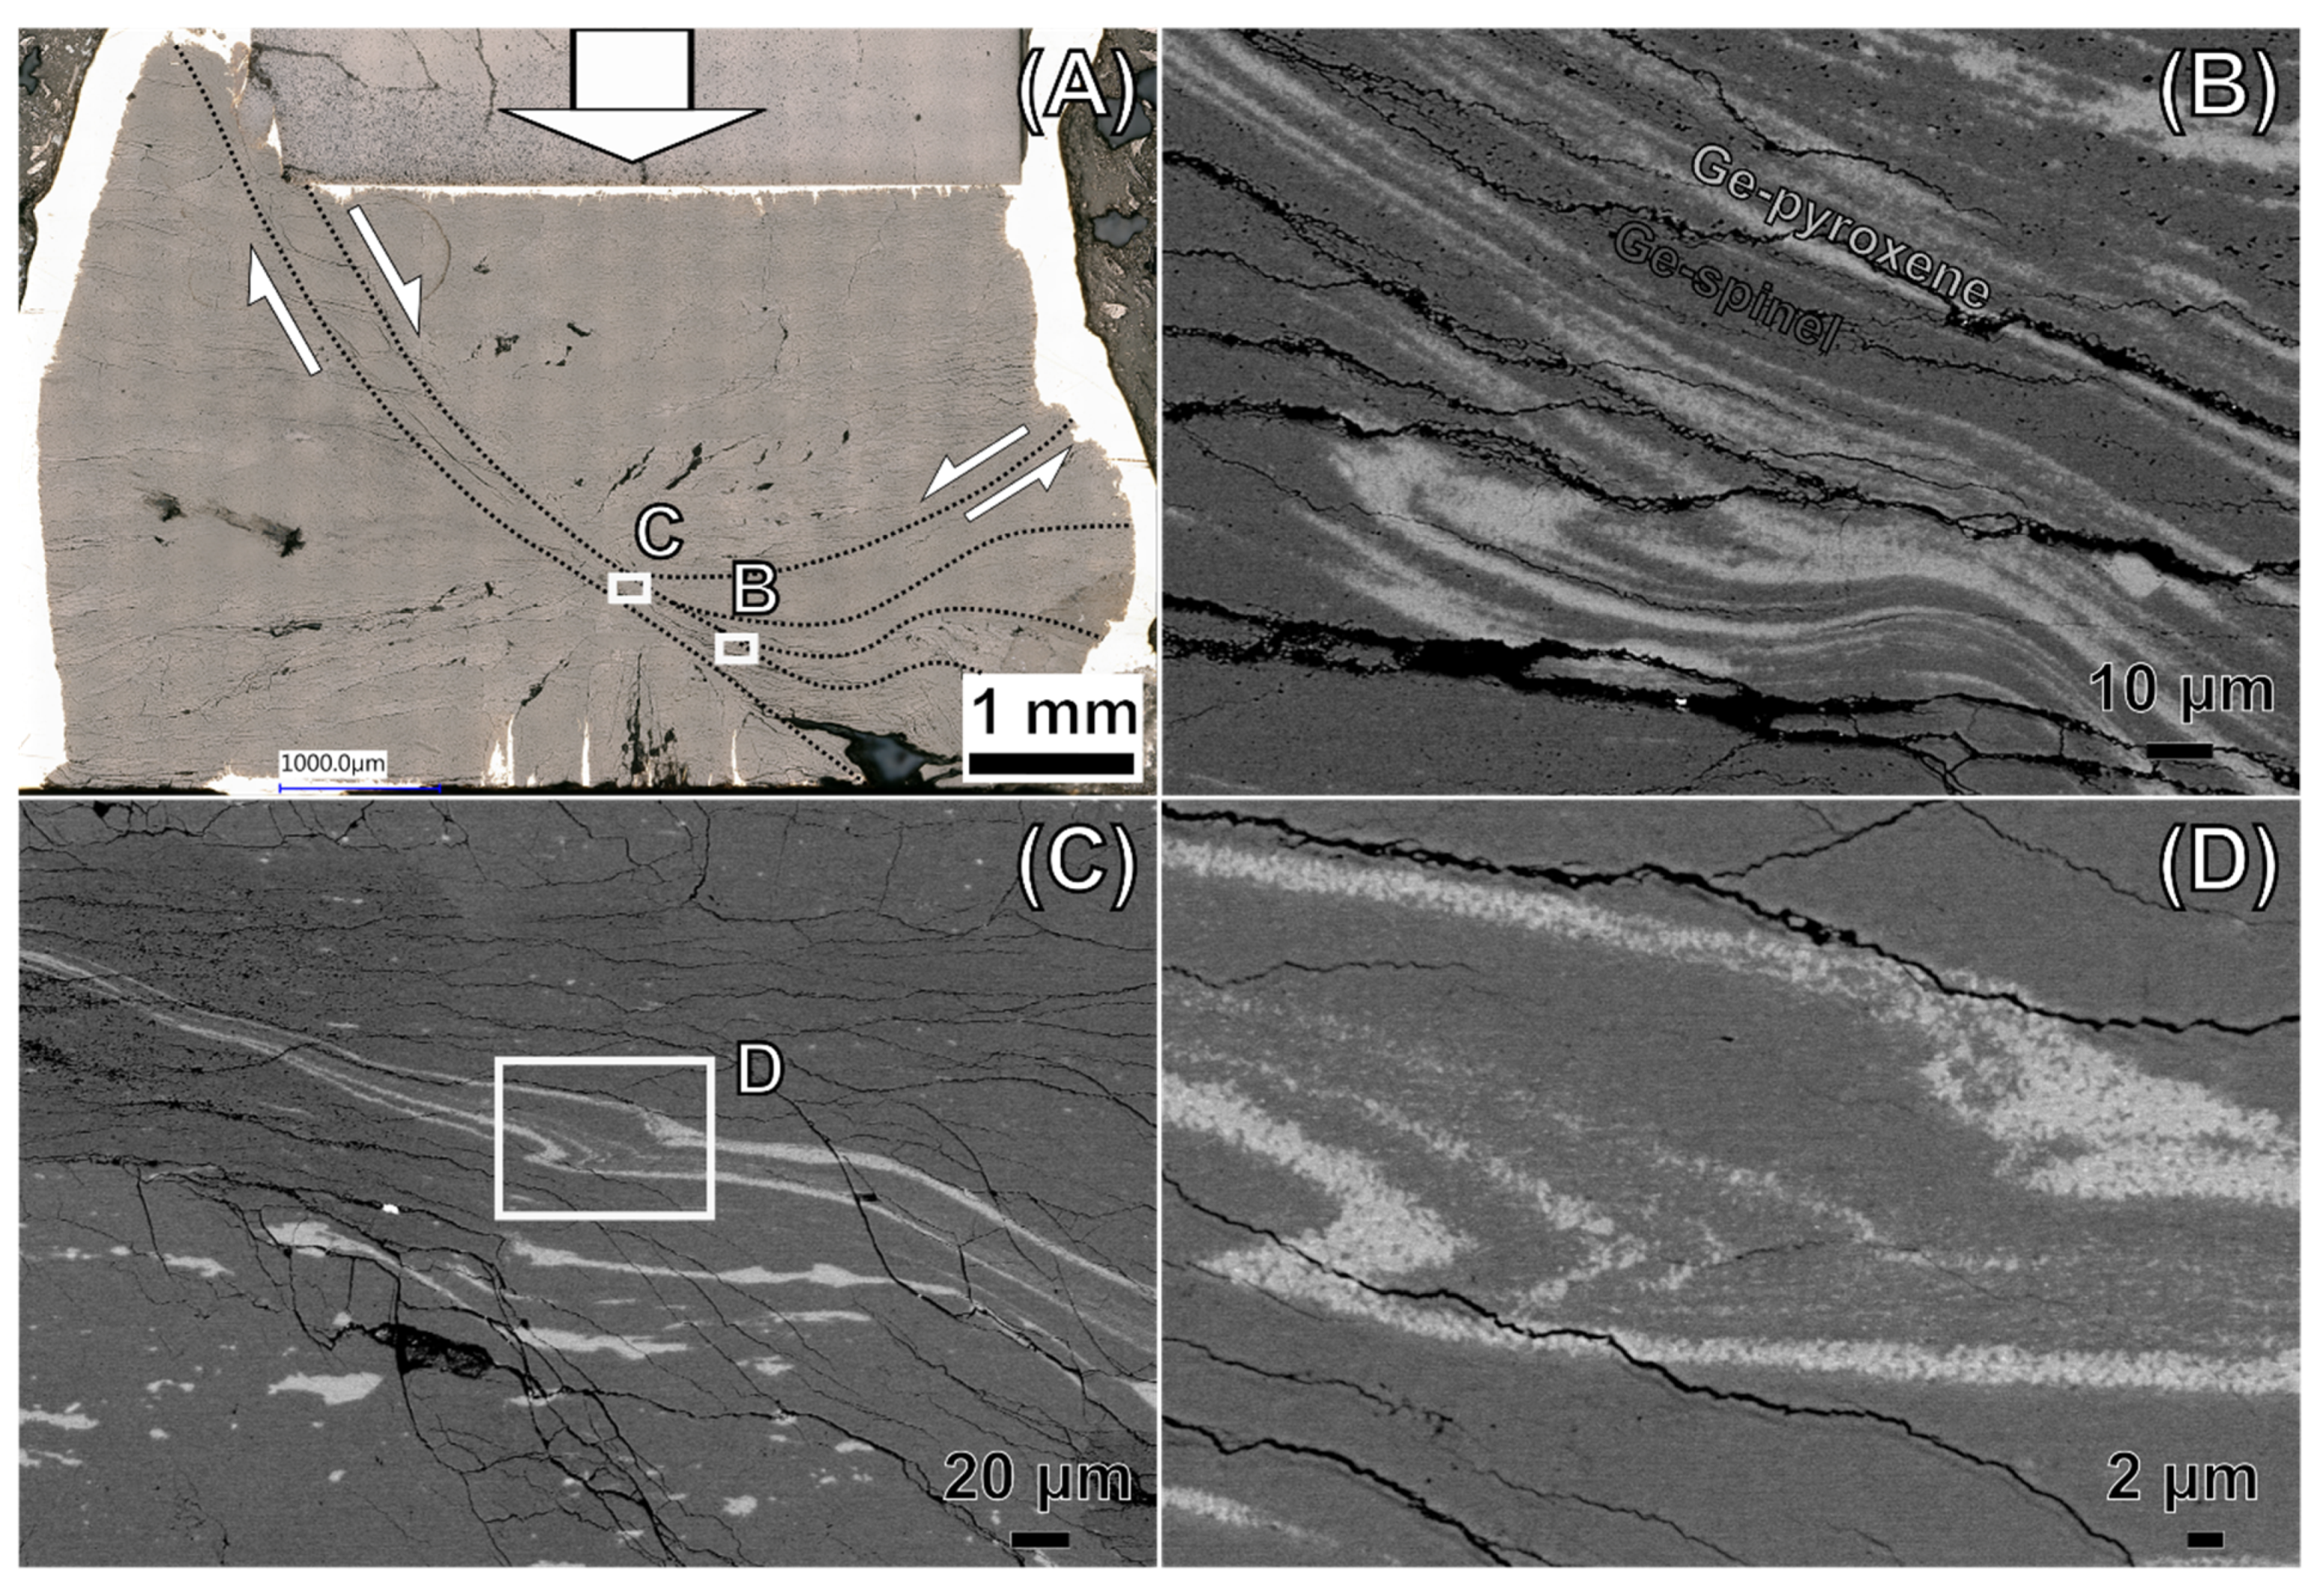
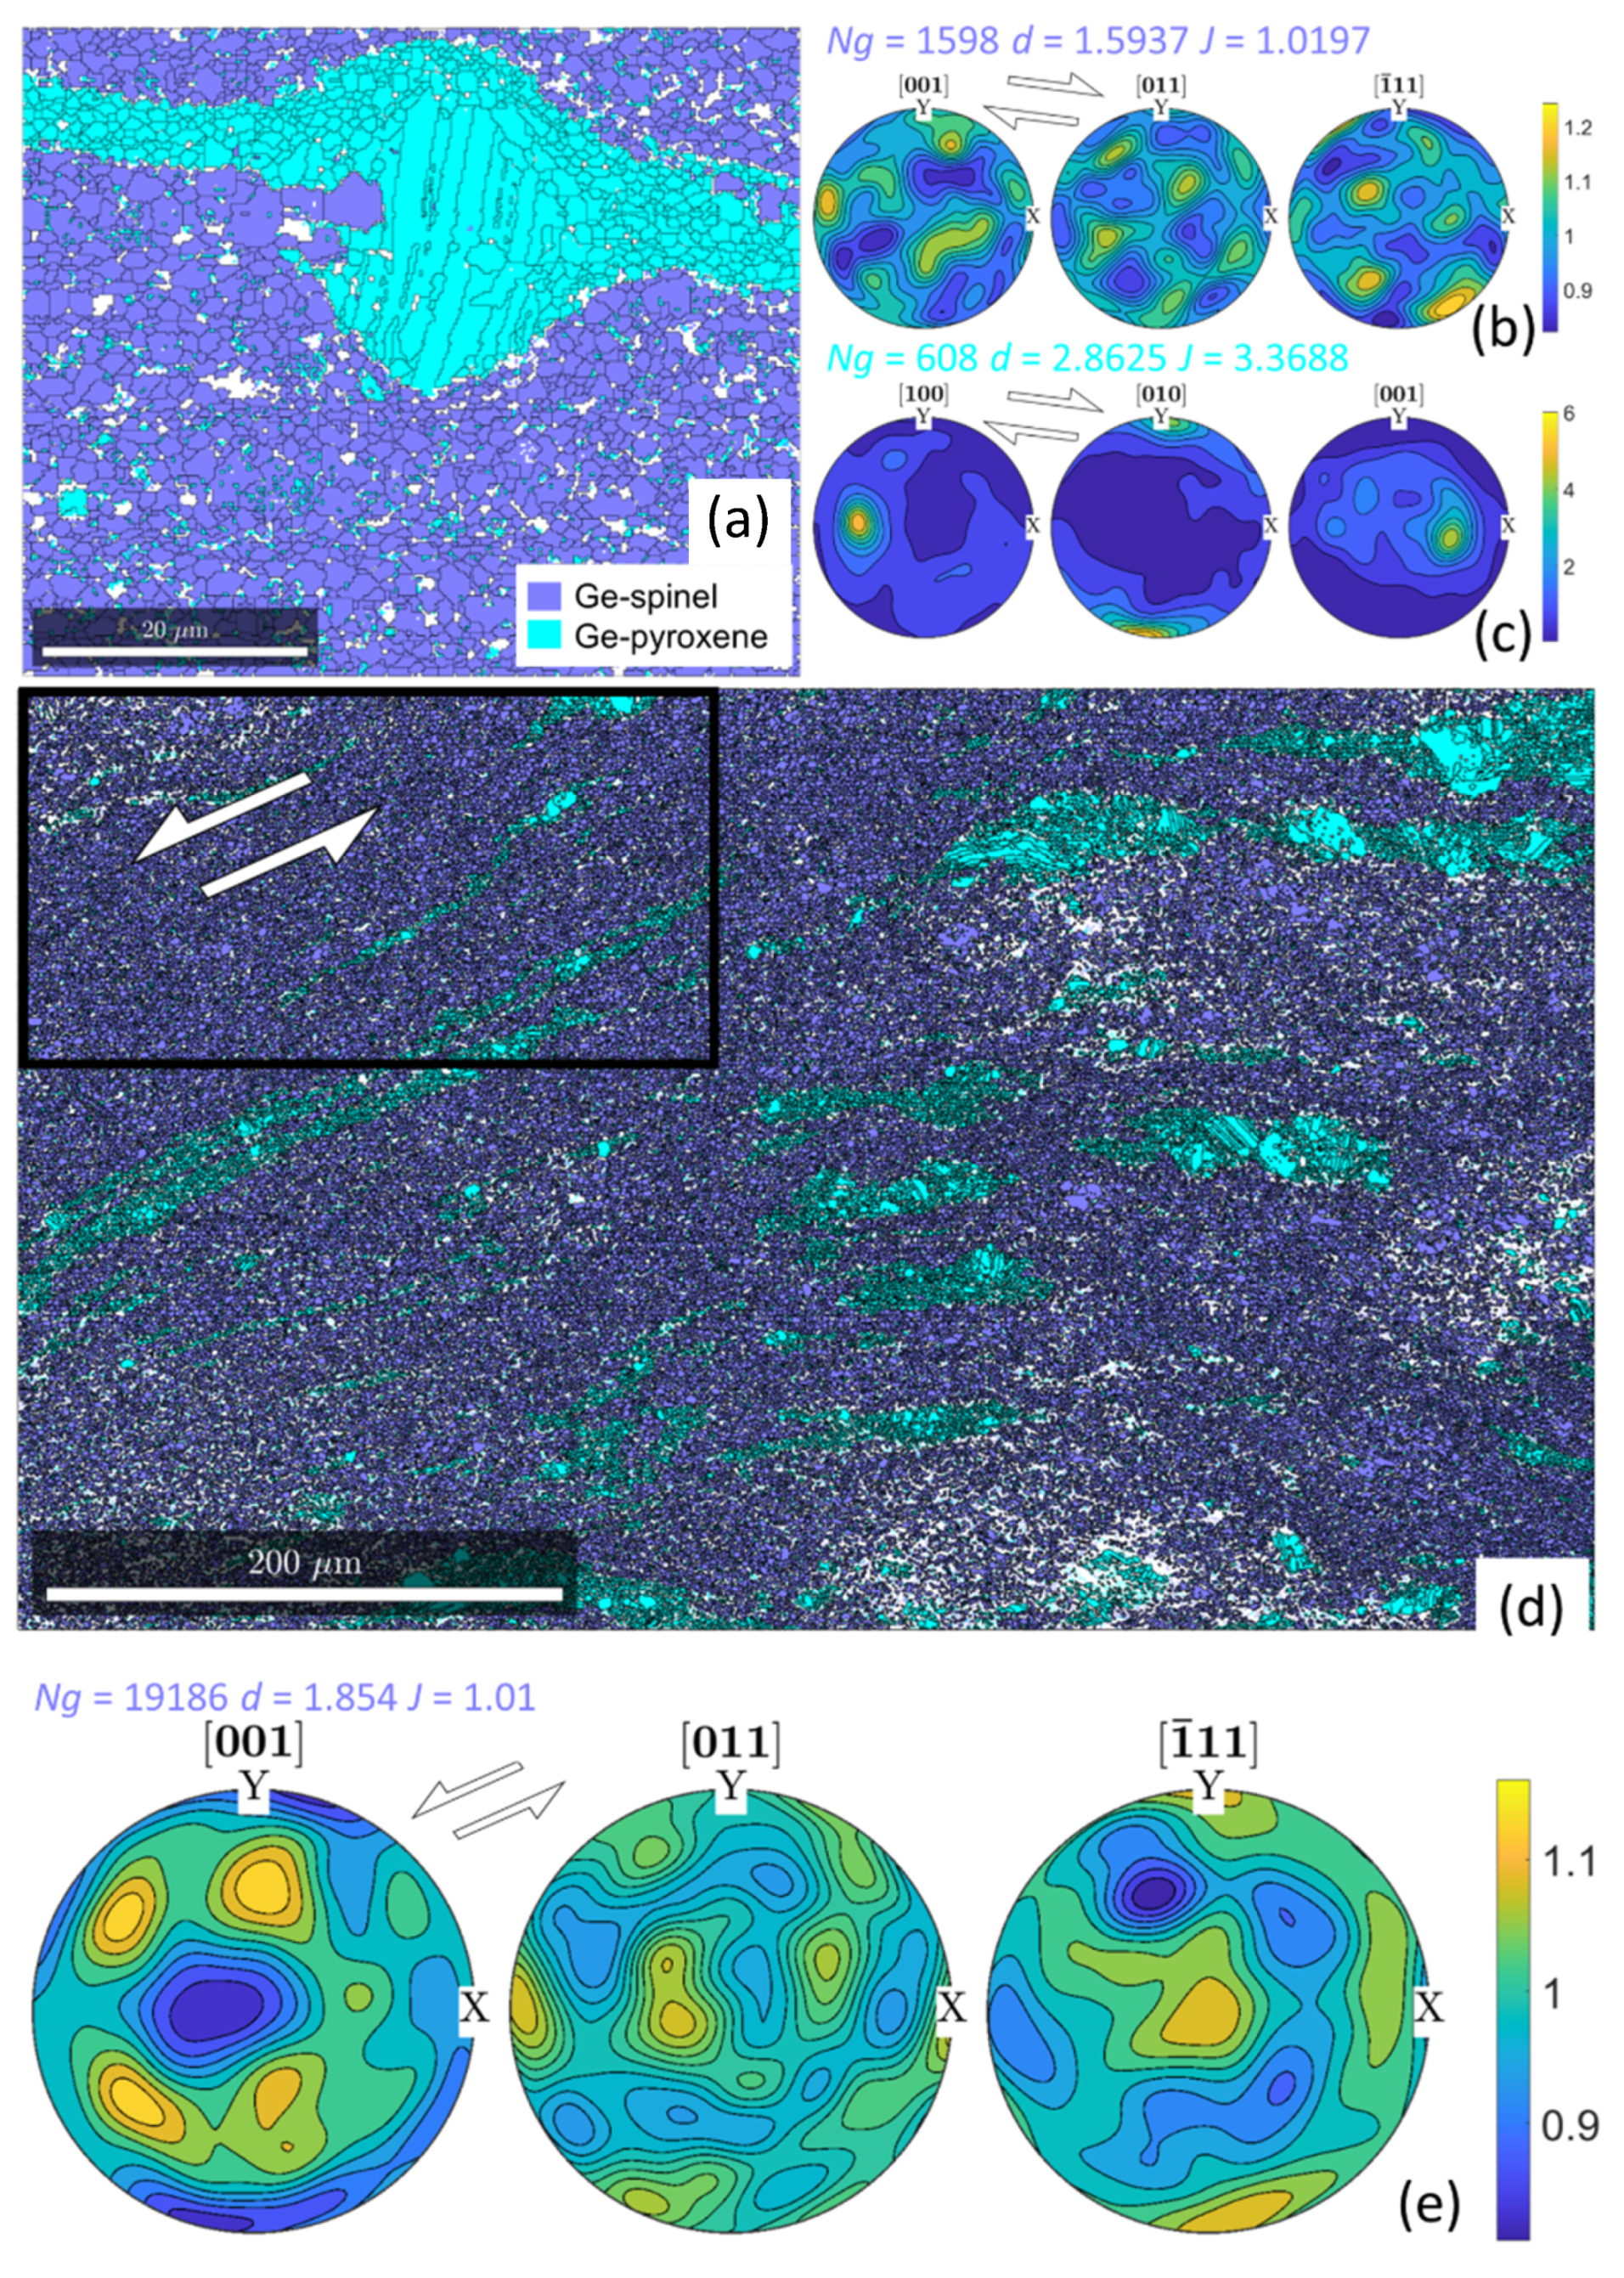
3.2. Microstructural Analysis

3.2.1. Ductile Localization with Rapid Ge-Spinel Growth

The two samples deformed at high temperatures are nearly fully reacted to Ge-spinel. However, transformation is heterogeneous throughout the sample as it is sensitive to both pressure and temperature changes. It is highly sensitive to pressure like all polymorphic reactions with a low Clapeyron slope indicative of a strong volume change. It is also highly sensitive to temperature because of the equilibrium overstep applied here, which implies that the reaction kinetic is mostly sensitive to temperature rather than the distance from equilibrium, i.e., a temperature increase reduces the equilibrium overstep but still results in an important kinetic increase due to the dramatic enhancement effect of temperature. Consequently, reaction extent is highly heterogeneous inside the samples due to small pressure (or stress) and temperature gradients. In undeformed regions where some relict Ge-olivine is present, Ge-spinel is observed as lenses that mostly grow normal to the principal stress imposed (Figure 6).
Strain is localized on conjugate planes in both samples, despite the ductile behaviour suggested by the mechanical data (Figure 7). In the BSE images, the dramatic shearing of the Ge-pyroxene grains evidences that these apparent faults are mylonitic shear bands. They are composed of fully reacted Ge-spinel that recrystallized into small euhedral grains. Phase mixing with Ge-pyroxene is incipient in most cases and attests to important strains. Grain size of both Ge-pyroxene and Ge-spinel within the shear bands is <1 µm, which attests to substantial dynamic recrystallization, since the initial average grain size of Ge-pyroxene in the HIP sample—still observed in undeformed regions of the samples—is ~23 µm.
EBSD analysis of the shear bands in G15 reveals the small grain size foreseen in the BSE images, as highlighted by the dramatic recrystallization of Ge-pyroxene grains. On the smaller EBSD maps acquired, a few tens of microns wide, Ge-spinel does not present an identifiable texture in the pole figures that show near random crystal orientation, and therefore suggest that deformation is mostly accommodated by grain rotation and grain boundary sliding (Figure 8a,b). In contrast, the pole figures of Ge-pyroxene display a strong texture with an alignment of the [010] axis normal to the shear plane, thus revealing the key role of dislocation creep in the dynamic recrystallization process (Figure 8c). However, the analysis of a much larger number of grains using a wider EBSD map within a shear zone reveals a light but significant texture for Ge-spinel (Figure 8d,e). The preferred orientation is marked by a minimum concentration of [001] axes in the shear plane and perpendicular to the shear direction, whereas maxima of concentration tend to align at 45° to this direction. A slight maximum of [111] axes is also observed perpendicular to the shear direction. The texture is very weak, with a J-index of only 1.01, but statistically relevant, as it was extracted from a considerable number of grains (19,186); it is also consistent with the previously reported textures of the high PT deformation of ringwoodite [31].

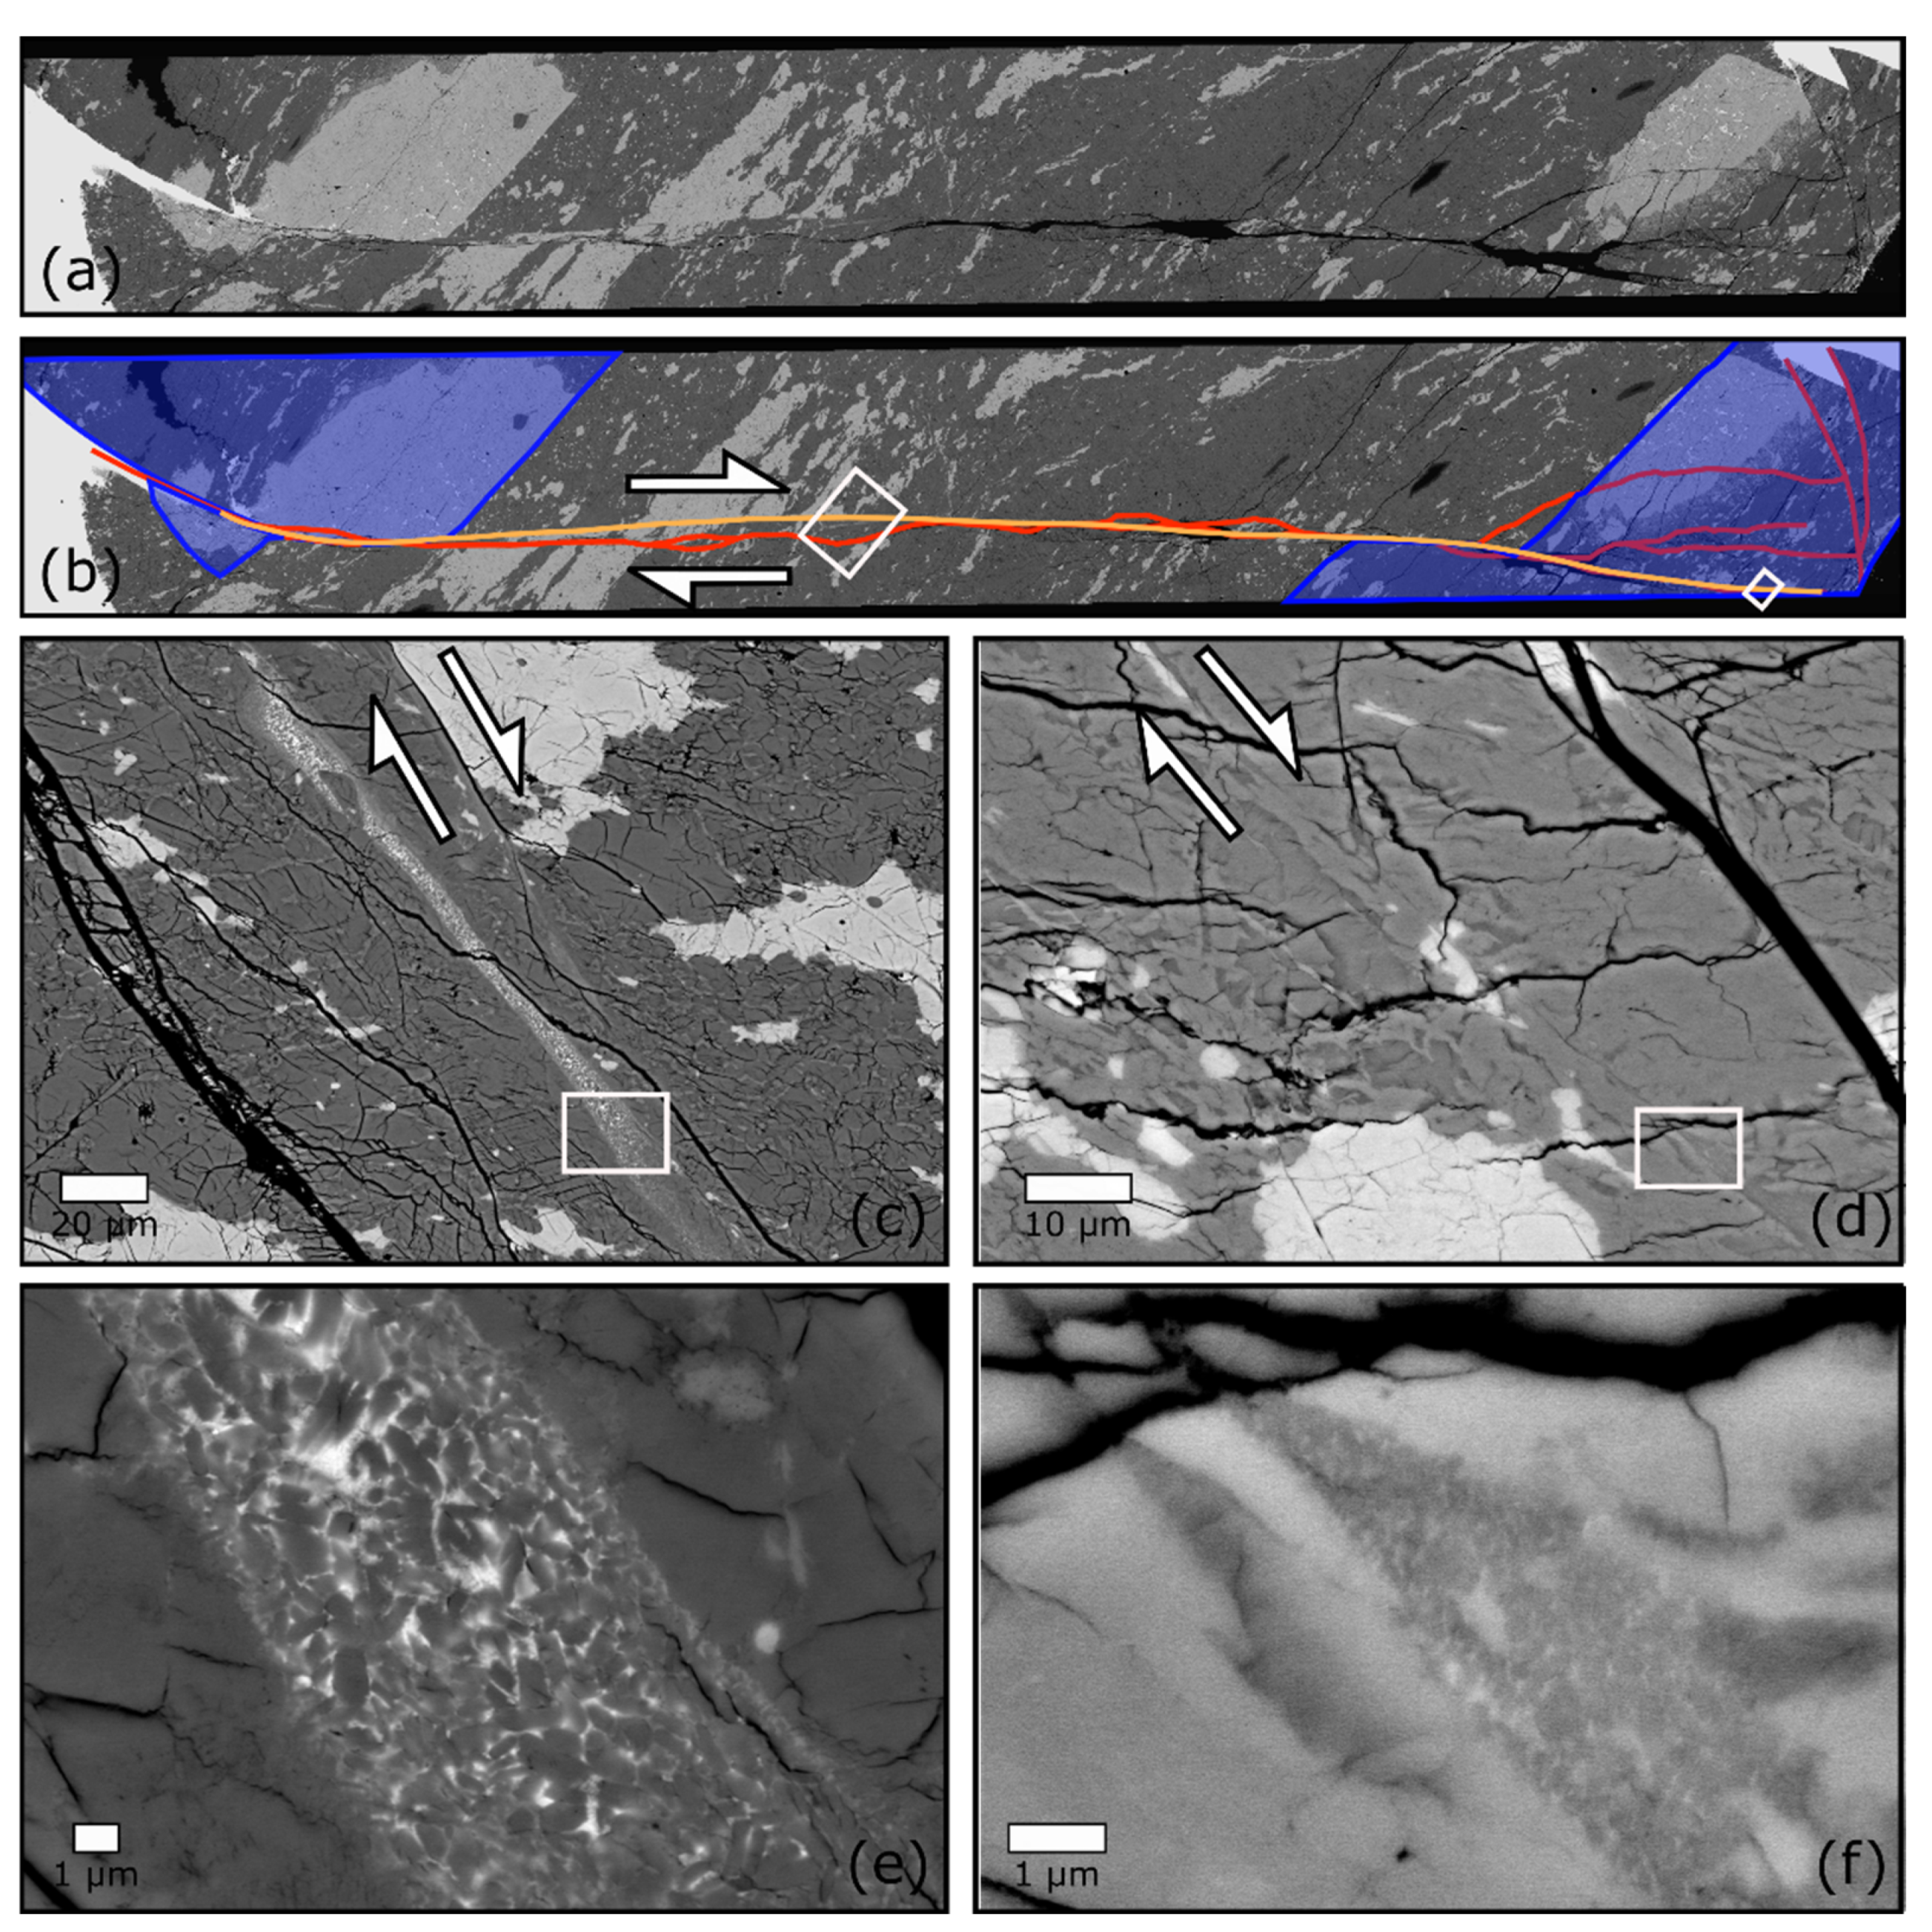
3.2.2. Slow Spinel Growth and Transformational Faulting

Samples G16, G22, and G23 all yielded significant AEs and eventually faulted in a brittle way. As expected from the lower temperatures, the reaction extent is lower in those samples. Ge-spinel is very heterogeneously distributed at the sample scale, as revealed by the optical images, where Ge-spinel appears darker than Ge-olivine (Figure 9a–c). The reaction is more important in some regions near the alumina piston due to stress concentrations. In all three samples, Ge-spinel concentrates in spear-shaped features were oriented at ~45° to the shortening direction. SEM images reveal that these features localized most of the strain, as evidenced by the dramatic elongation of Ge-pyroxene grains that they have cross-cut (Figure 9d,e). The interplay between strain localization and transformation is observed in all samples deformed under these PT conditions; whereas it could not be observed at higher temperatures where the reaction is pervasive. Here, the reaction in the undeformed bulk of the sample is confined to isolated lenses, a few microns to tens of microns large (lower-right hand corner of Figure 9f,g). We note that these lenses are less elongated than those observed in the high-temperature samples. In the bulk of the samples, Ge-spinel seems to nucleate indifferently within Ge-olivine grains and at grain boundaries, and then grows incoherently normal to principal stress. In contrast, close-up examinations at the tip of the spear-shaped shear bands shows that incipient reaction mostly proceeds at grain boundaries, insensitive to principal stress direction.
The results from the EBSD mapping of these shear zones are shown in Figure 10 and Figure 11; they correspond to the white rectangles in Figure 9a,c. The phase maps obtained confirm the greater presence of Ge-spinel inside the shear bands, whereas adjacent regions have preserved, for the most part, the initial texture, with no evidence of deformation and sparse Ge-spinel lenses. However, due to the intense deformation and grain size reduction within the shear bands, EBSD indexation is very poor. The pole figures obtained show very weak textures. Those of Ge-spinel, however, agree with the textures described above at higher temperature, and therefore correspond to shear-induced preferred orientations where [001] axes align at 45° relative to the shear-perpendicular direction. As expected from the darker region observed in the optical image (Figure 9a), the lower right-hand corner of the EBSD map shown in Figure 11a shows a higher degree of reaction. Interestingly, here, the olivine CPO is noticeably different from that of the starting material. It is marked by a [010] axis maxima parallel to the shortening direction and a [001] girdle normal to that same direction. Such a texture is common for samples deformed at high stress in pure shear [32,33].

3.2.3. Transformational Faulting and Frictional Melt Production

The shear bands observed in the transformational faulting samples show various degrees of transformation and are narrower than the mylonitic ones in the ductile, high-temperature, samples; they are associated with fewer but more energetic AEs, which suggests that their propagation involves dynamic rupture. In sample G22, a fault eventually ruptured the whole sample across Ge-spinel and Ge-olivine bits alike, and caused a major offset. The mere propagation of transformation-induced faulting in Ge-olivine inside stable Ge-spinel has strong implications in terms of deep seismicity, which are further discussed in a separate study [34].
In the present experiments, the deforming sample is surrounded by soft NaCl, used as a pressure medium, which allows the two blocks, once separated by the main fault, to slip relative to each other by rigid motion without internal deformation. This causes further damage along the fault plane, which is therefore difficult to fully recover for microstructural observations. However, in the case of G22, in several locations, damage related to rigid motion and the actual fault plane corresponding to dynamic (co-seismic) rupture propagation can undoubtedly be deciphered (Figure 12). The fault has very low tortuosity, indicative of fast rupture speed. Along its path, the fault presents several regions of submicronic euhedral grains. These features are present in the Ge-olivine and Ge-spinel parts of the sample alike. Close-up imaging of these features shows a decreasing grain size gradient from the inside out. These observations are a clear indication of fast static melt recrystallization along the fault plane (Figure 12e,f).

3.2.4. Low-Temperature Plasticity

Sample G42 was deformed at the lowest temperature in this study. It only shows seldom Ge-spinel grains despite a larger equilibrium overstep than for samples deformed at a higher temperature. This illustrates the control of temperature, rather than equilibrium overstep, on the reaction kinetics for the PT conditions investigated here. The mechanical data show some ductility (stress plateau) before eventual failure (Figure 4). Examination of the microstructures evidences that failure occurred by strain localization along two main faults (Figure 13). The first one (offset by the second one) consists of a cataclastic shear band of ~20–40 µm wide (Figure 13b). The intense shearing of Ge-pyroxene within these shear bands resembles that observed in the transformational faulting samples at a higher temperature. However, a close examination reveals the absence of Ge-spinel, as well as a breccia-type texture typical of cataclastic flow (Figure 13c). The second fault consists of a discrete and extremely straight plane. Ge-spinel is identified along the fault plane in several locations. Its distribution in v-shaped cracks at ~45° to the fault plane is a clear indication that it formed by the rapid crystallization of melt in mode-I cracks (a.k.a. injectites, Figure 13d,e). In places where the fault cut through both Ge-olivine and Ge-pyroxene grains, the recrystallized melt produced is a two-phase aggregate that unequivocally illustrates a quench texture, with small euhedral grains (Figure 13f,g). Although this is similar to what is observed in the fault of sample G22 (Figure 12e), here, grain size is smaller due to the lower bulk temperature that induces faster quench and hinders grain growth. In brief, this sample first deformed in a strong and ductile way before strain localized along with a cataclastic shear band. Unlike the transformational faulting samples described in the above, the propagation of this cataclastic shear band was only associated with a handful of AEs at most. Lastly, the sample faulted along a sharp fault, where frictional melting occurred. The lone large AE reported in Figure 4 shows that this faulting and associated melting correspond to a single event (i.e., the major stress drops towards the end of the experiment).

3.3. AE 1D Locations and Clustering

An analysis of arrival time differences shows that most AEs have Δtsp values of 3–5 µs, which confirms that they originate from the sample (Figure 14). For G15, most AEs were too small for s-wave arrival determination. However, the first group of AEs occurring at ~18% strain presents lower Δtsp and therefore seem to originate from the bottom end of the sample. The following AEs show a wider spread of Δtsp values that is consistent with the full length of the sample. Interestingly, a similar trend is observed in the other two experiments (G16 and G23) where larger AEs were recorded. Experiment G16 shows that small AEs also first appeared rather in the lower part of the sample before AEs of varying intensity started occurring throughout the entire sample. This trend is remarkably similar in G23 deformed at the same temperature but with lower strain rates. We note that, for these two latter experiments, the spread in Δtsp at higher strains is too large to be attributed to the sample length. This may be due either to actual cracks in the alumina parts above and below the sample or to the difficulty in accurately picking s-wave arrivals in the saturated waveforms of these large AEs. In any case, the trend depicted here describes the nucleation of cracks at the bottom end of the sample and their subsequent upward migration.
Experiment G15 displays several high coherency pairs of events that correspond to AEs at the beginning (from events #15-50) and at the end (#550-560) of the softening shown in the mechanical data (Figure 3). The result of the clustering operation is shown in Figure 15. The high coherencies yield two clusters. The first and largest cluster corresponds to the first AEs in Figure 14a that display similar Δtsp values (at a strain of ~0.2), which therefore implies that these events correlate both in time and space. Combined with our microstructural observations, this analysis reveals that these AEs likely correspond to the appearance of shear bands in the sample. Fewer but larger AEs were recorded for G16. These AEs display low coherency values, with only a few pair of events above the coherency threshold of 0.97 used for clustering. Consequently, no clusters are obtained for this experiment, which suggests that those events are mostly uncorrelated, as also suggested by the complex fault network observed in the recovered sample (Figure 9a).
Experiment G23 displays an intermediate case between the two previous ones. It presents a large number of both large and small AEs. High coherency values are evidenced at the beginning of the experiment, and coherency tends to decrease towards the end of the experiment as AEs become larger. Similar to G15, this yields a large cluster of small AEs that corresponds to low Δtsp values at the beginning of deformation, whereas the following larger events associated with successive stress drops in the sample are uncorrelated (Figure 16). Here again, this is an indication that the initial propagation of the main shear band at the bottom of the sample generates a cluster of small AEs, whereas subsequent deformation and dynamic failure occur via uncorrelated faulting events.

4. Discussion

4.1. Transformational Faulting as a Function of Strain-Rate and Reaction Kinetic

The strain-rate and temperature field investigated here encompasses mechanical behaviours that range from fully ductile to cataclastic. All samples deformed at temperatures <800 °C reached deviatoric stress levels exceeding the confining pressure. Although these conditions are not representative of the Earth, the comparison between the samples deformed at lower (~500–600 °C) and higher temperature (~700 °C), while transforming, yields remarkable differences. The former show more ductility and generate almost no AEs prior to and during failure, while the latter are more brittle and generate strong AEs when failing. In brief, samples in the 500–700 °C range become more brittle and generate more AEs with increasing temperature and decreasing strain rate. The combined effects of temperature on crystal plasticity and reaction kinetics govern the mechanical response of the samples. Reaction progress in the samples ranges from nearly inexistent to full. As previously described, the samples that are partly reacted behave in a brittle way due to the olivine–ringwoodite transformation, thus defining a transformational faulting window (Figure 17) [15,35].
The kinetics of a transformation are controlled by both the nucleation and growth rates of the newly formed phase. Nucleation rates are difficult to assess experimentally and poorly constrained for olivine–ringwoodite phase transformations. However, grain growth rates are well known [7]. They are a function of PT and the Gibbs free energy, ΔGr, and obey the following equation:
G = k 0 T e x p [ Δ H + P V * R T ] [ 1 e x p Δ G r R T ]
where k0 is a constant, ΔH is the activation energy, V* is the activation volume, of the reaction, P, T and R have their usual meanings [7]. The resulting growth rates for the germanate system in the PT space are shown in Figure 17, along with the deformation conditions of Mg2GeO4. In the present samples, the reaction is inhibited at the coldest temperatures (609 and 506 °C) despite a larger equilibrium overstep. This is a clear illustration of temperature—rather than Gibbs free energy—control over kinetics when far from equilibrium, which is predicted by the near-vertical isokinetic lines in Figure 17. As a result, Ge-spinel in those samples is only found where frictional heat provided enough energy to locally trigger the reaction. These samples are deformed mostly by cataclastic flow, which results in limited ductility and eventual failure. Such behaviour is expected here since, similar to silicate forsterite, far from the melting temperature, Tm (here at T/Tm ≤ 0.5), crystal plastic mechanisms are inhibited [32]. The differential stress measured, σ, rose above the Goetze criterion (i.e., σ > °P), which also predicts brittle failure.
The intermediate temperature range, where sluggish kinetics are observed, corresponds to the transformational faulting window, which is marked by an inverse brittle-ductile transition, when increasing strain rate or decreasing temperature [15]. This is evident when comparing the mechanical curves in Figure 4b,c. In the former, both samples were deformed at the same temperature. However, G16, deformed ~5 times faster, shows a stress plateau indicative of ductile behaviour, whereas G23 fails immediately after reaching peak stress. A similar observation can be made for the two curves shown in Figure 4c, where G42, deformed at lower temperatures and faster strain rates, shows some ductile behaviour, whereas G32 does not. This unusual brittle behaviour is related to the olivine–ringwoodite transformation, which triggers mechanical instabilities. Transformational faulting therefore only occurs under a favorable ratio between strain rate and reaction kinetics.
For given reaction kinetics, there exists a certain strain rate, below which reaction progress allows stress levels to remain low and the rock to flow in a ductile way. This is due to the combined effects of the negative volume change of the reaction accommodating strain, as well as fine-grained reaction products weakening the bulk [5,37,38]. It is the case at the highest temperature, where the softening observed reflects the weak strength of mylonitic shear bands that are deformed mostly by the diffusion creep of Ge-spinel grains. Conversely, above a certain strain rate value, instabilities related to the reaction do not have time to develop. The rock then behaves as if no reaction were taking place; it is strong and ductile, and deformation is dominated by cataclastic mechanisms. Transformational faulting corresponds to an intermediate scenario in which the regions of weak reaction products grow without fully weakening the bulk and eventually trigger dynamic instabilities. This explains why the transformational faulting window initially identified at ~900 °C by [15], is found here at only ~700 °C, with strain rates approximately 10 times lower (Figure 17).
The rheology of the germanate analogue is expected to be comparable to that of the silicate counterpart, as evidenced by the similar melting temperature of Ge-olivine [39]. At temperatures where transformational faulting is observed here, crystal plasticity remains inhibited, and the samples are strong. Indeed, although transformational faulting is not exclusive to the olivine–ringwoodite transformation, it may well be enabled by the notoriously limited crystal plasticity of olivine up to high temperatures [1,40,41]. Both crystal plastic mechanisms and reaction kinetics have Arrhenius-type dependencies with temperature. However, dislocation creep, the dominant regime at high stress, has higher activation energy (>300 kJ/mol) than olivine–ringwoodite kinetics, implying a stronger sensitivity to temperature [2,7,32,42,43,44]. Consequently, when reacting to ringwoodite, if the temperature is high enough, the strength of olivine is low thanks to efficient crystal plasticity and reaction rates are fast. However, towards lower temperatures, because of the activation energy difference mentioned above, one encounters a temperature field where reaction rates are still fast but crystal plasticity is inhibited. It is in such conditions, here at ~700 °C, that transformational faulting is observed. SEM images show that reaction products are too sparse to weaken the bulk, but can still grow and localize strain in self-localizing features.
As previously reported, AEs are an indication of transformational faulting [22,23]. They are an experimental analogue to deep focus earthquakes (DFEs) and a proof that transformational faulting can be seismogenic at high PT conditions. The scarcity of AEs at low temperature here, compared to their abundance at 703 °C, reflects the seismogenic nature of transformational faulting. The frequency–magnitude relation of these AEs was analyzed and reported elsewhere [34]. The b-values obtained (Table 1) show striking similarities with those of DFEs. In the same study, a detailed comparison with previous studies, where transformational faulting was investigated at faster strain rates and reaction kinetics, confirmed that transformational faulting occurs under constant strain rate–kinetic ratio in germanate and silicate olivines alike [15,21,22,45]. This approach allowed the extrapolation of the natural conditions under which DFEs occur (i.e., at much lower strain rates and temperatures). In the following, based on the analysis of the microstructures detailed above, we will focus on the physical mechanisms behind the mechanical instabilities that lead to transformational faulting and seismogenic failure.

4.2. Mechanisms behind Transformational Faulting

4.2.1. A Conceptual Model for Unstable Anti-Crack Propagation

Ge-spinel is found to be distributed in the samples in the form of elongated lenses that grew preferentially normal to principal stress, as previously described [15,16,21]. Their preferential growth direction is due to stress concentrations at their tips caused by the negative volume change of the transformation. The growth of these lenses is incoherent; as opposed to the martensitic lamellae replacement which is the predominant mechanism at higher pressure oversteps [36,46]. It has been proposed that these lenses accommodate local volumetric changes accompanying fault propagation, similar to mode 1 (i.e., dilatant) cracks during standard low-pressure faulting, but with opposite algebraic signs for far field stresses and local stress concentrations [16]. In that scenario, Ge-spinel lenses adjacent to the fault plane accommodate local compressive stresses, similar to tensile stresses in the case of standard brittle failure. However, this so-called anti-crack theory hypothesized that these lenses were composed of Ge-spinel fine-grained enough to allow superplasticity [47]. Here, EBSD data show that the lenses are single Ge-spinel crystal domains (Figure 10). In addition, Ge-spinel lenses are rather evenly distributed in the samples and do not seem particularly related to the shear bands and faults that cause the micro-seismic activity.
In the transformational faulting samples, macroscopic faults are consistently related to strain localization features from which they seem to initiate and where Ge-spinel is found in larger proportions. These narrow spear-shaped features localize deformation. The analysis of AE location and coherency presented above demonstrates that it is the growth of these shear bands that is seismogenic and thus a potential analogue to DFEs. The locally enhanced kinetics attest of a relation between transformation, mechanical weakening and AEs. Due to the volume change and the exothermic nature of the olivine–ringwoodite reaction, the development of these shear bands involves complex interplays between reaction progress, stress, and temperature. In fact, their mere shape suggests a self-localizing mechanism that results in an evolution towards sharper and narrower features. The increasingly large AEs recorded during each experiment indicate that their propagation accelerates, with ruptures able to propagate over increasingly large distances. This unstable growth is—at least partly—controlled by local stress field modifications induced by volume change. Indeed, according to Equation (4), above and below the shear band, as compaction occurs, hydrostatic stress, i.e., P, is relieved, which in turn locally decreases the equilibrium overstep (ΔGr), and therefore hinders growth and transformation kinetics [40]. In contrast, at the tip of the shear band, stress is enhanced, and kinetics are therefore accelerated, which further enhances stress, thus creating a positive feedback loop (Figure 18). Kinetics may also be locally increased or decreased due to the effects of stress (elastic strain) on ringwoodite nucleation rates [44,48,49]. Several studies have reported V* values close to or equal to zero [3,7,36]. Thus, the effects of local stress changes on growth rates according to Equation (4) are more likely a result of a modification of ΔGr than P. Since the curvature of the tip controls the stress concentration, the shape of the shear band, therefore, tends to become sharper as it grows (Figure 18). In addition, the in-plane growth of oblate spheroids undergoing volume reduction has been described before and was shown to concentrate not only compressive but also shear stress at their tips, thus favouring inclined growth, even for a nucleus initially oriented normal to principal stress [40].
We note that these transformation shear bands match the definition of anti-cracks since (1) they concentrate stress at their tips due to the compaction that their propagation induces and (2) as evidenced by the microscopy analysis, they induce weakening due to the fine-grained reaction products partly constituting them. This implies that, unlike the Ge-spinel lenses, these shear bands can reasonably be approximated as weak superplastic inclusions, as required by “anti-crack” theory [16].

4.2.2. The Role of Latent Heat Release

The feedback loop between stress concentration and preferential growth alone (represented by the vertical arrow in Figure 18) may explain the self-localizing nature of these anticrack-like shear bands. However, growth rates in the present PT conditions are controlled by temperature rather than equilibrium overstep (Figure 17). The growth of Ge-spinel is therefore strongly enhanced by latent heat release, which also promotes further reaction, thus favouring the feedback loop and the self-localizing propagation described above. The exothermic nature of the reaction has been described as key to transformational faulting before [1,41]. Indeed, the local rise in temperature due to the reaction results in a more dramatic kinetics increase at the tip of the shear band (Figure 18e).
To qualitatively illustrate the importance of latent heat release, the transformational faulting textures of sample G16 are compared to those of a quartz sample deformed in the coesite field at ~2.0 GPa, 650 °C and a strain rate, ε ˙ , of ~10−5 s−1 (Figure 19). Like the olivine–ringwoodite transformation, the quartz–coesite one induces a substantial volume reduction (8 and 7%, respectively), but unlike the olivine–ringwoodite transformation it has a modest specific latent heat, i.e., it has a lower Clapeyron slope [1]. Although the quartz sample was deformed under similar P-T- ε ˙ as the germanate samples that were subject to transformational faulting (with stress levels nearing the Goetze criterion), the sample remained ductile. This major behaviour difference may stem from a smaller equilibrium overstep that might induce slower kinetics, unable to trigger transformational instabilities.
However, the examination of the sample shows that several quartz–coesite reaction fronts developed, thus highlighting kinetics which, in the germanate system, proved to cause transformational faulting (Figure 19b). Transformation is enhanced in a pressure halo near the top alumina piston, as well as against the bottom alumina pedestal, which reflects the important stress levels the sample was subjected to when transforming. Several horizontal lenses of transformation suggest compaction band type structures with preferential in-plane propagation, but no sharp self-localizing structures at 45° as seen in the Ge-olivine samples (Figure 19d). Albeit crude, this comparison tends to confirm a long-held view that the exothermic nature of the reaction is key to the development the observed anti-crack shear zones leading to transformational faulting [1,15,41,50,51]. However, another explanation for the difference highlighted in Figure 19 between stable and unstable reaction front growth may reside in the strength contrast between the bulk and the reaction products. In the olivine–ringwoodite case, it is clear that a dramatic weakening accompanies the reaction, which favors stress concentrations at the edges of the reaction front. Although growing coesite regions are also expected to be significantly weaker than the bulk due to the fine-grained nature of the newly nucleated grains, it is possible that more rapid grain growth prevents coesite inclusions from remaining weak long enough to cause mechanical instabilities. This scenario is supported by the observation of coesite platelets and needles at reactions fronts that display a grain size comparable to that of the surrounding quartz (Figure 19e,f). Indeed, whether or not latent heat release is necessary for the feed-back loop described above, transformational faulting is only possible thanks to the weak nature of the inclusions formed by fine-grained reaction products. This implies that transformational faulting rather occurs in a temperature range where nucleation rates are high relative to growth rates.

4.3. High Temperature Ductile Transformation

At 834–843 °C, fully reacted mylonitic shear bands of several 100 s of microns wide developed. Although CPOs in the shear zones at high temperature are consistent with ringwoodite dislocation creep (Figure 8), their weakness is a strong indication of diffusion creep dominated deformation, which confirms that softening and strain localization are enabled by the grain size reduction accompanying the phase transition [31]. Temperature and grain size are two competing parameters in terms of strength. Higher temperature decreases viscosity regardless of the deformation regime, but it also favors grain growth, which in turn increases the viscosity of the rock by disabling diffusion creep flow. Studies have therefore suggested that the strength of the cold subducting slab in the transition zone may be lower than that of the warmer, coarse-grained, surrounding mantle [52]. The present results confirm that transformation induced strain localization, by way of grain size reduction, is a major mechanism in subducting slabs in the transition zone [4,5].
Although the high temperature samples remained ductile at the macroscopic level (Figure 4), in sample G15, deformed the fastest, a myriad of small AEs accompanied a mechanical softening. This suggests that the initial propagation of shear bands occurs by the same mechanism described above, with transformational faulting occurring at lower stresses and faults propagating over smaller distances. It is possible that in G43, deformed at lower strain rates, smaller AEs occurred under our detection limit. The fact that small AEs accompany the implementation of strain localizing shear zones in G15 indicate that the sample is nearly brittle at peak stress, at least at the microscopic scale. These AEs are therefore a high-pressure equivalent to brittle precursors to ductile deformation [53,54]. In a subducting slab in the transition zone, they constitute analogues to the small numerous DFEs occurring in the likely hotter, outer regions of the Tonga slab [14,20,55].

4.4. Implications for Seismic Versus Ductile Strain Localization in the Transition Zone

Subducting slabs are often differentiated on the basis of their thermal parameters, which invites us to view them as merely cold or warm [1,20,56]. However, one should keep in mind that, regardless of thermal parameter, all slabs in the transition zone present a large thermal gradient than can reach up to 1000 °C, thus resulting in a spectrum of rheological behaviours across the slab. In a fast-descending slab with high thermal parameter such as Tonga, i.e., in a “cold” slab, olivine remains metastable at higher temperatures than in a slower slab, which counterintuitively implies that the olivine–ringwoodite reaction takes place at higher temperatures. The present experiments show an indisputable increase of b-values (i.e., a larger proportion of small events) associated to transformational faulting towards higher temperatures and/or lower stresses. These results are therefore consistent with transformation-induced faulting accompanying extreme strain localization on the warmer edges of the MOW constituting the double seismic plane of the Tonga slab, and generating numerous small DFE [55]. This would therefore explain both the anomalously high seismic activity and high b-value (the highest worldwide) observed in Tonga for DFEs.
However, transformational faulting might only explain a fraction of DFEs, particularly in cases where the MOW has a limited thickness. In that case, it might serve as a nucleation mechanism for the largest earthquakes. Rocks on both sides of the strain localization layer where the transformation occurs present a stronger rheology; because of colder temperatures in the core of the unreacted slab and because of coarser grain size in the adjacent mantle [52]. This aspect is critical to reconcile the dimensions of MOWs with the likely greater dimensions of the largest DFEs [11,13,17]. Since higher strength implies possibly higher stress levels, transformational faulting events nucleated in the MOW according to the model described above may propagate outside the MOW by other mechanisms, such as shear heating instabilities [19]. In this regard, the observation of fault propagation through Ge-olivine and Ge-spinel alike in experiment G22 is paramount. It is a strong indication that DFEs, although initiated by transformational faulting, are not confined to the MOW but can propagate further in the adjacent ringwoodite mantle. The present results also suggest that fault propagation is possible in unreactive metastable olivine (Figure 13), which may be found in the cold core of fast-subducting slabs [57]. In both cases, fault propagation is associated with low tortuosity and frictional melting (Figure 12 and Figure 13). These observations are consistent with a dual mechanism where large events nucleated by transformational faulting propagate outside the MOW by shear instabilities, as proposed by seismology studies [19,20].
The initial transformational faulting model based on anti-crack theory involves irreversible transformation of metastable olivine to ringwoodite, which therefore precludes fault reactivation [15,16,21]. Seismologists have since debated whether DFEs can consistently be attributed to newly created fault networks or if DFE doublets and repeating DFEs rather attest of fault reactivation, which would therefore point to shear instabilities as a better candidate to explain the occurrence of DFEs [18,58]. The present faulting model (Figure 18) differs from the aforementioned classic transformational faulting model. In this case, incremental propagation of transformational instabilities results in the generation of repeating AEs (i.e., their Δtsp is the same within error and waveforms show high coherency), which is the result of cracks propagating over increasingly large distances due to increasingly large stress concentrations at the tip of the propagating shear band. If similar strain localization occurs in the subducting slab, this mechanism may explain observations of repeating DFEs as well as recent observations of foreshock activity for a large DFE [18,59,60,61].
Finally, the present model suggests that latent heat release is key to generate transformational instabilities because it results in a major kinetic increase at the tip of the instability. However, this only applies when far enough from equilibrium where kinetics are dominated by temperature, otherwise the temperature increase induced by the transformational latent heat slows down kinetics due to vanishing Gibbs free energy. The major implication of this is that transformational instabilities are only expected in slabs able to exceed a threshold equilibrium overstep in terms of olivine–ringwoodite transformations, which explains the duality between slabs producing numerous DFEs vs those producing none.

5. Conclusions

The present experiments consisted in deformation of metastable Ge-olivine samples in the ringwoodite field. A careful analysis of the micro-seismicity obtained, combined with detailed microscopic observations of the recovered samples, provided valuable insights into the mechanisms at play in the transition zone of the Earth’s mantle.
We confirmed that the olivine–ringwoodite transformation induces an important weakening if kinetics are fast enough. In that case, ductile strain localization occurs thanks to the preservation of fine-grained ringwoodite that deforms mostly by diffusion creep. If the growth of these shear zones occurs under sufficient stress, it is accompanied by numerous small AEs. These results suggest that the abundant deep seismicity in Tonga, mostly corresponds to transformational faulting events that occur at higher temperature than in any other subduction zone, due to the record-high thermal parameter of the slab. This is also consistent with the high b-value obtained at high temperature, as DFEs in Tonga present the highest b-value worldwide.
At lower temperature, transformational faulting lead to stronger seismicity. The microstructures revealed narrow spear-shaped shear bands that evidenced an obvious feedback between strain- and transformation-localization. The growth of these anticrack-like shear bands is self-sustained and unstable, which leads to eventual melt-assisted fault propagation. Faulting initiated in metastable olivine kept on propagating through adjacent ringwoodite samples. By analogy with the subducting slab, this observation validates the possibility that large DFEs (i.e., larger than the MOW) can result from initial transformational faulting instabilities extending in the stronger ringwoodite mantle. In addition, the low b-value associated with transformational faulting in these samples is consistent with what is observed in Nature, aside from the unique case of Tonga.
We revisited a former model regarding transformational faulting instabilities and demonstrated that their unstable growth is not only driven by the volume change but also by the latent heat release of the olivine–ringwoodite transformation. Additionally, we showed that, due to the incremental propagation of these mechanical instabilities, some of the AEs obtained share striking similarities with deep repeating earthquakes in Nature.

Author Contributions

Conceptualization, A.S. and J.G.; formal analysis, B.G., C.D., L.P. and J.G.; writing—original draft preparation, J.G.; investigation, A.M., A.S., C.D., D.D., J.G., L.P. and P.B.; writing—review and editing, A.M., A.S., B.G., C.D., D.D., L.P. and P.B. All authors have read and agreed to the published version of the manuscript.

Funding

This research was funded by the ERC grant REALISM (agreement #681346) and by the TelluS program of CNRS/INSU, via the grant MELODIES.

Data Availability Statement

Not applicable.

Acknowledgments

The authors benefitted from fruitful discussions with Harsha S. Bhat and Julien Fauconnier. We thank Claudio Madonna from ETH Zürich for sintering the starting material. We also thank two anonymous reviewers whose comments helped to improve the present manuscript.

Conflicts of Interest

The authors declare no conflict of interest.

References

  1. Kirby, S.H.; Stein, S.; Okal, E.A.; Rubie, D.C. Metastable mantle phase transformations and deep earthquakes in subducting oceanic lithosphere. Rev. Geophys. 1996, 34, 261–306. [Google Scholar] [CrossRef]
  2. Rubie, D.C. The olivine→Spinel transformation and the rheology of subducting lithosphere. Nature 1984, 308, 505–508. [Google Scholar] [CrossRef]
  3. Rubie, C.D.; Ross, C.R. Kinetics of the olivine-spinel transformation in subducting lithosphere—Experimental constraints and implications for deep slab processes. Phys. Earth Planet. Inter. 1994, 86, 223–241. [Google Scholar] [CrossRef]
  4. Ritterbex, S.; Carrez, P.; Cordier, P. Deformation across the mantle transition zone: A theoretical mineral physics view. Earth Planet. Sci. Lett. 2020, 547, 116438. [Google Scholar] [CrossRef]
  5. Mohiuddin, A.; Karato, S.-I.; Girard, J. Slab weakening during the olivine to ringwoodite transition in the mantle. Nat. Geosci. 2020, 13, 170–174. [Google Scholar] [CrossRef]
  6. Panasyuk, V.S.; Hager, B.H. A model of transformational superplasticity in the upper mantle. Geophys. J. Int. 1998, 133, 741–755. [Google Scholar] [CrossRef] [Green Version]
  7. Perrillat, J.P.; Chollet, M.; Durand, S.; van de Moortèle, B.; Chambat, F.; Mezouar, M.; Daniel, I. Kinetics of the olivine—Ringwoodite transformation and seismic attenuation in the Earth’s mantle transition zone. Earth Planet. Sci. Lett. 2016, 433, 360–369. [Google Scholar] [CrossRef]
  8. Mosenfelder, J.L.; Marton, F.C.; Ross, C.R., II; Kerschhofer, L.; Rubie, D.C. Experimental constraints on the depth of olivine metastability in subducting lithosphere. Phys. Earth Planet. Inter. 2001, 127, 165–180. [Google Scholar] [CrossRef]
  9. Du Frane, W.L.; Sharp, T.G.; Mosenfelder, J.L.; Leinenweber, K. Ringwoodite growth rates from olivine with similar to 75 ppmw H2O: Metastable olivine must be nearly anhydrous to exist in the mantle transition zone. Phys. Earth Planet. Inter. 2013, 219, 1–10. [Google Scholar] [CrossRef]
  10. Ishii, T.; Ohtani, E. Dry metastable olivine and slab deformation in a wet subducting slab. Nat. Geosci. 2021, 14, 526–530. [Google Scholar] [CrossRef]
  11. Shen, C.Z.; Zhan, Z.W. Metastable olivine wedge beneath the Japan sea imaged by seismic interferometry. Geophys. Res. Lett. 2020, 47, e2019GL085665. [Google Scholar] [CrossRef]
  12. Jiang, G.; Zhao, D.; Zhang, G. Detection of metastable olivine wedge in the western Pacific slab and its geodynamic implications. Phys. Earth Planet. Inter. 2015, 238, 1–7. [Google Scholar] [CrossRef]
  13. Kawakatsu, H.; Yoshioka, S. Metastable olivine wedge and deep dry cold slab beneath southwest Japan. Earth Planet. Sci. Lett. 2011, 303, 1–10. [Google Scholar] [CrossRef]
  14. Zhan, Z. Mechanisms and implications of deep earthquakes. Annu. Rev. Earth Planet. Sci. 2020, 48, 147–174. [Google Scholar] [CrossRef]
  15. Burnley, P.C.; Green, H.W.; Prior, D.J. Faulting associated with the olivine to spinel transformation in Mg2GeO4and its implications for deep-focus earthquakes. J. Geophys. Res. Earth Surf. 1991, 96, 425–443. [Google Scholar] [CrossRef]
  16. Green, W.H.; Burnley, P.C. A new self-organizing mechanism for deep-focus earthquakes. Nature 1989, 341, 733–737. [Google Scholar] [CrossRef]
  17. Wiens, A.D. Seismological constraints on the mechanism of deep earthquakes: Temperature dependence of deep earthquake source properties. Phys. Earth Planet. Inter. 2001, 127, 145–163. [Google Scholar] [CrossRef]
  18. Wiens, A.D.; Snider, N.O. Repeating deep earthquakes: Evidence for fault reactivation at great depth. Science 2001, 293, 1463–1466. [Google Scholar] [CrossRef] [Green Version]
  19. McGuire, J.J.; Wiens, D.A.; Shore, P.J.; Bevis, M.G. The March 9, 1994 (Mw7.6), deep Tonga earthquake: Rupture outside the seismically active slab. J. Geophys. Res. Earth Surf. 1997, 102, 15163–15182. [Google Scholar] [CrossRef]
  20. Zhan, Z. Gutenberg–Richter law for deep earthquakes revisited: A dual-mechanism hypothesis. Earth Planet. Sci. Lett. 2017, 461, 1–7. [Google Scholar] [CrossRef]
  21. Green, H.W.; Young, T.E.; Walker, D.; Scholz, C.H. Erratum: Anticrack-associated faulting at very high pressure in natural olivine. Nature 1991, 349, 264. [Google Scholar] [CrossRef] [Green Version]
  22. Schubnel, A.; Brunet, F.; Hilairet, N.; Gasc, J.; Wang, Y.; Green, H.W. Deep-Focus earthquake analogs recorded at high pressure and temperature in the laboratory. Science 2013, 341, 1377–1380. [Google Scholar] [CrossRef] [PubMed]
  23. Wang, Y.; Zhu, L.; Shi, F.; Schubnel, A.; Hilairet, N.; Yu, T.; Rivers, M.; Gasc, J.; Addad, A.; Deldicque, D.; et al. A laboratory nanoseismological study on deep-focus earthquake micromechanics. Sci. Adv. 2017, 3, e1601896. [Google Scholar] [CrossRef] [PubMed] [Green Version]
  24. Moarefvand, A.; Gasc, J.; Fauconnier, J.; Baïsset, M.; Burdette, E.; Labrousse, L.; Schubnel, A. A new generation Griggs apparatus with active acoustic monitoring. Tectonophysics 2021, 816, 229032. [Google Scholar] [CrossRef]
  25. Ross, L.N.; Navrotsky, A. The Mg2GeO4 olivine-spinel phase-transition. Phys. Chem. Miner. 1987, 14, 473–481. [Google Scholar] [CrossRef]
  26. Précigout, J.; Stünitz, H.; Pinquier, Y.; Champallier, R.; Schubnel, A. High-pressure, high-temperature deformation experiment using the new generation griggs-type apparatus. J. Vis. Exp. 2018, 134, e56841. [Google Scholar] [CrossRef] [Green Version]
  27. Dachille, F.; Roy, R. Spinel-olivine inversion in Mg2GeO4. Nature 1959, 183, 1257. [Google Scholar] [CrossRef]
  28. Weidner, J.D.; Hamaya, N. Elastic properties of the olivine and spinel polymorphs of Mg2GeO4, and evaluation of elastic analogs. Phys. Earth Planet. Inter. 1983, 33, 275–283. [Google Scholar] [CrossRef]
  29. Meredith, G.P.; Main, I.G.; Jones, C. Temporal variations in seismicity during quasi-static and dynamic rock failure. Tectonophysics 1990, 175, 249–268. [Google Scholar] [CrossRef]
  30. Bachmann, F.; Hielscher, R.; Schaeben, H. Texture analysis with MTEX—Free and open source software toolbox. Solid State Phenom. 2010, 160, 63–68. [Google Scholar]
  31. Ohuchi, T.; Fujino, K.; Kawazoe, T.; Irifune, T. Crystallographic preferred orientation of wadsleyite and ringwoodite: Effects of phase transformation and water on seismic anisotropy in the mantle transition zone. Earth Planet. Sci. Lett. 2014, 397, 133–144. [Google Scholar] [CrossRef]
  32. Gasc, J.; Demouchy, S.; Barou, F.; Koizumi, S.; Cordier, P. Creep mechanisms in the lithospheric mantle inferred from deformation of iron-free forsterite aggregates at 900–1200 °C. Tectonophysics 2019, 761, 16–30. [Google Scholar] [CrossRef]
  33. Ohuchi, T.; Nishihara, Y.; Seto, Y.; Kawazoe, T.; Nishi, M.; Maruyama, G.; Hashimoto, M.; Higo, Y.; Funakoshi, K.-I.; Suzuki, A.; et al. In Situ observation of crystallographic preferred orientation of deforming olivine at high pressure and high temperature. Phys. Earth Planet. Inter. 2015, 243, 1–21. [Google Scholar] [CrossRef]
  34. Gasc, J.; Daigre, C.; Moarefvand, A.; Deldicque, D.; Fauconnier, J.; Gardonio, B.; Madonna, C.; Burnley, P.C.; Schubnel, A. Deep-focus earthquakes: From high-temperature experiments to cold slabs. Geology 2022, in press. [Google Scholar] [CrossRef]
  35. Burnley, C.P.; Green, H.W. Stress dependence of the mechanism of the olivine spinel transformation. Nature 1989, 338, 753–756. [Google Scholar] [CrossRef]
  36. Burnley, P.C. The fate of olivine in subducting slabs; a reconnaissance study. Am. Miner. 1995, 80, 1293–1301. [Google Scholar] [CrossRef]
  37. Incel, S.; Labrousse, L.; Hilairet, N.; John, T.; Gasc, J.; Shi, F.; Wang, Y.; Andersen, T.B.; Renard, F.; Jamtveit, B.; et al. Reaction-induced embrittlement of the lower continental crust. Geology 2019, 47, 235–238. [Google Scholar] [CrossRef]
  38. Rutter, H.E.; Brodie, K.H. Experimental syntectonic dehydration of serpentinite under conditions of controlled pore water-pressure. J. Geophys. Res.-Solid Earth Planets 1988, 93, 4907–4932. [Google Scholar] [CrossRef]
  39. Miyamoto, Y.; Takubo, H.; Kume, S.; Koizumi, M. Melting of Mg2GeO4 under pressure. Bull. Volcanol. 1978, 41, 664–669. [Google Scholar] [CrossRef]
  40. Kirby, S.H. Localized polymorphic phase-transformations in high-pressure faults and applications to the physical-mechanism of deep earthquakes. J. Geophys. Res.-Solid Earth Planets 1987, 92, 13789–13800. [Google Scholar] [CrossRef]
  41. Green, W.H.; Zhou, Y. Transformation-induced faulting requires an exothermic reaction and explains the cessation of earthquakes at the base of the mantle transition zone. Tectonophysics 1996, 256, 39–56. [Google Scholar] [CrossRef]
  42. Faul, U.H.; Fitz Gerald, J.D.; Farla, R.J.M.; Ahlefeldt, R.; Jackson, I. Dislocation creep of fine-grained olivine. J. Geophys. Res.-Solid Earth 2011, 116. [Google Scholar] [CrossRef] [Green Version]
  43. Hirth, G.; Kohlstedt, D. The stress dependence of olivine creep rate: Implications for extrapolation of lab data and interpretation of recrystallized grain size. Earth Planet. Sci. Lett. 2015, 418, 20–26. [Google Scholar] [CrossRef]
  44. Kerschhofer, L.; Rubie, D.; Sharp, T.; McConnell, J.; Dupas-Bruzek, C. Kinetics of intracrystalline olivine—Ringwoodite transformation. Phys. Earth Planet. Inter. 2000, 121, 59–76. [Google Scholar] [CrossRef]
  45. Officer, T.; Secco, R.A. Detection of high P,T transformational faulting in Fe2SiO4 via In Situ acoustic emission: Relevance to deep-focus earthquakes. Phys. Earth Planet. Inter. 2020, 300, 106429. [Google Scholar] [CrossRef]
  46. Burnley, P.C. Investigation of the martensitic-like transformation from Mg2GeO4 olivine to its spinel structure polymorph. Am. Miner. 2005, 90, 1315–1324. [Google Scholar] [CrossRef]
  47. Green, H.W. Shearing instabilities accompanying high-pressure phase transformations and the mechanics of deep earthquakes. Proc. Natl. Acad. Sci. USA 2007, 104, 9133–9138. [Google Scholar] [CrossRef] [Green Version]
  48. Kerschhofer, L.; Dupas, C.; Liu, M.; Sharp, T.G.; Durham, W.B.; Rubie, D.C. Polymorphic transformations between olivine, wadsleyite and ringwoodite: Mechanisms of intracrystalline nucleation and the role of elastic strain. Miner. Mag. 1998, 62, 617–638. [Google Scholar] [CrossRef]
  49. Liu, M.; Kerschhofer, L.; Mosenfelder, J.L.; Rubie, D.C. The effect of strain energy on growth rates during the olivine-spinel transformation and implications for olivine metastability in subducting slabs. J. Geophys. Res. Earth Surf. 1998, 103, 23897–23909. [Google Scholar] [CrossRef]
  50. Kirby, H.S.; Durham, W.B.; Stern, L.A. Mantle phase-changes and deep-earthquake faulting in subducting lithosphere. Science 1991, 252, 216–225. [Google Scholar] [CrossRef] [Green Version]
  51. Green, W.H.; Houston, H. The mechanics of deep earthquakes. Annu. Rev. Earth Planet. Sci. 1995, 23, 169–213. [Google Scholar] [CrossRef]
  52. Yamazaki, D.; Inoue, T.; Okamoto, M.; Irifune, T. Grain growth kinetics of ringwoodite and its implication for rheology of the subducting slab. Earth Planet. Sci. Lett. 2005, 236, 871–881. [Google Scholar] [CrossRef]
  53. Leydier, T.; Goncalves, P.; Lanari, P.; Oliot, E. On the petrology of brittle precursors of shear zones—An expression of concomitant brittle deformation and fluid-rock interactions in the ‘ductile’ continental crust? J. Metamorph. Geol. 2019, 37, 1129–1149. [Google Scholar] [CrossRef]
  54. Menegon, L.; Pennacchioni, G.; Malaspina, N.; Harris, K.; Wood, E. Earthquakes as precursors of ductile shear zones in the dry and strong lower crust. Geochem. Geophys. Geosystems 2017, 18, 4356–4374. [Google Scholar] [CrossRef] [Green Version]
  55. Wiens, D.A.; McGuire, J.J.; Shore, P.J. Evidence for transformational faulting from a deep double seismic zone in Tonga. Nature 1993, 364, 790–793. [Google Scholar] [CrossRef]
  56. Wiens, A.D.; Gilbert, H.J. Effect of slab temperature on deep-earthquake aftershock productivity and magnitude-frequency relations. Nature 1996, 384, 153–156. [Google Scholar] [CrossRef]
  57. Yoshioka, S.; Torii, Y.; Riedel, M.R. Impact of phase change kinetics on the Mariana slab within the framework of 2-D mantle convection. Phys. Earth Planet. Inter. 2015, 240, 70–81. [Google Scholar] [CrossRef] [Green Version]
  58. Warren, L.M.; Hughes, A.N.; Silver, P.G. Earthquake mechanics and deformation in the Tonga-Kermadec subduction zone from fault plane orientations of intermediate- and deep-focus earthquakes. J. Geophys. Res. Earth Surf. 2007, 112. [Google Scholar] [CrossRef] [Green Version]
  59. Yu, C.W.; Wen, L.X. Deep-focus repeating earthquakes in the Tonga-Fiji subduction zone. Bull. Seismol. Soc. Am. 2012, 102, 1829–1849. [Google Scholar] [CrossRef]
  60. Myhill, R.; McKenzie, D.; Priestley, K. The distribution of earthquake multiplets beneath the southwest Pacific. Earth Planet. Sci. Lett. 2010, 301, 87–97. [Google Scholar] [CrossRef]
  61. Gardonio, B.; Schubnel, A.; Das, S.; Lyon-Caen, H.; Marsan, D.; Bouchon, M.; Kato, A. The preseismic and postseismic phases of the similar to 700 km deep M(w)7.9 Bonin Islands earthquake, Japan. Geophys. Res. Lett. 2020, 47. [Google Scholar] [CrossRef]
Figure 1. Electron Back-Scatter Diffraction (EBSD) data of the HIP sample used as starting material for deformation experiments. (a) Phase mapping reveals an equilibrium texture with low porosity (white pixels are unindexed pixels due to poor diffraction quality). Grain boundaries are drawn with black lines. The sample is constituted of about 6 vol% of MgGeO3 pyroxene. (b) Crystal orientations color-coded according to the inverse pole figure given in the inset. Ge-olivine grains have an average grain size of 37.6 µm. They are tabular and show no visible internal deformation as evidenced by their uniform colors reflecting uniform orientations. (c) Pole figures with densities of axis obtained with one point per Ge-olivine grain. Colors represent multiples of average concentration. A slight CPO, with a low J-index of J = 1.038 is identified. It is characterized by a concentration of c-axis along the length of the cylindrical HIP sample (see Section 2.1 for details). Ng and d stand for number of grains and average grain size, respectively.
Minerals 12 00719 g001
Figure 2. Example of coherency computation for two pairs of AEs (red-blue on the left; red-green on the right). Green boxes represent the time interval used to calculate coherency. The pair on the left shows highly similar waveforms while the pair on the right shows dissimilar AEs. The coherency value is given both for P and S waves on the top.
Minerals 12 00719 g002
Figure 3. Coherency matrix for AEs of experiments G15. Coherency values are given by the color scale.
Minerals 12 00719 g003
Figure 4. Evolution of differential stress with sample strain. The associated cumulative RMS values for AEs are given with the light-coloured curves. Horizontal axis is the same on all panels. Thicker curves correspond to faster strain rates (Table 1). (a) High-temperature experiments. No AEs were collected during G43. (b) Intermediate temperature experiments. Dashed lines represent experiment G22, where a smaller Ge-olivine sample was used, sandwiched between two Ge-spinel samples. (c) Low-temperature experiments.
Minerals 12 00719 g004
Figure 5. Effect of temperature on acoustic energy productivity. Lines show the stress-strain curves of some of the experiments presented in Figure 4. To evidence the effects of temperature, one curve for each temperature investigated is presented. Bars represent the cumulative RMS of AEs for each 1% increment of sample strain.
Minerals 12 00719 g005
Figure 6. SEM images of sample G43 (834 °C). Compression direction is vertical on all images. (a) Image of the entire sample. The gold capsule is visible on the sides. The brighter phase corresponds to Ge-pyroxene; the gray bulk of the sample corresponds mostly to Ge-spinel along some residual Ge-olivine grains. Several shear bands are observed; the two largest ones are highlighted by the dashed lines. (b,c) High magnification images in an undeformed part of the sample, where relict Ge-olivine is found (dark gray arrowheads). Rounded Ge-pyroxene grains evidence negligible deformation (white arrowheads). Ge-spinel grew as lenses, mostly oriented normal to the principal stress direction (light gray arrowheads). (d) Detailed view on a shear zone according to the rectangle in (a). Elongation of Ge-pyroxene grains reveals strain localization along shear bands that are a few tens of microns to hundreds of microns wide. (e) High magnification image of the shear band show in (d). Ge-olivine is fully reacted to Ge-spinel. The shear band is extremely fine-grained with equiaxed grains of both Ge-pyroxene and Ge-spinel. Some phase mixing occurred, as attested by the spotty nature of the Ge-spinel at the center of the shear band.
Minerals 12 00719 g006
Figure 7. Microscopy images of sample G15 (843 °C). Compression direction is vertical on all images. (A) Optical image showing the entire sample. The alumina piston used for axial shortening is visible at the top of the image. The down pointing arrow indicates the motion of the piston during deformation. (B,C) SEM images of in backscatter electron mode of the principal shear zone according to the white squares in (A). Black wavy cracks correspond to brittle damage caused by decompression, which locates preferentially in the deformed regions. (B) Ge-pyroxene, which appears brighter, is present in the form of recrystallized fine-grained layers that evidence the shearing direction. (C) The initial undeformed texture is mostly preserved in the bottom of this image and contrasts with the dramatic pyroxene stretching in the shear band in the center of the image. (D) Close-up view according to the rectangle in (C). At this scale, sub-micron Ge-pyroxene grains are visible and evidence that grain elongation occurs via substantial dynamic recrystallization.
Minerals 12 00719 g007
Figure 8. EBSD maps of shear bands on sample G15. (a) Shows a phase map with grain boundaries in black. (b,c) show corresponding pole figures for Ge-spinel and Ge-pyroxene, respectively. Number of grains used, Ng, average grain size, d, and the J index (i.e., texture strength) are given above. (d) Phase map with grain boundaries in black. The black rectangle, in the core of the shear zone, shows the area used for pole figure analysis. (e) Pole figures of Ge-spinel.
Minerals 12 00719 g008
Figure 9. Images of samples deformed at 703 °C. (ac) optical microscope images of samples G16, G22 and G23, respectively. White rectangles in (a,c) are the locations of the EBSD maps presented in Figure 11. (di) SEM images in BSE mode of the same samples according to the rectangles labelled in (ac). Half-headed arrows indicate shearing kinematics. (d) Shearing of Ge-pyroxene grains (brighter color) in the center of the image reveals that the narrow Ge-spinel-rich regions seen in (a) correspond to faults (black arrowheads). (e) Shows a magnified view according to the rectangle in (d). The fault gouge is ~40 µm wide (contoured by the dashed lines) and contains a larger proportion of Ge-spinel than the adjacent undeformed areas. (f) High magnification view of a fault in sample G22 (dashed lines). Inside the fault, Ge-spinel is more abundant and presents a smaller grain size. Outside the fault, Ge-spinel is found evenly distributed in the form of small horizontal lenses (arrowheads). (g) High magnification view of the tip of a propagating shear band (incipient fault) in the same sample. Inside the fault, delimited by the dashed lines, Ge-spinel grows mostly at Ge-olivine grain boundaries, insensitive to principal stress and in contrast with the lenses it forms in the bulk of the sample (arrowheads). (h) The main fault of sample G23 is visible thanks to shearing of Ge-pyroxene grains and higher Ge-spinel content resulting in a slightly brighter shade (arrowheads). (i) Close up view of the same fault. Reaction extent is larger due to longer experiment duration but the same microstructure contrast appears between the fault gouge and the bulk of the sample. Inside the fault, rounded Ge-olivine relict grains evidence isotropic transformation (dark gray arrowheads), whereas Ge-spinel growth occurs mostly normal to principal stress in the bulk of the sample (light gray arrowheads).
Minerals 12 00719 g009
Figure 10. EBSD map of sample G23. (a) Phase map with calculated grain boundaries in black. Non-indexed pixels at the center correspond to the main fault of the sample. Large amounts of reaction (i.e., Ge-spinel) are identified near the fault. (b) Band contrast of the same map, i.e., brighter shades indicate lower diffraction strength. The fault corresponds to a region of very weak band contrast due to extreme grain size reduction and large defect concentrations. (c) Map showing the orientation of indexed pixels according to the inverse pole figure color scale on the right. Ge-olivine grains appear slightly deformed and, in some cases, present kink bands (green arrows). Ge-spinel grains are smaller but those that grew present high internal strain (blue arrows). The Ge-olivine grain highlighted by the thick black lines and the small Ge-spinel lenses it contains are magnified in (d). (d) Ge-olivine and Ge-spinel grain boundaries are plotted in green and blue, respectively. This map reveals that Ge-spinel lenses are single crystallographic domains (blue arrows).
Minerals 12 00719 g010
Figure 11. EBSD data collected on samples G16 (a,b) and G23 (c,d). (a,c) show phase maps and calculated grain boundaries (black contours). (b,d) show corresponding pole figures for (a,c), respectively. Number of grains used, Ng, average grain size, d, and J indexes are given on top. Pole figures are only shown for Ge-spinel in (d), as Ge-olivine did not present any identifiable CPO, likely due to a lower number of grains than in (c).
Minerals 12 00719 g011
Figure 12. SEM images of the main fault in G22. (a) Shows an overview of the entire fault obtained by stitching multiple SEM images. (b) Shows the same image as in (a) with the main fault highlighted with the orange curve. The red lines correspond to the main mode 1 cracks that opened subsequently along the fault plane. The half-headed arrows indicate the relative motion on both sides of the fault. The blue regions correspond to the Ge-spinel bits that sandwiched the Ge-olivine sample from the beginning of the experiment. (c,d) correspond to the rectangles located at the center and on the right side of the image in (b), and therefore illustrate the microstructure of the fault in Ge-olivine and Ge-spinel, respectively. (e,f) are higher magnification images according to the rectangles in (c,d), respectively. These two images reveal the presence of recrystallized melt in both parts of the sample.
Minerals 12 00719 g012
Figure 13. Optical and SEM images of sample G42. Compression direction is vertical on all images. (a) Optical image of the whole sample. The main faults are shown with the dashed lines. Slip direction is given by the half-headed arrows. (bg) SEM images according to the rectangles labelled in (a,b,f). (b) Shows the first shear zone. Starting material texture is preserved on both sides and contrasts with the intense shearing of Ge-pyroxene within the shear band. (c) Close-up view according to the rectangle in (b). A breccia texture with heterogeneous grain size can be seen within the shear band. (d,e) are magnified views of the second fault that reveal a thin planar feature mostly filled with Ge-spinel. This latter phase is found in spearhead shapes that strongly resemble natural pseudotachylites. (f) Another location of the same fault where a Ge-pyroxene grain visible at the bottom of the image was sheared by the fault in a spectacular way, leaving a trail behind due to mixing with Ge-olivine. (g) Magnified view of the sheared Ge-pyroxene grain shown in (f) revealing a two-phase texture with rounded grains <100 nm in diameter.
Minerals 12 00719 g013
Figure 14. P- and s-wave arrival time differences of AEs and stress-strain curves for experiments G15 (a), G16, (b) and G23 (c). AEs are visualized here using signal–noise ratio, which is a proxy for their radiated energy. Stress-strain curves are the same as those introduced in Figure 4.
Minerals 12 00719 g014
Figure 15. Results from AE clustering for experiment G15. (a) Shows the evolution of differential stress and cumulative number of AEs. (b) Shows the occurrence of AEs and their RMS values. (c) Shows the same plot where only clustered AEs are displayed and their assignment to a particular cluster is colour-coded. Note that only the two largest clusters are given in the inset legend.
Minerals 12 00719 g015
Figure 16. Results from AE clustering for experiment G23. (a) Shows the evolution of differential stress and cumulative number of AEs. (b) Shows the occurrence of AEs and their Root Mean Square values. (c) Shows only clustered AEs.
Minerals 12 00719 g016
Figure 17. PT conditions of the present study (circles) and those of [15,22] (stars and diamonds, respectively). Open symbols indicate ductile behaviour, even if limited. Full symbols indicate brittle failure. The dashed lines indicate the transformational faulting temperature window identified by previous studies and the present one, at lower temperature and strain rates. The colour-coded grain growth rates are from [36], using thermodynamic data of [25] for free enthalpy of reaction calculation.
Minerals 12 00719 g017
Figure 18. Schematic growth of an anti-crack type shear band. (ad) represent successive stages of growth. Principal stress is vertical. The blue and green region in the left bottom corner represents the partly reacted shear band, with the direction of shear depicted by the half-headed arrows. Lines in yellow to red colors depict increasingly high stress levels. Gray lines illustrate a fault that propagates over increasingly long distances as the shear band grows. (e) qualitatively depicts effects of local stress change at the tip of the shear band according to Equation (4). The vertical arrow represents an increase in growth rate due to a mere stress concentration. The diagonal arrow shows that a much larger growth rate increase may be obtained when considering latent heat release due to local temperature rise.
Minerals 12 00719 g018
Figure 19. Microscopy images on cross sections of sample G16 (a,b) and a recovered quartz sample partly transformed to coesite (cf) comparing modes of reaction front propagation. (a) Optical image, already presented in Figure 9, showing the entire sample. Ge-spinel appears darker. (b) Same image where the main ringwoodite-rich regions have been highlighted in blue. The narrower oblique ones correspond to shear bands and faults. Arrows schematize the fast in-plane growth of these features, relative to the sluggish plane-normal growth. (c) Quartz sample in its Au capsule, seen in optical microscopy. (d) Darker, coesite-rich, regions have been highlighted in blue. Arrows on the top reaction front show a rather isotropic growth controlled by local overpressure near the alumina piston. Arrows on the smaller coesite lens indicate preferential growth normal to principal stress. (e,f) Are SEM images according to the rectangles in (c) showing the replacement of quartz by coesite platelets and needles (brighter phase).
Minerals 12 00719 g019
Table 1. Experimental conditions and results. Error on temperature is estimated to be ±6.8% [24]. Standard deviation on obtained b-values is given between parentheses.
Experiment #T (°C)Duration (s)Final Volume Fraction of Ge-SpinelPeak Stress (GPa)Strain Rate at Peak Stress (× 10–5 s–1)Mechanical BehaviourNumber of AEsAEs Cumulated RMS (V)b-Value
G1584313,8440.81.292.79Ductile5861.121.5 (0.070)
G4383454,9530.951.310.495Ductile00-
G1670395920.22.152.69Faulting1474.550.52 (0.042)
G2270362300.052.234.31Faulting642.000.77 (0.095)
G2370357,4620.22.430.602Faulting6331.010.62 (0.024)
G3260925,4490.12.370.998Faulting321.331.1 (0.18)
G4250677770.012.193.54Faulting70.33-
Publisher’s Note: MDPI stays neutral with regard to jurisdictional claims in published maps and institutional affiliations.

