
Stability Evaluation and Structural Parameters Optimization of Stope Based on Area Bearing Theory

Zijin School of Geology and Mining, Fuzhou University, Fuzhou 350108, China
*
Author to whom correspondence should be addressed.
Minerals 2022, 12(7), 808; https://doi.org/10.3390/min12070808
Submission received: 27 April 2022
/
Revised: 17 June 2022
/
Accepted: 21 June 2022
/
Published: 25 June 2022
(This article belongs to the Topic Mining Safety and Sustainability)
Abstract
:A reasonable and stable stope structure is the premise of realizing safe mining of underground metal ore. To safely mine the gently inclined medium-thick ore body, stope stability in Bainiuchang Mine was analyzed based on the pillar area bearing theory, and stope stability with regard to nine groups of structural parameters was numerically simulated. The results show that the existing stope structural parameters failed to maintain stability requirements and tended to be exposed to the risk of stope collapse. The middle section of the pillar as well as stope roofs and floors are vulnerable due to tensile stress when mining by open stoping, and the compressive stress concentration is prone to occur at the junction of the pillars, stope side walls, roofs and floors. Shear stress contributes little to pillar failure. The reasonable stope structural parameters of open stoping for the gently inclined medium-thick ore body in Bainiuchang mine are optimized using ANSYS numerical simulation: stope height 4.5 m, pillar diameter 4 m, pillar spacing 7 m and pillar row spacing 8 m. The onsite trial shows that the ore recovery rate reaches 82% under these parameters, which also realizes the equilibrium of safety and economy.
1. Introduction
Gently inclined medium-thick ore body is one of the most widely distributed types of underground metal deposits worldwide. The inclination angle of this type of ore body is mostly 5~30°, which is not conducive to the normal operation of trackless mining equipment such as intelligent scrapers, nor to ore-drawing under gravity of blasted ore in the stope. It is internationally recognized as the most difficult type of ore body to mine [1,2,3]. Open stoping is commonly used in the world to mine gently inclined medium-thick ore bodies [4], and its mining structural parameters are the most important indicators for balancing safe, economic and efficient recovery. If pillars are too thin to resist ground pressure, it usually leads to safety accidents; in contrast, it will cause ore loss and reduce ore recovery rate and production profit. Structural parameters are the most influential factors for maintaining stope stability with open stoping. In 1973, Bieniawski proposed the RMR (Rock Mass Rating) rock mass classification method to evaluate the stability of various rock masses [5]. Bazaluk et al. [6] studied the stope stability of underground mining of iron ore by taking yuzhno-belozerskyi deposit as the research object. Wu et al. [7] used ANSYS and Flac3D to analyze the influence of mine room and pillar configuration on stope stability in highly fractured areas and preferred the stope structure configuration scheme based on the objective function and constraint function. Mikaeil et al. [8] used Flac2D to calculate the load cases such as axial forces, bending moments and shear forces in the vault, bottom and side walls of the underground roadway and analyzed the stability characteristics of the roadway support. Zhao et al. [9] used Flac3D to simulate the stope structure and design the safest stope exposure size based on the Mathews stability graphical solution method. Qin et al. [10] analyzed the stability characteristics of ore pillars with different thicknesses by numerical simulation in an iron mine, which provided a reference for the optimization of structural parameters. Lan et al. [11] constructed a second-order response surface model and realized the comprehensive optimization of the stope structural parameters through multi-objective optimization and multi-attribute decision making. Liu et al. [12] used Flac3D to establish a numerical calculation model of the fractured ore body and studied the relationship between the stope span parameters, roof displacement and plastic zone volume. However, the aforementioned studies were based on safety and technology for optimization, and less consideration was given to the best economic efficiency during mine recovery.
Bainiuchang Mine has a typical gently inclined medium-thick ore body, which is mainly mined using the room and pillar method. The width of ore block is generally 20~25 m, the length is 30~40 m, and a circular pillar with a side length of 2~4 m is reserved. With the increasing mining depth, the ground pressure management is becoming more and more complicated, and there is a serious risk of collapse. It is urgent to optimize the original stope structural parameters. Based on the area-bearing theory, the mining process before optimization of the Bainiuchang Mine was simulated through ANSYS, and the stope stability was evaluated through stress analysis. Nine different stope structural parameters optimization schemes were proposed through orthogonal design, and the stress conditions of pillar, roof and floor were analyzed based on numerical simulation, and safe and economic stope structural parameters were further optimized, so as to guide the mining of gently inclined medium-thick ore body.
2. Area Bearing Theory
The area-bearing theory holds that the load on the pillar is the gravity of the overlying rock layer from the mining space it supports to the surface, and the area supported by the pillar is the sum of the mining area and the cross-sectional area of the pillar itself, from which the axial compressive stress of the pillar is approximated. It reveals the internal causes of pillar instability and failure (as shown in Figure 1 and Figure 2). Its equilibrium equation is as follows Equation (1).
where is the axial compressive stress of the mine pillar; is the vertical positive stress component of the ground stress field before mining; is the width of the mine room; is the width of the mine pillar.
The strip mine pillar and circular mine pillar are mainly arranged in Bainiuchang Mine. The calculation Equations (2) and (3) for the axial compressive stress of the two types of ore pillars can be derived from Equation (1).
where is the capacity of the overlying rock layer; is the mining depth [13,14].
Based on the area bearing theory, the axial compressive stress of the ore pillar can be calculated. According to the area bearing theory, each pillar supports the ore rock in a certain area. The axial compressive stress of the ore pillar can be calculated by the gravity of the upper ore rock and the sectional area of the ore pillar. When the axial compressive stress exceeds the uniaxial compressive strength of the ore rock, the ore pillar will be crushed, resulting in fragmentation, deformation and even collapse. Then, cause the collapse of the stope roof. When the number of collapsed pillars reaches a certain amount, it will produce a chain effect, leading to the collapse of other pillars, and finally the overall collapse of the mine room. otherwise, it can be safely mined.
Combined with the area bearing theory (Equation (3)) and the Bieniawski pillar strength formula (Equation (4)), the safety factor calculation formula (Equation (5)) of the circular point pillar in Bainiuchang mine can be derived.
where is strength of ore pillar, MPa; is strength parameter of ore and rock, MPa; is the room height, m; is the width of the mine pillar.
where is the safety factor of circular point column. Other physical quantities are described above.
3. Stope Stability Evaluation
The existing stope stability of Bainiuchang mine is evaluated. The geological structure of the mining area is well developed, and the weathering is strong. The hydrogeological conditions of the deposit are complex, with strong karst aquifers filling with water. The roof of the ore body is a carbonate rock mixed with clastic rock karst fissure aquifer, and the inflow is 0.0025~1.52 L·s−1; The floor of the ore body is a karst fissure aquifer of clastic rock mixed with carbonate rock, and the inflow is 0.0109~2.69 L·s−1. The ore body is stratiform and lenticular in shape, with siltstone and mudstone on the roof and argillaceous limestone on the floor. The surrounding rock mass of the upper and lower walls of the ore body is of good quality, and the engineering geological conditions are simple. The physical and mechanical parameters of the main ore rocks of the Bainiuchang mine are shown in Table 1. In Table 1, σc represents uniaxial compressive strength, σt represents uniaxial tensile strength, τ represents shear strength, c represents cohesion, φ represents internal friction angle, E represents elastic modulus, ρ represents density, and μ represents Poisson’s ratio. The pillar of Bainiuchang mine are shown in Figure 3.
The structural geology of site: The fault structures in the mining area are developed, mainly NW trending faults, with NE trending faults interspersed between them, forming a structural framework. F2, F3, F6, F7 and F8 in the northwest direction are mainly exposed in the mining area. F2 fault strike NW-SE, dip direction SW, dip of 65°. F3 fault is the most important ore controlling and hosting structure in Bainiuchang mine, with a total length of 5000~6000 m, strike NW-SE, dip direction of 200~230° to SW, and dip of 20~35°. F6 fault is about 1.7 km, strike NW-SE, dip direction SW, dip of 30~35°. F7 fault is about 3.5 km, strike NW-SE, dip direction SW, dip of 34~50°. F8 fault is about 3.4 km, strike NW-SE, dip direction SW, dip of 60~75°.
3.1. Simulation Conditions and Process
The onsite mining process of Bainiuchang mine (as shown in Figure 4): Strip rooms and strip pillars are arranged in intervals. Strip rooms are mined first. After strip rooms are mined, the strip pillars are mined, leaving round point pillars with a diameter of 3 m. The stope height is 3 m, stope length is 40 m and the width is 25 m. Next, a multi-step excavation finite element calculation model will be established according to the actual mining process by ANSYS 19.2.
Modeling: The finite element model is established according to the onsite geological conditions, and the mechanical model is established according to the influence range of 3~5 times the diameter of the excavation space. In order to balance the calculation speed and accuracy, a 500 m × 500 m × 625 m model is established (Figure 5). On the basis of not affecting the calculation results and considering the size coordination relationship of the model, the depth is taken to 1380 m above sea level. The model contains the ore body, and then contains the target ore block of numerical simulation calculation.
Mesh refinement analysis: If the mesh is sparse, the accuracy of calculation cannot meet the requirements. The finer the mesh, the higher the accuracy of calculation, but the amount of calculation will increase exponentially. In order to balance the calculation accuracy and efficiency, considering the regularity of the element, we established a material model based on the key points by using ANSYS. This work is according to the geological structure model and the distribution changes of the physical property parameters of each layer in the mining area. Using the tetrahedron (SOLID92) 10 node element type, we divided the finite element mesh of each volume element. The whole mesh was divided into 57,611 elements and 79,159 nodes (Figure 6).
Initial stress conditions: Calculated the distribution of in situ stress according to gravity, as shown in Figure 7.
Boundary condition: The outer four sides of the model are fixed along the x-axis and y-axis, respectively, and the bottom of the model is fixed along the z-axis as the boundary condition.
Multi-step excavation numerical simulation process: the internal loading model that releases the load along the excavation perimeter is used. In the first step, the inversion of original rock stress is revealed according to the boundary conditions and the load conditions (dead weight stress field). In order to get close to the actual results, the second step is to carry out multi-step excavation simulation calculation according to the onsite mining process of Bainiuchang mine.
Constitutive model: Three-dimensional elastic-plastic finite element calculation and analysis of the multi-step excavation was carried out using the Drucker–Prager plastic yielding criterion commonly used in geotechnical engineering [15,16]. This criterion is shown in Equation (6).
where: is the first invariant of stress; is the second invariant of stress deflection; , are experimental constants related to the internal friction angle and cohesion of rock; is the internal friction angle of rock; is the cohesion of rock; , , is the maximum, intermediate and minimum principal stress, respectively.
3.2. Simulation Results
Numerical simulations were performed according to the onsite mining process, and the numerical results of the maximum, intermediate and minimum principal stresses σ1, σ2, σ3 and three axial shear stresses within the stope and pillars can be obtained (Table 2). The main stress distribution cloud images are shown in Figure 8, Figure 9, Figure 10, Figure 11, Figure 12 and Figure 13.
According to the area bearing theory, when the current stope structural parameters are adopted, the axial compressive stress borne by the ore pillar is 135.5 MPa, which exceeds the uniaxial compressive strength of the ore rock (97.62 MPa). At the same time, the simulation results show that compressive and tensile stresses exist simultaneously during the mining process. Compared with that before mining, all stresses have increased by tens of times. The compressive stresses mainly exist in the junction part of the pillars, stope side walls, roofs and floors, while the tensile stresses mainly exist in stope side walls, roofs and floors. With the expansion of mining areas, the tensile stresses in the stope side walls and the roofs and floors gradually increase, and the compressive stresses in the ore pillars are also gradually concentrated, with the maximum compressive stress of 142.0 MPa in the pillar. This is much greater than the uniaxial compressive strength of the ore (97.62 MPa). The field observation also shows that under the existing stope structural parameters, the plastic yielding phenomenon of the ore pillars become more and more obvious as mining proceeds; after the end of the whole stope mining, all the pillars show yielding and the stope stability is poor. If the deep ore body continue to be mined according to the existing stope structural parameters, the risk of collapse is extremely high and safe and stable recovery cannot be guaranteed.
4. Optimization of Stope Structural Parameters
The stope height in Bainiuchang Mine is generally between 2.5 and 4.5 m. Therefore, the optimization of stope structural parameters was conducted for the three stope heights of 2.5 m, 3.5 m and 4.5 m. The nine optimization schemes after conducting orthogonal design are shown in Table 3. The finite element calculation continues the method in Section 3.1, and the ore pillar arrangement is shown in Figure 14.
4.1. Stope Height 2.5 m
The calculation results of schemes 1–3 are shown in Table 4, and the main stress distribution cloud images are shown in Figure 15, Figure 16, Figure 17, Figure 18, Figure 19, Figure 20, Figure 21 and Figure 22. The results show that the maximum shear stress in the stope under the three schemes (36.3 MPa, 27.9 MPa, 28.0 MPa) does not exceed the shear strength of the ore rock (50.86 MPa). The tensile stresses mainly appear in the middle of the pillar, stope roof and floor, and the local tensile stresses of 5.83, 4.04 and 4.33 MPa is beyond the uniaxial tensile strength of ore by 2.07 MPa. It tends to result in a local rock fall in the stope roof. Pillars are mainly subjected to compressive stress, especially the junction area between the pillars and the roofs and floors is prone to stress concentration (Figure 17 and Figure 21). In general, the maximum compressive stress values of 143.0, 118.0 and 123.0 MPa in the three schemes are much higher than the uniaxial compressive strength of the ore (97.62 MPa), and the ore pillar will be crushed by the overlying rock layer after the formation of mined-out areas. Hence, these three schemes are not advisable.
4.2. Stope Height 3.5 m
The calculation results of schemes 4–6 are shown in Table 5, and the main stress distribution cloud images are shown in Figure 23, Figure 24, Figure 25, Figure 26, Figure 27, Figure 28, Figure 29 and Figure 30. The results show that the maximum shear stress in the stope under the three schemes (39.9 MPa, 28.0 MPa, 19.6 MPa) does not exceed the shear strength of the ore rock (50.86 MPa). The tensile stress distribution law as mentioned in Section 4.1, and the local rock body of the roof is prone to fall. From Figure 25 and Figure 29, the compressive stresses are mainly concentrated in the pillars, and the maximum compressive stress values of 155.0 and 123.0 MPa in the pillars of scheme 4 and scheme 5 are already much higher than the uniaxial compressive strength of the ore (97.62 MPa). The maximum compressive stress of 86.8 MPa in scheme 6 is relatively low, and all stress indexes are greater than those of schemes 4 and 5.
4.3. Stope Height 4.5 m
The calculation results of schemes 7–9 are shown in Table 6, and the main stress distribution cloud images are shown in Figure 31, Figure 32, Figure 33, Figure 34, Figure 35, Figure 36, Figure 37, Figure 38. The results show that the maximum shear stress in the stope under the three schemes (37.8 MPa, 28.3 MPa, 21.0 MPa) does not exceed the shear strength of the ore rock (50.86 MPa). The tensile stress distribution law as mentioned in Section 4.1, and the falling rock mass is prone to cause safety accidents. From Figure 33 and Figure 37, the axes of the ore pillars suffer high compressive stresses, and the maximum compressive stress of 155.0 and 113.0 MPa in the pillars of scheme 7 and scheme 8 are much higher than the uniaxial compressive strength of the ore (97.62 MPa), and the pillars are susceptible to collapse by the pressure of the overlying rock after the formation of mined-out areas. In the perspective of safety, scheme 9 is greater than scheme 7 and 8.
4.4. Optimization Results
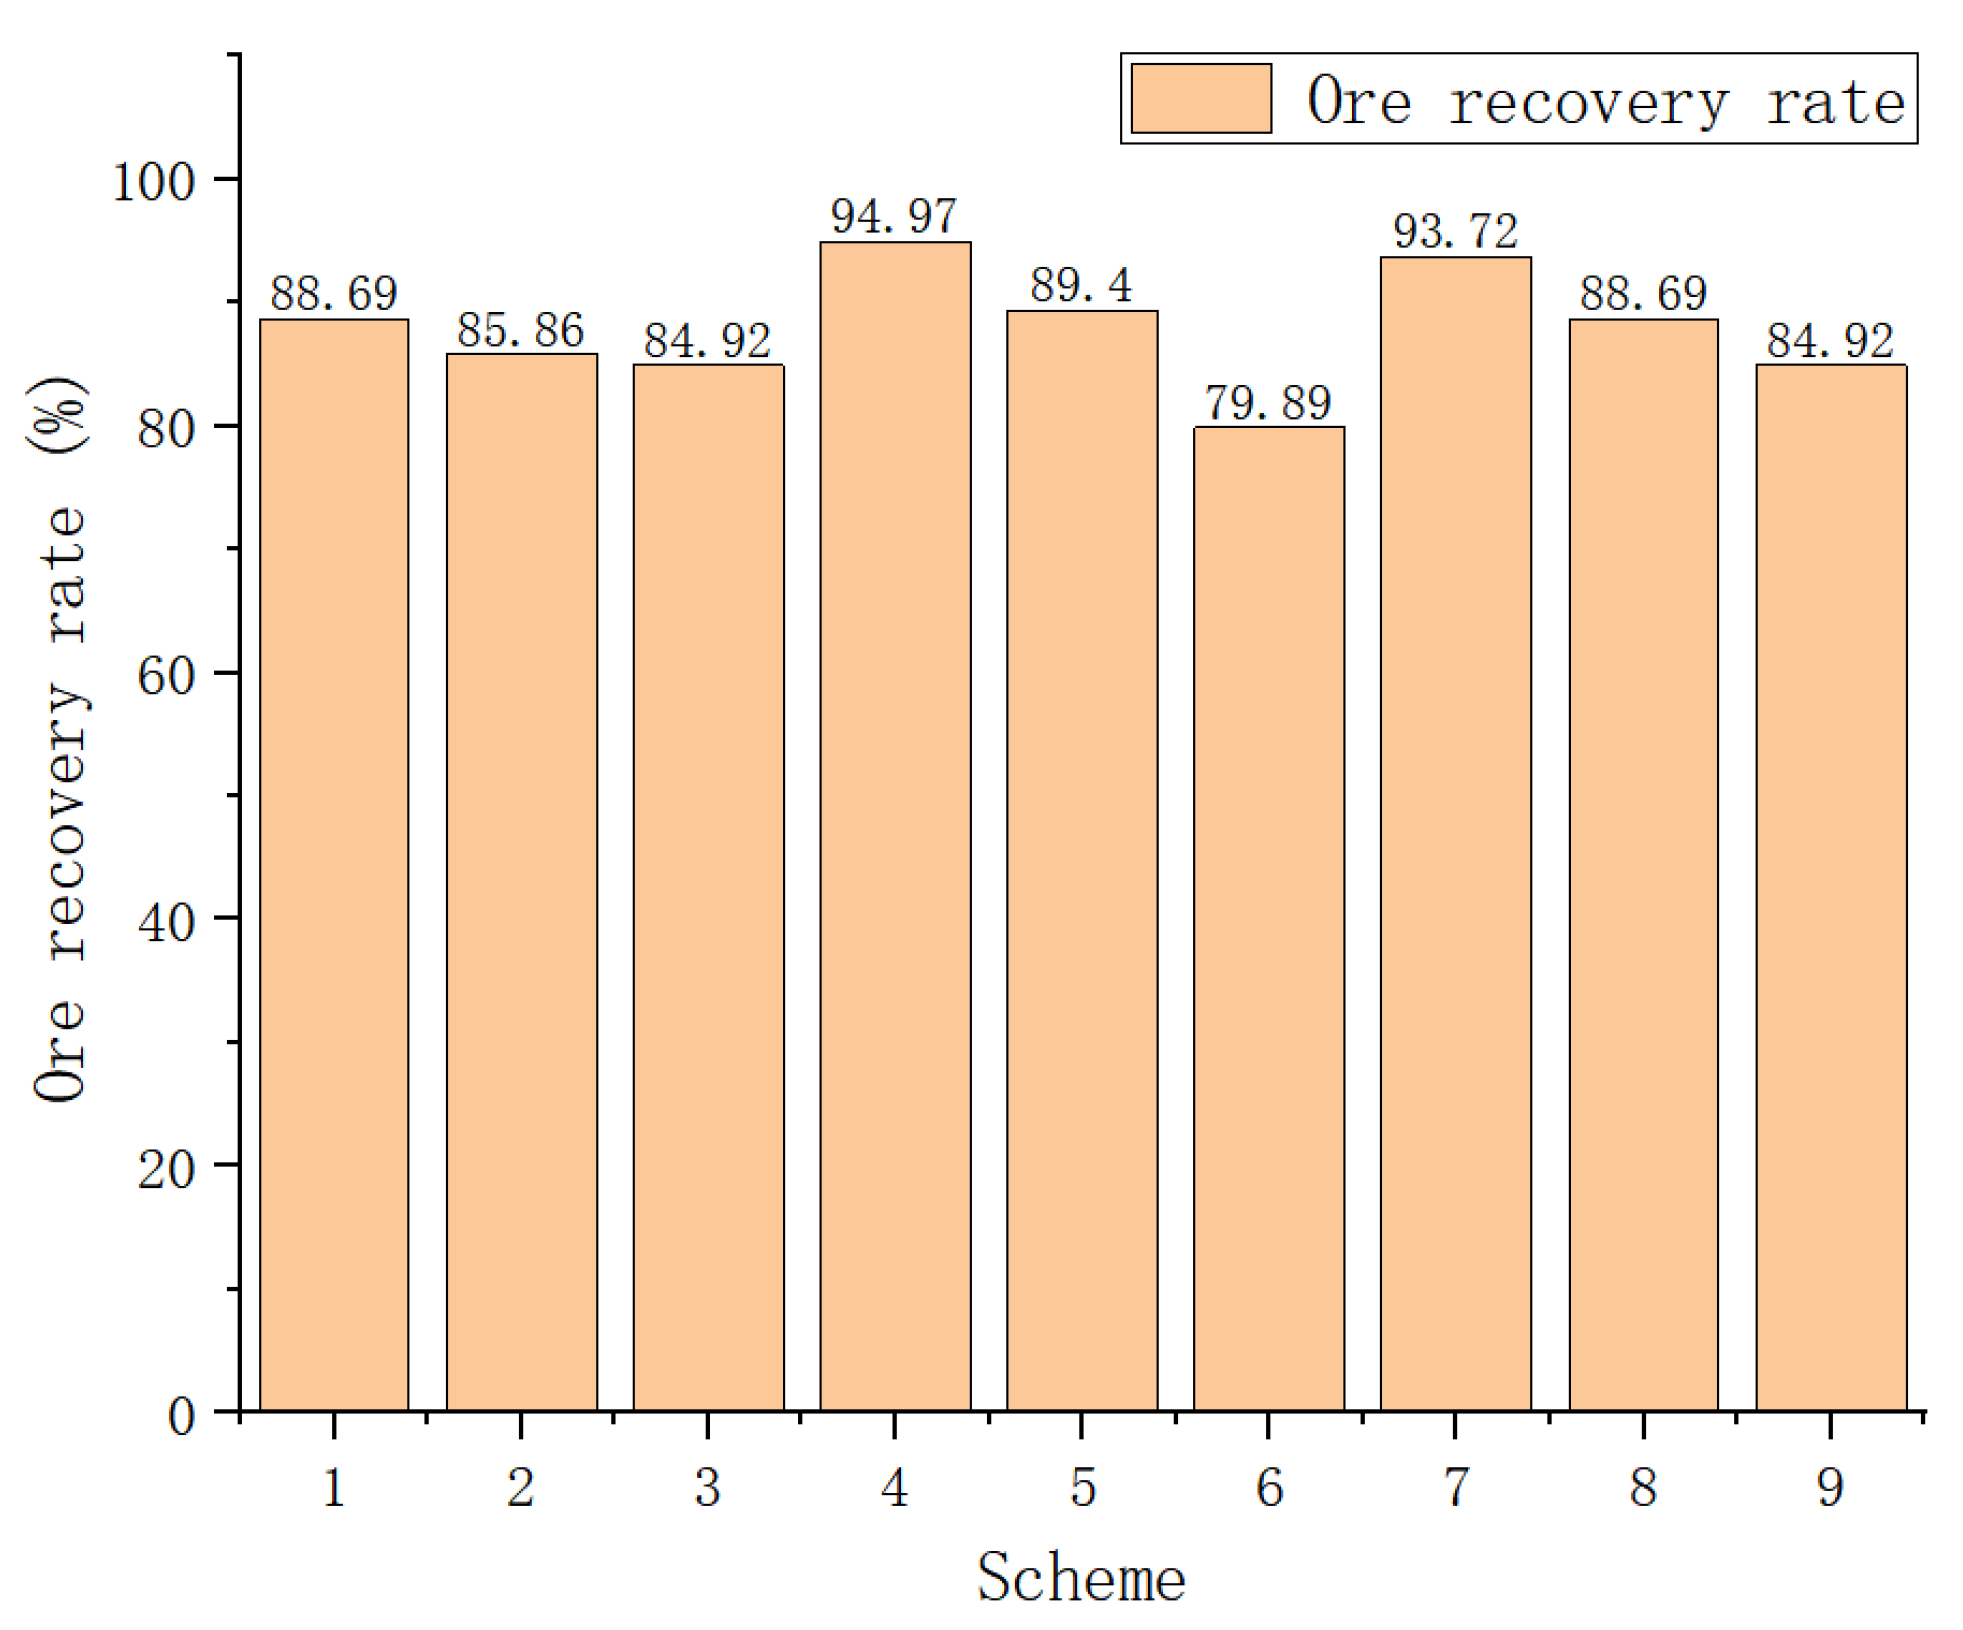
In summary, the maximum shear stress in the ore pillar under the nine schemes is all lower than the shear strength of the ore rock of 50.86 MPa, and in the actual mining process, the occurrence state of the structural planes in the pillar can be disregarded, so the possibility of complete shear failure of the pillar is low. The maximum compressive stress of 86.8 and 92.5 MPa for schemes 6 and 9 are both lower than the uniaxial compressive strength of the ore (97.62 MPa) (Figure 39), which prevail over other schemes. Although stress values of scheme 6 are all low, scheme 9 has a lower ore loss than scheme 6 due to retained ore pillars, and the ore recovery rate of 84.92% is higher than that of 79.89% in scheme 6 (Figure 40). After comprehensive consideration, the stope structural parameters of scheme 9 are recommended.
The optimal structural parameters of the room and pillar method are: stope height 4.5 m, ore pillar diameter 4 m, ore pillar spacing 7 m, and ore pillar row spacing 8 m. Based on the area-bearing theory, the axial compressive stress of the pillar under this parameter is 67.75 MPa, which is lower than the uniaxial compressive strength of the ore rock (97.62 MPa). The onsite trial is carried out in S3 stope at 1480 m using the recommended stope structural parameters, where all the stresses of the ore pillars meet the strength requirements of the ore rock, and the pillars ensures safety and stability after the ore room is mined. Additionally, the ore recovery rate of optimized stope reaches 82%, which also realizes the equilibrium of safety and economy.
5. Conclusions
- 1.
- Based on the area bearing theory, when the axial compressive stress is higher than the uniaxial compressive strength of the ore rock, the stope room will collapse. When the existing stope structural parameters are adopted, the maximum compressive stress in the ore pillar (142.0 MPa) is much higher than the uniaxial compressive strength of the ore (97.62 MPa). The existing stope structural parameters failed to maintain stability requirements and tended to be exposed to the risk of stope collapse.
- 2.
- When open stoping is applied to gently inclined medium-thick ore body, pillars are less affected by shear stress, and shear stress contributes little to pillar failure; the tensile stresses mainly occur in the middle of the pillars and within stope roofs and floors. Pillars mainly suffer compressive stress, especially the compressive stress concentrations that are prone to occur to the junction of the pillars, stope side walls, as well as roofs and floors.
- 3.
- The optimal structural parameters of the room and pillar method for the gently inclined medium-thick ore body are: stope height 4.5 m, pillar diameter 4 m, pillar spacing 7 m, and pillar row spacing 8 m. The onsite mining trial show that the optimized parameters are beneficial to realize the equilibrium of safety and economy, while the ore recovery rate reaches 82%.
Author Contributions
Writing—original draft preparation and editing, investigation, software, H.-Y.Q.; funding acquisition, writing—review, M.-Q.H.; translation, Y.-J.W. All authors have read and agreed to the published version of the manuscript.
Funding
This research was funded by the National Key Research and Development Program of China (Grant No. 2017YFC0602900), The National Natural Science Foundation of China (Grant No. 51804079) and National College Students’ innovation and entrepreneurship training program (Grant No. 202210386022).
Data Availability Statement
The data presented in this study are available on request from the corresponding author.
Conflicts of Interest
The authors declare no conflict of interest.
References
- Guo, Q.Q.; Yu, H.X.; Dan, Z.Y.; Li, S. Mining method optimization of gently inclined and soft broken complex ore body based on ahp and topsis: Taking miao-ling gold mine of china as an example. Sustainability 2021, 13, 12503. [Google Scholar] [CrossRef]
- Wu, J. Research on sublevel open stoping recovery processes of inclined medium-thick orebody on the basis of physical simulation experiments. PLoS ONE 2020, 15, e0232640. [Google Scholar] [CrossRef] [PubMed]
- Li, X.S.; Wang, Y.M.; Yang, S.; Xiong, J.; Zhao, K. Research progress in the mining technology of the slowly inclined, thin to medium thick phosphate rock transition from open-pit to underground mine. Appl. Math. Nonlinear Sci. 2021, 6, 319–334. [Google Scholar] [CrossRef]
- Ge, Q.F.; Sun, X.S.; Zhu, W.G.; Chen, Q.G. Research of mining method for difficult-to-mine ore bodies in deep mine. Adv. Mater. Res. 2014, 962–965, 1041–1046. [Google Scholar] [CrossRef]
- Serrano, A.; Olalla, C. Ultimate bearing capacity of rock masses. Int. J. Rock Mech. Min. Sci. Geomech. Abstr. 1994, 31, 93–106. [Google Scholar] [CrossRef]
- Bazaluk, O.; Petlovanyi, M.; Zubko, S.; Lozynskyi, V.; Sai, K. Instability Assessment of Hanging Wall Rocks during Underground Mining of Iron Ores. Minerals 2021, 11, 858. [Google Scholar] [CrossRef]
- Wu, A.X.; Huang, M.Q.; Han, B.; Wang, Y.M.; Yu, S.F.; Miao, X.X. Orthogonal design and numerical simulation of room and pillar configurations in fractured stopes. J. Cent. South Univ. 2014, 21, 3338–3344. [Google Scholar] [CrossRef]
- Mikaeil, R.; Bakhshinezhad, H.; Haghshenas, S.S.; Ataei, M. Stability Analysis of Tunnel Support Systems Using Numerical and Intelligent Simulations (Case Study: Kouhin Tunnel of Qazvin-Rasht Railway). Rud.-Geološko-Naft. Zb. 2019, 34, 1–10. [Google Scholar] [CrossRef] [Green Version]
- Zhao, K.; Wang, Q.; Li, Q.; Yan, Y.J.; Yu, X.; Wang, J.Q.; Cao, S. Optimization calculation of stope structure parameters based on mathews stabilization graph method. J. Vibroeng. 2019, 21, 1227–1239. [Google Scholar]
- Qin, X.S.; Cao, H.; Wang, Z.X.; Zheng, Z.J. Analysis on safe thickness of the horizontal separation pillar in the upward horizontal slicing and filling method. IOP Conf. Ser. Earth Environ. Sci. 2021, 861, 052051. [Google Scholar] [CrossRef]
- Lan, M.; Liu, Z.; Li, X. Multi-objective optimization and multi-attribute decision making on structural parameters of stage backfilling stope. J. Cent. South Univ. 2019, 50, 375–383. [Google Scholar]
- Liu, D.; Shao, A.; Jin, C.; Ding, C.; Fan, F. Numerical model building for broken ore body and optimization of stope structural parameters. J. Cent. South Univ. 2019, 50, 437–444. [Google Scholar]
- Qin, X.S.; Cao, H.; Guo, L.J. Sensitivity analysis of factors influencing pillar stability in the deep stope of underground salt mine. IOP Conf. Ser. Earth Environ. Sci. 2020, 570, 022002. [Google Scholar] [CrossRef]
- Yao, G.H.; Wu, A.X.; Wang, Y.M. Stability analysis of stope retention pillars in broken rock conditions. J. Univ. Sci. Technol. Beijing 2011, 33, 400–405. [Google Scholar]
- Ma, M.H.; Guo, Q.F.; Pan, J.L.; Ma, C.; Cai, M.F. Optimal Support Solution for a Soft Rock Roadway Based on the Drucker–Prager Yield Criteria. Minerals 2022, 12, 1. [Google Scholar] [CrossRef]
- Drucker, D.C.; Prager, W. Soil mechanics and plastic analysis or limit design. Quart. Appl. Math. 1952, 10, 157–165. [Google Scholar] [CrossRef] [Green Version]
Figure 1.
Schematic diagram of pillar stress.
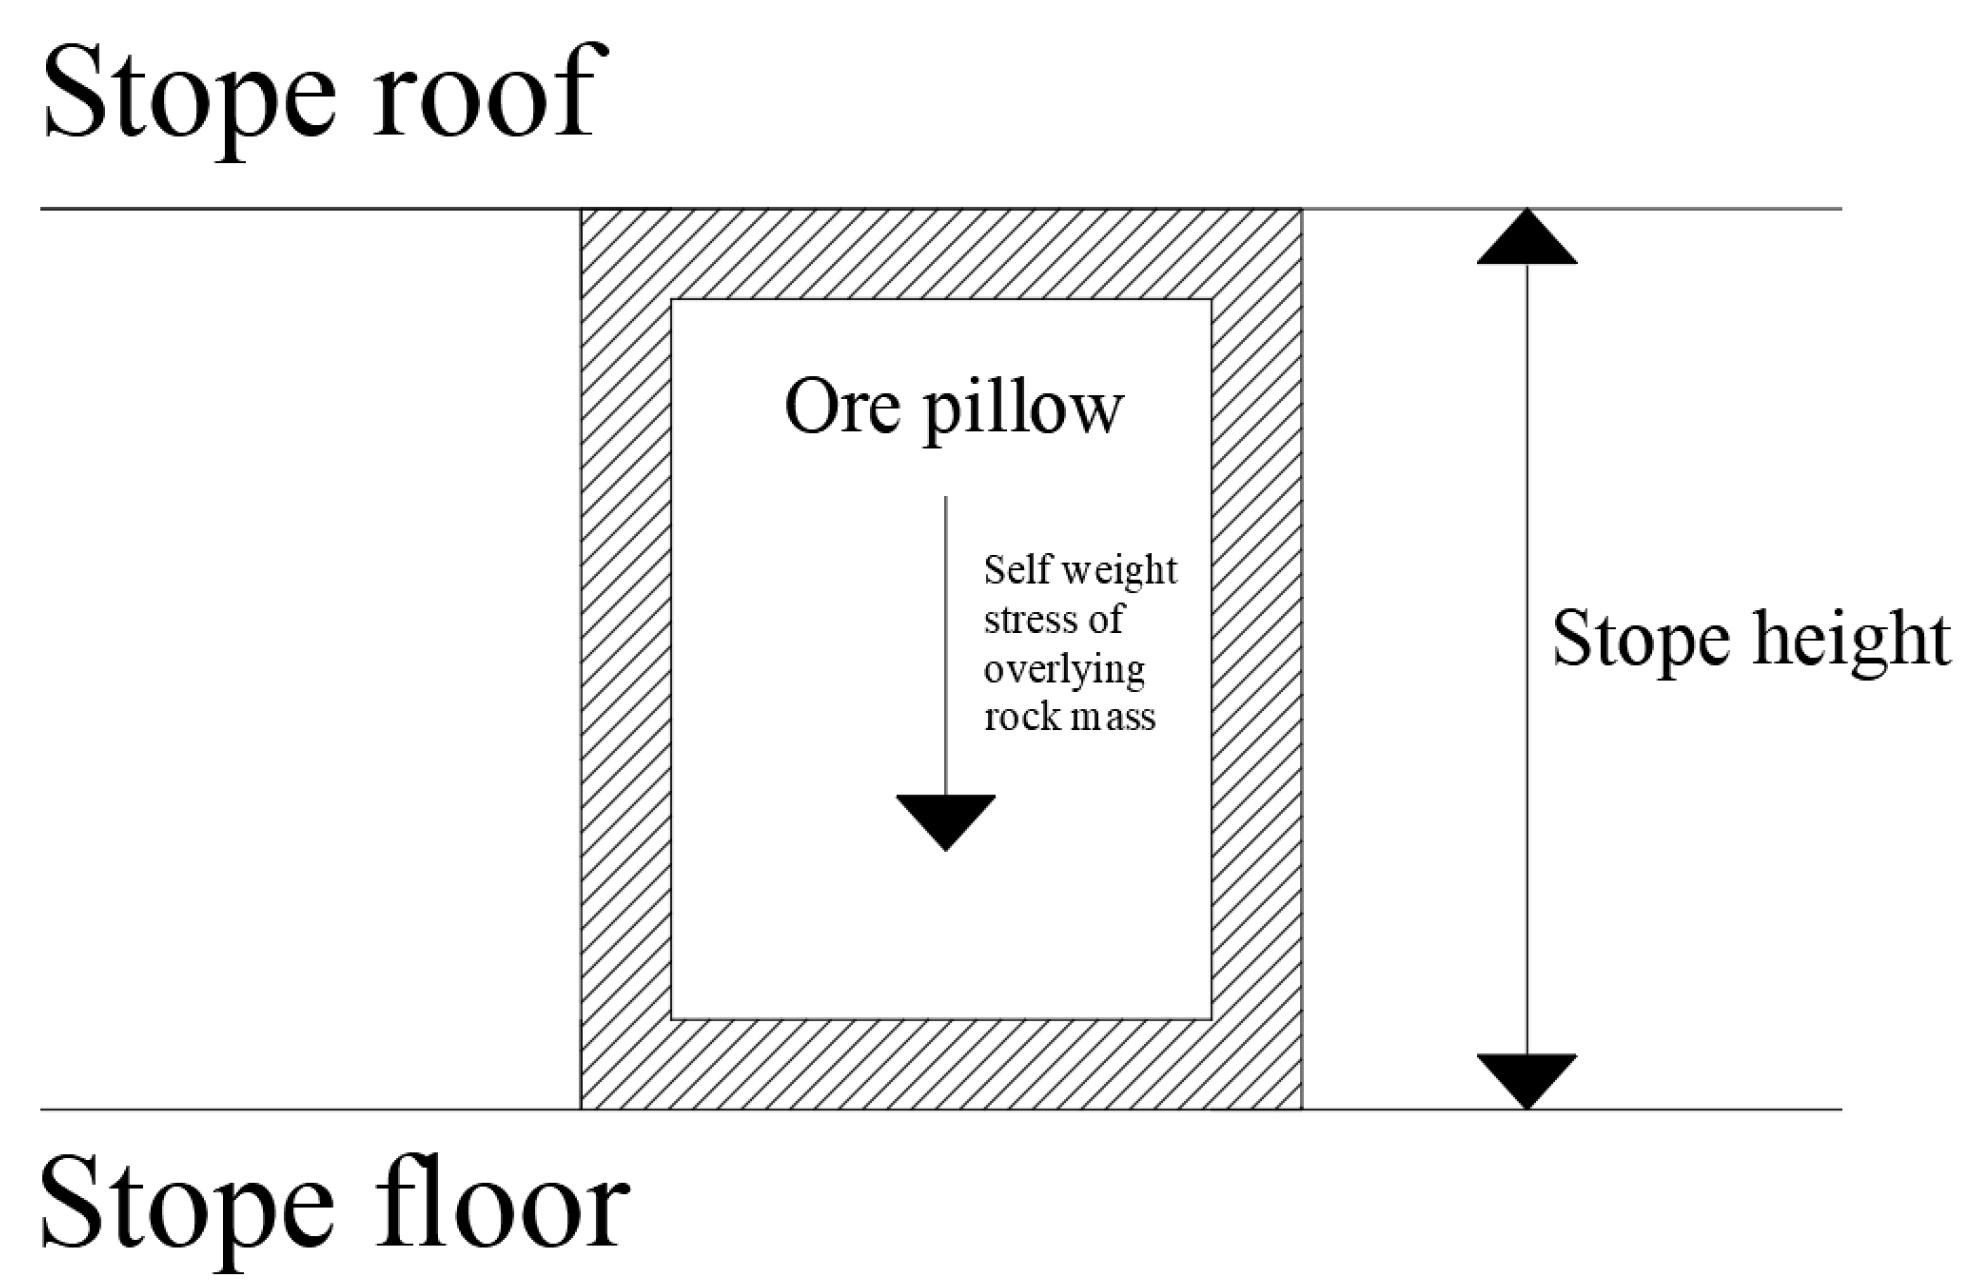
Figure 2.
Schematic diagram of pillar bearing calculation.

Figure 3.
Picture of pillar in Bainiuchang mine.
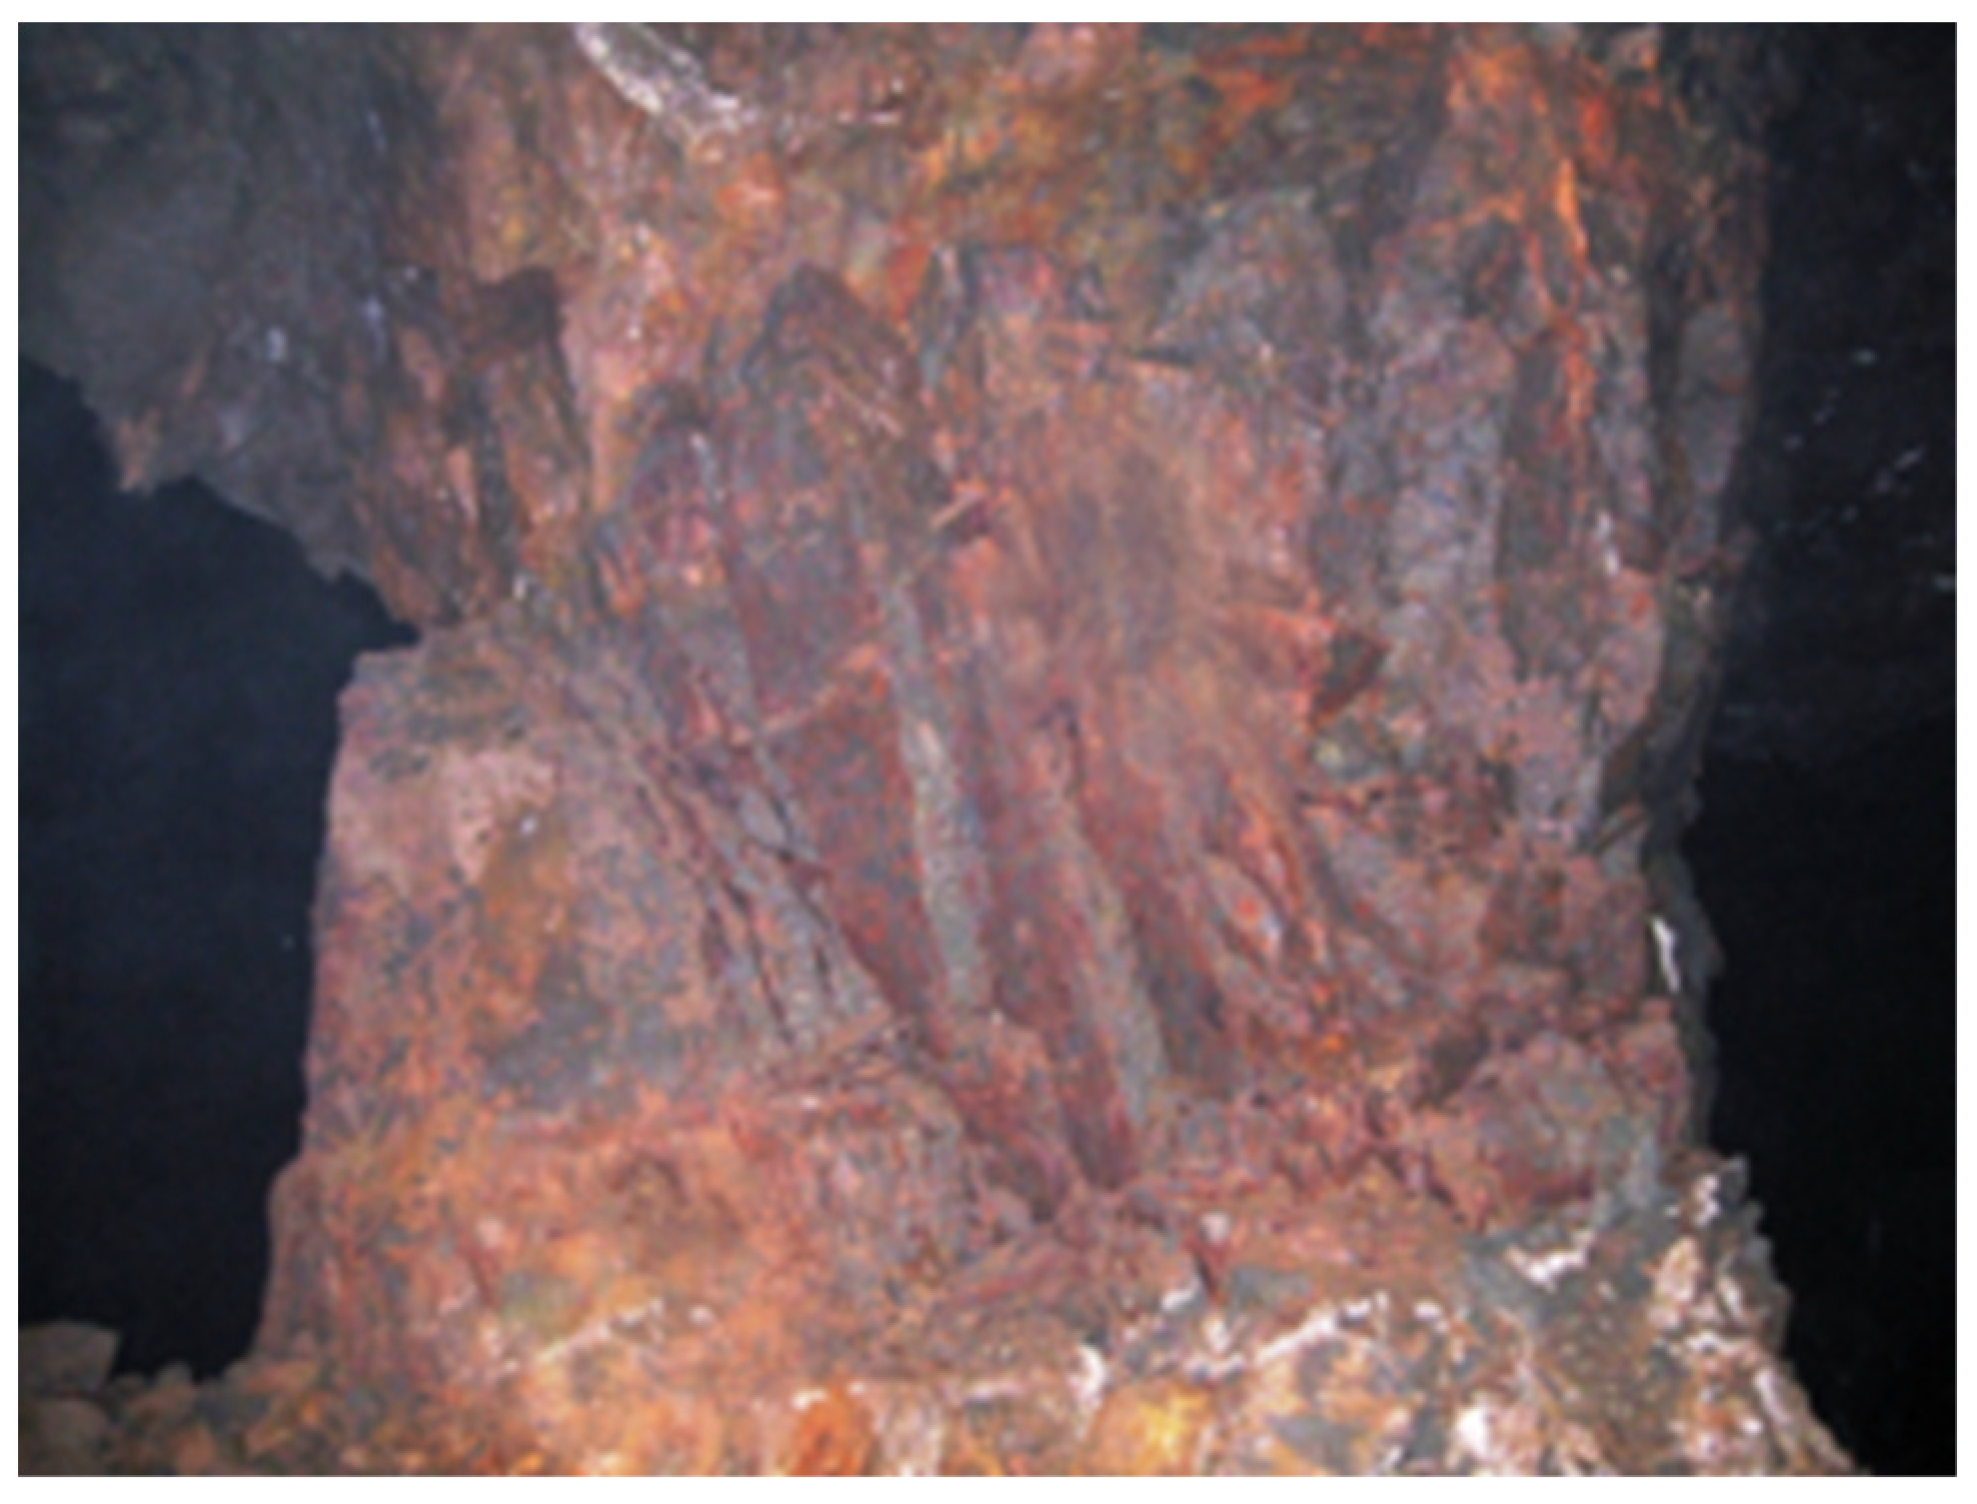
Figure 4.
Arrangement and mining sequence of rooms and pillars.
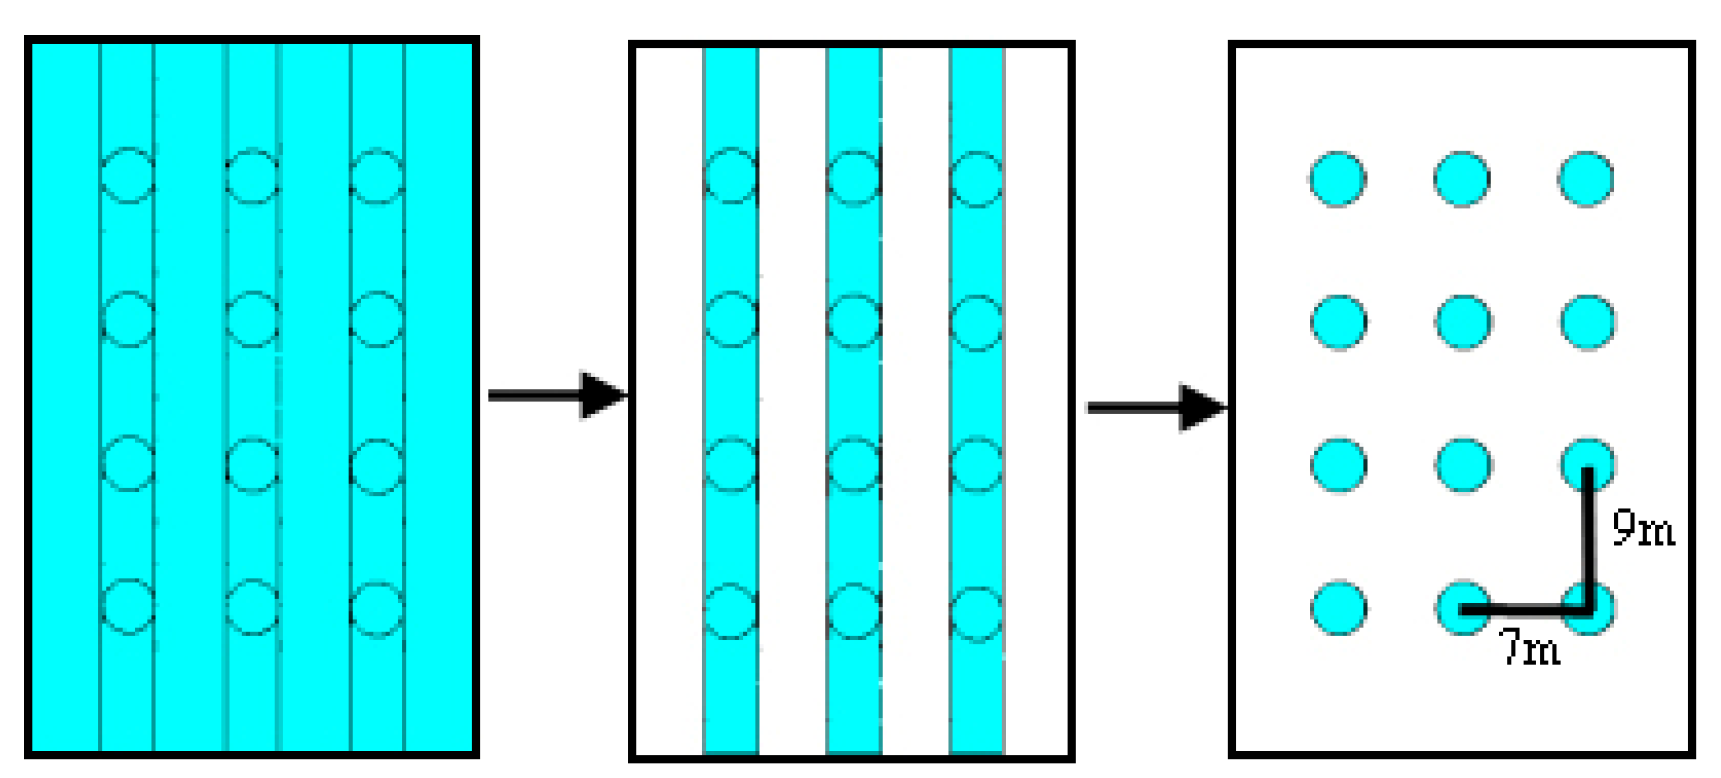
Figure 5.
Finite element calculation model.
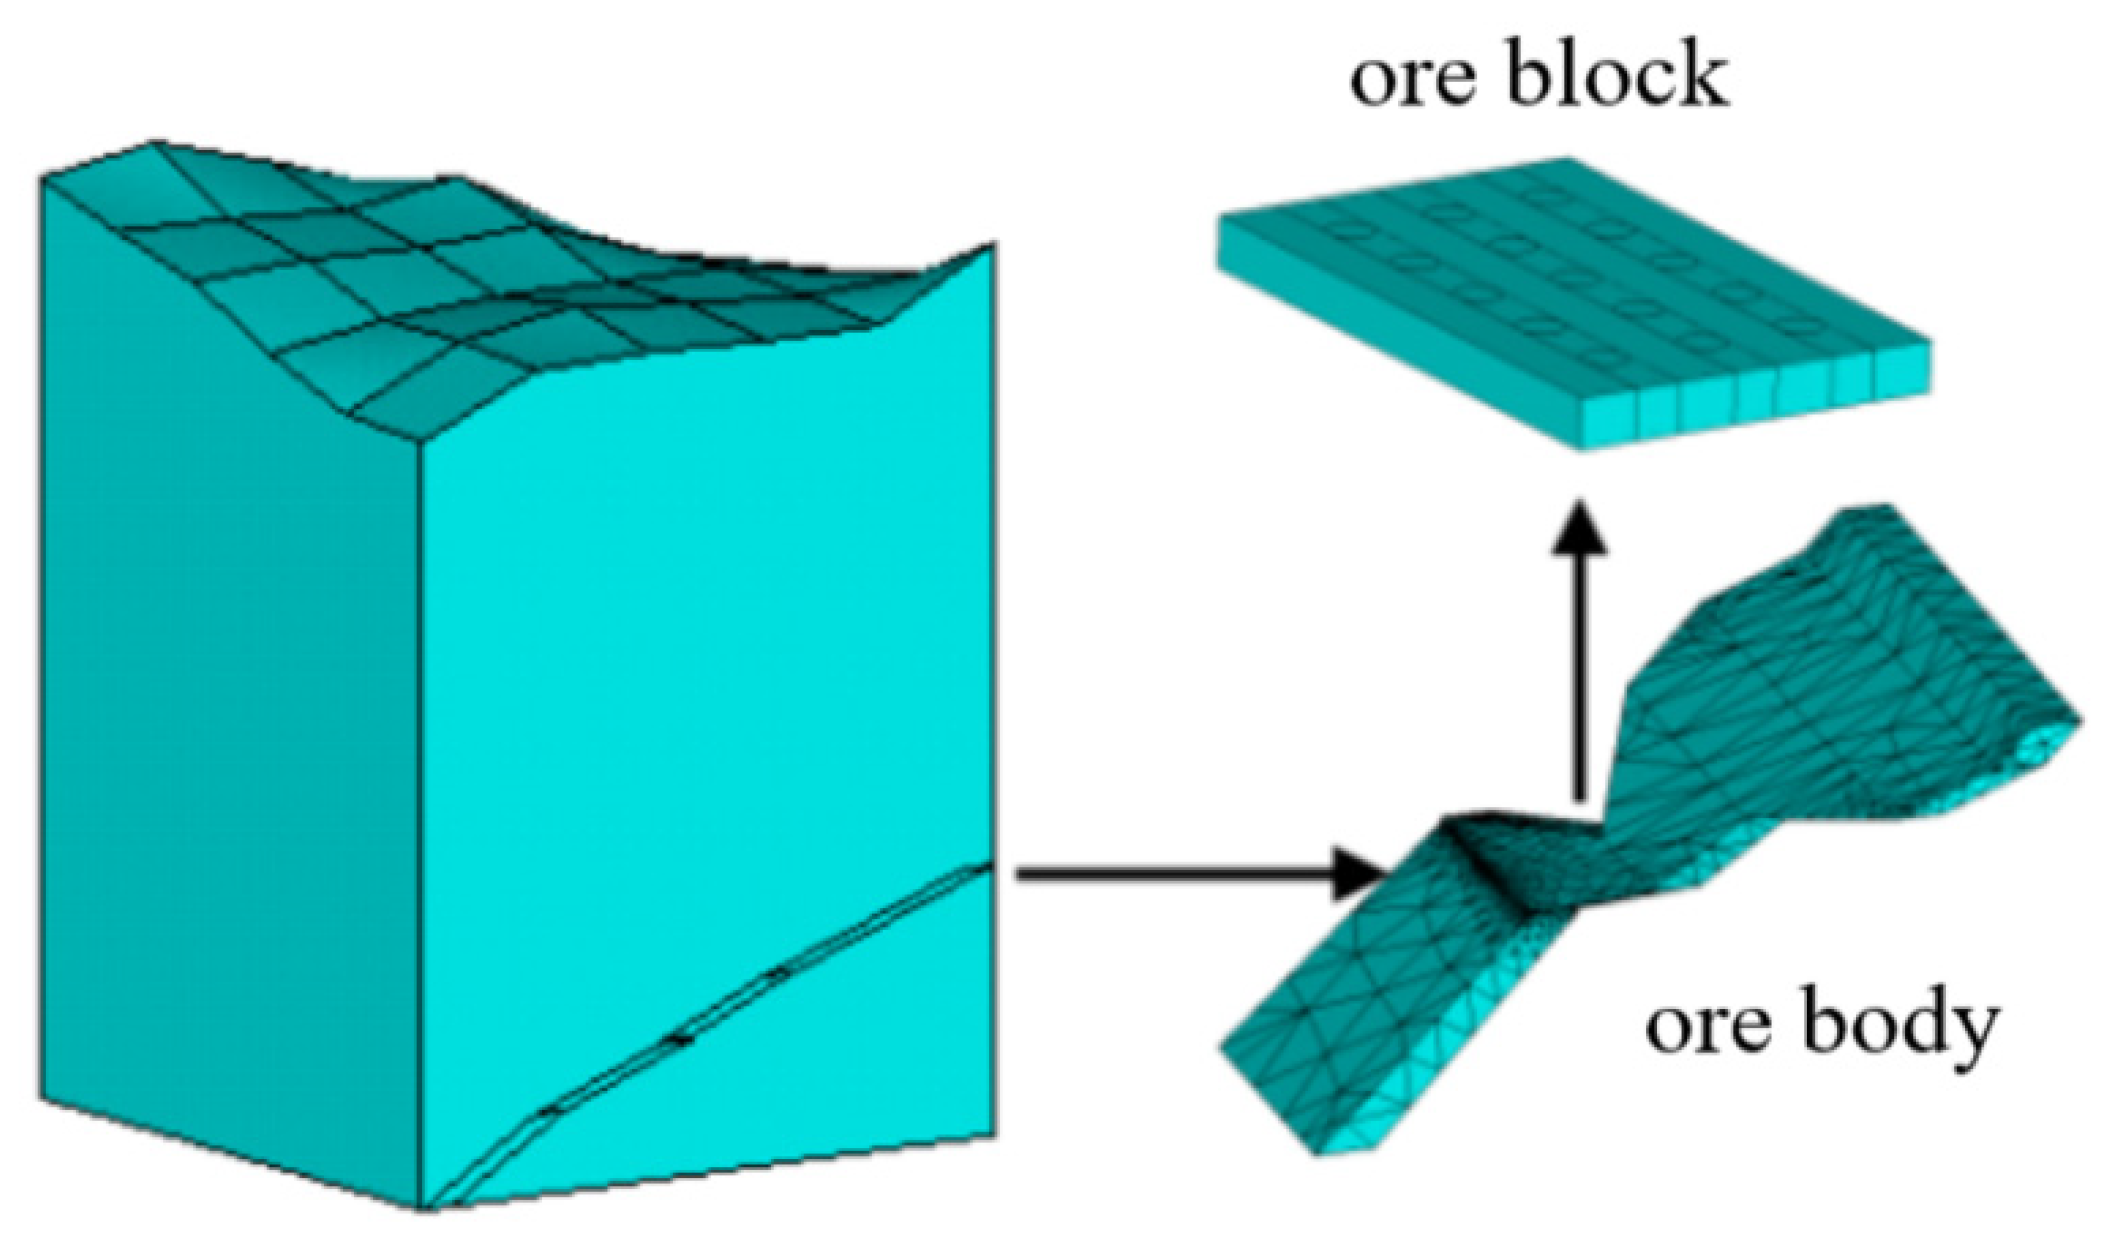
Figure 6.
Finite element model meshing.

Figure 7.
Dead-weight stress field calculation results.
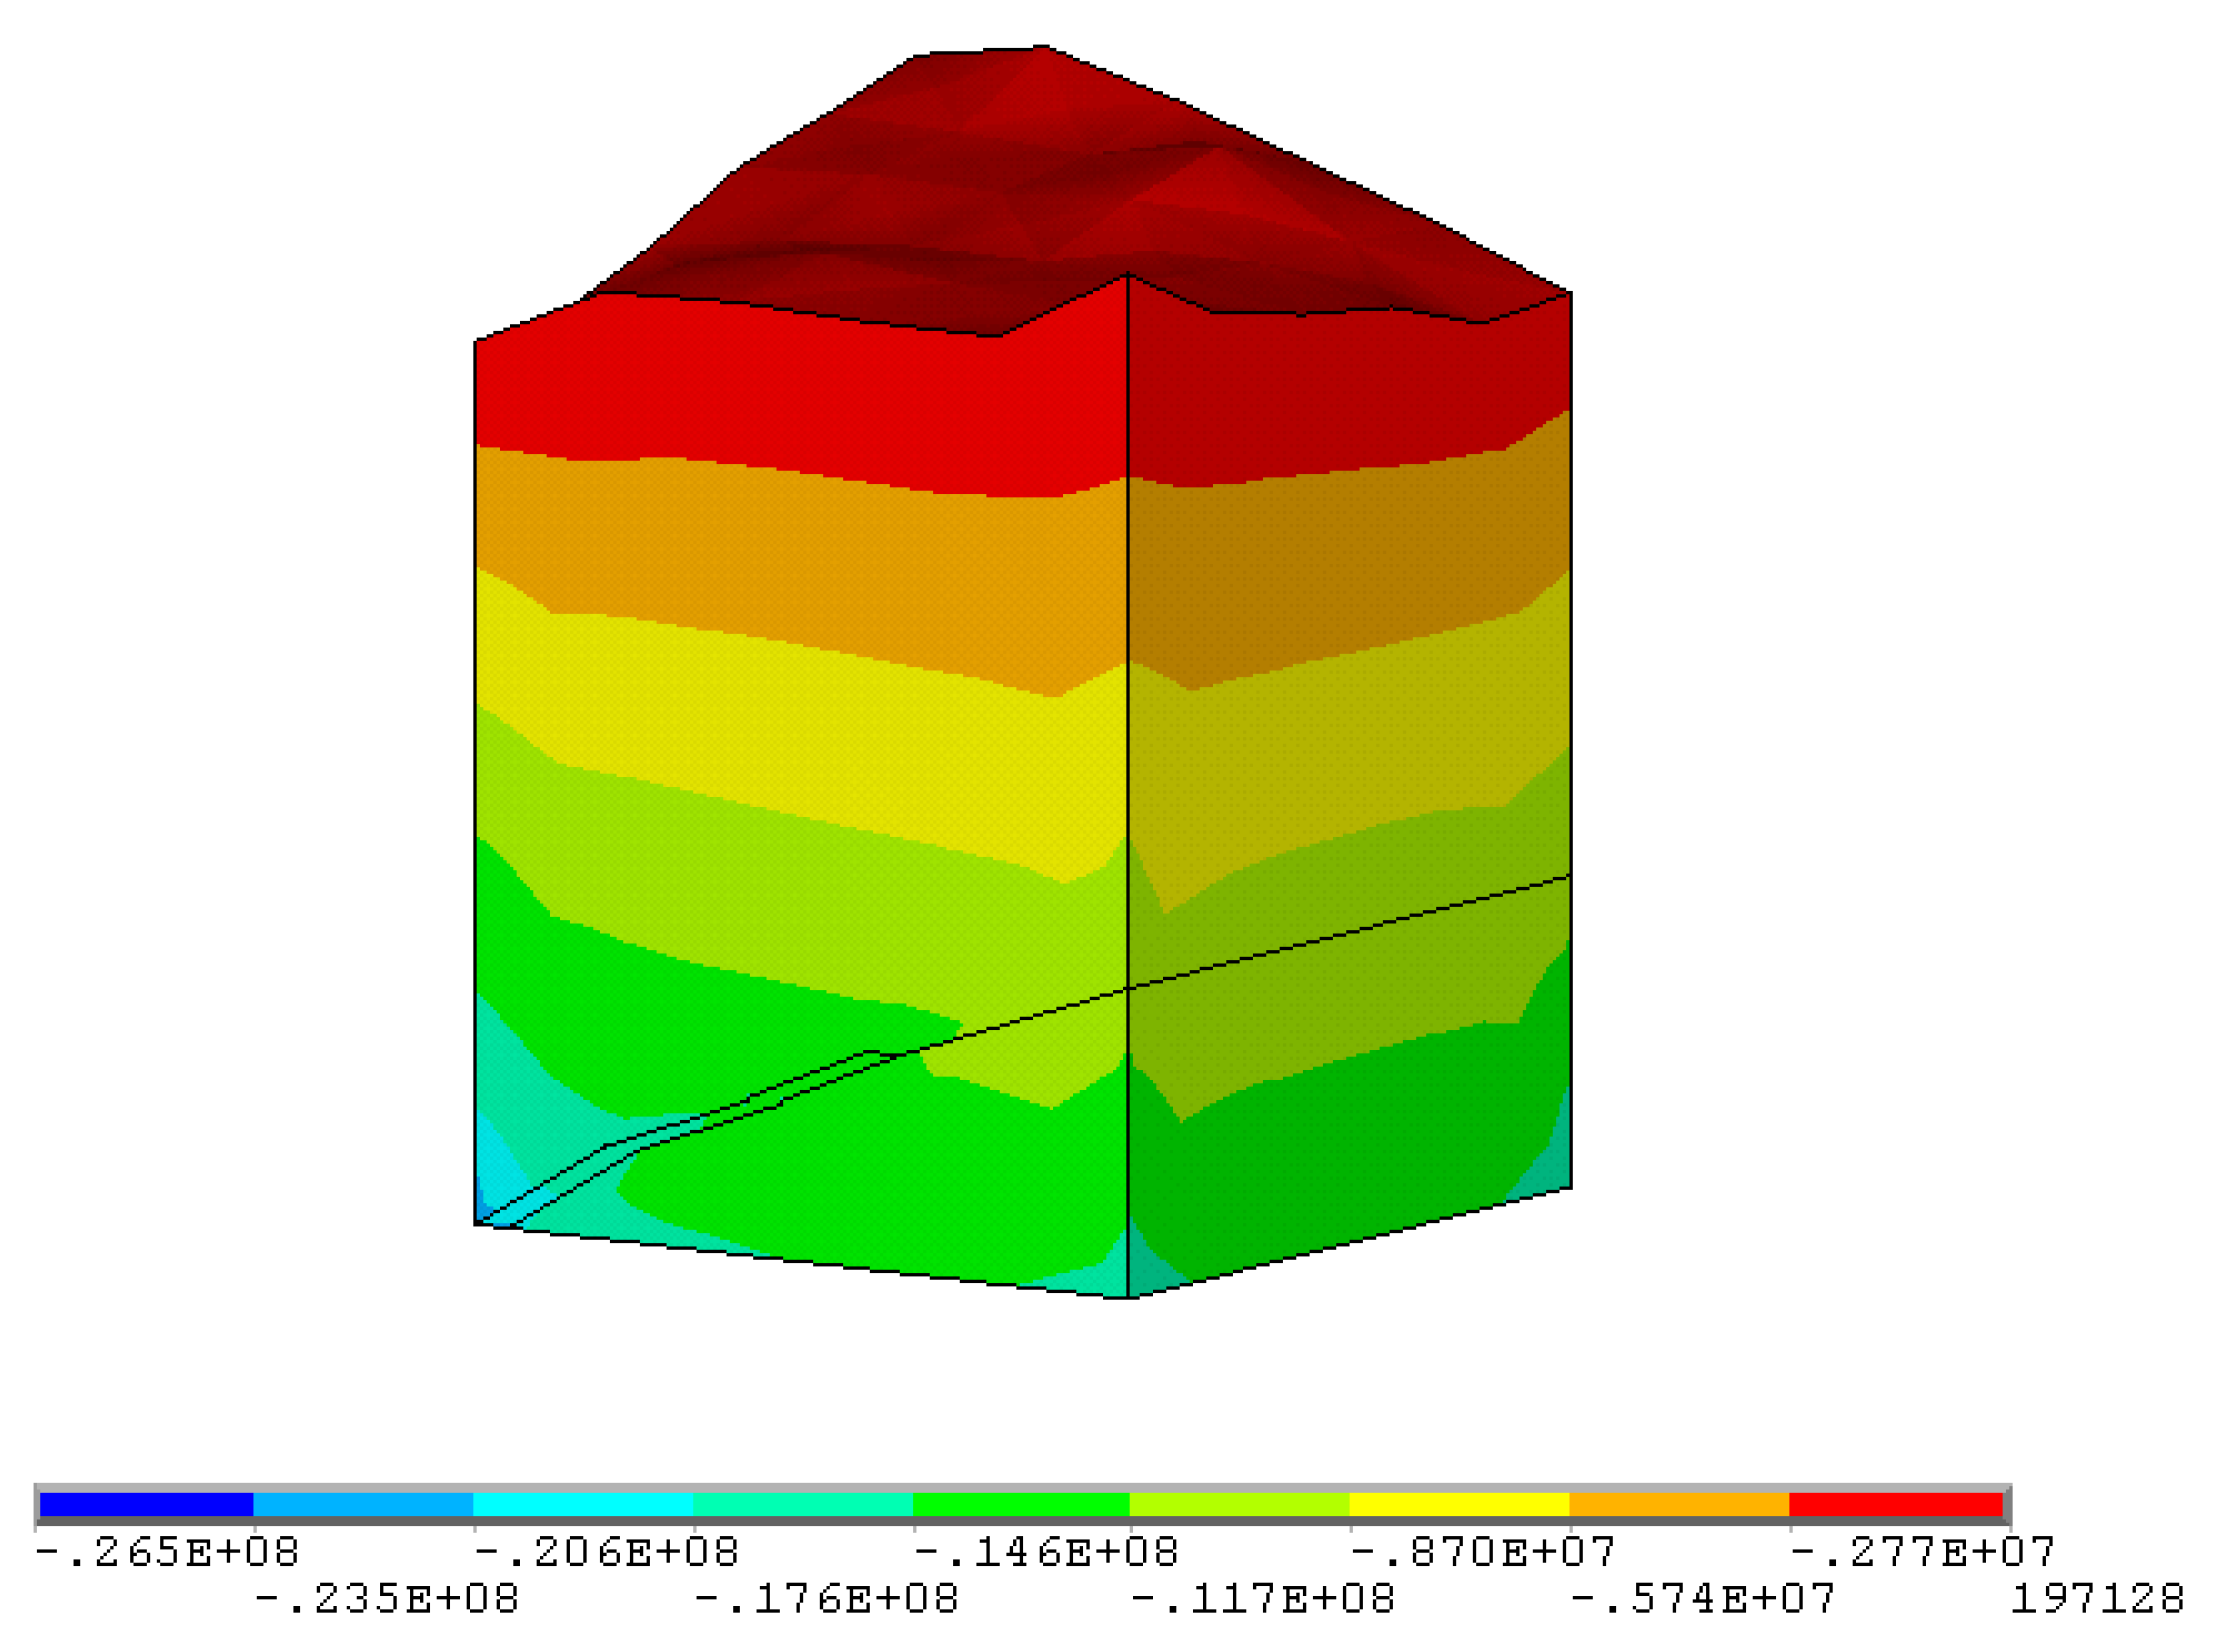
Figure 8.
Maximum principal stress distribution in the ore block at 1480 mL before mining (parameters before optimization: stope height 3 m, pillar diameter 3 m, pillar spacing 7 m, pillar row spacing 9 m).
Figure 8.
Maximum principal stress distribution in the ore block at 1480 mL before mining (parameters before optimization: stope height 3 m, pillar diameter 3 m, pillar spacing 7 m, pillar row spacing 9 m).
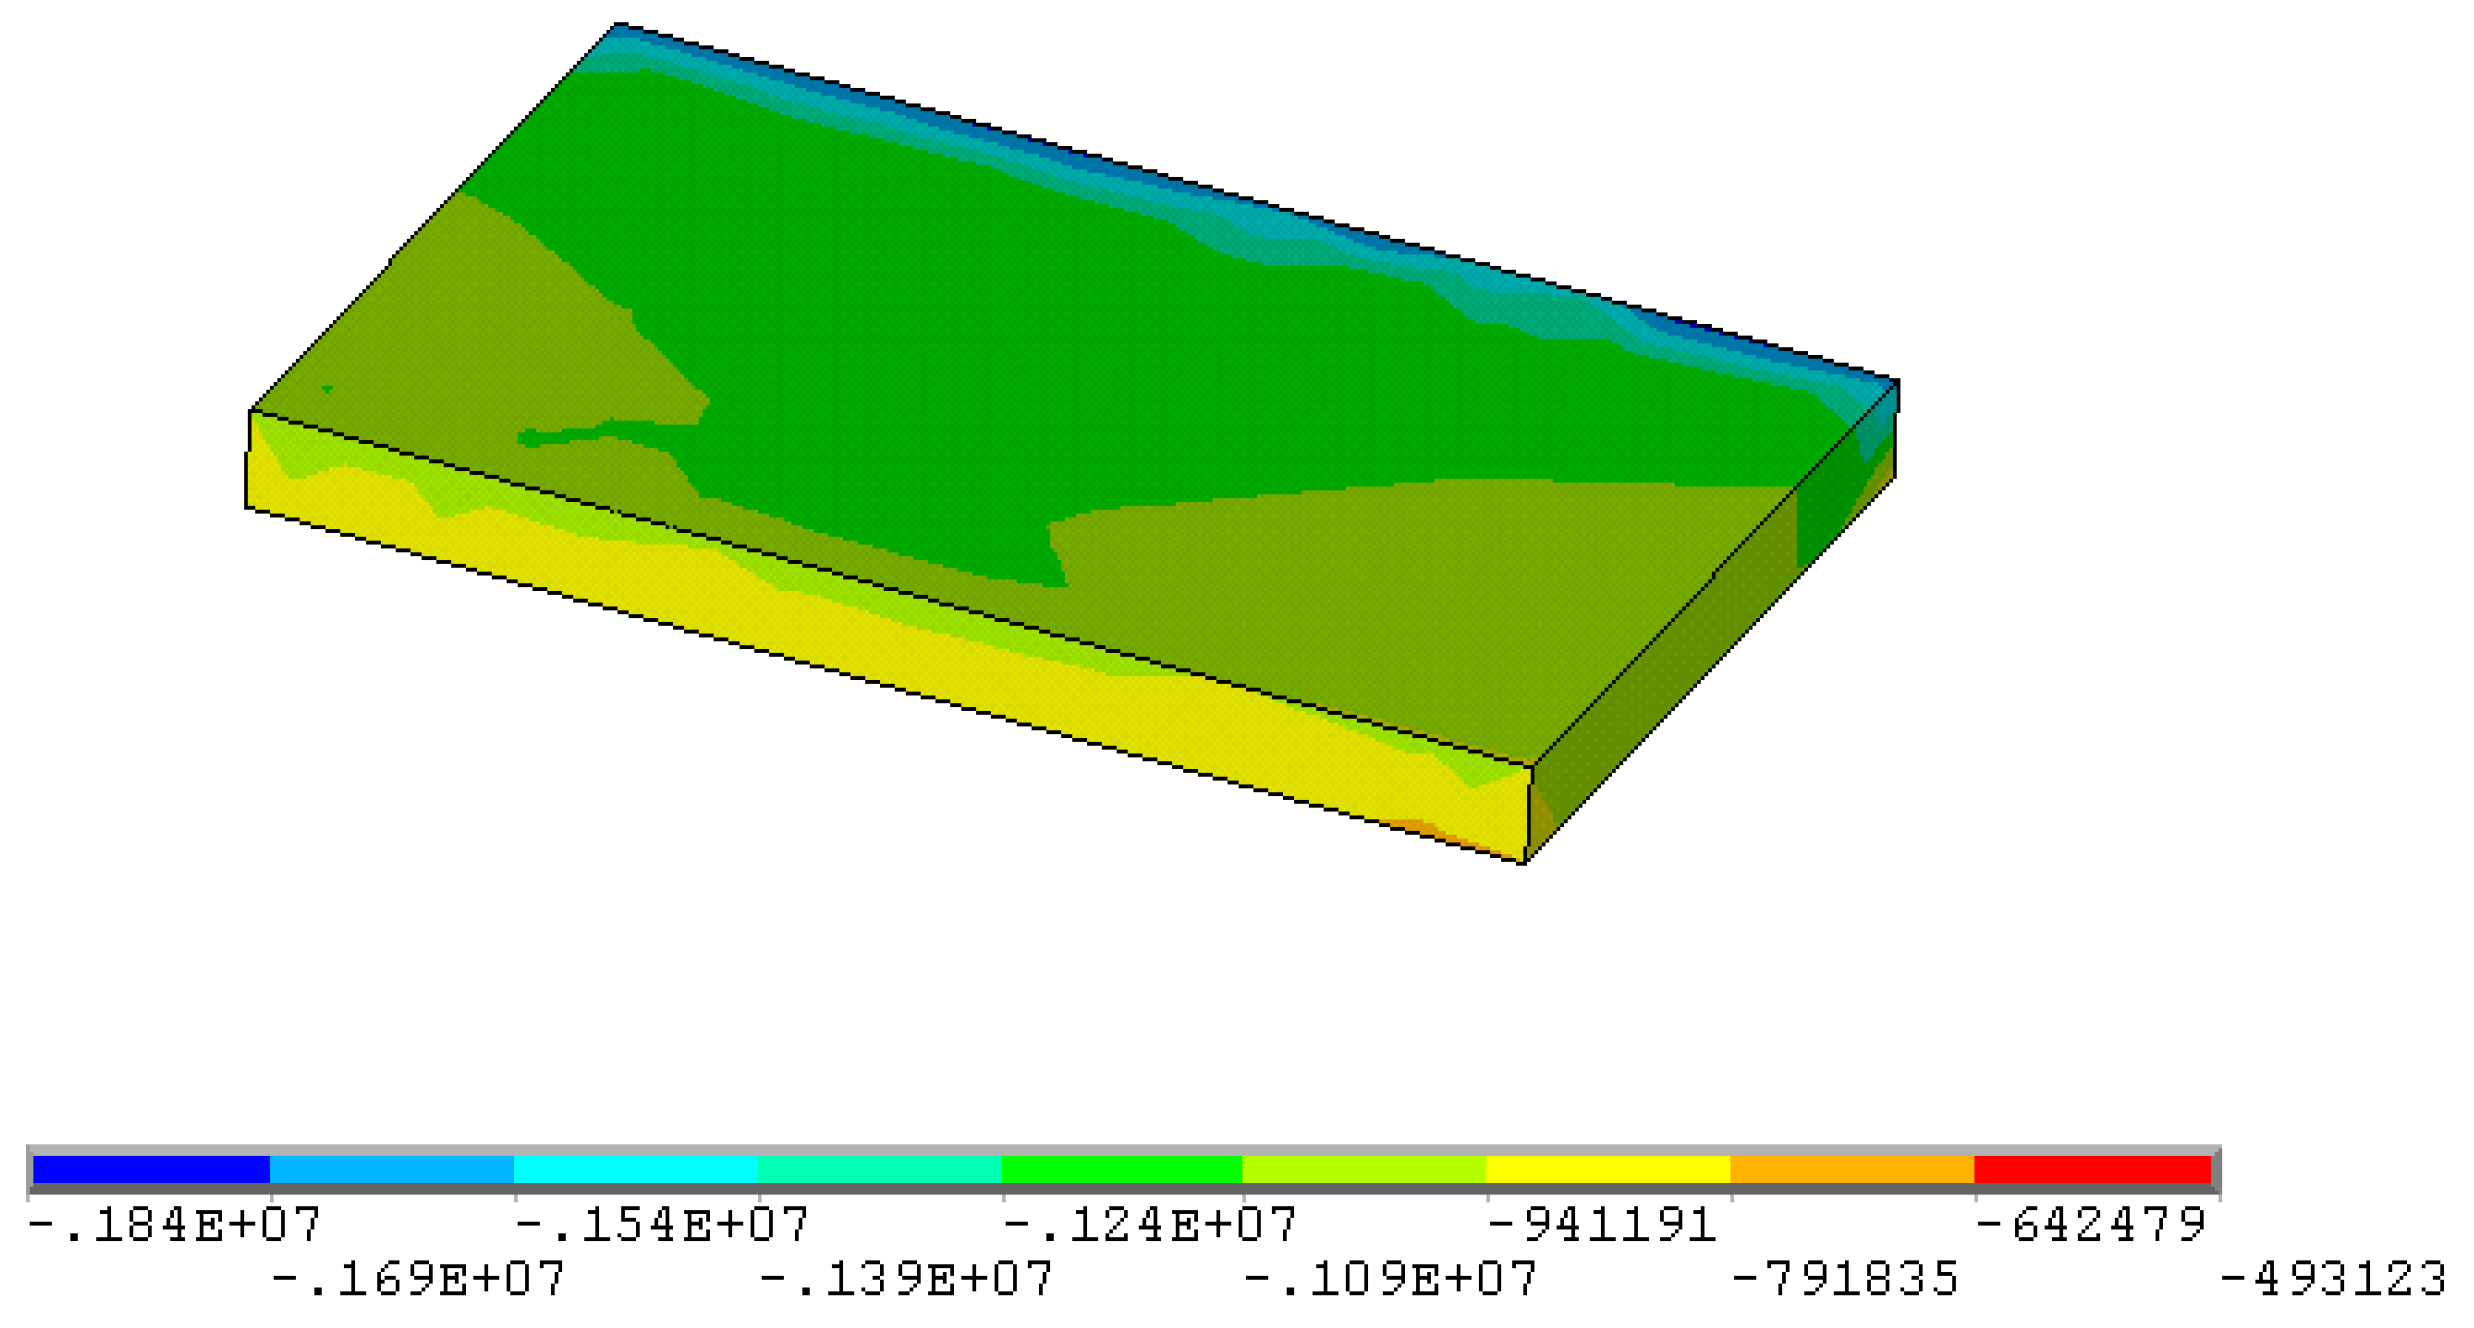
Figure 9.
Minimum principal stress distribution in the block at 1480 mL before mining (parameters before optimization: stope height 3 m, pillar diameter 3 m, pillar spacing 7 m, pillar row spacing 9 m).
Figure 9.
Minimum principal stress distribution in the block at 1480 mL before mining (parameters before optimization: stope height 3 m, pillar diameter 3 m, pillar spacing 7 m, pillar row spacing 9 m).
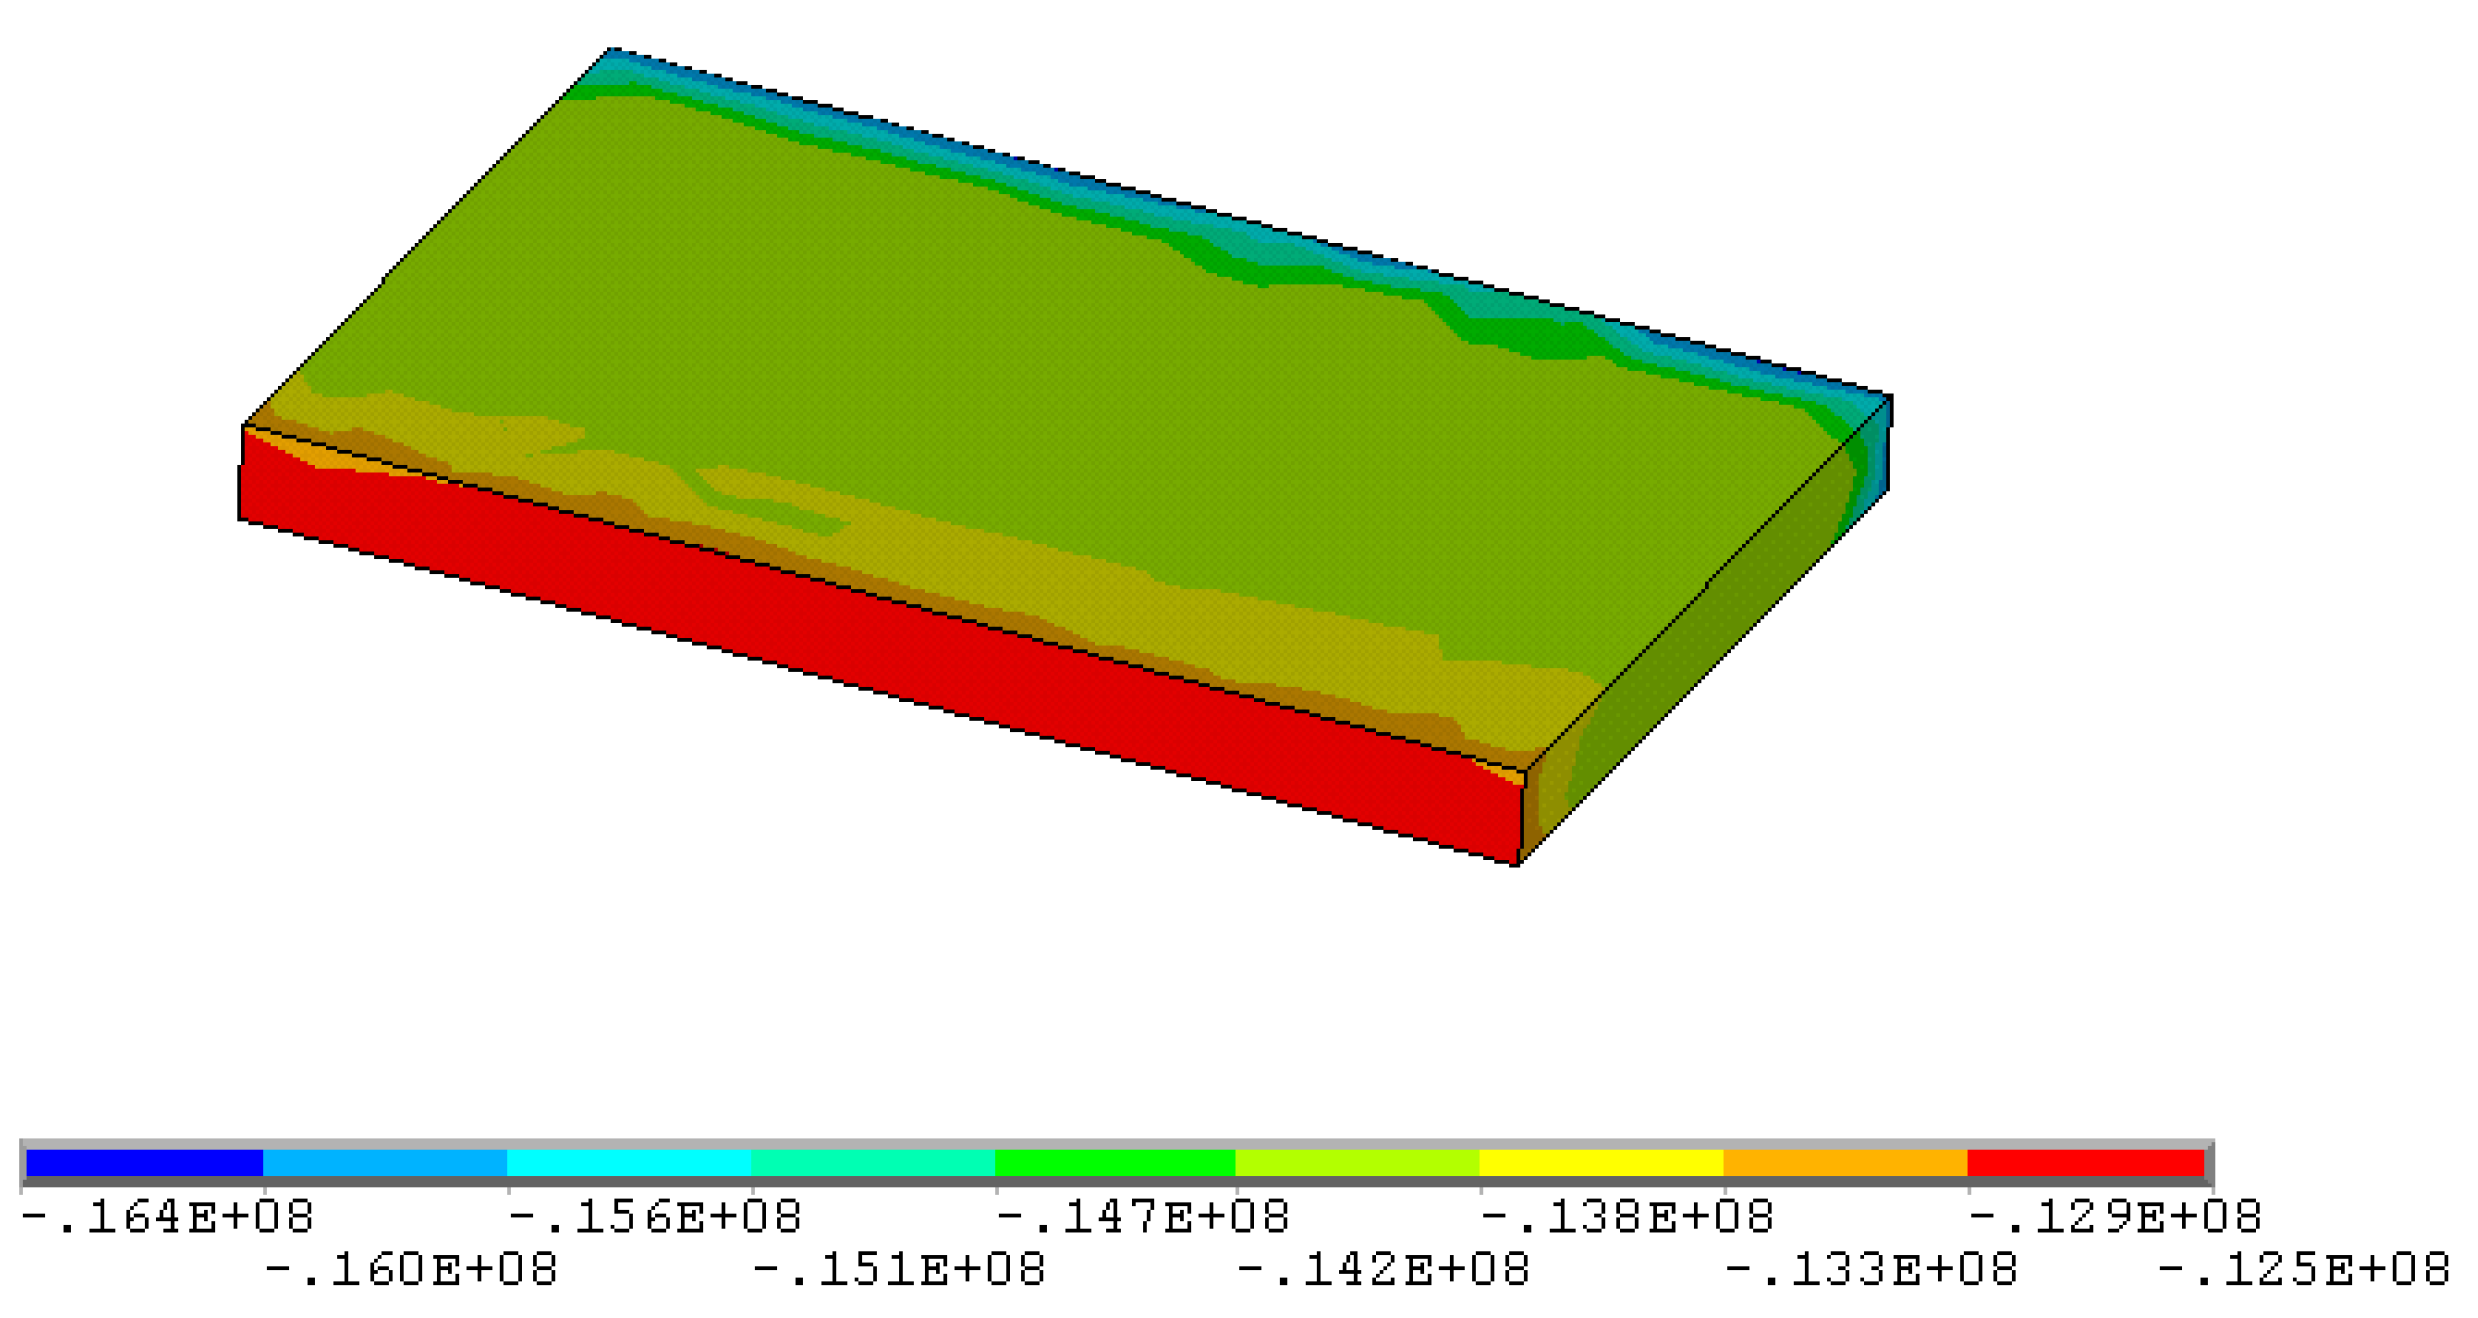
Figure 10.
Maximum principal stress distribution in the ore block at 1480 mL after mining the strip room (parameters before optimization: stope height 3 m, pillar diameter 3 m, pillar spacing 7 m, pillar row spacing 9 m).
Figure 10.
Maximum principal stress distribution in the ore block at 1480 mL after mining the strip room (parameters before optimization: stope height 3 m, pillar diameter 3 m, pillar spacing 7 m, pillar row spacing 9 m).
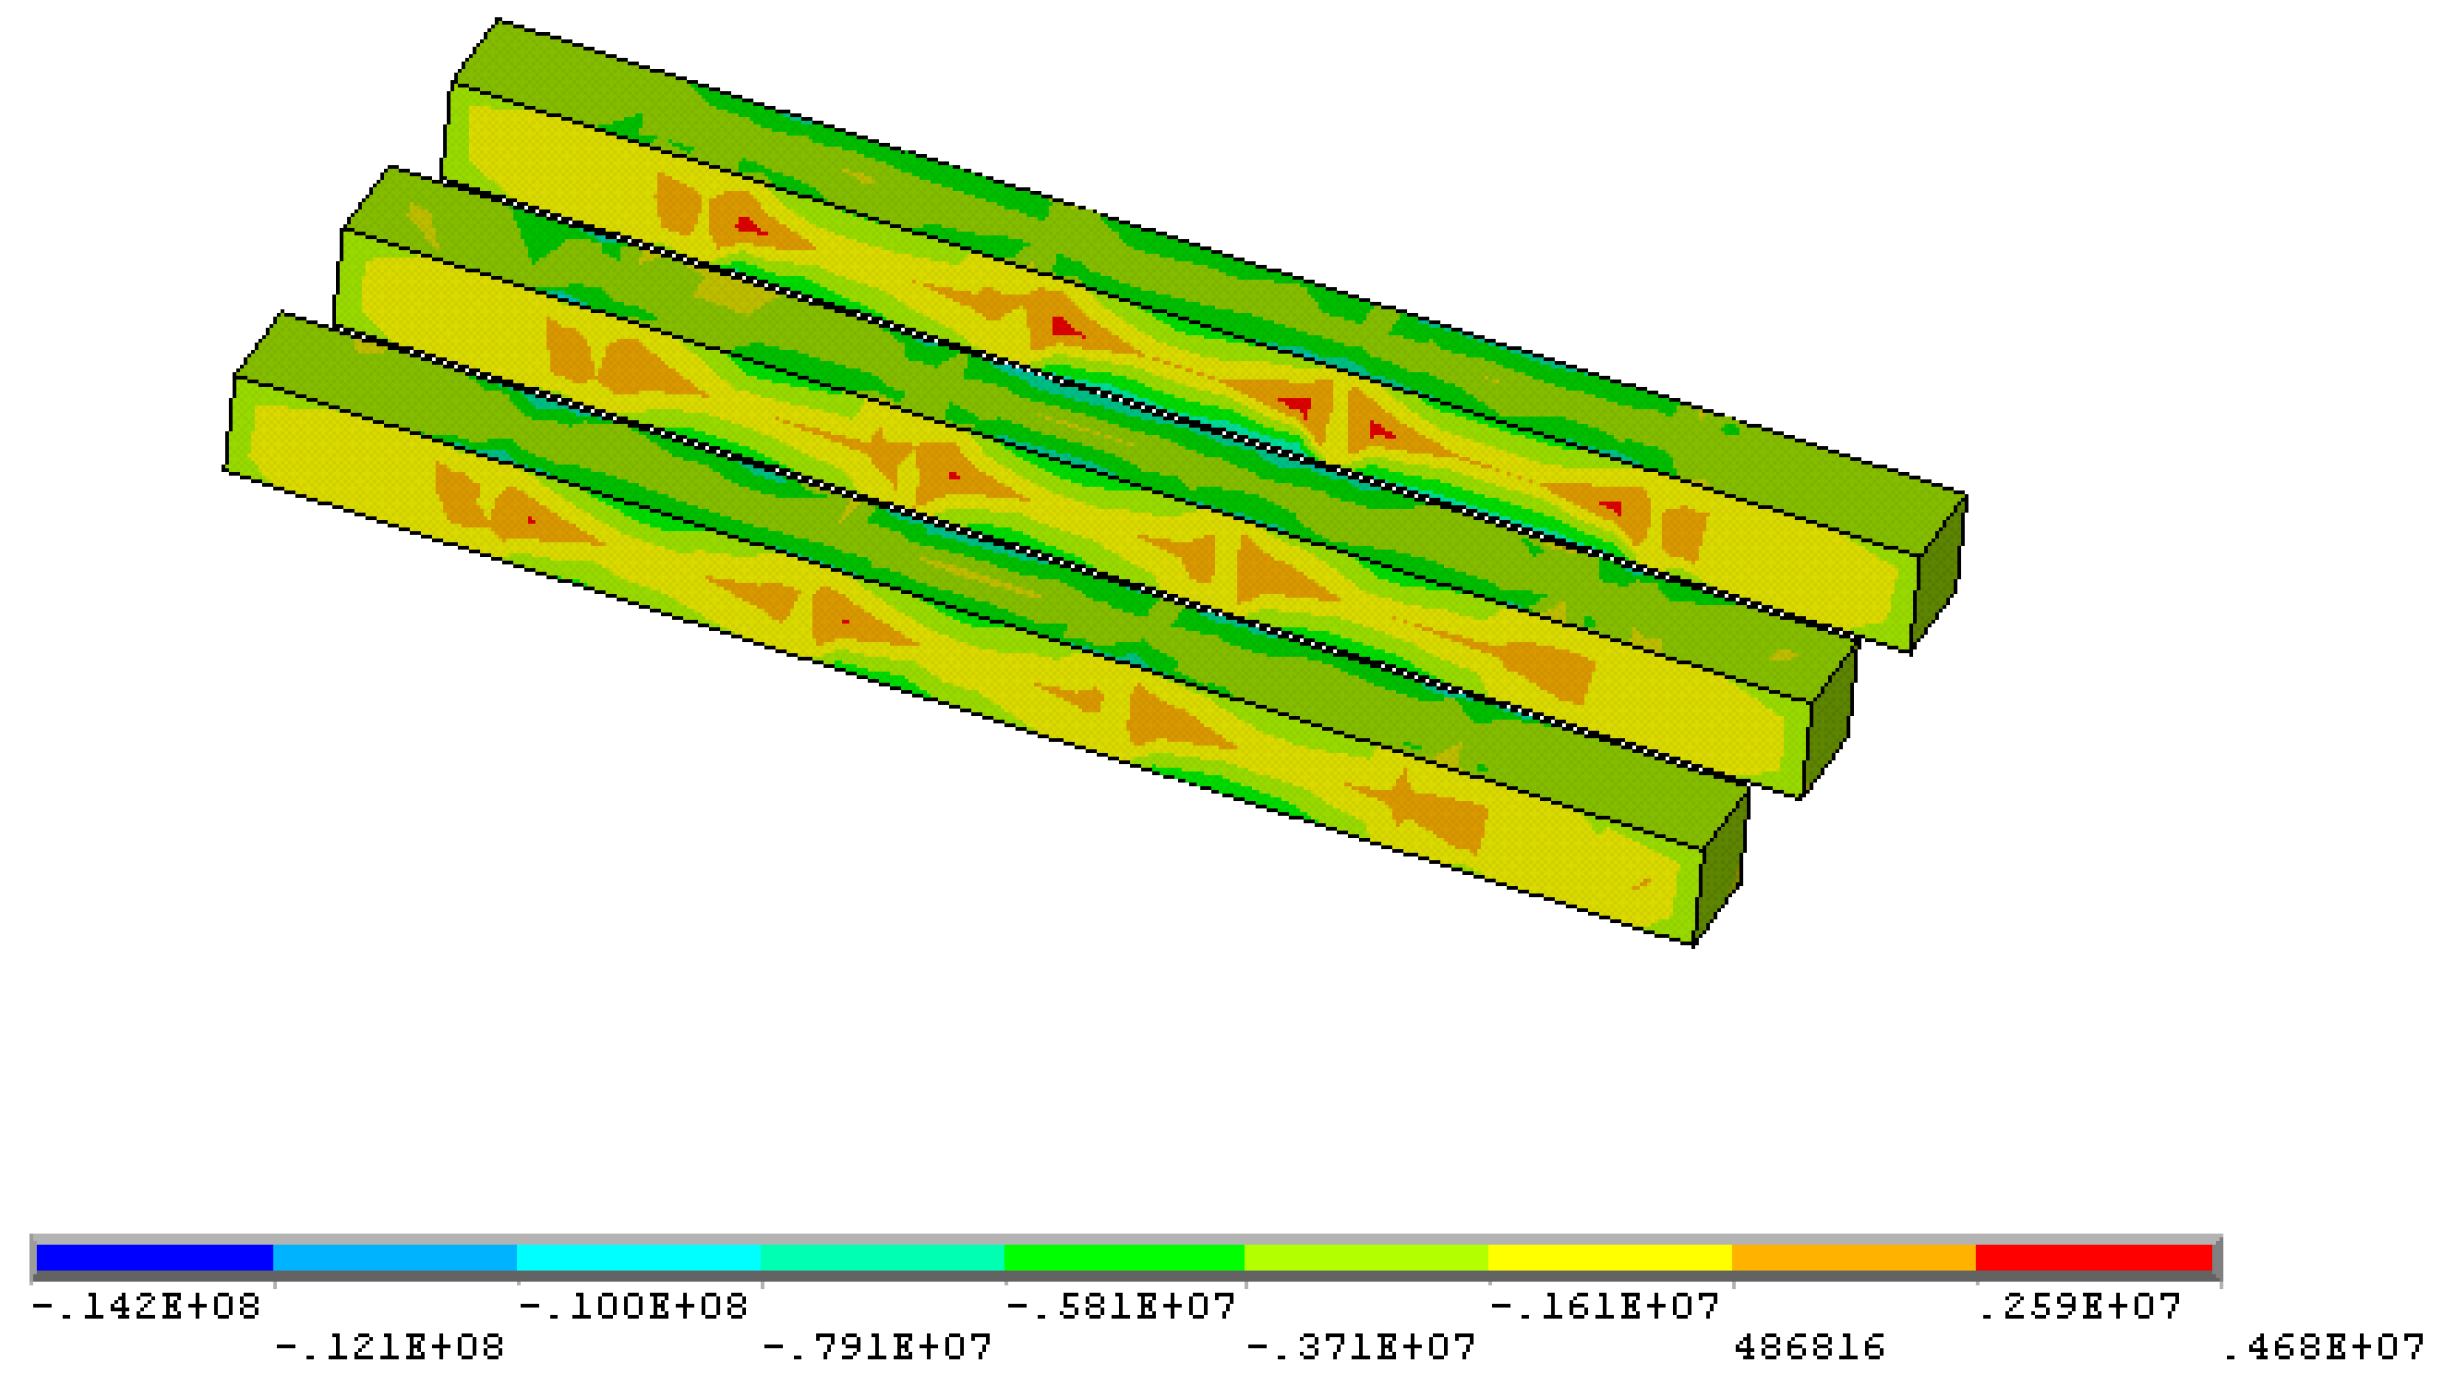
Figure 11.
Minimum principal stress distribution in the ore block at 1480 mL after mining the strip room (parameters before optimization: stope height 3 m, pillar diameter 3 m, pillar spacing 7 m, pillar row spacing 9 m).
Figure 11.
Minimum principal stress distribution in the ore block at 1480 mL after mining the strip room (parameters before optimization: stope height 3 m, pillar diameter 3 m, pillar spacing 7 m, pillar row spacing 9 m).
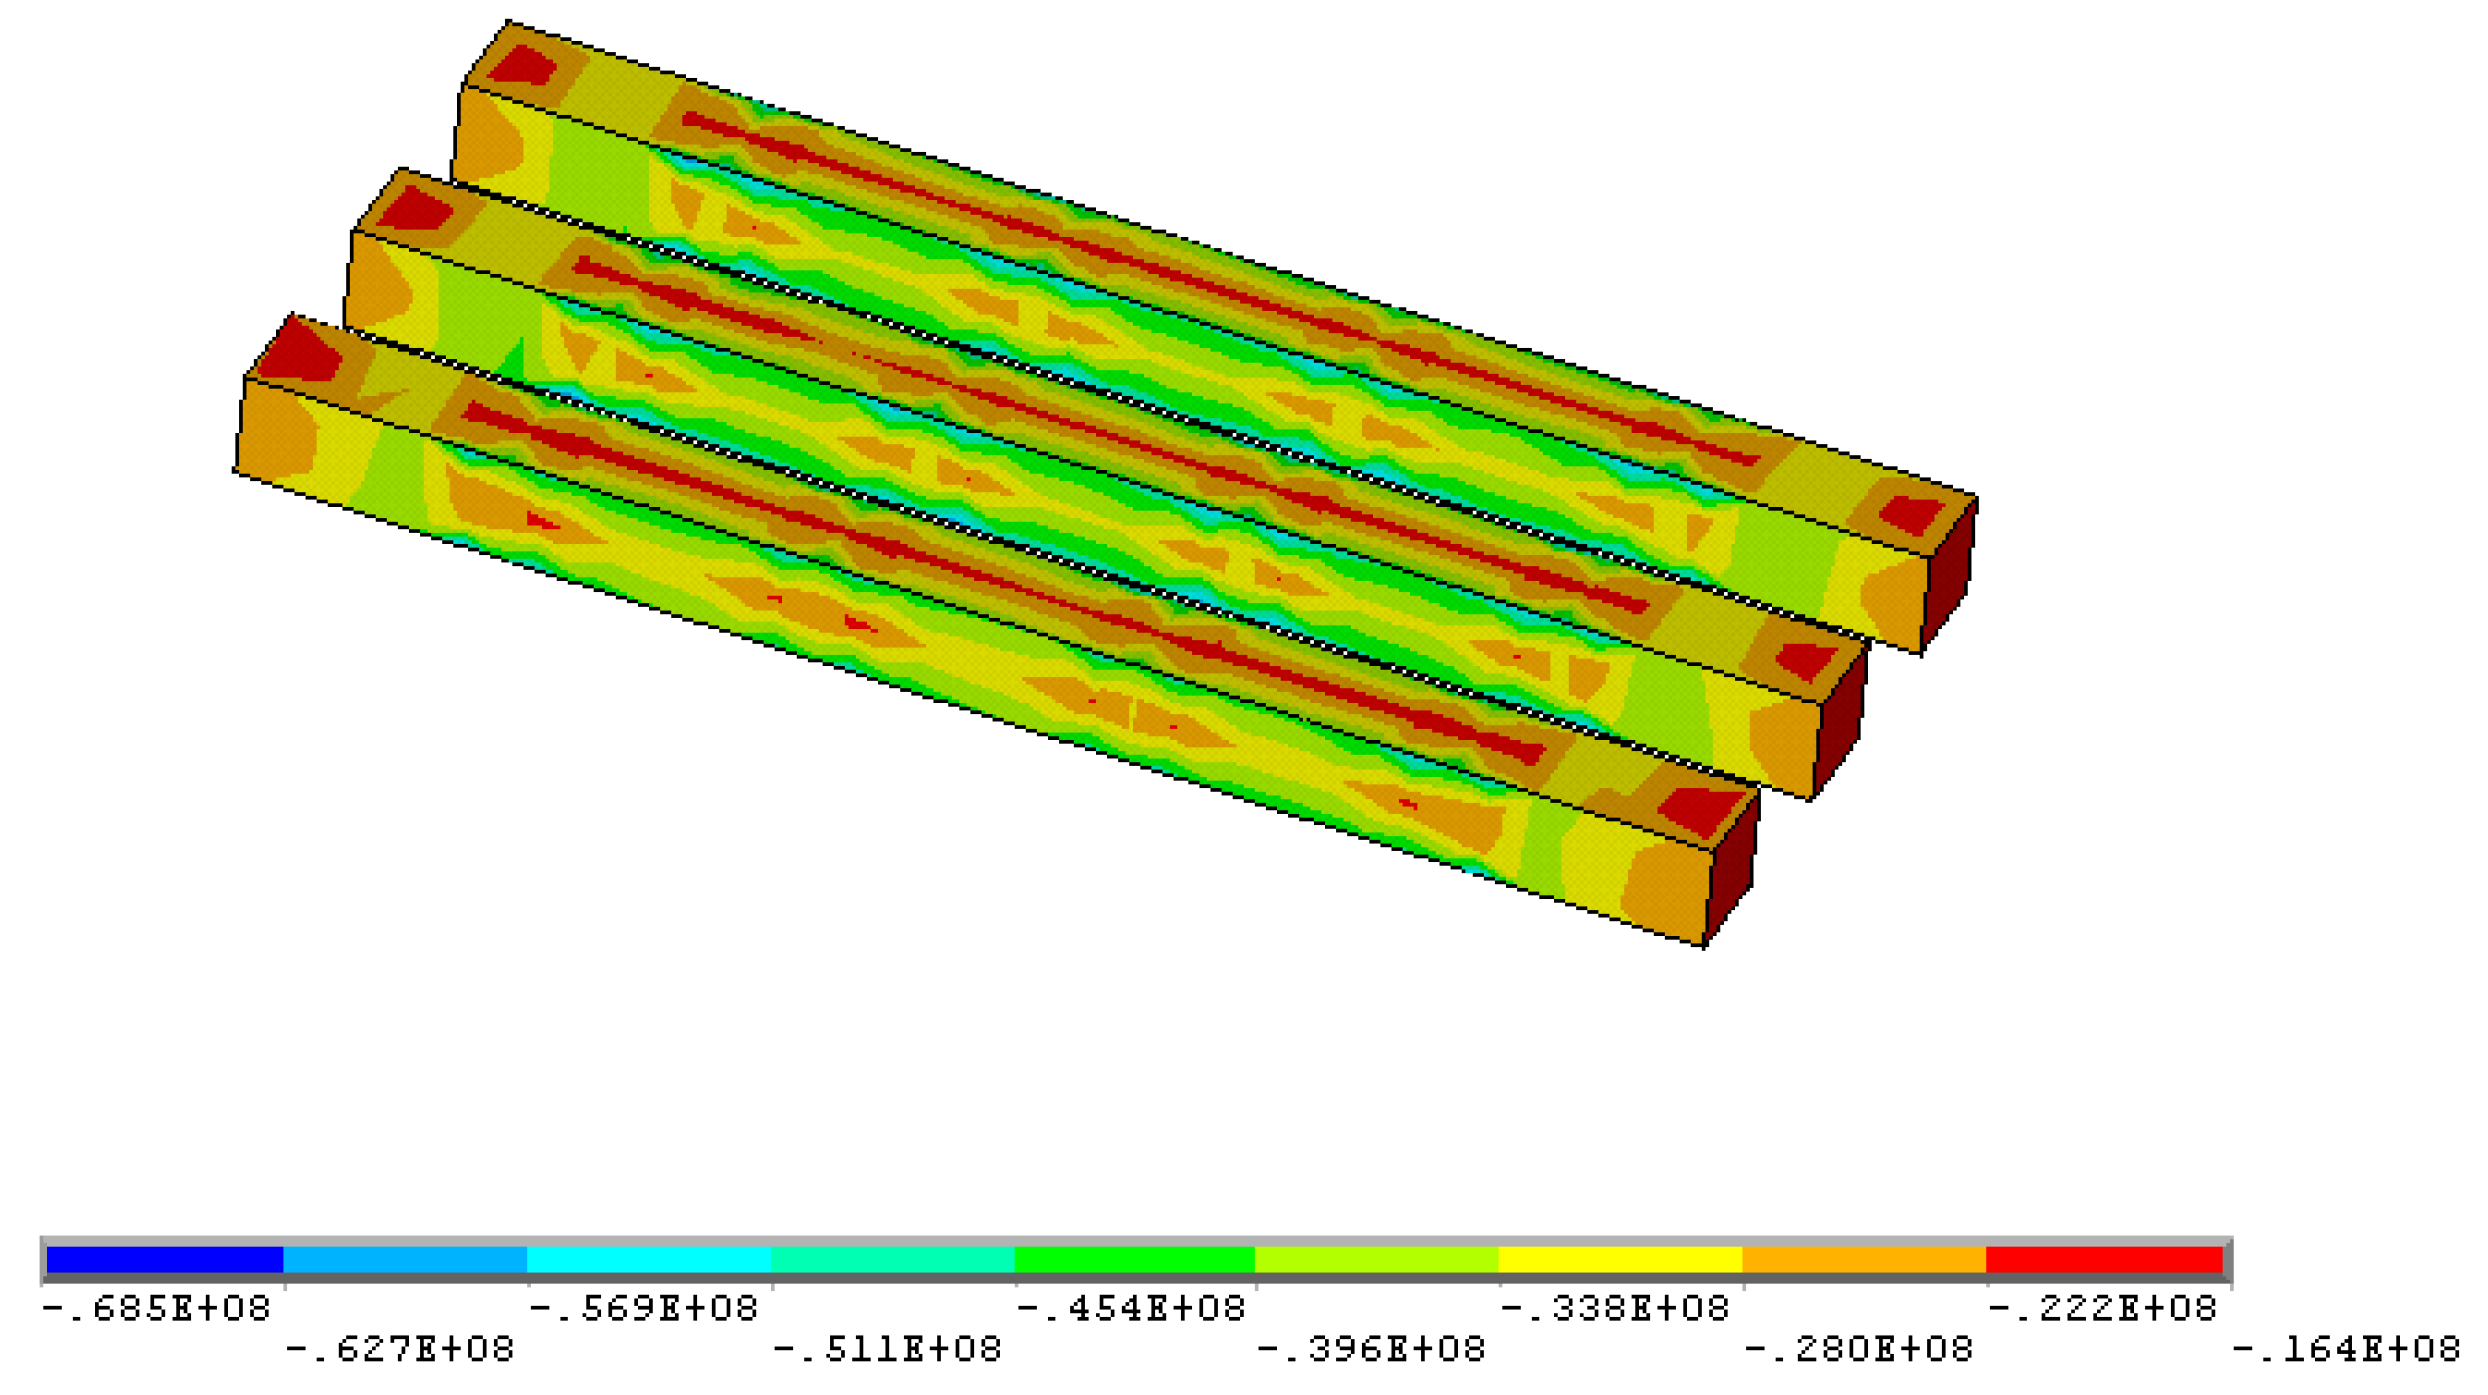
Figure 12.
Maximum principal stress distribution in the ore block at 1480 mL after mining of strip pillars (parameters before optimization: stope height 3 m, pillar diameter 3 m, pillar spacing 7 m, pillar row spacing 9 m).
Figure 12.
Maximum principal stress distribution in the ore block at 1480 mL after mining of strip pillars (parameters before optimization: stope height 3 m, pillar diameter 3 m, pillar spacing 7 m, pillar row spacing 9 m).
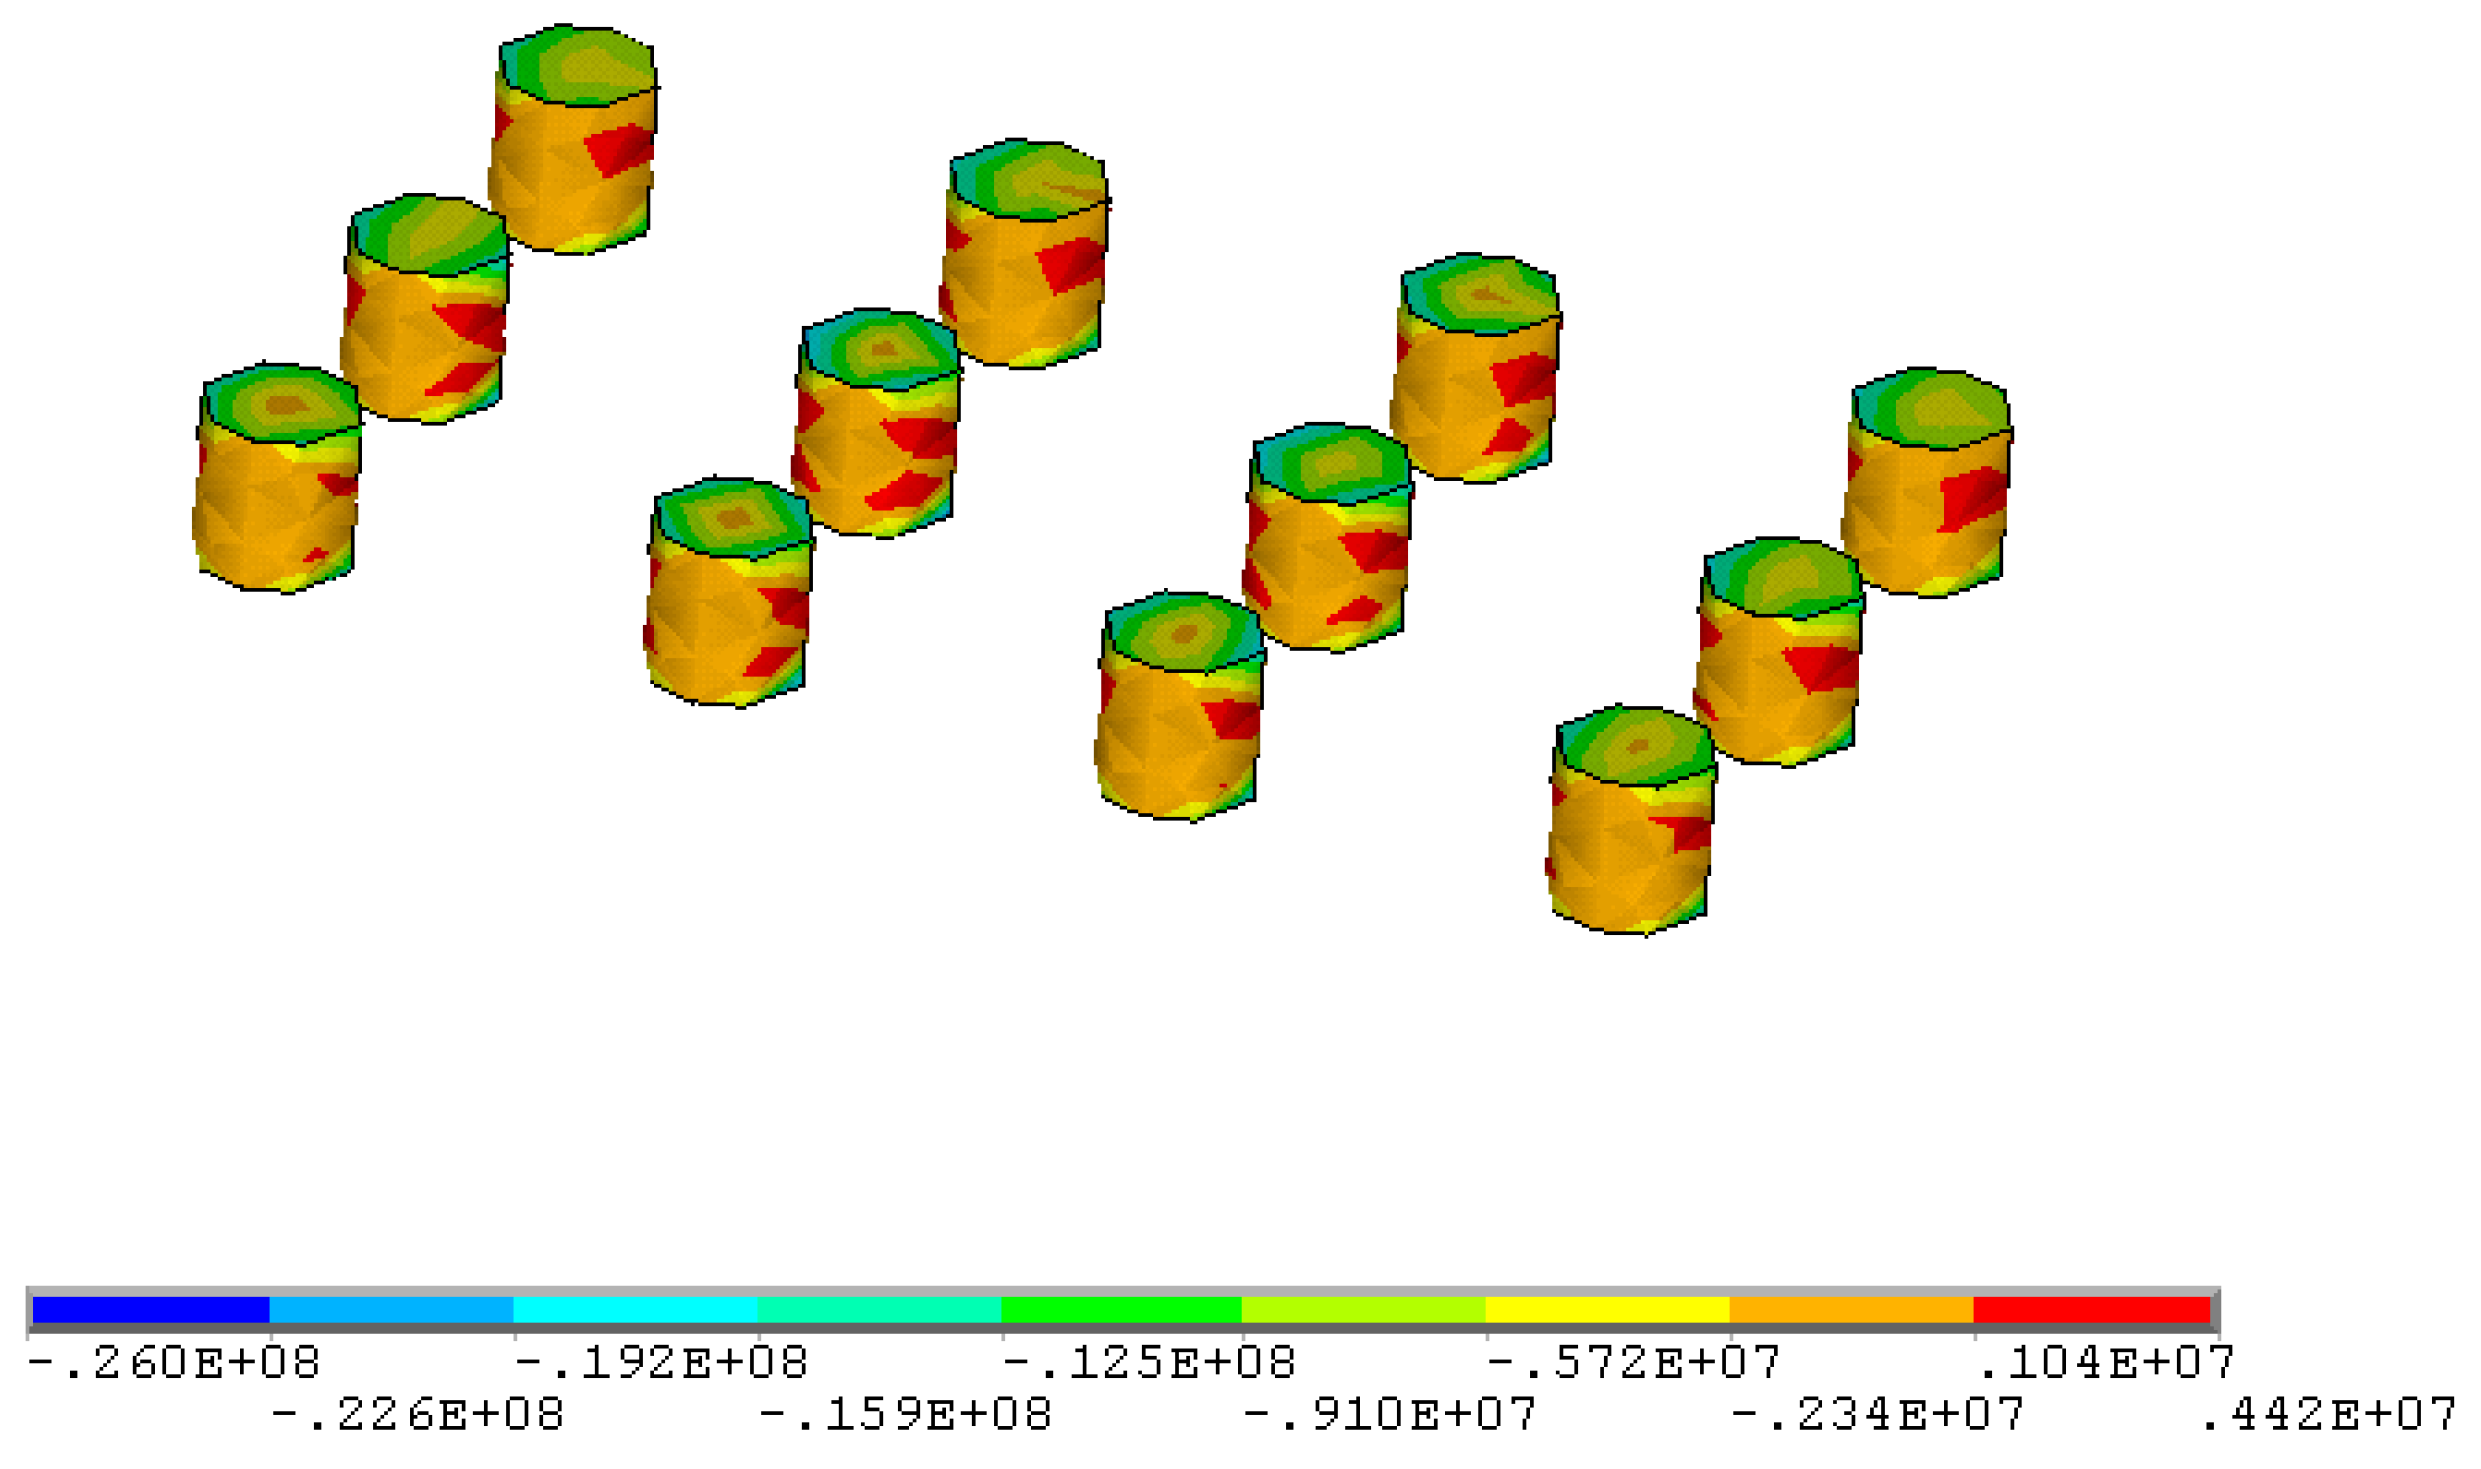
Figure 13.
Minimum principal stress distribution in the ore block at 1480 mL after mining of strip pillars (parameters before optimization: stope height 3 m, pillar diameter 3 m, pillar spacing 7 m, pillar row spacing 9 m).
Figure 13.
Minimum principal stress distribution in the ore block at 1480 mL after mining of strip pillars (parameters before optimization: stope height 3 m, pillar diameter 3 m, pillar spacing 7 m, pillar row spacing 9 m).
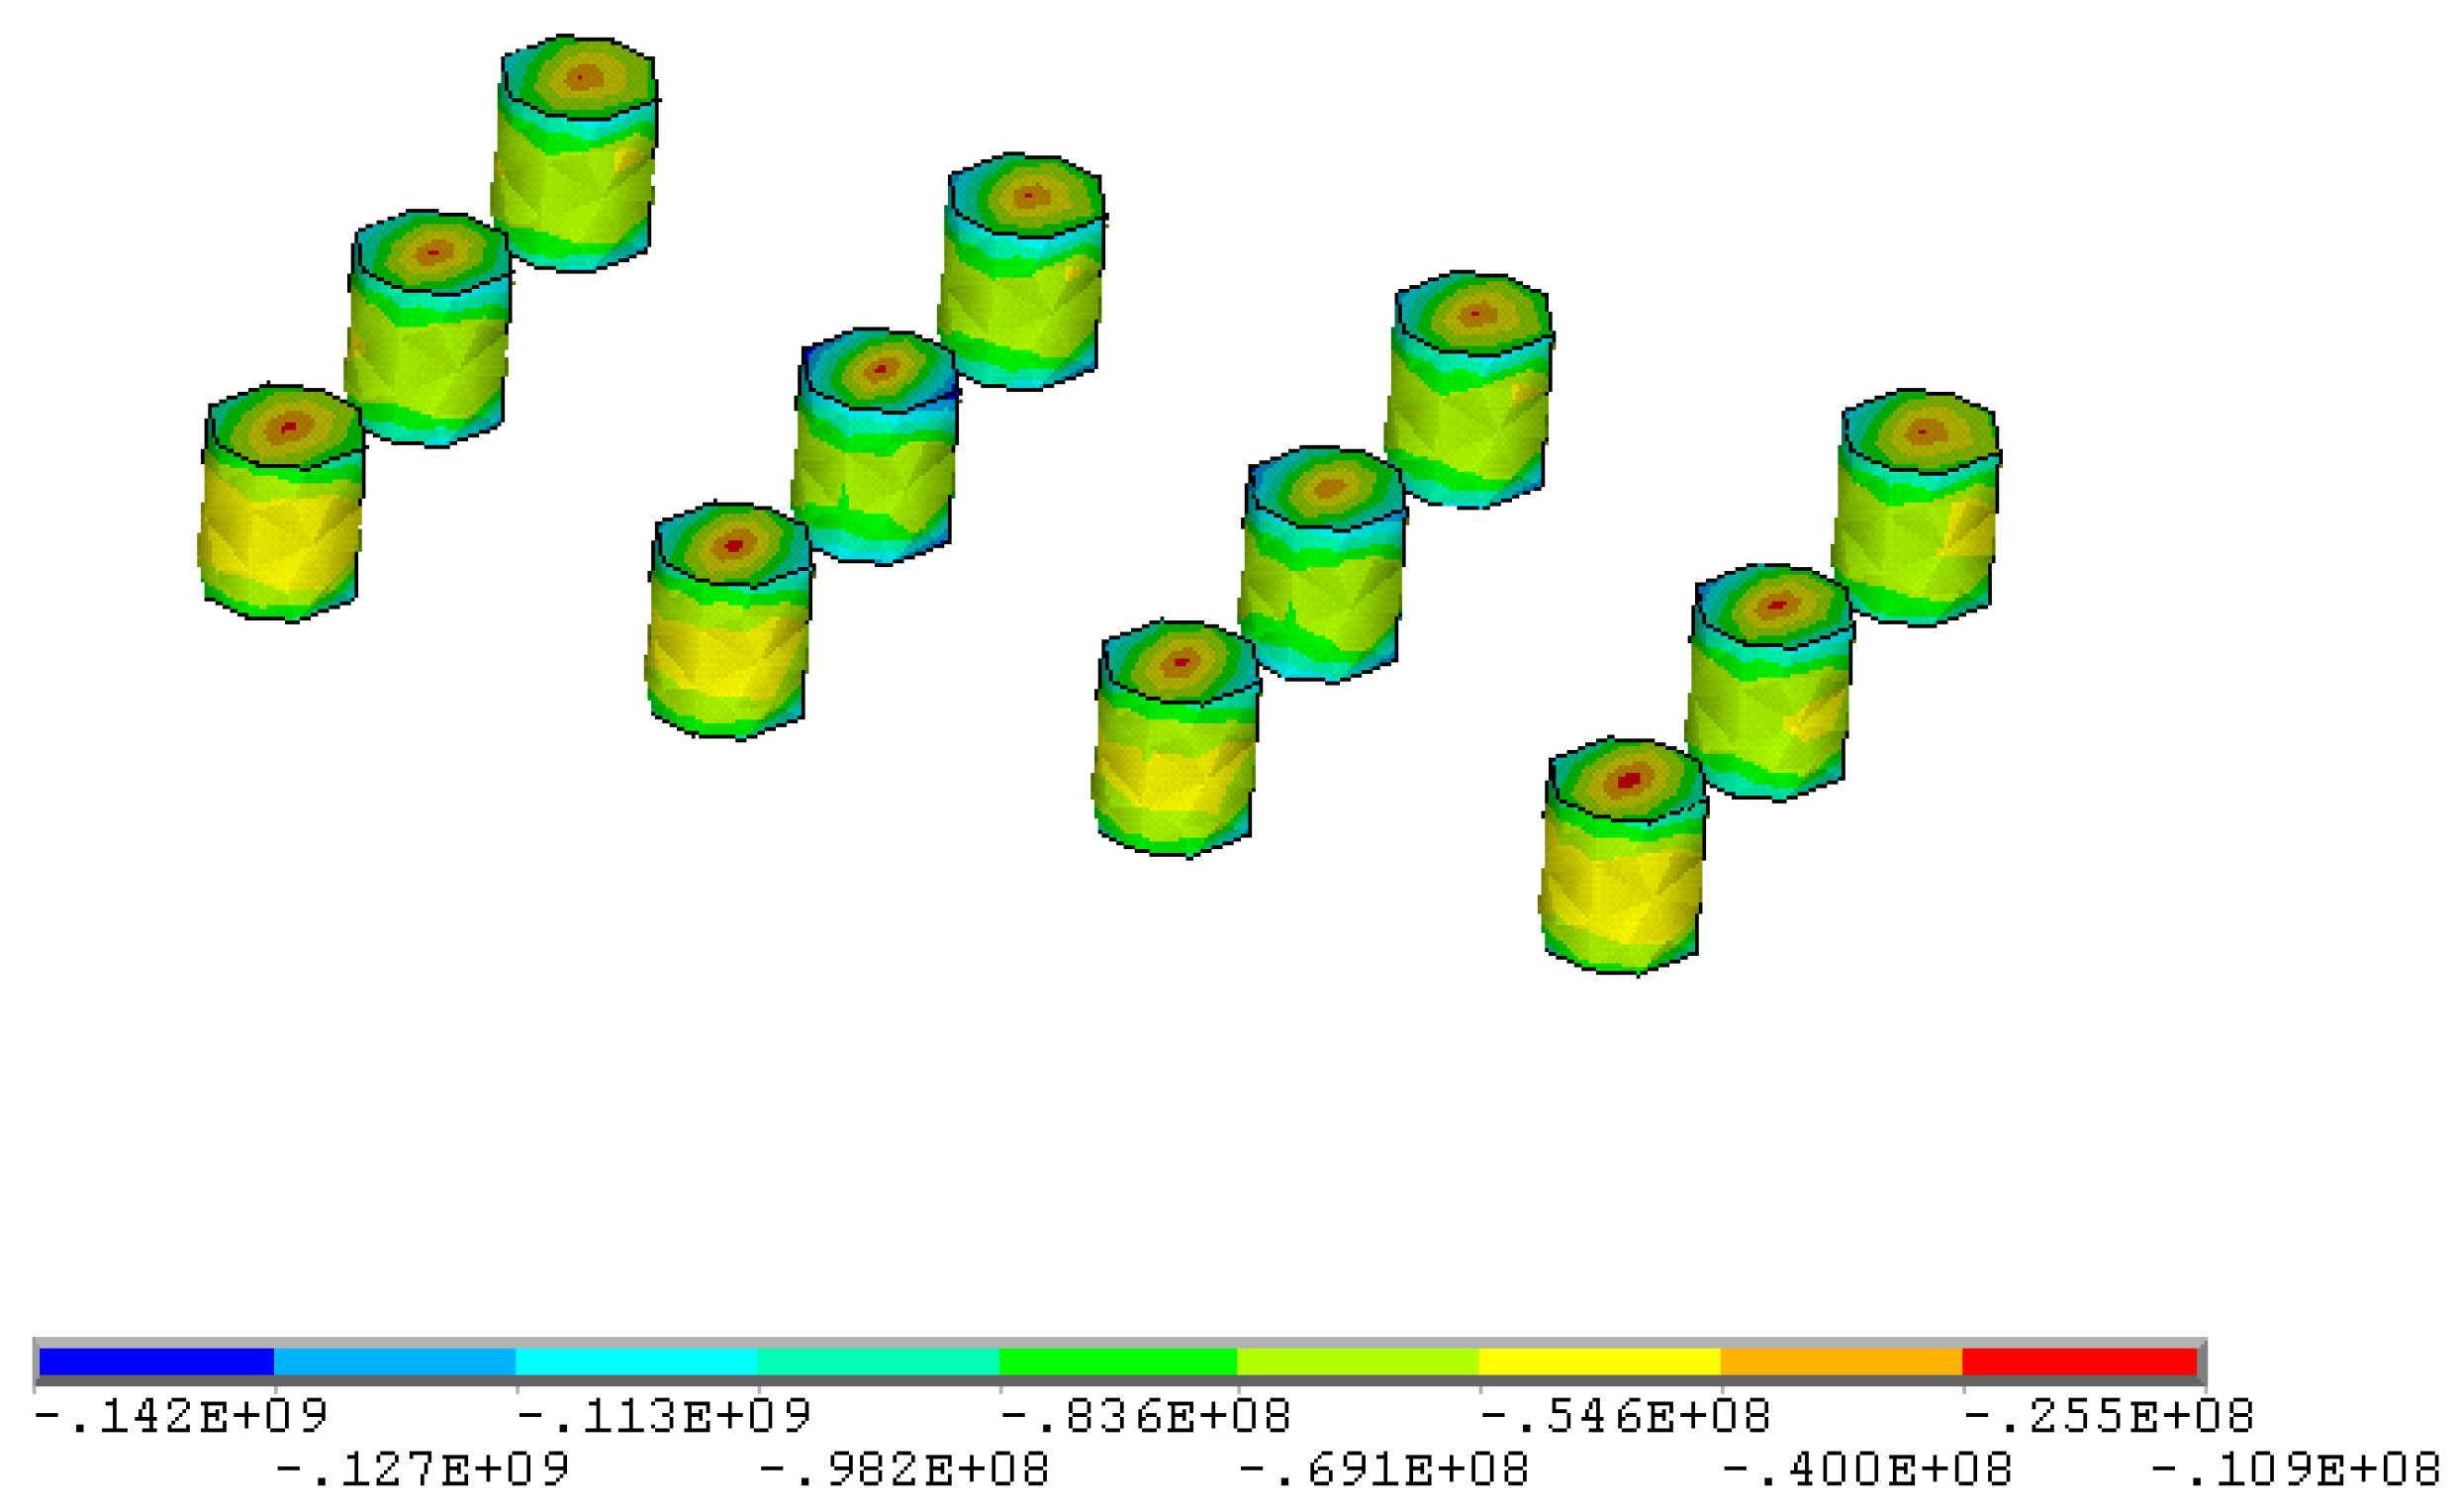
Figure 14.
Nine schemes of room and pillar configurations (a) Scheme 1; (b) Scheme 2; (c) Scheme 3; (d) Scheme 4; (e) Scheme 5; (f) Scheme 6; (g) Scheme 7; (h) Scheme 8; (i) Scheme 9.
Figure 14.
Nine schemes of room and pillar configurations (a) Scheme 1; (b) Scheme 2; (c) Scheme 3; (d) Scheme 4; (e) Scheme 5; (f) Scheme 6; (g) Scheme 7; (h) Scheme 8; (i) Scheme 9.

Figure 15.
Maximum principal stress distribution of scheme 1 pillars at 1480 mL (parameters of scheme 1: stope height 2.5 m, pillar diameter 2 m, pillar spacing 4 m, pillar row spacing 6 m).
Figure 15.
Maximum principal stress distribution of scheme 1 pillars at 1480 mL (parameters of scheme 1: stope height 2.5 m, pillar diameter 2 m, pillar spacing 4 m, pillar row spacing 6 m).
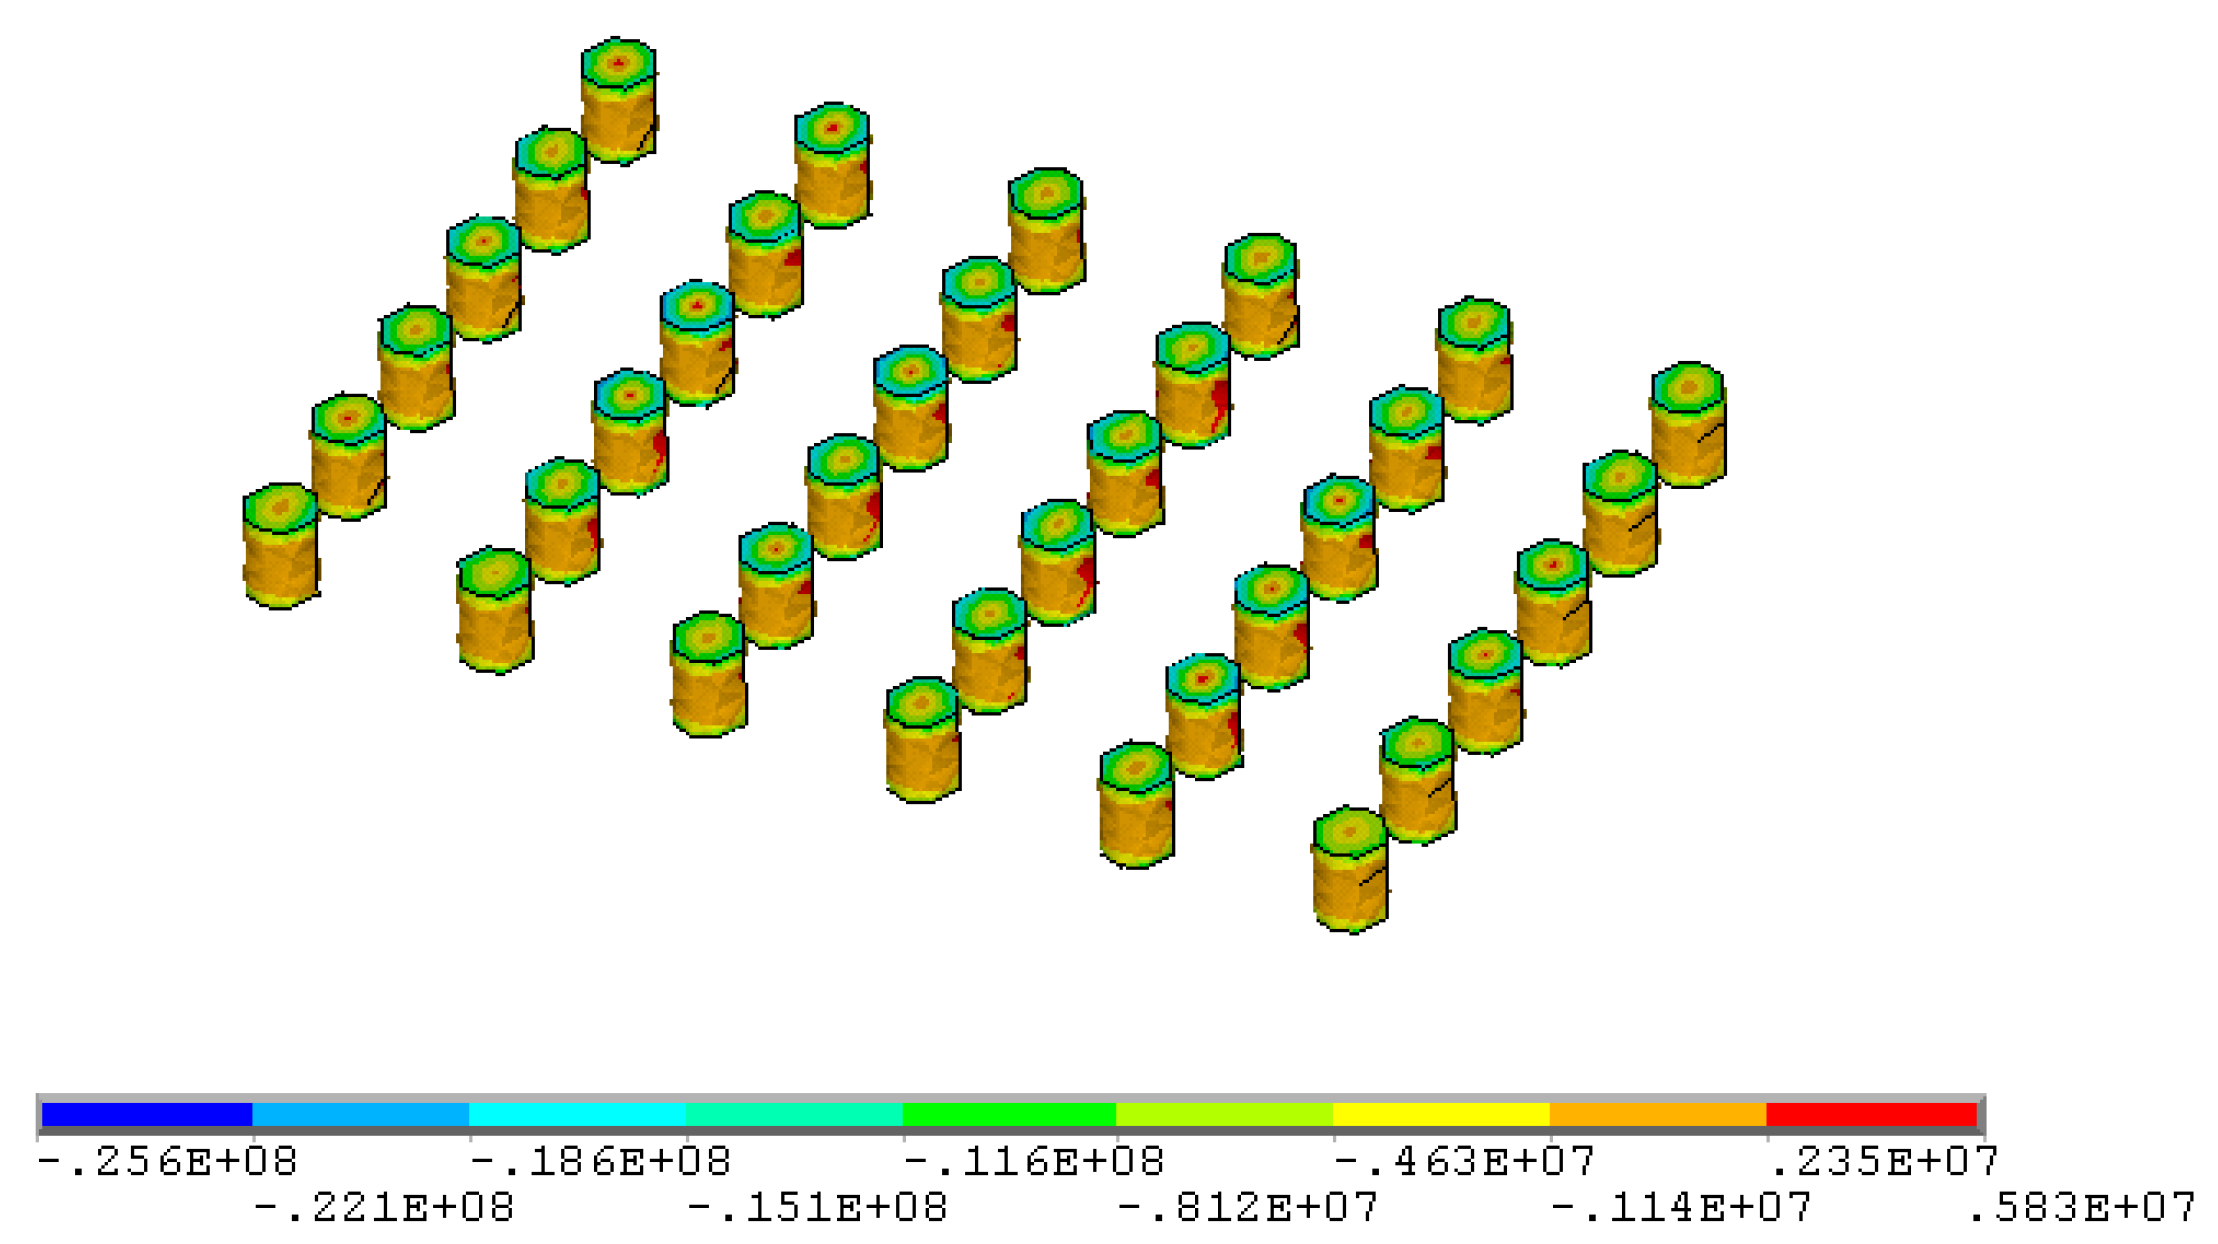
Figure 16.
Maximum principal stress distribution in the middle of the pillar at 1480 mL of scheme 1 (parameters of scheme 1: stope height 2.5 m, pillar diameter 2 m, pillar spacing 4 m, pillar row spacing 6 m).
Figure 16.
Maximum principal stress distribution in the middle of the pillar at 1480 mL of scheme 1 (parameters of scheme 1: stope height 2.5 m, pillar diameter 2 m, pillar spacing 4 m, pillar row spacing 6 m).
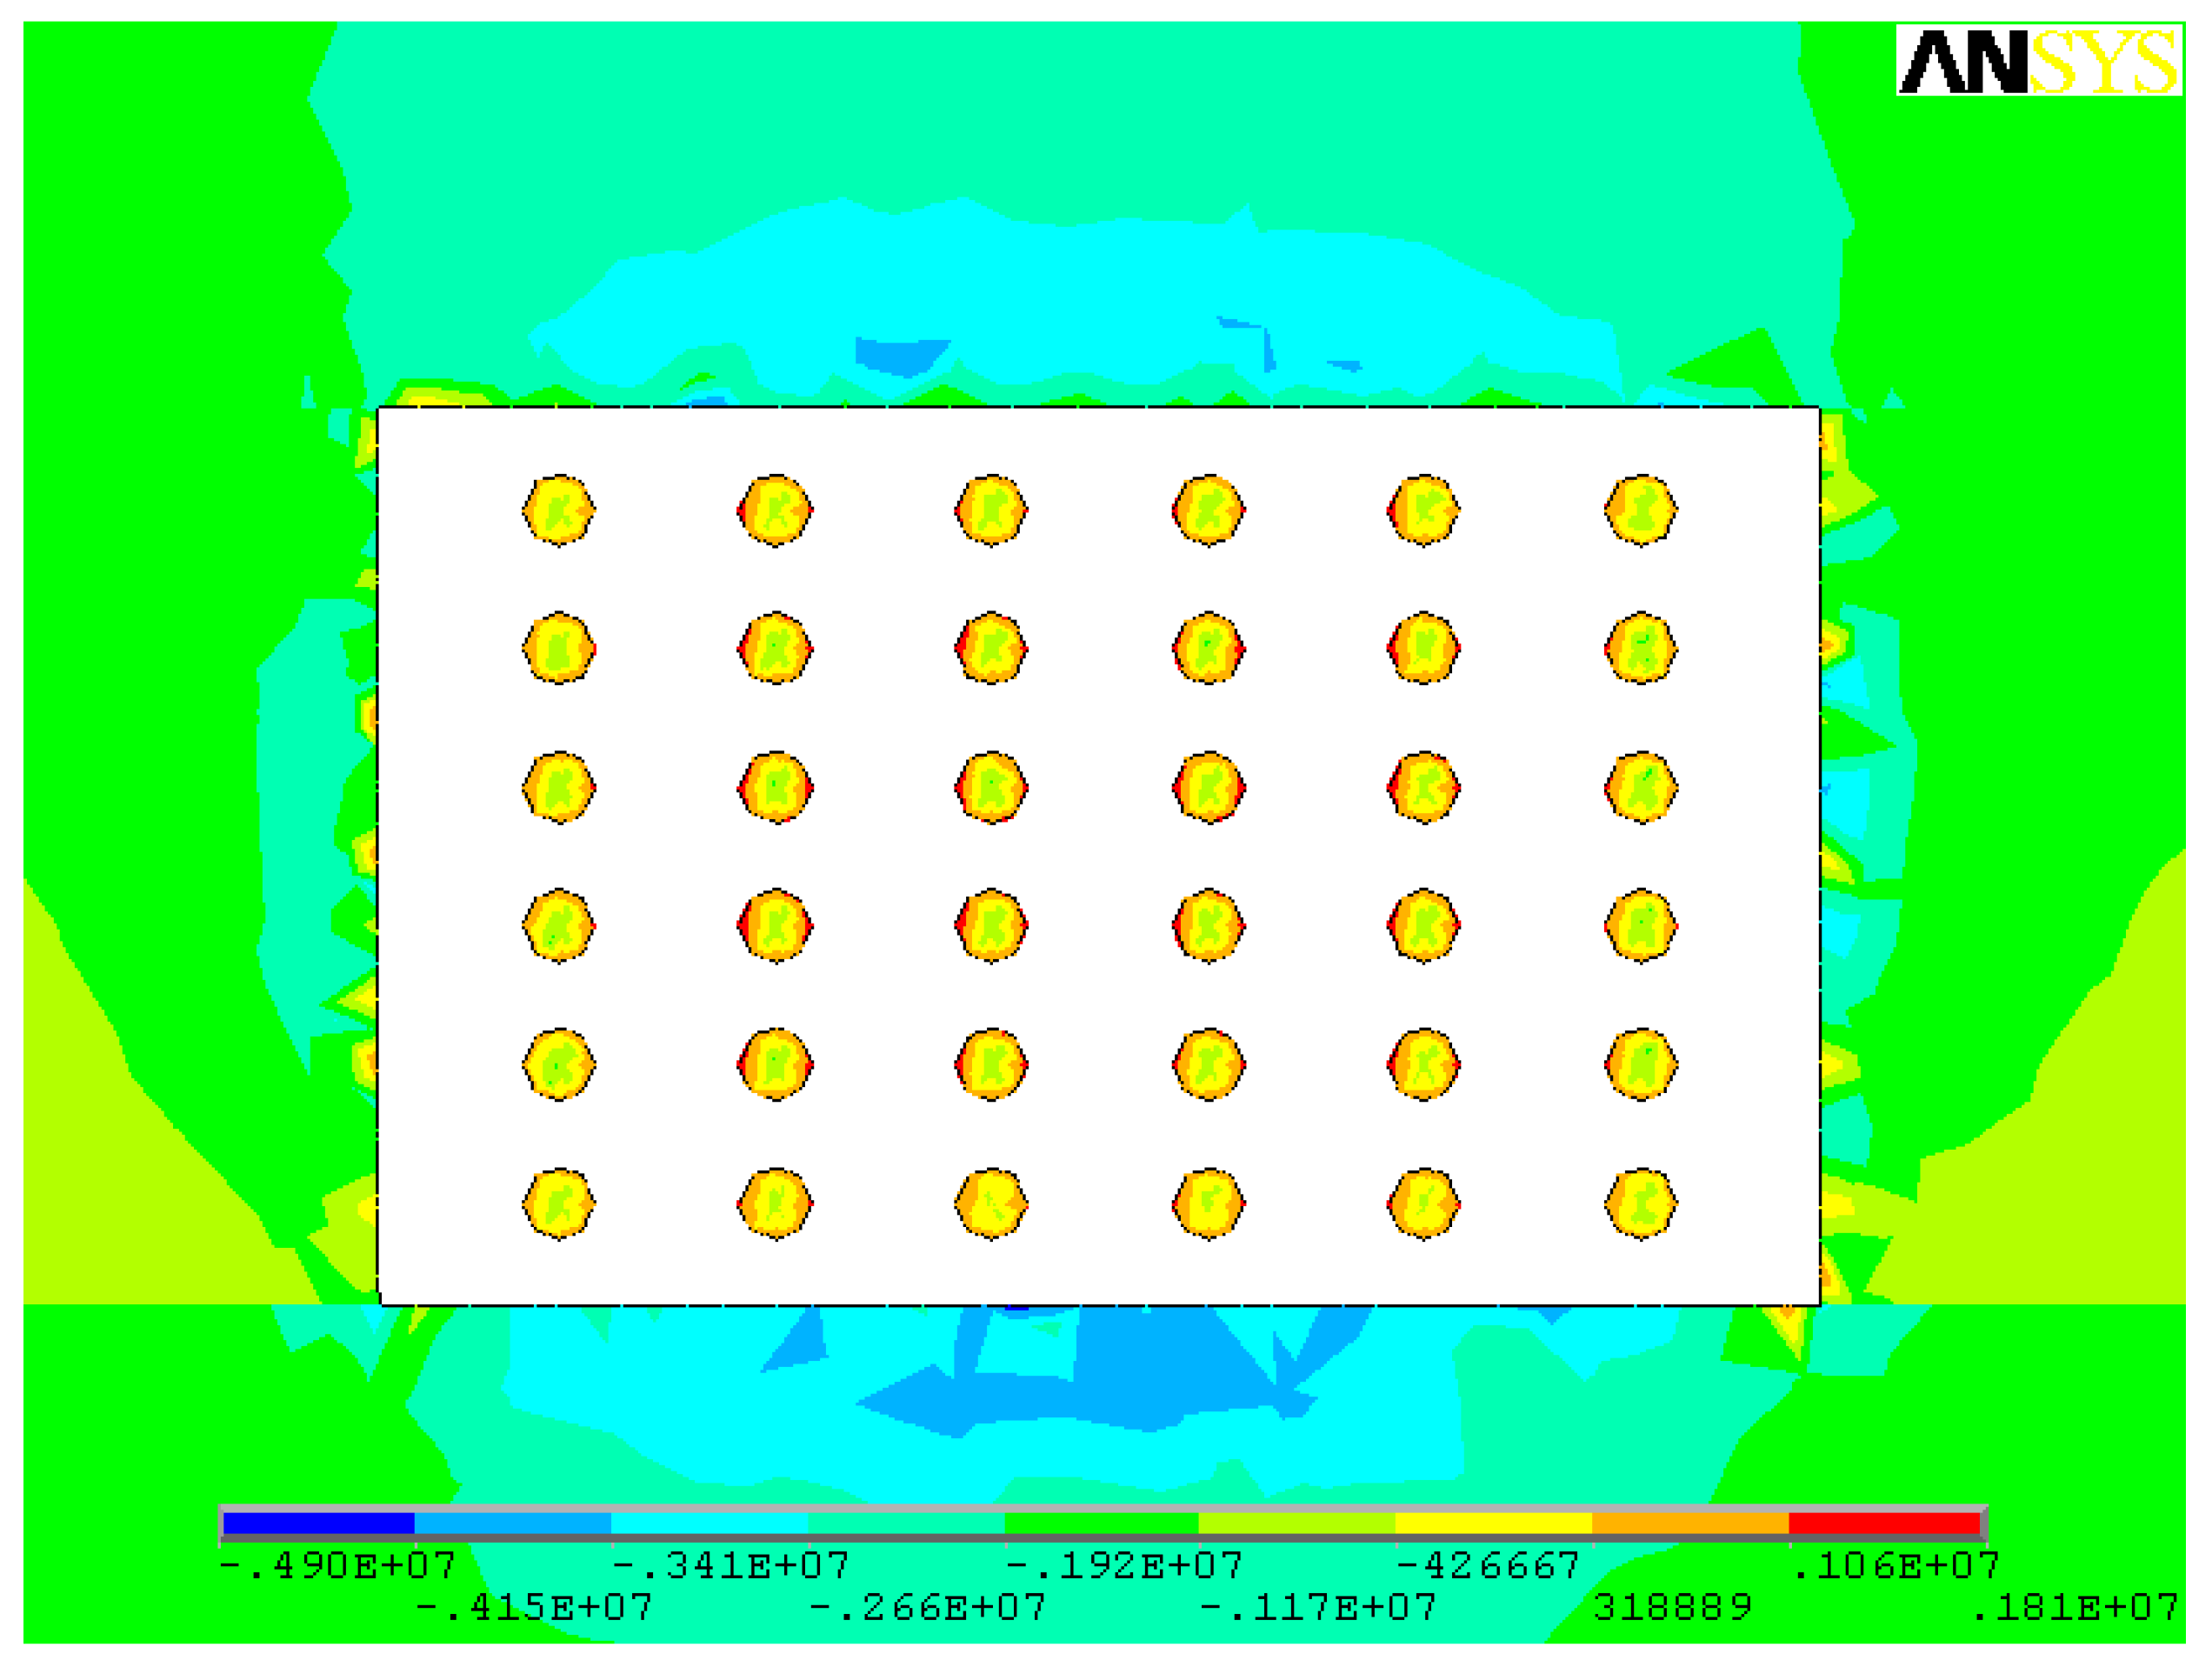
Figure 17.
Minimum principal stress distribution of scheme 1 pillars at 1480 mL (parameters of scheme 1: stope height 2.5 m, pillar diameter 2 m, pillar spacing 4 m, pillar row spacing 6 m).
Figure 17.
Minimum principal stress distribution of scheme 1 pillars at 1480 mL (parameters of scheme 1: stope height 2.5 m, pillar diameter 2 m, pillar spacing 4 m, pillar row spacing 6 m).
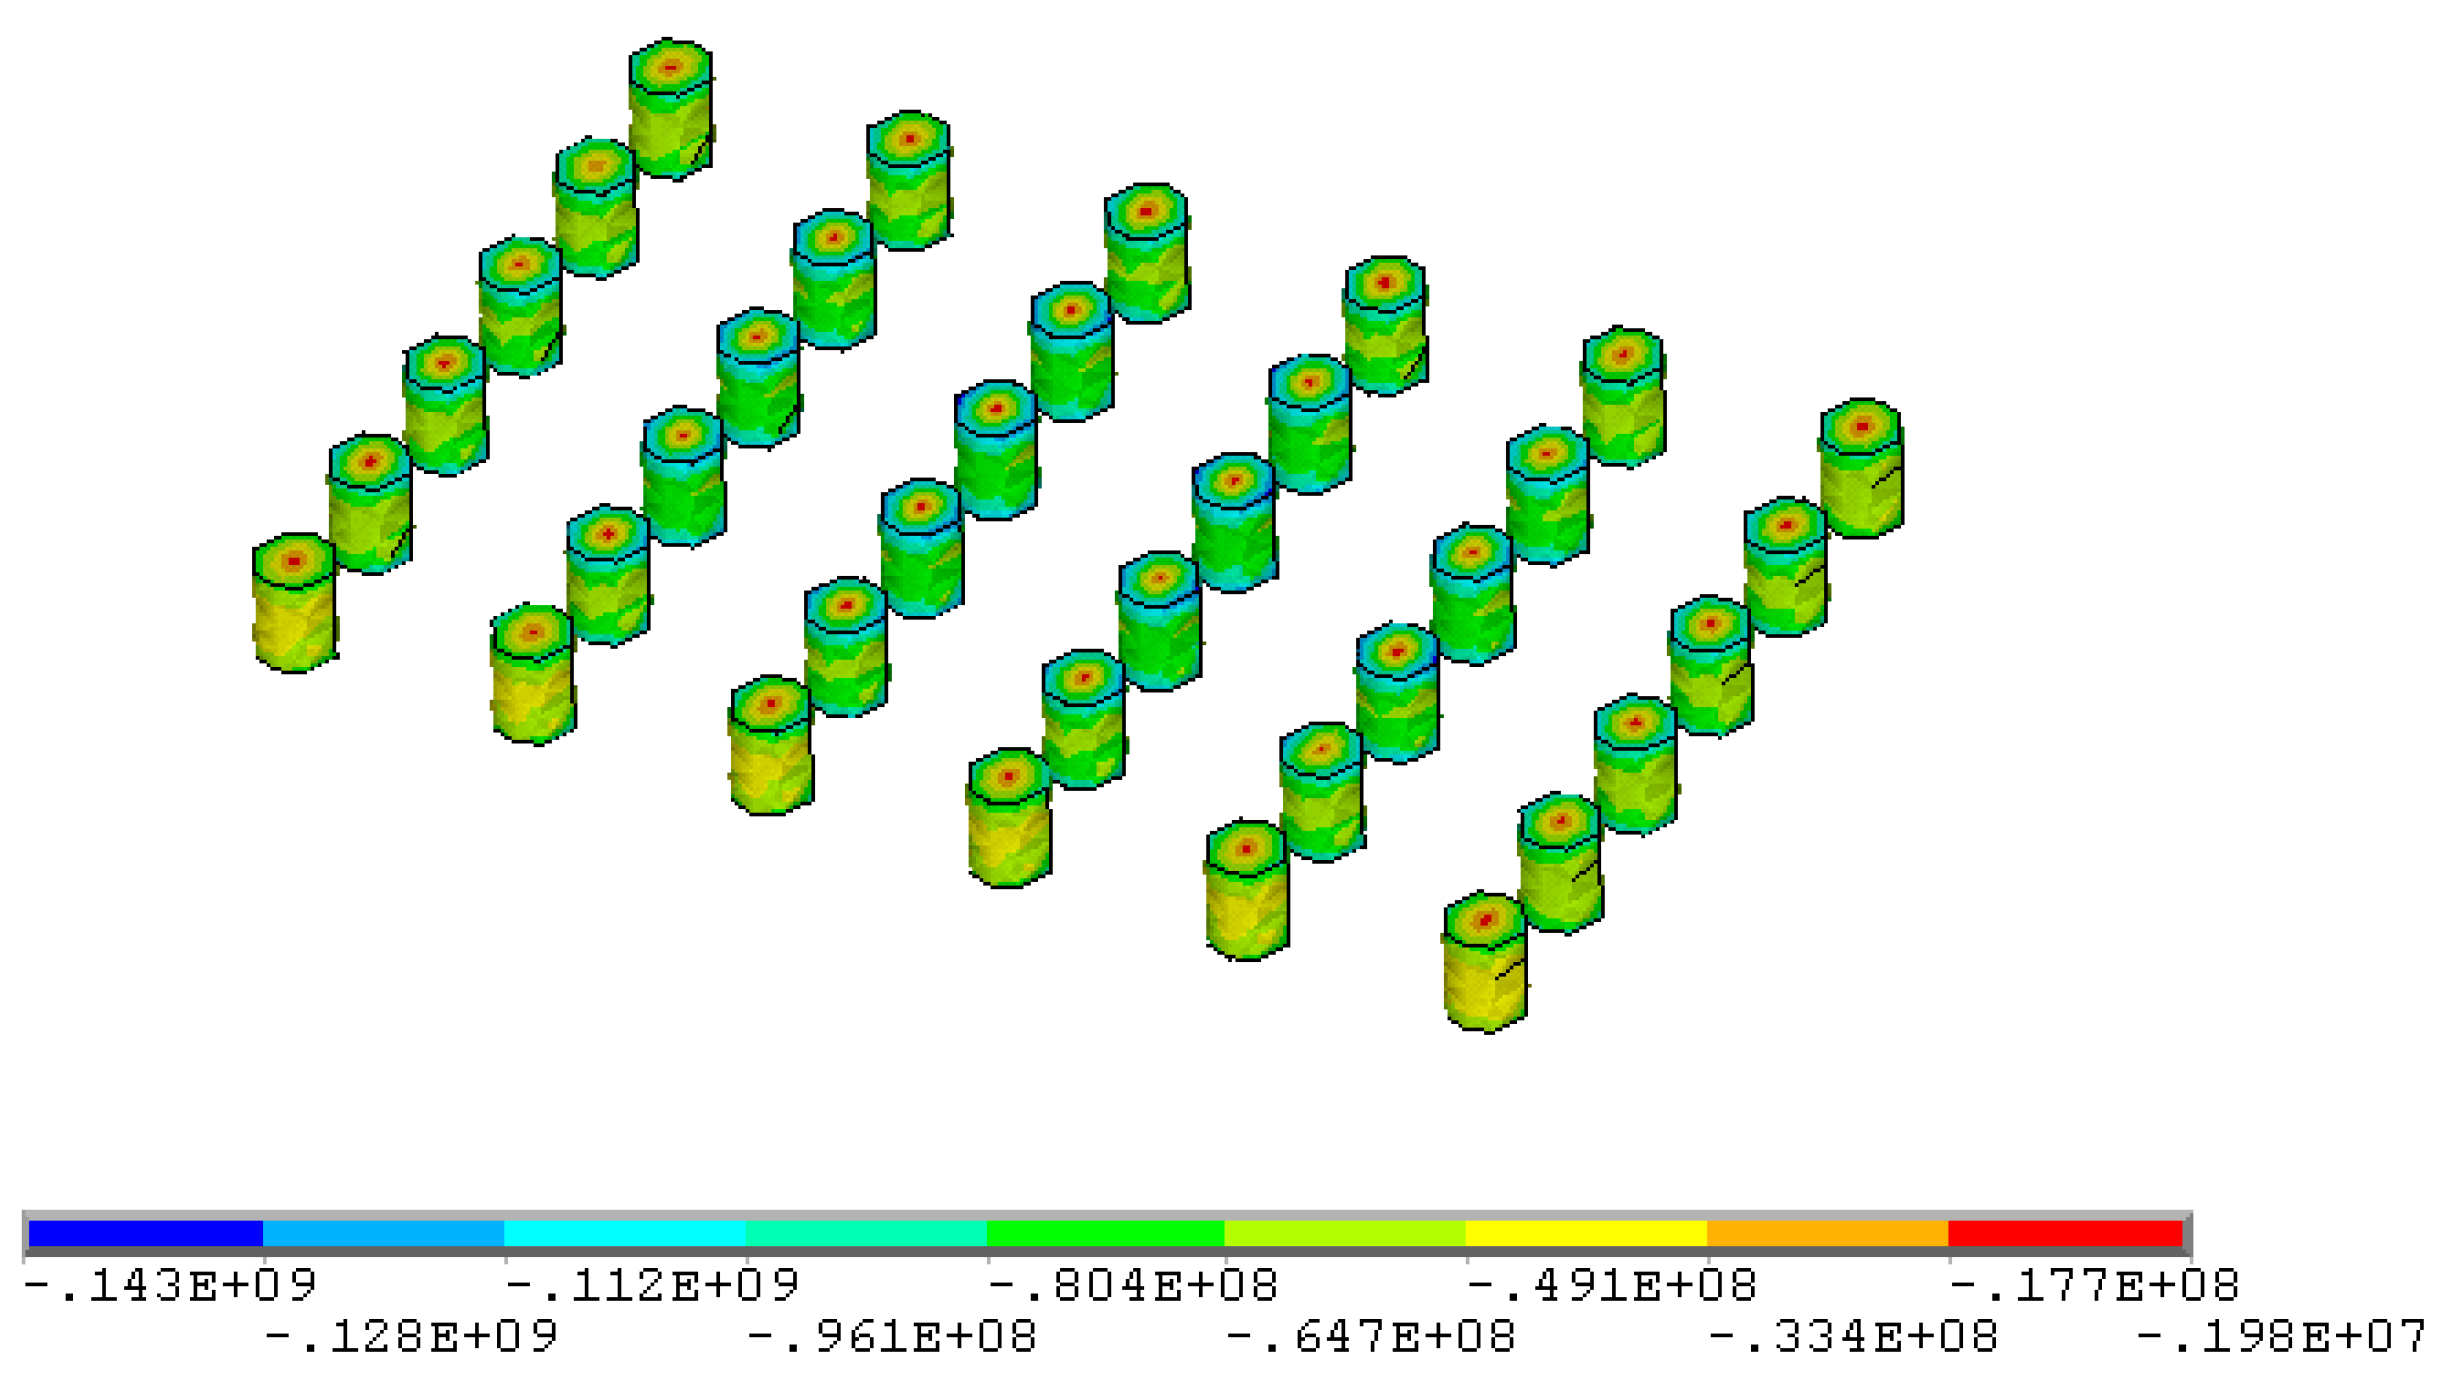
Figure 18.
Minimum principal stress distribution in the middle of the pillar at 1480 mL of scheme 1 (parameters of scheme 1: stope height 2.5 m, pillar diameter 2 m, pillar spacing 4 m, pillar row spacing 6 m).
Figure 18.
Minimum principal stress distribution in the middle of the pillar at 1480 mL of scheme 1 (parameters of scheme 1: stope height 2.5 m, pillar diameter 2 m, pillar spacing 4 m, pillar row spacing 6 m).
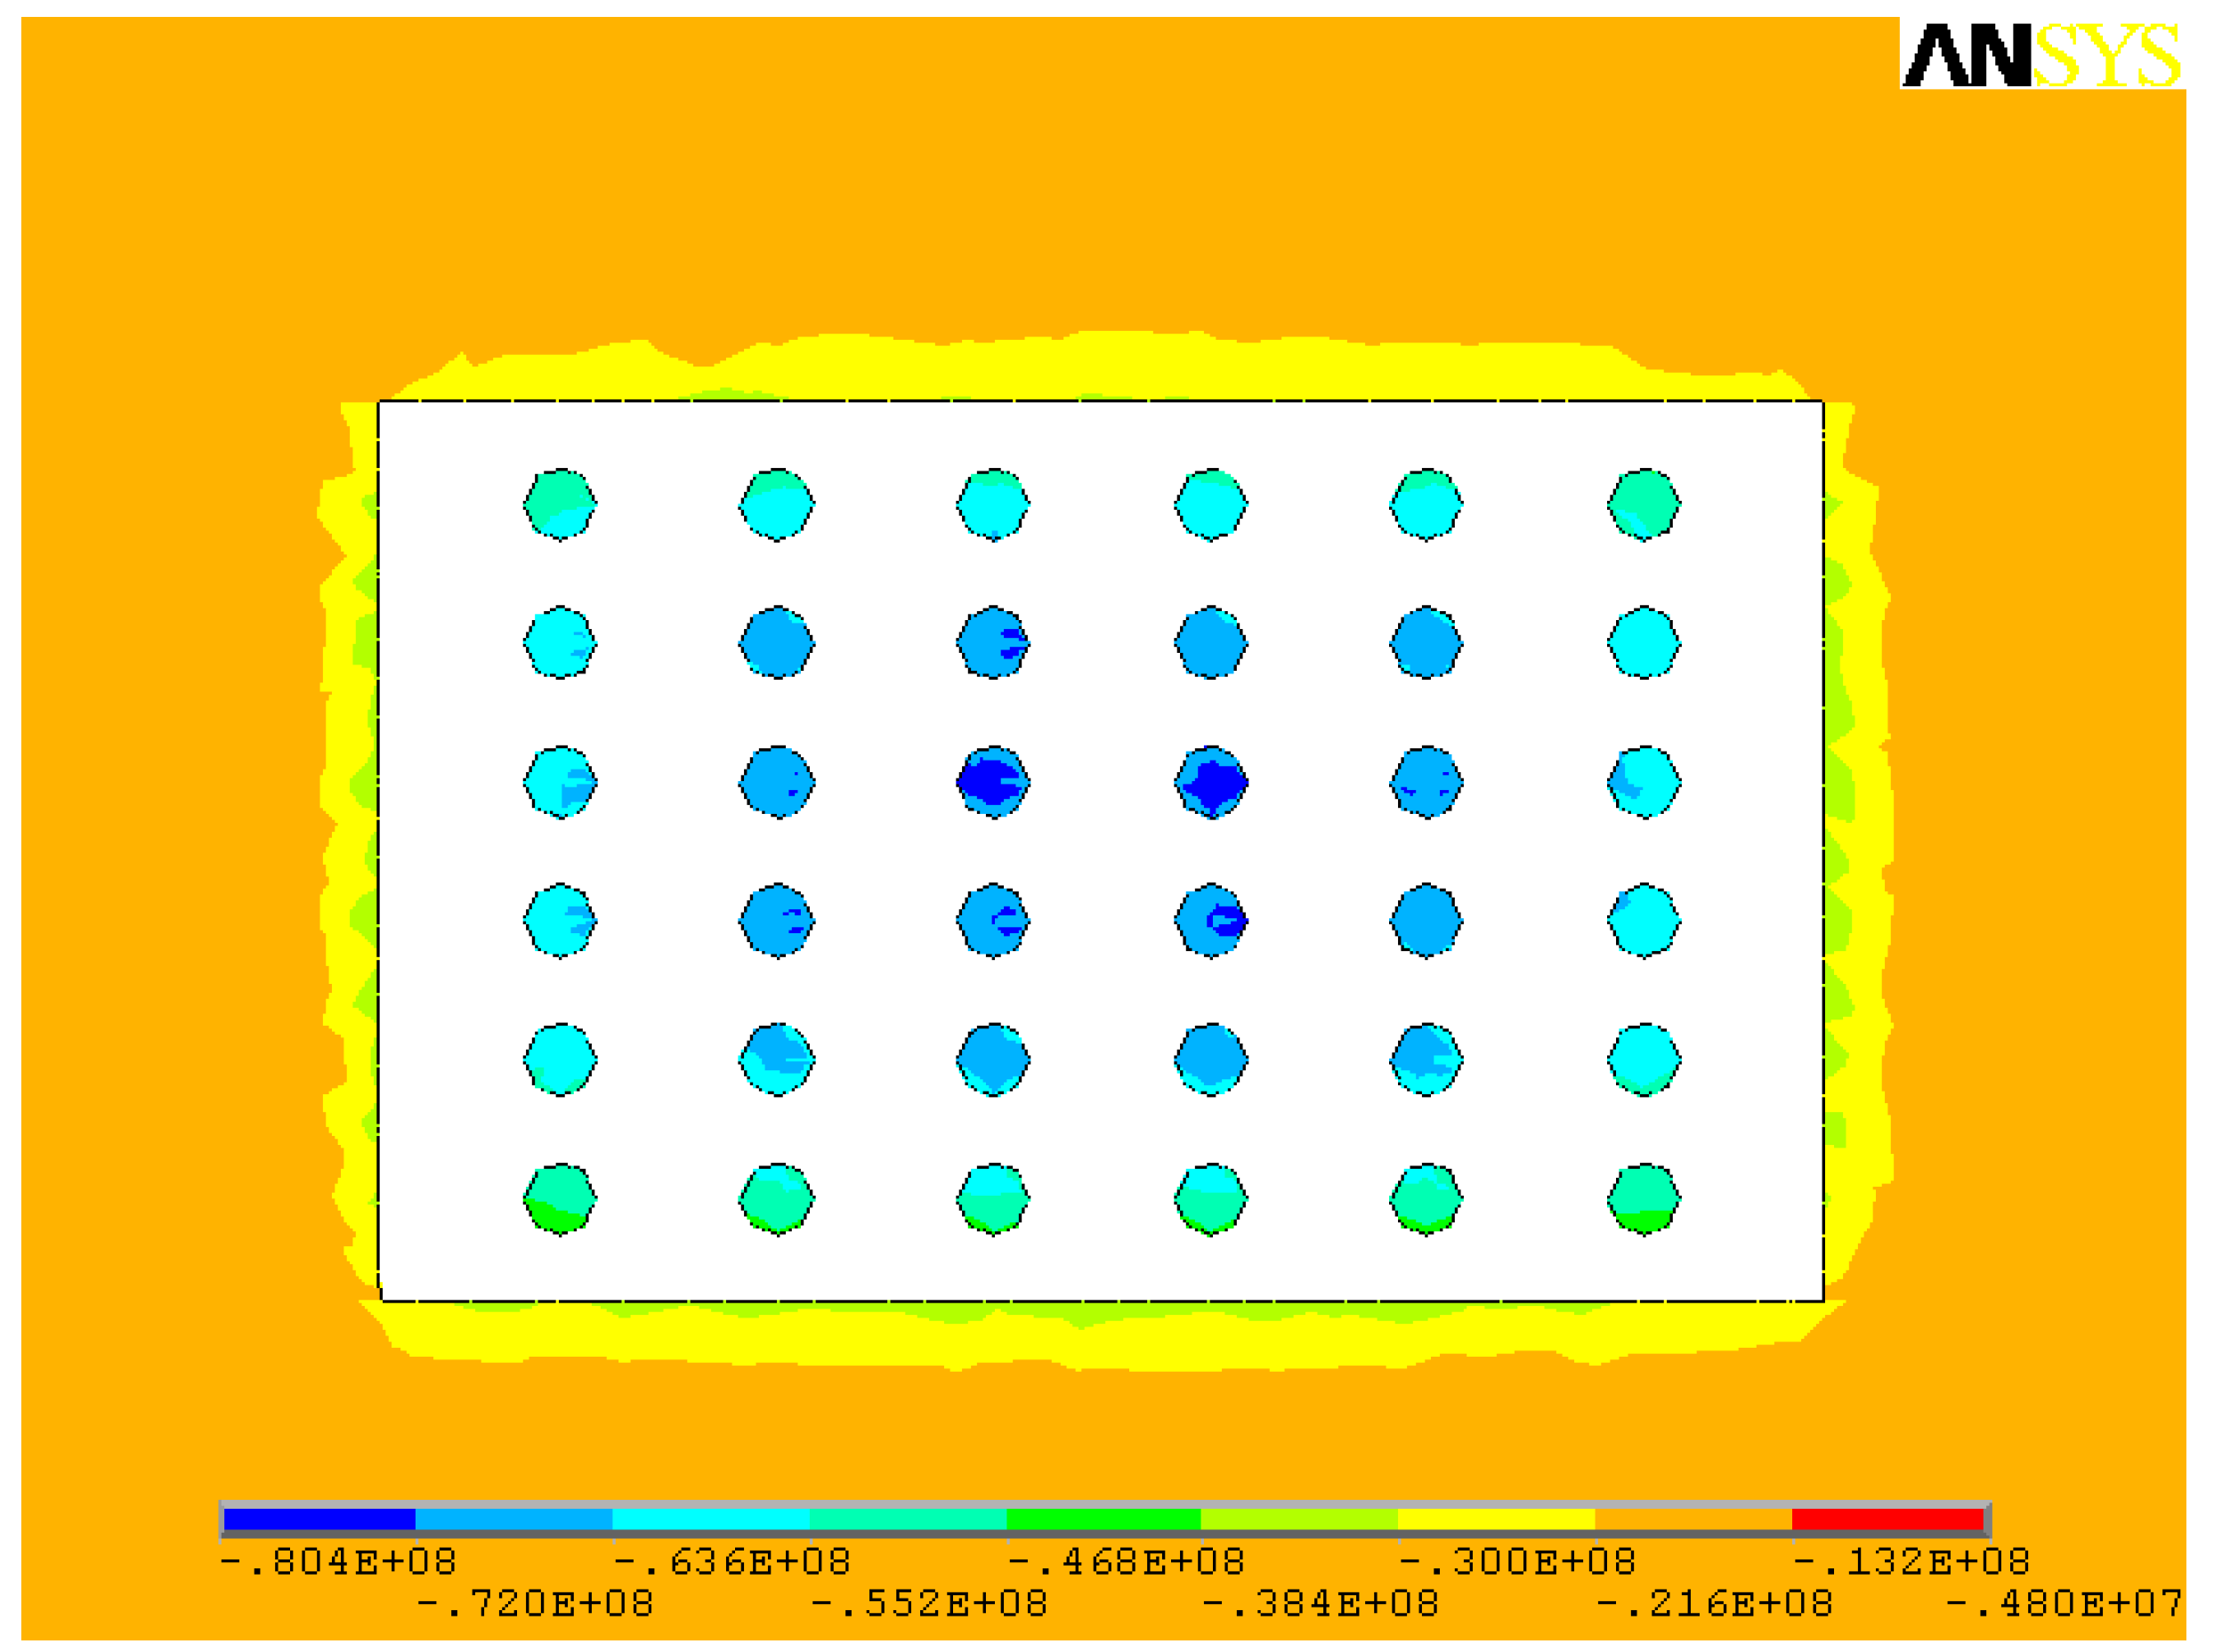
Figure 19.
Maximum principal stress distribution of scheme 2 pillars at 1480 mL (parameters of scheme 2: stope height 2.5 m, pillar diameter 3 m, pillar spacing 6 m, pillar row spacing 8 m).
Figure 19.
Maximum principal stress distribution of scheme 2 pillars at 1480 mL (parameters of scheme 2: stope height 2.5 m, pillar diameter 3 m, pillar spacing 6 m, pillar row spacing 8 m).

Figure 20.
Maximum principal stress distribution in the middle of the pillar at 1480 mL of scheme 2 (parameters of scheme 2: stope height 2.5 m, pillar diameter 3 m, pillar spacing 6 m, pillar row spacing 8 m).
Figure 20.
Maximum principal stress distribution in the middle of the pillar at 1480 mL of scheme 2 (parameters of scheme 2: stope height 2.5 m, pillar diameter 3 m, pillar spacing 6 m, pillar row spacing 8 m).
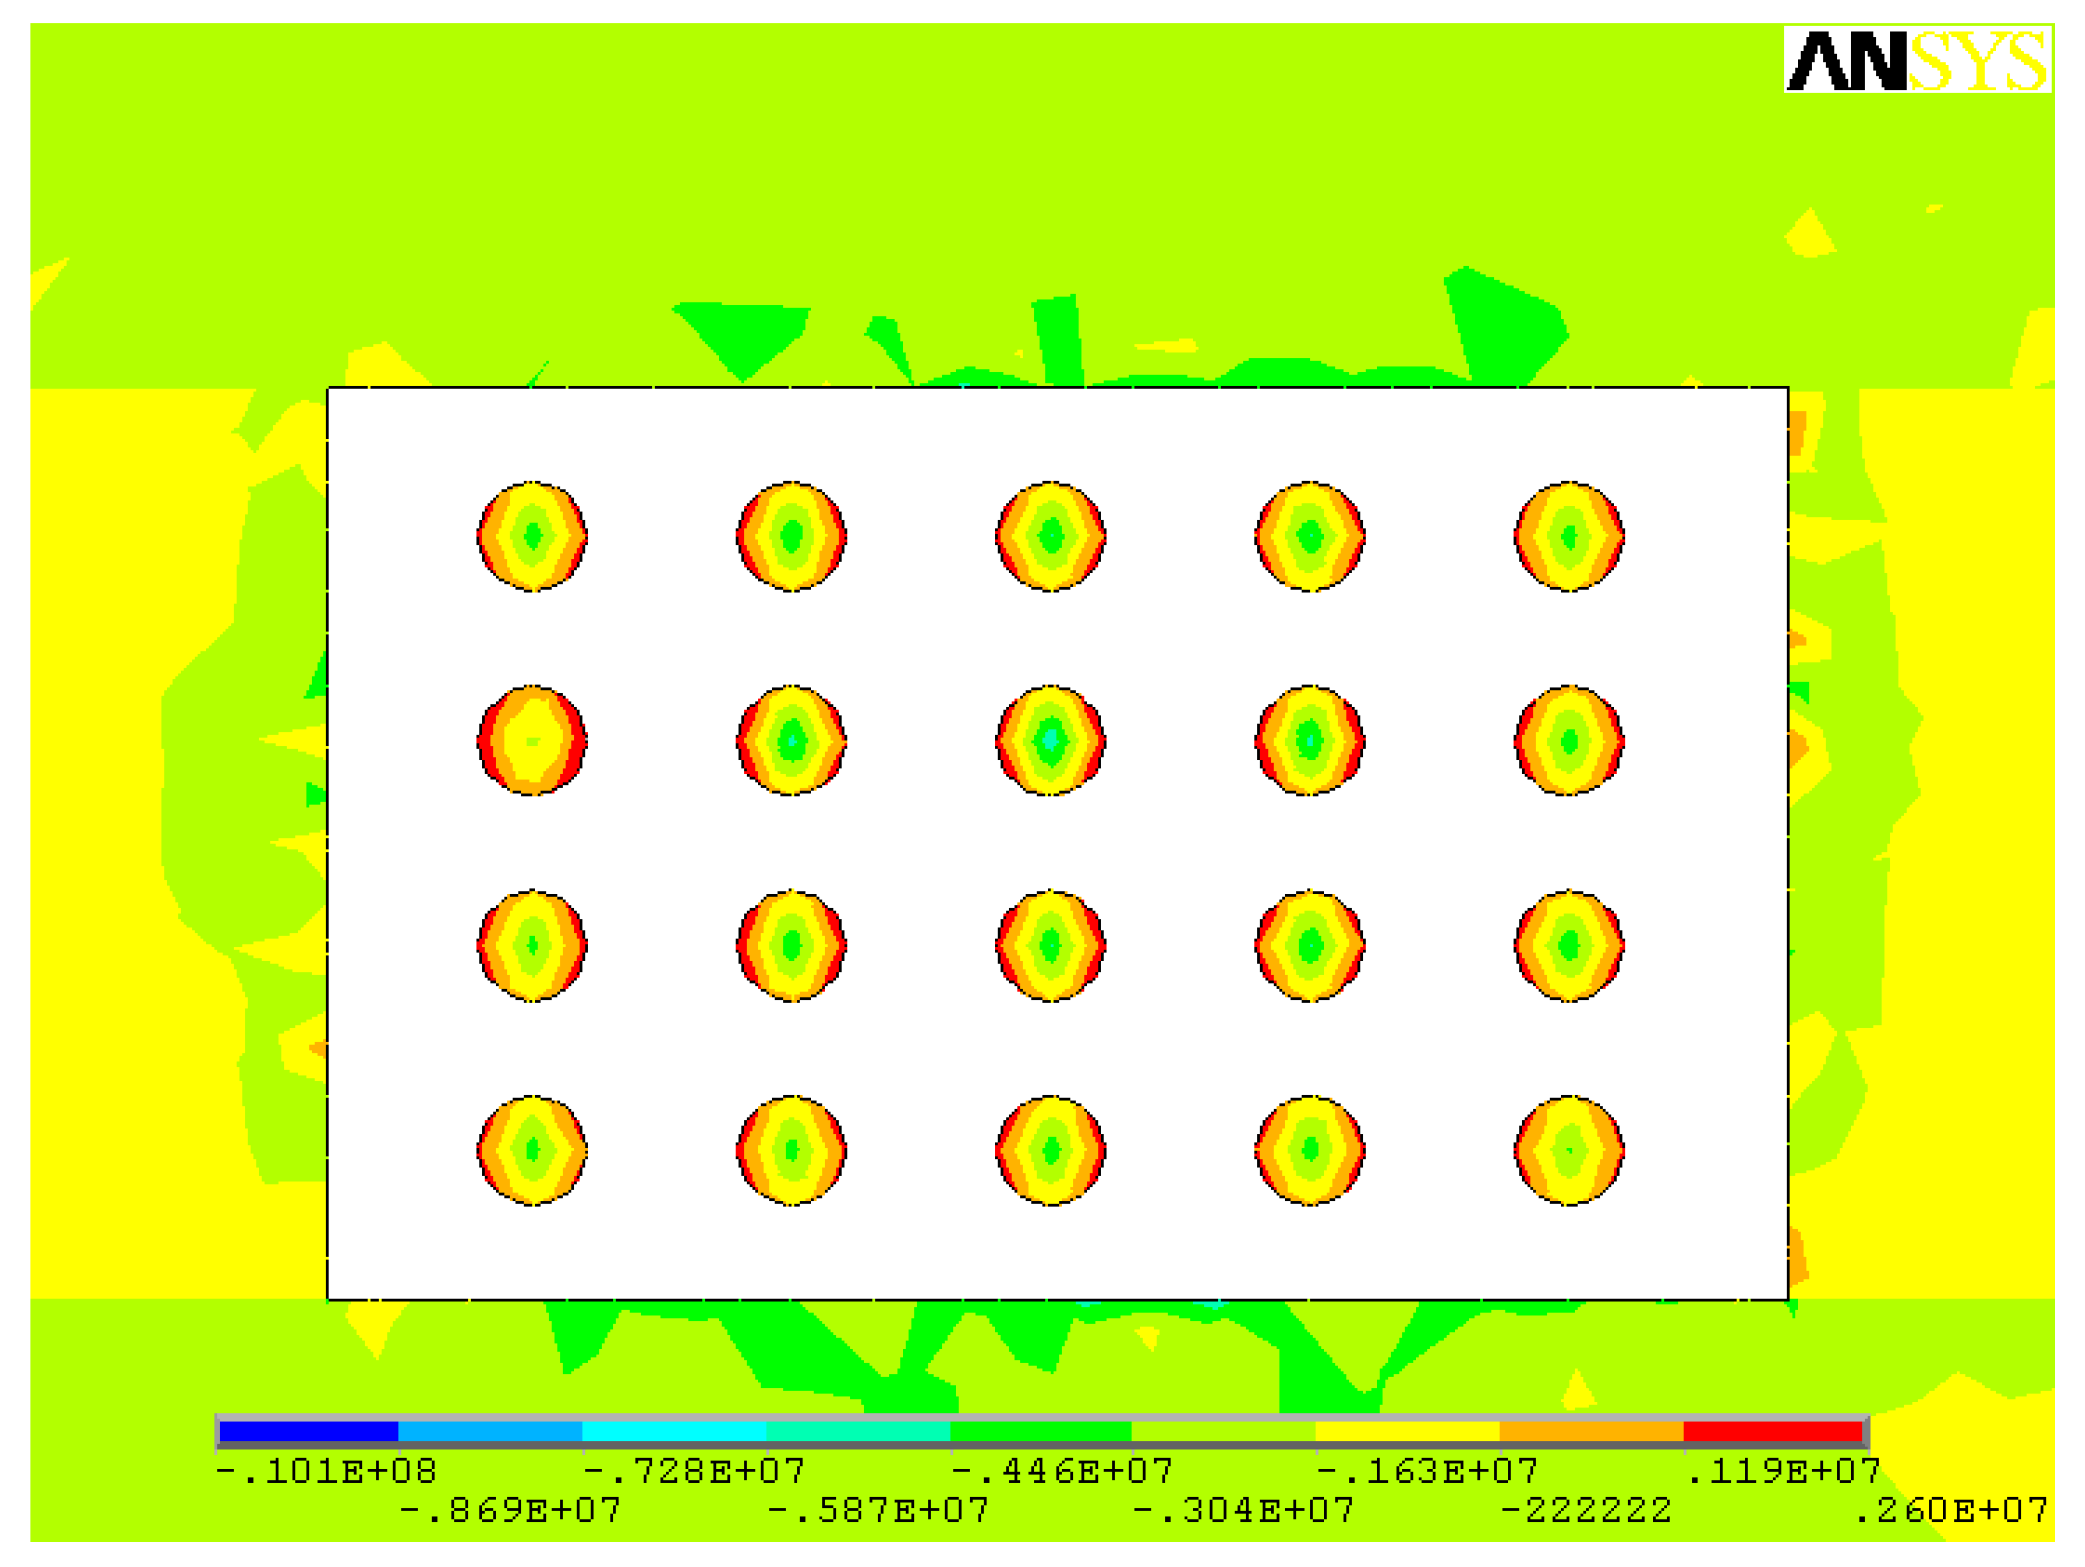
Figure 21.
Minimum principal stress distribution of scheme 2 pillars at 1480 mL (parameters of scheme 2: stope height 2.5 m, pillar diameter 3 m, pillar spacing 6 m, pillar row spacing 8 m).
Figure 21.
Minimum principal stress distribution of scheme 2 pillars at 1480 mL (parameters of scheme 2: stope height 2.5 m, pillar diameter 3 m, pillar spacing 6 m, pillar row spacing 8 m).

Figure 22.
Minimum principal stress distribution in the middle of the pillar at 1480 mL of scheme 2 (parameters of scheme 2: stope height 2.5 m, pillar diameter 3 m, pillar spacing 6 m, pillar row spacing 8 m).
Figure 22.
Minimum principal stress distribution in the middle of the pillar at 1480 mL of scheme 2 (parameters of scheme 2: stope height 2.5 m, pillar diameter 3 m, pillar spacing 6 m, pillar row spacing 8 m).
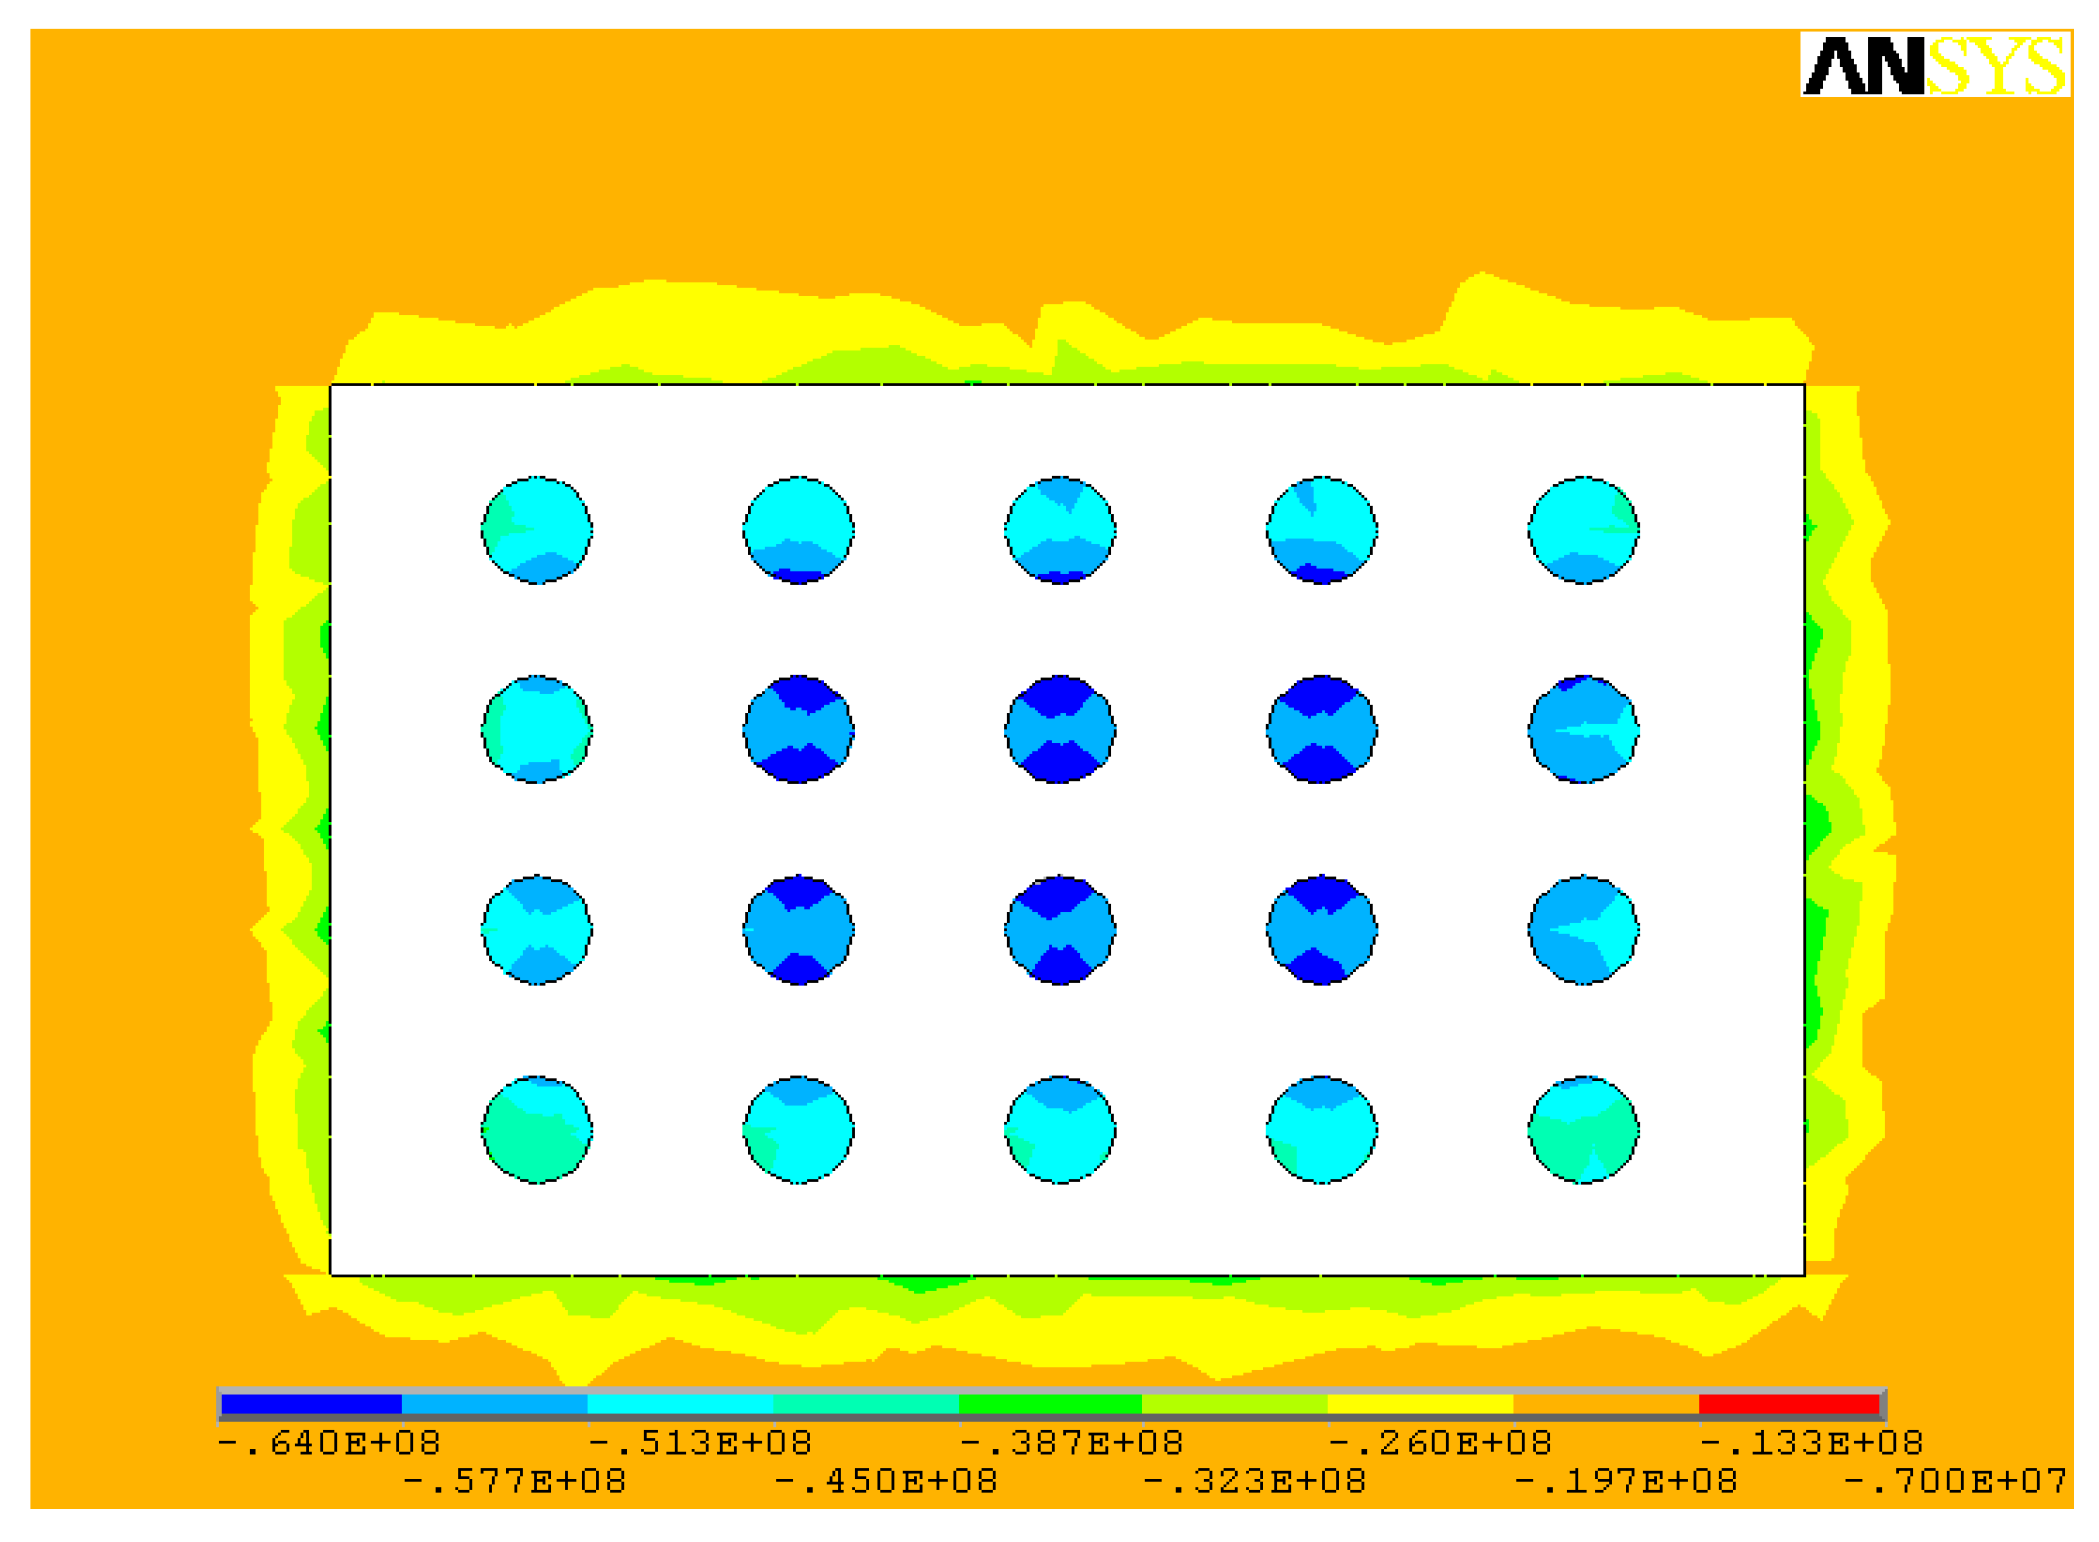
Figure 23.
Maximum principal stress distribution of scheme 4 pillars at 1480 mL (parameters of scheme 4: stope height 3.5 m, pillar diameter 2 m, pillar spacing 5 m, pillar row spacing 8 m).
Figure 23.
Maximum principal stress distribution of scheme 4 pillars at 1480 mL (parameters of scheme 4: stope height 3.5 m, pillar diameter 2 m, pillar spacing 5 m, pillar row spacing 8 m).
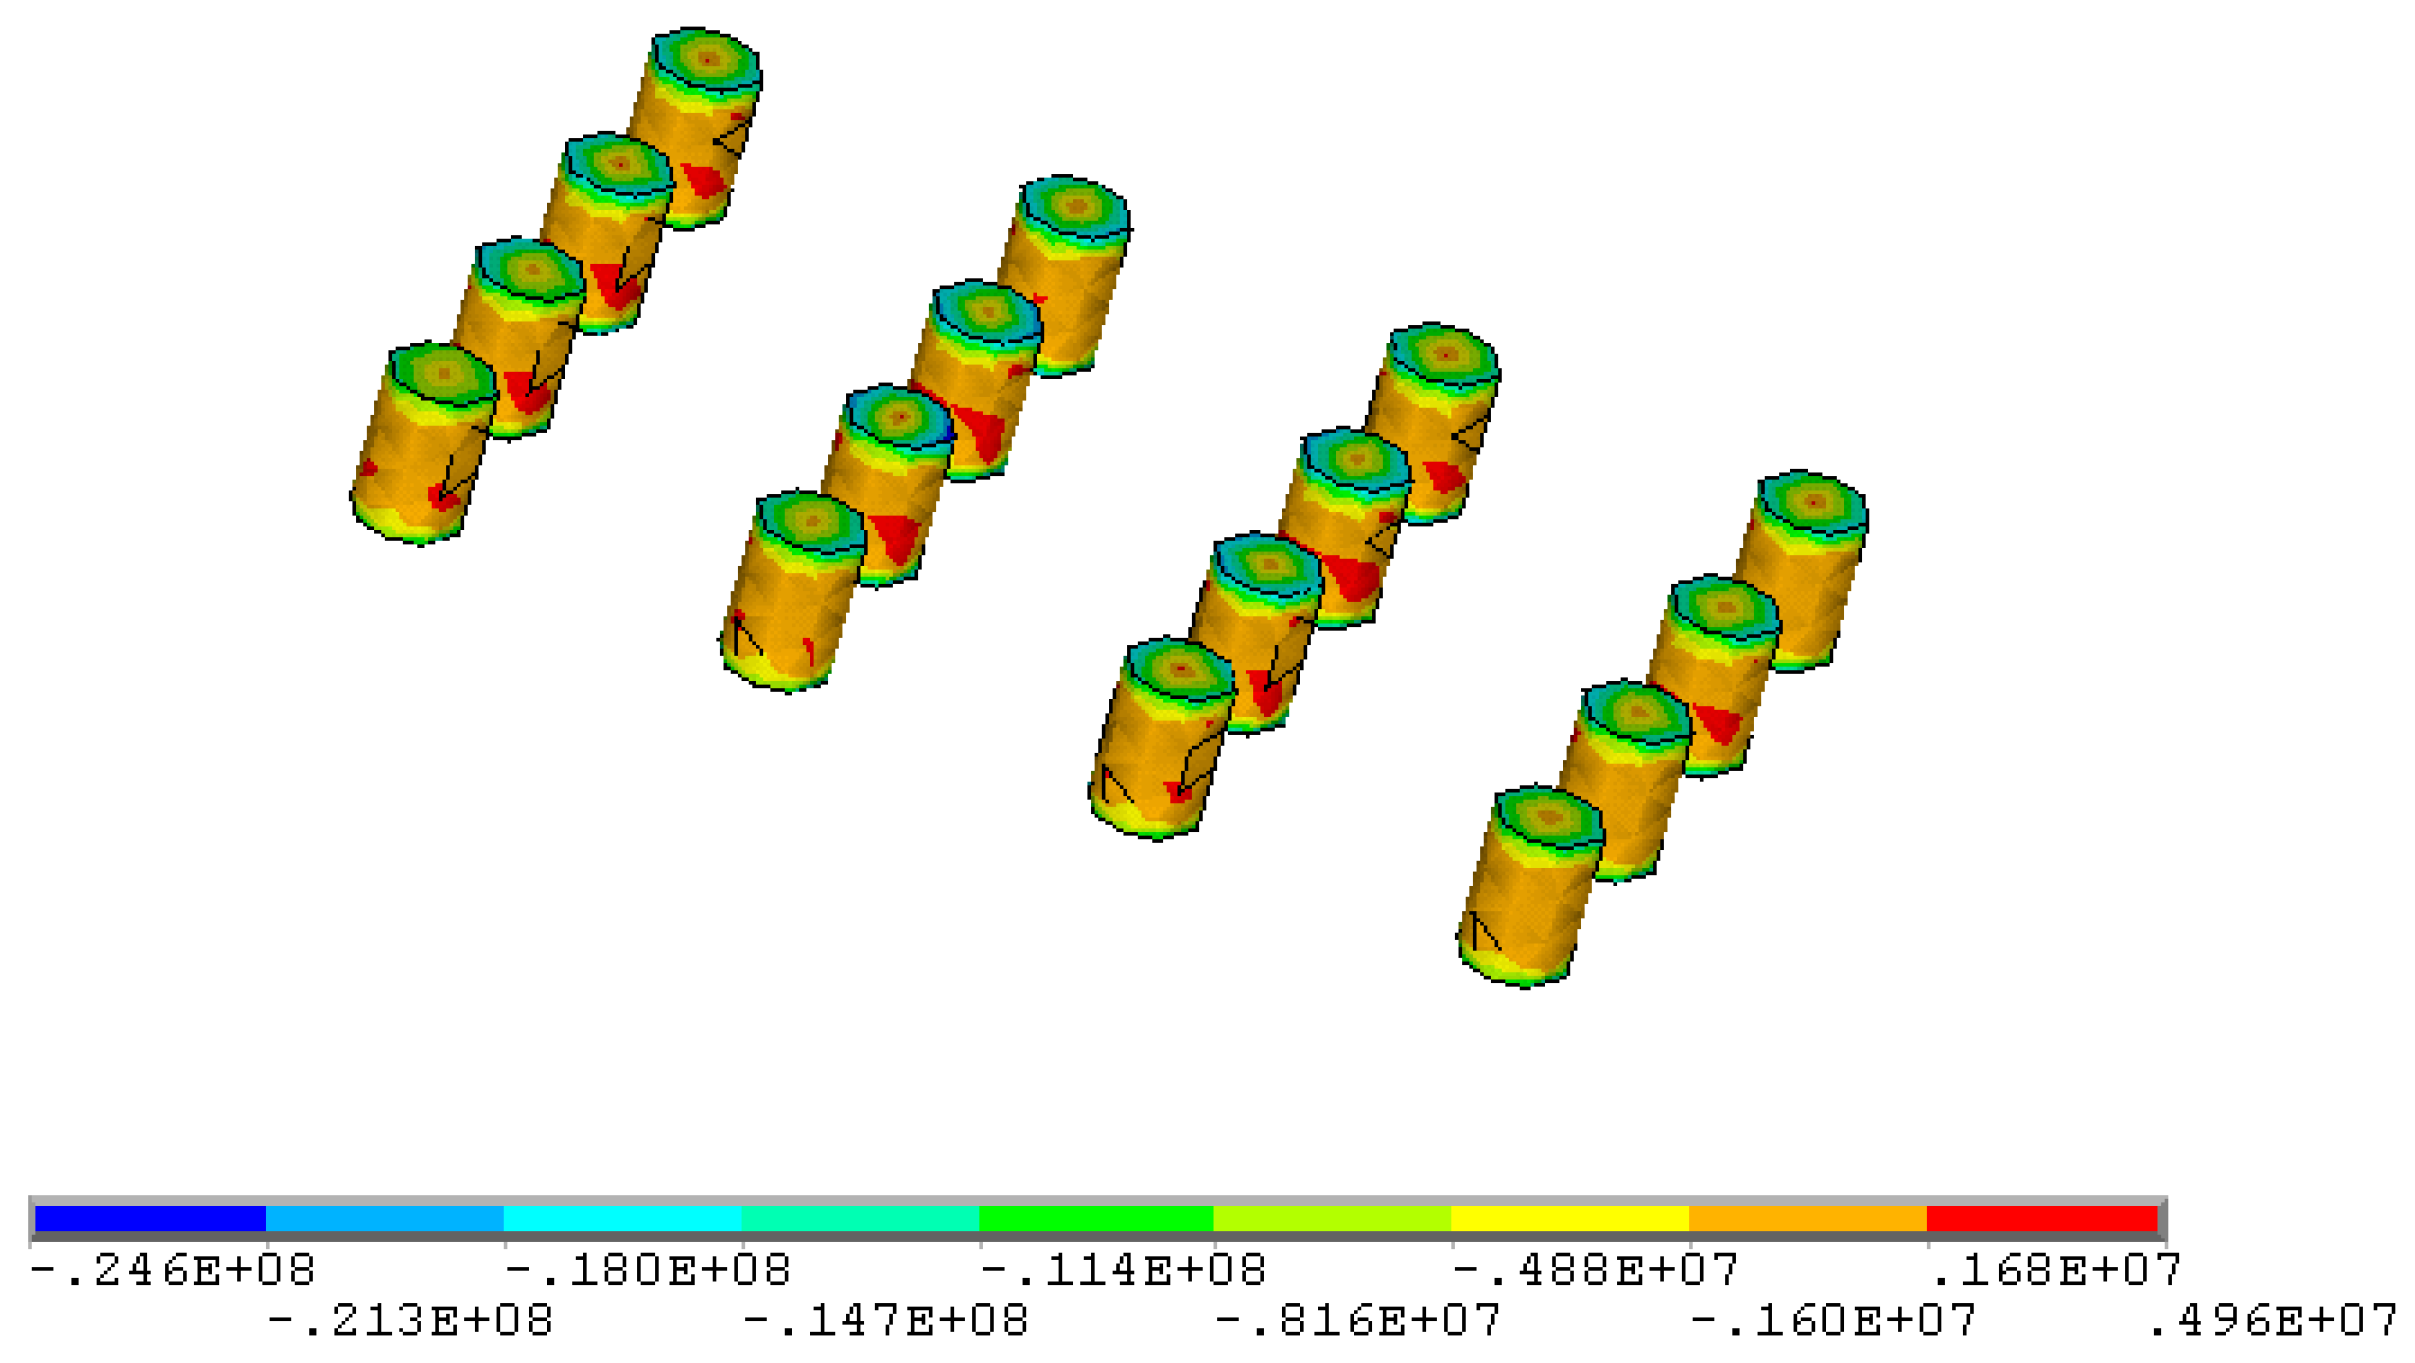
Figure 24.
Maximum principal stress distribution in the middle of the pillar at 1480 mL of scheme 4 (parameters of scheme 4: stope height 3.5 m, pillar diameter 2 m, pillar spacing 5 m, pillar row spacing 8 m).
Figure 24.
Maximum principal stress distribution in the middle of the pillar at 1480 mL of scheme 4 (parameters of scheme 4: stope height 3.5 m, pillar diameter 2 m, pillar spacing 5 m, pillar row spacing 8 m).
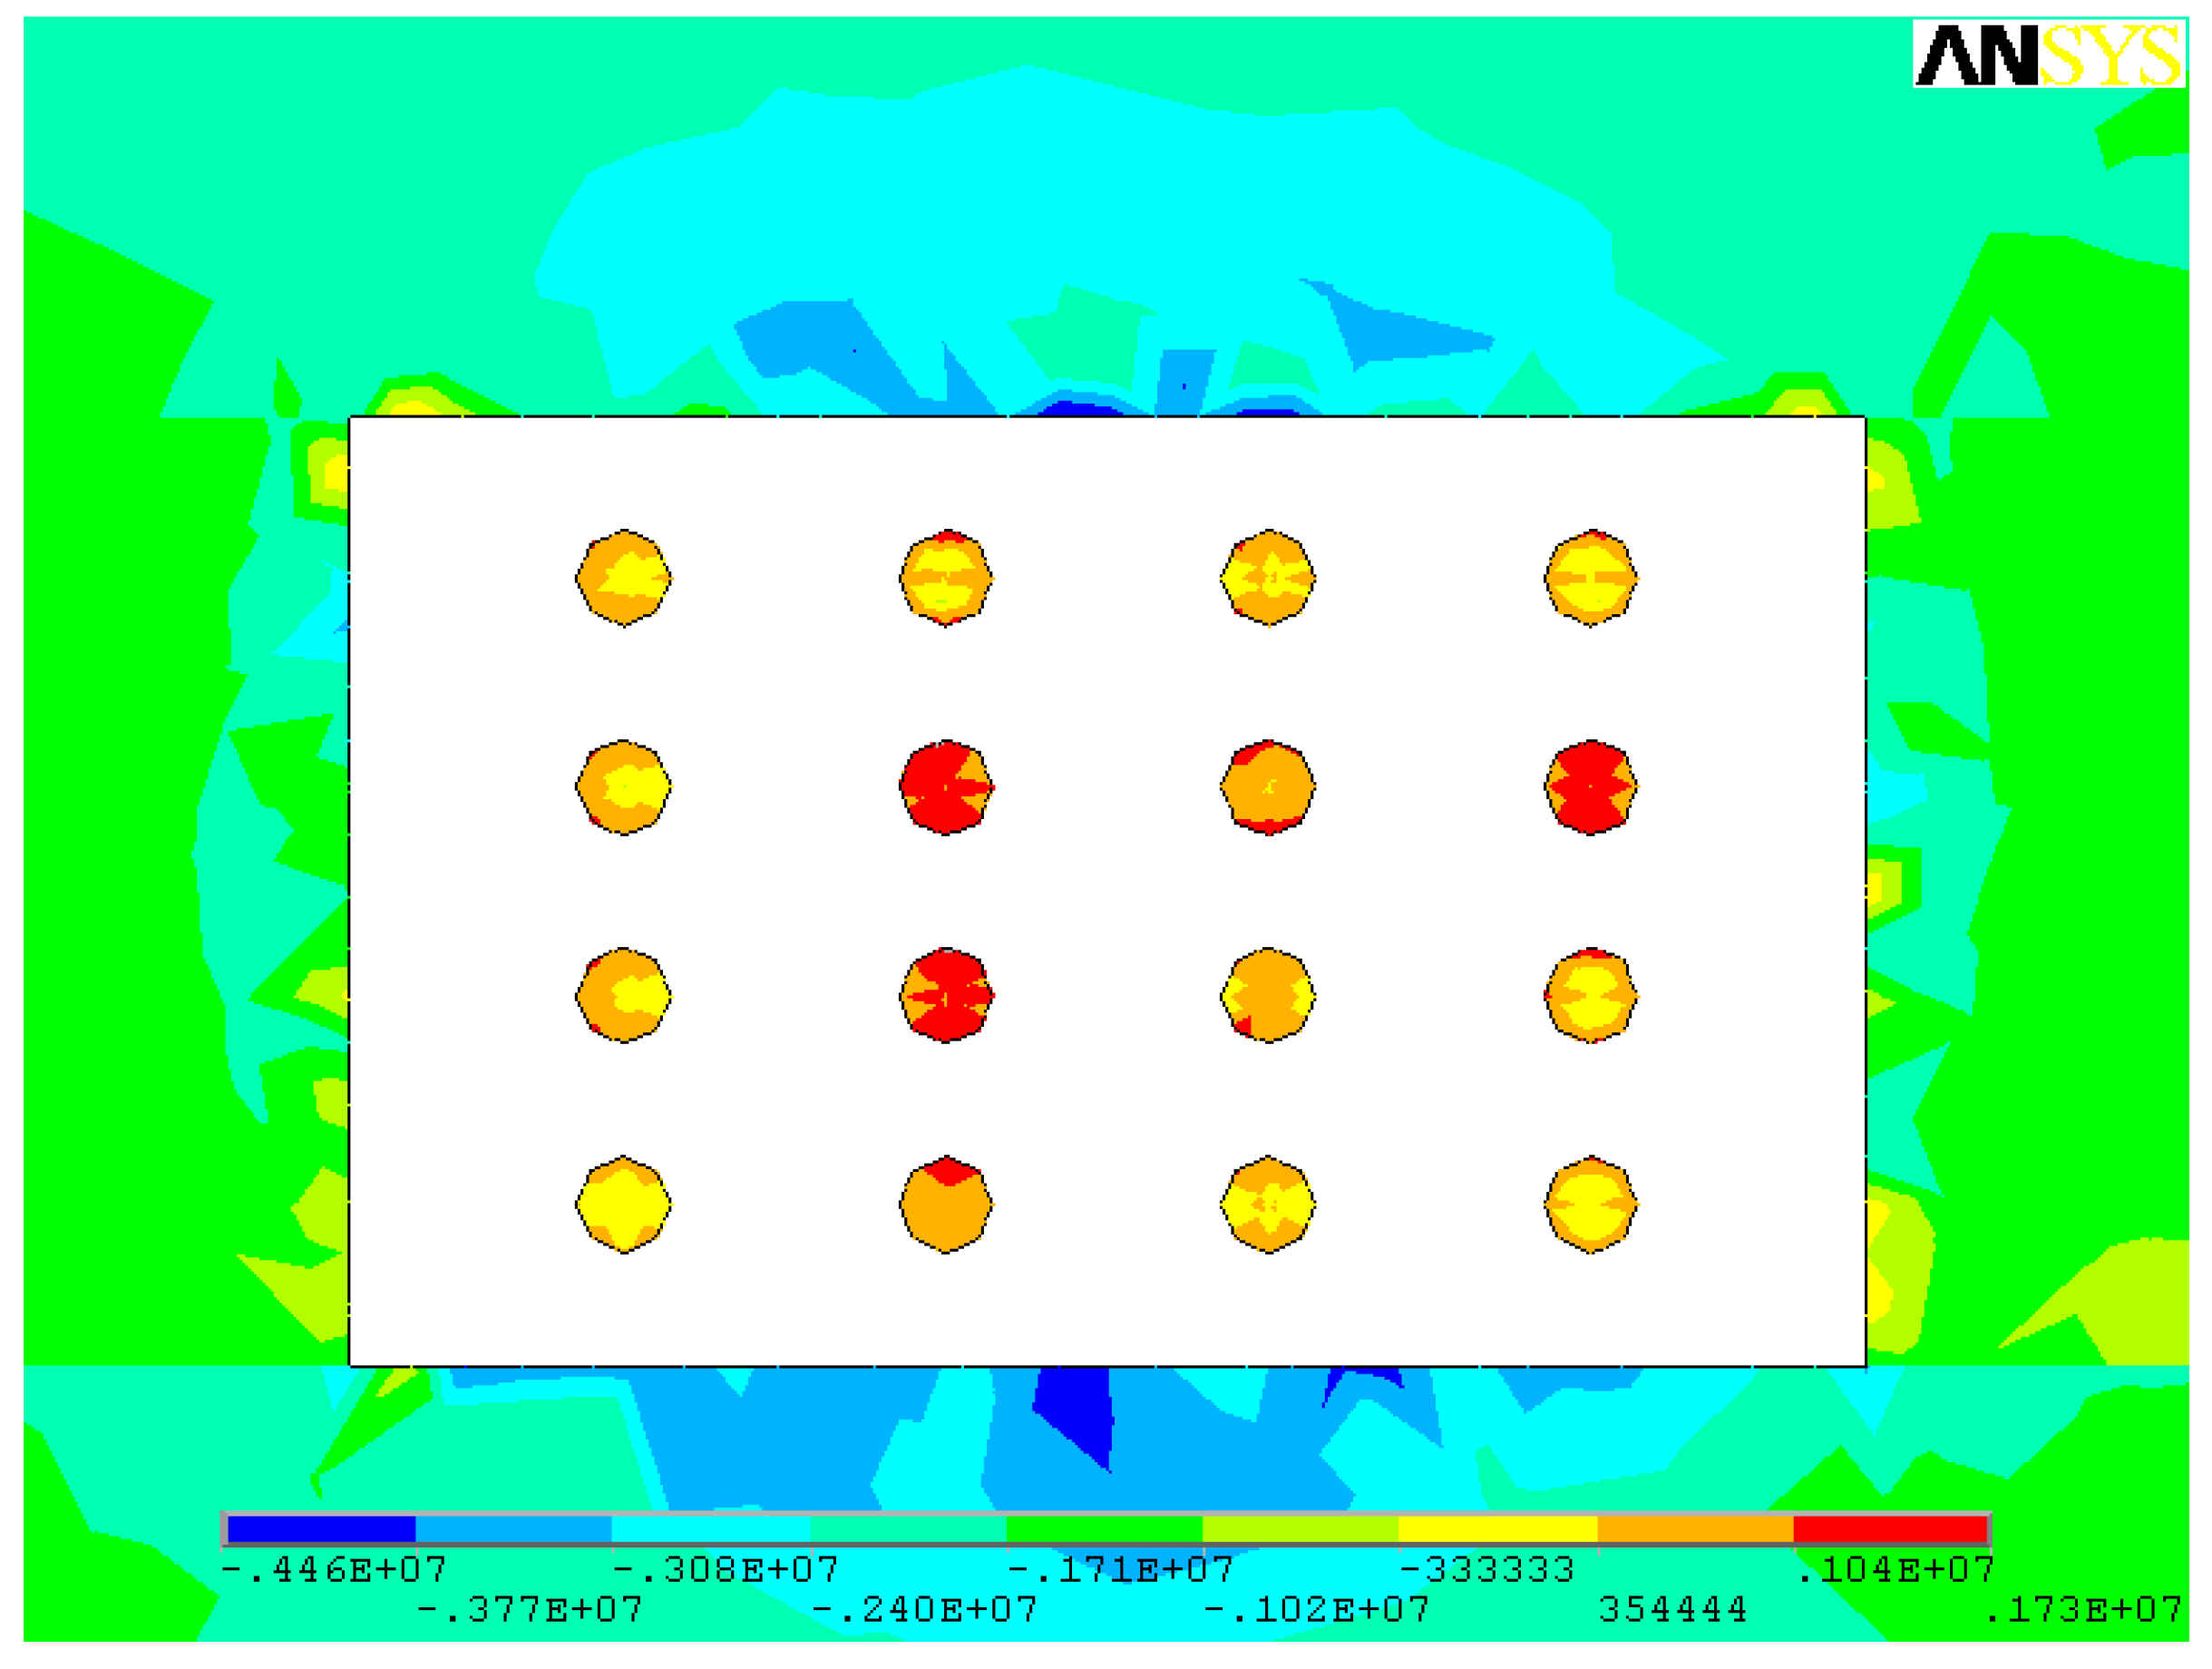
Figure 25.
Minimum principal stress distribution of scheme 4 pillars at 1480 mL (parameters of scheme 4: stope height 3.5 m, pillar diameter 2 m, pillar spacing 5 m, pillar row spacing 8 m).
Figure 25.
Minimum principal stress distribution of scheme 4 pillars at 1480 mL (parameters of scheme 4: stope height 3.5 m, pillar diameter 2 m, pillar spacing 5 m, pillar row spacing 8 m).

Figure 26.
Minimum principal stress distribution in the middle of the pillar at 1480 mL of scheme 4 (parameters of scheme 4: stope height 3.5 m, pillar diameter 2 m, pillar spacing 5 m, pillar row spacing 8 m).
Figure 26.
Minimum principal stress distribution in the middle of the pillar at 1480 mL of scheme 4 (parameters of scheme 4: stope height 3.5 m, pillar diameter 2 m, pillar spacing 5 m, pillar row spacing 8 m).

Figure 27.
Maximum principal stress distribution of scheme 6 pillars at 1480 mL (parameters of scheme 6: stope height 3.5 m, pillar diameter 4 m, pillar spacing 6 m, pillar row spacing 9 m).
Figure 27.
Maximum principal stress distribution of scheme 6 pillars at 1480 mL (parameters of scheme 6: stope height 3.5 m, pillar diameter 4 m, pillar spacing 6 m, pillar row spacing 9 m).

Figure 28.
Maximum principal stress distribution in the middle of the pillar at 1480 mL of scheme 6 (parameters of scheme 6: stope height 3.5 m, pillar diameter 4 m, pillar spacing 6 m, pillar row spacing 9 m).
Figure 28.
Maximum principal stress distribution in the middle of the pillar at 1480 mL of scheme 6 (parameters of scheme 6: stope height 3.5 m, pillar diameter 4 m, pillar spacing 6 m, pillar row spacing 9 m).
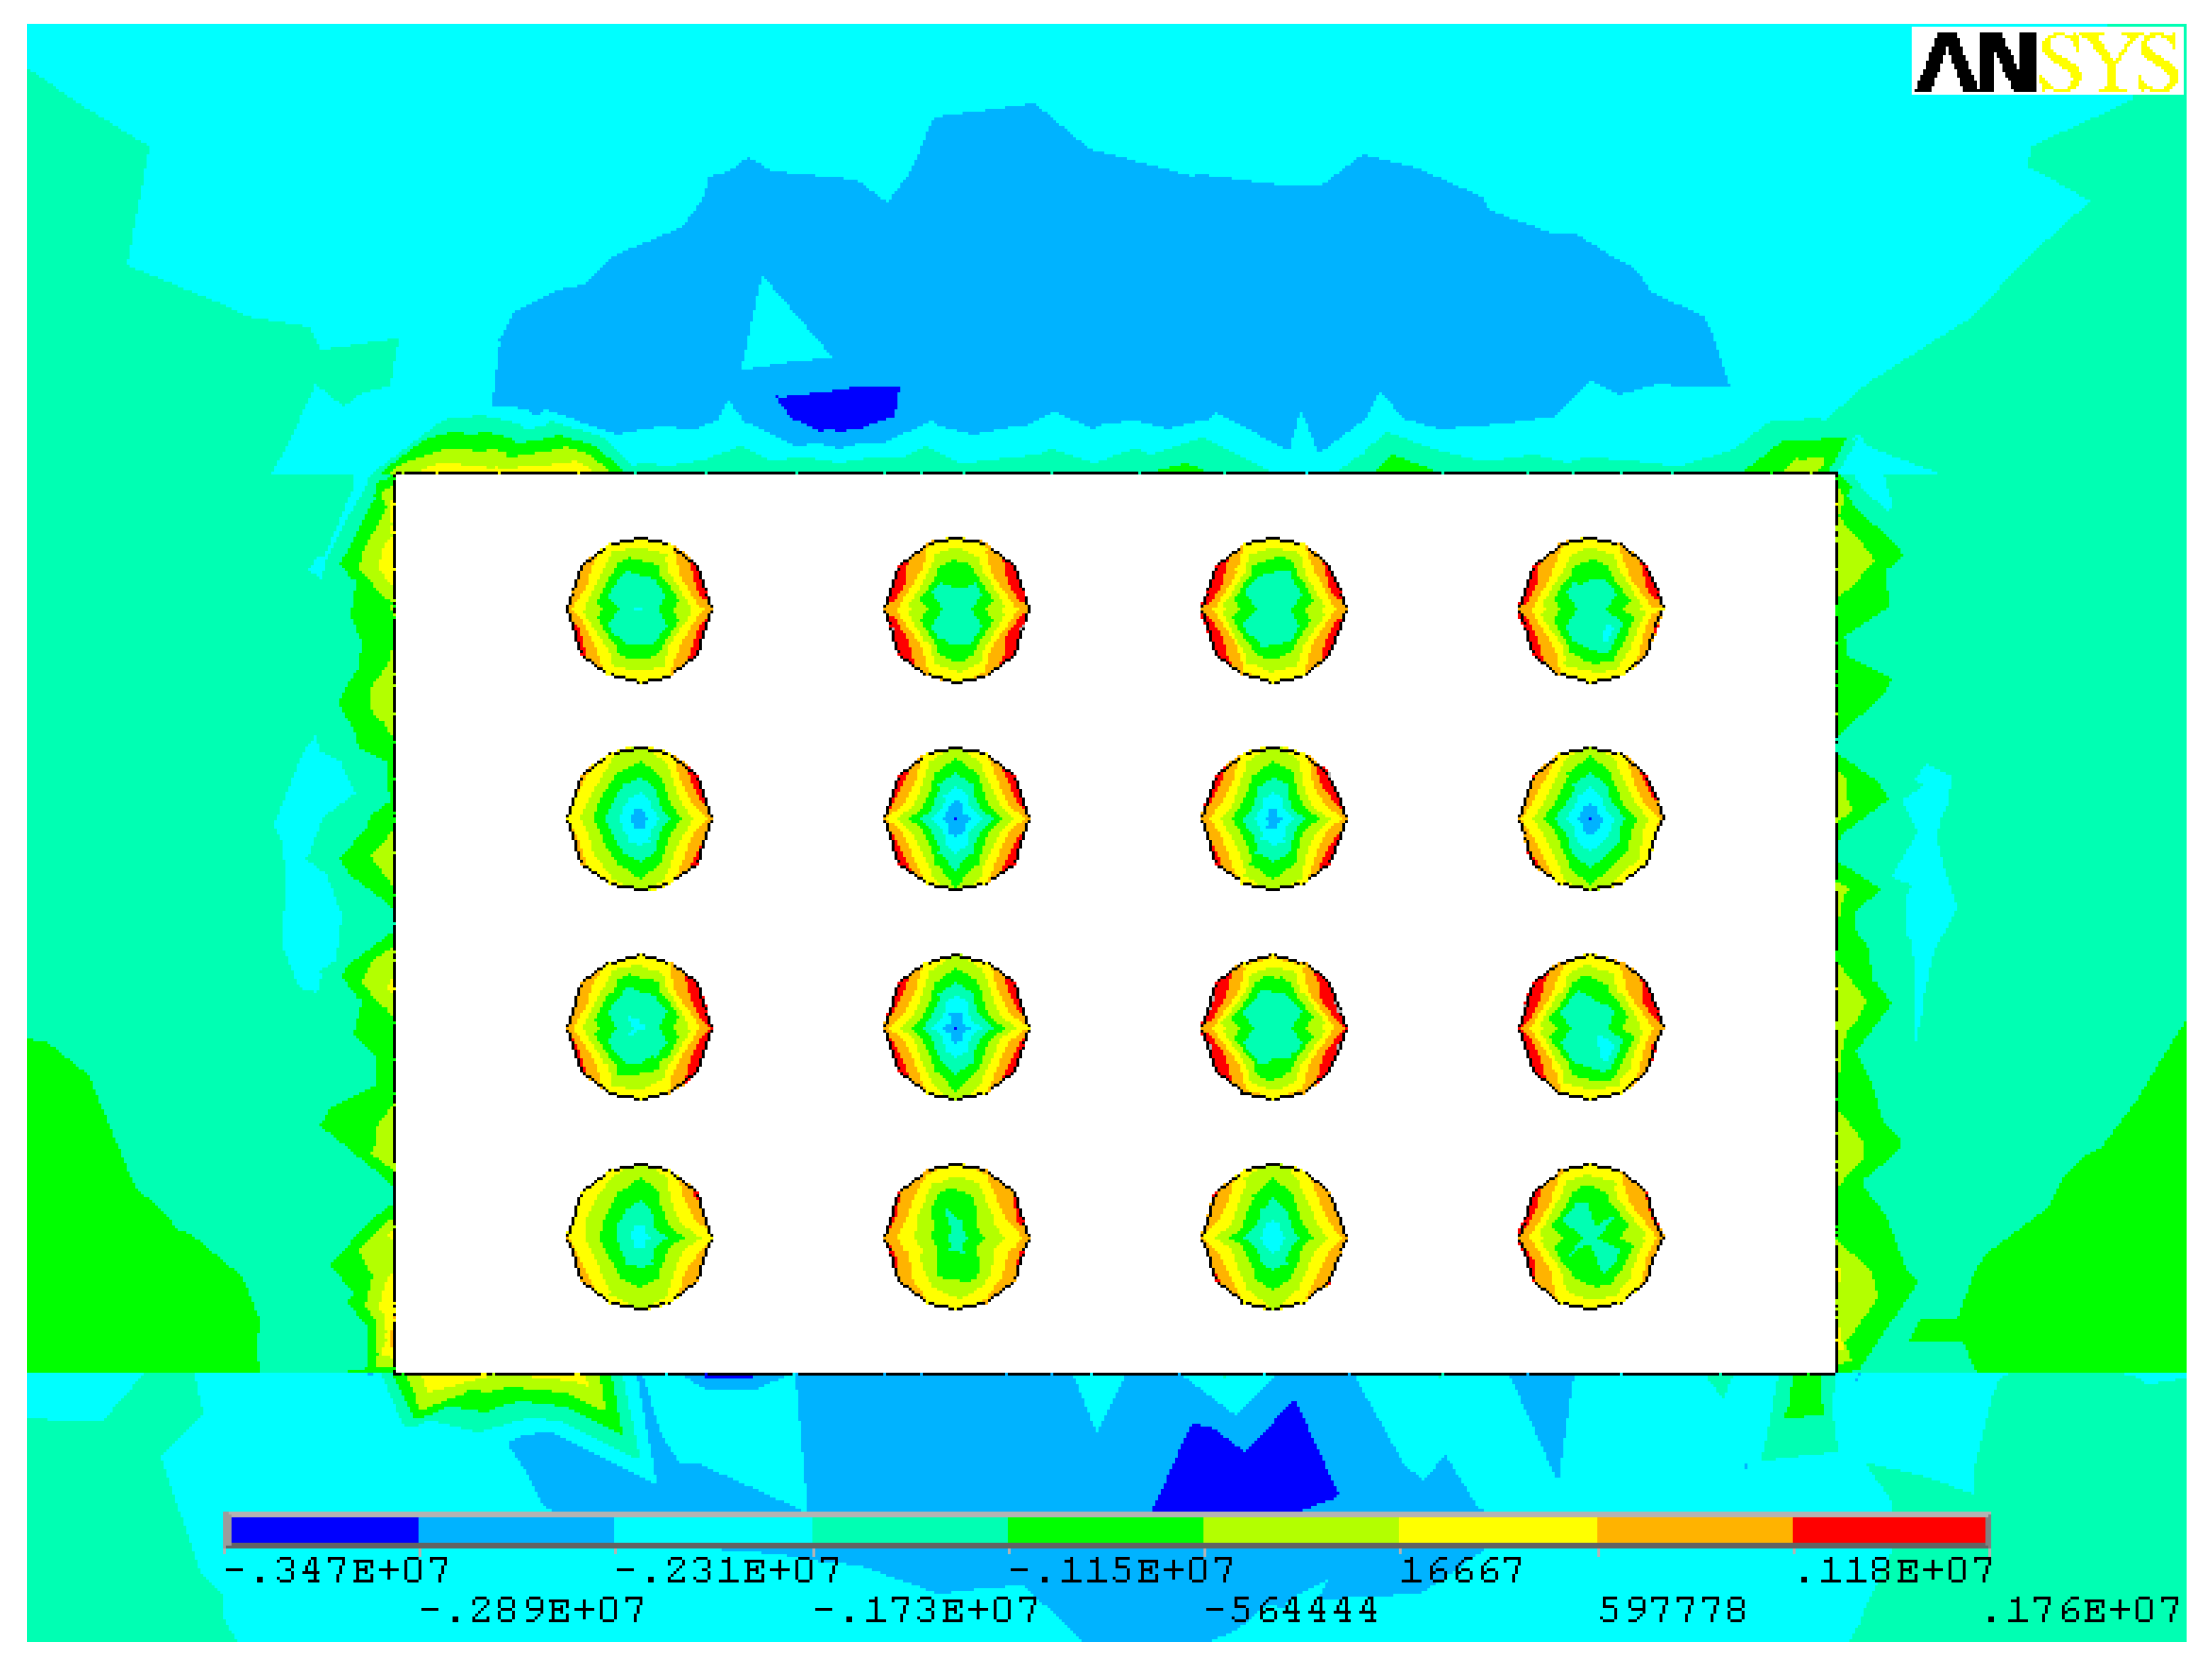
Figure 29.
Minimum principal stress distribution of scheme 6 pillars at 1480 mL (parameters of scheme 6: stope height 3.5 m, pillar diameter 4 m, pillar spacing 6 m, pillar row spacing 9 m).
Figure 29.
Minimum principal stress distribution of scheme 6 pillars at 1480 mL (parameters of scheme 6: stope height 3.5 m, pillar diameter 4 m, pillar spacing 6 m, pillar row spacing 9 m).

Figure 30.
Minimum principal stress distribution in the middle of the pillar at 1480 mL of scheme 6 (parameters of scheme 6: stope height 3.5 m, pillar diameter 4 m, pillar spacing 6 m, pillar row spacing 9 m).
Figure 30.
Minimum principal stress distribution in the middle of the pillar at 1480 mL of scheme 6 (parameters of scheme 6: stope height 3.5 m, pillar diameter 4 m, pillar spacing 6 m, pillar row spacing 9 m).

Figure 31.
Maximum principal stress distribution of scheme 7 pillars at 1480 mL (parameters of scheme 7: stope height 4.5 m, pillar diameter 2 m, pillar spacing 6 m, pillar row spacing 7 m).
Figure 31.
Maximum principal stress distribution of scheme 7 pillars at 1480 mL (parameters of scheme 7: stope height 4.5 m, pillar diameter 2 m, pillar spacing 6 m, pillar row spacing 7 m).

Figure 32.
Maximum principal stress distribution in the middle of the pillar at 1480 mL of scheme 7 (parameters of scheme 7: stope height 4.5 m, pillar diameter 2 m, pillar spacing 6 m, pillar row spacing 7 m).
Figure 32.
Maximum principal stress distribution in the middle of the pillar at 1480 mL of scheme 7 (parameters of scheme 7: stope height 4.5 m, pillar diameter 2 m, pillar spacing 6 m, pillar row spacing 7 m).
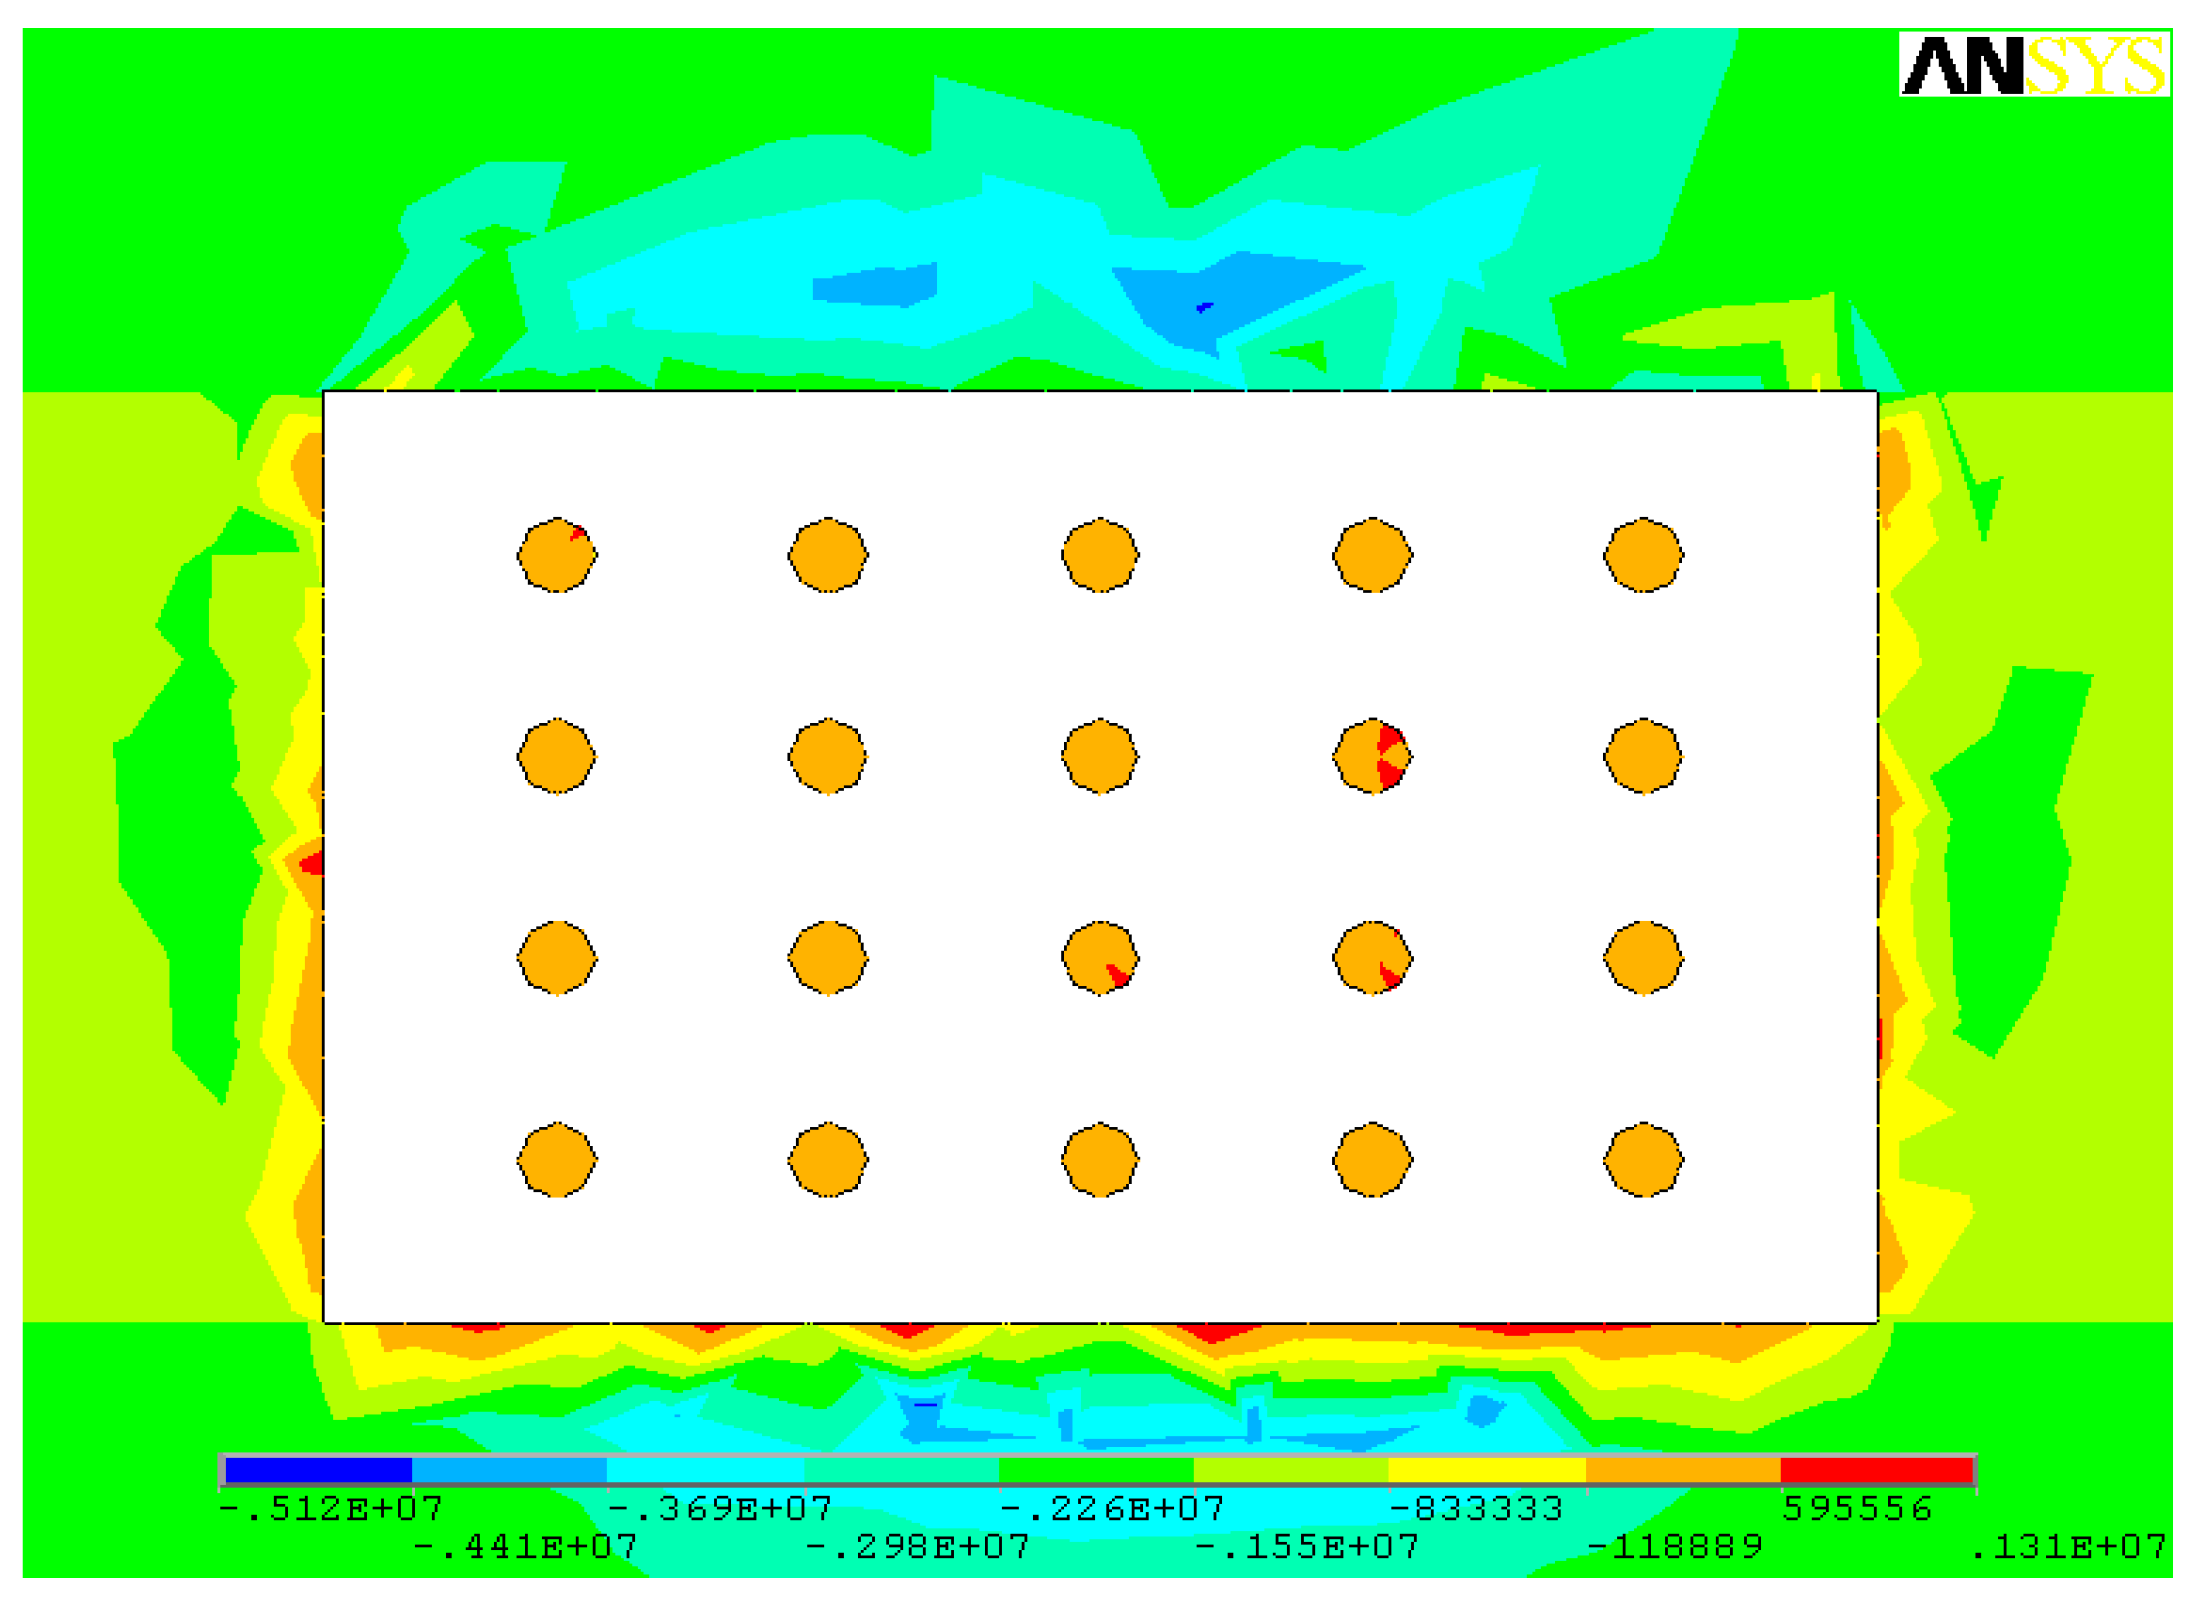
Figure 33.
Minimum principal stress distribution of scheme 7 pillars at 1480 mL (parameters of scheme 7: stope height 4.5 m, pillar diameter 2 m, pillar spacing 6 m, pillar row spacing 7 m).
Figure 33.
Minimum principal stress distribution of scheme 7 pillars at 1480 mL (parameters of scheme 7: stope height 4.5 m, pillar diameter 2 m, pillar spacing 6 m, pillar row spacing 7 m).

Figure 34.
Minimum principal stress distribution in the middle of the pillar at 1480 mL of scheme 7 (parameters of scheme 7: stope height 4.5 m, pillar diameter 2 m, pillar spacing 6 m, pillar row spacing 7 m).
Figure 34.
Minimum principal stress distribution in the middle of the pillar at 1480 mL of scheme 7 (parameters of scheme 7: stope height 4.5 m, pillar diameter 2 m, pillar spacing 6 m, pillar row spacing 7 m).
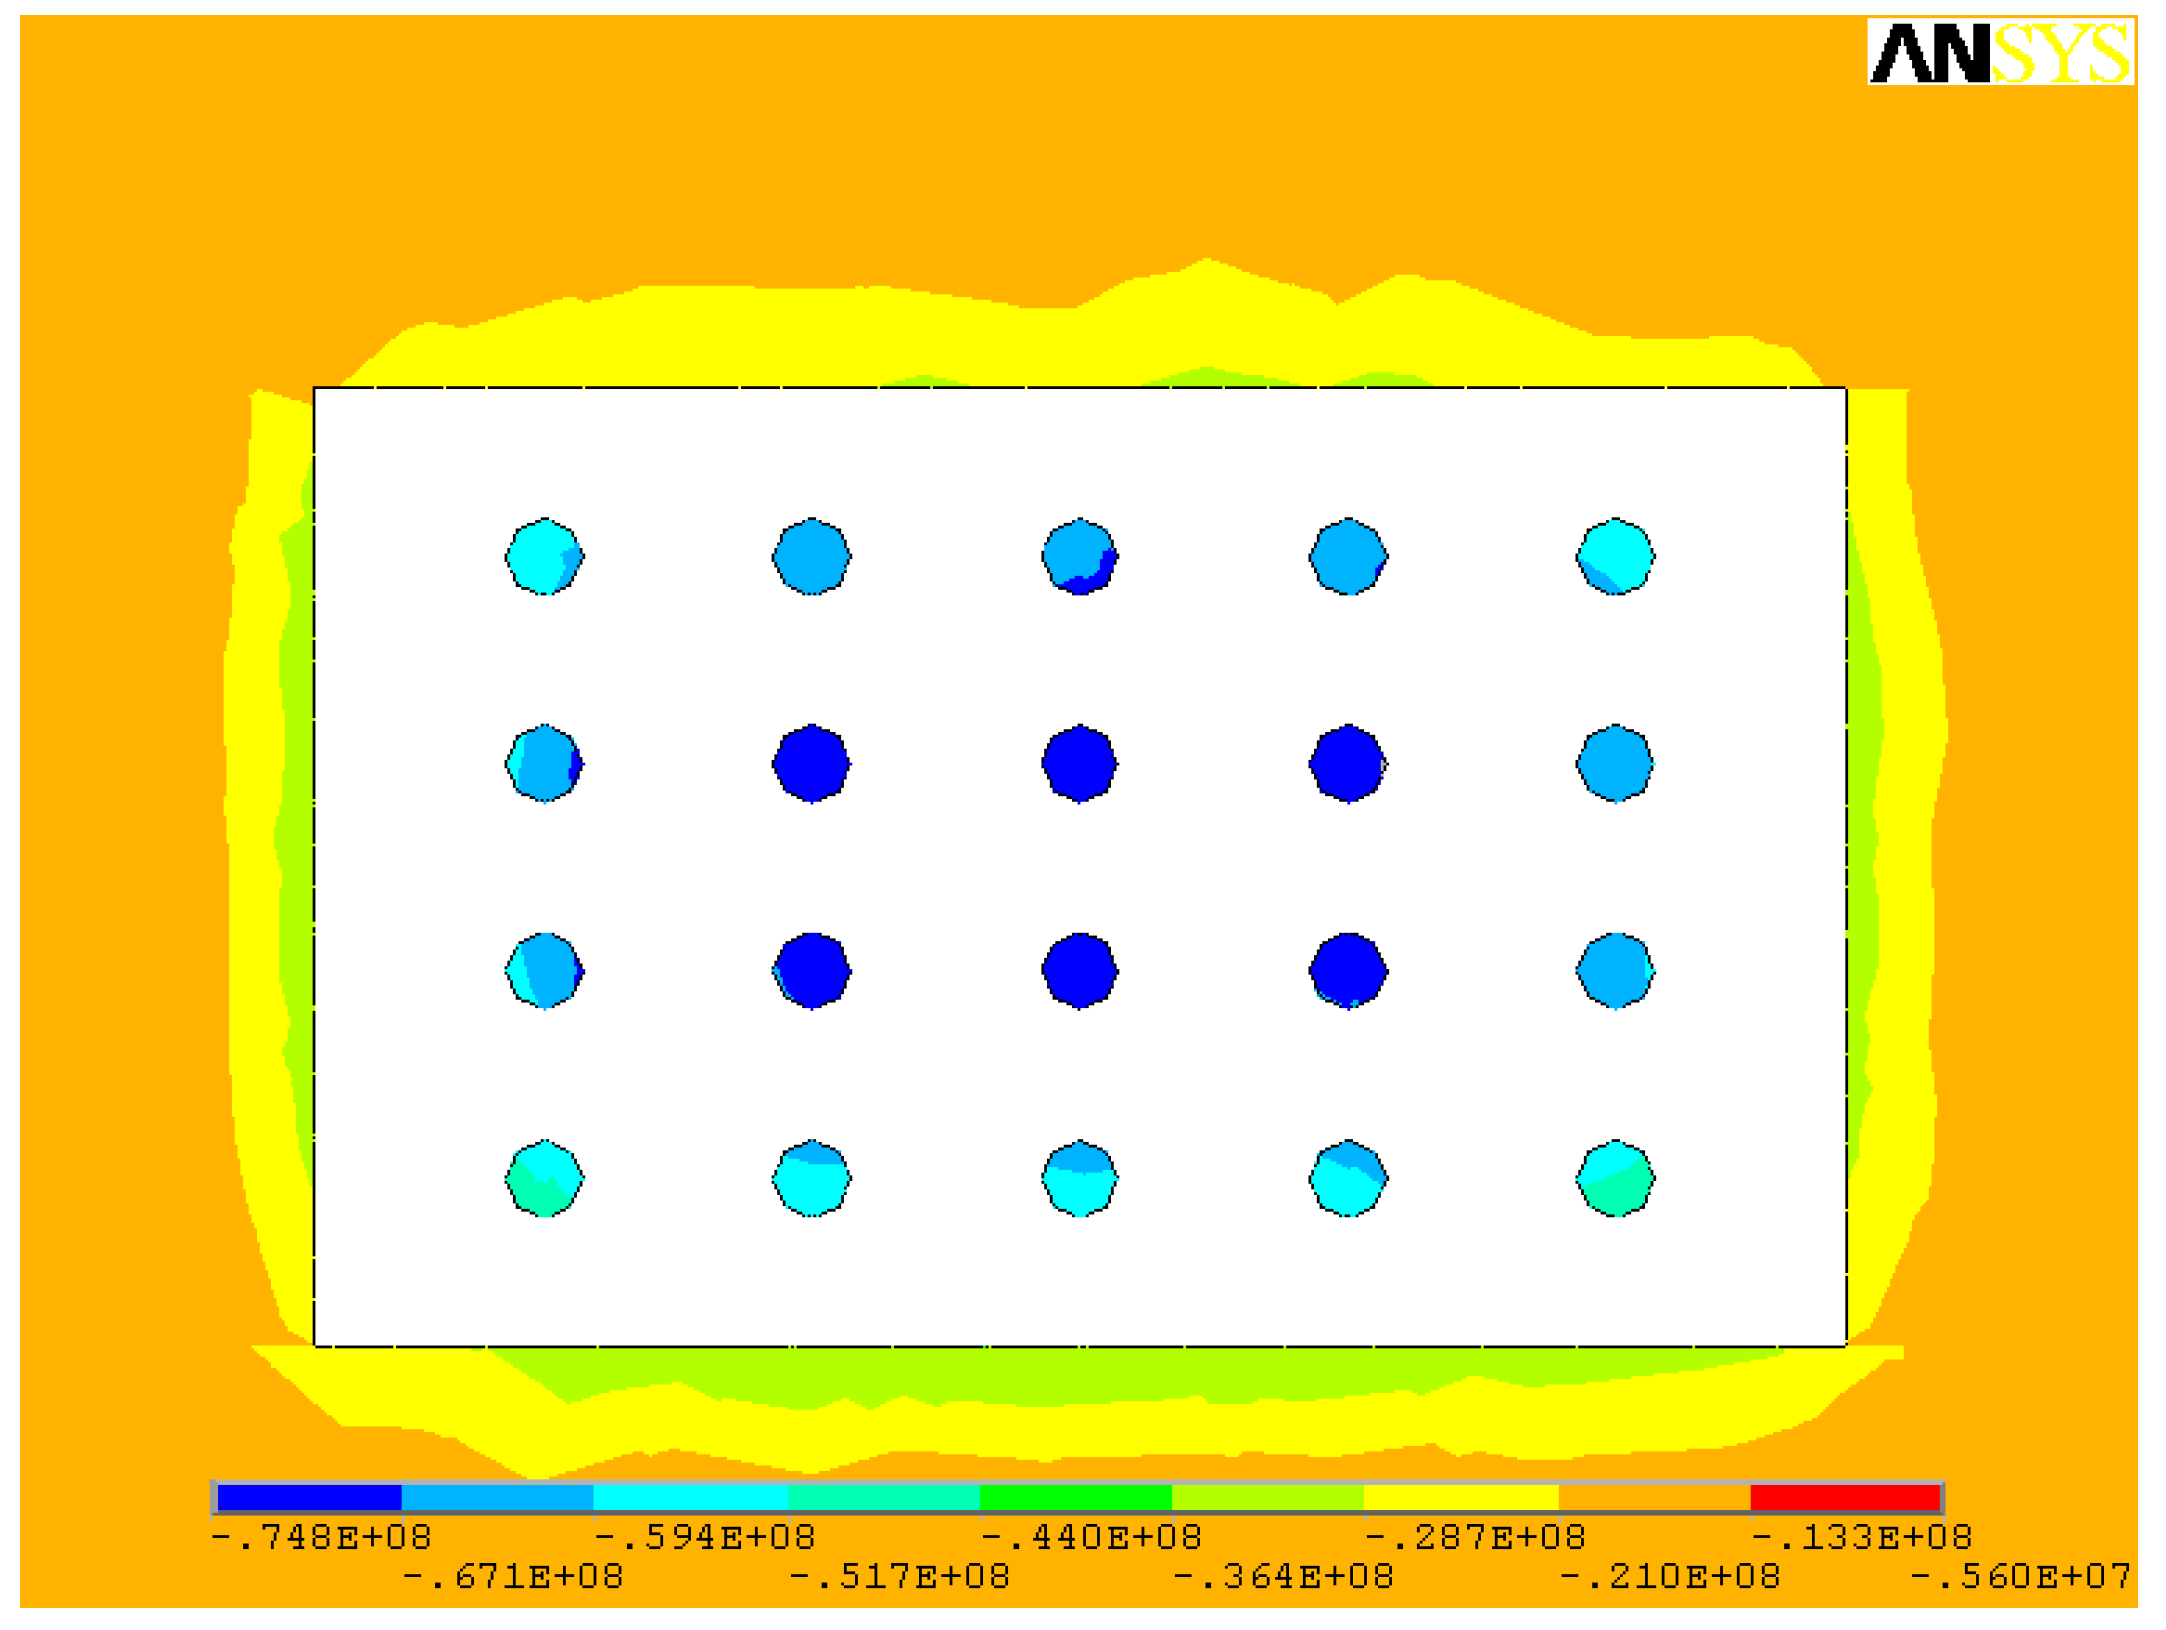
Figure 35.
Maximum principal stress distribution of scheme 9 pillars at 1480 mL (parameters of scheme 9: stope height 4.5 m, pillar diameter 4 m, pillar spacing 7 m, pillar row spacing 8 m).
Figure 35.
Maximum principal stress distribution of scheme 9 pillars at 1480 mL (parameters of scheme 9: stope height 4.5 m, pillar diameter 4 m, pillar spacing 7 m, pillar row spacing 8 m).
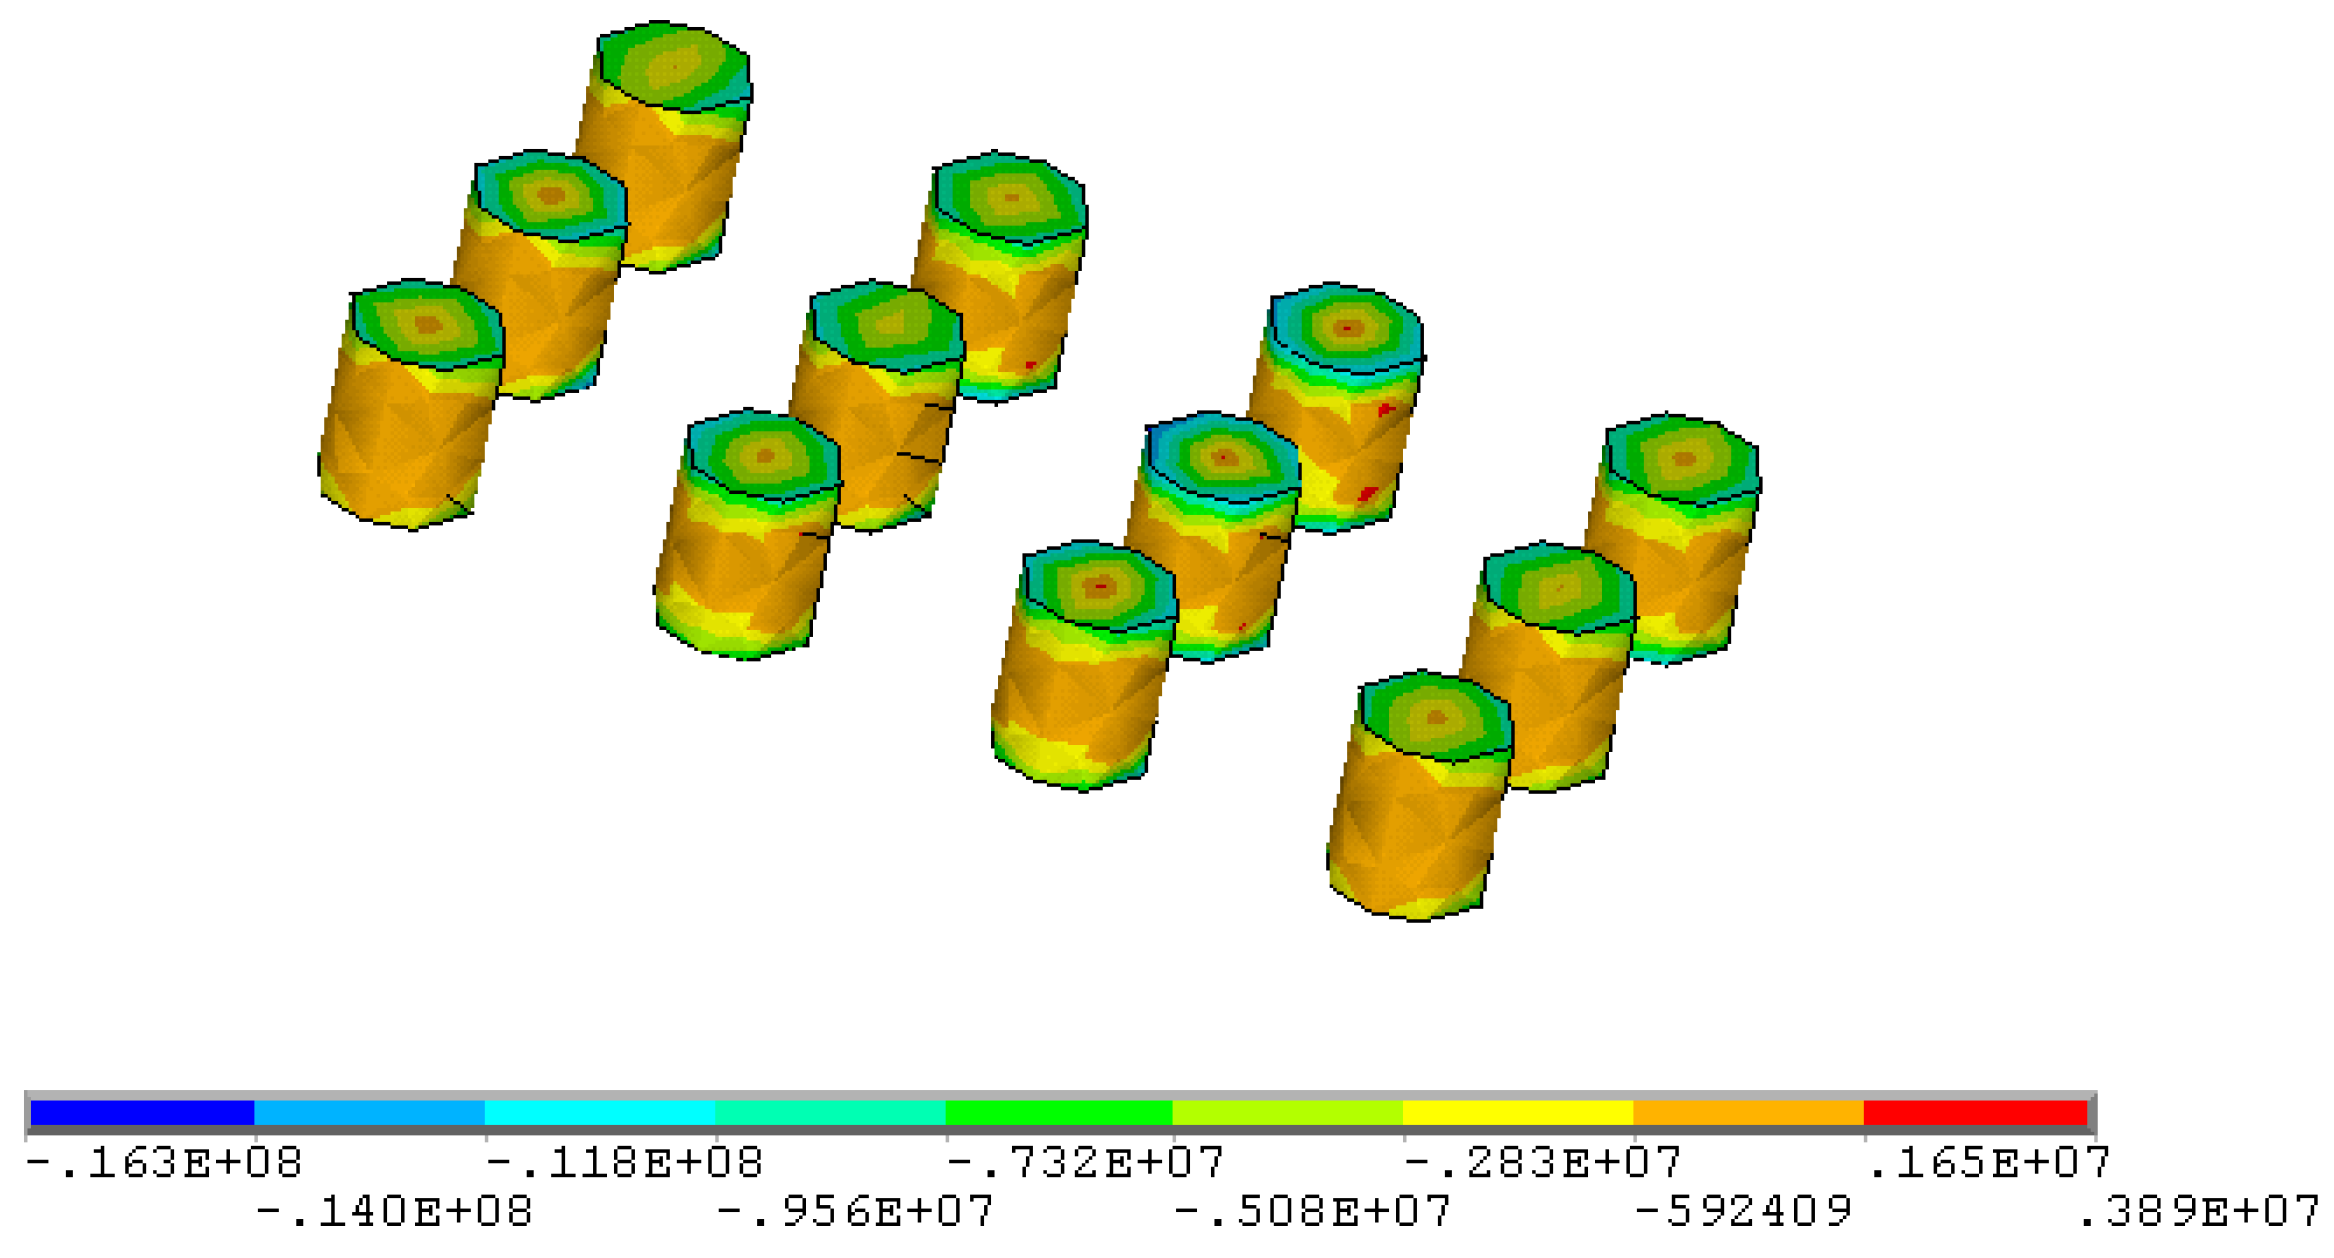
Figure 36.
Maximum principal stress distribution in the middle of the pillar at 1480 mL of scheme 9 (parameters of scheme 9: stope height 4.5 m, pillar diameter 4 m, pillar spacing 7 m, pillar row spacing 8 m).
Figure 36.
Maximum principal stress distribution in the middle of the pillar at 1480 mL of scheme 9 (parameters of scheme 9: stope height 4.5 m, pillar diameter 4 m, pillar spacing 7 m, pillar row spacing 8 m).
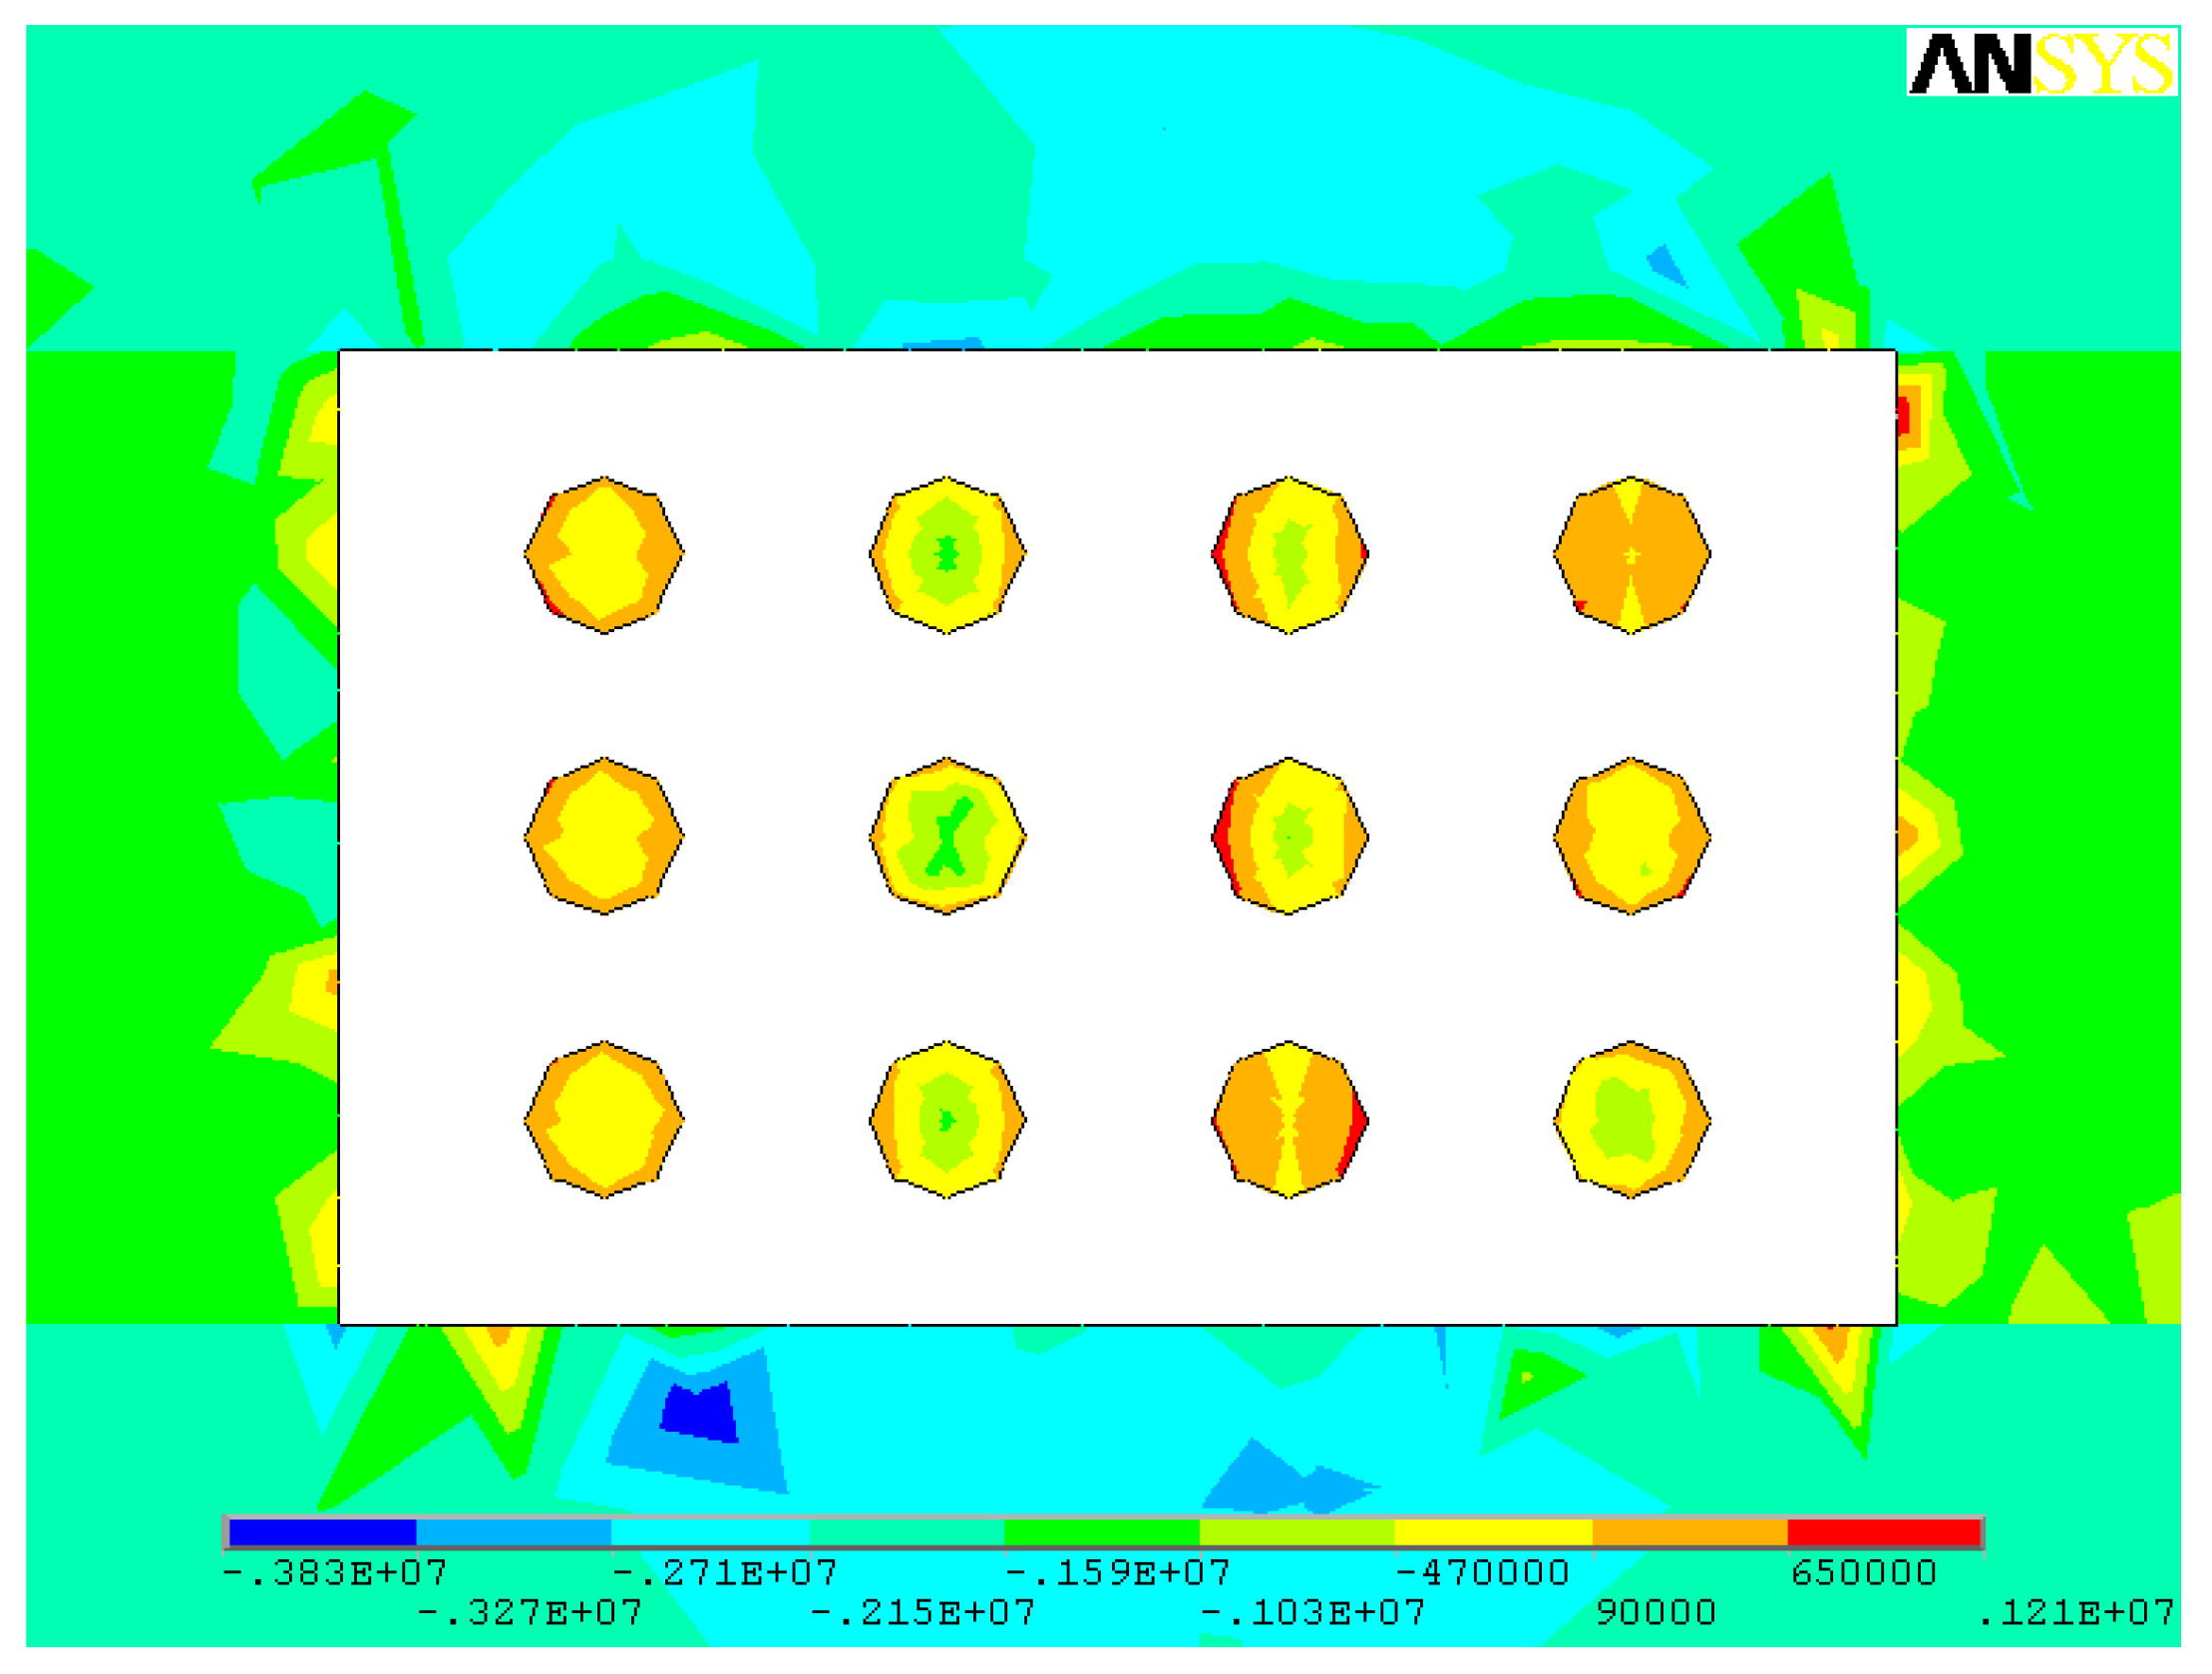
Figure 37.
Minimum principal stress distribution of scheme 9 pillars at 1480 mL (parameters of scheme 9: stope height 4.5 m, pillar diameter 4 m, pillar spacing 7 m, pillar row spacing 8 m).
Figure 37.
Minimum principal stress distribution of scheme 9 pillars at 1480 mL (parameters of scheme 9: stope height 4.5 m, pillar diameter 4 m, pillar spacing 7 m, pillar row spacing 8 m).
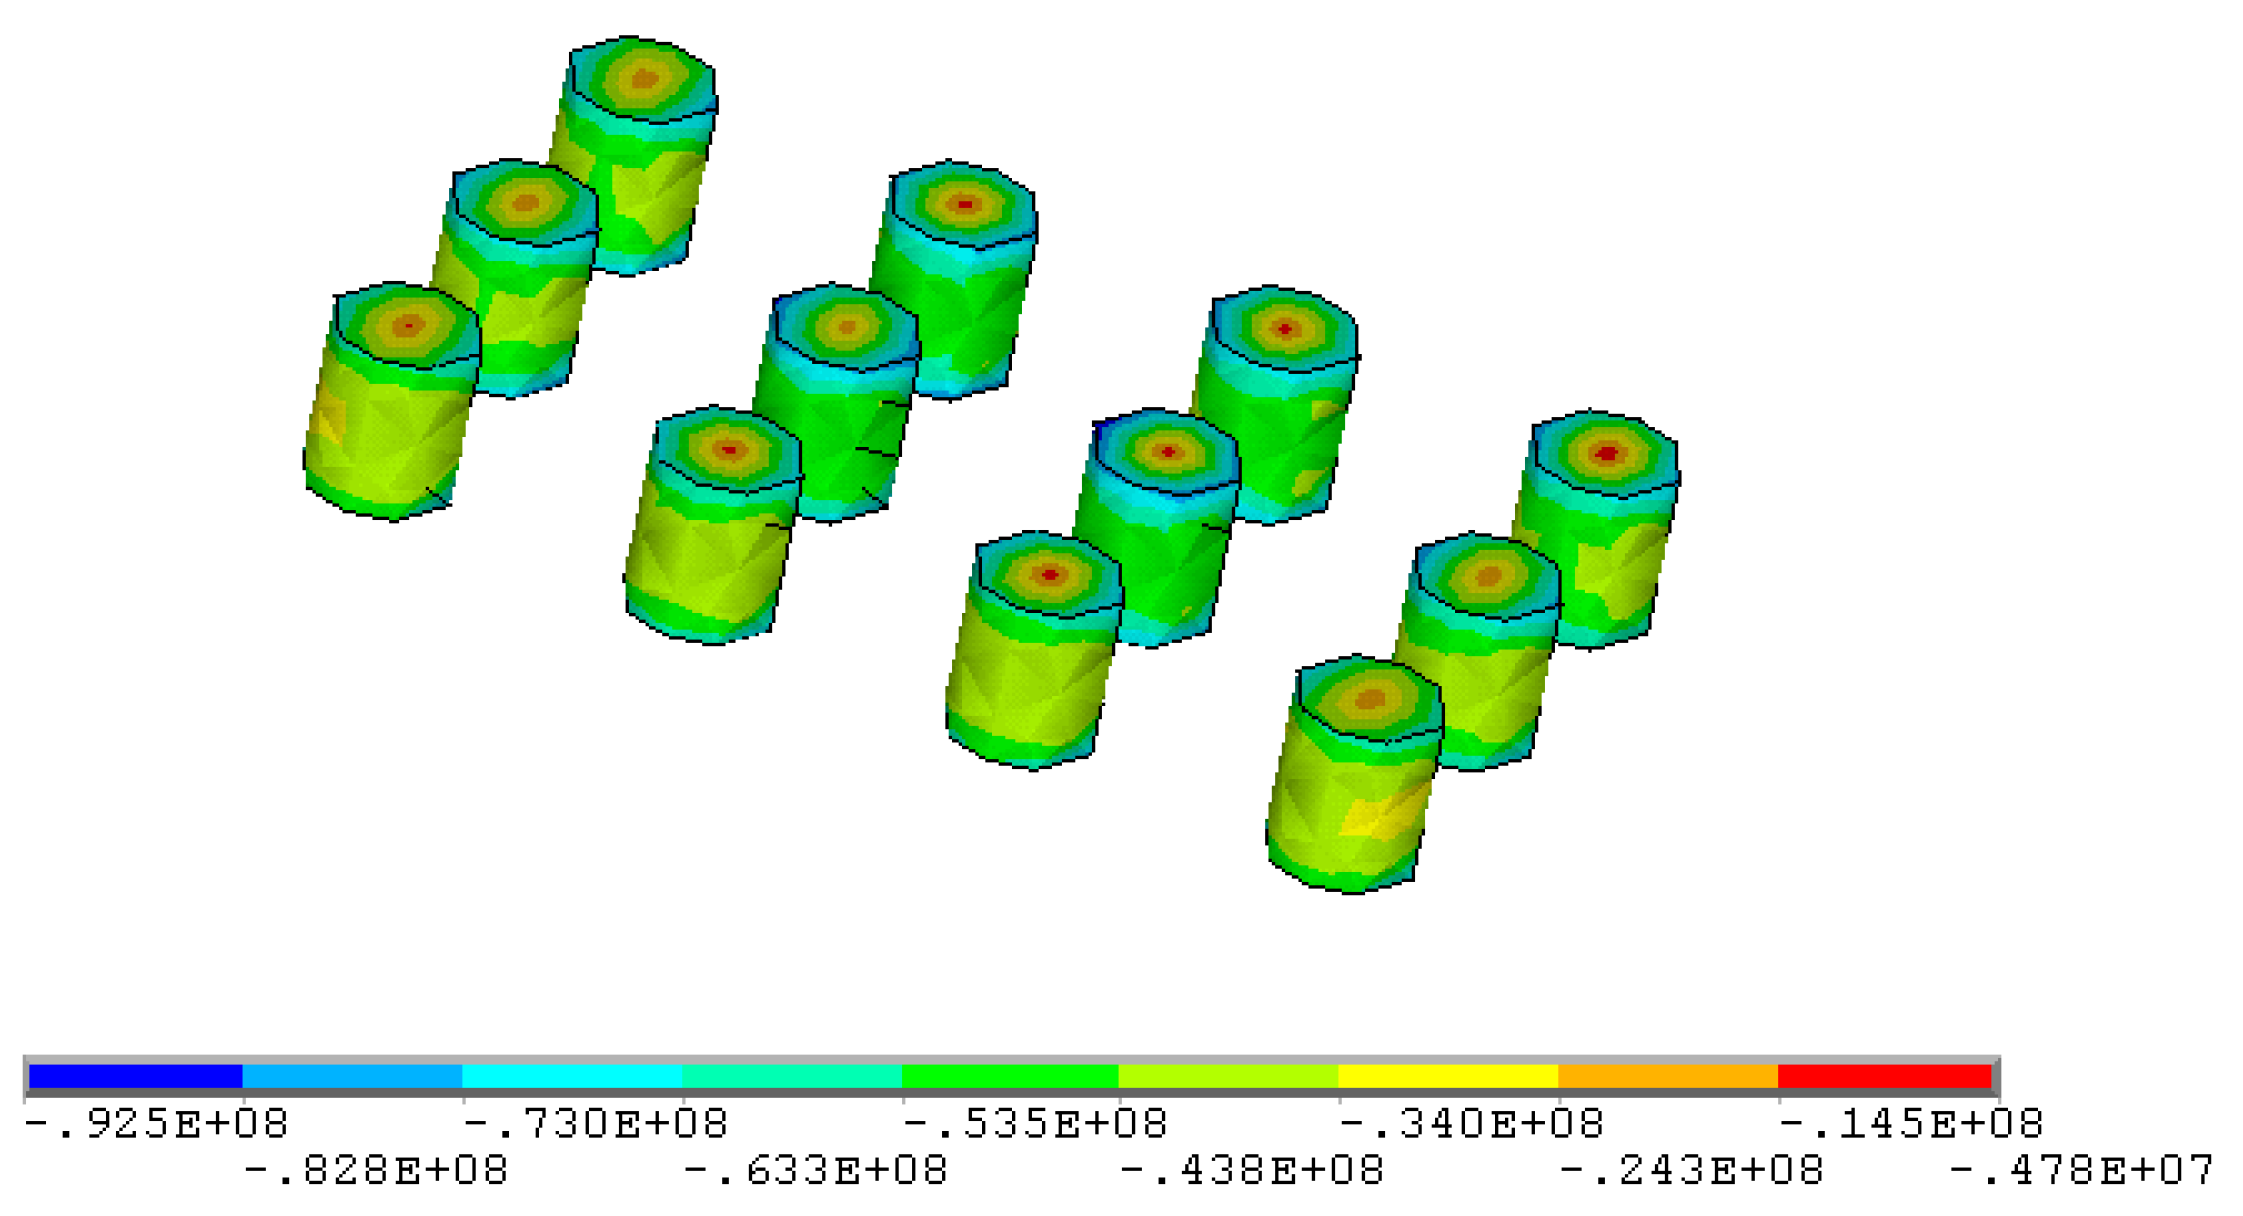
Figure 38.
Minimum principal stress distribution in the middle of the pillar at 1480 mL of scheme 9 (parameters of scheme 9: stope height 4.5 m, pillar diameter 4 m, pillar spacing 7 m, pillar row spacing 8 m).
Figure 38.
Minimum principal stress distribution in the middle of the pillar at 1480 mL of scheme 9 (parameters of scheme 9: stope height 4.5 m, pillar diameter 4 m, pillar spacing 7 m, pillar row spacing 8 m).
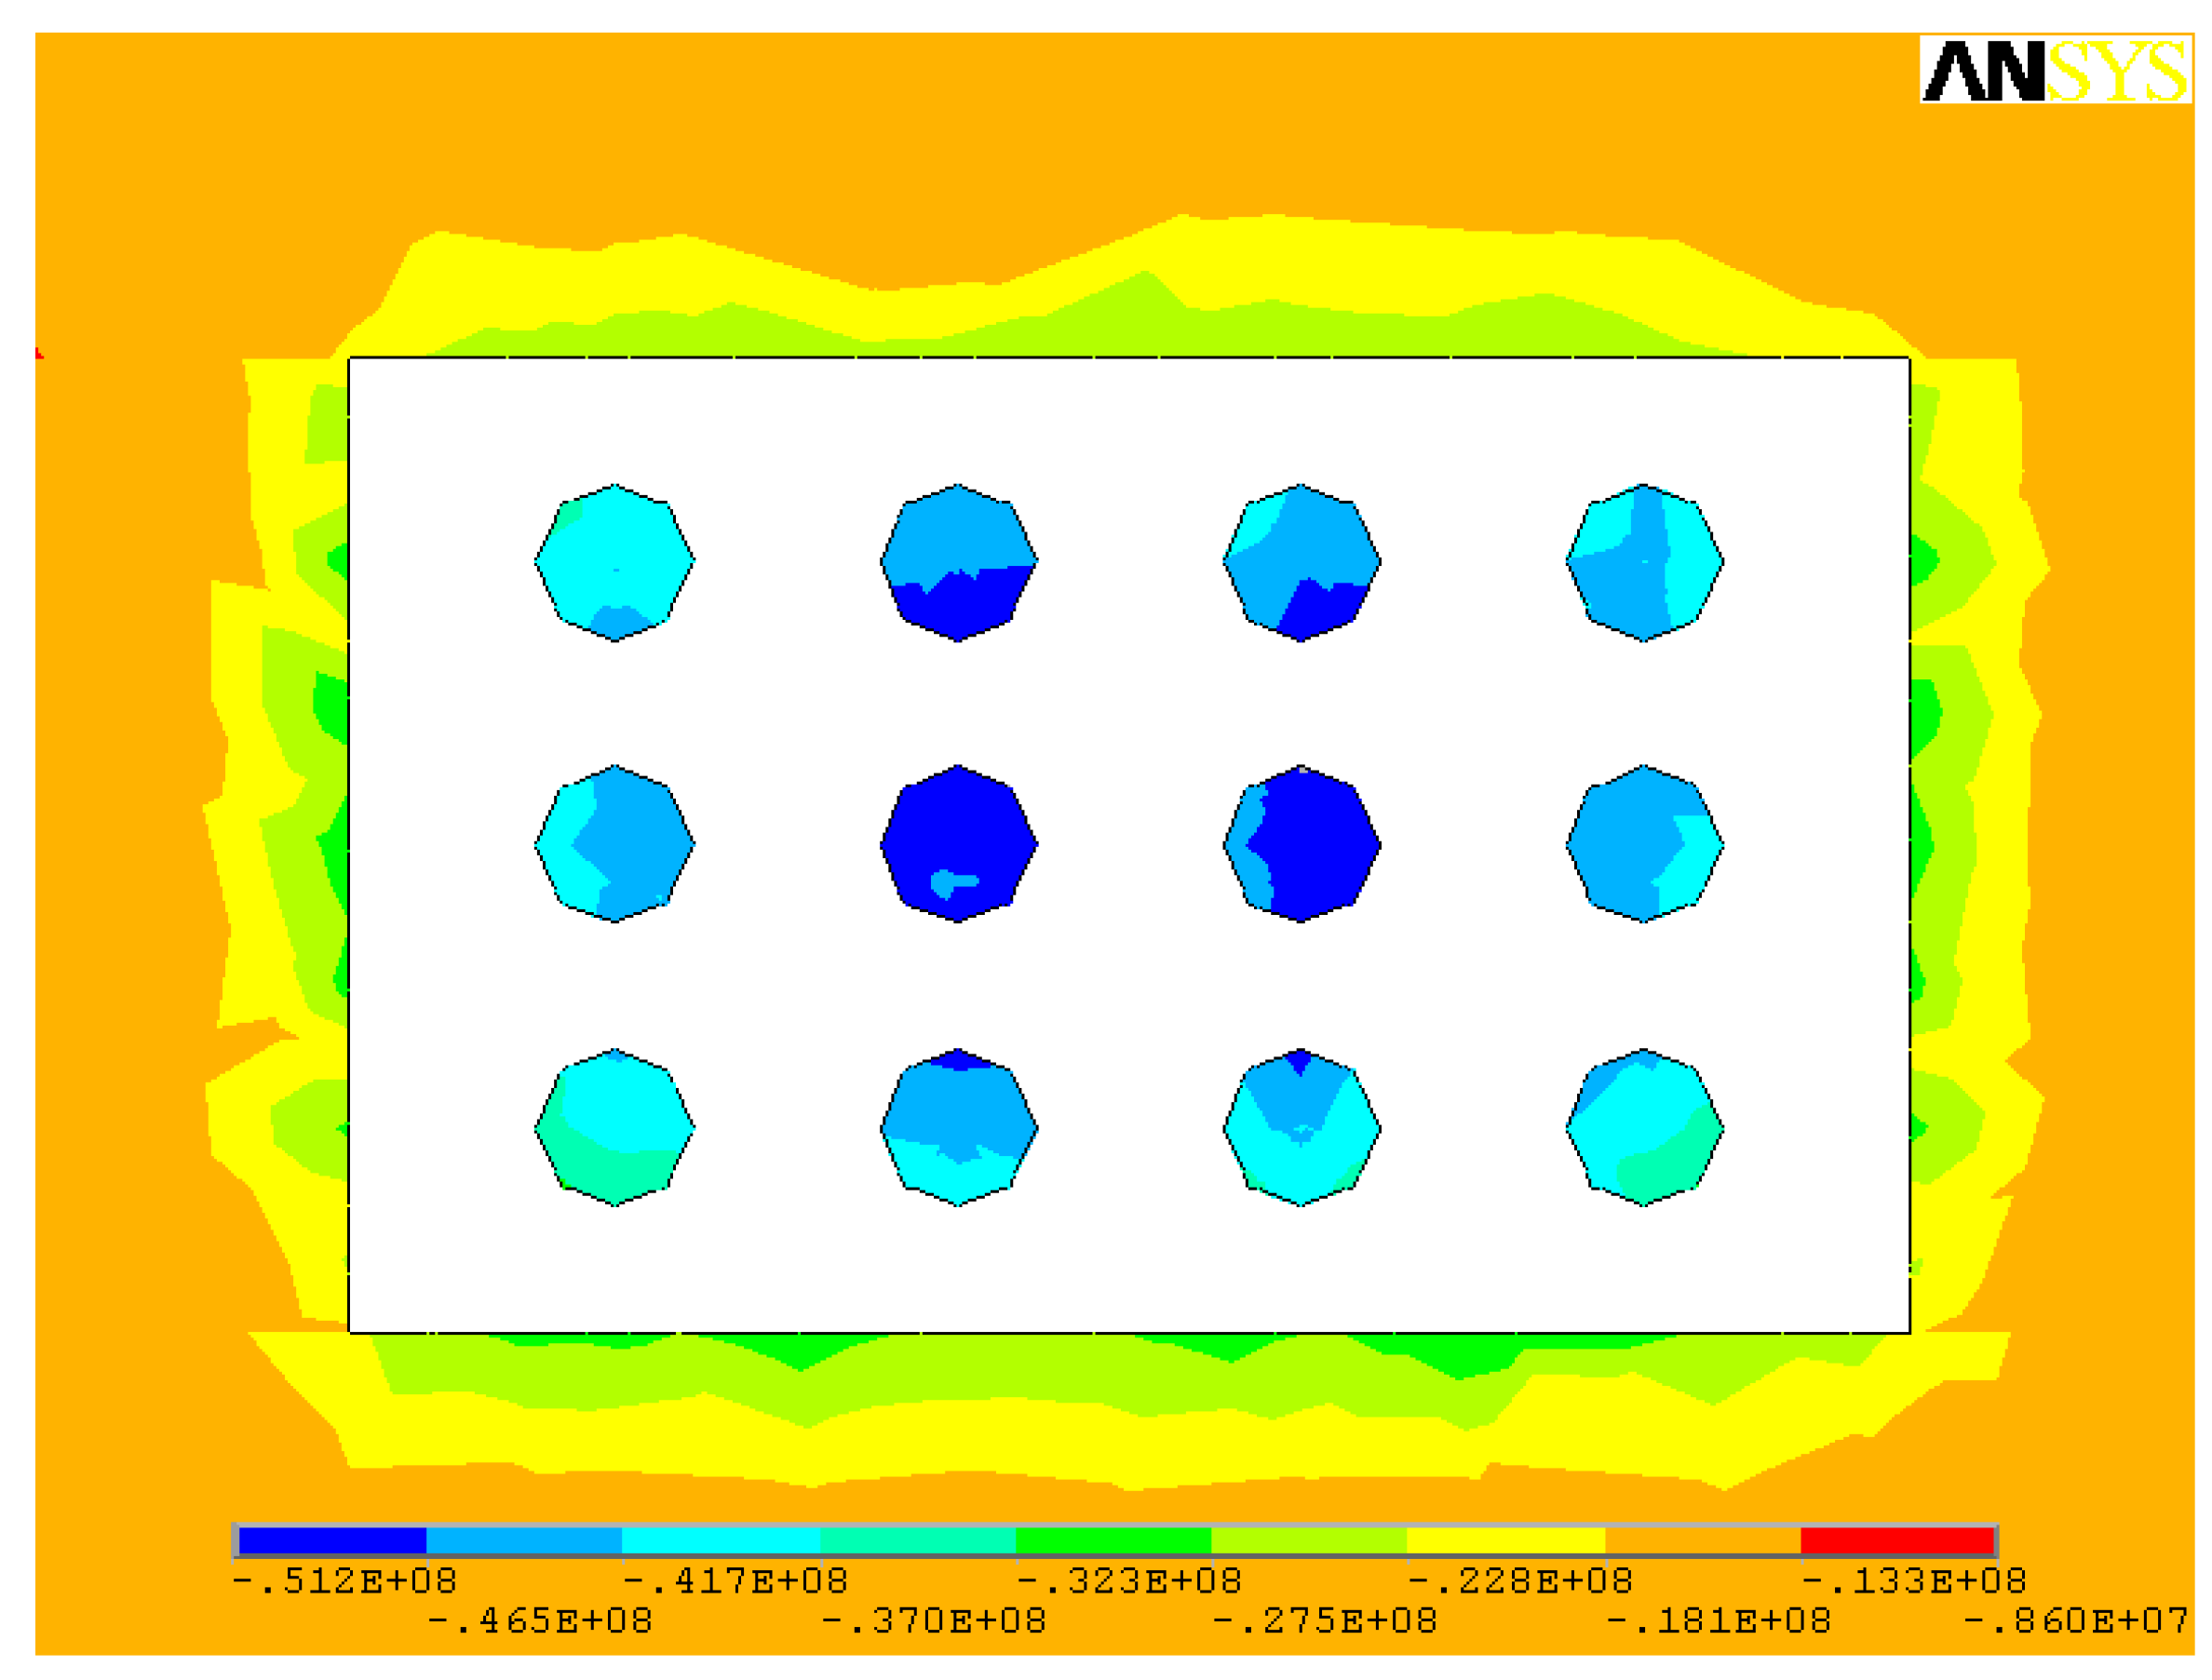
Figure 39.
Maximum compressive stress in the ore pillars of schemes 1 to 9 (compared with the uniaxial compressive strength of the ore (97.62 MPa)).
Figure 39.
Maximum compressive stress in the ore pillars of schemes 1 to 9 (compared with the uniaxial compressive strength of the ore (97.62 MPa)).
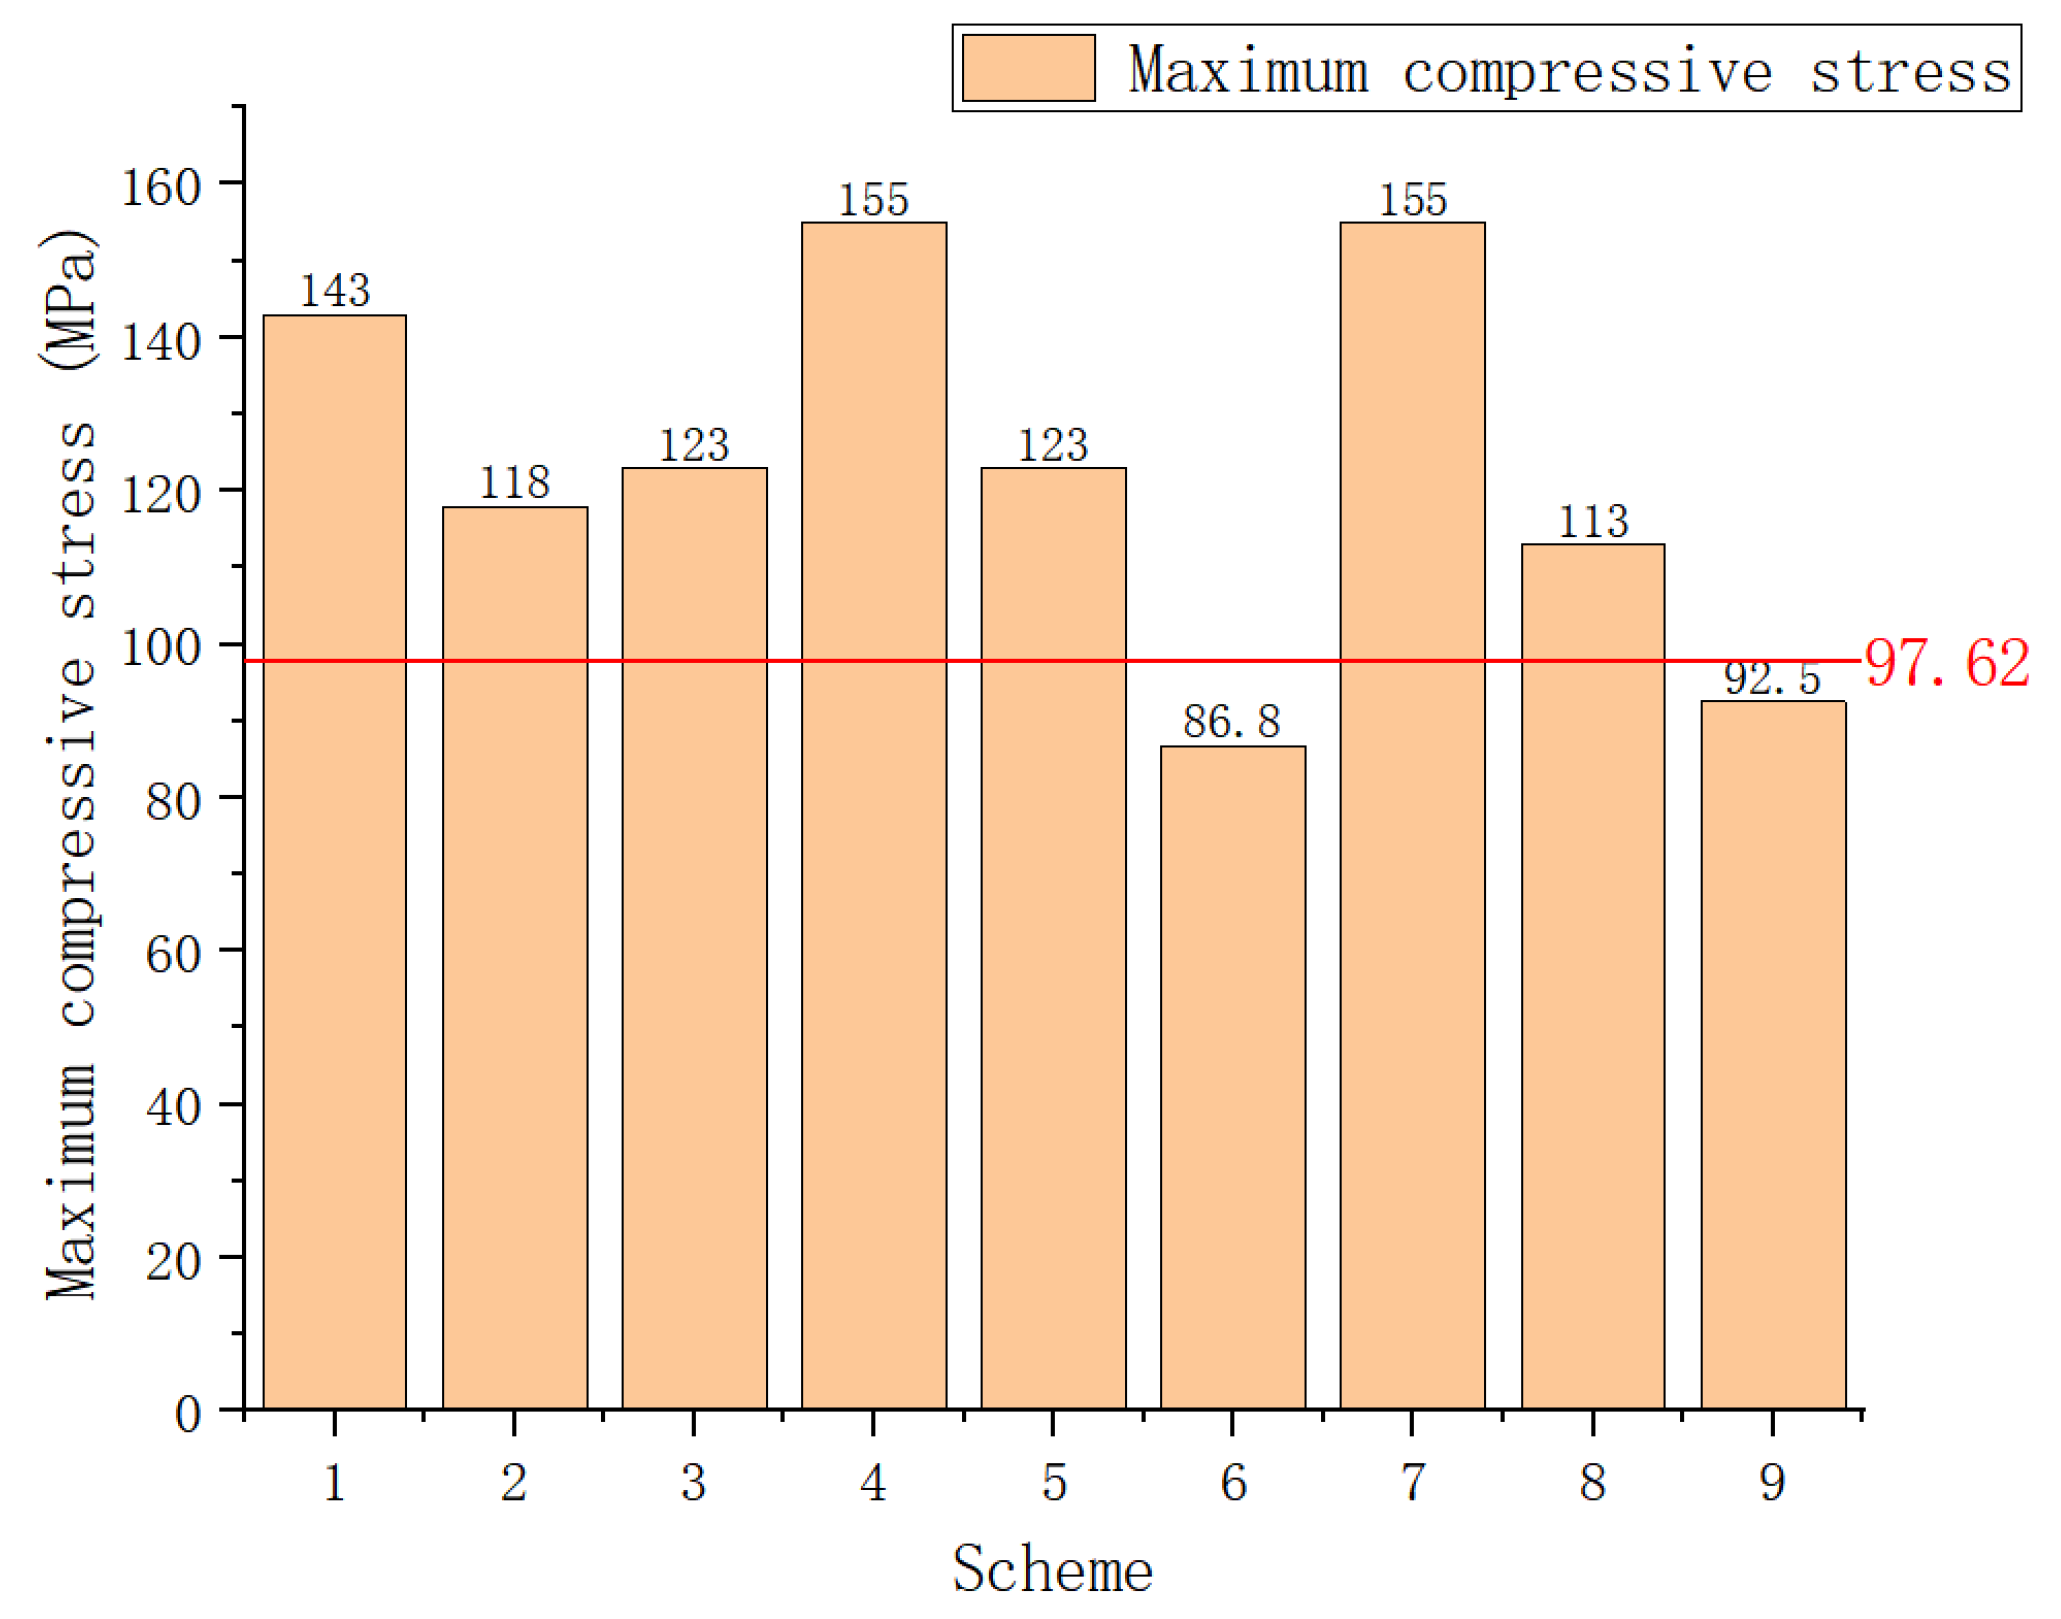
Figure 40.
Designed ore recovery rate of schemes 1 to 9.

Table 1.
Physical and mechanical parameters of Bainiuchang’s ore rocks.
| Ore Rock Type | σc /MPa | σt /MPa | τ /MPa | c /MPa | φ /(°) | E /GPa | ρ /g·cm−3 | μ |
|---|---|---|---|---|---|---|---|---|
| Argillaceous Limestone | 58.30 | 3.76 | 36.81 | 3.47 | 28.38 | 9.37 | 2.74 | 0.25 |
| Mudstone | 35.42 | 1.99 | 30.64 | 1.14 | 17.79 | 4.51 | 2.79 | 0.19 |
| Siltstone | 77.14 | 2.78 | 37.57 | 4.08 | 35.97 | 14.88 | 2.64 | 0.27 |
| Ore body | 97.62 | 2.07 | 50.86 | 6.58 | 42.93 | 12.60 | 4.00 | 0.22 |
Table 2.
Numerical simulation results of the recovery process before optimization.
| No. | Stress Parameter | Step 1 (Before Mining) | Step 2 (Mining Strip Rooms) | Step 3 (Mining Strip Pillars) |
|---|---|---|---|---|
| 1 | σ1 (MPa) | −1.84~−0.49 | −14.2~4.68 | −26.0~4.42 |
| 2 | σ2 (MPa) | −2.07~−0.98 | −16.3~−1.3 | −36.4~1.41 |
| 3 | σ3 (MPa) | −16.4~−12.5 | −68.5~−16.4 | −142.0~−10.9 |
| 4 | τxy (MPa) | −0.15~0.12 | −1.70~−1.54 | −9.48~9.63 |
| 5 | τyz (MPa) | −0.67~0.70 | −21.7~22.9 | −25.3~25.8 |
| 6 | τzx (MPa) | −0.007~0.177 | 2.16~2.83 | −32.3~34.7 |
Table 3.
Nine optimization schemes for orthogonal design.
| Factor | Stope Height/m | Pillar Diameter/m | Pillar Spacing/m | Pillar Row Spacing/m | |
|---|---|---|---|---|---|
| Scheme | |||||
| 1 | 2.5 | 2 | 4 | 6 | |
| 2 | 2.5 | 3 | 6 | 8 | |
| 3 | 2.5 | 4 | 8 | 10 | |
| 4 | 3.5 | 2 | 5 | 8 | |
| 5 | 3.5 | 3 | 7 | 7 | |
| 6 | 3.5 | 4 | 6 | 9 | |
| 7 | 4.5 | 2 | 6 | 7 | |
| 8 | 4.5 | 3 | 5 | 9 | |
| 9 | 4.5 | 4 | 7 | 8 | |
Table 4.
Numerical calculation with stope height of 2.5 m.
| No. | Stress Parameter | Scheme 1 | Scheme 2 | Scheme 3 |
|---|---|---|---|---|
| 2 m × 4 m × 6 m | 3 m × 6 m × 8 m | 4 m × 8 m × 10 m | ||
| 1 | σ1/MPa | −25.6~5.83 | −20.3~4.04 | −19.6~4.33 |
| 2 | σ3/MPa | −143.0~−1.98 | −118.0~−6.25 | −123.0~−6.22 |
| 3 | τxz/MPa | −33.7~36.3 | −27.9~27.4 | −28.0~25.0 |
Table 5.
Numerical calculation with stope height of 3.5 m.
| No. | Stress Parameter | Scheme 4 | Scheme 5 | Scheme 6 |
|---|---|---|---|---|
| 2 m × 5 m × 8 m | 3 m × 7 m × 7 m | 4 m × 6 m × 9 m | ||
| 1 | σ1/MPa | −24.6~4.96 | −17.9~4.34 | −14.4~3.18 |
| 2 | σ3/MPa | −155.0~−1.08 | −123.0~−3.91 | −86.8~−6.46 |
| 3 | τxz/MPa | −39.9~37.3 | −28.0~27.2 | −19.6~19.6 |
Table 6.
Numerical calculation with stope height of 4.5 m.
| No. | Stress Parameter | Scheme 7 | Scheme 8 | Scheme 9 |
|---|---|---|---|---|
| 2 m × 6 m × 7 m | 3 m × 5 m × 9 m | 4 m × 7 m × 8 m | ||
| 1 | σ1/MPa | −25.3~6.01 | −19.3~4.61 | −16.3~3.89 |
| 2 | σ3/MPa | −155.0~−1.1 | −113.0~−2.68 | −92.5~−4.78 |
| 3 | τxz/MPa | −35.3~37.8 | −27.6~28.3 | −20.6~21.0 |
Publisher’s Note: MDPI stays neutral with regard to jurisdictional claims in published maps and institutional affiliations. |
© 2022 by the authors. Licensee MDPI, Basel, Switzerland. This article is an open access article distributed under the terms and conditions of the Creative Commons Attribution (CC BY) license (https://creativecommons.org/licenses/by/4.0/).
Share and Cite
MDPI and ACS Style
Qiu, H.-Y.; Huang, M.-Q.; Weng, Y.-J. Stability Evaluation and Structural Parameters Optimization of Stope Based on Area Bearing Theory. Minerals 2022, 12, 808. https://doi.org/10.3390/min12070808
AMA Style
Qiu H-Y, Huang M-Q, Weng Y-J. Stability Evaluation and Structural Parameters Optimization of Stope Based on Area Bearing Theory. Minerals. 2022; 12(7):808. https://doi.org/10.3390/min12070808
Chicago/Turabian StyleQiu, Hao-Yu, Ming-Qing Huang, and Ya-Jie Weng. 2022. "Stability Evaluation and Structural Parameters Optimization of Stope Based on Area Bearing Theory" Minerals 12, no. 7: 808. https://doi.org/10.3390/min12070808
Note that from the first issue of 2016, this journal uses article numbers instead of page numbers. See further details here.