
A Mine-to-Crusher Model to Minimize Costs at a Truckless Open-Pit Iron Mine in Brazil
by
 , ,
, ,
Vidal Felix Navarro Torres
1 ,
,
Janine Rodrigues Figueiredo
1,*,
Raul Carretero De La Hoz
2,
Márcio Botaro
3 and
Leonardo Soares Chaves
3 1
S/N, Conjunto de Laboratórios da Escola de Minas, UFOP, Instituto Tecnológico Vale, Rua Prof. Paulo Magalhães Gomes, Morro do Cruzeiro, Ouro Preto, MG 35400-000, Brazil
2
Ernst & Young Global Limited, Rua Antônio de Albuquerque, 156-10 andar, Belo Horizonte, MG 30112-010, Brazil
3
S/N Vila do Sossego, Vale S.A., Av. Mina do Sossego, Canaã dos Carajás, PA 68537-000, Brazil
*
Author to whom correspondence should be addressed.
Minerals 2022, 12(8), 1037; https://doi.org/10.3390/min12081037
Submission received: 1 July 2022
/
Revised: 12 August 2022
/
Accepted: 16 August 2022
/
Published: 18 August 2022
(This article belongs to the Section Mineral Processing and Extractive Metallurgy)
Abstract
:Innovation has an important role in improving the productivity, safety and sustainability of mining operations. Historically, ore transport was done by diesel trucks, but with the commitment to reduce CO2 emissions and increase mine safety, mining companies have invested in innovative, more sustainable ore transport technologies. The innovative truckless system, with the intensive use of belt conveyors to transport the ore from the mine to the processing plant, represents a huge project and capital investment. However, operation costs are lower when considering the decrease of fuel use and also maintenance expenses. This paper presents an economic analysis of a mine-to-crusher model to estimate and minimize the operating expenses of an open-pit iron mine located in northern Brazil. The activities at this truckless mine consist of drilling and blasting, loading and primary crushing. In this study, the calibration of the mine-to-crusher model was based on rock fragmentation from the blasting phase. The costs of each mine operation phase were estimated for an optimum 80% passing size (P80). The calibration was conducted with the values of technical and economic parameters in 2019. By considering the structural lithologies of canga and jaspillites, we concluded that the P80 value that minimizes costs might be in the range from 0.31 to 0.34 m.
1. Introduction
With the development of deep iron ore mines and underground mine explorations [1], harder and more compact ore is being mined now than in the past, which directly impacts operating costs. The operating costs of the mining industry are distributed into mining, milling (or processing) and general and administration. Furthermore, in the mine phase, the activities to exploit mineral reserves consist of drilling, blasting, loading and hauling. The operating costs of these activities are characterized by equipment operation and maintenance, electricity and fuel use, chemical inputs and personnel [2]. The minimization of mine operating costs and increase in productivity are important goals for developing a more sustainable mining industry. As these very large mining operations have increased in scale, their operating costs have also increased.
Traditionally, in open-pit mines, the ore has been predominantly mined by conventional mining systems, including shovels and trucks. However, with increasing operating costs associated with hauling rock farther, longer hauling cycle times, increasing diesel prices [3] and environmental and safety commitments, several innovative projects for mining related to loading and hauling have been adopted by mine companies. Aguayo et al. [4] studied the application of a surge loader as an alternative into the shovel-truck system. This technology includes an equipment between the shovel and trucks to increase the safety and productivity of the loading and hauling phases.
The project of mining without trucks is attracting interest for its significant environmental sustainability and potential to reduce the operating costs [5]. These include Chuquicamata in Chile, Highland Valley in Canada, Bingham Canyon in the USA [6], Loy Yang and Clermont Coal in Australia and Drummond’s Pribbenow mine in Columbia [5]. A truckless mining system or in-pit crushing and conveying system is a sustainable and cost-efficient alternative compared to hauling by trucks, considering long hauls and non-selective mining and dumping. On the other side, technical personnel shortages and increasing concerns to reduce greenhouse gas emissions also enhance the truckless system as a feasible alternative [5].
In the main configuration available to the truckless system, the mining method consists of drilling, blasting, loading (done by a shovel, which delivers material directly onto an in-pit conveying system for delivery out of pit) or in-pit primary crushing and a long-distance belt conveyor for hauling the material to the processing plant.
Considering these different activities of the mine phases, the minimum costs corresponding to each mine unit operation do not necessarily correspond to the minimum total cost. Thus, it is necessary to integrate the unit operations of drilling, blasting, loading, hauling and crushing to obtain the minimum total cost [7].
Between 1996 and 2002, the collaborative research project “Optimization of fragmentation for downstream processing”, developed by the Julius Krutschnitt Mineral Research Center (JKMRC) in Queensland, Australia, sought to improve mining and ore processing activities by using mathematical modeling and simulations to integrate the different stages of the mineral production chain [8]. The technology developed in this project became known worldwide as “Mine to Mill”. Mckee [9] presented a history of this integrated study from blasting to grinding, with concepts and case studies from the project. Later, emerging technologies, such as image analysis, simulation software and ore tracking devices, made it possible to improve the technique. Adel et al. [10] proposed the adaptation of the technology developed by the JKMRC for application in the aggregate industry, applying the models to two quarries in the United States. Valery et al. [11] presented a methodology developed for this integration between the different stages and reported important gains with its application, generally between 5 and 20%. Mahmoud [12] developed an integrated model for optimizing the production process from mining to milling. Recently, Varannai et al. [13] studied the optimization of the comminution chain through an ore transportation model, between the crushing and the milling stages of the Aitik mine. Furthermore, they showed the importance of reducing the transportation time between these two stages, which has an impact on mine costs.
Navarro Torres el al. [14] has been studying this topic since 2016, developing mathematical models that include the production chain from blasting to crushing/milling based on specific explosive energy or particle size distribution and validating these models for different hard lithologies present in some iron ore mines in Brazil.
The 80% passing size (P80) in the cumulative particle size distribution is used as a representative size of the fragmentation to optimize comminution processes in the hard-rock mining industry [7,15,16]. Faramarzi et al. [17] evaluated the fragmentation risk and predicted rock fragmentation in bench blasting, considering the change in blasting design. Zhang et al. [18] investigated the effect of stemming conditions on rock fragmentation to hard-rock conditions. Ke et al. [19] used a neural network to predict the block rate in deep hole blasting in a gold and copper mine, to optimize blasting fragmentation and reduce costs. Therefore, rock fragmentation distribution influences the operating costs of all mining unit operations [20], impacting the productivity of loading and transport and the productivity, energy consumption and circulating loads in the crushing and grinding stages [21].
Hard-rock mines have been operated with large expenses due to energy consumption and their consequent costs, putting pressure on mines to cut costs and optimize their operations [22]. In this context, new methodologies to investigate costs optimization might be useful to these operations. This paper presents a mine-to-crusher model applied to an exceptional mining case study. The objective of this study was to present and calibrate an economic model to calculate and minimize the operating costs for a truckless hard-rock iron ore mine in Brazil. The model correlated the mine phase operating costs with the P80 size resulting from blasting material. An economic database and key performance indicators (KPIs) were collected for the unit operations of drilling, blasting, loading and primary crushing in 2019, and they were statistically processed to estimate the operating costs, according to the mine-to-crusher model equations, as presented in the following sections. The model was applied to minimize the operating costs by considering the P80 sizes for the hard lithologies on site: structural canga and jaspillite. The methodology complies with blasting subject to optimize the blasting design and obtain an optimal P80. Therefore, the mine-to-crusher model could be used by hard-rock mine sites, which deal with operating costs minimization.
2. Case Study
The case study was an open-pit mining system located in northern Brazil, which consists of four independent truckless systems with long-distance belt conveyors (LDBCs) to transport the ore to the processing plant. The mining area has a total area of 1400 ha, and the total ore production has been estimated to be 90 million tons per year, with a grade of approximately 66.70% iron. The mining process starts with cable shovels (CAT 7495) that dig and load the material directly into the mobile size rig (MSR) and mobile crusher rig (MCR) systems. The primary crushers are four mobile roller crushers (PF 200–9500) with the feed size between 0.80 m to 1.20 m and a maximum product size of 0.35 m; the crushed ore is transported through a system of bench conveyors to a fifth crusher. Then, LDBCs transport the ore to the processing plant (Figure 1).
The ore deposit is composed of a lateritic cover (canga) over a main body of friable hematite with jaspillite lenses, as shown in Figure 2.
The main types of iron-rich materials in the region of the mine deposit are friable hematite, compact hematite, manganese hematite, jaspillite, rich jaspillite, structural canga and chemical canga. Other lithologies found at the site and considered sterile are the enclosing rocks of the iron formations, which are composed of mafic rocks and may or may not be decomposed.
3. Materials and Methods
At the first stage of this work, all mine site operating costs from blasting to primary crushing were modelled using equations combining technical and economic parameters, including the P80 as a cost parameter. In the second stage, the methodology considered characterized the technical parameters and real costs of the process at the truckless mine based on a robust and complex database of information corresponding to the year 2019. The range of mine unit costs, that is, drilling and blasting, loading and primary crushing operations, were processed, statically analyzed and validated. Technical parameters of the mine operations were estimated considering the structural canga and jaspillite lithologies. Real data for blasting design were correlated to the particle size distribution to predict the P80 size range used as the input.
In the third stage, the total costs of the truckless mine were estimated and calibrated according to the rock fragmentation variability (P80). Operation process knowledge and scientific references were consulted to support the calibration [2,3,7,22]. Finally, during the cost minimization stage, the operating costs of mine phases were assessed considering 0.20 and 0.40 m as an optimal region of P80 size. In the following sections, the model equations for cost estimation are presented.
3.1. Drilling and Blasting
The productivity of drilling and blasting operations can be measured by the particle size distribution of rock fragments resulting from blasting [7]. The particle size distribution can be optimized by changing the blast design parameters, for example, the blasthole diameter [23], spacing, burden, bench height [19], stemming and specific explosive charge, which directly influence costs [24]. Through these parameters, the operating costs of drilling and blasting (Cpd), as a function of P80, can be calculated by Equation (1):
where H is the bench height (m); J is the stemming length (m); Qex is the specific explosive charge per hole (kg/hole); $ex is the explosive cost (USD); $ai is the blasting accessories cost; ρr is the in-situ rock density (t/m3); Ar is the rock factor; P80 is the 80% passing size (cm); RWS is the relative weight strength of the explosive (%).
3.2. Loading and Primary Crushing
The loading operation through shovel equipment is impacted by several characteristics of muck piles, such as the particle size distribution resulting from blasting. Additionally, the lithology, operator skills and equipment operating conditions influence the loading productivity.
The shovel loading cycle time (Tc) consists of the dig time (te), the swing time (ti), the dump time (td), and the return swing time (tr) for one shovel load. The dig time is the part of the shovel loading cycle that is most sensitive to variation in muck pile characteristics [25]. To calibrate the dig time of a CAT 7495 cable shovel, the experimental model presented by Jethro and Shehu [26] was adopted and calibrated for this case study. The calibrated expression for the dig time as a function of P80, considering the coefficient an equal to 8.10 for structural canga and 7.30 for jaspillites, is shown in Equation (2):
Some studies have been developed to define the crushing productivity/capacity set through the crusher type [27,28]. The productivity of the primary roller crushers in this study is affected by the roller characteristics and the density of the ore fed. The calibration of the variation in productivity of the mobile primary crusher with respect to P80 was performed using the experimental model presented by Beyglou et al. [22]. That study considered an Allis Chalmers Superior 60–109 crusher with a diameter of 2.77 m and productivity from 3434 to 4801 t/h for crushing ore with a uniaxial compressive strength (USC) of 128 MPa. This is similar to the UCS of the structural canga (UCS of 100 MPa) and jaspillites (UCS of 100 to 400 MPa) from the truckless mine in this study.
The variation of the productivity of the primary crusher is an exponential function of P80, which results in higher productivity for smaller P80 and vice versa [22], which is totally reasonable. Applying this similarity to the truckless mobile primary crusher with an average productivity of 7700 t/h, the productivity as a function of P80 can be calculated as in Equation (3):
where Pbp (t/h) is the nominal productivity of the primary crusher. Then, the operating costs of loading and primary crushing, as functions of P80, can be estimated by the calibrated model Equations (4) and (5), respectively,
where $c is the hourly cost of the loading operation (USD/h); a is a coefficient depending on lithology, operator skills and equipment operating conditions; b and c are the operating coefficients for the shovel; θ is the swing angle of the shovel (°); td is the dumping time (s) and Lc is the shovel payload (t). For Equation (5), Wi is the Bond Work Index (kWh/t); P80bp is the 80% passing size of the product output of the crusher (μm); F80 is the 80% passing size of the ore feed to the crusher (μm); $e is the cost of electricity ($/kWh); $bp is the sum of the operating costs of people, materials, maintenance and others inputs ($/h) for primary crushing and f is the mass fraction greater than P80 that is actually crushed.
4. Results and Discussions
4.1. Model Calibration
For the model calibration, it was necessary to characterize the truckless mine real costs and their distribution; for these purposes, the mine operating costs were consolidated from the 2019 database and represented in Table 1 and Figure 3, respectively.
As shown in Table 1, the total mine cost included the operating costs of drilling and blasting, loading, truckless transport, infrastructure, mine support, and primary crushing, which totaled 2.43 USD/t. The costs of the drilling and blasting, loading and primary crushing chain, determined by model Equations (1), (4) and (5), totaled 1.02 USD/t. For this reason, it was necessary to increase this difference to the total mine cost.
It is worth mentioning that truckless transport represents just 14% of the total operating costs in this case study. In comparison, conventional shovel–truck mine systems for large open-pit mines usually have a haulage cost component in the range of 40%–50% of the operating mine costs. In addition to the operating costs, truckless systems have several advantages, such as the reduction in carbon emissions [5], potentially high vertical development rates and high productivity [6] associated with the mobility of the MCRs.
Unfortunately, the mine support and infrastructure operating costs were not related to P80 and were not minimized through the mine-to-crusher model. However, the infrastructure operating costs, which totaled 34% of the total mine operating costs, were higher than the infrastructure operating costs of other mines [6]. The total operating cost of the drilling and blasting, loading and primary crushing phases was 78.81 MUSD/year, and the cost distribution for these phases was 40, 21 and 39%, respectively.
In the case of loading and primary crushing operations, the mine-to-crusher model involves loading and primary crushing operations, exclusively considering truckless loading and truckless crushing. In both cases, it does not include the MCR or the 5th crushing, which are also located in the mine. In this sense, considering 100% of the truckless loading or crushing cost, the MCR and the 5th crushing costs represent 22%; therefore, the costs of Equations (4) and (5) should be weighted by 1.22.
The productivity in primary crushing at the truckless mine was considered to be the same as in the loading phase, as the shovels load the material directly into the hoppers of the crushers in the MSR and MCR systems. In this case, it was observed that the productivity of the crushers in MSR systems was less than their nominal capacities.
Technical and economic parameters from the complex and robust database allowed us to obtain key parameters for the production process of structural canga (CE), compact jaspillite (JC), highly compact jaspillite (JAC) and extremely compact jaspillite (JEC). Table 2, Table 3 and Table 4 show the mean parameters that were used for model calibration.
Finally, the calibrated model that allows us to estimate a value of P80 that minimizes the operating costs of a truckless mine (Cmine) in USD/t is expressed through Equation (6):
4.2. Cost Minimization
The cost minimization model developed for the truckless mine was applied for each lithologie: structural canga (CE), compact jaspillites (JC), highly compact jaspillite (JAC) and extremely compact jaspillite (JEC), considering the following production processes: (a) production chain of drilling and blasting, loading and primary crushing and (b) mine operation chain of drilling and blasting, loading, truckless transport, infrastructure, mine support and primary crushing.
4.2.1. Production Chain
The results obtained for the production chain of drilling and blasting, loading and primary crushing were consistent and allowed us to determine the range of fragmentation that minimized the total operating costs. Figure 4a,b shows the operating cost components for CE and JC, respectively.
From the analysis of Figure 4, the minimum operating cost of the production chain was 1.09 USD/t for drilling and blasting, loading and crushing; for CE, this was achieved with a P80 between 0.28 and 0.35 m. Considering the top size of the primary crushers, it was recommended to adopt a P80 between 0.29 and 0.34 m for this lithology. For JC, the minimum operating costs were 1.00 USD/t, with an optimum P80 between 0.29 and 0.34 m, less than the top size of the primary crushers.
Figure 5a,b shows the cost components for JAC and JEC, respectively.
According to the results of Figure 5, in the case of JAC, the minimum cost of operations was 1.06 USD/t and corresponded to P80 between 0.30 and 0.36 m, exceeding the top size of the primary crushers. In this case, the blasting design technology should focus on P80 between 0.30 and 0.34 m. For JEC with a minimum cost of 1.10 USD/t, P80 was between 0.31 and 0.37 m, also exceeding the top size of the primary crushers.
Notably, the P80 that minimized operating costs exceeded the top size of the mobile primary crushers for JAC and JEC lithologies. This demonstrates the importance of balancing the costs for blasting with explosives to reduce sizes with the need to limit sizes to 0.35 m.
4.2.2. Mine Operation Chain
The P80 cost-reduction model for the mine operation chain comprises drilling and blasting, loading, truckless transport, infrastructure, mine support and primary crushing. This allows us to observe the cost-minimizing P80 for the four studied lithologies (CE, JC, JAC and JEC) in Figure 6.
Figure 6 provides the values of P80 that minimize the total mine operating costs for each lithology: 0.31 m for structural canga, 0.31 m for compact jaspillite, 0.33 m for highly compact jaspillite and 0.34 m for extremely compact jaspillite. In a deeper analysis involving the total mining cost, it is possible to specify the value of P80 that minimizes overall operating costs. Considering the objective of optimum blasting with explosives, its parameters should be designed to achieve P80 between 0.29 and 0.33 m for CE, from 0.28 to 0.34 m for JC, from 0.30 to 0.34 cm for JAC and from 0.31 to 0.34 m for JEC. For these P80 values, the minimum total mine operating cost has an average of 2.48 USD/t, which is very close to the value from the database analysis in Table 1. Kim [29] achieved an optimization of mine-to-mill rock fracturing processes; the greatest cost savings were associated with increasing the blast energy in a hard-rock mine. The database of operational parameters for each mine production unit operations makes it feasible. The rock fragmentation of blasting directly contributes to reduced costs, improved performance and an increase in the efficiency of the post-blasting stages, loading and truckless system, as in [20].
5. Conclusions
The cost-minimization methodology through the mine-to-crusher model for the truckless mine represents a very important tool for cost-optimization purposes. This study allowed us to conclude that in the process of this case study, it is essential to limit P80 to the range from 0.31 to 0.34 m (less than the top size of the primary crushers) to minimize the operating costs of all mine phases. Especially considering the significant costs of blasting with explosives, which must be designed, applied and calibrated to achieve the optimal particle size distribution.
The overall cost analysis validates that truckless mine systems, specifically the hauling component, save energy and are cost-efficient compared to conventional shovel–truck systems. This study can be useful to assist mining companies in the choice of alternative methods to the traditional diesel trucks, aiming to reach a more sustainable hauling method. However, it is worth to mention that truckless systems are indicated to specific type of reserve, material, and mining method, as well as for the traditional mining method established in literature. Although this study was based on an iron-ore mine with specific characteristics, the mine-to-crusher model could be applied in other mine sites, considering suiting the model to the its conditions.
Author Contributions
Conceptualization, V.F.N.T., J.R.F. and L.S.C.; Methodology, V.F.N.T. and L.S.C.; Validation, V.F.N.T. and L.S.C.; Data Curation, R.C.D.L.H. and M.B.; Original Draft Preparation, V.F.N.T., J.R.F. and L.S.C.; Writing, Review & Editing, J.R.F.; Supervision, V.F.N.T. All authors have read and agreed to the published version of the manuscript.
Funding
This research received no external funding.
Institutional Review Board Statement
Not applicable.
Informed Consent Statement
Not applicable.
Data Availability Statement
Data were obtained from Vale S.A. and are available from the authors with the permission of Vale S.A.
Acknowledgments
The authors would like to thank the Vale Institute of Technology and Vale S.A. for the material and resources used for the preparation of this study.
Conflicts of Interest
The authors declare no conflict of interest.
References
- Bazaluk, O.; Petlovanyi, M.; Lozynskyi, V.; Zubko, S.; Sai, K.; Saik, P. Sustainable Underground Iron Ore Mining in Ukraine with Backfilling Worked-Out Area. Sustainability 2021, 13, 834. [Google Scholar] [CrossRef]
- Curry, J.A.; Ismay, J.L.M.; Jameson, J.G. Mine operating costs and the potential impacts of energy and grinding. Miner. Eng. 2014, 56, 70–80. [Google Scholar] [CrossRef]
- Paricheh, M.; Osanloo, M. Determination of the optimum in-pit crusher location in open-pit mining under production and operating cost uncertainties. In Proceedings of the 16th International Conference on Computer Applications in the Mineral Industries (Swemp2016), Istanbul, Turkey, 5–7 October 2016. [Google Scholar]
- Aguayo, I.A.O.; Nehring, M.; Ullah, G.M.W. Optimising productivity and safety of the open pit loading and haulage system with a surge loader. Mining 2021, 1, 167–179. [Google Scholar] [CrossRef]
- Atchison, T.; Morrison, D. In-pit crushing and conveying bench operations—Assessing the truckless mining option. Bulk Solids Handl. Arch. 2012, 32. Available online: https://news.bulk-online.com/bulk-solids-handling-archive/in-pit-crushing-and-conveying-bench-operations-assessing-the-truckless-mining-option.html (accessed on 11 August 2022).
- Tutton, D.; Streck, W. The application of mobile in-pit crushing and conveying in large, hard rock open pit mines. In Proceedings of the Mining Magazine Congress, Toronto, ON, Canada, 8–9 October 2009. [Google Scholar]
- Ozdemir, B.; Kumral, M. A system-wide approach to minimize the operational cost of bench production in open-cast mining operations. Int. J. Coal Sci. Technol. 2019, 6, 84–94. [Google Scholar] [CrossRef]
- Cameron, P.; Drinkwater, D.; Pease, J. The ABC of Mine to Mill and Metal Price Cycles; Australasian Institute of Mining and Metallurgy (AusIMM) Bulletin: Carlton, Australia, 2017; p. 9. [Google Scholar]
- Mckee, D.J. Understanding Mine to Mil, 1st ed.; The Cooperative Research Centre for Optimizing Resource Extraction (CRC ORE): Brisbane, Australia, 2013; p. 96. [Google Scholar]
- Adel, G.; Kojovic, T.; Thornton, D. Mine-to-mill optimization of aggregate production. In Semi-Annual Report No. 4; Virginia Polytechnic Institute & State University: Blacksburg, VA, USA, 2006; p. 168. [Google Scholar]
- Valery, W.; Jankovic, A.; La Rosa, D.; Dance, A.; Esen, S.; Colacioppo, J. Process integration and optimization from mine-to-mill. In Proceedings of the International Seminar on Mineral Processing Technology, Mumbai, India, 22–24 February 2007; pp. 557–581. [Google Scholar]
- Mahmoud, A.A.A. Development of an integrated mining and processing optimization system. Ph.D. Thesis, The Technische Universität Bergakademie Freiberg, Freiberg, Germany, April 2013; p. 234. [Google Scholar]
- Varannai, B.; Johansson, D.; Schunnesson, H. Crusher to Mill Transportation Time Calculation—The Aitik Case. Minerals 2022, 12, 147. [Google Scholar] [CrossRef]
- Navarro Torres, V.F.; Lopes, P.; Euzébio, E.; Peixoto, J.; Veras, E.; Reis, J.; Silva, L.S.; Lage, D. Effective Minimization of Production Costs in Open-Pit Mines [Minimização efetiva de custos de produção em minas a céu aberto]; Instituto Tecnlógico Vale: Ouro Preto, Brazil, 2017; p. 94. [Google Scholar]
- Nageshwaraniyer, S.S.; Kim, K.; Son, Y.-S. A mine-to-mill economic analysis model and spectral imaging-based tracking system for a copper mine. J. S. Afr. Inst. Min. Metall. 2018, 118, 7–14. [Google Scholar] [CrossRef]
- Park, J.; Kim, K. Use of drilling performance to improve rock-breakage efficiencies: A part of mine-to-mill optimization studies in a hard-rock mine. Int. J. Min. Sci. Technol. 2020, 30, 179–188. [Google Scholar] [CrossRef]
- Faramarzi, F.; Mansouri, H.; Ebrahimi Farsangi, M.A. A rock engineering system based model to predict rock fragmentation by blasting. Int. J. Rock Mech. Min. Sci. 2013, 60, 82–94. [Google Scholar] [CrossRef]
- Zhang, Z.X.; Qiao, Y.; Chi, L.Y.; Hou, F. Experimental study of rock fragmentation under different stemming conditions in model blasting. Int. J. Rock Mech. Min. Sci. 2021, 143, 104797. [Google Scholar] [CrossRef]
- Ke, B.; Pan, R.; Zhang, J.; Wang, W.; Hu, Y.; Lei, G.; Chi, X.; Ren, G.; You, Y. Parameter optimization and fragmentation prediction of fan-shaped deep hole blasting in Sanxin gold and copper mine. Minerals 2022, 12, 788. [Google Scholar] [CrossRef]
- Nikkhah, A.; Vakylabad, A.B.; Hassanzadeh, A.; Niedoba, T.; Surowiak, A. An evaluation on the impact of ore fragmented by blasting on mining performance. Minerals 2022, 12, 258. [Google Scholar] [CrossRef]
- Monjezi, M.; Rezaei, M.; Yazdian Varjani, A. Prediction of rock fragmentation due to blasting in Gol-E-Gohar iron mine using fuzzy logic. Int. J. Rock Mech. Min. Sci. 2009, 46, 1273–1280. [Google Scholar] [CrossRef]
- Beyglou, A.; Johansson, A.; Schunnesson, H. Target fragmentation for efficient loading and crushing—The Aitik case. J. S. Afr. Inst. Min. Metall. 2017, 117, 1053–1062. [Google Scholar] [CrossRef]
- Leng, Z.; Fan, Y.; Gao, Q.; Hu, Y. Evaluation and optimization of blasting approaches to reducing oversize boulders and toes in open-pit mine. Int. J. Min. Sci. Technol. 2020, 30, 373–380. [Google Scholar] [CrossRef]
- Zhang, Z.X. Impact of rock blasting on mining engineering. In Proceedings of the 5th International Conference & Exhibition on Mass Mining, Luleå, Sweden, 9–11 June 2008; pp. 671–680. [Google Scholar]
- Brunton, I.; Thornton, D.; Hodson, R.; Sprott, D. Impact of blast fragmentation on hydraulic excavator dig time. In Proceedings of the Fifth Large Open Pit Mining Conference, Kalgoorlie, Australia, 3–5 November 2003; Australasian Institute of Mining and Metallurgy (AuSIMM): Carlton, Australia; pp. 39–48. [Google Scholar]
- Jethro, M.A.; Shehu, S.A.; Kayode, T.S. Effect of Fragmentation on Loading at Obajana Cement Company Plc, Nigeria. Int. J. Sci. Eng. Res. 2016, 7, 608–620. [Google Scholar]
- Wills, B.A.; Finch, J.A. Wills’ Mineral Processing Technology. An Introduction to the Practical Aspects of Ore Treatment and Mineral Recovery, 8th ed.; Butterworth-Heinemann: Oxford, UK, 2015. [Google Scholar]
- Gupta, A.; Yan, D. Mineral Processing Design and Operations, 2nd ed.; Elsevier: Amsterdam, The Netherlands, 2016. [Google Scholar]
- Kim, K. Rock Fracturing & Mine to Mill Optimization. Ph.D. Thesis, The University of Arizona, Tucson, AZ, USA, 2012. Available online: http://hdl.handle.net/10150/242456 (accessed on 1 August 2022).
Figure 1.
Flowchart of loading and primary crushing operations in a truckless mine.

Figure 2.
Main lithologies of the truckless mine.

Figure 3.
Mine operating cost distribution of the truckless mine.
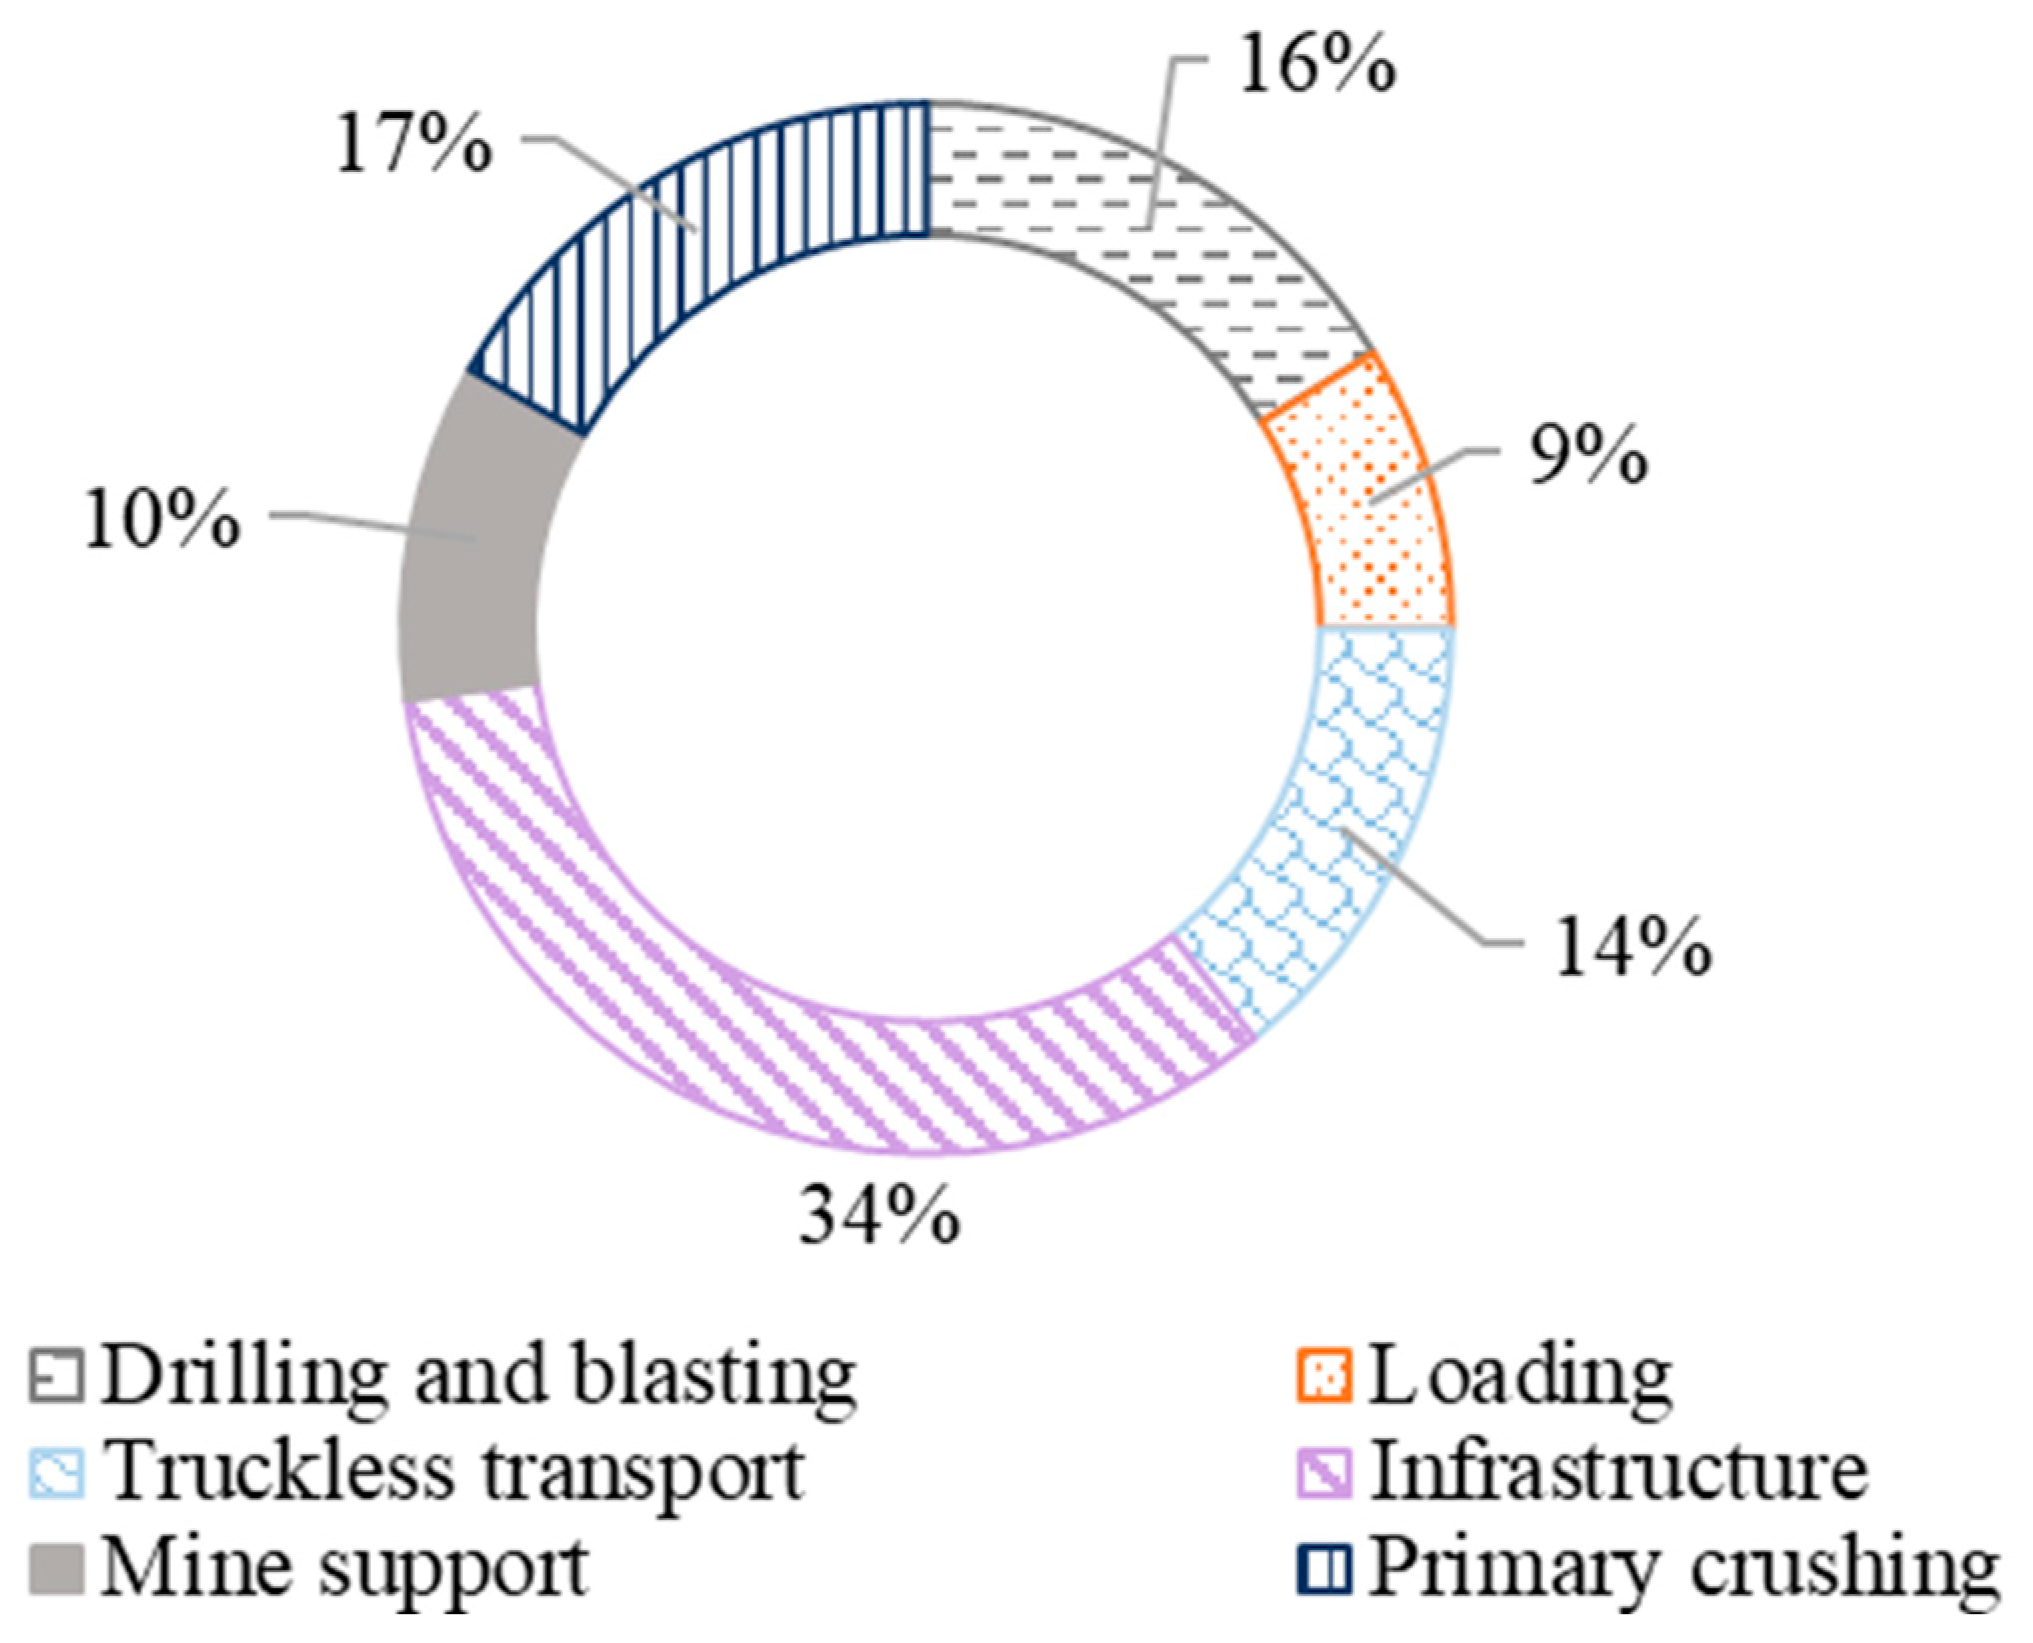
Figure 4.
Drilling and blasting, loading and primary crushing operating costs as functions of P80 for (a) CE and (b) JC.
Figure 4.
Drilling and blasting, loading and primary crushing operating costs as functions of P80 for (a) CE and (b) JC.
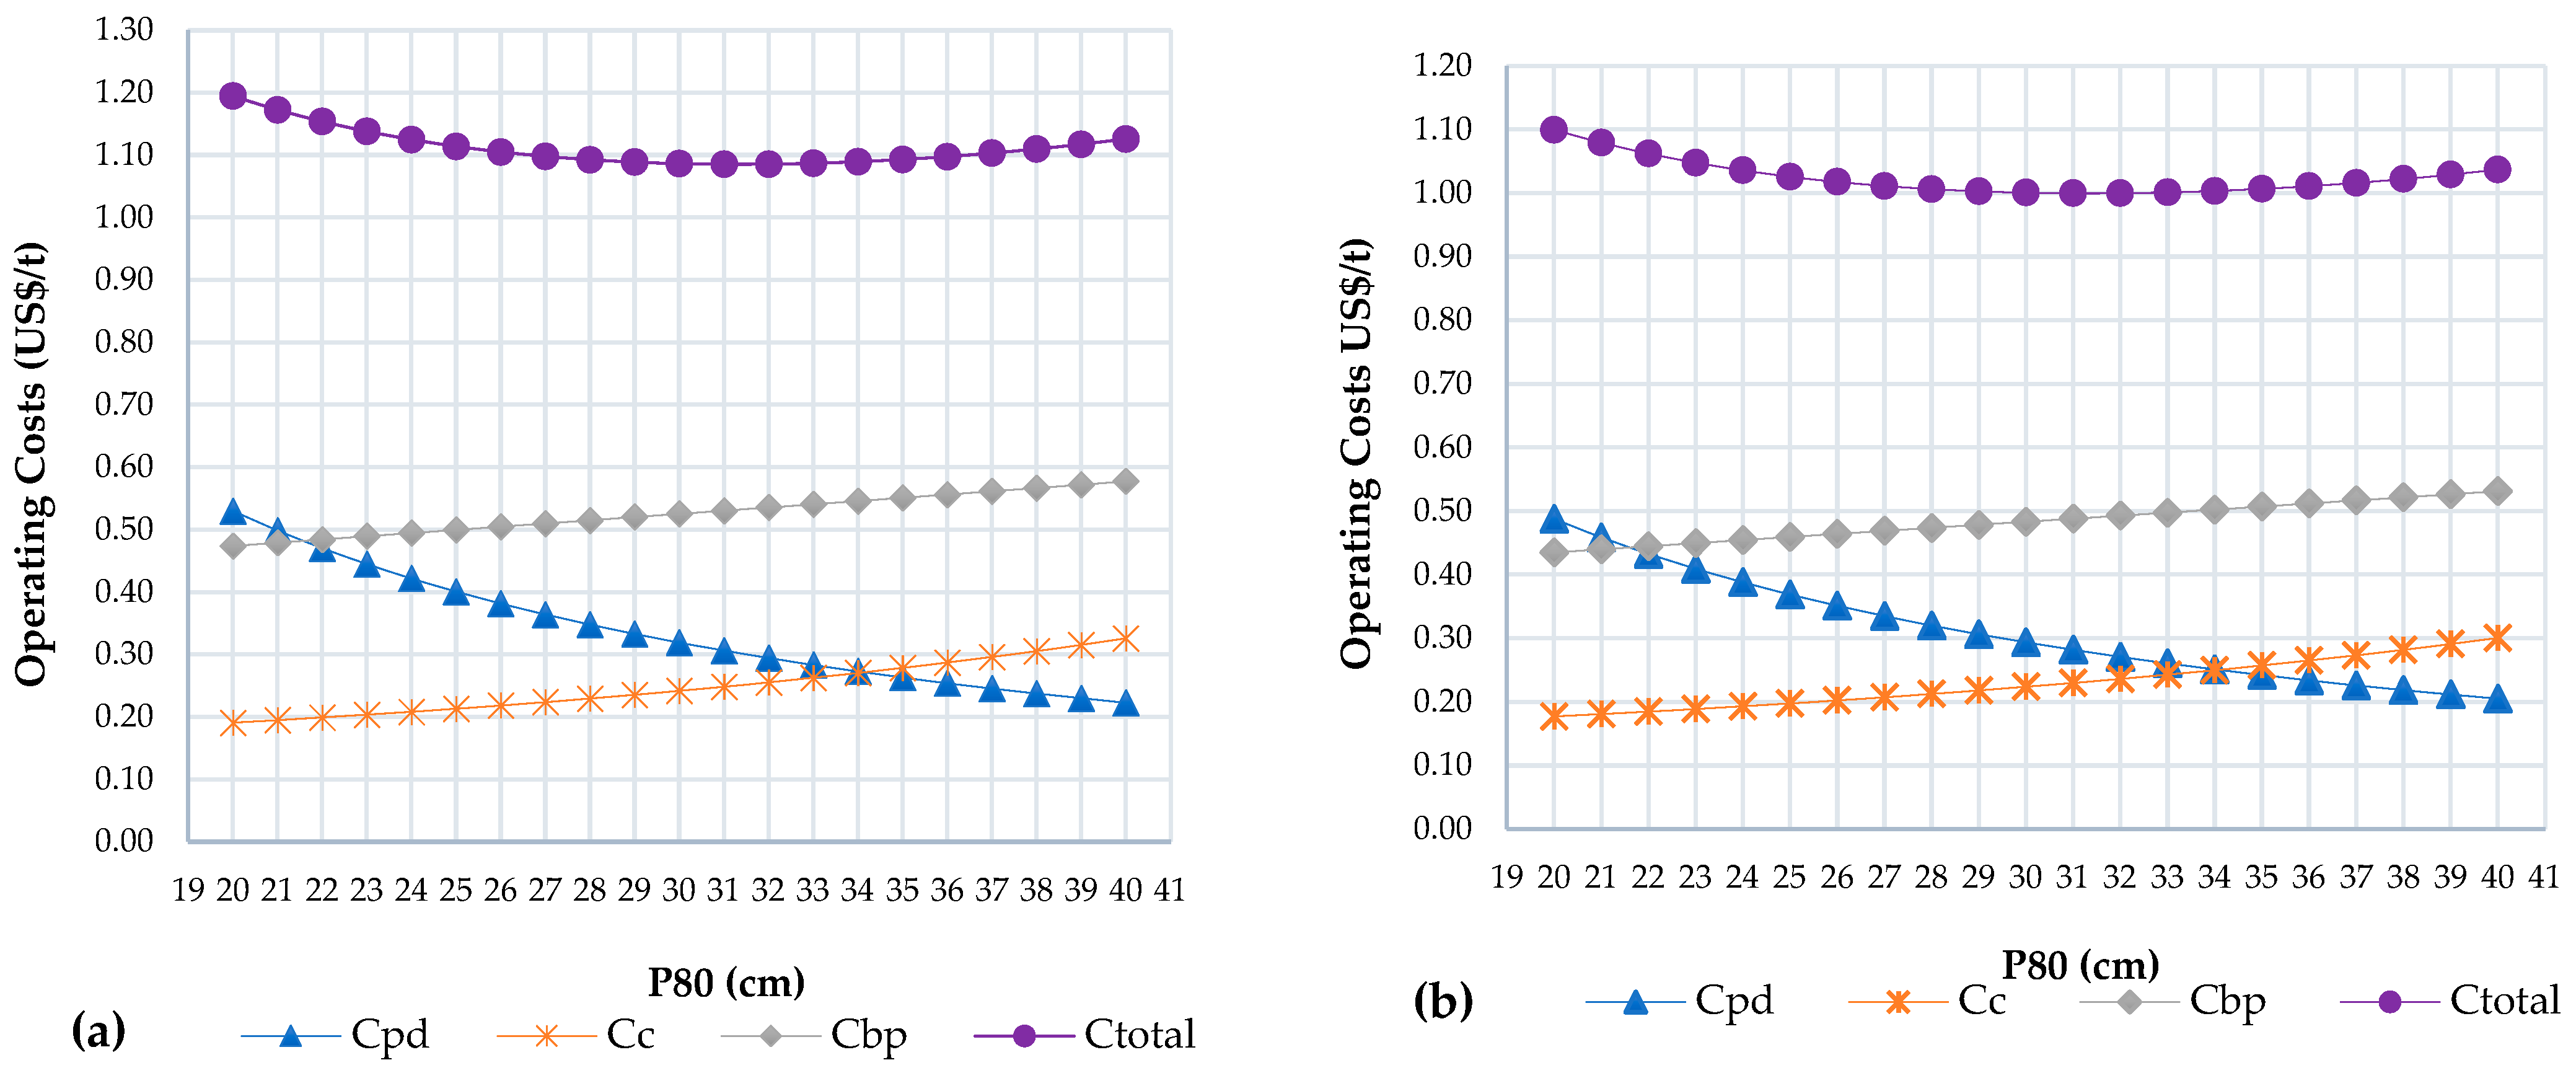
Figure 5.
Drilling and blasting, loading and primary crushing operating costs as functions of P80 for (a) JAC and (b) JEC.
Figure 5.
Drilling and blasting, loading and primary crushing operating costs as functions of P80 for (a) JAC and (b) JEC.
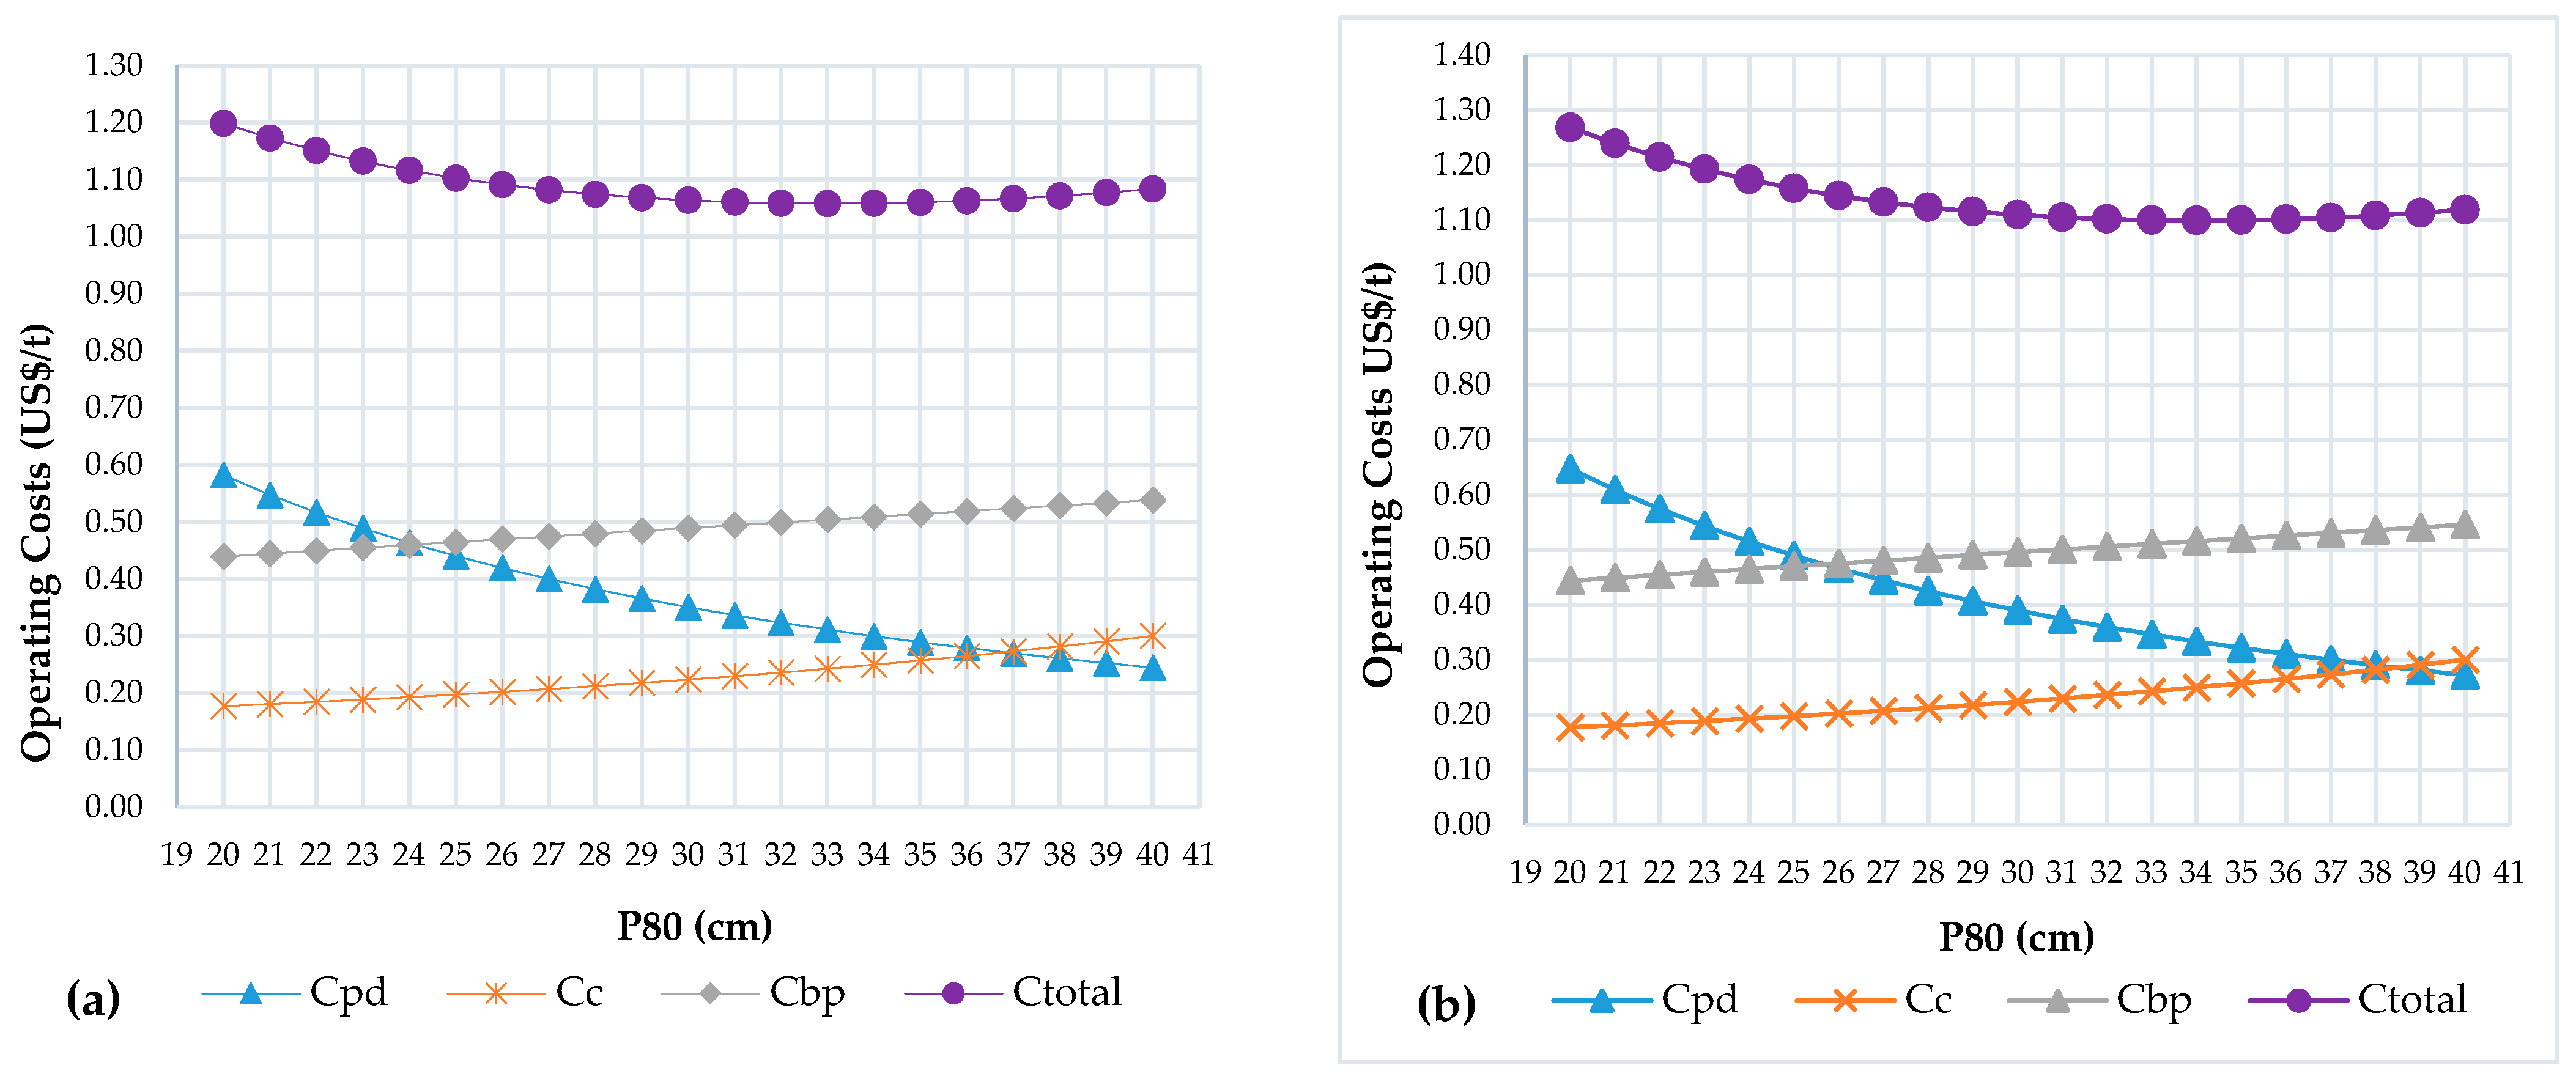
Figure 6.
Total mine operating costs as a function of P80 for CE, JC, JAC and JEC.


Table 1.
Real operating costs of the truckless mine.
| Mine Operating Phase | Mine Operating Costs | |
|---|---|---|
| US$/Year | US$/T | |
| Total | 178,585,285.22 | 2.43 |
| Drilling and blasting | 29,021,194.67 | 0.40 |
| Loading | 15,757,463.44 | 0.21 |
| Truckless transport | 25,497,715.91 | 0.35 |
| Infrastructure | 60,064,228.39 | 0.82 |
| Mine Support | 18,557,182.45 | 0.25 |
| Primary Crushing | 30,030,701.94 | 0.41 |
Table 2.
Mean parameters used for the model calibration process for drilling and blasting at the truckless mine.
Table 2.
Mean parameters used for the model calibration process for drilling and blasting at the truckless mine.
| Parameter | CE | JC | JAC | JEC | |
|---|---|---|---|---|---|
| $p | (USD/m) | 8.17 | 10.01 | 10.01 | 10.01 |
| H | (m) | 15.00 | 15.00 | 15.00 | 15.00 |
| J | (m) | 1.50 | 2.00 | 2.00 | 2.00 |
| Qex | (kg/furo) | 640.00 | 768.00 | 768.00 | 711.40 |
| $ex | (USD/kg) | 0.56 | 0.57 | 0.57 | 0.57 |
| $ai | (USD/furo) | 51.99 | 51.99 | 51.99 | 51.99 |
| Ar | - | 6.00 | 6.00 | 7.00 | 8.00 |
| RWS | (%) | 93.00 | 99.00 | 99.00 | 99.00 |
| n | - | 1.37 | 1.57 | 1.60 | 1.80 |
| ρr | (g/cm3) | 3.30 | 3.26 | 3.26 | 3.26 |
Table 3.
Mean parameters used for the model calibration process for loading at the truckless mine.
| Parameter | CE | JC | JAC | JEC | |
|---|---|---|---|---|---|
| $c | (USD/h) | 1098.60 | 1098.60 | 1098.60 | 1098.60 |
| a | - | 8.10 | 7.30 | 7.30 | 7.30 |
| b | - | 0.09 | 0.08 | 0.08 | 0.08 |
| θ | (°) | 95.00 | 95.00 | 95.00 | 95.00 |
| c | - | 1.05 | 1.14 | 1.14 | 1.14 |
| td | (s) | 12.70 | 10.88 | 10.88 | 10.88 |
| Lc | (t) | 104.40 | 102.90 | 102.90 | 102.90 |
Table 4.
Mean parameters used for the model calibration process for primary crushing at the truckless mine.
Table 4.
Mean parameters used for the model calibration process for primary crushing at the truckless mine.
| Parameter | CE | JC | JAC | JEC | |
|---|---|---|---|---|---|
| $bp | (USD/h) | 2569.59 | 2569.59 | 2569.59 | 2569.59 |
| Wi | (kWh/t) | 10.00 | 11.00 | 13.00 | 15.00 |
| P80bp | (mm) | 98.00 | 94.00 | 94.00 | 94.00 |
| Pbp | (t/h) | 7000.00 | 8500.00 | 8500.00 | 8500.00 |
| $e | (USD/kWk) | 0.18 | 0.18 | 0.18 | 0.18 |
Publisher’s Note: MDPI stays neutral with regard to jurisdictional claims in published maps and institutional affiliations. |
© 2022 by the authors. Licensee MDPI, Basel, Switzerland. This article is an open access article distributed under the terms and conditions of the Creative Commons Attribution (CC BY) license (https://creativecommons.org/licenses/by/4.0/).
Share and Cite
MDPI and ACS Style
Navarro Torres, V.F.; Figueiredo, J.R.; De La Hoz, R.C.; Botaro, M.; Chaves, L.S. A Mine-to-Crusher Model to Minimize Costs at a Truckless Open-Pit Iron Mine in Brazil. Minerals 2022, 12, 1037. https://doi.org/10.3390/min12081037
AMA Style
Navarro Torres VF, Figueiredo JR, De La Hoz RC, Botaro M, Chaves LS. A Mine-to-Crusher Model to Minimize Costs at a Truckless Open-Pit Iron Mine in Brazil. Minerals. 2022; 12(8):1037. https://doi.org/10.3390/min12081037
Chicago/Turabian StyleNavarro Torres, Vidal Felix, Janine Rodrigues Figueiredo, Raul Carretero De La Hoz, Márcio Botaro, and Leonardo Soares Chaves. 2022. "A Mine-to-Crusher Model to Minimize Costs at a Truckless Open-Pit Iron Mine in Brazil" Minerals 12, no. 8: 1037. https://doi.org/10.3390/min12081037
Note that from the first issue of 2016, this journal uses article numbers instead of page numbers. See further details here.