
Raman Spectroscopy Studies of Equilibrated Ordinary Chondrites with H and L Group and Shock Metamorphism Degrees

 , ,
, ,
Abstract
:1. Introduction
2. Sample Description and Analytical Methods
3. Results
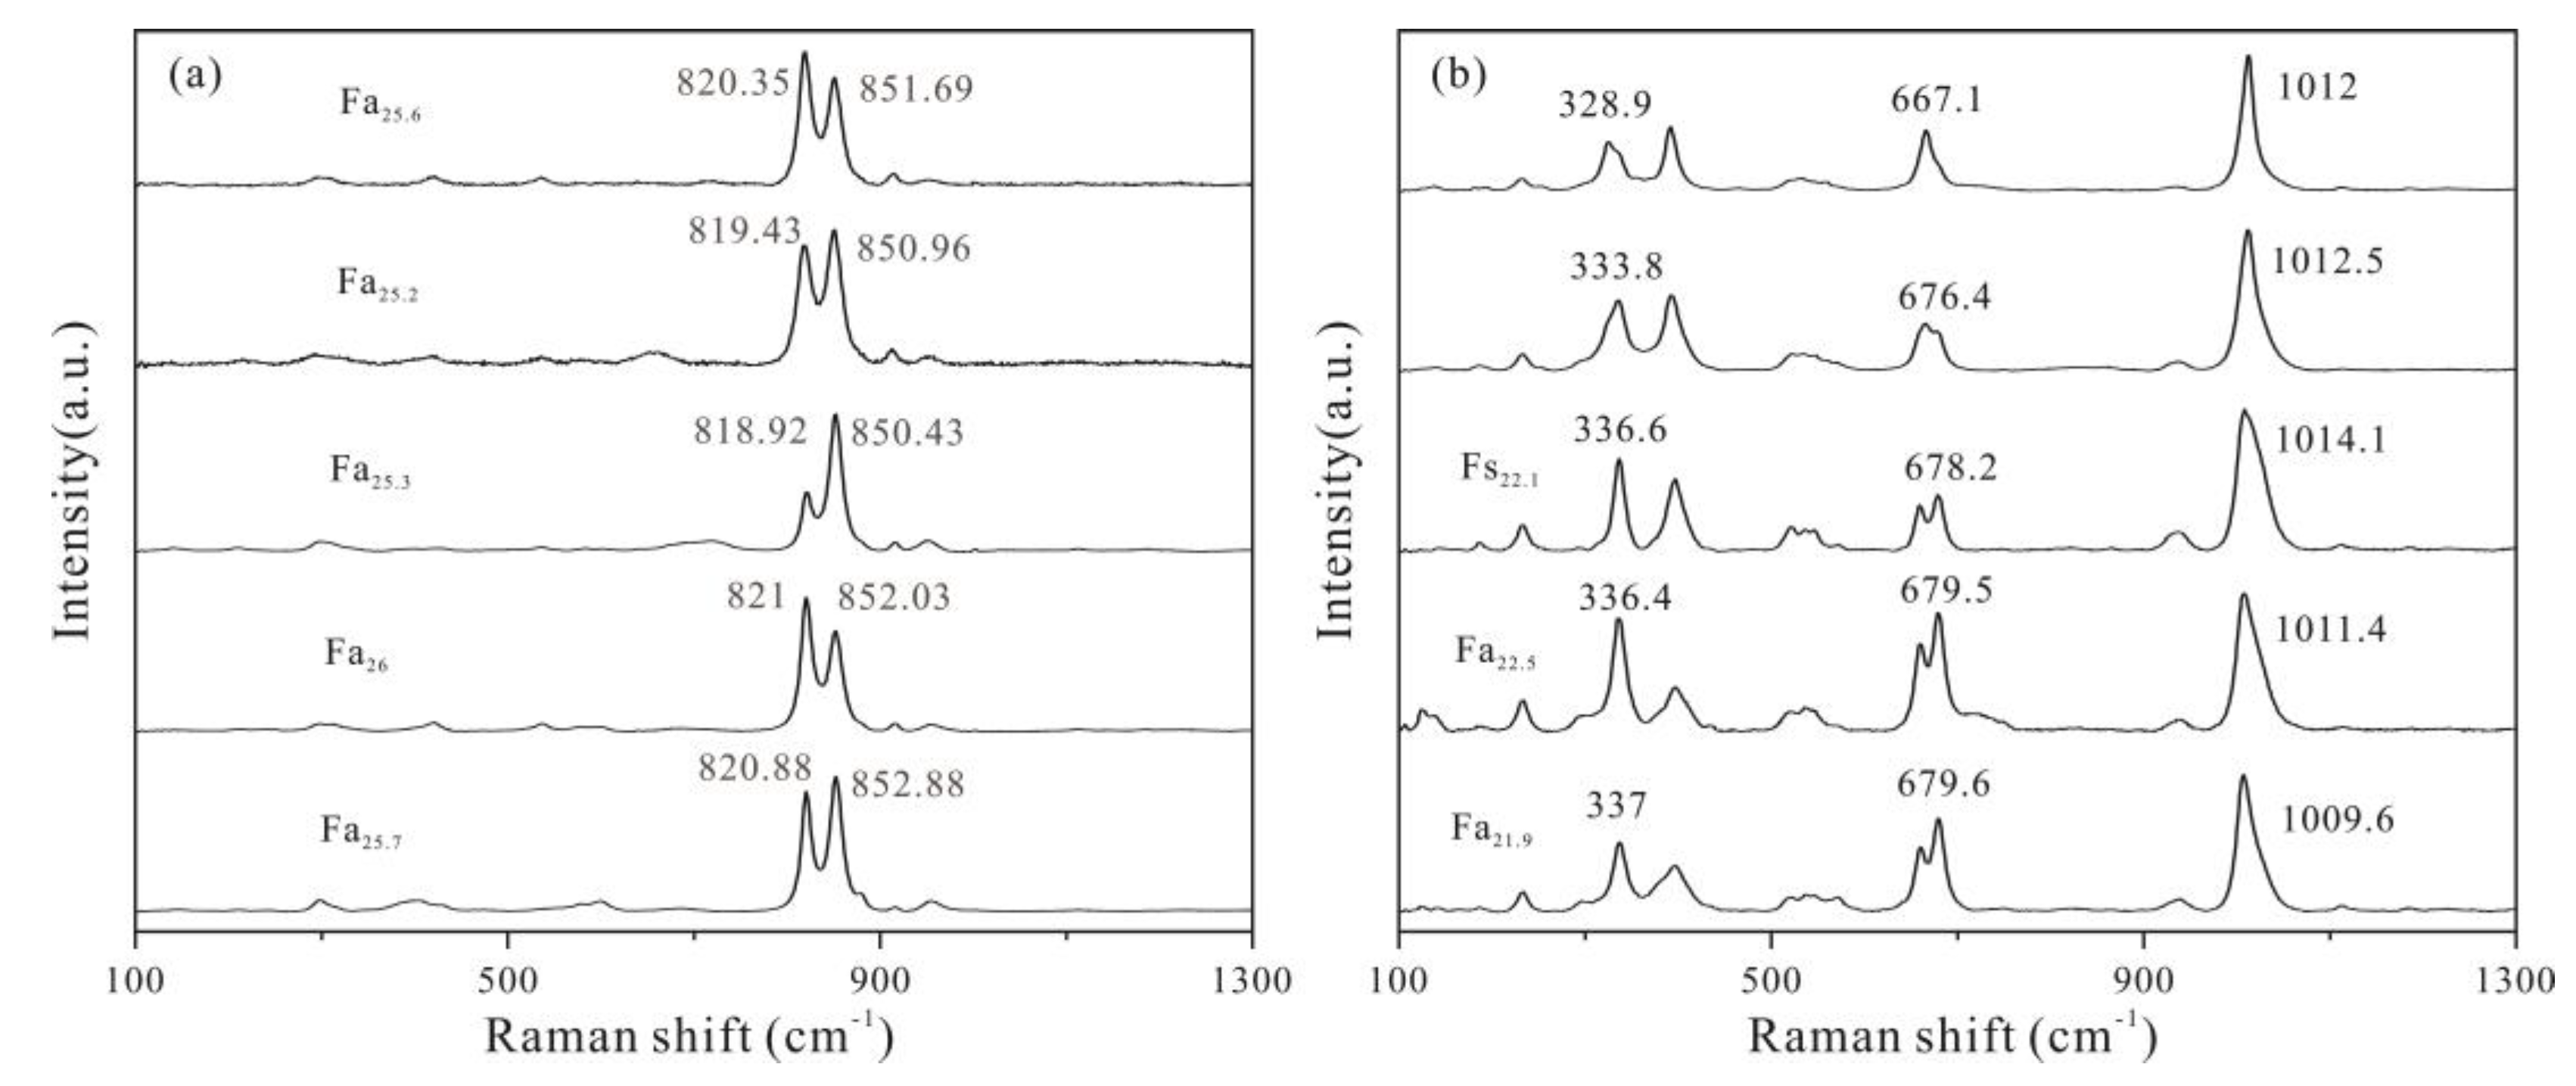
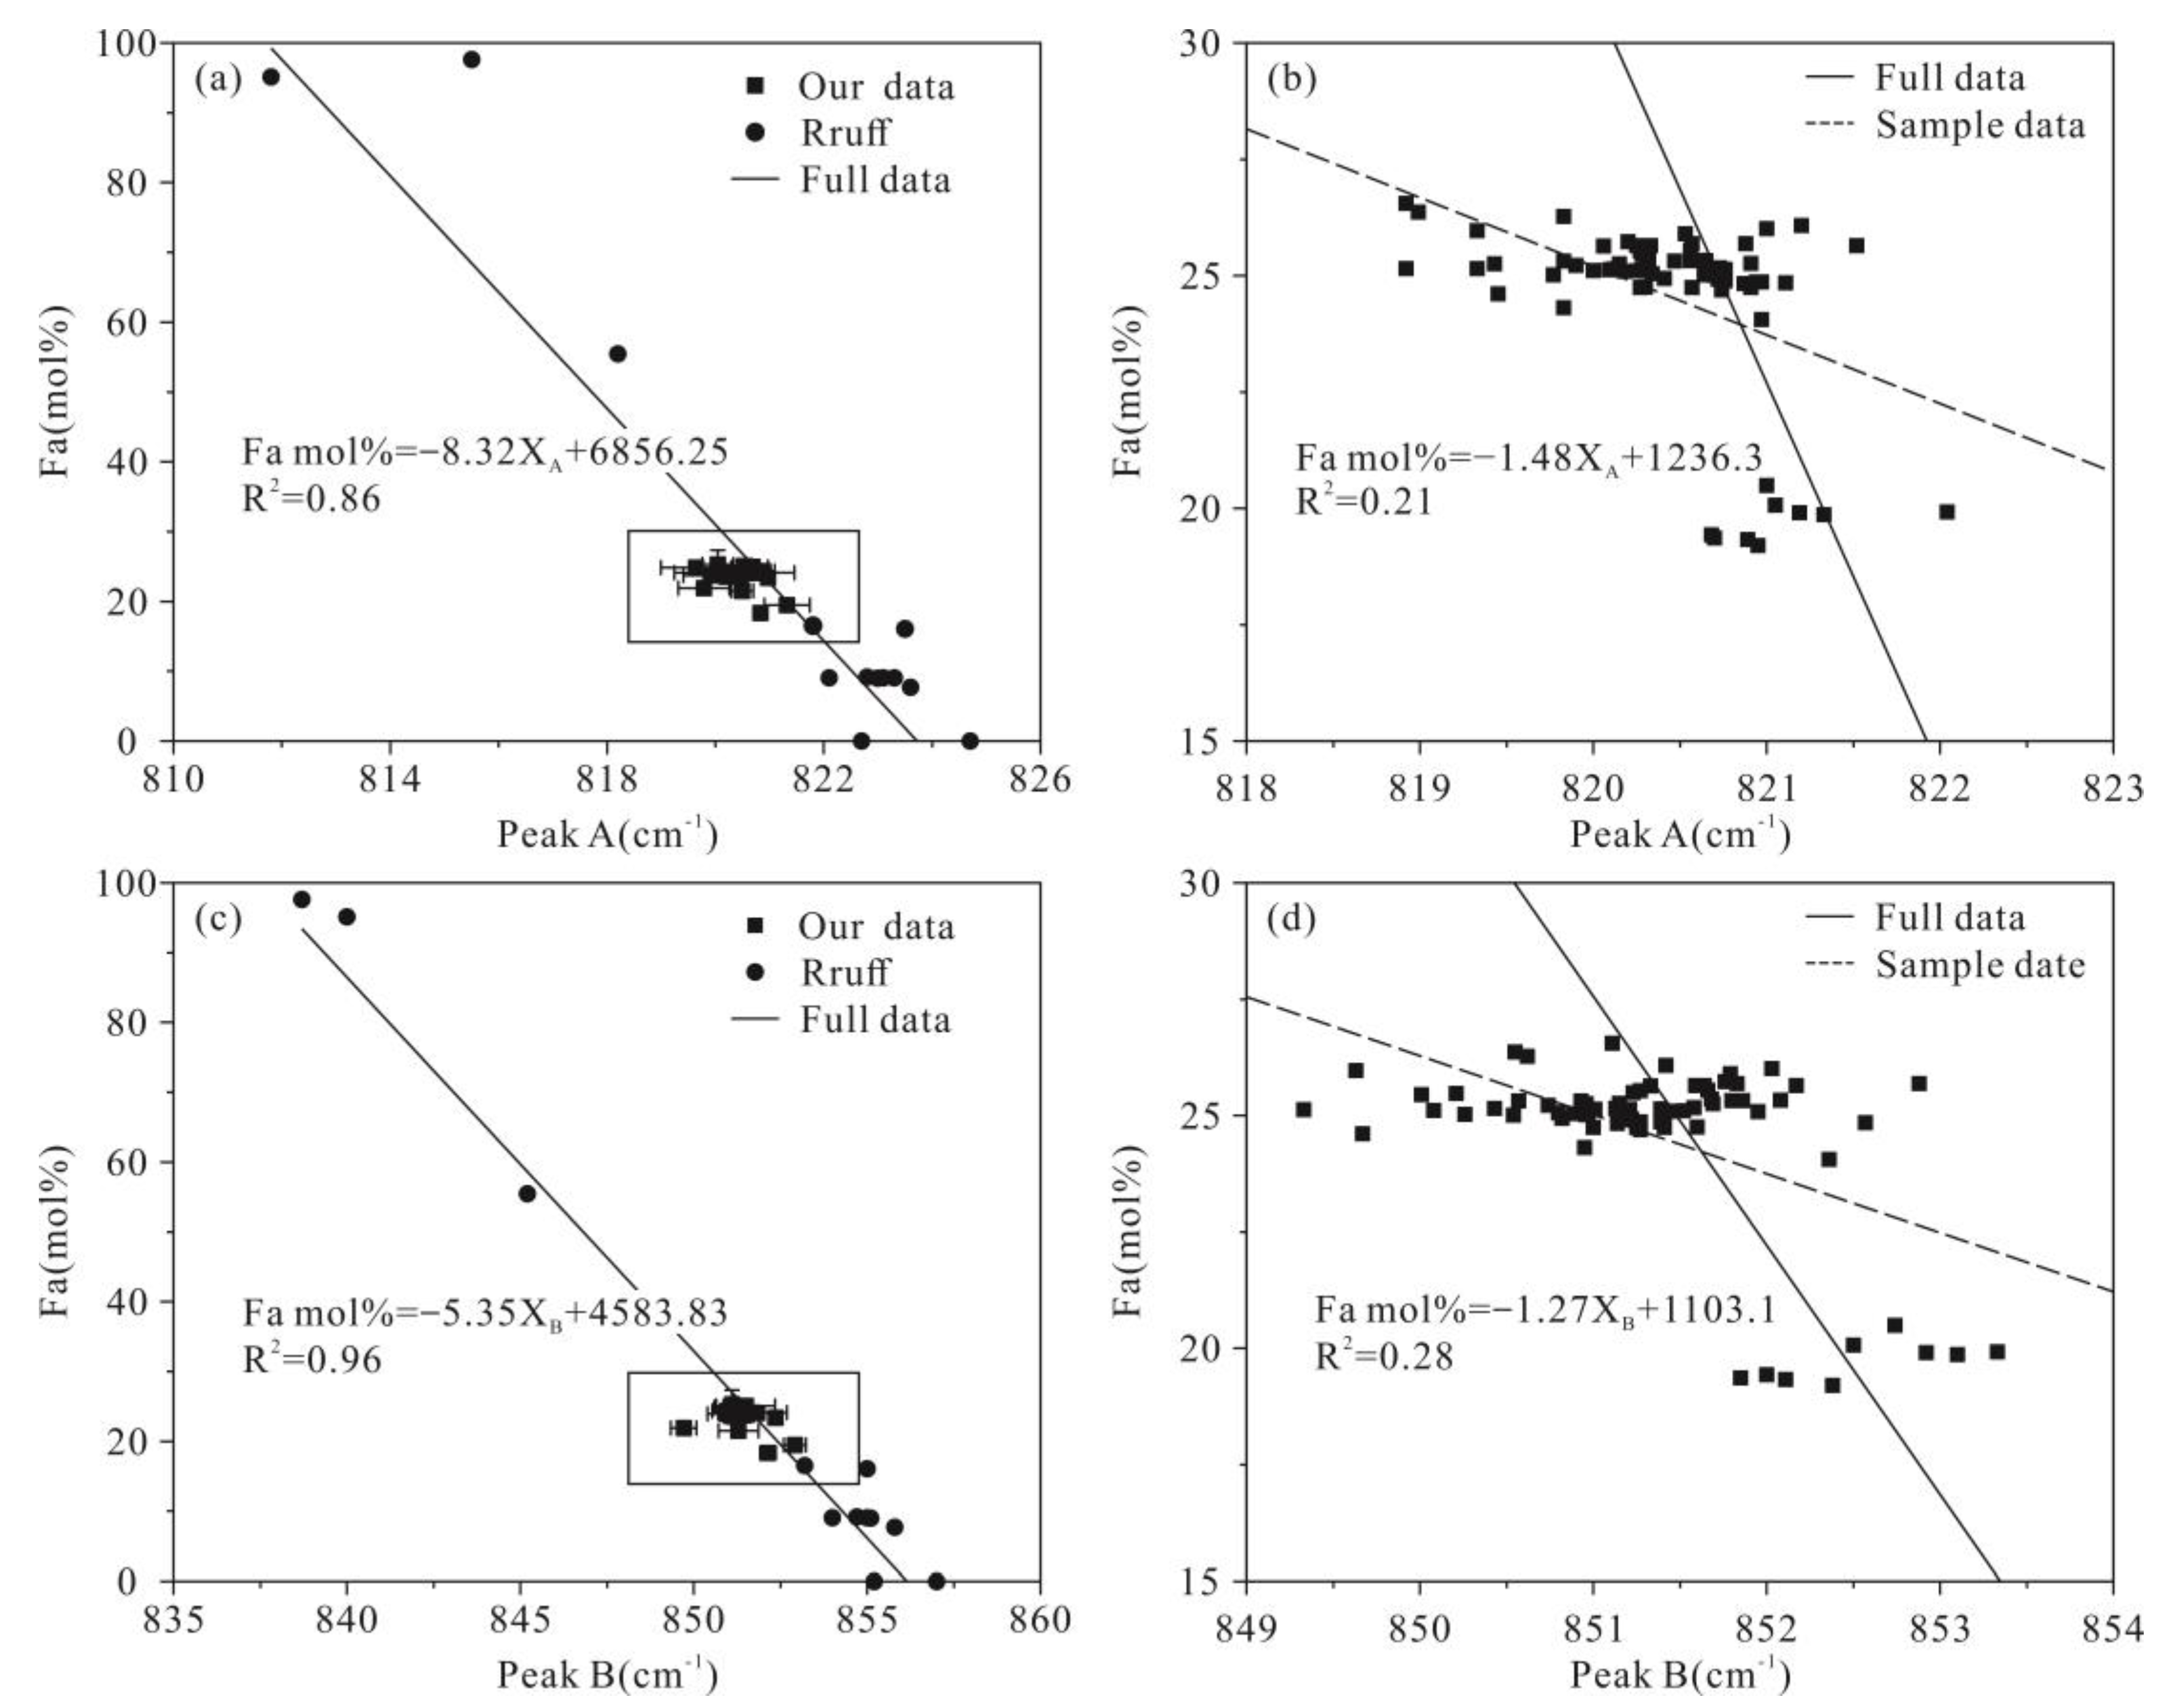
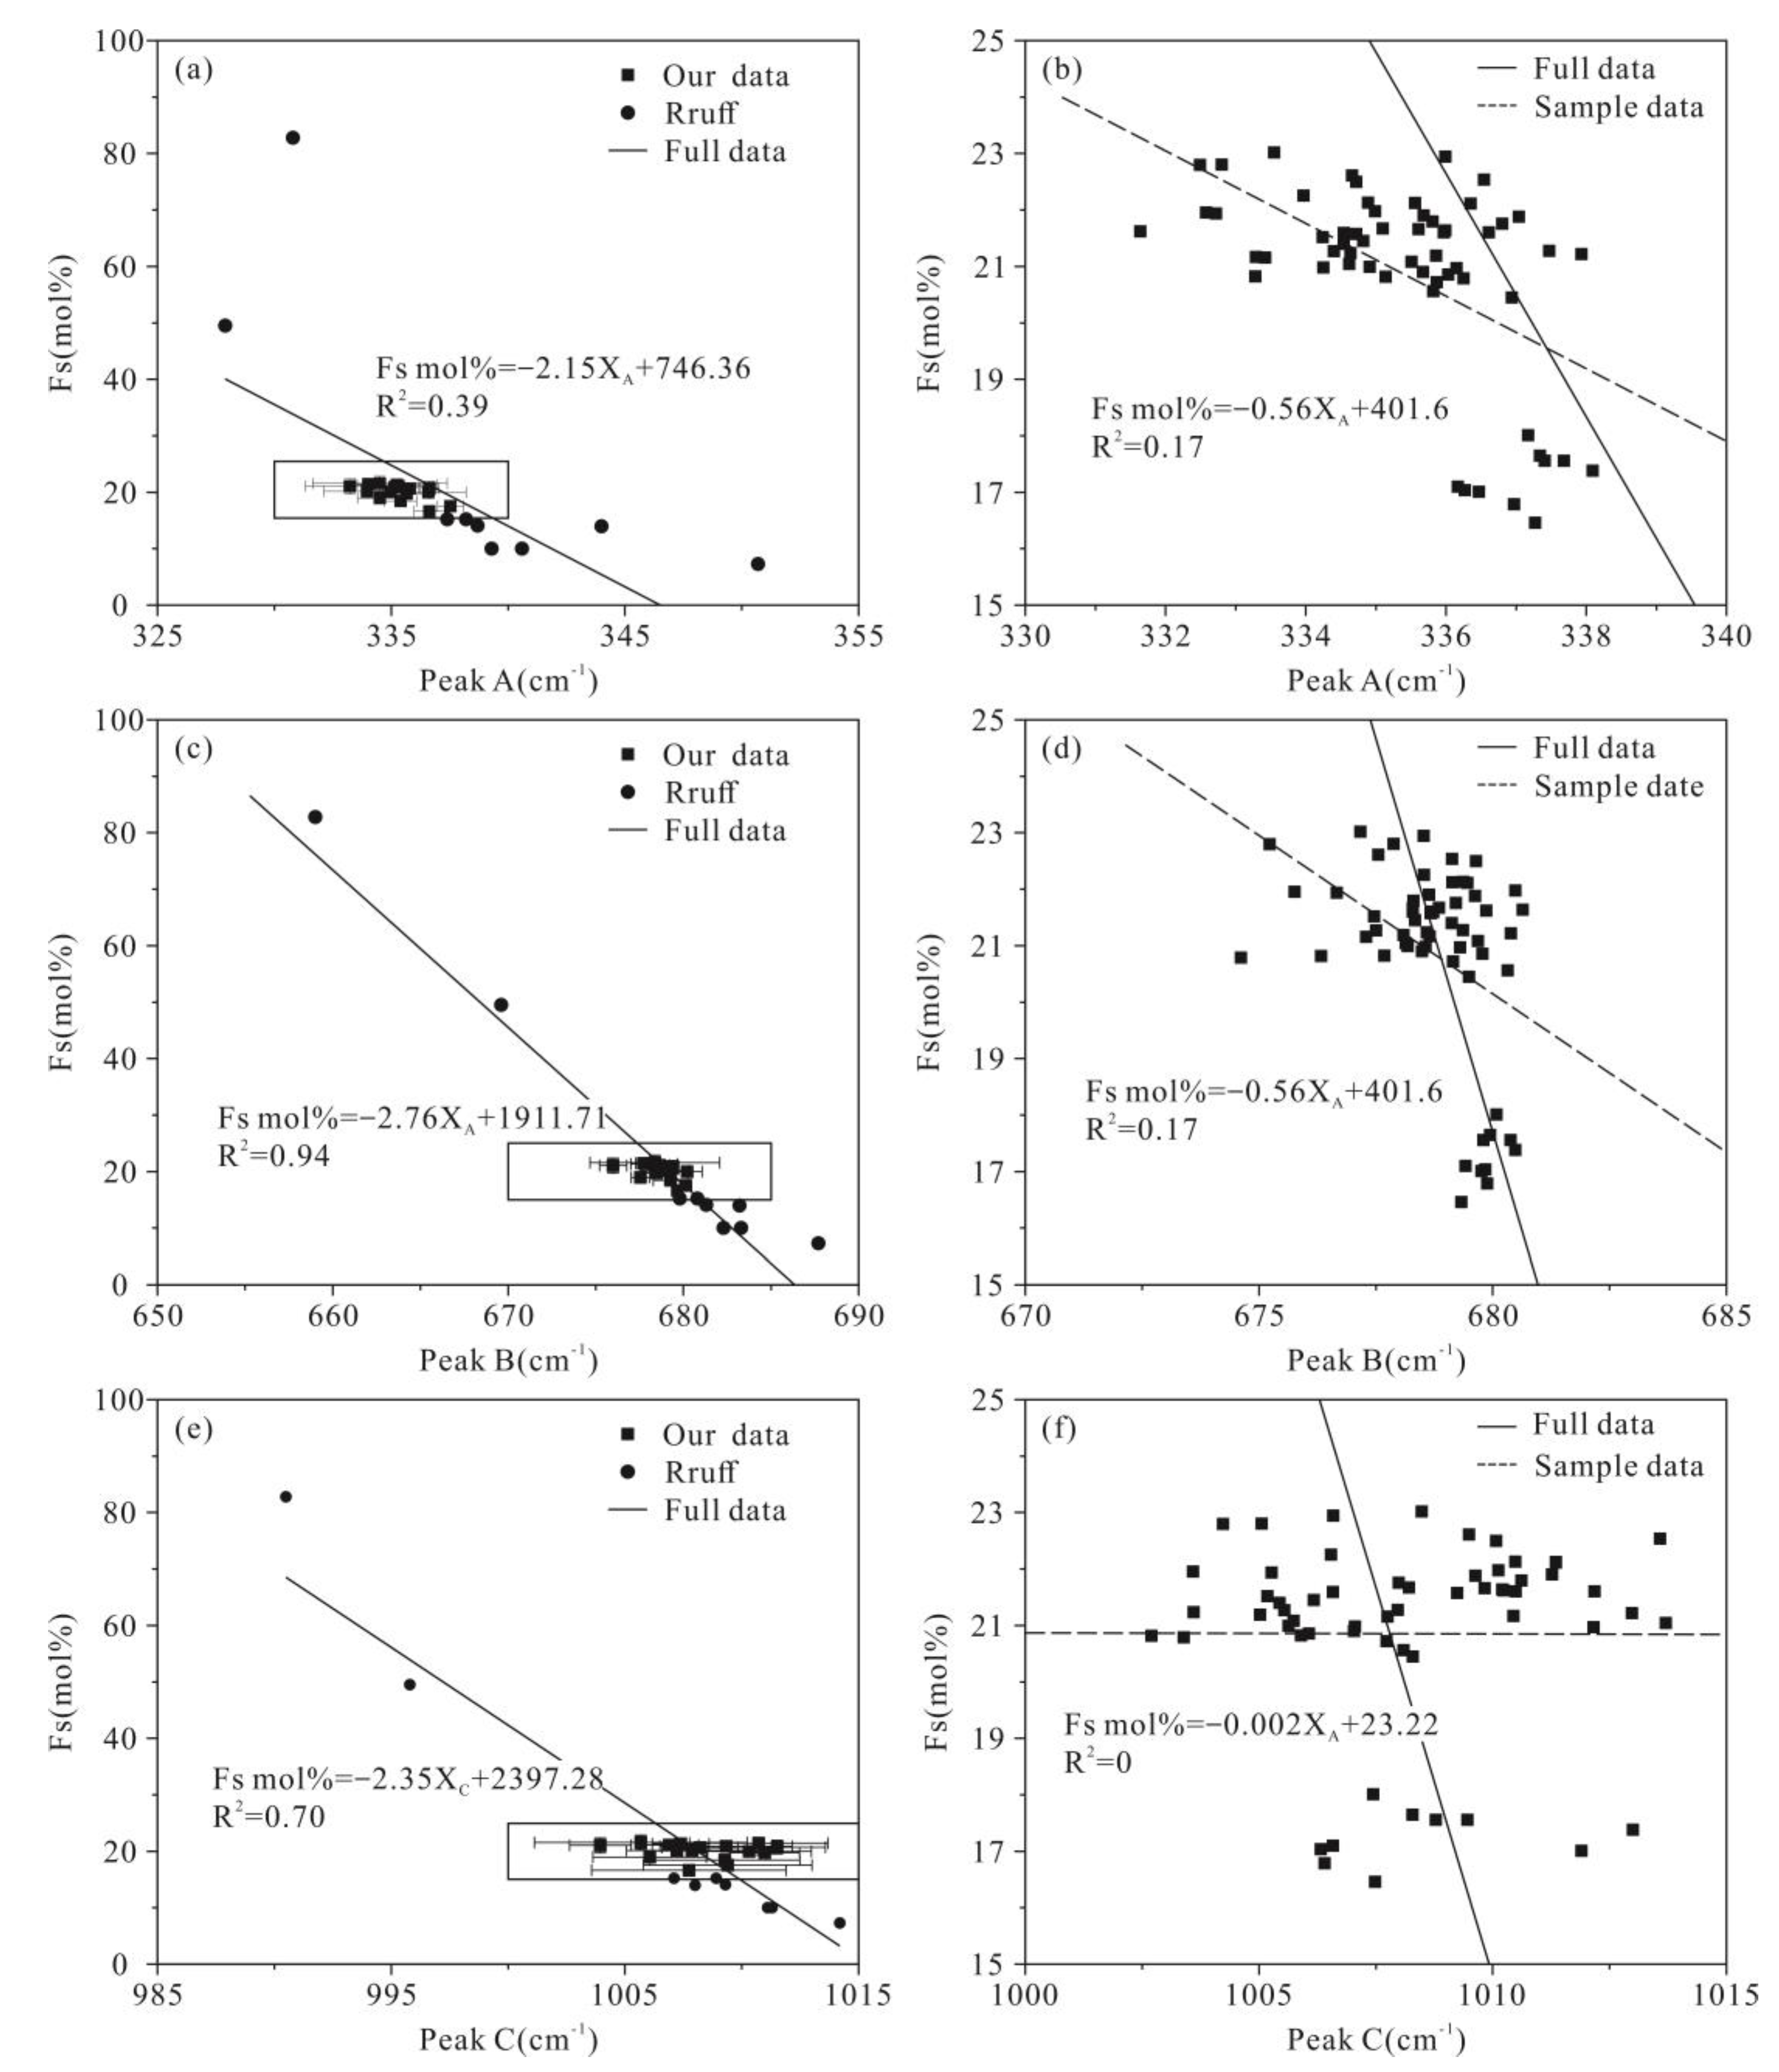
3.1. Raman Spectrum of Silicate Minerals
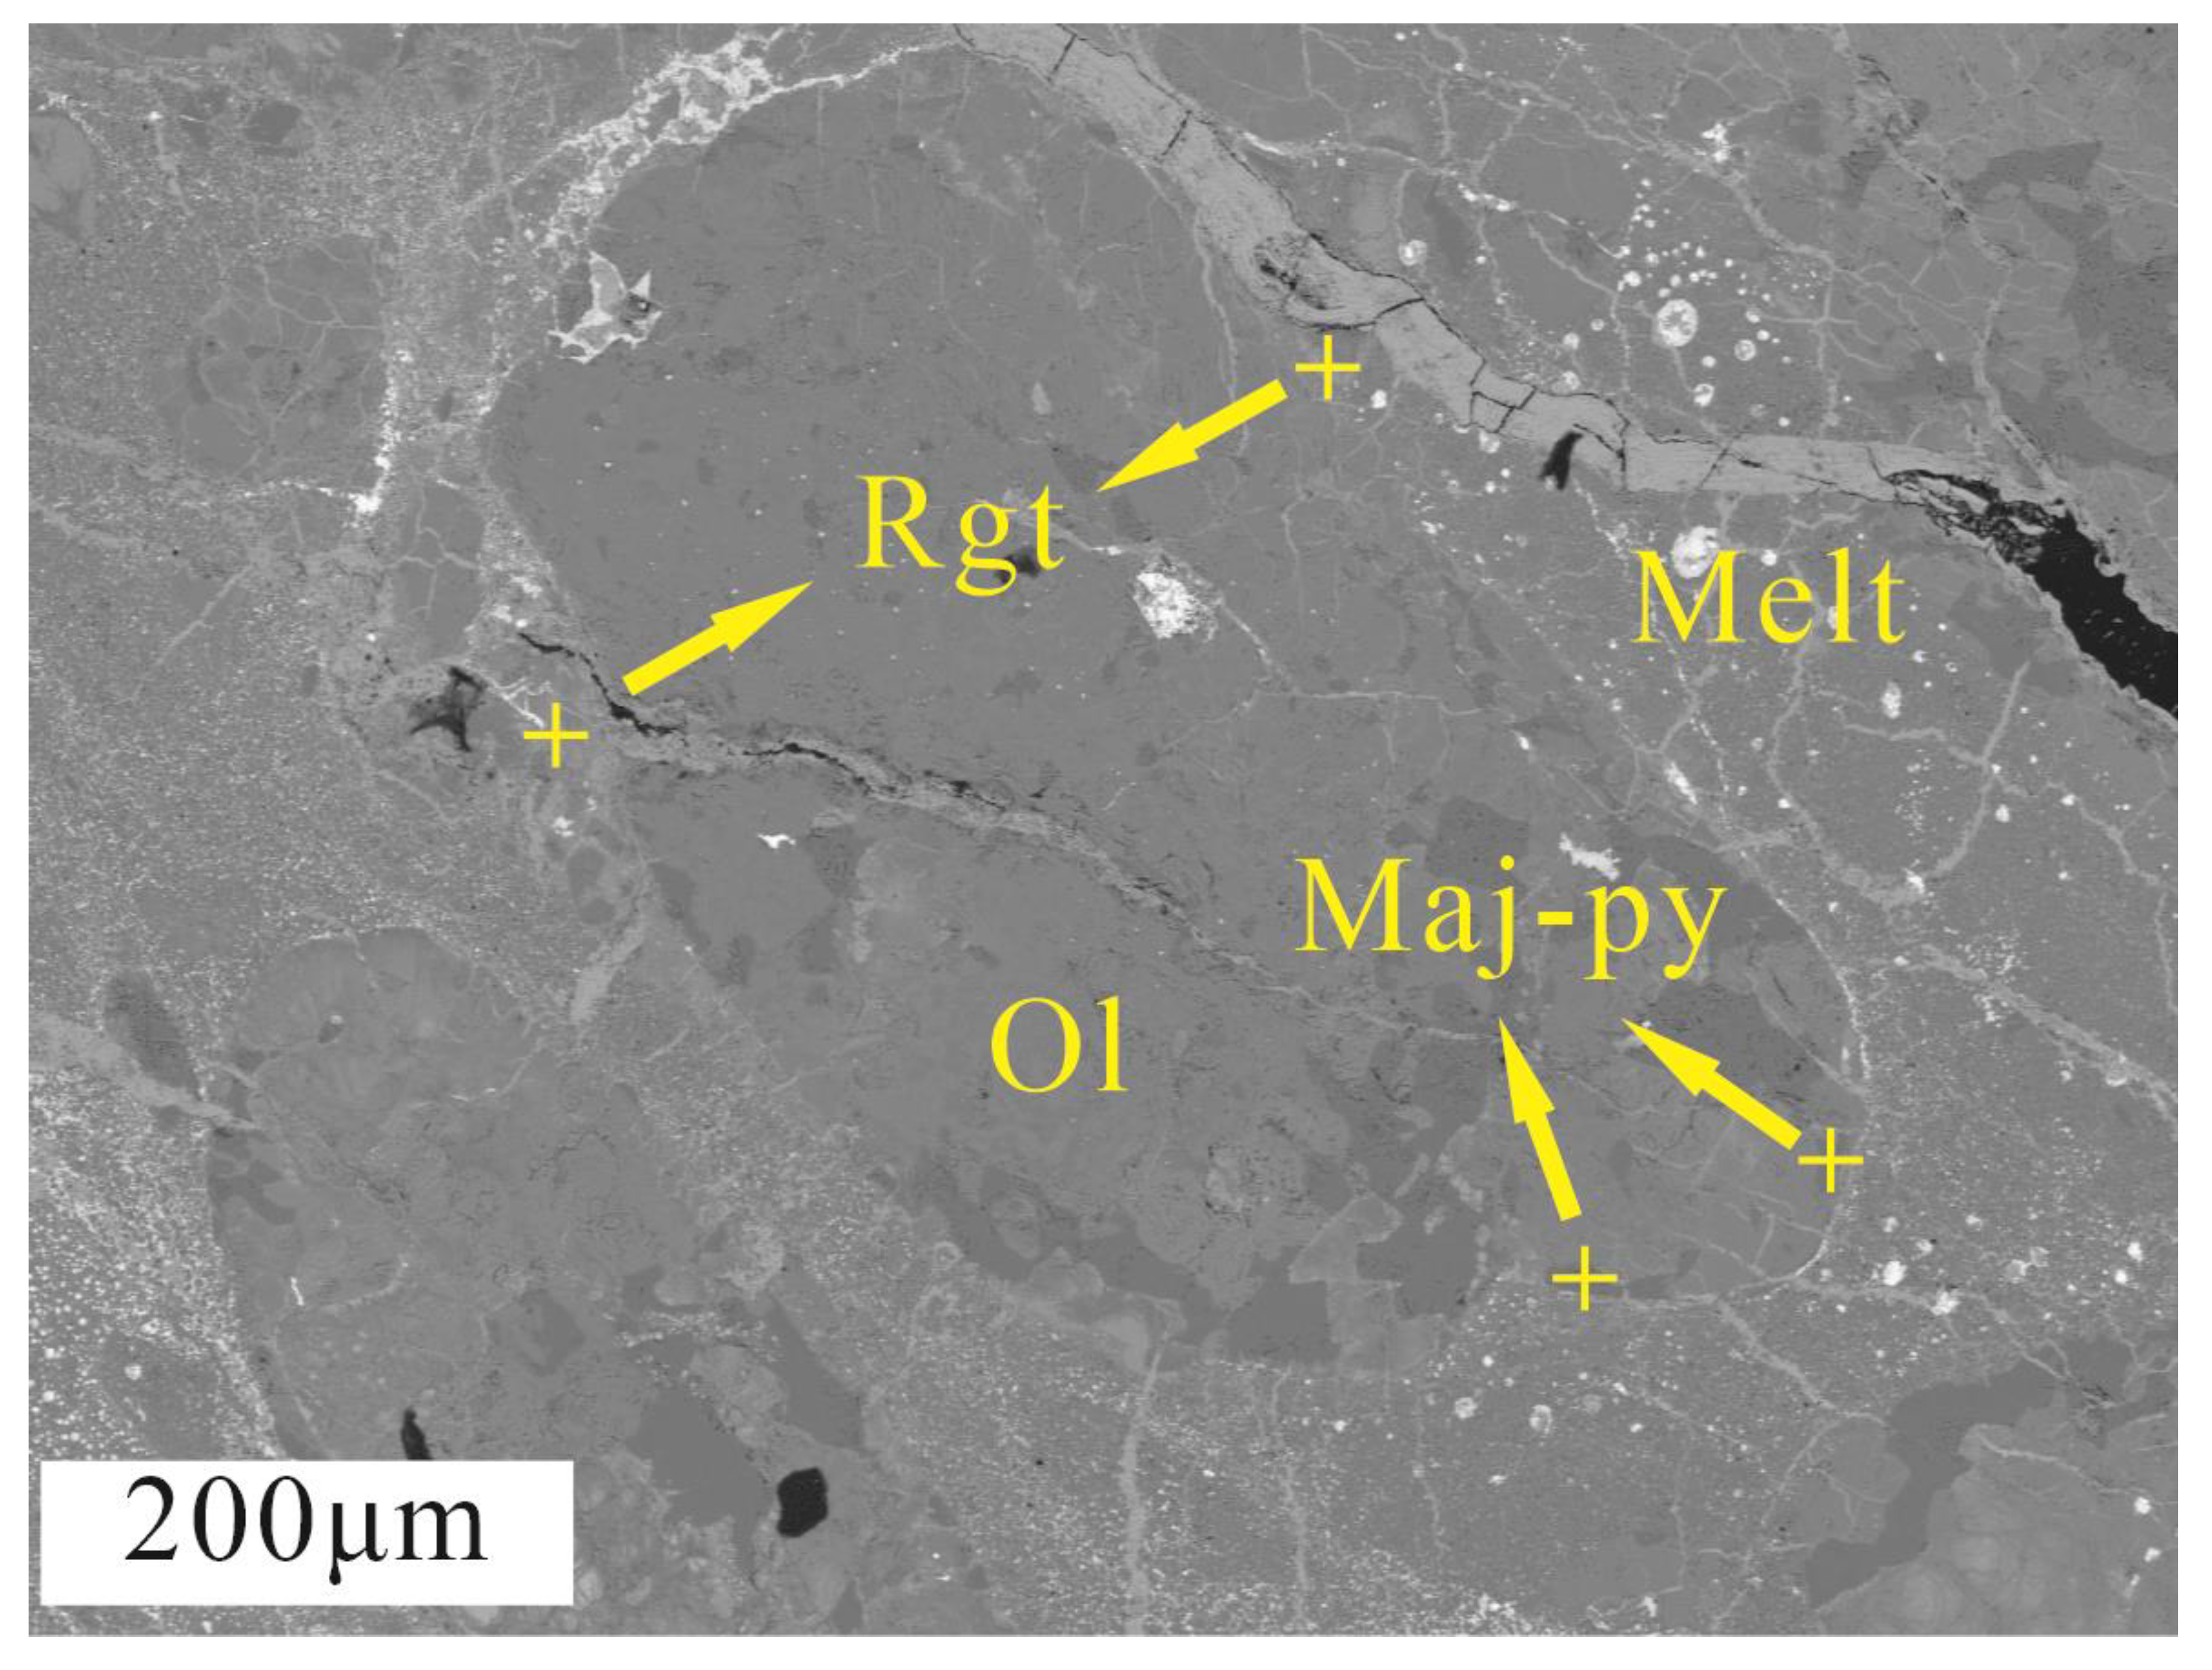
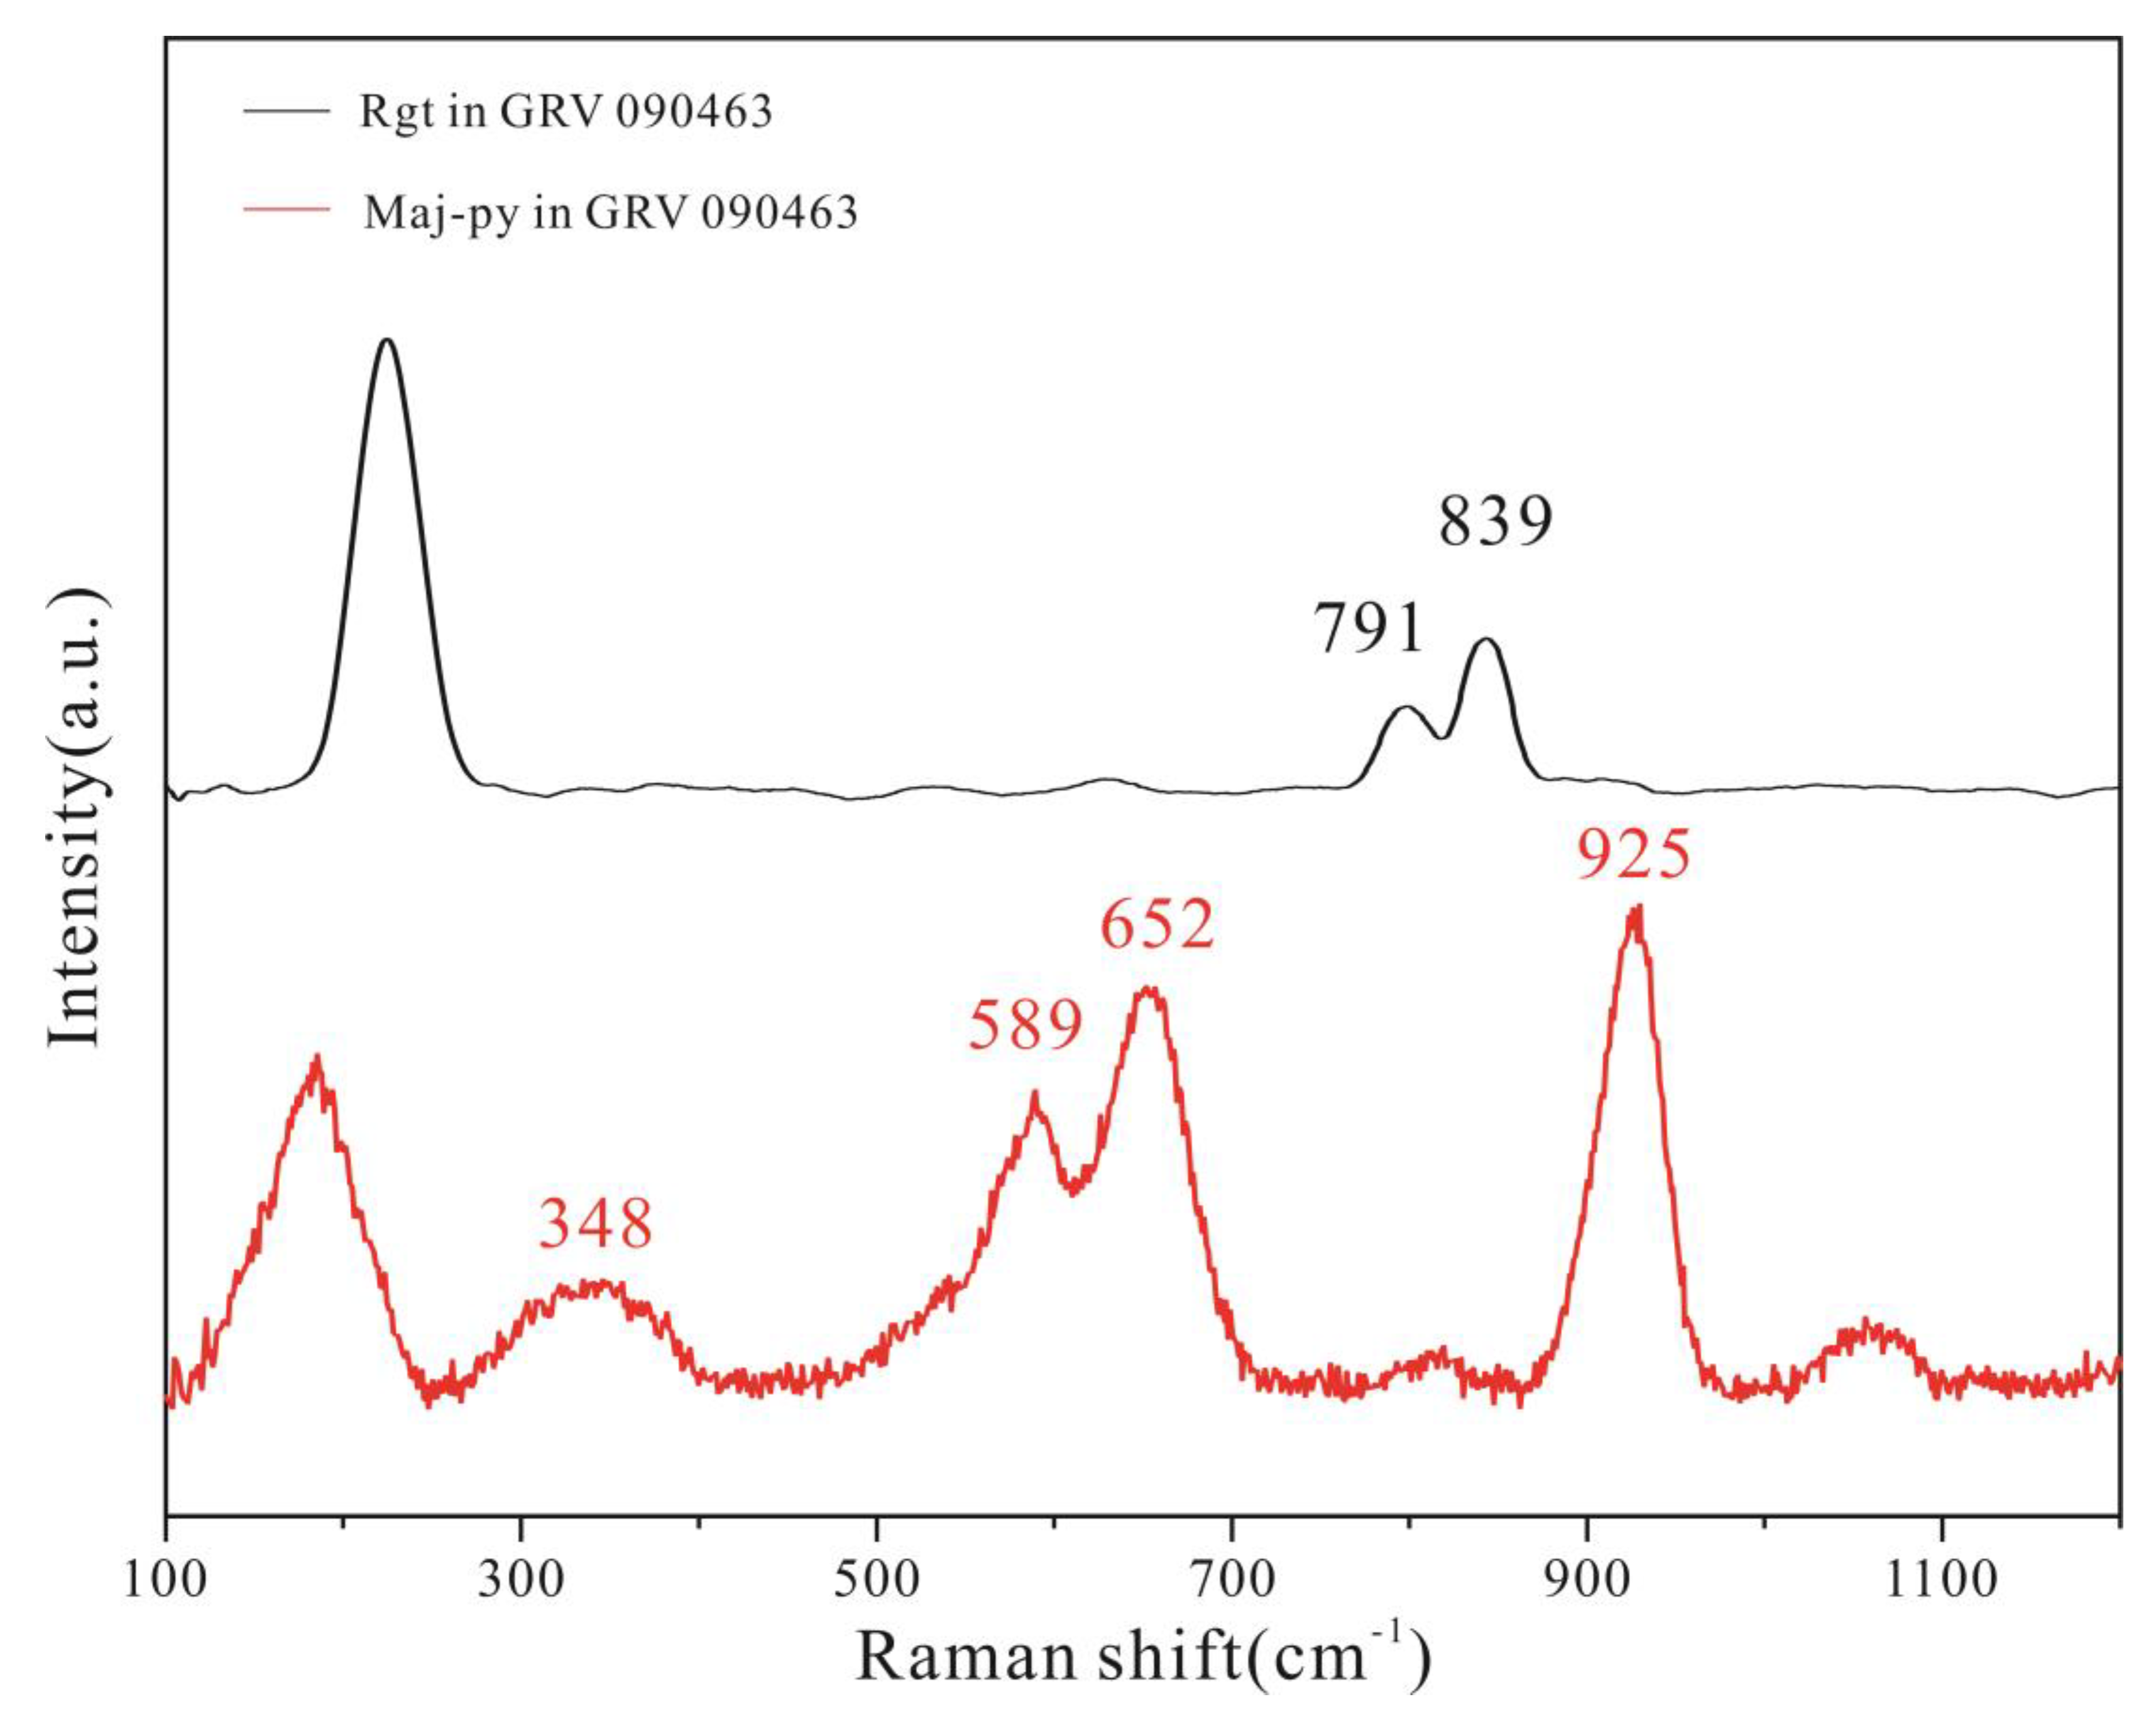
3.2. Raman Spectrum of Shocked Silicate Minerals
4. Discussion
5. Conclusions
Author Contributions
Funding
Data Availability Statement
Acknowledgments
Conflicts of Interest
Appendix A

| Sample | Number | Peak A/cm−1 | FWHM/cm−1 | Peak B/cm−1 | FWHM/cm−1 | Fa/mol% | av.Fa/mol% |
|---|---|---|---|---|---|---|---|
| GRV 090360 | 1 | 820.9 | 11.7 | 852.9 | 15.6 | 25.7 | |
| 2 | 821.0 | 13.3 | 852.0 | 16.5 | 26.0 | ||
| 3 | 821.5 | 11.6 | 852.2 | 15.4 | 25.6 | ||
| 4 | 818.9 | 16.0 | 850.4 | 18.0 | 25.2 | ||
| 5 | 819.4 | 13.9 | 851.0 | 16.6 | 25.3 | ||
| 6 | 821.8 | 14.6 | 853.4 | 17.0 | 25.8 | ||
| 7 | 821.0 | 14.4 | 852.7 | 17.0 | 25.3 | ||
| 8 | 821.4 | 15.7 | 852.7 | 17.3 | 25.1 | ||
| 9 | 821.9 | 15.5 | 851.8 | 15.9 | 25.2 | ||
| 10 | 821.0 | 16.3 | 852.9 | 14.9 | 25.7 | 22.1 (n = 10) | |
| GRV 090361 | 1 | 820.3 | 16.6 | 850.2 | 16.4 | 25.5 | |
| 2 | 819.5 | 15.0 | 849.7 | 18.0 | 24.6 | ||
| 3 | 820.1 | 15.6 | 849.3 | 20.6 | 25.1 | ||
| 4 | 819.3 | 15.9 | 849.6 | 17.2 | 26.0 | ||
| 5 | 819.7 | 16.8 | 852.5 | 17.4 | 24.6 | ||
| 6 | 820.6 | 15.9 | 851.9 | 15.4 | 25.6 | ||
| 7 | 819.7 | 16.8 | 851.6 | 14.2 | 24.7 | ||
| 8 | 820.7 | 13.3 | 850.8 | 14.0 | 25.3 | ||
| 9 | 821.0 | 16.9 | 852.8 | 15.5 | 25.3 | ||
| 10 | 821.1 | 14.7 | 850.1 | 16.1 | 25.2 | 21.4 (n = 10) | |
| 363 | 1 | 820.7 | 13.0 | 850.5 | 17.3 | 25.0 | |
| 2 | 820.6 | 13.1 | 851.8 | 16.4 | 25.3 | ||
| 3 | 820.7 | 13.1 | 850.8 | 16.5 | 25.1 | ||
| 4 | 820.3 | 13.2 | 851.6 | 16.4 | 25.6 | ||
| 5 | 820.3 | 12.0 | 851.7 | 15.6 | 25.4 | ||
| 6 | 820.3 | 13.3 | 852.9 | 16.2 | 25.4 | ||
| 7 | 819.1 | 10.1 | 851.7 | 14.7 | 24.6 | ||
| 8 | 820.4 | 11.8 | 851.9 | 17.0 | 25.5 | ||
| 9 | 821.9 | 11.9 | 851.1 | 17.3 | 24.6 | ||
| 10 | 820.0 | 13.7 | 850.6 | 15.6 | 25.4 | 21.8 (n = 10) | |
| GRV 090376 | 1 | 820.7 | 11.9 | 851.6 | 15.8 | 25.2 | |
| 2 | 820.5 | 14.8 | 850.6 | 17.2 | 25.3 | ||
| 3 | 821.0 | 13.2 | 851.3 | 16.5 | 24.9 | ||
| 4 | 820.3 | 13.5 | 851.6 | 16.7 | 25.6 | ||
| 5 | 820.9 | 13.0 | 851.4 | 15.9 | 24.9 | ||
| 6 | 821.3 | 12.3 | 851.1 | 13.4 | 25.3 | ||
| 7 | 821.2 | 10.8 | 851.7 | 15.9 | 25.5 | ||
| 8 | 821.1 | 11.1 | 850.5 | 16.2 | 25.2 | ||
| 9 | 821.0 | 11.6 | 852.6 | 14.5 | 25.5 | ||
| 10 | 821.6 | 10.8 | 852.4 | 15.3 | 25.7 | 21.3 (n =10) | |
| GRV 090379 | 1 | 820.6 | 13.3 | 851.7 | 16.5 | 25.5 | |
| 2 | 820.7 | 11.2 | 852.0 | 14.0 | 25.1 | ||
| 3 | 820.5 | 10.9 | 851.8 | 14.6 | 25.9 | ||
| 4 | 820.6 | 12.5 | 852.1 | 16.5 | 25.3 | ||
| 5 | 821.2 | 12.6 | 853.0 | 14.1 | 25.1 | ||
| 6 | 821.5 | 11.6 | 852.5 | 14.8 | 25.0 | ||
| 7 | 819.9 | 11.9 | 850.7 | 13.1 | 24.5 | ||
| 8 | 820.6 | 12.1 | 851.2 | 14.2 | 25.8 | ||
| 9 | 821.2 | 10.2 | 852.4 | 16.1 | 25.0 | ||
| 10 | 819.9 | 10.8 | 852.8 | 14.3 | 24.8 | 21.3 (n = 10) | |
| GRV 090380 | 1 | 820.6 | 12.5 | 851.3 | 15.3 | 24.7 | |
| 2 | 819.9 | 14.4 | 850.7 | 17.0 | 25.2 | ||
| 3 | 820.7 | 13.1 | 851.3 | 16.1 | 24.7 | ||
| 4 | 820.0 | 15.2 | 850.1 | 18.0 | 25.1 | ||
| 5 | 820.3 | 13.0 | 851.4 | 16.2 | 24.7 | ||
| 6 | 821.6 | 13.6 | 850.4 | 17.4 | 25.0 | ||
| 7 | 820.4 | 13.5 | 850.2 | 16.6 | 25.5 | ||
| 8 | 819.3 | 12.0 | 852.1 | 16.0 | 26.0 | ||
| 9 | 821.0 | 11.8 | 852.9 | 16.7 | 25.5 | ||
| 10 | 819.2 | 13.7 | 851.4 | 15.1 | 24.5 | 21.6 (n = 10) | |
| GRV 090403 | 1 | 821.1 | 10.6 | 852.5 | 14.1 | 20.1 | |
| 2 | 821.0 | 11.0 | 852.7 | 14.7 | 20.5 | ||
| 3 | 821.2 | 10.7 | 852.9 | 13.4 | 19.9 | ||
| 4 | 821.3 | 10.6 | 853.1 | 13.6 | 19.9 | ||
| 5 | 822.0 | 10.3 | 853.3 | 13.6 | 19.9 | ||
| 6 | 821.5 | 10.6 | 853.5 | 14.1 | 20.0 | ||
| 7 | 819.1 | 10.5 | 853.9 | 15.3 | 19.9 | ||
| 8 | 821.7 | 12.4 | 853.7 | 15.7 | 19.8 | ||
| 9 | 819.9 | 12.6 | 853.5 | 14.1 | 19.9 | ||
| 10 | 820.3 | 10.7 | 853.1 | 16.1 | 19.8 | 17.7 (n = 10) | |
| GRV 090421 | 1 | 820.7 | 11.0 | 851.9 | 14.9 | 19.4 | |
| 2 | 820.7 | 12.2 | 852.0 | 15.4 | 19.4 | ||
| 3 | 821.0 | 10.6 | 852.4 | 13.5 | 19.2 | ||
| 4 | 820.9 | 11.6 | 852.1 | 14.1 | 19.3 | ||
| 5 | 821.4 | 13.8 | 852.9 | 14.6 | 19.4 | ||
| 6 | 821.2 | 11.9 | 853.9 | 15.2 | 19.3 | ||
| 7 | 820.2 | 11.4 | 852.9 | 14.5 | 19.1 | ||
| 8 | 819.7 | 12.3 | 853.3 | 14.3 | 19.2 | ||
| 9 | 822.0 | 10.7 | 853.7 | 16.4 | 19.2 | ||
| 10 | 820.8 | 12.1 | 852.7 | 15.1 | 19.5 | 16.9 (n = 10) | |
| GRV 090463 | 1 | 821.0 | 13.3 | 852.4 | 16.8 | 24.1 | |
| 2 | 820.3 | 13.7 | 850.0 | 17.1 | 25.4 | ||
| 3 | 820.9 | 16.1 | 851.0 | 17.5 | 24.7 | ||
| 4 | 820.9 | 14.6 | 851.1 | 17.2 | 24.8 | ||
| 5 | 820.7 | 12.9 | 853.2 | 17.1 | 25.8 | ||
| 6 | 821.2 | 11.7 | 851.9 | 14.9 | 24.8 | ||
| 7 | 820.3 | 10.5 | 852.1 | 14.8 | 24.6 | ||
| 8 | 821.1 | 10.9 | 851.9 | 14.7 | 24.9 | ||
| 9 | 820.7 | 11.7 | 852.4 | 16.1 | 24.9 | ||
| 10 | 819.9 | 14.0 | 852.0 | 16.4 | 25.3 | 22(n = 10) | |
| GRV 090448 | 1 | 820.7 | 11.9 | 851.2 | 16.8 | 24.9 | |
| 2 | 819.8 | 13.8 | 850.9 | 16.9 | 25.3 | ||
| 3 | 820.8 | 11.6 | 851.4 | 15.3 | 24.9 | ||
| 4 | 820.3 | 12.3 | 850.9 | 15.6 | 25.0 | ||
| 5 | 820.6 | 11.4 | 851.0 | 14.7 | 25.0 | ||
| 6 | 819.7 | 10.3 | 851.7 | 15.5 | 26.0 | ||
| 7 | 820.2 | 11.6 | 852.7 | 14.7 | 24.7 | ||
| 8 | 819.8 | 11.1 | 850.8 | 14.1 | 25.0 | ||
| 9 | 820.1 | 12.6 | 852.6 | 14.7 | 25.5 | ||
| 10 | 820.0 | 11.3 | 851.5 | 14.5 | 24.9 | 21.1 (n = 10) | |
| GRV 090449 | 1 | 820.1 | 13.3 | 851.4 | 16.0 | 25.1 | |
| 2 | 820.4 | 12.2 | 850.8 | 15.8 | 24.9 | ||
| 3 | 820.1 | 11.8 | 851.3 | 15.8 | 25.6 | ||
| 4 | 820.3 | 12.4 | 851.2 | 15.4 | 25.1 | ||
| 5 | 819.2 | 10.4 | 852.5 | 16.8 | 25.2 | ||
| 6 | 821.3 | 12.4 | 850.1 | 14.2 | 25.4 | ||
| 7 | 820.6 | 11.2 | 851.1 | 13.3 | 25.8 | ||
| 8 | 820.7 | 13.7 | 851.4 | 16.9 | 25.6 | ||
| 9 | 820.4 | 11.9 | 851.4 | 16.5 | 24.6 | ||
| 10 | 819.1 | 11.3 | 850.7 | 16.0 | 25.8 | 22 (n = 10) | |
| GRV 090511 | 1 | 820.7 | 14.0 | 850.3 | 17.2 | 25.0 | |
| 2 | 821.2 | 14.4 | 851.4 | 16.1 | 26.1 | ||
| 3 | 820.9 | 14.8 | 851.2 | 16.5 | 25.3 | ||
| 4 | 820.8 | 15.4 | 851.0 | 16.8 | 25.1 | ||
| 5 | 821.1 | 13.8 | 851.9 | 17.5 | 24.8 | ||
| 6 | 821.2 | 15.7 | 850.8 | 17.2 | 24.5 | ||
| 7 | 820.0 | 15.1 | 850.1 | 16.6 | 25.1 | ||
| 8 | 821.5 | 14.4 | 850.5 | 15.2 | 25.3 | ||
| 9 | 819.5 | 15.4 | 852.9 | 14.9 | 25.6 | ||
| 10 | 820.9 | 14.1 | 852.5 | 15.7 | 24.9 | 21.3 (n = 10) | |
| GRV 090517 | 1 | 820.7 | 13.3 | 851.9 | 16.1 | 25.3 | |
| 2 | 821.1 | 11.8 | 852.6 | 14.8 | 24.8 | ||
| 3 | 820.6 | 12.1 | 851.8 | 15.4 | 25.7 | ||
| 4 | 820.2 | 13.3 | 851.8 | 16.0 | 25.7 | ||
| 5 | 819.6 | 11.8 | 851.9 | 14.1 | 25.3 | ||
| 6 | 820.6 | 12.2 | 852.3 | 16.9 | 25.1 | ||
| 7 | 820.2 | 13.8 | 852.7 | 14.5 | 25.6 | ||
| 8 | 819.6 | 12.3 | 852.2 | 16.4 | 25.2 | ||
| 9 | 820.7 | 13.9 | 850.8 | 13.1 | 25.7 | ||
| 10 | 820.4 | 11.1 | 851.1 | 13.4 | 24.9 | 21.5 (n = 10) | |
| GRV 090519 | 1 | 820.2 | 18.3 | 851.4 | 21.8 | 25.1 | |
| 2 | 819.0 | 19.8 | 850.6 | 23.7 | 26.4 | ||
| 3 | 819.8 | 18.0 | 850.6 | 23.7 | 26.3 | ||
| 4 | 818.9 | 24.1 | 851.1 | 22.8 | 26.6 | ||
| 5 | 820.3 | 19.6 | 851.6 | 21.1 | 24.8 | ||
| 6 | 821.8 | 15.3 | 850.6 | 23.2 | 24.5 | ||
| 7 | 819.5 | 14.2 | 850.9 | 20.8 | 24.8 | ||
| 8 | 819.4 | 15.6 | 851.2 | 22.7 | 24.6 | ||
| 9 | 820.2 | 15.1 | 852.2 | 20.8 | 25.0 | ||
| 10 | 821.1 | 13.6 | 852.9 | 20.9 | 25.6 | ||
| 11 | 819.7 | 15.5 | 852.2 | 20.5 | 25.7 | 21.5 (n = 10) | |
| GRV 090520 | 1 | 820.2 | 14.4 | 851.7 | 17.8 | 25.3 | |
| 2 | 819.3 | 14.8 | 851.1 | 18.2 | 25.2 | ||
| 3 | 820.3 | 13.2 | 851.5 | 16.8 | 25.1 | ||
| 4 | 820.1 | 13.9 | 850.6 | 17.3 | 24.7 | ||
| 5 | 820.3 | 15.5 | 850.2 | 17.0 | 24.6 | ||
| 6 | 820.6 | 15.0 | 851.2 | 16.3 | 25.8 | ||
| 7 | 819.9 | 13.8 | 850.2 | 16.5 | 25.0 | ||
| 8 | 820.0 | 13.9 | 852.5 | 17.2 | 25.1 | ||
| 9 | 822.0 | 14.3 | 851.1 | 17.5 | 24.7 | ||
| 10 | 820.8 | 13.2 | 850.1 | 17.3 | 25.2 | 21.4 (n = 10) | |
| GRV 090521 | 1 | 819.8 | 22.4 | 851.0 | 23.1 | 24.3 | |
| 2 | 819.8 | 22.3 | 851.0 | 23.4 | 25.0 | ||
| 3 | 820.3 | 24.0 | 851.2 | 21.4 | 25.5 | ||
| 4 | 820.3 | 24.3 | 851.3 | 21.6 | 25.5 | ||
| 5 | 820.9 | 20.7 | 851.6 | 20.1 | 25.5 | ||
| 6 | 822.0 | 23.1 | 851.2 | 22.9 | 25.7 | ||
| 7 | 820.8 | 20.9 | 852.1 | 22.0 | 24.7 | ||
| 8 | 821.4 | 24.2 | 851.9 | 21.7 | 25.4 | ||
| 9 | 822.0 | 20.4 | 850.0 | 23.4 | 24.6 | ||
| 10 | 820.5 | 22.3 | 852.8 | 22.4 | 25.6 | 21.6 (n = 10) |
| Sample | Number | Peak A/cm−1 | FWHM/cm−1 | Peak B/cm−1 | FWHM/cm−1 | Peak C/cm−1 | FWHM/cm−1 | Fs/mol% | av.Fs/mol% |
|---|---|---|---|---|---|---|---|---|---|
| GRV 090360 | 1 | 337.0 | 14.1 | 679.6 | 14.1 | 1009.6 | 21.3 | 21.9 | |
| 2 | 336.4 | 17.5 | 679.5 | 17.5 | 1011.4 | 24.7 | 22.1 | ||
| 3 | 336.5 | 11.7 | 679.1 | 11.7 | 1013.6 | 27.1 | 22.5 | ||
| 4 | 335.9 | 12.5 | 678.8 | 14.1 | 1008.6 | 15.1 | 22.0 | ||
| 5 | 335.3 | 16.9 | 678.9 | 16.3 | 1011.2 | 24.7 | 21.9 | ||
| 6 | 334.0 | 16.0 | 677.5 | 15.3 | 1008.4 | 13.9 | 21.9 | ||
| 7 | 334.3 | 14.7 | 679.2 | 16.2 | 1010.3 | 21.9 | 22.0 | ||
| 8 | 334.4 | 14.7 | 679.2 | 14.4 | 1011.9 | 27.5 | 22.0 | ||
| 9 | 335.9 | 15.5 | 679.6 | 13.9 | 1009.6 | 18.5 | 22.2 | ||
| 10 | 334.8 | 15.4 | 678.0 | 16.8 | 1009.2 | 17.2 | 22.0 | 22.1 (n = 10) | |
| GRV 090361 | 1 | 333.6 | 12.9 | 677.2 | 15.6 | 1008.5 | 23.7 | 23.0 | |
| 2 | 334.4 | 13.7 | 677.5 | 12.7 | 1005.5 | 14.8 | 21.3 | ||
| 3 | 334.2 | 14.2 | 677.5 | 12.3 | 1005.2 | 16.5 | 21.5 | ||
| 4 | 335.9 | 7.0 | 678.1 | 12.1 | 1005.0 | 13.3 | 21.2 | ||
| 5 | 335.7 | 12.8 | 677.1 | 18.0 | 1011.9 | 27.6 | 21.3 | ||
| 6 | 334.9 | 13.8 | 680.0 | 16.2 | 1009.6 | 19.7 | 21.5 | ||
| 7 | 335.7 | 14.2 | 678.4 | 14.8 | 1011.0 | 23.6 | 21.4 | ||
| 8 | 335.4 | 12.5 | 679.2 | 15.8 | 1011.9 | 27.6 | 21.1 | ||
| 9 | 335.0 | 13.2 | 678.5 | 11.8 | 1008.8 | 15.7 | 21.1 | ||
| 10 | 335.2 | 12.0 | 677.3 | 13.0 | 1009.6 | 18.7 | 21.4 | 21.4 (n = 10) | |
| GRV 090363 | 1 | 334.7 | 20.9 | 679.6 | 20.9 | 1010.1 | 24.0 | 22.5 | |
| 2 | 334.9 | 13.5 | 679.4 | 17.1 | 1010.5 | 24.9 | 22.1 | ||
| 3 | 336.0 | 12.4 | 678.3 | 11.9 | 1010.5 | 24.7 | 21.6 | ||
| 4 | 336.0 | 12.1 | 679.8 | 12.7 | 1006.1 | 13.8 | 20.9 | ||
| 5 | 335.5 | 14.7 | 678.6 | 16.3 | 1011.9 | 27.9 | 21.5 | ||
| 6 | 334.2 | 12.1 | 677.7 | 14.3 | 1010.2 | 20.9 | 21.6 | ||
| 7 | 335.2 | 12.2 | 679.3 | 16.9 | 1011.3 | 25.8 | 22.0 | ||
| 8 | 334.1 | 14.7 | 679.1 | 16.7 | 1010.9 | 23.1 | 21.5 | ||
| 9 | 334.7 | 12.6 | 677.2 | 15.1 | 1008.4 | 14.8 | 22.0 | ||
| 10 | 334.8 | 12.3 | 677.1 | 16.9 | 1008.6 | 15.1 | 21.6 | 21.8 (n = 10) | |
| GRV 090376 | 1 | 336.9 | 13.6 | 679.5 | 12.5 | 1008.3 | 18.7 | 20.4 | |
| 2 | 334.0 | 15.3 | 678.5 | 20.9 | 1006.5 | 18.3 | 22.3 | ||
| 3 | 334.8 | 15.3 | 678.3 | 13.4 | 1006.2 | 15.2 | 21.4 | ||
| 4 | 335.4 | 14.4 | 678.3 | 16.6 | 1007.9 | 13.9 | 21.1 | ||
| 5 | 335.2 | 13.4 | 679.4 | 14.3 | 1010.7 | 22.5 | 21.0 | ||
| 6 | 334.2 | 13.6 | 677.7 | 14.8 | 1008.0 | 13.1 | 21.4 | ||
| 7 | 334.8 | 13.0 | 679.5 | 15.9 | 1010.8 | 22.7 | 21.1 | ||
| 8 | 334.9 | 13.0 | 679.9 | 16.4 | 1011.2 | 24.9 | 21.2 | ||
| 9 | 335.9 | 13.1 | 677.0 | 17.0 | 1008.1 | 13.5 | 21.4 | ||
| 10 | 334.1 | 12.6 | 680.0 | 15.7 | 1007.0 | 13.4 | 21.1 | 21.3 (n = 10) | |
| GRV 090379 | 1 | 336.8 | 11.6 | 679.2 | 13.8 | 1008.0 | 17.5 | 21.8 | |
| 2 | 334.3 | 13.0 | 678.6 | 12.8 | 1007.1 | 20.2 | 21.0 | ||
| 3 | 334.9 | 12.5 | 678.2 | 12.7 | 1005.6 | 13.1 | 21.0 | ||
| 4 | 334.1 | 14.6 | 679.8 | 11.7 | 1008.4 | 14.9 | 21.3 | ||
| 5 | 335.3 | 13.0 | 677.9 | 14.7 | 1010.1 | 20.5 | 21.4 | ||
| 6 | 334.8 | 12.0 | 677.2 | 12.7 | 1009.6 | 19.9 | 21.2 | ||
| 7 | 335.6 | 13.6 | 677.2 | 11.0 | 1009.3 | 19.4 | 21.4 | ||
| 8 | 334.0 | 13.6 | 678.2 | 13.8 | 1010.7 | 22.5 | 21.2 | ||
| 9 | 334.8 | 13.5 | 677.2 | 11.6 | 1009.0 | 17.0 | 21.1 | ||
| 10 | 334.0 | 13.7 | 678.3 | 12.2 | 1006.1 | 13.2 | 21.5 | 21.3 (n = 10) | |
| GRV 090380 | 1 | 336.0 | 13.8 | 678.5 | 12.5 | 1006.6 | 15.6 | 22.9 | |
| 2 | 335.6 | 14.4 | 678.3 | 16.1 | 1009.8 | 22.0 | 21.7 | ||
| 3 | 333.3 | 17.7 | 677.7 | 19.8 | 1005.9 | 17.7 | 20.8 | ||
| 4 | 335.6 | 14.6 | 677.1 | 15.2 | 1011.3 | 25.3 | 21.8 | ||
| 5 | 335.1 | 12.8 | 678.4 | 15.6 | 1008.4 | 14.6 | 21.4 | ||
| 6 | 335.0 | 14.8 | 677.8 | 14.4 | 1010.3 | 21.8 | 21.6 | ||
| 7 | 335.5 | 13.9 | 679.6 | 15.8 | 1010.7 | 22.4 | 21.6 | ||
| 8 | 335.6 | 14.2 | 680.0 | 14.1 | 1009.6 | 19.0 | 21.5 | ||
| 9 | 335.0 | 12.3 | 677.1 | 16.4 | 1009.3 | 17.8 | 21.7 | ||
| 10 | 334.7 | 13.5 | 678.4 | 16.3 | 1008.9 | 16.0 | 21.4 | 21.6 (n = 10) | |
| GRV 090403 | 1 | 337.3 | 11.4 | 679.9 | 12.2 | 1008.3 | 17.0 | 17.7 | |
| 2 | 337.4 | 15.4 | 679.8 | 11.5 | 1009.5 | 20.1 | 17.6 | ||
| 3 | 337.2 | 12.2 | 680.1 | 13.1 | 1007.4 | 13.2 | 18.0 | ||
| 4 | 337.7 | 11.4 | 680.4 | 13.2 | 1008.8 | 17.2 | 17.6 | ||
| 5 | 338.1 | 11.9 | 680.5 | 12.3 | 1013.0 | 25.3 | 17.4 | ||
| 6 | 337.3 | 12.5 | 680.4 | 17.9 | 1009.7 | 20.0 | 17.9 | ||
| 7 | 336.9 | 13.7 | 679.6 | 14.7 | 1009.0 | 16.9 | 17.8 | ||
| 8 | 336.4 | 13.3 | 680.5 | 16.7 | 1009.3 | 18.0 | 17.9 | ||
| 9 | 337.4 | 14.6 | 680.2 | 18.2 | 1010.6 | 22.4 | 17.7 | ||
| 10 | 336.3 | 14.9 | 679.6 | 16.0 | 1010.1 | 20.5 | 17.7 | 17.7 (n = 10) | |
| GRV 090421 | 1 | 336.2 | 13.3 | 679.4 | 12.2 | 1006.6 | 14.2 | 17.1 | |
| 2 | 336.5 | 12.2 | 679.8 | 12.9 | 1011.9 | 22.7 | 17.0 | ||
| 3 | 336.3 | 11.8 | 679.8 | 20.5 | 1006.3 | 19.5 | 17.0 | ||
| 4 | 337.3 | 25.4 | 679.3 | 12.4 | 1007.5 | 14.7 | 16.5 | ||
| 5 | 337.0 | 11.1 | 679.9 | 12.2 | 1006.4 | 13.5 | 16.8 | ||
| 6 | 336.7 | 13.0 | 680.0 | 12.2 | 1004.3 | 12.9 | 17.0 | ||
| 7 | 336.5 | 13.7 | 679.8 | 16.7 | 1007.2 | 13.6 | 17.1 | ||
| 8 | 337.6 | 12.8 | 679.7 | 14.7 | 1006.6 | 13.4 | 16.9 | ||
| 9 | 336.9 | 14.9 | 680.0 | 11.5 | 1007.0 | 13.5 | 17.0 | ||
| 10 | 337.8 | 13.0 | 680.2 | 13.6 | 1006.9 | 13.4 | 17.2 | 16.9 (n = 10) | |
| GRV 090463 | 1 | 335.0 | 17.4 | 680.5 | 24.9 | 1010.1 | 22.3 | 22.0 | |
| 2 | 337.5 | 48.4 | 679.4 | 16.2 | 1008.0 | 20.7 | 21.3 | ||
| 3 | 336.0 | 13.9 | 680.6 | 17.7 | 1010.2 | 26.3 | 21.6 | ||
| 4 | 337.9 | 34.7 | 680.4 | 16.8 | 1013.0 | 27.5 | 21.2 | ||
| 5 | 335.9 | 18.7 | 678.2 | 16.3 | 1009.4 | 18.4 | 22.0 | ||
| 6 | 335.9 | 19.6 | 679.3 | 15.0 | 1009.7 | 20.3 | 22.1 | ||
| 7 | 335.4 | 21.2 | 678.5 | 17.0 | 1009.9 | 20.3 | 22.1 | ||
| 8 | 335.8 | 18.7 | 678.9 | 12.5 | 1010.5 | 22.1 | 22.1 | ||
| 9 | 335.6 | 21.5 | 679.7 | 16.6 | 1008.9 | 15.8 | 21.8 | ||
| 10 | 334.8 | 20.7 | 678.5 | 17.9 | 1007.8 | 13.8 | 21.9 | 22.0 (n = 10) | |
| GRV 090448 | 1 | 335.9 | 12.5 | 679.2 | 12.6 | 1007.7 | 18.4 | 20.7 | |
| 2 | 335.1 | 14.1 | 678.9 | 13.8 | 1008.2 | 18.8 | 21.7 | ||
| 3 | 335.7 | 13.6 | 678.5 | 12.5 | 1007.0 | 16.7 | 20.9 | ||
| 4 | 334.9 | 13.6 | 678.0 | 13.7 | 1006.2 | 13.3 | 21.8 | ||
| 5 | 335.8 | 13.0 | 678.4 | 12.4 | 1008.4 | 14.2 | 22.1 | ||
| 6 | 334.5 | 13.8 | 678.1 | 13.4 | 1011.0 | 23.8 | 21.2 | ||
| 7 | 334.2 | 14.4 | 679.3 | 12.9 | 1008.5 | 15.0 | 21.0 | ||
| 8 | 335.2 | 14.8 | 679.1 | 12.3 | 1008.1 | 13.1 | 21.0 | ||
| 9 | 334.6 | 14.1 | 680.0 | 18.4 | 1009.4 | 18.1 | 20.9 | ||
| 10 | 335.5 | 15.8 | 679.1 | 17.2 | 1010.2 | 24.1 | 20.8 | 21.1 (n = 10) | |
| GRV 090449 | 1 | 334.7 | 19.3 | 677.6 | 13.1 | 1009.5 | 24.3 | 22.6 | |
| 2 | 335.7 | 15.3 | 678.6 | 16.3 | 1011.3 | 24.1 | 21.9 | ||
| 3 | 335.8 | 14.8 | 678.3 | 18.4 | 1010.6 | 29.0 | 21.8 | ||
| 4 | 335.6 | 14.0 | 679.1 | 25.9 | 1011.4 | 25.2 | 22.1 | ||
| 5 | 336.6 | 29.3 | 678.7 | 17.3 | 1012.2 | 27.0 | 21.6 | ||
| 6 | 335.4 | 17.1 | 677.6 | 17.3 | 1003.3 | 12.0 | 22.1 | ||
| 7 | 334.0 | 16.3 | 678.9 | 14.1 | 1005.4 | 13.0 | 22.1 | ||
| 8 | 335.2 | 16.8 | 677.5 | 17.0 | 1003.9 | 12.7 | 22.2 | ||
| 9 | 335.8 | 18.2 | 679.1 | 17.2 | 1003.1 | 12.0 | 22.1 | ||
| 10 | 335.3 | 14.6 | 679.6 | 12.5 | 1005.8 | 13.2 | 22.2 | 22.0 (n = 10) | |
| GRV 090511 | 1 | 334.6 | 15.4 | 678.6 | 15.1 | 1003.6 | 12.1 | 21.2 | |
| 2 | 334.5 | 15.0 | 679.1 | 15.9 | 1005.4 | 17.0 | 21.4 | ||
| 3 | 331.6 | 31.0 | 679.9 | 21.9 | 1010.2 | 24.1 | 21.6 | ||
| 4 | 336.3 | 14.8 | 674.6 | 25.7 | 1003.4 | 9.4 | 20.8 | ||
| 5 | 335.5 | 12.3 | 679.7 | 13.2 | 1005.7 | 14.9 | 21.1 | ||
| 6 | 335.1 | 14.8 | 679.7 | 14.2 | 1003.5 | 12.2 | 21.3 | ||
| 7 | 334.0 | 14.9 | 679.3 | 14.2 | 1003.2 | 12.0 | 21.0 | ||
| 8 | 335.6 | 15.8 | 678.0 | 14.4 | 1005.8 | 13.2 | 21.2 | ||
| 9 | 336.0 | 16.7 | 679.7 | 16.9 | 1007.1 | 13.6 | 21.3 | ||
| 10 | 335.7 | 15.3 | 679.7 | 15.7 | 1007.2 | 13.8 | 21.2 | 21.3 (n = 10) | |
| GRV 090517 | 1 | 336.2 | 17.1 | 679.3 | 16.5 | 1012.2 | 32.1 | 21.0 | |
| 2 | 334.5 | 16.2 | 678.7 | 13.2 | 1006.6 | 17.7 | 21.6 | ||
| 3 | 334.7 | 17.1 | 678.7 | 15.5 | 1009.2 | 22.9 | 21.6 | ||
| 4 | 335.6 | 15.8 | 677.3 | 16.4 | 1008.8 | 15.2 | 21.6 | ||
| 5 | 335.5 | 16.8 | 678.2 | 16.8 | 1011.3 | 25.2 | 21.4 | ||
| 6 | 334.5 | 16.9 | 677.7 | 17.0 | 1009.3 | 17.5 | 21.5 | ||
| 7 | 334.2 | 16.2 | 679.6 | 14.3 | 1008.9 | 16.2 | 21.3 | ||
| 8 | 336.0 | 17.0 | 678.9 | 14.5 | 1011.3 | 25.6 | 21.6 | ||
| 9 | 335.6 | 16.1 | 677.3 | 14.9 | 1011.0 | 24.2 | 21.6 | ||
| 10 | 334.7 | 15.8 | 677.8 | 15.9 | 1008.0 | 14.0 | 21.3 | 21.5 (n = 10) | |
| GRV 090519 | 1 | 333.4 | 19.5 | 677.3 | 27.1 | 1007.8 | 27.4 | 21.2 | |
| 2 | 334.6 | 22.3 | 678.1 | 23.2 | 1013.7 | 37.6 | 21.0 | ||
| 3 | 335.2 | 21.2 | 678.4 | 24.0 | 1006.7 | 13.4 | 21.1 | ||
| 4 | 334.9 | 19.7 | 678.5 | 20.9 | 1010.4 | 22.0 | 21.9 | ||
| 5 | 334.4 | 21.7 | 679.6 | 20.1 | 1009.6 | 19.9 | 21.8 | ||
| 6 | 334.3 | 21.4 | 679.1 | 24.6 | 1010.2 | 21.1 | 21.3 | ||
| 7 | 336.0 | 21.0 | 678.4 | 21.7 | 1010.3 | 21.8 | 21.2 | ||
| 8 | 334.3 | 22.7 | 677.8 | 21.7 | 1011.4 | 26.0 | 21.9 | ||
| 9 | 334.9 | 22.5 | 678.7 | 23.4 | 1011.1 | 24.2 | 21.6 | ||
| 10 | 334.1 | 19.8 | 679.2 | 24.3 | 1011.7 | 26.6 | 21.5 | 21.5 (n = 10) | |
| GRV 090520 | 1 | 335.8 | 23.9 | 680.3 | 18.6 | 1008.1 | 30.0 | 20.6 | |
| 2 | 333.3 | 24.6 | 678.7 | 21.7 | 1010.4 | 35.0 | 21.2 | ||
| 3 | 332.8 | 32.8 | 677.9 | 15.4 | 1005.1 | 18.5 | 22.8 | ||
| 4 | 335.1 | 19.7 | 677.5 | 13.4 | 1006.3 | 13.3 | 20.6 | ||
| 5 | 335.7 | 20.3 | 679.3 | 12.8 | 1008.9 | 16.7 | 21.1 | ||
| 6 | 335.3 | 22.0 | 679.6 | 16.5 | 1008.3 | 13.9 | 21.1 | ||
| 7 | 335.1 | 20.8 | 678.6 | 16.6 | 1009.1 | 17.1 | 20.5 | ||
| 8 | 335.9 | 22.2 | 677.5 | 14.0 | 1008.4 | 14.1 | 20.9 | ||
| 9 | 335.4 | 18.4 | 679.7 | 15.1 | 1009.5 | 18.5 | 21.1 | ||
| 10 | 335.8 | 20.4 | 679.4 | 18.6 | 1011.3 | 25.0 | 21.3 | 21.0 (n = 10) | |
| GRV 090521 | 1 | 332.7 | 23.0 | 676.7 | 18.1 | 1005.3 | 17.7 | 21.9 | |
| 2 | 332.5 | 23.3 | 675.2 | 31.9 | 1004.2 | 23.3 | 22.8 | ||
| 3 | 335.1 | 18.0 | 676.3 | 24.7 | 1002.7 | 11.8 | 20.8 | ||
| 4 | 332.6 | 19.5 | 675.8 | 24.2 | 1003.6 | 17.1 | 22.0 | ||
| 5 | 334.0 | 20.9 | 679.5 | 22.7 | 1003.9 | 12.6 | 21.4 | ||
| 6 | 334.9 | 21.4 | 679.8 | 25.8 | 1005.5 | 13.0 | 21.1 | ||
| 7 | 334.6 | 19.0 | 678.4 | 25.3 | 1004.4 | 12.9 | 21.3 | ||
| 8 | 335.7 | 18.2 | 677.3 | 20.9 | 1003.4 | 12.1 | 21.1 | ||
| 9 | 335.0 | 21.0 | 678.5 | 22.4 | 1004.9 | 12.9 | 21.4 | ||
| 10 | 335.3 | 18.1 | 679.0 | 21.5 | 1006.0 | 13.2 | 20.9 | 21.6 (n = 10) |
References
- Hutchison, R. Meteorites: A Petrologic, Chemical and Isotopic Synthesis; Cambridge University Press: Cambridge, UK, 2006. [Google Scholar]
- Miao, B.; Xia, Z.; Zhang, C.; Ou, R.; Sun, Y. Progress of Antarctic meteorite survey and research in China. Adv. Polar Sci. 2018, 29, 61–77. [Google Scholar]
- Xia, Z.; Zhang, J.; Miao, B.; Ou, R.; Xie, L.; Yang, R.; Jing, Y. Meteorite classification for building the Chinese Antarctic Meteorite Depository—Introduction of the classification of 500 grove mountains meteorites. Adv. Polar Sci. 2016, 27, 56–63. [Google Scholar]
- Van Schmus, W.; Wood, J.A. A chemical-petrologic classification for the chondritic meteorites. Geochim. Et Cosmochim. Acta 1967, 31, 747–765. [Google Scholar] [CrossRef]
- Grossman, J.; Rubin, A. White paper report for the Nomenclature Committee on the composition of olivine and pyroxene in equilibrated ordinary chondrites. Unpublished work. 2006. Available online: https://www.lpi.usra.edu/meteor/docs/whitepaper.pdf (accessed on 13 July 2022).
- Wasson, J.T.; Kallemeyn, G.W. Compositions of chondrites. Philos. Trans. R. Soc. London. Ser. A Math. Phys. Sci. 1988, 325, 535–544. [Google Scholar]
- Baryshnikova, G.; Lavrukhina, A. The classification of the chondrules of ordinary chondrites. Geokhimiia 1982, 58, 490–503. [Google Scholar]
- Rochette, P.; Sagnotti, L.; Bourot-Denise, M.; Consolmagno, G.; Folco, L.; Gattacceca, J.; Osete, M.L.; Pesonen, L. Magnetic classification of stony meteorites: 1. Ordinary chondrites. Meteorit. Planet. Sci. 2003, 38, 251–268. [Google Scholar] [CrossRef]
- Tomioka, N.; Miyahara, M. High-pressure minerals in shocked meteorites. Meteorit. Planet. Sci. 2017, 52, 2017–2039. [Google Scholar] [CrossRef]
- Rubin, A.E. Mineralogy of meteorite groups. Meteorit. Planet. Sci. 1997, 32, 231–247. [Google Scholar] [CrossRef]
- Fritz, J.; Greshake, A.; Fernandes, V.A. Revising the shock classification of meteorites. Meteorit. Planet. Sci. 2017, 52, 1216–1232. [Google Scholar] [CrossRef]
- Sharp, T.G.; DeCarli, P.S. Shock effects in meteorites. Meteor. Early Sol. Syst. II 2006, 943, 653–677. [Google Scholar]
- Stöffler, D.; Keil, K.; RD, S.E. Shock metamorphism of ordinary chondrites. Geochim. Et Cosmochim. Acta 1991, 55, 3845–3867. [Google Scholar] [CrossRef] [Green Version]
- Angel, S.M.; Gomer, N.R.; Sharma, S.K.; McKay, C. Remote Raman spectroscopy for planetary exploration: A review. Appl. Spectrosc. 2012, 66, 137–150. [Google Scholar] [CrossRef] [PubMed] [Green Version]
- Wang, A.; Freeman, J.J.; Jolliff, B.L.; Chou, I.-M. Sulfates on Mars: A systematic Raman spectroscopic study of hydration states of magnesium sulfates. Geochim. Et Cosmochim. Acta 2006, 70, 6118–6135. [Google Scholar] [CrossRef]
- Haskin, L.A.; Wang, A.; Rockow, K.M.; Jolliff, B.L.; Korotev, R.L.; Viskupic, K.M. Raman spectroscopy for mineral identification and quantification for in situ planetary surface analysis: A point count method. J. Geophys. Res. Planets 1997, 102, 19293–19306. [Google Scholar] [CrossRef] [Green Version]
- Nascimento-Dias, B. Aplicação da espectroscopia Raman na identificação de olivinas em meteoritos. J. Exp. Tech. Instrum. 2021, 4, 21–28. [Google Scholar] [CrossRef]
- Maksimova, A.A.; Petrova, E.V.; Chukin, A.V.; Nogueira, B.A.; Fausto, R.; Szabó, Á.; Dankházi, Z.; Felner, I.; Gritsevich, M.; Kohout, T.; et al. Bjurböle L/LL4 ordinary chondrite properties studied by Raman spectroscopy, X-ray diffraction, magnetization measurements and Mössbauer spectroscopy. Spectrochim. Acta Part A Mol. Biomol. Spectrosc. 2021, 248, 119196. [Google Scholar] [CrossRef]
- Xie, Z.; Sharp, T.G.; DeCarli, P.S. High-pressure phases in a shock-induced melt vein of the Tenham L6 chondrite: Constraints on shock pressure and duration. Geochim. Et Cosmochim. Acta 2006, 70, 504–515. [Google Scholar] [CrossRef]
- Pittarello, L.; Baert, K.; Debaille, V.; Claeys, P. Screening and classification of ordinary chondrites by Raman spectroscopy. Meteorit. Planet. Sci. 2015, 50, 1718–1732. [Google Scholar] [CrossRef]
- Alba-Aldave, L.; Cervantes-de la Cruz, K.; Sato-Berru, R.; Linares-López, C.; Reyes-Salas, M.; Ortega-Gutiérrez, F. Ca-poor Pyroxene Raman Characteristics in H Ordinary Chondrites. In Proceedings of the AIP Conference Proceedings 2–4 April 2009, Mainz, Germany, 2–4 April 2009; American Institute of Physics: College Park, MD, USA, 2009; Volume 1163, pp. 161–167. [Google Scholar] [CrossRef]
- Kuebler, K.E.; Jolliff, B.L.; Wang, A.; Haskin, L.A. Extracting olivine (Fo–Fa) compositions from Raman spectral peak positions. Geochim. Et Cosmochim. Acta 2006, 70, 6201–6222. [Google Scholar] [CrossRef]
- Huang, E.; Chen, C.; Huang, T.; Lin, E.; Xu, J.-A. Raman spectroscopic characteristics of Mg-Fe-Ca pyroxenes. Am. Mineral. 2000, 85, 473–479. [Google Scholar] [CrossRef]
- Karki, B.; Duan, W.; Da Silva, C.; Wentzcovitch, R. Ab initio structure of MgSiO3 ilmenite at high pressure. Am. Mineral. 2000, 85, 317–320. [Google Scholar] [CrossRef]
- Lin, Y.; Kimura, M.; Miao, B.; Dai, D.; Monoi, A. Petrographic comparison of refractory inclusions from different chemical groups of chondrites. Meteorit. Planet. Sci. 2006, 41, 67–81. [Google Scholar] [CrossRef]
- Xie, X.; Chen, M.; Wang, D. Shock-related mineralogical features and PT history of the Suizhou L6 chondrite. Eur. J. Mineral. 2001, 13, 1177–1190. [Google Scholar] [CrossRef]
- Chen, M.; Sharp, T.G.; Goresy, A.E.; Wopenka, B.; Xie, X. The majorite-pyrope+ magnesiowüstite assemblage: Constraints on the history of shock veins in chondrites. Science 1996, 271, 1570–1573. [Google Scholar] [CrossRef]
- Wesełucha-Birczyńska, A.; Żmudzka, M. Micro-Raman spectroscopy characterization of selected meteorites. J. Mol. Struct. 2008, 887, 253–261. [Google Scholar] [CrossRef]
- Chakraborty, S. Diffusion Coefficients in Olivine, Wadsleyite and Ringwoodite. Rev. Mineral. Geochem. 2010, 72, 603–639. [Google Scholar] [CrossRef]
- Rull, F.; Muñoz-Espadas, M.J.; Lunar, R.; Martínez-Frías, J. Raman spectroscopic study of four Spanish shocked ordinary chondrites: Cañellas, Olmedilla de Alarcón, Reliegos and Olivenza. Philos. Trans. R. Soc. A: Math. Phys. Eng. Sci. 2010, 368, 3153–3166. [Google Scholar] [CrossRef] [Green Version]
- Hope, G.; Woods, R.; Munce, C. Raman microprobe mineral identification. Miner. Eng. 2001, 14, 1565–1577. [Google Scholar] [CrossRef]
- Unsalan, O.; Altunayar-Unsalan, C. Shock–induced olivine–ringwoodite and plagioclase–maskelynite transformations in Bursa L6 chondrite: A Raman and ATR–FTIR spectroscopic study. Spectrochim. Acta Part A: Mol. Biomol. Spectrosc. 2020, 240, 118590. [Google Scholar] [CrossRef]
- Foster, N.; Wozniakiewicz, P.J.; Price, M.C.; Kearsley, A.T.; Burchell, M.J. Identification by Raman spectroscopy of Mg–Fe content of olivine samples after impact at 6 km s− 1 onto aluminium foil and aerogel: In the laboratory and in Wild-2 cometary samples. Geochim. Et Cosmochim. Acta 2013, 121, 1–14. [Google Scholar] [CrossRef] [Green Version]
- Harriss, K.H.; Burchell, M.J. A study of the observed shift in the peak position of olivine Raman spectra as a result of shock induced by hypervelocity impacts. Meteorit. Planet. Sci. 2016, 51, 1289–1300. [Google Scholar] [CrossRef] [Green Version]


| Sample Name | Chemical Group | Petrologic Type | Shock Stage | Weathering | Av.Fa/mol% | Av.Fs/mol% |
|---|---|---|---|---|---|---|
| GRV 090360 | L | 5 | S1 | W1 | 24.12 ± 0.90 (n = 10) | 20.74 ± 1.19 (n = 11) |
| GRV 090361 | L | 5 | S3 | W1 | 21.92 ± 0.63 (n = 10) | 18.95 ± 0.71 (n = 11) |
| GRV 090363 | L | 5 | S5 | W1 | 21.5 ± 0.38 (n = 7) | 18.46 ± 0.88 (n = 11) |
| GRV 090376 | L | 5 | S2 | W2 | 24.96 ± 0.73 (n = 24) | 21.33 ± 0.81 (n = 7) |
| GRV 090379 | L | 5 | S3 | W2 | 25.06 ± 1 (n = 9) | 21.13 ± 0.89 (n = 12) |
| GRV 090380 | L | 5 | S2 | W2 | 23.94 ± 0.54 (n = 12) | 20.68 ± 0.71 (n = 12) |
| GRV 090403 | H | 5 | S2 | W2 | 19.47 ± 0.23 (n = 10) | 17.57 ± 0.28 (n = 9) |
| GRV 090421 | H | 5 | S2 | W2 | 18.36 ± 0.6 (n = 15) | 16.62 ± 0.6 (n = 11) |
| GRV 090448 | L | 5 | S2 | W1 | 23.63 ± 0.67 (n = 11) | 20.11 ± 0.48 (n = 13) |
| GRV 090449 | L | 5 | S3 | W2 | 23.53 ± 0.73 (n = 13) | 19.77 ± 0.32 (n = 9) |
| GRV 090463 | L | 5 | S4 | W2 | 23.37 ± 0.37 (n = 15) | 19.98 ± 0.52 (n = 15) |
| GRV 090511 | L | 5 | S4 | W1 | 24.34 ± 0.45 (n = 10) | 21.57 ± 1.29 (n = 12) |
| GRV 090517 | L | 6 | S4 | W2 | 24.08 ± 0.32 (n = 13) | 20.88 ± 0.38 (n = 12) |
| GRV 090519 | L | 5 | S2 | W1 | 24.83 ± 0.78 (n = 10) | 21.47 ± 0.66 (n = 9) |
| GRV 090520 | L | 5 | S3 | W3 | 23.74 ± 0.29 (n = 14) | 20.14 ± 0.15 (n = 12) |
| GRV 090521 | L | 4 | S4 | W2 | 25.31 ± 2.03 (n = 13) | 21.05 ± 1.33 (n = 16) |
| Minerals | RRUFF ID | Mineral Phase | Peak A/cm−1 | Peak B/cm−1 | Peak C/cm−1 | Fa/mol% | Fs/mol% |
|---|---|---|---|---|---|---|---|
| Olivine | R100103 | Fayalite | 815.5 | 838.7 | 97.7 | ||
| R100104 | Fayalite | 811.8 | 840.0 | 95.2 | |||
| R100102 | Fayalite | 818.2 | 845.2 | 55.5 | |||
| R060539 | Forsterite | 821.8 | 853.2 | 16.5 | |||
| R040057 | Forsterite | 823.5 | 855.0 | 16.1 | |||
| R100101 | Forsterite | 822.8 | 854.7 | 9.19 | |||
| R050117 | Forsterite | 823.3 | 855.0 | 9.05 | |||
| R060535 | Forsterite | 823.1 | 855.0 | 9.05 | |||
| R040018 | Forsterite | 822.1 | 854.0 | 9.05 | |||
| R060551 | Forsterite | 823.0 | 855.1 | 9.00 | |||
| R100100 | Forsterite | 823.6 | 855.8 | 7.71 | |||
| R100099 | Forsterite | 824.7 | 857.0 | 0.00 | |||
| R040052 | Forsterite | 822.7 | 855.2 | 0.00 | |||
| Pyroxene | R040093 | Enstatite | 337.4 | 679.8 | 1007.1 | 15.2 | |
| R040094 | Enstatite | 338.2 | 680.8 | 1008.9 | 15.2 | ||
| R050644 | Enstatite | 339.3 | 682.3 | 1011.1 | 10.0 | ||
| R060630 | Enstatite | 350.7 | 687.7 | 1014.2 | 7.30 | ||
| R060744 | Enstatite | 338.7 | 681.3 | 1009.3 | 14.1 | ||
| R070418 | Enstatite | 344.0 | 683.2 | 1008.0 | 14.0 | ||
| R070550 | Enstatite | 340.6 | 683.3 | 1011.3 | 10.0 | ||
| R070386 | Ferrosilite | 330.8 | 659.0 | 990.5 | 82.8 | ||
| R070387 | Ferrosilite | 327.9 | 669.6 | 995.8 | 49.5 |
| Mineral | Number | Shock Stage | Position | FWHM in Peak A | FWHM in Peak B | FWHM in Peak C |
|---|---|---|---|---|---|---|
| Ol | GRV 090403 | S2 | matrix | 10.33 | 13.64 | |
| 11.01 | 14.66 | |||||
| GRV 090421 | S2 | matrix | 10.63 | 13.52 | ||
| 12.22 | 15.40 | |||||
| GRV 090511 | S4 | matrix | 14.40 | 16.13 | ||
| shock vein | 16.09 | 17.47 | ||||
| GRV 090517 | S4 | matrix | 11.83 | 14.77 | ||
| shock vein | 13.29 | 16.01 | ||||
| Px | GRV 090403 | S2 | matrix | 12.21 | 13.07 | 13.19 |
| 15.35 | 11.46 | 20.07 | ||||
| GRV 090421 | S2 | matrix | 11.08 | 12.23 | 13.50 | |
| 12.21 | 12.90 | 22.73 | ||||
| GRV 090511 | S4 | matrix | 14.99 | 15.87 | 16.99 | |
| shock vein | 30.95 | 21.94 | 24.05 | |||
| GRV 090517 | S4 | matrix | 16.17 | 13.24 | 17.66 | |
| shock vein | 17.12 | 15.50 | 22.90 |
Publisher’s Note: MDPI stays neutral with regard to jurisdictional claims in published maps and institutional affiliations. |
© 2022 by the authors. Licensee MDPI, Basel, Switzerland. This article is an open access article distributed under the terms and conditions of the Creative Commons Attribution (CC BY) license (https://creativecommons.org/licenses/by/4.0/).
Share and Cite
Zhang, Y.; Xia, Z.; Miao, B.; Huang, J.; Zhang, C.; Chen, Y.; Chen, G. Raman Spectroscopy Studies of Equilibrated Ordinary Chondrites with H and L Group and Shock Metamorphism Degrees. Minerals 2022, 12, 1053. https://doi.org/10.3390/min12081053
Zhang Y, Xia Z, Miao B, Huang J, Zhang C, Chen Y, Chen G. Raman Spectroscopy Studies of Equilibrated Ordinary Chondrites with H and L Group and Shock Metamorphism Degrees. Minerals. 2022; 12(8):1053. https://doi.org/10.3390/min12081053
Chicago/Turabian StyleZhang, Yikai, Zhipeng Xia, Bingkui Miao, Jing Huang, Chuantong Zhang, Yan Chen, and Guozhu Chen. 2022. "Raman Spectroscopy Studies of Equilibrated Ordinary Chondrites with H and L Group and Shock Metamorphism Degrees" Minerals 12, no. 8: 1053. https://doi.org/10.3390/min12081053