
Tracking Grade Heterogeneity in a Panel Cave Mine: A Reconciliation Study Investigating the Impact of Mixing from an Ore Sorting Perspective
Abstract
:1. Introduction
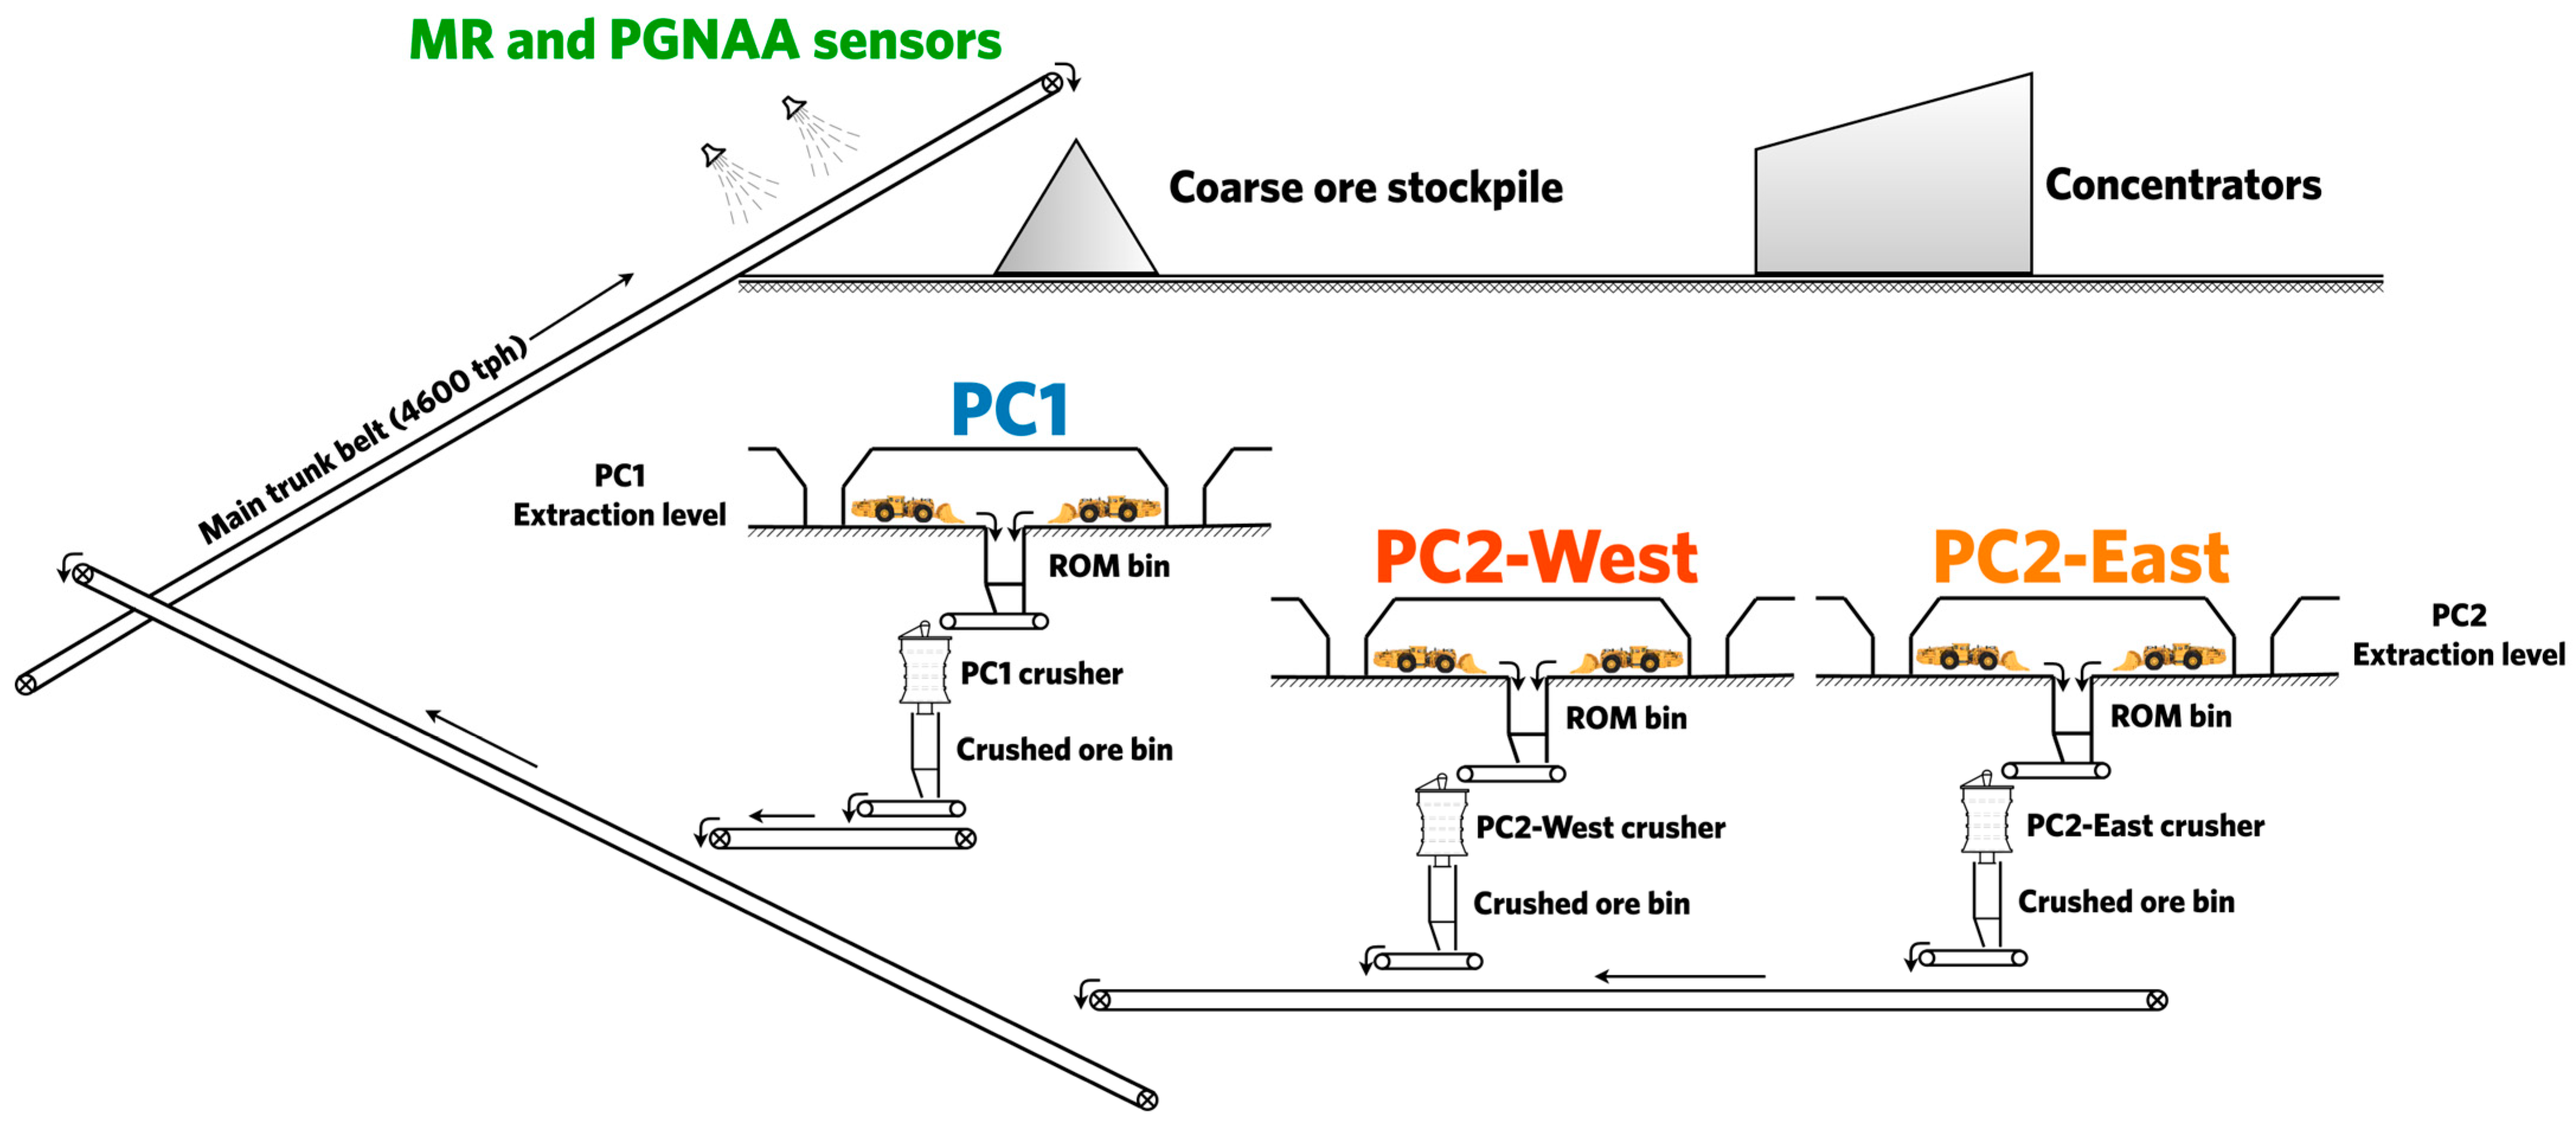
2. Identification of Mixing Events at the Cadia East Mine
3. Methodology
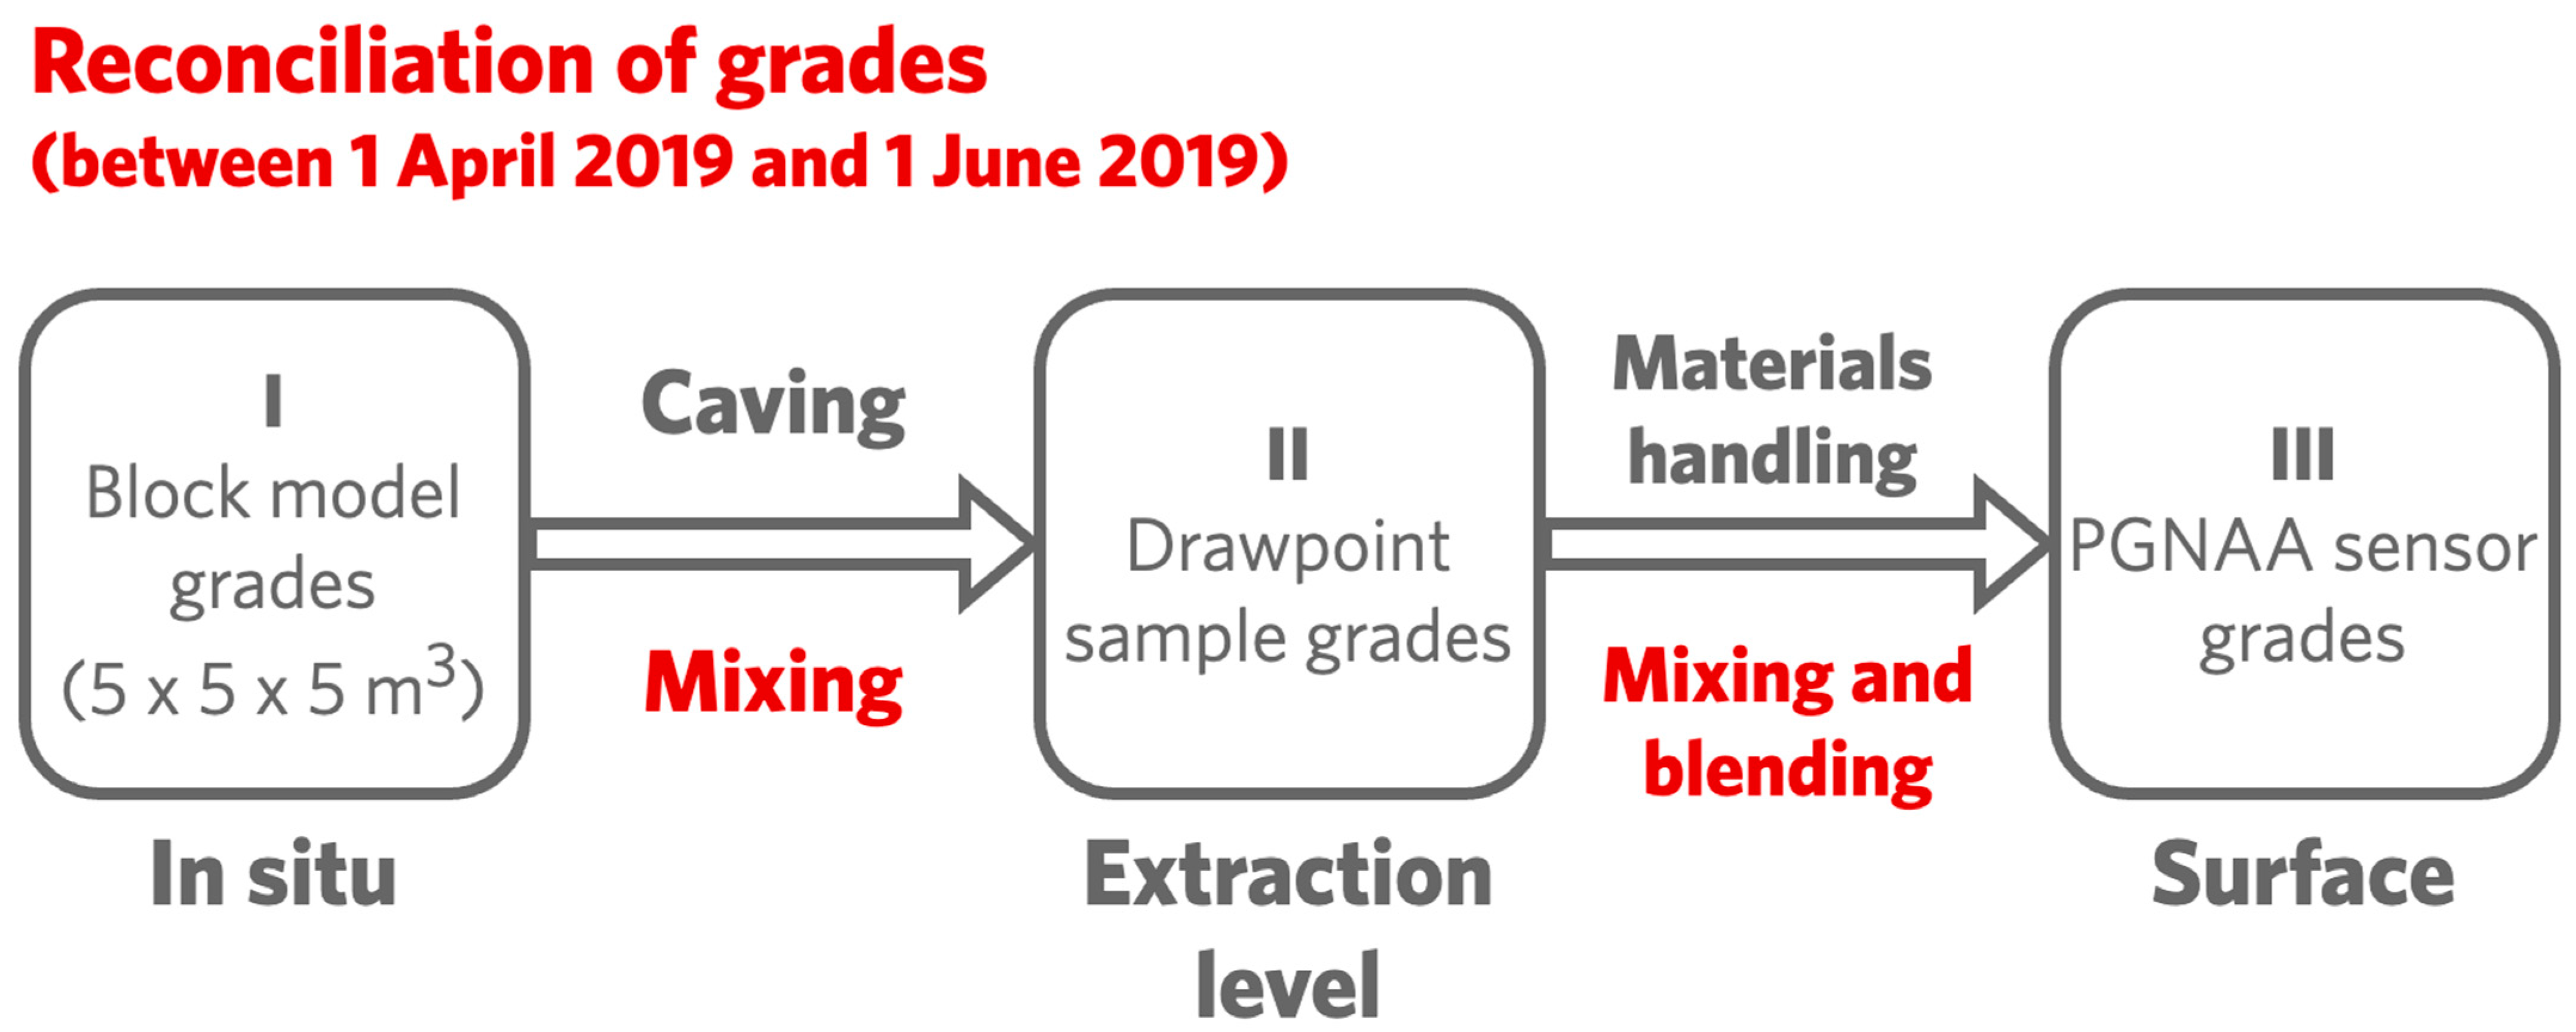
3.1. Investigation Period
3.2. Data Description and Grade Reconciliation
3.3. Assessing Impact of Mixing on Grade Heterogeneity and Bulk Ore Sorting Potential
4. Results and Discussion
4.1. Impact on Grade Heterogeneity
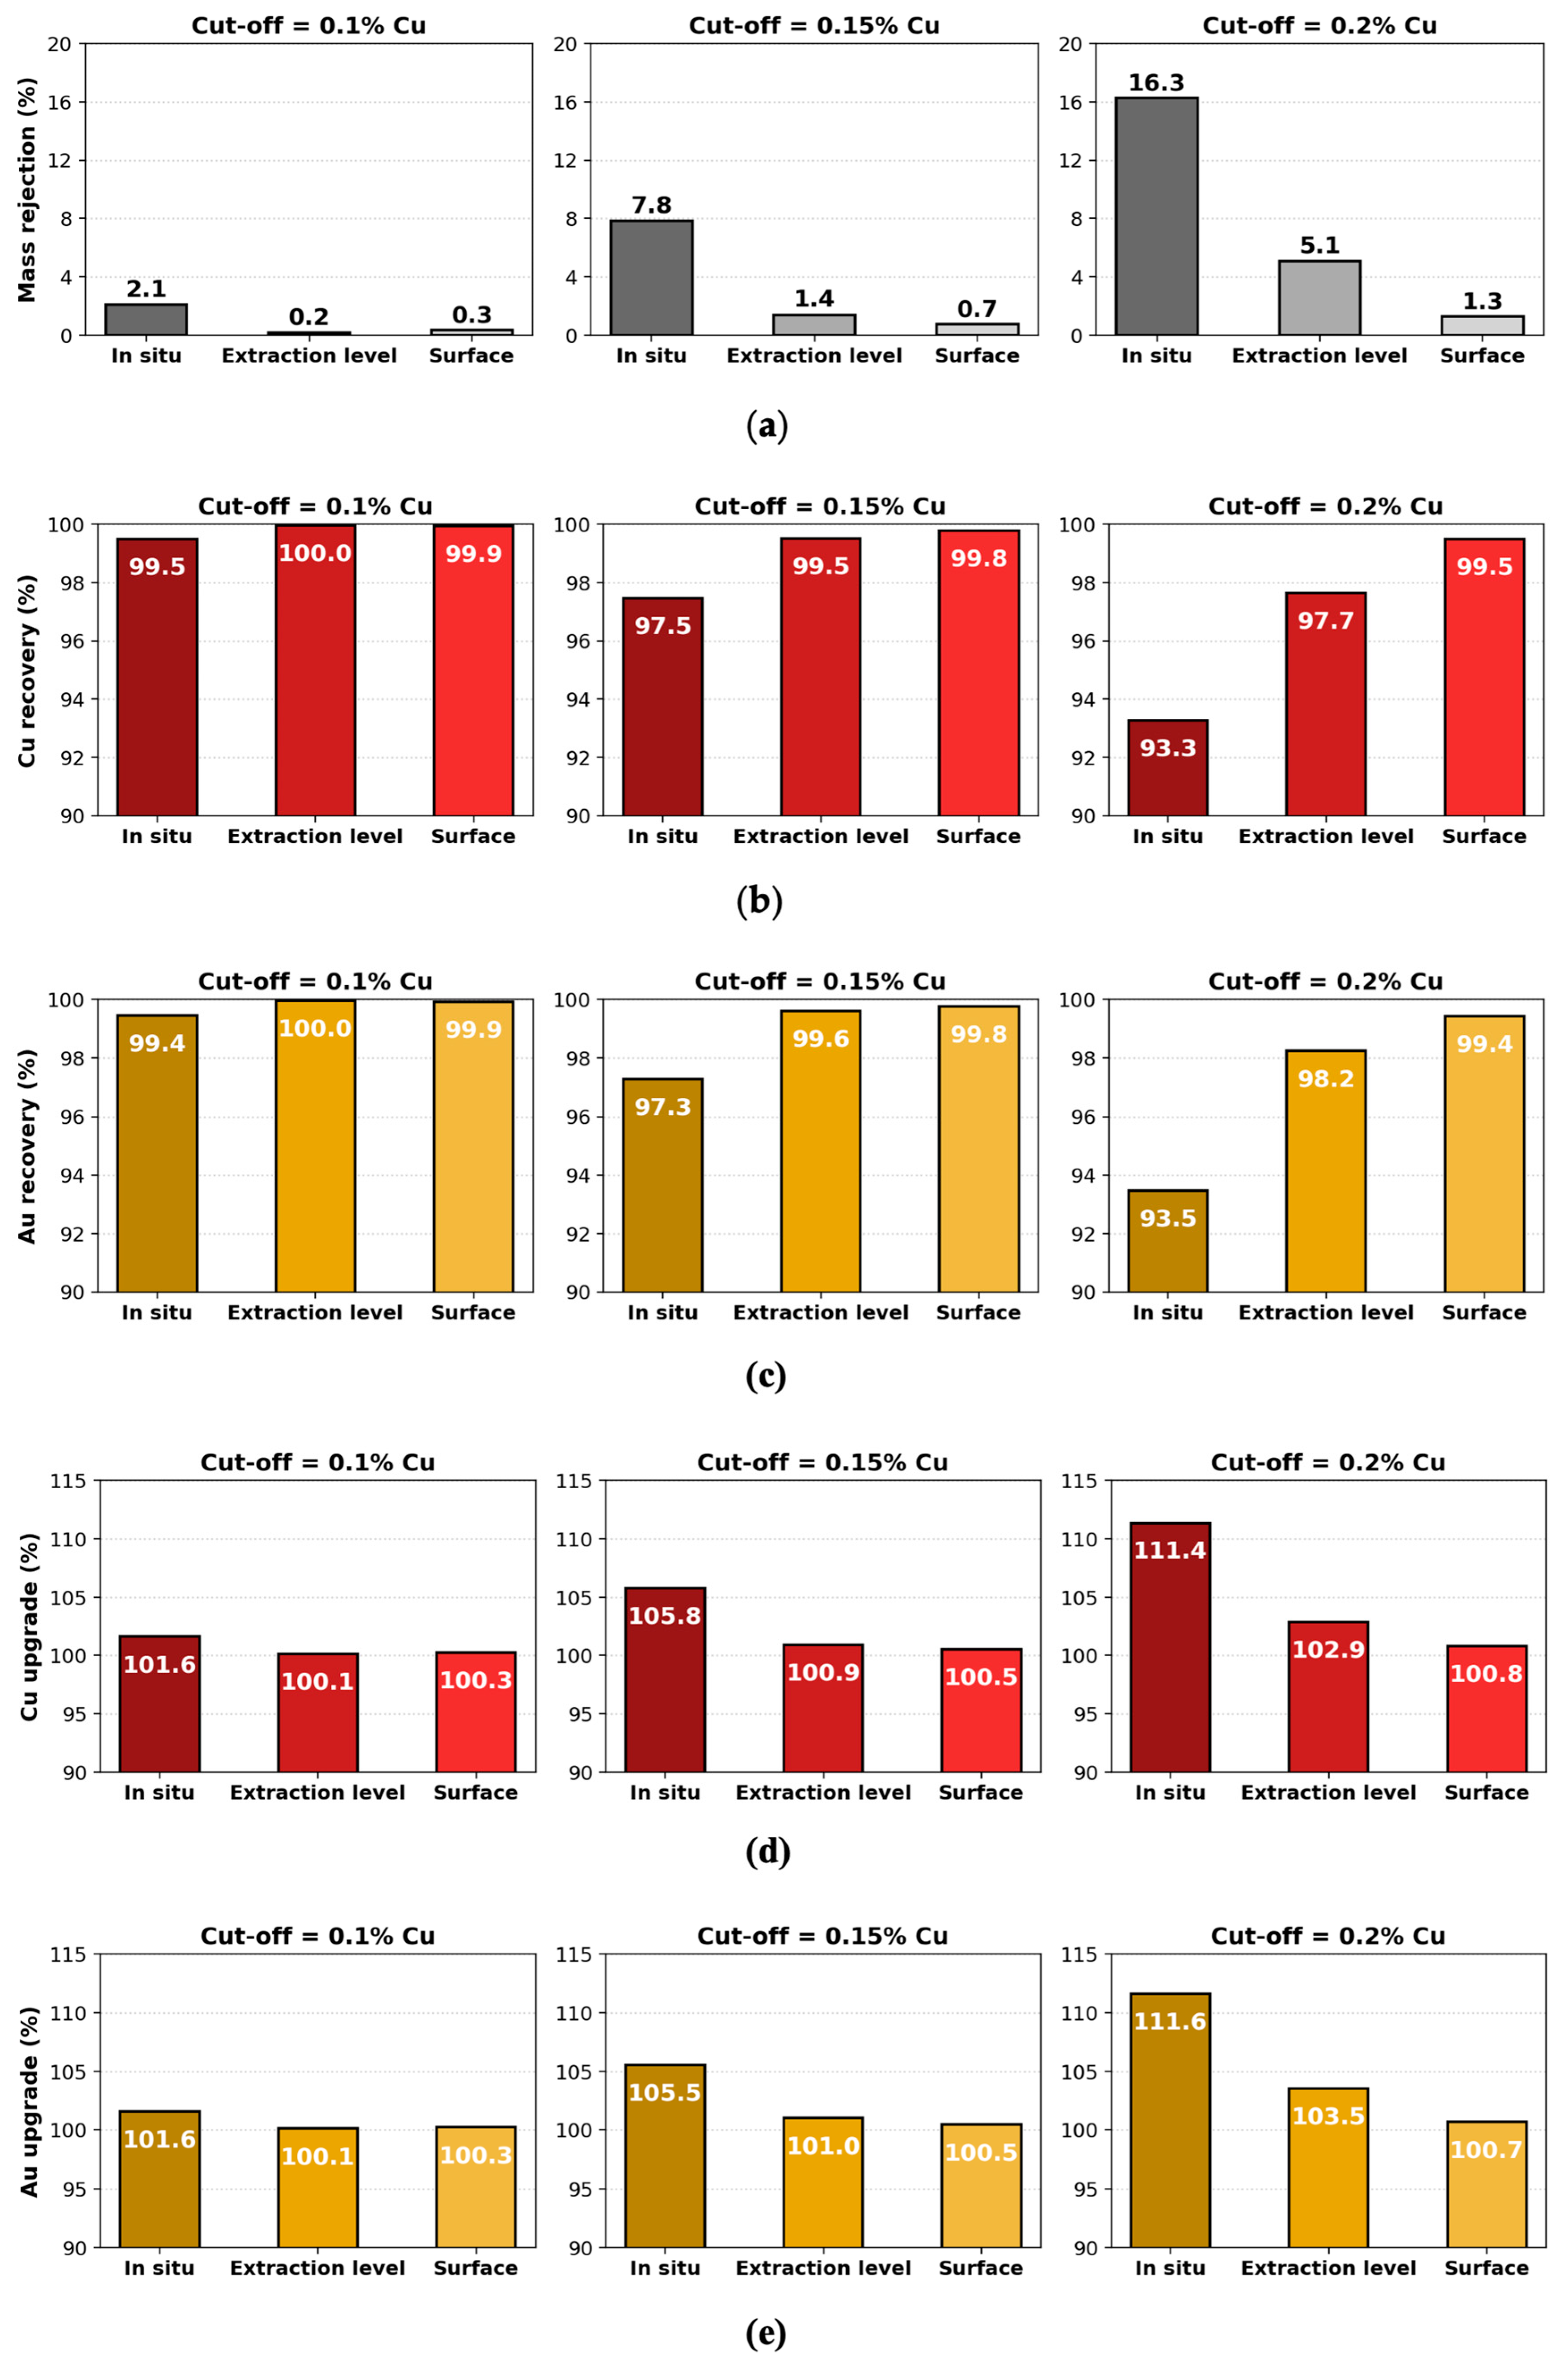
4.2. Impact on Bulk Ore Sorting Potential
5. Conclusions
Author Contributions
Funding
Data Availability Statement
Acknowledgments
Conflicts of Interest
References
- Robben, C.; Wotruba, H. Sensor-Based Ore Sorting Technology in Mining-Past, Present and Future. Minerals 2019, 9, 523. [Google Scholar] [CrossRef]
- Klein, B.; Bamber, A. Mineral Sorting. In Mineral Processing and Extractive Metallurgy Handbook; Society for Mining, Metallurgy & Exploration (SME): Englewood, CO, USA, 2019; pp. 763–786. [Google Scholar]
- Rutter, J.; Scott, M.; Odiar, N.; Federov, M.; Francois-Bongarcon, D. Quantification of surface sensor representivity of primary crushed ore for bulk ore sorting. In Proceedings of the Preconcentration Digital Conference, Online, 10–11, 17–18 November 2020. [Google Scholar]
- Noble, G.; Ferguson, S. Understanding ore heterogeneity and effective bulk ore sorting using PGNAA/PFTNA. In Proceedings of the Preconcentration Digital Conference, Online, 10–11, 17–18 November 2020. [Google Scholar]
- Li, G.; Klein, B.; Sun, C.; Kou, J. Investigation on influential factors of bulk ore sortability based on fractal modelling. Miner. Eng. 2021, 177, 107362. [Google Scholar] [CrossRef]
- Keeney, L.; La Rosa, D.; Walters, P.; Rutter, J.; Scott, M. Evaluation and operationalization of bulk sensing technologies: Insights from real world case studies. In Proceedings of the Preconcentration Digital Conference, Online, 10–11, 17–18 November 2020. [Google Scholar]
- Scott, M.; Rutter, J.; Plessis, J.D.; Alexander, D. Operational deployment of sensor technologies for bulk ore sorting at Mogalakwena PGE Mine. In Proceedings of the Preconcentration Digital Conference, Online, 10–11, 17–18 November 2020. [Google Scholar]
- Nadolski, S.; Klein, B.; Elmo, D.; Scoble, M.; Liu, Y.; Scholar, J. Investigation into the Implementation of Sensor-based Ore Sorting Systems at a Block Caving Operation. In Proceedings of the Seventh International Conference & Exhibition on Mass Mining, Sydney, NSW, Australia, 9–11 May 2016. [Google Scholar]
- Moss, A.; Klein, B.; Nadolski, S. Cave to mill: Improving value of caving operations. In Proceedings of the Caving 2018: Proceedings of the Fourth International symposium on Block and Sublevel Caving, Vancouver, BC, Canada, 15–17 October 2018. [Google Scholar]
- Nadolski, S.; Samuels, M.; Klein, B.; Hart, C.J. Evaluation of bulk and particle sensor-based sorting systems for the New Afton block caving operation. Miner. Eng. 2018, 121, 169–179. [Google Scholar] [CrossRef]
- Kurth, H. Using real time elemental analysis of conveyed ore flows to improve copper processing export citation. In Proceedings of the 58th Conference of Metallurgists Hosting Copper 2019, Vancouver, BC, Canada, 18–21 August 2019. [Google Scholar]
- Beal, C.; Singh, S. Improved mining recovery with bulk ore sorting and MR technology. In Proceedings of the Preconcentration Digital Conference, Online, 10–11, 17–18 November 2020. [Google Scholar]
- Coghill, P.J.; Curtain, A.; Lovric, B.; McEwan, A.; Milinkovic, D.; Miljak, D.G.; Roberts, G.; Stefulj, R.; Yong, R. Bulk sensing of trucks, in-pit equipment and the mine bench for preconcentration. In Proceedings of the Preconcentration Digital Conference 2020, Online, 10–11, 17–18 November 2020. [Google Scholar]
- Gleeson, K.; Newcombe, G.; Griffin, P.; Stephenson, P. Cadia Operations New South Wales, Australia NI 43-101 Technical Report; Newcrest Mining Limited: Melbourne, Australia, 2020. [Google Scholar]
- Diering, T.; Richter, O.; Villa, D. Block cave production scheduling using PCBC. In Proceedings of the SME Annual Meeting, Phoenix, AZ, USA, 28 February–3 March 2010. [Google Scholar]
- Gy, P.M. Introduction to the theory of sampling I. Heterogeneity of a population of uncorrelated units. TrAC Trends Anal. Chem. 1995, 14, 67–76. [Google Scholar] [CrossRef]
- Nadolski, S. Cave-to-Mill: Mine and Mill Integration for Block Cave Mines. Ph.D. Thesis, University of British Columbia, Vancouver, BC, Canada, 2018. [Google Scholar]
- Burr, I.W. Cumulative Frequency Functions. Ann. Math. Stat. 1942, 13, 215–332. [Google Scholar] [CrossRef]
- Tadikamalla, P.R. A Look at the Burr and Related Distributions. Int. Stat. Rev. 1980, 48, 337–344. [Google Scholar] [CrossRef]
- Rossi, M.E.; Deutsch, C.V. Statistical Tools and Concepts. In Mineral Resource Estimation; Springer: Dordrecht, The Netherlands, 2014; pp. 11–27. [Google Scholar]
- Singer, D.A. The lognormal distribution of metal resources in mineral deposits. Ore Geol.Rev. 2013, 55, 80–86. [Google Scholar] [CrossRef]
- Gandhi, S.M.; Sarkar, B.C. Conventional and Statistical Resource/Reserve Estimation. In Essentials of Mineral Exploration and Evaluation; Elsevier: Amsterdam, The Netherlands, 2016; pp. 271–288. [Google Scholar]
- Holliday, J.R.; Wilson, A.J.; Blevin, P.L.; Tedder, I.J.; Dunham, P.D.; Pfitzner, M. Porphyry gold-copper mineralisation in the Cadia district, eastern Lachlan Fold Belt, New South Wales, and its relationship to shoshonitic magmatism. Miner. Depos. 2002, 37, 100–116. [Google Scholar] [CrossRef]
- Bonnici, N.K. The Mineralogical and Textural Characteristics of Copper-Gold Deposits Related to Mineral Processing Attributes. Ph.D. Thesis, University of Tasmania, Hobart, Tasmania, 2012. [Google Scholar]
- Cetin, M.C.; Li, G.; Klein, B.; Futcher, W. Simulating Bulk Ore Sorting Performance of a Panel Cave Mine: A Comparison between Two Approaches. Minerals 2023, 13, 603. [Google Scholar] [CrossRef]
- Ross, I.T. Sampling in Block Cave Mines. In Proceedings of the Sampling Conference, Perth, WA, Australia, 21–22 August 2012. [Google Scholar]


| Mixing Location | Chronological Order | Ore Mixing Event |
|---|---|---|
| Within caves | 1 | Collapsing of ore onto caved ore muck pile as caving progresses |
| 2 | Flow through draw columns | |
| Material handling system | 3 | Blending according to mine planning to provide concentrators with consistent feed and manage panel caves safely |
| 4 | Flow through ROM bins | |
| 5 | Flow through crushed ore bins | |
| 6 | Mixing of crushed ore originated from different panel caves on collection conveyor belts |
| Panel Cave | Active Drawpoints | Between 1 April 2019 and 1 June 2019 | Until 1 April 2019 | ||
|---|---|---|---|---|---|
| Tonnage Share (%) of Caves | Average HOD of Drawpoints Targeted | Tonnage Share (%) of Footprints Caved | Average HOD of Drawpoints Achieved | ||
| PC1 | 127 | 6.55 | 1.33 | 43.88 | 357.15 |
| PC2-West | 129 | 51.78 | 10.15 | 15.81 | 199.12 |
| PC2-East | 167 | 41.66 | 6.16 | 10.7 | 118.11 |
| Total | 423 | 100 | - | - | - |
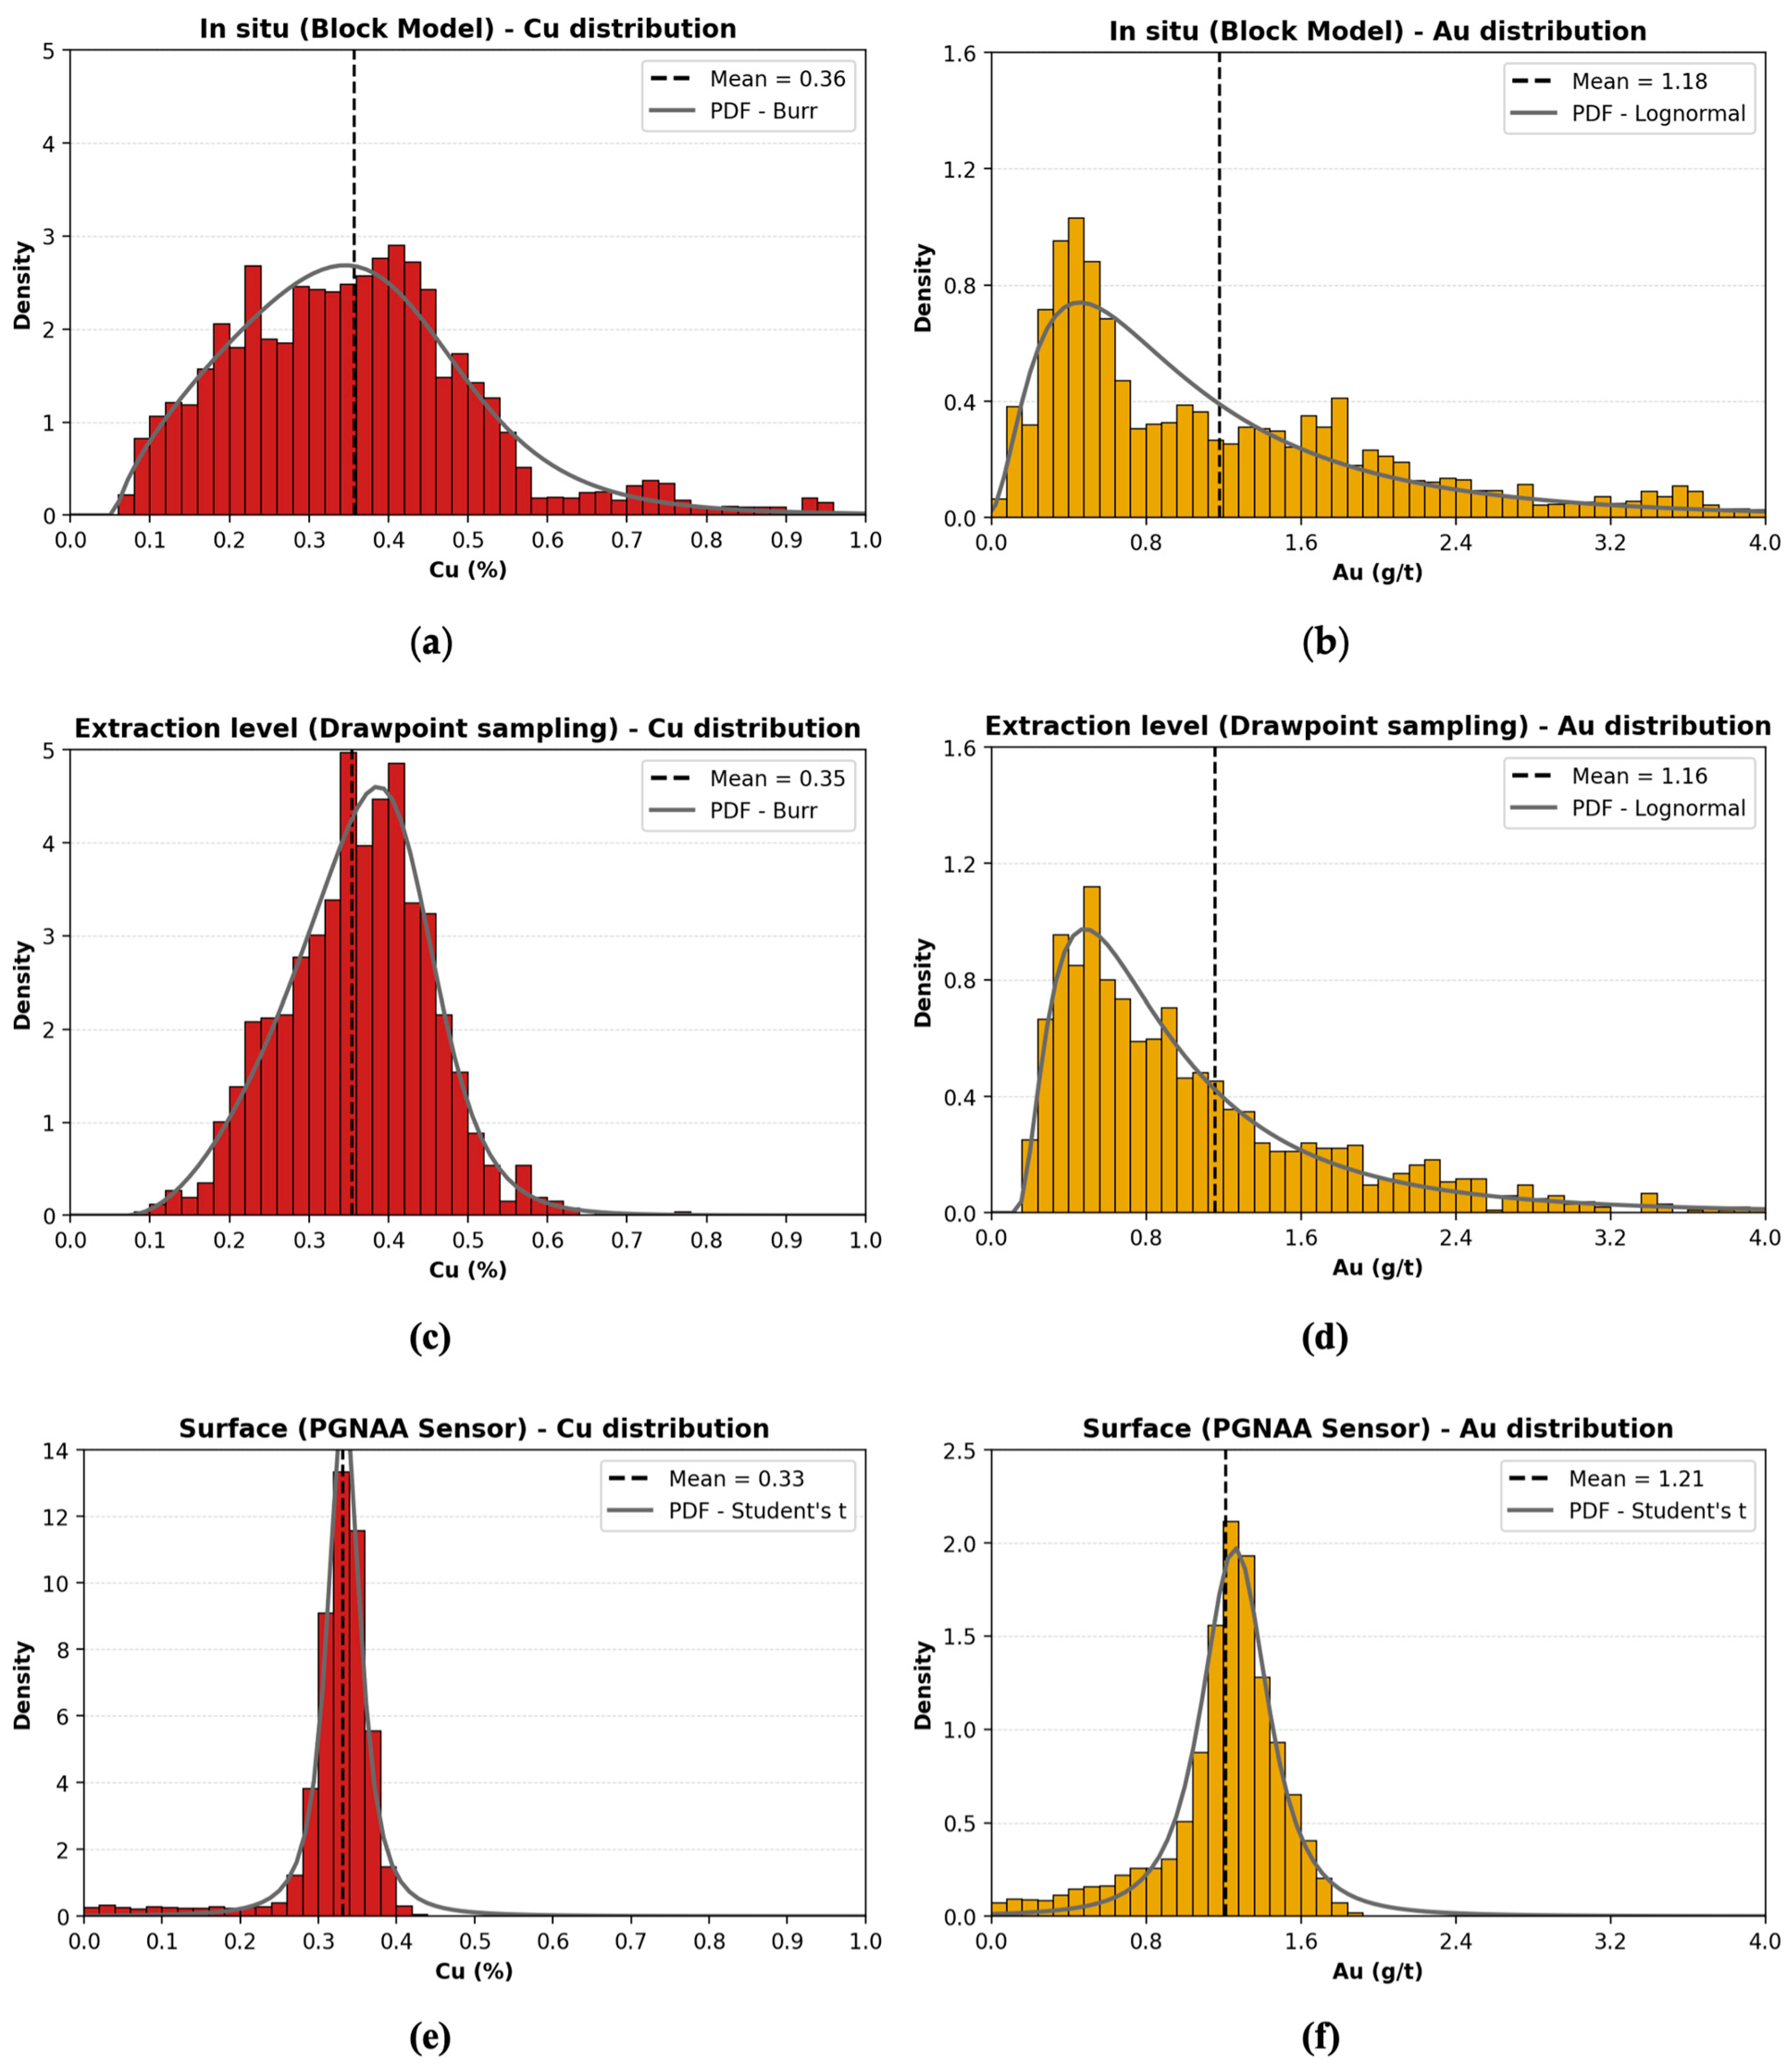
| Location | Panel Cave | Cu (%) | Au (g/t) |
|---|---|---|---|
| In situ (block model) | PC1 | 0.32 | 0.64 |
| PC2-West | 0.35 | 1.30 | |
| PC2-East | 0.39 | 1.12 | |
| All caves | 0.36 | 1.18 | |
| Extraction level (drawpoint sampling) | PC1 | 0.36 | 0.57 |
| PC2-West | 0.33 | 1.24 | |
| PC2-East | 0.38 | 1.20 | |
| All caves | 0.35 | 1.16 | |
| Surface (PGNAA sensor) | All caves | 0.33 | 1.21 |
| Variables | Location | ||
|---|---|---|---|
| In Situ | Extraction Level | Surface | |
| or | Number of ore blocks | Number of drawpoint samples | Number of ore pods scanned by PGNAA |
| or | Grade of a block | Grade of a drawpoint sample taken during a sampling period | Grade of an ore pod |
| or | Mass of a block | Total mass produced from a drawpoint during a sampling period | Mass of an ore pod |
| or | Average grade of blocks | Average grade of drawpoint samples | Average grade of ore pods |
| or | Total mass of blocks | Total mass produced from drawpoints | Total mass of ore pods |
| Distribution | Explanation |
|---|---|
| Burr | The Burr distribution was introduced by Burr [18] and can fit almost any unimodal data since it can yield a wide range of skewness and kurtosis values [19]. |
| Chi-squared | Many variables in earth science are non-negative and positively (right) skewed [20]. The gamma distribution is a two-parameter distribution widely used for modelling positively skewed data. Chi-squared, Erlang, and exponential distributions are special cases of the gamma distribution. |
| Erlang | |
| Exponential | |
| Gamma | |
| Lognormal | The lognormal distribution has been determined to represent the frequencies of metal contents well when the ore deposit is modelled with consistent geologic settings, and the model data comes from well-explored deposits with spatial rules consistently applied [21]. |
| Normal | The sample value frequency distributions of most mineral deposits commonly conform to the normal (Gaussian) or lognormal distributions [22]. |
| Student’s t | The student’s t distribution is similar to the standardized normal distribution with heavier tails, meaning that it possesses a higher probability in the extreme values, or tails, compared to the normal distribution. |
| Location | Change (%) in DH and Weighted Variance Spatially | |||
|---|---|---|---|---|
| Cu | Au | |||
| DH | Weighted Variance | DH | Weighted Variance | |
| In situ to extraction level | −7 | −61 | 74 | −24 |
| Extraction level to surface | −95 | −87 | −96 | −89 |
| In situ to surface | −95 | −95 | −92 | −92 |
| Location | Best-Fit Distribution Types and Parameters | |
|---|---|---|
| Cu | Au | |
| In situ (block model) | Burr(shape(c) = 5.85, shape(d) = 0.29, location = 0.06, scale = 0.43) | Lognormal (shape = 0.77, location = −0.06, scale = 0.94) |
| Extraction level (drawpoint sampling) | Burr (shape(c) = 10.71, shape(d) = 0.27, location = 0.07, scale = 0.37) | Lognormal (shape = 0.79, location = 0.10, scale = 0.71) |
| Surface (PGNAA sensor) | Student’s t (degrees of freedom = 1.83, location = 0.33, scale = 0.02) | Student’s t (degrees of freedom = 2.29, location = 1.26, scale = 0.18) |
Disclaimer/Publisher’s Note: The statements, opinions and data contained in all publications are solely those of the individual author(s) and contributor(s) and not of MDPI and/or the editor(s). MDPI and/or the editor(s) disclaim responsibility for any injury to people or property resulting from any ideas, methods, instructions or products referred to in the content. |
© 2023 by the authors. Licensee MDPI, Basel, Switzerland. This article is an open access article distributed under the terms and conditions of the Creative Commons Attribution (CC BY) license (https://creativecommons.org/licenses/by/4.0/).
Share and Cite
Cetin, M.C.; Klein, B.; Li, G.; Futcher, W. Tracking Grade Heterogeneity in a Panel Cave Mine: A Reconciliation Study Investigating the Impact of Mixing from an Ore Sorting Perspective. Minerals 2023, 13, 1333. https://doi.org/10.3390/min13101333
Cetin MC, Klein B, Li G, Futcher W. Tracking Grade Heterogeneity in a Panel Cave Mine: A Reconciliation Study Investigating the Impact of Mixing from an Ore Sorting Perspective. Minerals. 2023; 13(10):1333. https://doi.org/10.3390/min13101333
Chicago/Turabian StyleCetin, Mahir Can, Bern Klein, Genzhuang Li, and William Futcher. 2023. "Tracking Grade Heterogeneity in a Panel Cave Mine: A Reconciliation Study Investigating the Impact of Mixing from an Ore Sorting Perspective" Minerals 13, no. 10: 1333. https://doi.org/10.3390/min13101333