
Petrology and Geochemistry of Mesoarchean Sukinda Ultramafics, Southern Singhbhum Odisha Craton, India: Implications for Mantle Resources and the Geodynamic Setting
Abstract
:1. Introduction
2. Geological Setting
2.1. Regional Geology
2.2. Local Geology
3. Samples and Analytical Methods
4. Results
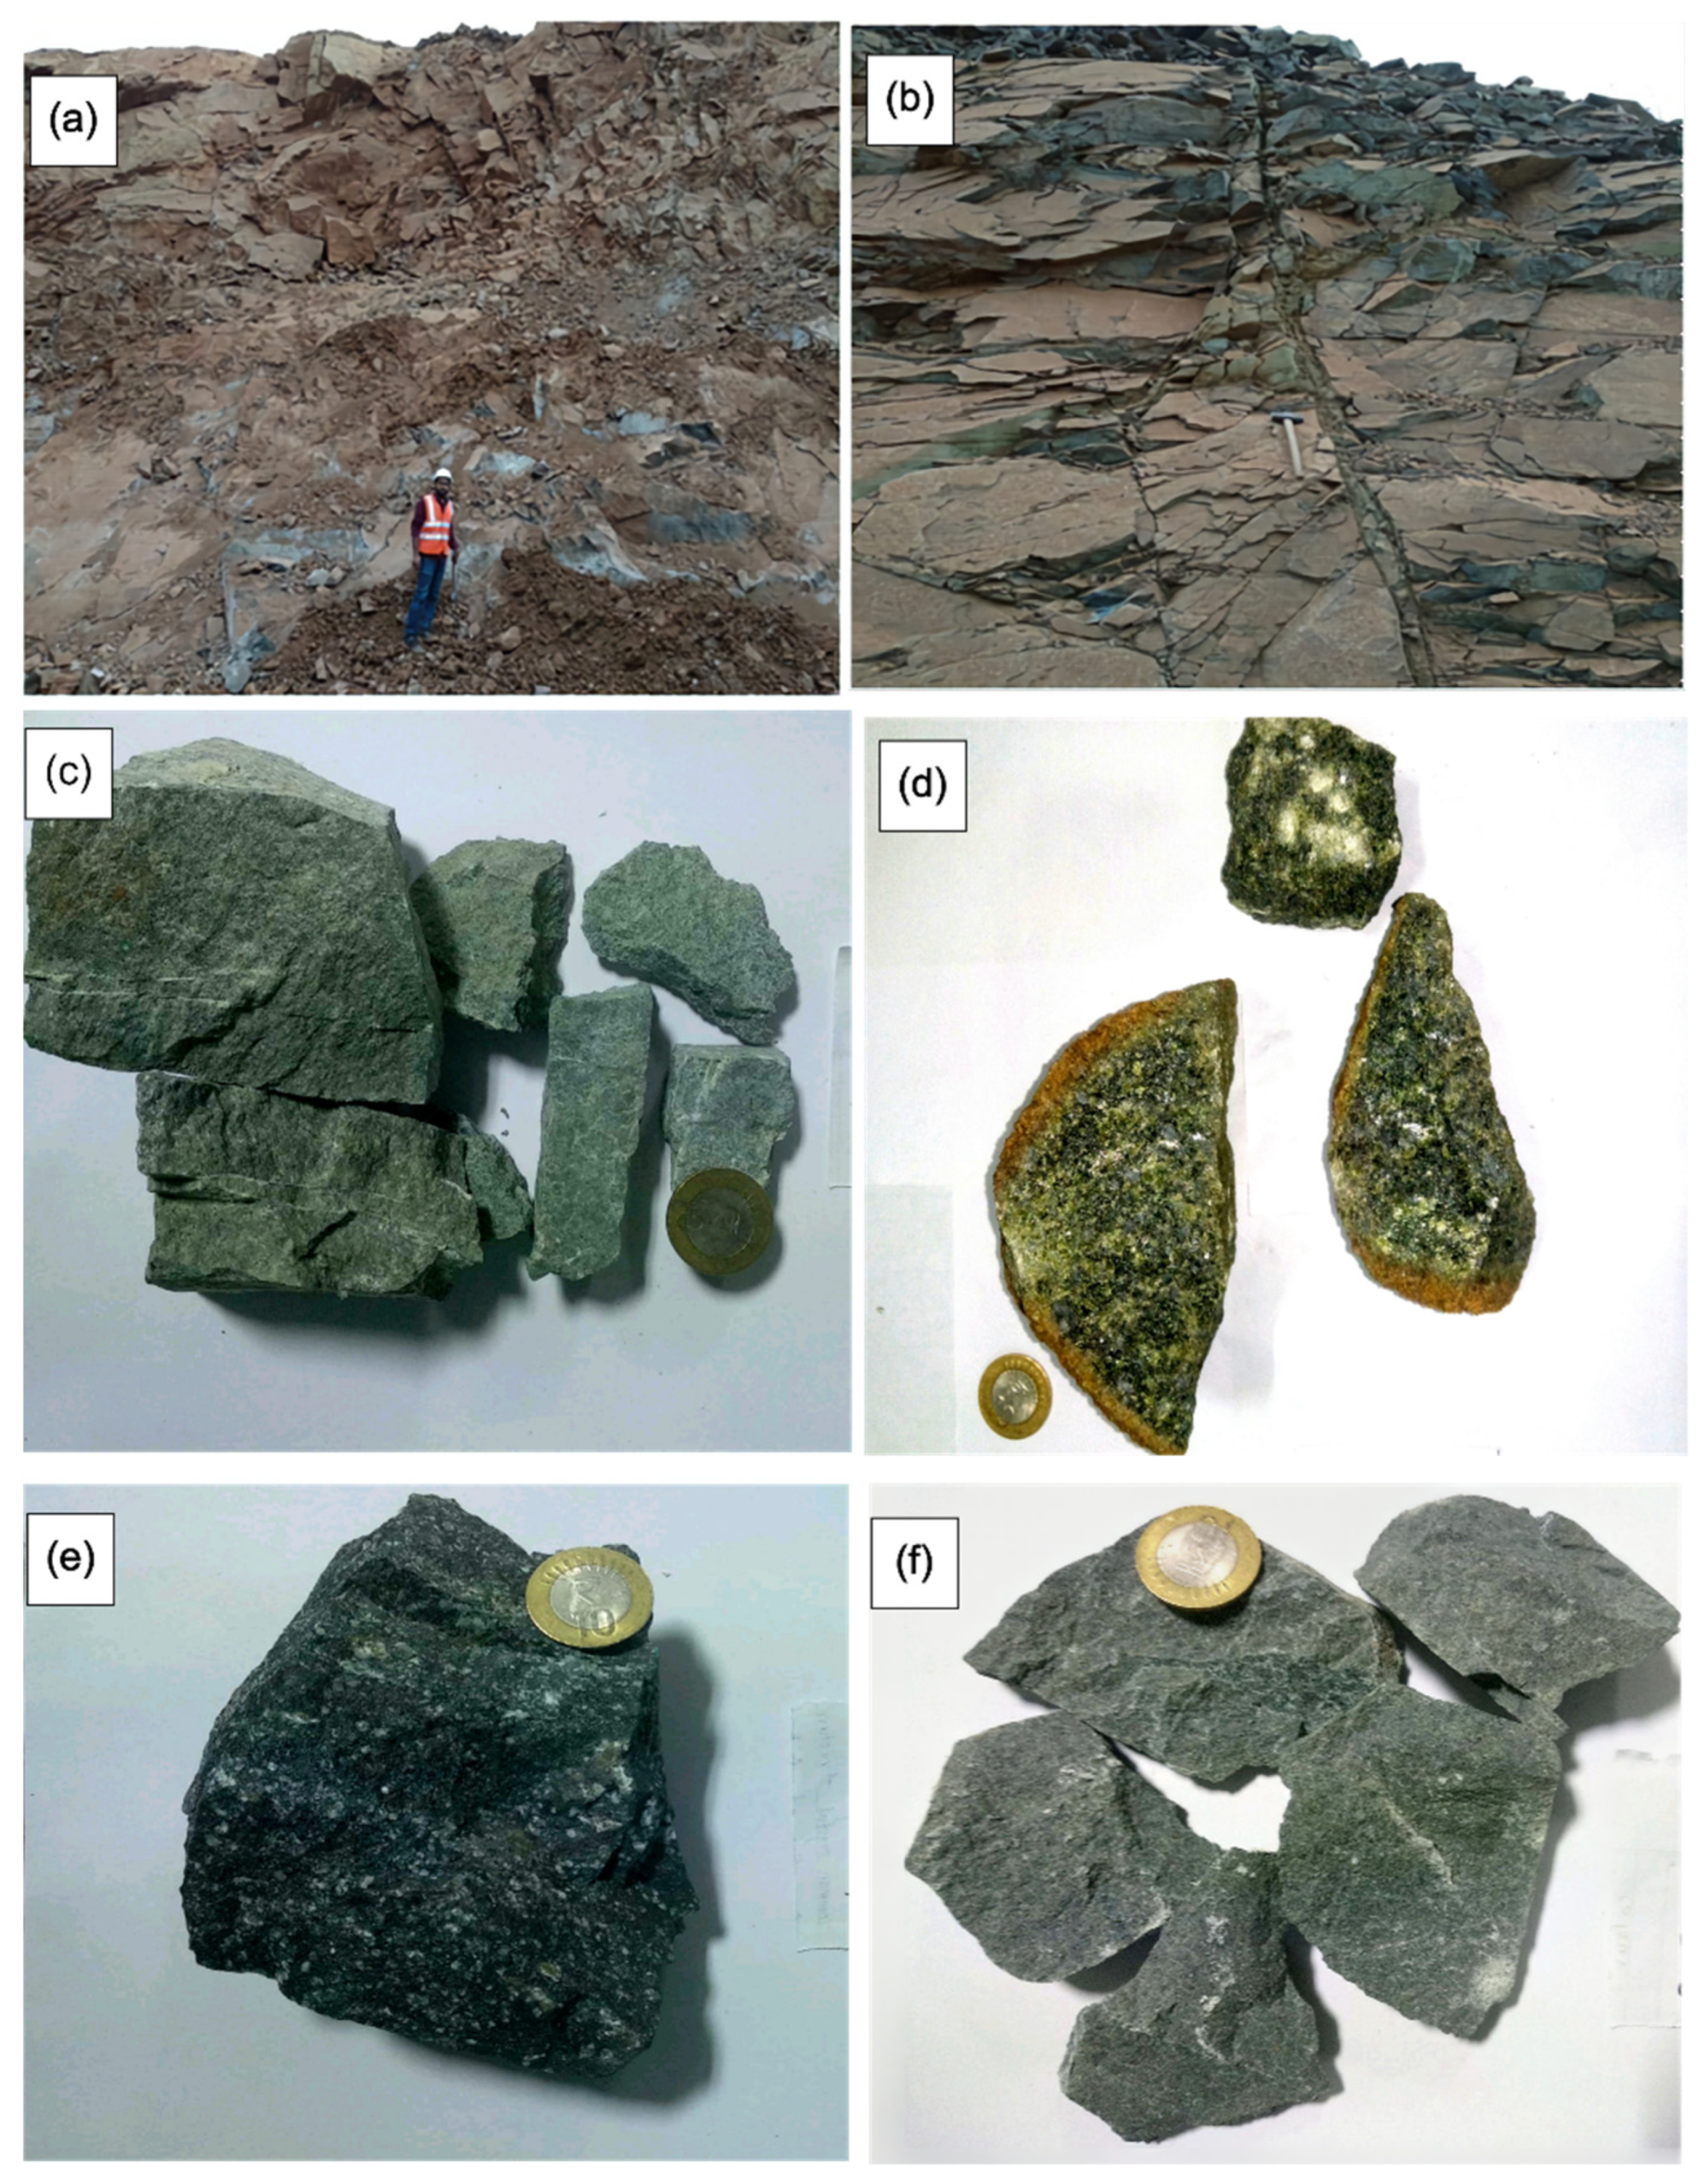
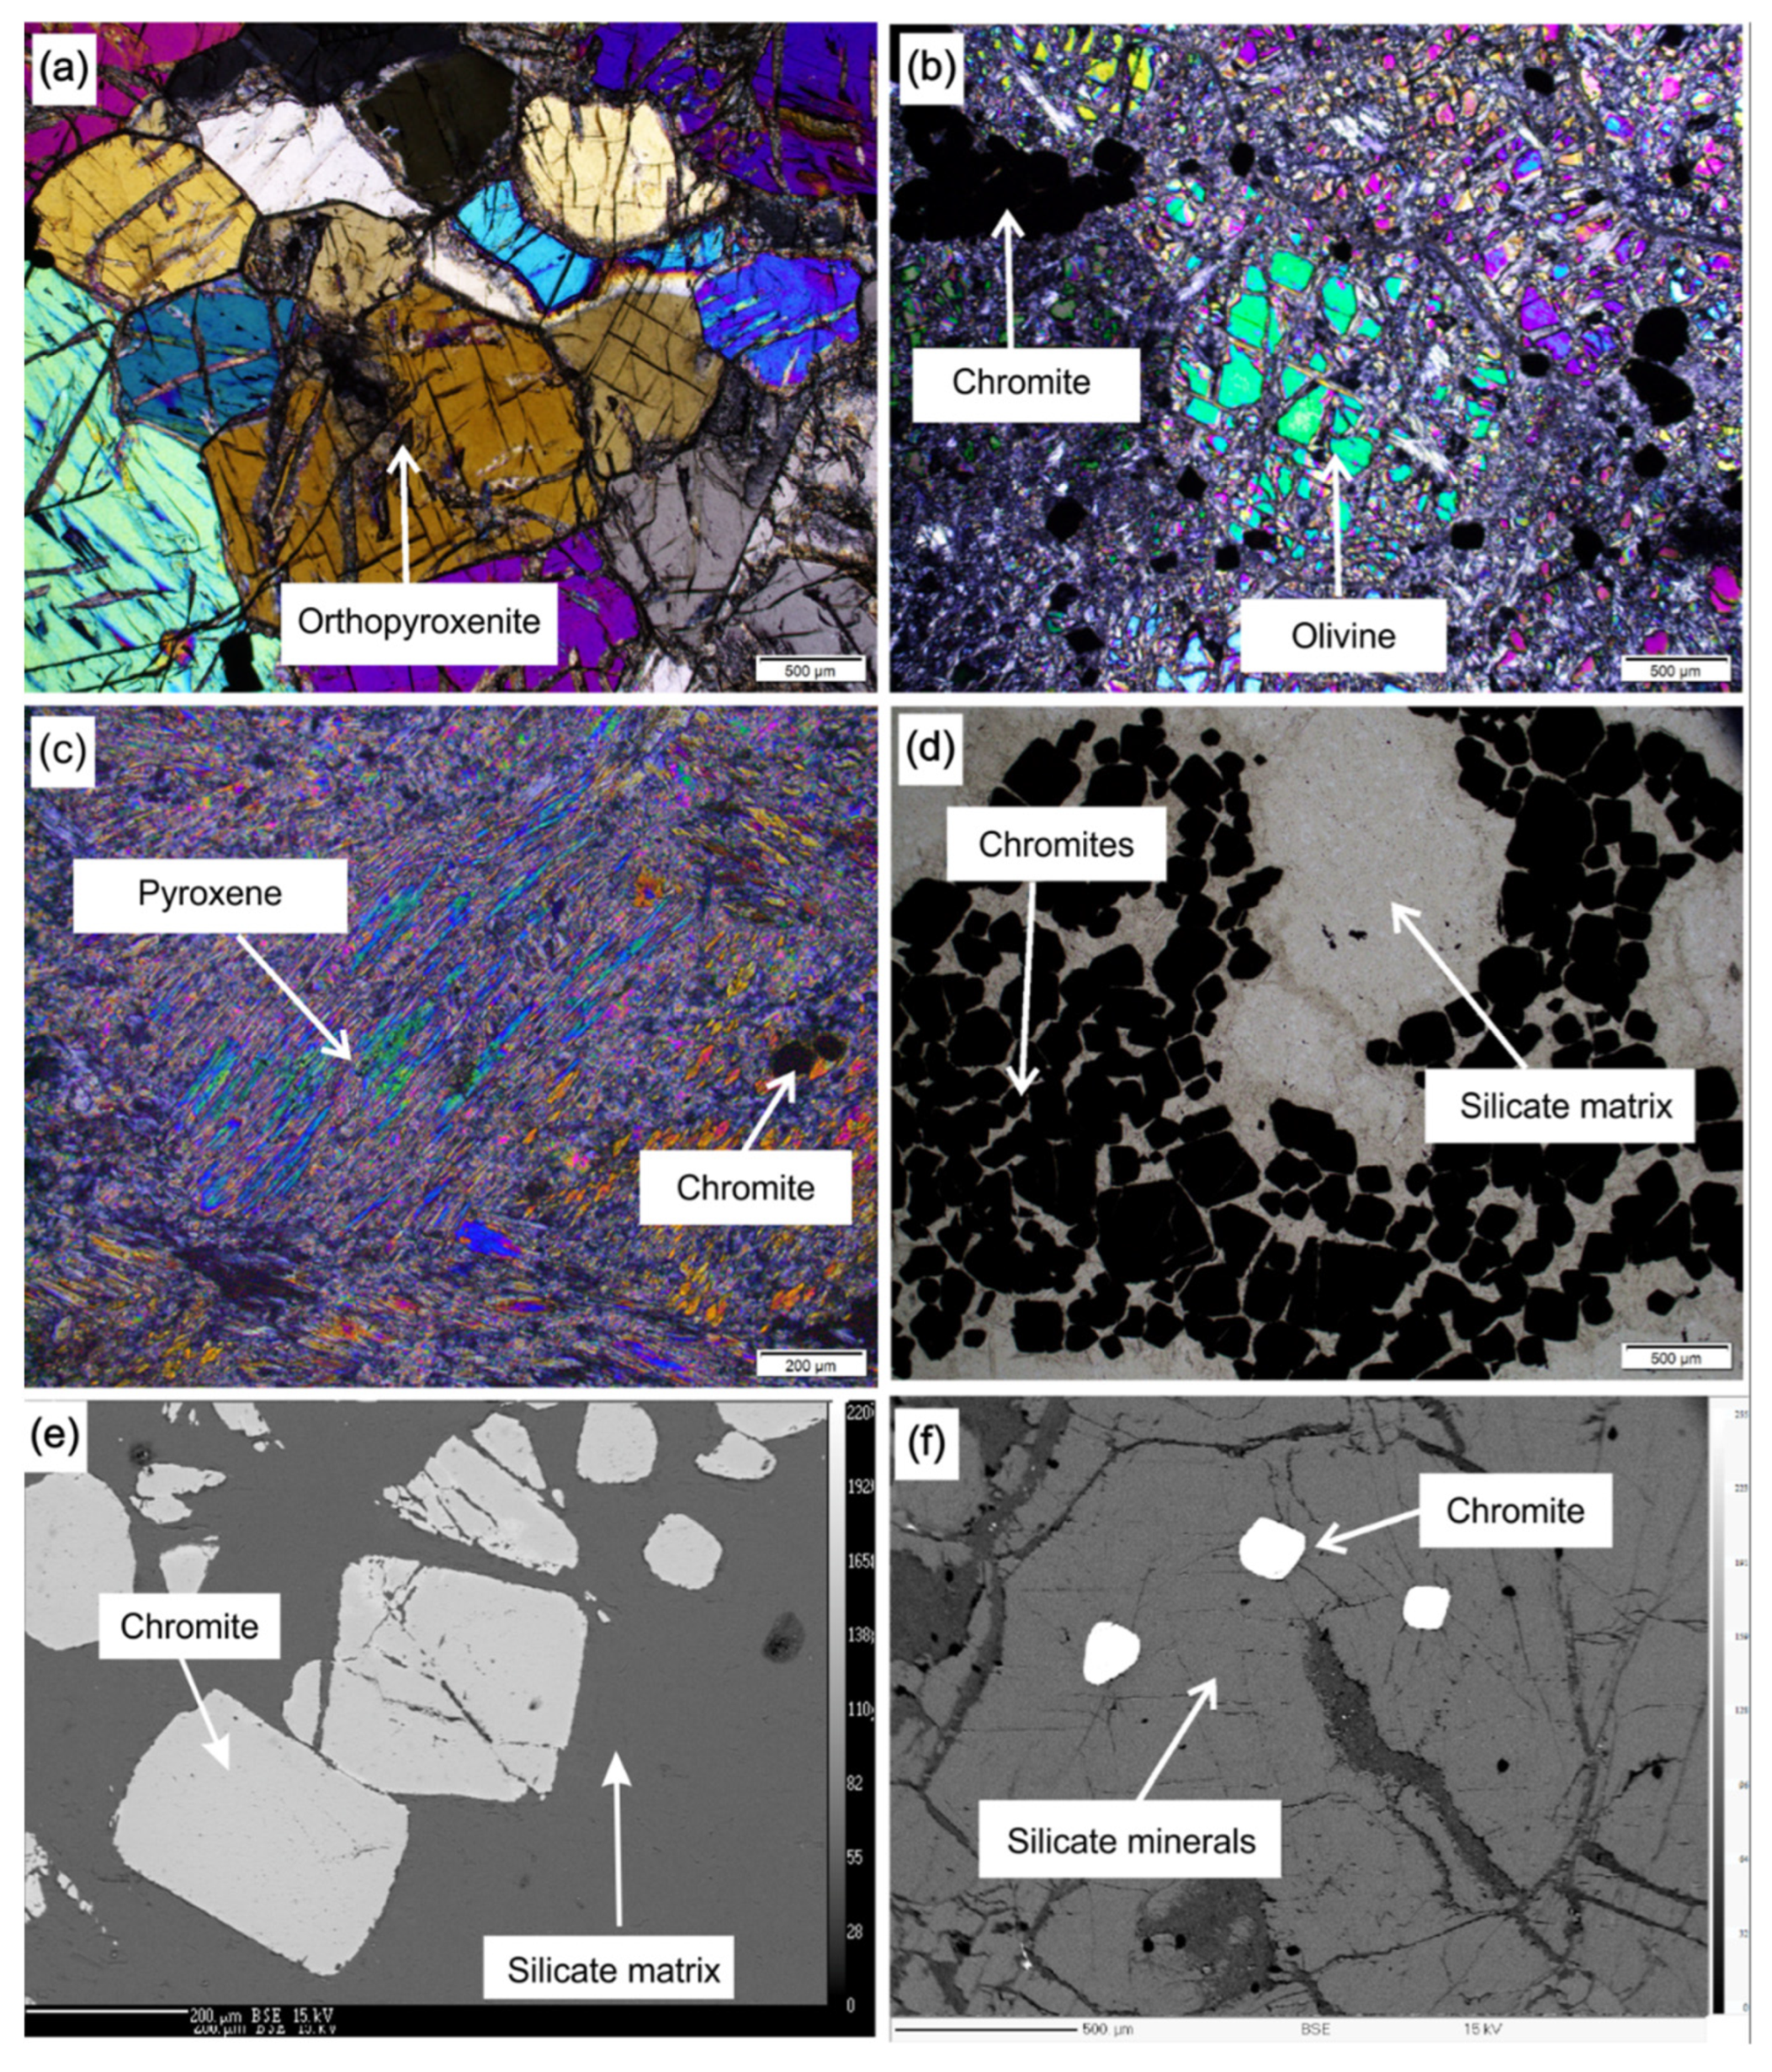
4.1. Petrography
4.1.1. Dunite
4.1.2. Orthopyroxenite
4.1.3. Serpentinite
4.2. Whole-Rock Geochemistry
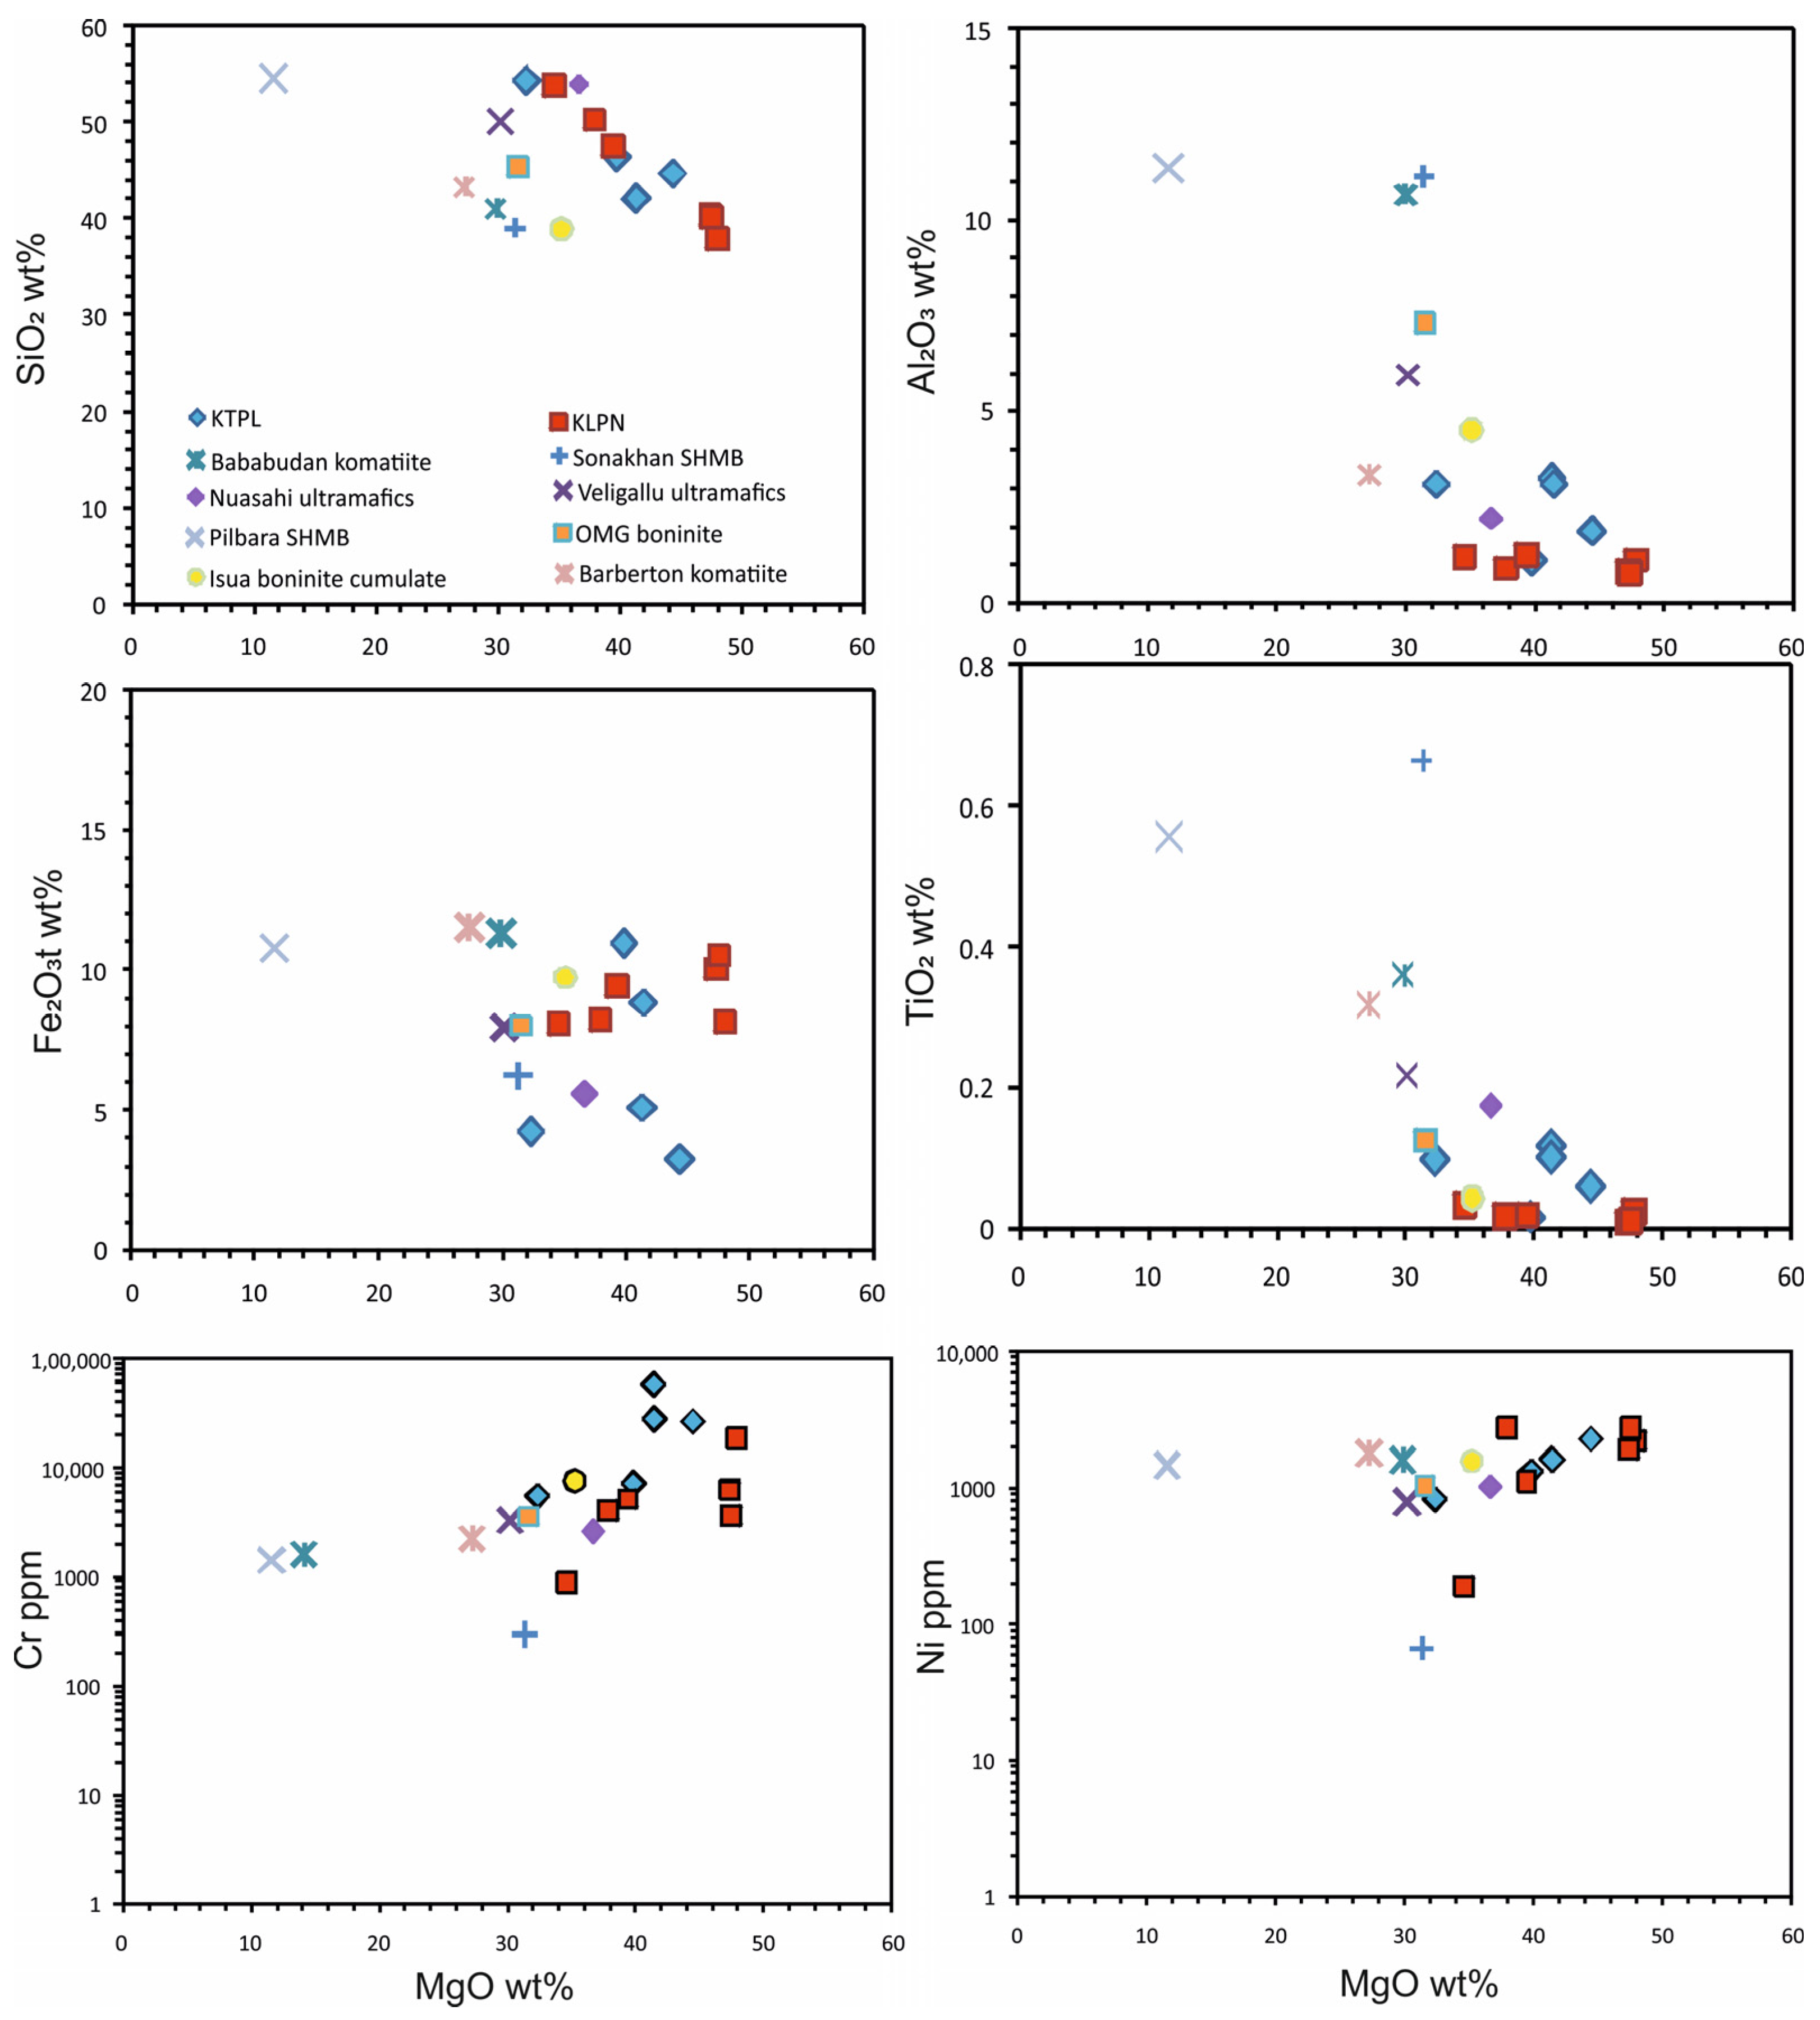
4.2.1. Major-Element Geochemistry
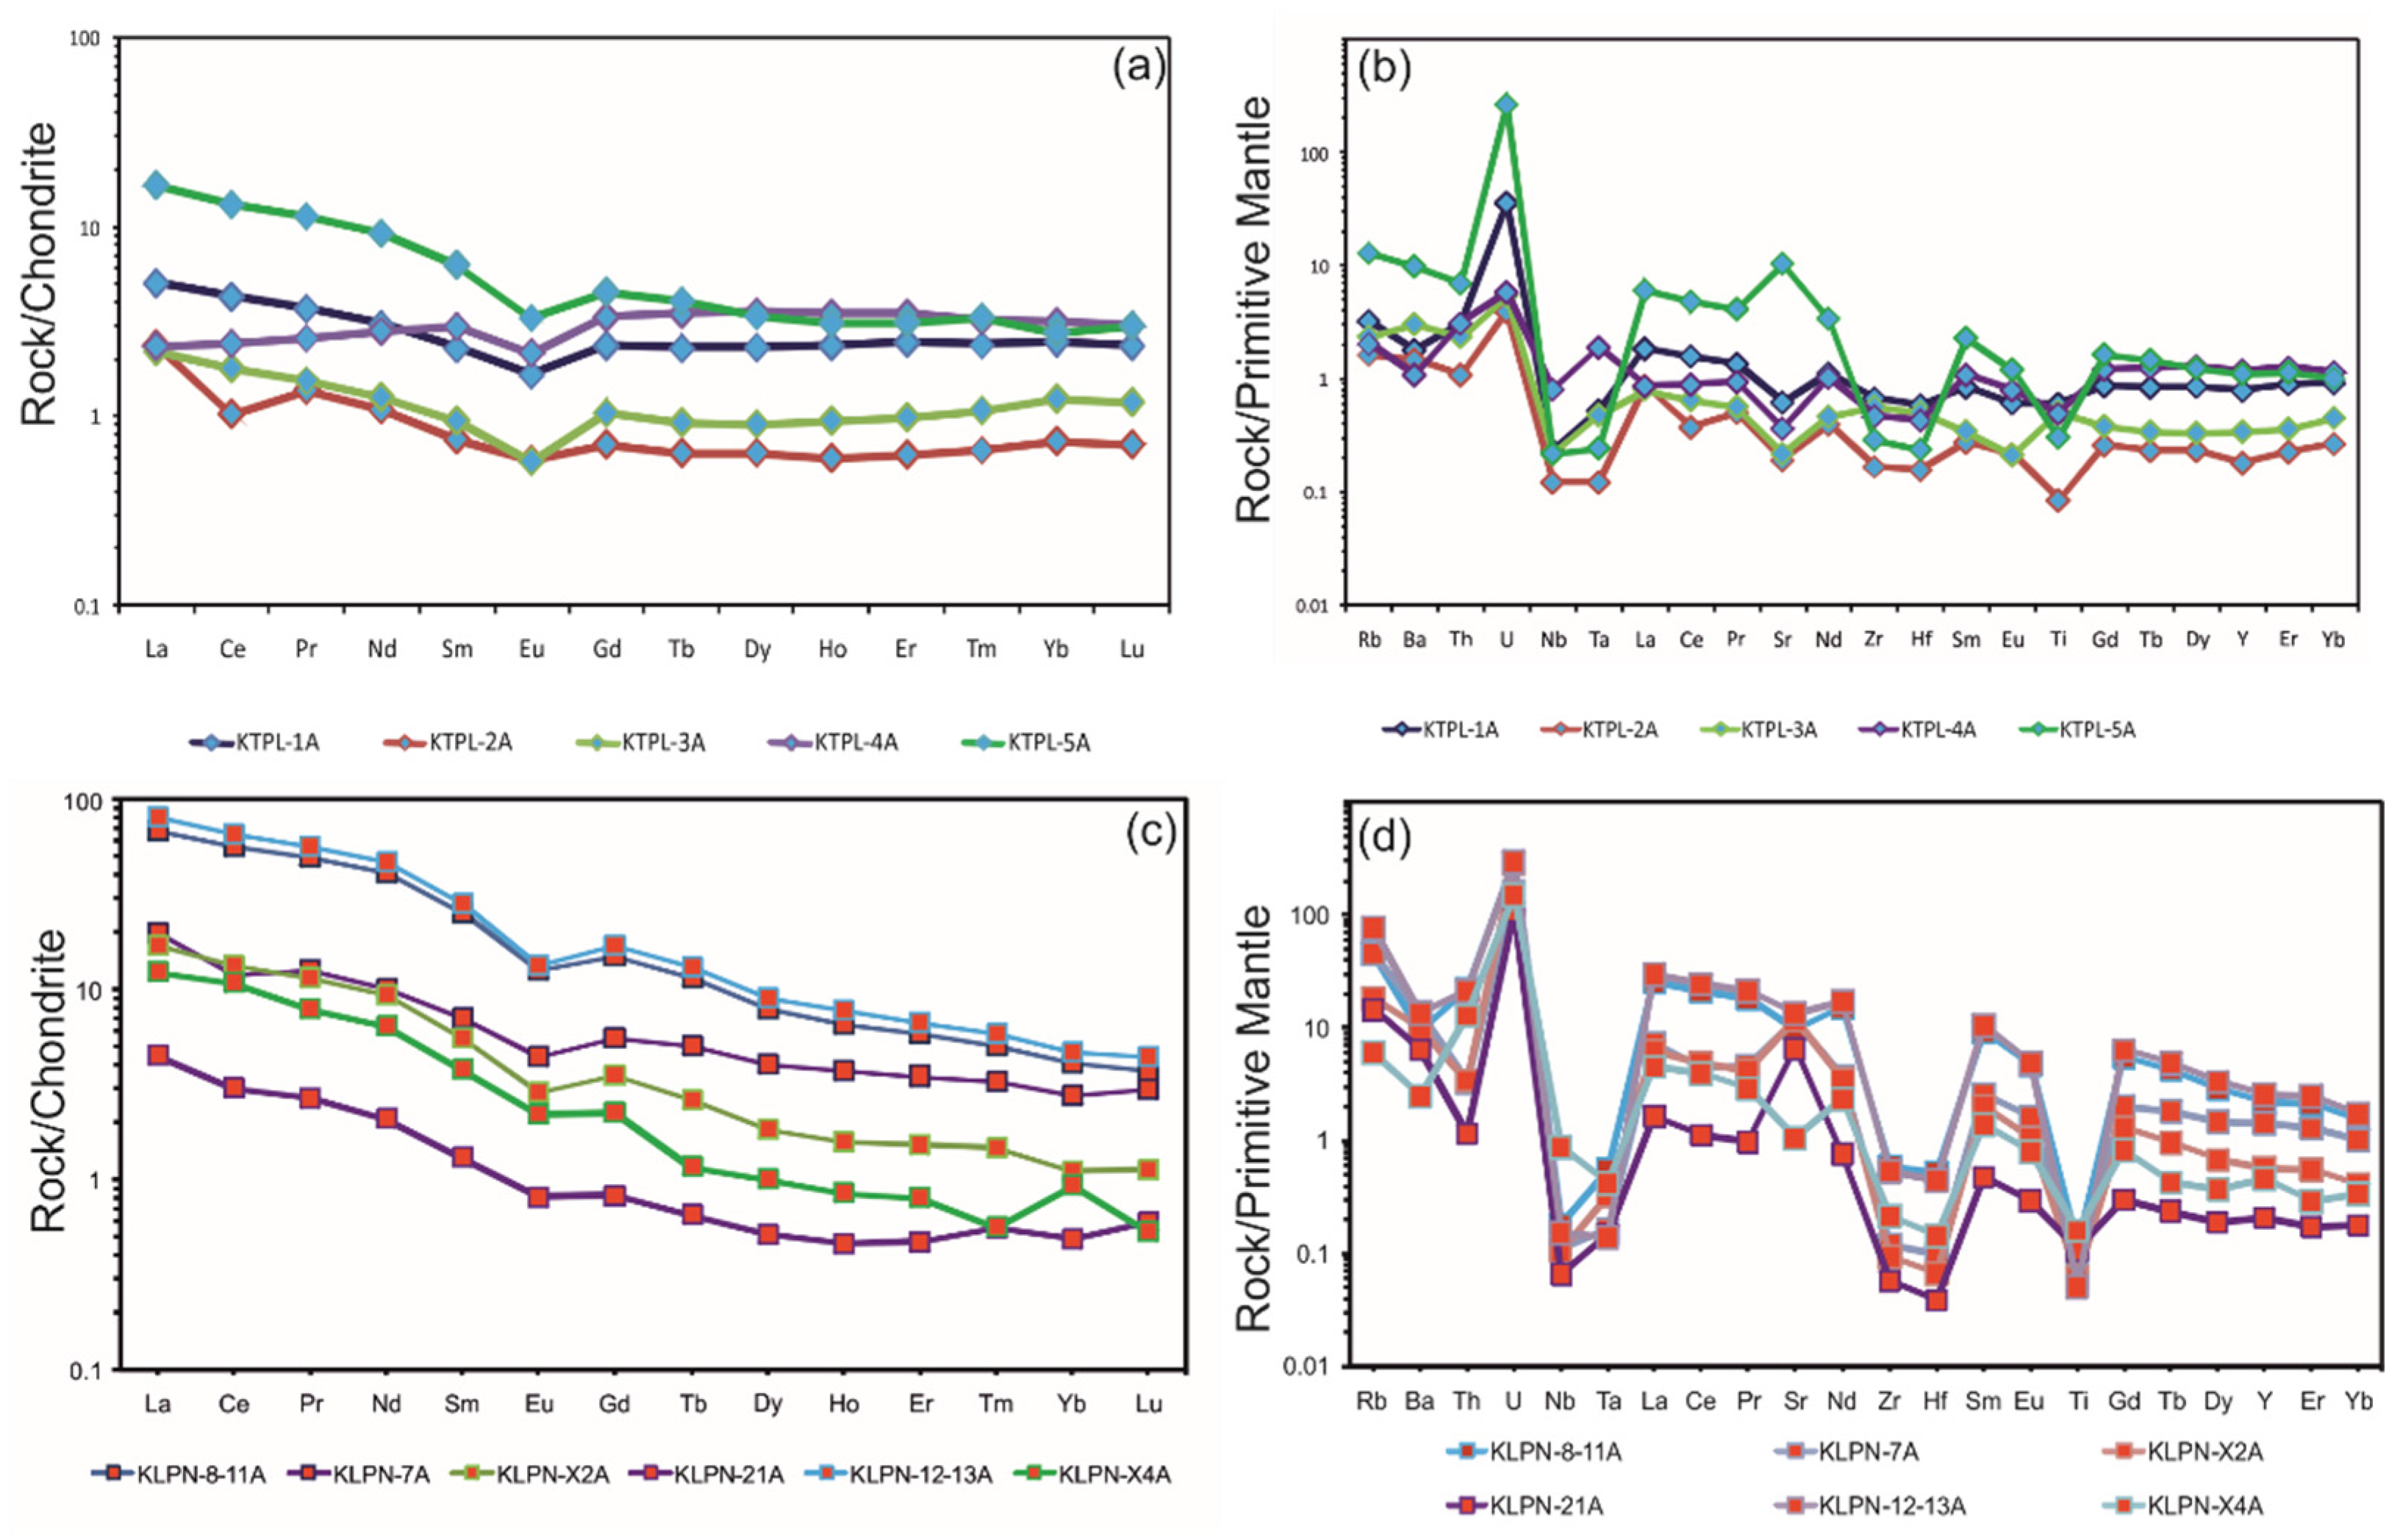
4.2.2. Trace-Element Geochemistry
4.3. Mineral Chemistry
4.3.1. Chromite
4.3.2. Orthopyroxene
4.3.3. Olivine
5. Discussion
5.1. Role of Crustal Contamination
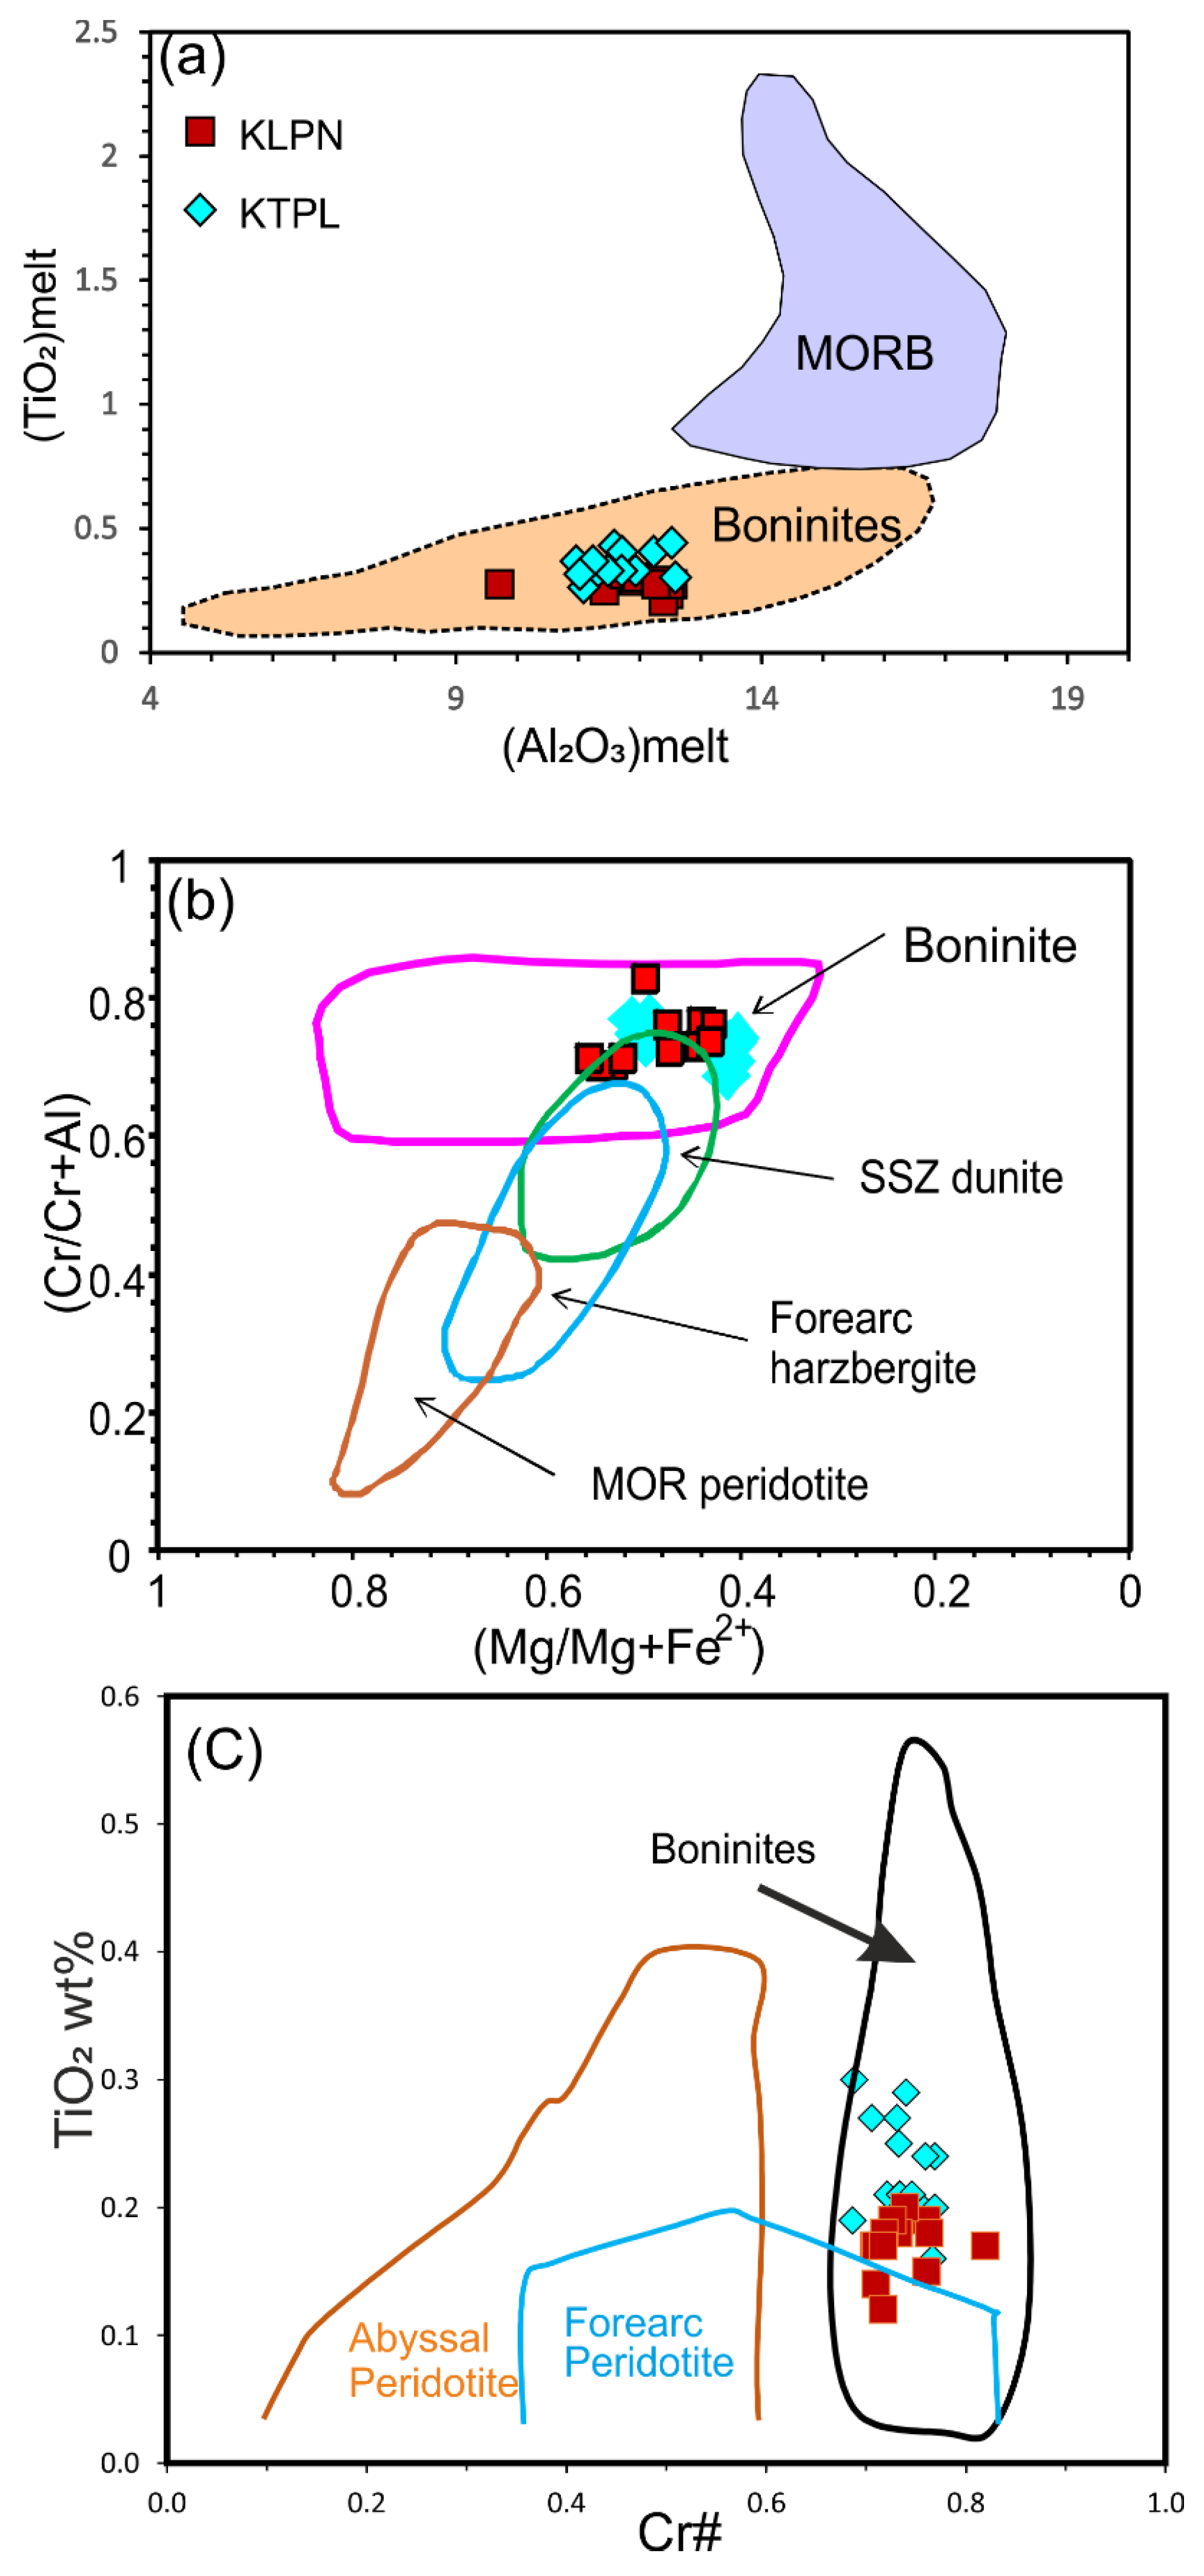
5.2. Classification and Parent Melt Composition
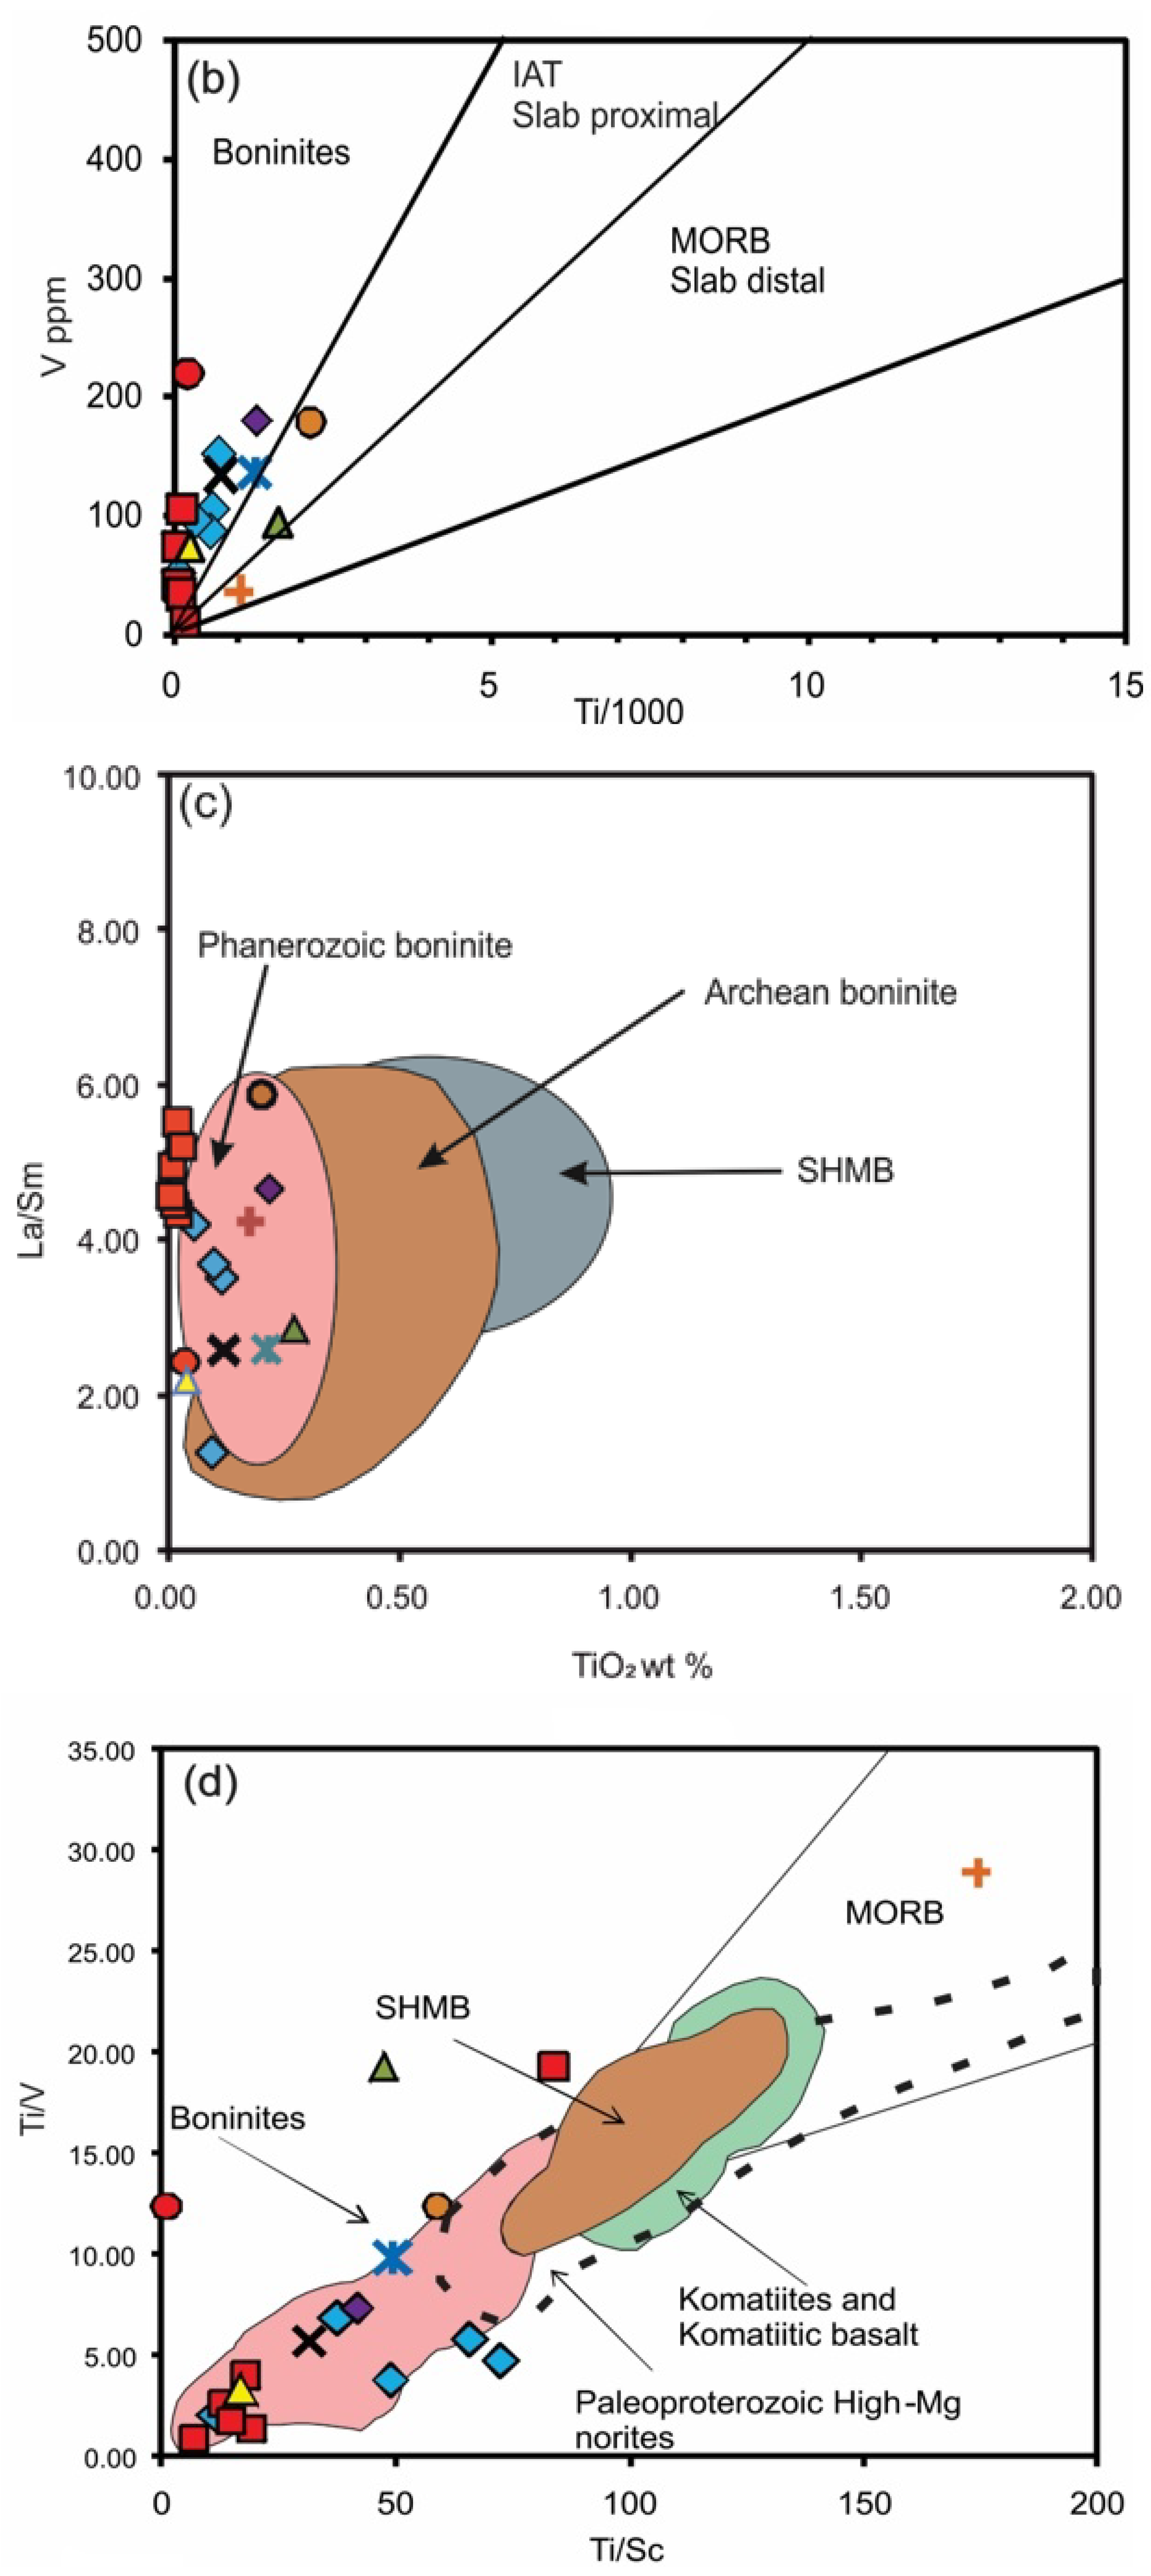
5.3. Comparison and Distinction of Sukinda Boninites from Komatiites, Siliceous High-Mg Basalts, Picrites, and Other Ultramafic Formations
5.4. Petrogenesis of Sukinda Ultramafic Rocks
- Partial melting of serpentinised harzburgite at the time of subduction initiation along a transform fault [131].
- Partial mantle wedge melting due to the subduction of an active spreading center trending sub-parallel to an intra-oceanic arc-trench system [94].
- Contact melting of the hydrous mantle wedge due to the introduction of a hot mantle diaper during arc rifting [137].
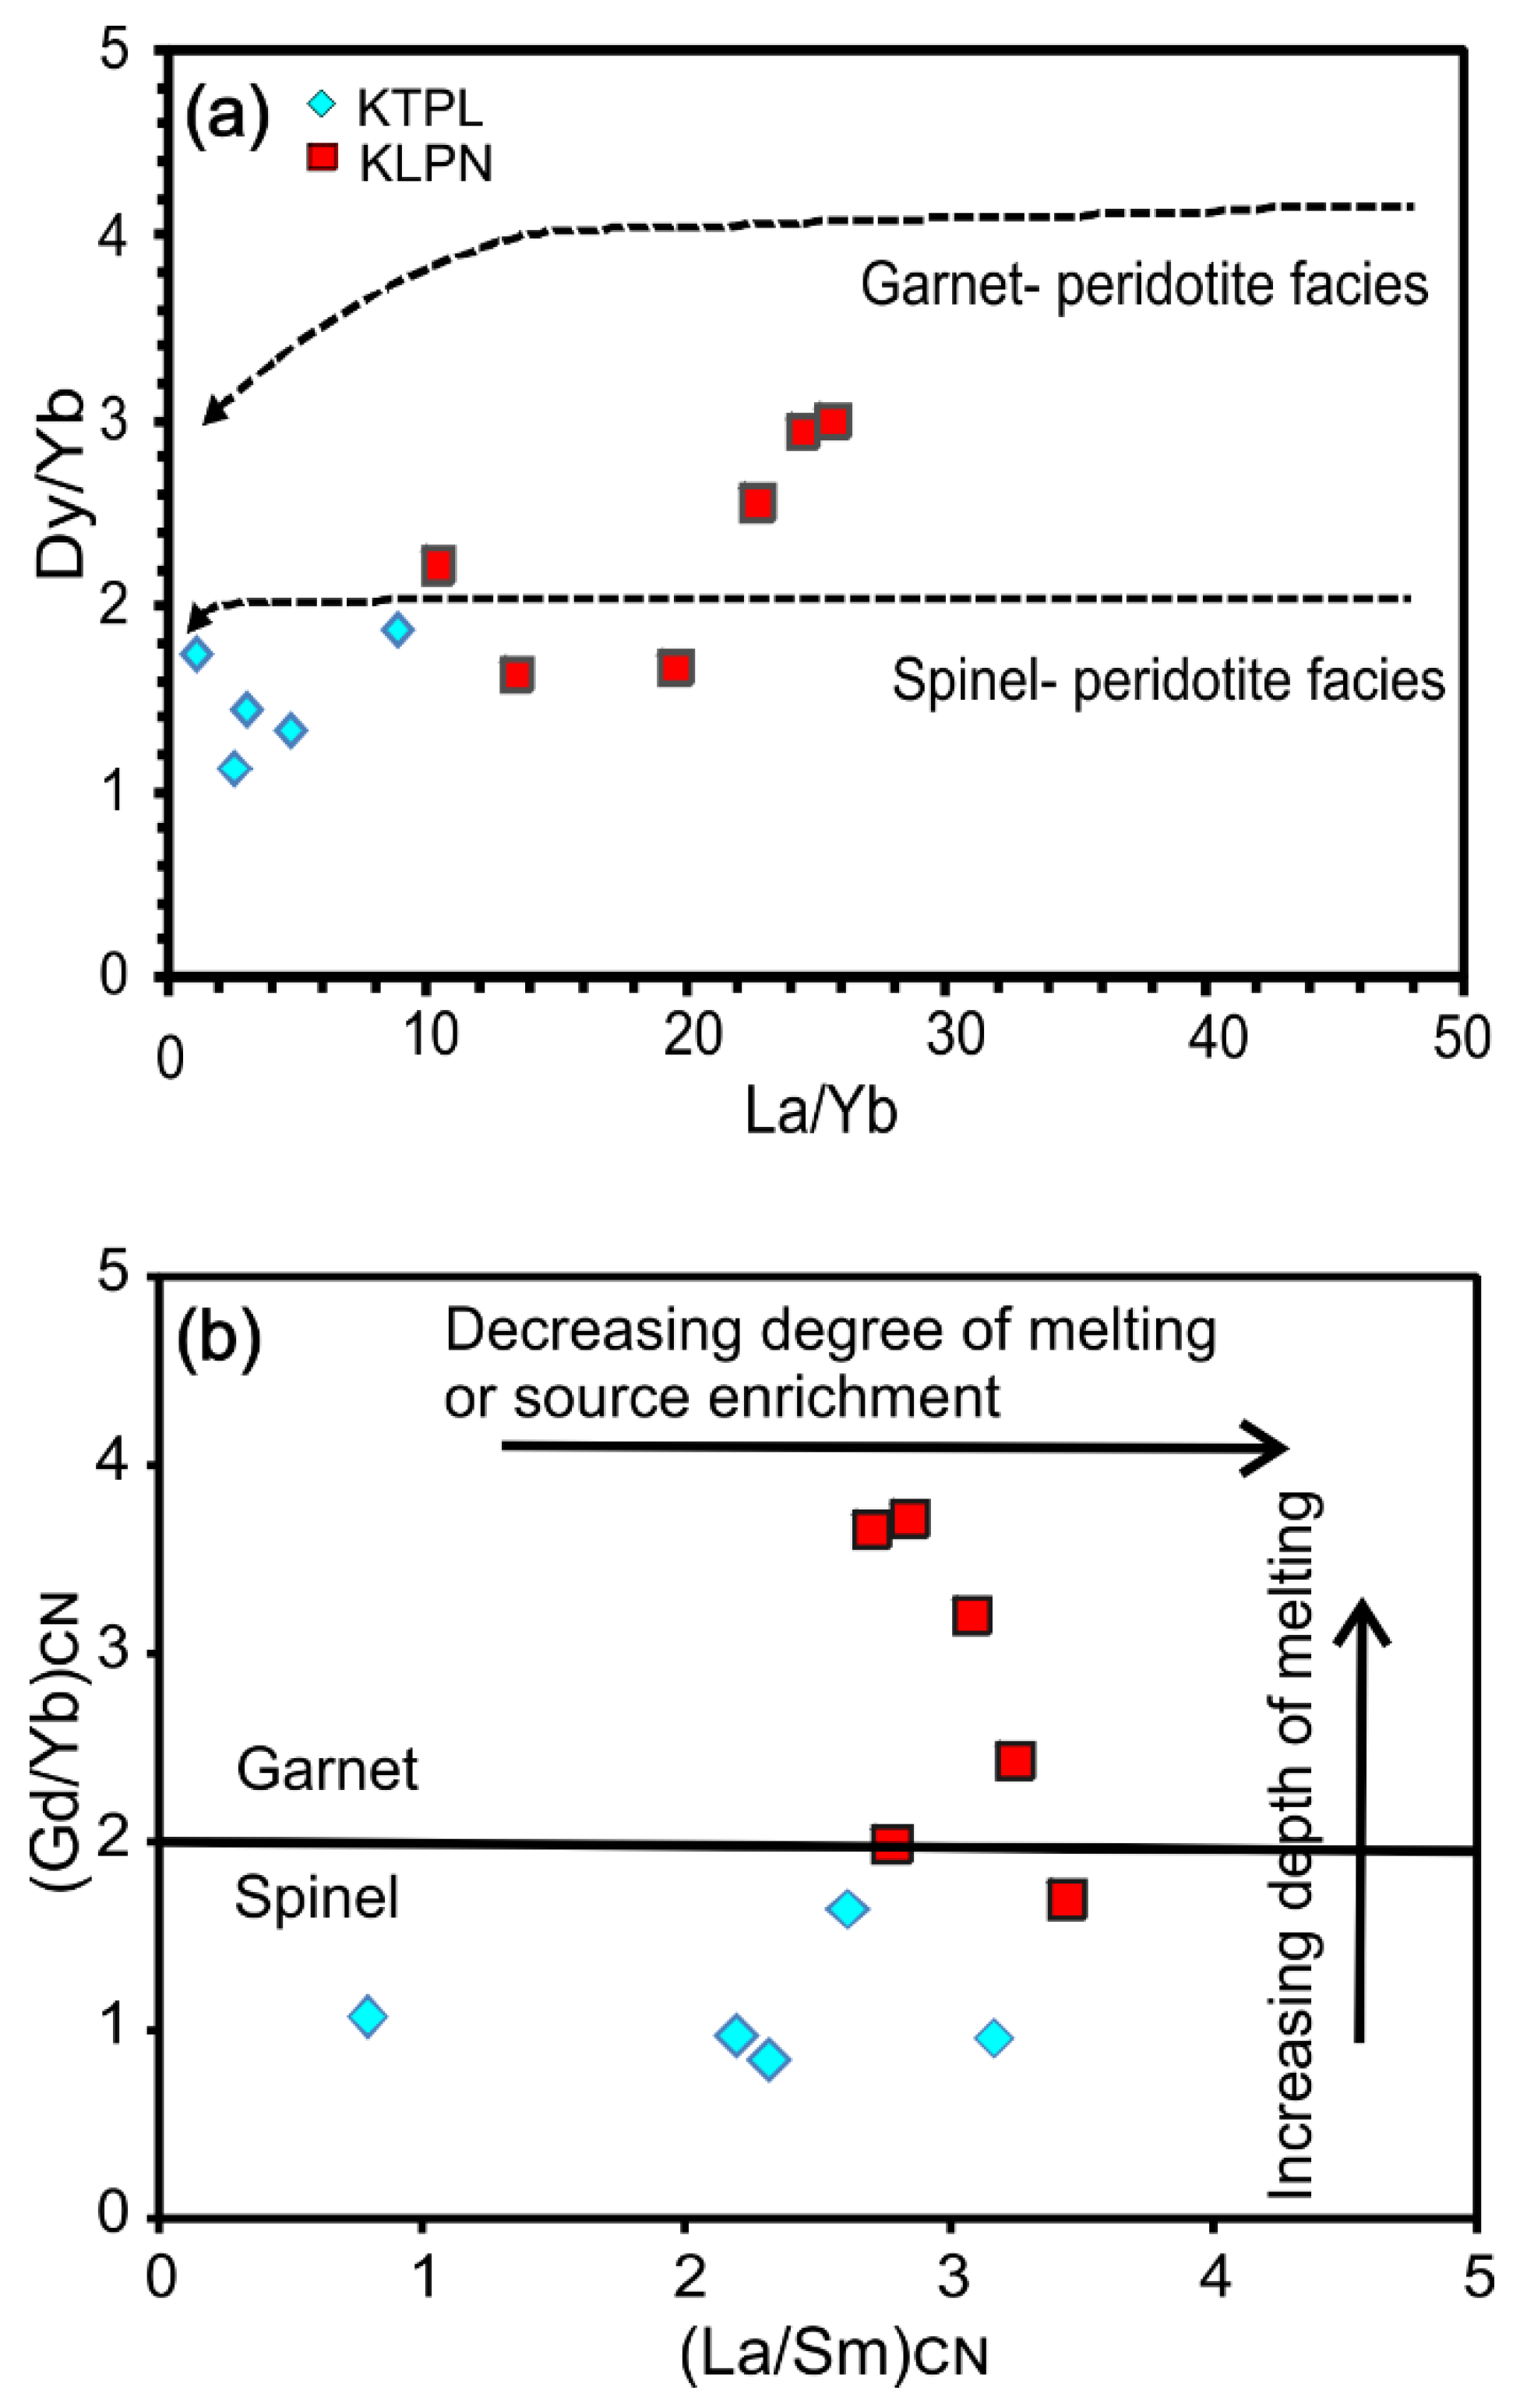
5.4.1. Partial Melting of the Depleted Mantle Source
5.4.2. Addition of Subducted Slab Components to the Mantle Wedge
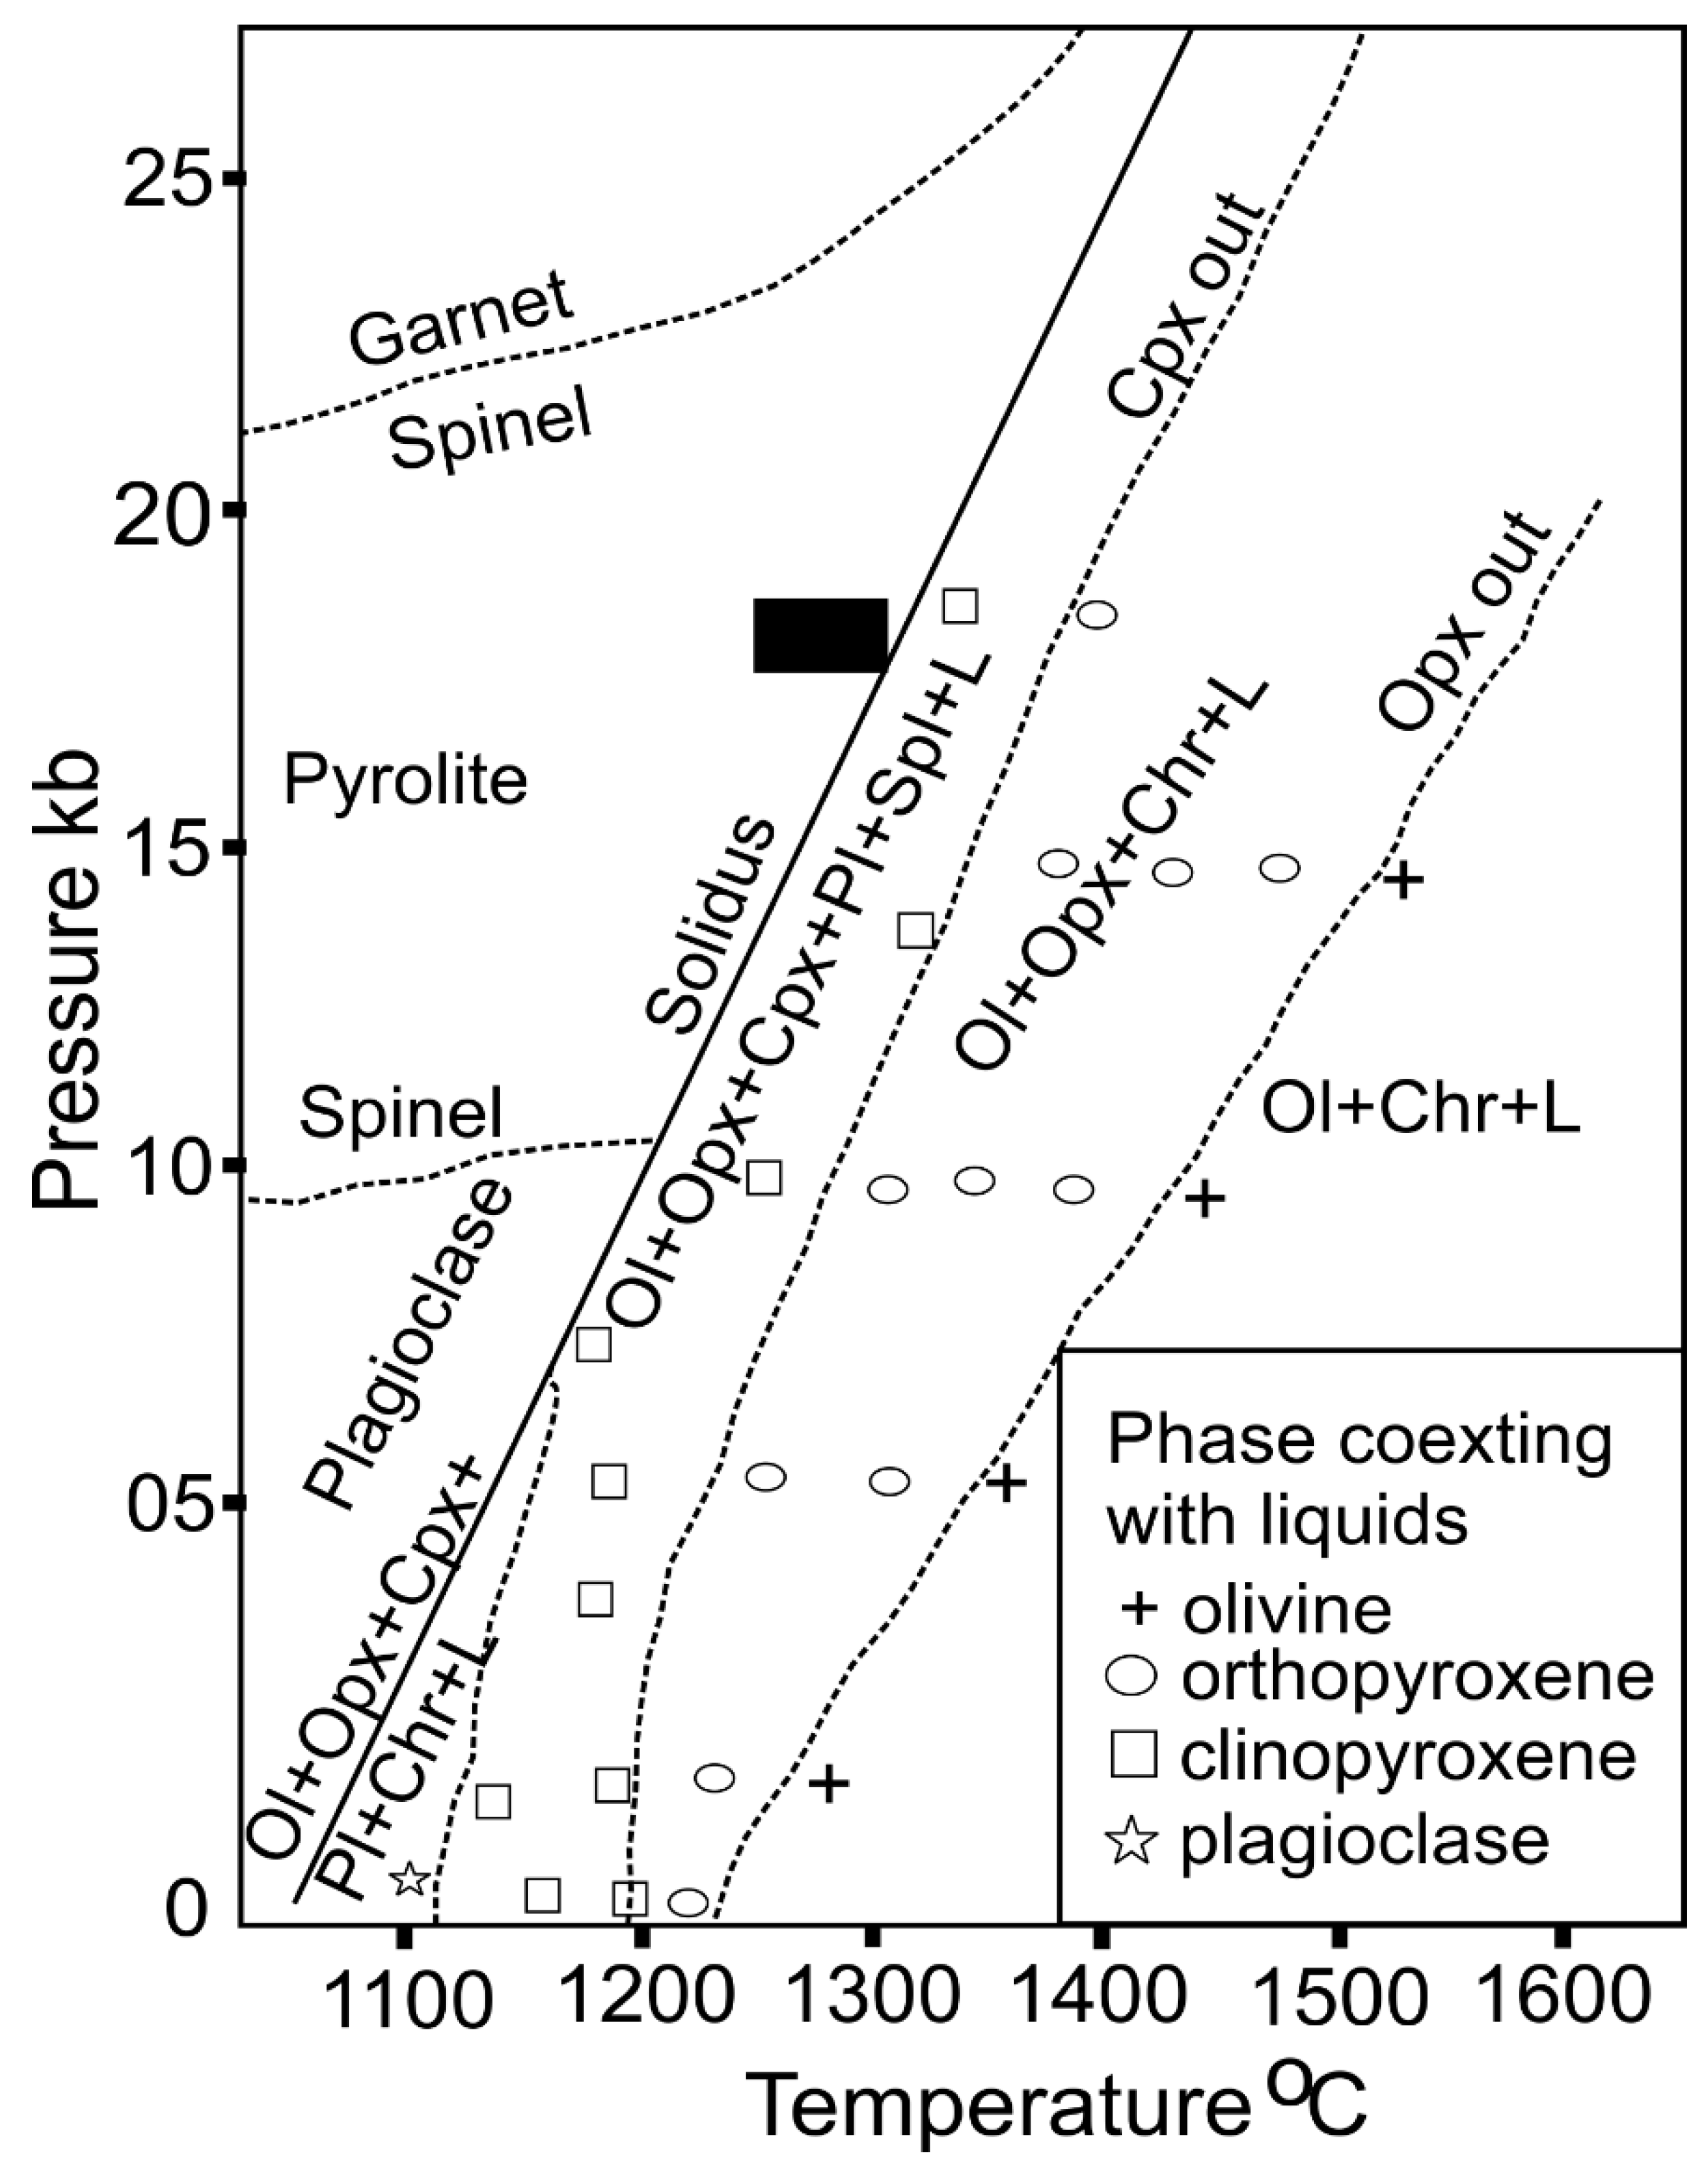
6. Pressure Condition and Thermal History
7. Tectonic Framework of the Sukinda Complex
8. Conclusions
Supplementary Materials
Author Contributions
Funding
Data Availability Statement
Acknowledgments
Conflicts of Interest
References
- Zhang, Z.H.; Mao, J.W.; Du, A.D.; Pirajno, F.; Yang, J.M.; Wang, Z.L.; Chai, F.M.; Zhang, Z.C. Re–Os dating of the two largest Cu–Ni sulfide deposits in northern Xinjiang, and its geological significance. Asian J. Earth Sci. 2008, 32, 204–217. [Google Scholar] [CrossRef]
- DeWit, M.J.; Tredoux, M. P.G.E. in the 3.5 Ga Jamestown Ophiolite Complex, Barberton greenstone belt, with implications for P.G.E. distribution in simatic lithosphere. In Proceedings of the Symposium GeoPlatinum; Prichard, H.M., Potts, P.J., Bowles, J.F.W., Cribb, S.J., Eds.; Elsevier: London, UK; New York, NY, USA, 1987; Volume 87, pp. 319–341. [Google Scholar]
- Naldrett, T.; Kinnaird, J.; Wilson, A.; Chunnett, G. The concentration of P.G.E. in the Earth’s crust with special reference to the Bushveld Complex. Earth Sci. Front. 2008, 15, 264–297. [Google Scholar] [CrossRef]
- Song, X.Y.; Zhou, M.F.; Hou, Z.Q.; Cao, Z.M.; Wang, Y.L. Ni-Cu-(P.G.E.) magmatic sulfide deposits in the Yangliuping area, Permian Emeishan igneous province, S.W. China. Miner. Depos. 2003, 38, 831–843. [Google Scholar] [CrossRef]
- Zhu, W.G.; Zhong, H.; Hu, R.Z.; Liu, B.G.; He, D.F.; Song, X.Y.; Deng, H.L. Platinum-group minerals and tellurides from the PGE-bearing Xinjie layered intrusion in the Emeishan Large Igneous Province, SW China. Mineral. Petrol. 2010, 98, 167–180. [Google Scholar] [CrossRef]
- Prendergast, M.D. Archean komatiitic sill-hosted chromite deposits in the Zimbabwe craton. Econ. Geol. 2008, 103, 981–1004. [Google Scholar] [CrossRef]
- Rollinson, H. The Archean komatiite-related Inyala chromitite, southern Zimbabwe. Econ. Geol. 1997, 92, 98–107. [Google Scholar] [CrossRef]
- Stowe, C.W. Chromite deposits of the Shurugwi greenstone belt, Zimbabwe. In Evolution of Chromium Ore Fields; Stowe, C.W., Ed.; Hutchinson Ross Publication: New York, NY, USA, 1997; pp. 71–88. [Google Scholar]
- Khatun, S.; Mondal, S.K.; Zhou, M.-F.; Balaram, V.; Prichard, H.M. Platinum-group element (P.G.E.) geochemistry of Mesoarchean ultramafic-mafic cumulate rocks and chromitites from the Nuasahi Massif, Singhbhum craton (India). Lithos 2014, 205, 322–340. [Google Scholar] [CrossRef]
- Mondal, S.K.; Ripley, E.M.; Li, C.; Frei, R. The genesis of Archean chromitites from the Nuasahi and Sukinda massifs in the Singhbhum craton, India. Precambrian Res. 2006, 148, 45–66. [Google Scholar] [CrossRef]
- Stowe, C.W. Composition and tectonic settings of chromite deposits through time. Econ. Geol. 1994, 89, 528–546. [Google Scholar] [CrossRef]
- Mondal, S.K. Chromite and P.G.E. deposits of Mesoarchean ultramafic–mafic suites within the greenstone belts of the Singhbhum Craton (India): Implication for mantle heterogeneity and tectonic setting. J. Geol. Soc. India 2009, 73, 36–51. [Google Scholar] [CrossRef]
- Mondal, S.K.; Zhou, M.F. Enrichment of P.G.E. through interaction of evolved boninitic magmas with early formed cumulates in a gabbro-breccia zone of the Mesoarchean Nuasahi Massif (eastern India). Miner. Depos. 2010, 45, 69–91. [Google Scholar] [CrossRef]
- Mukherjee, R.; Mondal, S.K.; Zhong, H.; Bai, Z.-J.; Balaram, V.; Kumar, G.R.R. Platinum-group element geochemistry of komatiite-derived 3.1 Ga ultramafic–mafic rocks and chromitites from the Nuggihalli greenstone belt, western Dharwar craton (India). Chem. Geol. 2014, 386, 190–208. [Google Scholar] [CrossRef]
- Mukherjee, R.; Mondal, S.K.; Gonzalez-Jimenez, J.M.; Griffin, W.L.; Pearson, N.J.; O’Reilly, S.Y. Trace element fingerprints of chromite, magnetite and sulfide from the 3.1 Ga ultramafic-mafic rocks of the Nuggihalli greenstone belt, Western Dharwar Craton (India). Contrib. Mineral. Petrol. 2015, 169, 59. [Google Scholar] [CrossRef]
- Acharyya, S.K. Greenstones from Singhbhum craton, their Archaean character, oceanic crustal affinity and tectonics. Proc. Nat. Acad. Sci. India Sec. 1993, 63, 211–222. [Google Scholar]
- Srinivasachari, K. Stratiform chromite deposits of Sukinda-Nuasahi ultramafic belt, Orissa, India. Geol. Surv. India Misc. Publ. 1974, 34, 151–160. [Google Scholar]
- Mukhopadhyay, D.; Dutta, D.R. Structures in the Roro ultramafics and their country rocks, Singhbhum district, Bihar. In Structure and Tectonics of Precambrian Rocks of India; Recent Researches in Geology; Hindustan Publishing Corporation: New Delhi, India, 1983; Volume 10, pp. 98–109. [Google Scholar]
- Basu, A.; Maitra, M.; Roy, P.K. Petrology of mafic-ultramafic complex of Sukinda Valley Odisha. Indian Miner. 1997, 50, 271–290. [Google Scholar]
- Chakraborty, K.L.; Chakraborty, T.L. Geological features and origin of the chromite deposits of SukindaValley, Odisha, India. Miner. Depos. 1984, 19, 256–265. [Google Scholar] [CrossRef]
- Pal, T.; Mitra, S. P-T-fO2 controls on a partly inverse chromite bearing ultramafic intrusive: An evaluation from the Sukinda Massif, India. J. Asian Earth Sci. 2004, 22, 483–493. [Google Scholar] [CrossRef]
- Page, N.J.; Banerji, P.K.; Haffty, J. Characterization of the Sukinda and Nausahi ultramafic complexes, Orissa, India by platinum-group element geochemistry. Precambrian Res. 1985, 30, 27–41. [Google Scholar] [CrossRef]
- Misra, S.; Deomurari, M.P.; Wiedenbeck, M.; Goswami, J.N.; Ray, S.; Saha, A.K. 207Pb/206Pb zircon ages and the evolution of the Singhbhum Craton, eastern India: An ion microprobe study. Precambrian Res. 1999, 93, 139–151. [Google Scholar] [CrossRef]
- Saha, A.K.; Ray, S.L.; Sarkar, S.N. Early history of the Earth: Evidence from the eastern Indian Shield. Geol. Soc. India Mem. 1988, 8, 13–37. [Google Scholar]
- Sarkar, S.N.; Saha, A.K. Structure and tectonics of the Singhbhum-Orissa iron ore craton, eastern India. In Structure and Tectonics of the Precambrian Rocks; Sinha-Roy, S., Ed.; Recent Researches in Geology; Hindustan Publ. Co.: Delhi, India, 1983; Volume 10, pp. 1–25. [Google Scholar]
- Saha, A.K. Crustal evolution of Singhbhum North Odisha, Eastern India. Geol. Soc. India Mem. 1994, 27, 341. [Google Scholar]
- Mukhopadhyay, D. The Archean nucleus of Singhbhum: The present state of knowledge. Gondwana Res. 2001, 4, 307–318. [Google Scholar] [CrossRef]
- Misra, S. Precambrian chronostratigraphic growth of Singhbhum–Orissa Craton, Eastern Indian Shield: An alternative model. J. Geol. Soc. India 2006, 67, 356–378. [Google Scholar]
- Mondal, S.K.; Khatun, S.; Prichard, H.M.; Satyanarayanan, M.; Kumar, G.R.R. Platinum-group element geochemistry of boninite-derived Mesoarchean chromitites and ultramafic-mafic cumulate rocks from the Sukinda Massif (Orissa, India). Ore Geol. Rev. 2019, 104, 722–744. [Google Scholar] [CrossRef]
- Mukhopadhyay, J.; Beukes, N.J.; Armstrong, R.A.; Zimmermann, U.; Ghosh, G.; Medda, R.A. Dating the oldest greenstone in India: A 3.51-Ga precise U–Pb SHRIMP zircon age for dacitic lava of the Southern Iron Ore Group, Singhbhum Craton. J. Geol. 2008, 116, 449–461. [Google Scholar] [CrossRef]
- Misra, S.; Johnson, P.T. Geochronological constraints on the evolution of the Singhbhum Mobile Belt and associated basic volcanics of eastern Indian shield. Gond. Res. 2005, 8, 129–142. [Google Scholar] [CrossRef]
- Bose, M.K. Mafic-ultramafic magmatism in the eastern Indian craton—A review. Geol. Surv. India Spec. Publ. 2000, 55, 227–258. [Google Scholar]
- Sengupta, S.; Acharya, S.K.; De Smith, J.B. Geochemistry of Archean volcanic rocks from Iron Ore Supergroup, Singhbhum, eastern India. Proc. Indian Acad. Sc. 1997, 106, 327–342. [Google Scholar]
- Sahu, N.K.; Mukherjee, M.M. Spinifex textured komatiite from BadampaharGorumahishani schist belt, Mayurbhanj district, Orissa. J. Geol. Soc. India 2001, 57, 529–534. [Google Scholar]
- Chaudhuri, T.; Mazumder, R.; Arima, M. Petrography and geochemistry of Mesoarchaean komatiites from the eastern Iron Ore belt, Singhbhum craton, India, and its similarity with “Barberton type komatiite”. J. Afr. Earth Sci. 2015, 101, 135–147. [Google Scholar] [CrossRef]
- Chaudhuri, T.; Satish-Kumar, M.; Mazumder, R.; Biswas, S. Geochemistry and Sm-Nd isotopic characteristics of the Paleoarchean Komatiites from Singhbhum Craton, Eastern India and their implications. Precambrian Res. 2017, 298, 385–402. [Google Scholar] [CrossRef]
- Paul, D.; Mukhopadhyay, D.; Pyne, T.; Bishui, P. Rb-Sr age of granitoid in the Deo River Section, Singhbhum and its relevance to the age of iron formation. Indian Miner. 1991, 45, 51–56. [Google Scholar]
- Roy, A.; Sarkar, A.; Jeyakumar, S.; Aggarwal, S.K.; Ebihara, M.; Satosh, H. Late Archean mantle metasomatism below eastern Indian craton: Evidence from trace elements, REE geochemistry and Sr–Nd–O isotope systematics of ultramafic dykes. Proc. Indian Acad. Sci. 2004, 113, 649–665. [Google Scholar]
- Banerjee, P.K. Geology and geochemistry of the Sukinda ultramafic field, Cuttack district, Odisha. Mem. Geol. Surv. India 1972, 103, 171. [Google Scholar]
- McDonough, W.F.; Sun, S.S. The composition of the Earth. Chem. Geol. 1995, 120, 223–253. [Google Scholar] [CrossRef]
- Satyanarayanan, M.; Balaram, V.; Sawant, S.S.; Subramanyam, K.S.V.; Krishna, G.V.; Dasaram, B.; Manikyamba, C. Rapid determination of REEs, P.G.E.s, and other trace elements in geological and environmental materials by high resolution inductively coupled plasma mass spectrometry. At. Spectrosc. 2018, 39, 1–15. [Google Scholar] [CrossRef]
- Droop, G.T.R. A general equation for estimating Fe3+ concentrations in ferromagnesian silicates and oxides from microprobe analyses, using stoichiometric criteria. Mineral. Mag. 1987, 51, 431–435. [Google Scholar] [CrossRef]
- Banerjee, M.; Dutta, U.; Anand, R.; Atlas, Z.D. Insights on the process of two-stage coronae formation at olivine-plagioclase contact in mafic dyke from Palghat Cauvery Shear Zone, southern India. Mineral. Petrol. 2019, 113, 625–649. [Google Scholar] [CrossRef]
- Deer, W.A.; Howie, R.A.; Zussman, J. An Introduction to the Rock-Forming Minerals, 3rd Excerpted Student ed.; The Mineralogical Society: London, UK, 2013.
- Humphries, D.W. The Preparation of Thin Sections of Rocks, Minerals and Ceramics. Royal Microscopical Society; Oxford University Press, Oxford Science Publication: Oxford, UK; New York, NY, USA, 1992; Volume 24, p. 83. [Google Scholar]
- Manikyamba, C.; Ray, J.; Ganguly, S.; Singh, M.R.; Santosh, M.; Saha, A.; Satyanarayana, M. Boninitic metavolcanic rocks and island arc tholeiites from the Older Metamorphic Group (O.M.G.) of Singhbhum craton, eastern India: Geochemical evidence for Archean subduction processes. Precambrian Res. 2015, 271, 138–159. [Google Scholar] [CrossRef]
- Revillon, S.; Arndt, N.T.; Hallot, E.; Kerr, A.C.; Tarney, J. Petrogenesis of picrites from the Caribbean Plateau and the North Atlantic magmatic province. Lithos 1999, 49, 1–21. [Google Scholar] [CrossRef]
- Khanna, T.C.; Sesha Sai, V.V.; Bizimis, M.; Krishna, A.K. Petrogenesis of ultramafics in the Neoarchean Veligallu greenstone terrane, eastern Dharwar craton, India: Constraints from bulk-rock geochemistry and Lu-Hf isotopes. Precambrian Res. 2016, 285, 186–201. [Google Scholar] [CrossRef]
- Peng, T.; Wilde, S.A.; Fan, W.; Peng, B. Neoarchean siliceous high-Mg basalt (SHMB) from the Taishan granite-greenstone terrane, Eastern North China Craton: Petrogenesis and tectonic implications. Precambrian Res. 2013, 228, 233–249. [Google Scholar] [CrossRef]
- Maier, W.D.; Barnes, S.J.; Campbell, I.H.; Fiorentini, M.L.; Peltonen, P.; Barnes, S.-J.; Smithies, R.H. Progressive mixing of meteoritic veneer into the early Earth’s deep mantle. Nature 2009, 460, 620–623. [Google Scholar] [CrossRef]
- Rollinson, H.; Appel, P.W.U.; Frei, R. A metamorphosed, early Archaean chromitite from west Greenland: Implications for the genesis of Archaean anorthosite chromitites. J. Petrol. 2002, 43, 2143–2170. [Google Scholar] [CrossRef]
- Szilas, K.; Kelemen, P.B.; Rosing, M.T. The petrogenesis of ultramafic rocks in the >3.7 Ga Isua supracrustal belt, southern West Greenland: Geochemical evidence for two distinct magmatic cumulate trends. Gondwana Res. 2015, 28, 565–580. [Google Scholar] [CrossRef]
- Mohr, P.A. Crustal Contamination in Mafic Sheets: A summary. In Mafic Dyke Swarms; Halls, H.C., Fahrig, W.C., Eds.; Special Publication-Geological Association of Canada: St. John’s, NL, Canada, 1987; Volume 34, pp. 75–80. [Google Scholar]
- Zhu, Y.; An, F.; Tan, J. Geochemistry of hydrothermal gold deposits: A review. Geosci. Front. 2011, 2, 367–374. [Google Scholar] [CrossRef]
- Rudnick, R.L.; Gao, S. Composition of the continental crust. Treatise Geochem. 2004, 3, 1–64. [Google Scholar]
- Zhao, J.J.; Zhou, M.F. Geochemistry of Neoproterozoic mafic intrusions in the Panzhihua district (Sichuan Province, SW China): Implications for subduction-related metasomatism in the upper mantle. Precambrian Res. 2007, 152, 27–47. [Google Scholar] [CrossRef]
- Cameron, W.E.; McCulloch, M.T.; Walker, D.A. Boninite petrogenesis: Chemical and Nd-Sr isotopic constraints. Earth Planet. Sci. Lett. 1983, 65, 75–89. [Google Scholar] [CrossRef]
- Hall, R.P.; Hughes, D.J. Norite dykes of southern Greenland, early Proterozoic boninitic magmatism. Contrib. Mineral. Petrol. 1987, 97, 169–182. [Google Scholar] [CrossRef]
- Hall, R.P.; Hughes, D.J. (Eds.) Norite Magmatism. Early Precambrian Basic Magmatism; Blackie, Glasgow; Springer: Dordrecht, The Netherlands, 1990; pp. 83–110. [Google Scholar]
- Poidevin, J.L. Boninite-like rocks from the Palaeoproterozoic greenstone belt of Bogoin, Central African Republic: Geochemistry and petrogenesis. Precambrian Res. 1994, 68, 97–113. [Google Scholar] [CrossRef]
- Smithies, R.H. Archaeanboninite like rocks in an intracratonic setting. Earth Planet. Sci. Lett. 2002, 197, 19–34. [Google Scholar] [CrossRef]
- Plank, T. Constraints from thorium/lanthanum on sediment recycling at subduction zones and the evolution of the continents. J. Petrol. 2005, 46, 921–944. [Google Scholar] [CrossRef]
- Taylor, S.R.; McLennan, S.M. The geochemical evolution of the continental crust. Rev. Geophys. 1995, 33, 241–265. [Google Scholar] [CrossRef]
- Sun, S.S.; McDonough, W.F. Chemical and isotopic systematics of oceanic basalt: Implication for mantle composition and processes. Geol. Soc. Lond. Spec. Publ. 1989, 42, 528–548. [Google Scholar] [CrossRef]
- Irvine, T.N. Chromian spinel as a petrogenetic indicator. Part I. Theory. Can. J. Earth Sci. 1965, 52, 648–672. [Google Scholar] [CrossRef]
- Arai, S. Chemistry of chromian spinel in volcanic rocks as a potential guide to magma chemistry. Mineral. Mag. 1992, 56, 173–184. [Google Scholar] [CrossRef]
- Arai, S. Characterization of spinel peridotites by olivine-spinel compositional relationships: Review and interpretation. Chem. Geol. 1994, 113, 191–204. [Google Scholar] [CrossRef]
- Kamenetsky, V.; Crawford, A.J.; Meffre, S. Factors controlling chemistry of magmatic spinel: An empirical study of associated olivine, Cr-spinel and melt inclusions from primitive rocks. J. Petrol. 2001, 42, 655–671. [Google Scholar] [CrossRef]
- Irvine, T.N. Chromian spinel as a petrogenetic indicator, Part II. Petrological applications. Can. J. Earth Sci. 1967, 4, 71–103. [Google Scholar] [CrossRef]
- Barnes, S.J. Chromite in komatiites, II. Modification during greenschist to mid-amphibolite facies metamorphism. J. Petrol. 2000, 41, 387–409. [Google Scholar] [CrossRef]
- Arai, S.; Okamura, H.; Kadoshima, K.; Tanaka, C.; Suzuki, S.; Ishimaru, S. Chemical characteristics of chromian spinel in plutonic rocks: Implications for deep magma processes and discrimination of tectonic setting. Isl. Arc 2011, 20, 125–137. [Google Scholar] [CrossRef]
- Wilson, B.M. Igneous Petrogenesis a Global Tectonic Approach; Springer Science & Business Media: Dordrecht, The Netherlands, 2007. [Google Scholar]
- Nayak, R.; Pal, D.; Chinnasamy, S.S. High-Cr chromitites of the Nidar Ophiolite Complex, northern India: Petrogenesis and tectonic implications. Ore Geol. Rev. 2021, 129, 103942. [Google Scholar] [CrossRef]
- Roeder, P.L.; Campbell, I.H.; Jamieson, H.E. A re-evaluation of the olivine-spinel geothermometer. Contrib. Mineral. Petrol. 1979, 68, 325–334. [Google Scholar] [CrossRef]
- Rollinson, H. The geochemistry of mantle chromitites from the northern part of the Oman ophiolite: Inferred parental melt compositions. Contrib. Mineral. Petrol. 2008, 156, 273–288. [Google Scholar] [CrossRef]
- Hill, R.; Roeder, P. The crystallization of spinel from basaltic liquid as a function of oxygen fugacity. J. Geol. 1974, 82, 709–729. [Google Scholar] [CrossRef]
- Pagé, P.; Barnes, S.J. Using trace elements in chromites to constrain the origin of podiform chromitites in the ThetfordMines Ophiolite, Quebec, Canada. Econ. Geol. 2009, 104, 997–1018. [Google Scholar] [CrossRef]
- Manu Prasanth, M.P.; Hari, K.R.; Chalapathi Rao, N.V.; Hou, G.; Pandit, D. An island arc tectonic setting for the Neoarchean Sonakhan Greenstone Belt, Bastar Craton, Central India: Insights from the chromite mineral chemistry and geochemistry of the siliceous high-Mg basalts (SHMB). Geol. J. 2017, 53, 1526–1542. [Google Scholar] [CrossRef]
- Wilson, M. Igneous Petrogenesis; Unwin Hyman: London, UK, 1989; p. 446. [Google Scholar]
- Hickey, R.L.; Frey, F.A. Geochemical characteristics of boninite series volcanics: Implications for their source. Geochim. Et Cosmochim. Acta 1982, 46, 2099–2115. [Google Scholar] [CrossRef]
- Sun, S.S.; Nesbitt, R.W. Geochemical regularities and genetic significance of ophiolitic basalts. Geology 1978, 6, 689–693. [Google Scholar] [CrossRef]
- Shibata, T.; Thompson, G.; Frey, F.A. Tholeiitic and alkali basalts from the Mid-Atlantic Ridge at 43° N. Contr. Mineral. Petrol. 1979, 70, 127–141. [Google Scholar] [CrossRef]
- le Roex, A.P.; Dick, H.J.; Gulen, L.; Reid, A.M.; Erlank, A.J. Local and regional heterogeneity in MORB from the Mid-Atlantic Ridge between 54.5° S and 51° S: Evidence for geochemical enrichment. Geochim. Cosmochim. Acta 1987, 51, 541–555. [Google Scholar] [CrossRef]
- Kamenetsky, V.; Sobolev, A.; Eggins, S.; Crawford, A.; Arculus, R. Olivine-enriched melt inclusions in chromites from low-Ca boninites, Cape Vogel, Papua New Guinea: Evidence for ultramafic primary magma, refractory mantle source and enriched components. Chem. Geol. 2002, 183, 287–303. [Google Scholar] [CrossRef]
- Ishii, T.; Robinson, P.T.; Maekawa, H.; Fiske, R. Petrological studies of peridotites from diapiric serpentinites seamounts in the Izu-Ogasawara-Mariana forearc, Leg 125. Proc. Ocean. Drill. Program Sci. Results 1992, 125, 445–485. [Google Scholar]
- Pearce, J.A.; Barker, P.F.; Edwards, S.J.; Parkinson, I.J.; Leat, P.T. Geochemistry and tectonic significance of peridotites from the South Sandwich arc–basin system, South Atlantic. Contrib. Miner. Pet. 2000, 139, 36–53. [Google Scholar] [CrossRef]
- Dick, H.J.B.; Bullen, T. Chromian spinel as a petrogenetic indicator in abyssal and alpine-type peridotites and spatially associated lavas. Contrib. Mineral. Petrol. 1984, 86, 54–76. [Google Scholar] [CrossRef]
- Van Der Laan, S.R.; Arculus, R.J.; Pearce, J.A.; Murton, B.J. Petrography, mineral chemistry, and phase relations of the basement boninite series of Site 786, Izu-Bonin forearc. Proc. Ocean. Drill. Program Sci. Results 1992, 125, 171–202. [Google Scholar]
- Sobolev, A.V.; Danyushevsky, L.V. Petrology and geochemistry of boninites from the north termination of the Tonga Trench: Constraints on the generation conditions of primary high-Ca boninite magmas. J. Petrol. 1994, 35, 1183–1211. [Google Scholar] [CrossRef]
- Cameron, W.E. Petrology and origin of primitive lavas from Troodos ophiolite, Cyprus. Contrib. Mineral. Petrol. 1985, 89, 239–255. [Google Scholar] [CrossRef]
- Umino, S. Magma mixing in boninite sequence of Chichijima, Bonin island. J. Volcanol. Geotherm. Res. 1986, 29, 125–157. [Google Scholar] [CrossRef]
- Parkinson, I.J.; Pearce, J.A. Peridotites of the Izu-Bonin-Mariana forearc (ODP Leg 125) evidence for mantle melting and melt–mantle interactions in a supra-subduction zone setting. J. Petrol. 1998, 39, 1577–1618. [Google Scholar] [CrossRef]
- Van der Laan, S.R.; Flower, M.F.J.; Koster van Groos, A.F. Experimental evidence for the origin of boninites: Near-liquidus phase relations to 7·5 kbar. In Boninites and Related Rocks; Crawford, A.J., Ed.; Unwin and Hyman: London, UK, 1989; pp. 112–147. [Google Scholar]
- Crawford, A.J.; Falloon, T.J.; Green, D.H. Classification, petrogenesis and tectonic setting of boninites. In Boninites and Related Rocks; Crawford, A.J., Ed.; Unwin Hyman: London, UK, 1989; pp. 2–44. [Google Scholar]
- Naldrett, A.J.; von Gruenewoldt, G. Association of platinum group elements with chromitite in layered intrusions and ophiolite complexes. Econ. Geol. 1989, 84, 180–187. [Google Scholar] [CrossRef]
- Sun, S.S.; Wallace, D.A.; Hoatson, D.M.; Glikson, A.Y.; Keays, R.R. Use of geochemistry as a guide to platinum group element potential of mafic–ultramafic rocks: Examples from the west Pilbara Block and Halls Creek mobile zone, Western Australia. Precambrian Res. 1991, 50, 1–35. [Google Scholar] [CrossRef]
- Keays, R.R. The role of komatitic and picritic magmatism and Ssaturation in the formation of ore deposits. Lithos 1994, 34, 1–18. [Google Scholar] [CrossRef]
- Dilek, Y.; Furnes, H. Structure and geochemistry of Tethyan ophiolites and their petrogenesis in subduction rollback systems. Lithos 2009, 113, 1–20. [Google Scholar] [CrossRef]
- Shervias, J.W. Ti–V plots and the petrogenesis of modern and ophiolitic lavas. Earth Planet. Sci. Lett. 1982, 59, 101–118. [Google Scholar] [CrossRef]
- Seitz, H.M.; Keays, R.R. Platinum group element segregation and mineralization in a Noritic Ring complex formed from Proterozoic siliceous high magnesium basalt magmas in the Vestfold Hills, Antarctica. J. Petrol. 1997, 38, 703–725. [Google Scholar] [CrossRef]
- Sensarma, S.; Palme, H.; Mukhopadhyay, D. Crust–mantle interaction in the genesis of siliceous high magnesian basalts: Evidence from the early Proterozoic Dongargarh Supergroup, India. Chem. Geol. 2002, 187, 21–37. [Google Scholar] [CrossRef]
- Polat, A.; Hofmann, A.W.; Rosing, M.T. Boninite-like volcanic rocks in the 3.7–3.8 Ga Isua greenstone belt, West Greenland: 914 geochemical evidence for intra-oceanic subduction zone processes in the early Earth. Chem. Geol. 2002, 184, 231–254. [Google Scholar] [CrossRef]
- Manikyamba, C.; Naqvi, S.M.; Rao, D.S.; Mohan, M.R.; Khanna, T.C.; Rao, T.G.; Reddy, G.L.N. Boninites from the Neoarchaean Gadwal greenstone belt, eastern Dharwar craton, India: Implications for Archaean subduction processes. Earth Planet. Sci. Lett. 2005, 230, 65–83. [Google Scholar] [CrossRef]
- Srivastava, R.K. Geochemistry and petrogenesis of Neoarchaeanhigh-Mg low-Ti mafic igneous rocks in an intracratonic setting, Central India craton: Evidence for boninite magmatism. Geochem. J. 2006, 40, 15–31. [Google Scholar] [CrossRef]
- Chalapathi Rao, N.V.; Srivastava, R.K. A new find of boninite dyke from the Palaeoproterozoic Dongargarh Supergroup: Inference for a fossil subduction zone in the Archaean of the Bastar Craton, Central India. Neues Jahrb. Für Mineral. Abh. 2009, 186, 271–282. [Google Scholar]
- Konig, S.; Munker, C.; Schuth, S.; Luguet, A.; Hoffmann, J.E.; Kuduon, J. Boninites as windows into trace element mobility in subduction zones. Geochim. Cosmochim. Acta 2010, 74, 684–704. [Google Scholar]
- Rollinson, H.R. Using Geochemical Data: Evaluation, Presentation, Interpretation; John Wiley: Chichester, UK, 1993; p. 352. [Google Scholar]
- Kitayama, Y.C.; Francis, D. Iron-rich alkaline magmatism in the Archean Wawa greenstone belts (Ontario, Canada). Precambrian Res. 2014, 252, 53–70. [Google Scholar] [CrossRef]
- Puchtel, I.S.; Haase, K.M.; Hofmann, A.W.; Chauvel, C.; Kulikov, V.S.; Garbe-Schonberg, C.D.; Nemchin, A.A. Petrology and geochemistry of crustally contaminated komatiitic basalts from the Vetreny belt, southeastern Baltic Shield: Evidence for an early Proterozoic mantle plume beneath rifted Archean continental lithosphere. Geochim. Cosmochim. Acta 1997, 61, 1205–1222. [Google Scholar] [CrossRef]
- Puchtel, I.S.; Hofmann, A.W.; Amelin, Y.V.; Garbe-Schonberg, C.D.; Samsonov, A.V.; Shchipansky, A.A. Combined mantle plume–island arc model for the formation of the 2.9 Ga Sumozero-Kenozero greenstone belt, S.E. Baltic Shield: Isotope and trace element constraints. Geochim. Cosmochim. Acta 1999, 63, 3579–3595. [Google Scholar] [CrossRef]
- Szilas, K.; Naeraa, T.; Schersten, A.; Stendal, H.; Frei, R.; van Hinsberg, V.J.; Kokfelt, T.F.; Rosing, M.T. Origin of Mesoarchean arc-related rocks with boninite/komatiite affinities from south West Greenland. Lithos 2012, 144, 24–39. [Google Scholar] [CrossRef]
- Saha, A.; Manikyamba, C.; Santosh, M.; Ganguly, S.; Khelen, A.C.; Subramanyam, K.S.V. Platinum Group Elements (P.G.E.) geochemistry of komatiites and boninites from Dharwar Craton, India: Implications for mantle melting processes. J. Asian Earth Sci. 2015, 105, 300–319. [Google Scholar]
- Le Bas, M.J. IUGS reclassification of the high-Mg and picritic volcanic rocks. J. Petrol. 2000, 41, 1467–1470. [Google Scholar] [CrossRef]
- Srivastava, R.K. Global IntracratonicBoninite- Norite magmatism during the Neoarchean—Paleoproterozoic: Evidence from the Central Indian Bastar craton. Int. Geol. Rev. 2008, 50, 61–74. [Google Scholar] [CrossRef]
- Parman, S.; Dann, J.; Grove, T.L.; De Wit, M.J. Emplacement conditions of komatiite magmas from the 3.49 Ga Komati formation, Barberton Greenstone Belt, South Africa. Earth Planet. Sci. Lett. 1997, 150, 303–323. [Google Scholar]
- Parman, S.W.; Grove, T.L.; Dann, J.C. The production of Barberton komatiites in an Archean subduction zone. Geophys. Res. Lett. 2001, 28, 2513–2516. [Google Scholar]
- Grove, T.L.; Parman, S.W.; Dann, J.C. Conditions of magma generation for Archean komatiites from the Barberton Mountainland, South Africa. Spec. Publ. Geochem. Soc. 1999, 6, 155–167. [Google Scholar]
- Redman, B.A.; Keays, R.R. Archaean basic volcanism in the Eastern GoldfieldsProvince, Yilgarn Block, Western Australia. Precambrian Res. 1985, 30, 113–152. [Google Scholar]
- Arndt, N.T.; Brügmann, G.E.; Lehnert, K.; Chauvel, C.; Chappell, B.W. Geochemistry, Petrogenesis and Tectonic Environment of Circum-Superior Belt Basalts, Canada. Geol. Soc. Spec. Publ. 1987, 33, 133–145. [Google Scholar]
- Smithies, R.H.; Champion, D.C.; Sun, S.S. The case for Archaean boninites. Contrib. Mineral. Petrol. 2004, 147, 705–721. [Google Scholar]
- Verma, S.P.; Torres-Alvarado, I.S.; Sotelo-Rodr’ıguez, Z.T. SINCLAS: Standard igneous norm and volcanic rock classification system. Comput. Geosci. 2002, 28, 711–715. [Google Scholar]
- Brown, A.V.; Jenner, G.A. Geological setting, petrology and chemistry of Cambrian boninite and low-Ti tholeiitic lavas in western Tasmania. In Boninites and Related Rocks; Crawford, A.J., Ed.; Unwin Hyman: London, UK, 1989; pp. 233–263. [Google Scholar]
- Xia, X.; Song, S.; Niu, Y. Tholeiite–Boninite terrane in the North Qilian suture zone: Implications for subduction initiation and back-arc basin development. Chem. Geol. 2012, 328, 259–277. [Google Scholar]
- Kerrich, R.; Wyman, D.A.; Fan, J.; Bleeker, W. Boninite series: Low Ti–tholeiite associations from the 2.7 Ga Abitibi greenstone belt. Earth Planet. Sci. Lett. 1998, 164, 303–316. [Google Scholar]
- Boily, M.; Dion, C. Geochemistry of boninite-type volcanic rocks in the Frotet-Evans greenstone belt, Opaticasubprovince, Quebec: Implications for the evolution of Archaean greenstone belt. Precambrian Res. 2002, 115, 349–371. [Google Scholar] [CrossRef]
- Umino, S.; Kushiro, I. Experimental studies on boninite petrogenesis. In Boninites and Related Rocks; Crawford, A.J., Ed.; Unwin Hyman: London, UK, 1989; pp. 89–111. [Google Scholar]
- Falloon, T.J.; Danyushevsky, L.V. Melting of refractory mantle at 1.5, 2 and 2.5 GPa under anhydrous and H2O-undersaturated conditions: Implications for high-Ca boninites and the influence of subduction components on mantle melting. J. Petrol. 2000, 41, 257–283. [Google Scholar] [CrossRef]
- Defant, M.J.; Drummond, M.S. Derivation of some modern arc magmas by melting of young subducted lithosphere. Nature 1990, 347, 662–665. [Google Scholar] [CrossRef]
- Pearce, J.A.; Vander Laan, S.R.; Arculus, R.J.; Murton, B.J.; Ishii, T.; Peate, D.W.; Parkinson, I.J. Boninite and harzburgite from Leg 125 (Bonin-Mariana forearc): A case study of magma genesis during the initial stages of subduction, in Fryer. In Proceeding of the Ocean Drilling Program Scientific Results; Ocean Drilling Program: College Station, TX, USA, 1992; Volume 125, pp. 623–659. [Google Scholar]
- Li, C.; Ripley, E.M.; Thakurta, J.; Stifter, E.C.; Qi, L. Variations of olivine Fo–Ni contents and highly chalcophile element abundances in arc ultramafic cumulates, southern Alaska. Chem. Geol. 2013, 351, 15–28. [Google Scholar]
- Hawkins, J.W.; Bloomer, S.H.; Evans, C.A.; Melchior, J.T. Evolution of intra-oceanic arc-trench systems. Tectonophysics 1984, 102, 175–205. [Google Scholar]
- Duncan, R.A.; Green, D.H. Role of multistage melting in the formation of oceanic crust. Geology 1980, 8, 22–26. [Google Scholar] [CrossRef]
- Duncan, R.A.; Green, D.H. The genesis of refractory melts in the formation of oceanic crust. Contrib. Mineral. Petrol. 1987, 96, 326–342. [Google Scholar]
- Shiraki, K.; Kuroda, N.; Maruyama, S.; Urano, H. Evolution of the Tertiary volcanic rocks in the Izu Mariana Arc. Bull Volcanol 1978, 41, 548–562. [Google Scholar] [CrossRef]
- Meijer, A. Primitive arc volcanism and a boninite series: Examples from western Pacific Island arcs. The tectonic and geologic evolution of Southeast Asian seas and islands. Wash. DC Am. Geophys. Union Geophys. Monogr. Ser. 1980, 23, 269–282. [Google Scholar]
- Tatsumi, Y.; Lshizaka, K. High magnesian andesite and basalt from Shodo-Shima island, south west Japan, and their bearing on the genesis of calc-alkaline andesites. Lithos 1982, 15, 161–172. [Google Scholar] [CrossRef]
- Crawford, A.J.; Beccaluva, L.; Serri, G.; Dostal, J. Petrology, geochemistry and tectonic implications of volcanic dredged from the intersection of the Yap and Mariana trenches. Earth Planet. Sci. Lett. 1986, 80, 265–280. [Google Scholar] [CrossRef]
- Pearce, J.A.; Parkinson, I.J. Trace element models for mantle melting: Application to volcanic arc petrogenesis. Geol. Soc. Lond. Spec. Publ. 1993, 76, 373–403. [Google Scholar] [CrossRef]
- Woodhead, J.; Eggins, S.; Gamble, J. High field strength and transition element systematics in island arc and back-arc basin basalts: Evidence for multi-phase melt extraction and a depleted mantle wedge. Earth Planet. Sci. Lett. 1993, 114, 491–504. [Google Scholar] [CrossRef]
- Elliott, T.; Plank, T.; Zindler, A.; White, W.; Bourdon, B. Element transport from slab to volcanic front at the Mariana arc. J. Geophys. Res. Solid Earth 1997, 102, 14991–15019. [Google Scholar] [CrossRef]
- Jiang, Y.H.; Jiang, S.Y.; Dai, B.Z.; Liao, S.Y.; Zhao, K.D.; Ling, H.F. Middle to late Jurassic felsic and mafic magmatism in southern Hunan province, southeast China: Implications for a continental arc to rifting. Lithos 2009, 107, 185–204. [Google Scholar] [CrossRef]
- Yang, Q.Y.; Santosh, M.; Shen, J.F.; Li, S.R. Juvenile vs. recycled crust in N.E. China: Zircon U–Pb geochronology, Hf isotope and an integrated model for Mesozoic gold mineralization in the Jiadong Peninsula. Gondwana Res. 2014, 25, 1445–1468. [Google Scholar] [CrossRef]
- Rajesh, H.M.; Chisonga, B.C.; Shindo, K.; Beukes, N.J.; Armstrong, R.A. Petrographic, geochemical and SHRIMP U–Pb titanite age characterization of the Thabazimbi mafic sills: Extended time frame and a unifying petrogenetic model for the Bushveld Large Igneous Province. Precambrian Res. 2013, 230, 79–102. [Google Scholar] [CrossRef]
- Rooney, T.O. Geochemical evidence of lithospheric thinning in the southern Main Ethiopian Rift. Lithos 2010, 117, 33–48. [Google Scholar] [CrossRef]
- Stern, R.J.; Reagan, M.; Ishizuka, O.; Ohara, Y.; Whattam, S. To understand subduction initiation, study forearc crust; to understand forearc crust, study ophiolites. Lithosphere 2012, 4, 469–483. [Google Scholar] [CrossRef]
- Hall, R. Cenozoic geological and plate tectonic evolution of SE Asia and the SW Pacific: Computer-based reconstructions, model and animations. J. Asian Earth Sci. 2002, 20, 353–431. [Google Scholar] [CrossRef]
- Pearce, J.A. Trace element characteristics of lavas from destructive plate boundaries. In Andesites; Thorpe, R.S., Ed.; Wiley: New York, NY, USA, 1982; pp. 525–548. [Google Scholar]
- Pearce, J.A.; Lippard, S.J.; Roberts, S. Characteristics and tectonic significance of supra-subduction zone ophiolites. Geol. Soc. Spec. Publ. 1984, 16, 77–94. [Google Scholar] [CrossRef]
- Bloomer, S.; Taylor, B.; MacLeod, C.J.; Stern, B.; Fryer, P.; Hawkins, J.W.; Jhonson, L. Early arc volcanism and the ophiolite problem: A perspective from drilling in the Western Pacific. Act. Margins Marg. Basins West. Pac. 1995, 88, 1–30. [Google Scholar]
- Stern, R.J.; Morris, J.; Bloomer, S.H.; Hawkins, J.W., Jr. The source of metasomatic fluids and the generation of arc melt: Trace element and radiogenic isotope evidence from Eocene boninites, Mariana forearc. Geochim. Cosmochim. Acta 1991, 55, 1467–1481. [Google Scholar] [CrossRef]
- Kimura, J.I.; Nakajima, J. Behaviour of subducted water and its role in magma genesis in the N.E. Japan arc: A combined geophysical and geochemical approach. Geochim. Cosmochim. Acta 2014, 143, 165–188. [Google Scholar] [CrossRef]
- Plank, T.; Kelley, K.A.; Zimmer, M.M.; Hauri, E.H.; Wallace, P.J. Why do mafic arc magmas contain ~4% water on average? Earth Planet. Sci. Lett. 2013, 364, 168–179. [Google Scholar] [CrossRef]
- Jackson, E.D. Chemical variation in coexisting chromite and olivine in chromitite zones of the Stillwater Complex. Econ. Geol. Monogr. Ser. 1996, 4, 41–71. [Google Scholar]
- Fabries, J. Spinel-olivine geothermometry in peridotites from ultramafic complexes. Contrib. Mineral. Petrol. 1979, 69, 329–336. [Google Scholar] [CrossRef]
- Engi, M.; Evans, B.W. Contributions to Mineralogy and A Re-Evaluation of the Olivine-Spinel Geothermometer: Discussion. Contrib. Mineral. Petrol. 1980, 73, 201–203. [Google Scholar] [CrossRef]
- Jaques, A.L.; Green, D.H. Anhydrous melting of peridotite at 0–15 kb pressure and the genesis of tholeiitic basalts. Contrib. Miner. Petrol. 1980, 73, 287–310. [Google Scholar] [CrossRef]
- Deng, X.H.; Chen, Y.J.; Santosh, M.; Yao, J.M. Genesis of the 1.76 Ga Zhaiwa Mo–Cu and its link with the Xiong’ervolcanics in the North China Craton: Implications for accretionary growth along the margin of the Columbia supercontinent. Precambrian Res. 2012, 227, 337–348. [Google Scholar] [CrossRef]
- Bédard, J.H. Petrogenesis of boninites from the Betts Cove Ophiolite, Newfoundland, Canada: Identification of subducted source components. J. Petrol. 1999, 40, 1853–1889. [Google Scholar] [CrossRef]
- Cooper, L.B.; Plank, T.; Arculus, R.J.; Hauri, E.H.; Hall, P.S.; Parman, S.W. High-Ca boninites from the active Tonga Arc. J. Geophys. Res. Solid Earth 2010, 115. [Google Scholar] [CrossRef]
- Falloon, T.J.; Danyushevsky, L.V.; Ariskin, A.; Green, D.H.; Ford, C.E. The application of olivine geothermometry to infer crystallization temperatures of parental liquids: Implications for the temperatures of MORB magmas. Chem. Geol. 2007, 241, 3–4. [Google Scholar] [CrossRef]
- Stern, R.J.; Bloomer, S.H. Subduction zone infancy: Examples from the Eocene Izu–Bonin–Mariana and Jurassic California Arcs. Geol. Soc. Am. Bull. 1992, 104, 1621–1636. [Google Scholar] [CrossRef]
- Weaver, B.L.; Tarney, J. The Scourie dyke suite: Petrogenesis and geochemical nature of Proterozoic subcontinental mantle. Contrib Mineral Petrol 1981, 78, 175–178. [Google Scholar] [CrossRef]
- Sheraton, J.W.; Black, L.P.; McCulloch, M.T.; Oliver, R.L. Age and origin of a compositionally varied mafic dyke swarm in the Bunger Hills, East Antarctica. Chem Geol 1990, 85, 215–246. [Google Scholar] [CrossRef]
- Pal, T.; Ghosh, B.; Chakraborty, S. Petrogenesis of Archaean chromite deposits of the Roro-Jojohatu areas in the Singhbhum craton: A Boninitic parental melt in suprasubduction zone setting. J. Geol. Soc. India 2008, 72, 635–647. [Google Scholar]
- Mir, A.R.; Alvi, S.H.; Balaram, V. Boninitic geochemical 1262 characteristics of high-Mg mafic dykes from the Singhbhum Granitoid Complex, eastern India. Chin. J. Geochem. 2015, 34, 241–251. [Google Scholar] [CrossRef]
- Mukherjee, R.; Mondal, S.K.; Rosing, M.T.; Frei, R. Compositional variations in the Mesoarchean chromianspinels of the Nuggihalli schist belt, Western Dharwar Craton (India): Potential parental melts and implications for tectonic setting. Contrib. Miner. Petrol. 2010, 160, 865–885. [Google Scholar] [CrossRef]
- Naqvi, S.M.; Khan, R.M.K.; Manikyamba, C.; Mohan, M.R.; Khanna, T.C. Geochemistry of the Neoarchaean high-Mg basalts, boninites and adakites from the Kushtagi–Hungund greenstone belt of the eastern Dharwar craton (EDC); implications for the tectonic setting. J. Asian Earth Sci. 2006, 27, 25–44. [Google Scholar] [CrossRef]
- Jayananda, M. Geochemical constraints on komatiite volcanism from Sargur Group Nagamangala greenstone belt, western Dharwar craton, southern India: Implications for Mesoarchean mantle evolution and continental growth. Geosci. Front. 2013, 4, 321–340. [Google Scholar]
- Jayananda, M.; Kano, T.; Peucat, J.J.; Channabasappa, S. 3.35 Ga komatiite volcanism in the western Dharwar craton, southern India: Constraints from Nd isotopes and whole rock geochemistry. Precamb. Res. 2008, 162, 160–179. [Google Scholar] [CrossRef]
- Maya, J.M.; Bhutani, R.; Balakrishnan, S.; Sandhya, S.R. Petrogenesis of 3.15 Ga old Banasandra komatiites from the Dharwar craton, India: Implications for early mantle heterogeneity. Geosci. Front. 2016, 8, 467–481. [Google Scholar] [CrossRef]
- Manikyamba, C.; Kerrich, R.; Khanna, T.C.; Krishna, A.K.; Satyanarayanan, M. Geochemical systematics of komatiite–tholeiite and adakitic - arc basalt associations: The role of a mantle plume and convergent margininformationof the SandurSuperterrane, Dharwar craton, India. Lithos 2008, 106, 155–172. [Google Scholar] [CrossRef]
- Manikyamba, C.; Kerrich, R.; Polat, A.; Saha, A. Geochemistry of two stratigraphicallyrelated ultramafic (komatiite) layers from the Neoarchean Sigegudda greenstone terrane, western Dharwar craton, India: Evidence for compositional diversity in Archean mantle plumes. Lithos 2013, 177, 120–135. [Google Scholar] [CrossRef]
- Malviya, V.P.; Arima, M.; Pati, J.K.; Kaneko, Y. Petrology and geochemistry of metamorphosed basaltic pillow lava and basaltic komatiite in the Mauranipur area: Subduction related volcanism in the Archean Bundelkhand craton, Central India. J. Mineral. Petrol. Sci. 2006, 101, 199–217. [Google Scholar] [CrossRef]
- Balaram, V.; Singh, S.P.; Satyanarayanan, M.; Anjaiah, K.V. Platinum group elements geochemistry of ultramafic and associated rocks from Pindar in Madawara igneous complex, Bundelkhand massif, Central India. J. Earth System Sci. 2013, 122, 79–91. [Google Scholar] [CrossRef]
- Habtoor, M.A.; Ahmed, A.H.; Akizawa, N.; Harbi, H.; Arai, S. Chemical homogeneity of high-Cr chromitites as indicator for widespread invasion of boninitic melt in mantle peridotite of Bir Tuluha ophiolite, Northern Arabian Shield. Saudi Arabia. Ore Geol Rev. 2017, 90, 243–259. [Google Scholar] [CrossRef]
- Ahmed, A.H.; Arai, S.; Attia, A.K. Petrological characteristics of the Pan African podiform chromitites and associated peridotites of the Proterozoic ophiolite complexes, Egypt. Miner. Depos. 2001, 36, 72–84. [Google Scholar] [CrossRef]


| Species | Katpal | Kaliapani | |||||||||
|---|---|---|---|---|---|---|---|---|---|---|---|
| 1A | 3A | 5A | 2A | 4A | 8-11A | 12-13A | X2A | 21A | 7A | X4A | |
| Main-element oxide contents in weight percent (wt%) | |||||||||||
| SiO2 | 42.14 | 42.31 | 44.76 | 46.44 | 54.31 | 37.83 | 40.06 | 40.26 | 47.5 | 50.21 | 53.79 |
| TiO2 | 0.12 | 0.1 | 0.06 | 0.02 | 0.1 | 0.02 | 0.01 | 0.01 | 0.02 | 0.02 | 0.03 |
| Al2O3 | 3.23 | 3.08 | 1.86 | 1.1 | 3.11 | 1.13 | 0.74 | 0.79 | 1.22 | 0.92 | 1.16 |
| Fe2O3T | 5.12 | 8.84 | 3.24 | 10.94 | 4.23 | 8.15 | 10.56 | 10.08 | 9.4 | 8.21 | 8.07 |
| MnO | 0.09 | 0.09 | 0.06 | 0.09 | 0.07 | 0.09 | 0.1 | 0.09 | 0.1 | 0.1 | 0.11 |
| MgO | 41.33 | 41.41 | 44.41 | 39.79 | 32.32 | 47.94 | 47.48 | 47.36 | 39.42 | 37.87 | 34.54 |
| CaO | 0.2 | 0.05 | 0.04 | 0.2 | 3.85 | 0.05 | 0.1 | 0.15 | 0.55 | 0.28 | 0.69 |
| K2O | n.d. | n.d. | n.d. | n.d. | n.d. | n.d. | n.d. | n.d. | 0.01 | n.d. | n.d. |
| Na2O | 0.16 | 0.15 | 0.15 | 0.15 | 0.15 | 0.17 | 0.17 | 0.16 | 0.18 | 0.16 | 0.18 |
| P2O5 | 0.03 | 0.03 | 0.03 | 0.02 | 0.03 | 0.03 | 0.03 | 0.02 | 0.03 | 0.03 | 0.03 |
| Cr2O3 | 7.29 | 3.01 | 4.27 | 1.05 | 1.05 | 4.59 | 0.75 | 0.8 | 1.16 | 1.08 | 1.1 |
| NiO | 0.13 | 0.09 | 0.7 | 0.04 | n.d. | n.d. | n.d. | 0.01 | n.d. | 0.91 | n.d. |
| LOI | 9.92 | 10.7 | 11.78 | 11.65 | 4.69 | 12.28 | 13.01 | 13.81 | 12.64 | 11.12 | 3.61 |
| Analytical sum | 109.76 | 109.85 | 111.37 | 111.47 | 103.91 | 112.29 | 113 | 113.55 | 112.22 | 110.9 | 103.3 |
| Trace-element contents in parts per million (ppm, μg·g−1) | |||||||||||
| Cr | 58,799 | 28,159 | 26,785 | 7166 | 5492 | 18,778 | 3719 | 6370 | 5242 | 4140 | 905.4 |
| Co | 100.87 | 122.64 | 58.21 | 116.56 | 48.69 | 110.57 | 149.7 | 123.57 | 99.7 | 89.16 | 18.66 |
| Ni | 1660 | 1627 | 2311 | 1334 | 832 | 2225 | 2790 | 1947 | 1124 | 2759 | 193.81 |
| Rb | 1.93 | 1.4 | 7.75 | 0.98 | 1.23 | 27.31 | 45.94 | 10.92 | 8.71 | 27.27 | 3.58 |
| Sr | 11.98 | 4.22 | 204.83 | 3.74 | 7.05 | 188.04 | 257.42 | 227.53 | 127.73 | 227.41 | 20.44 |
| Cs | 0.13 | 0.1 | 0.17 | 0.08 | 0.13 | 0.84 | 1.4 | 0.25 | 0.09 | 0.45 | 0.06 |
| Ba | 11.84 | 20.06 | 65.28 | 9.77 | 7.13 | 60.19 | 87.67 | 64.07 | 42.36 | 92.12 | 16.33 |
| Sc | 9.91 | 9.31 | 7.4 | 8.69 | 15.68 | 7.09 | 8.5 | 4.77 | 7.14 | 7.38 | 2.31 |
| V | 150.57 | 104.95 | 94.55 | 49.87 | 85.34 | 104.25 | 73.54 | 41.88 | 32.94 | 39.33 | 10.05 |
| Ta | 0.02 | 0.02 | 0.01 | 0 | 0.07 | 0.02 | 0.01 | 0.01 | 0.01 | 0.01 | 0.02 |
| Nb | 0.15 | 0.14 | 0.14 | 0.08 | 0.53 | 0.12 | 0.1 | 0.07 | 0.04 | 0.07 | 0.57 |
| Zr | 7.07 | 5.9 | 2.99 | 1.75 | 4.85 | 6.16 | 5.65 | 0.96 | 0.6 | 1.27 | 2.23 |
| Hf | 0.16 | 0.14 | 0.07 | 0.04 | 0.12 | 0.15 | 0.13 | 0.02 | 0.01 | 0.03 | 0.04 |
| Th | 0.25 | 0.19 | 0.55 | 0.09 | 0.25 | 1.72 | 1.66 | 0.27 | 0.09 | 0.26 | 1.02 |
| U | 0.73 | 0.11 | 5.43 | 0.08 | 0.12 | 6.03 | 5.94 | 5.84 | 2.19 | 3.27 | 3.06 |
| Y | 3.36 | 1.46 | 4.77 | 0.77 | 5.1 | 9.48 | 10.84 | 2.43 | 0.89 | 6.14 | 1.96 |
| Rrare-earth element (REE) contents in parts per million (ppm, μg·g−1) | |||||||||||
| La | 1.19 | 0.52 | 3.92 | 0.56 | 0.56 | 16.25 | 19.16 | 4.04 | 1.07 | 4.69 | 2.93 |
| Ce | 2.63 | 1.09 | 8.05 | 0.63 | 1.48 | 34.98 | 40.49 | 8.19 | 1.87 | 7.4 | 6.59 |
| Pr | 0.34 | 0.14 | 1.05 | 0.13 | 0.24 | 4.65 | 5.29 | 1.07 | 0.25 | 1.17 | 0.73 |
| Nd | 1.39 | 0.58 | 4.23 | 0.49 | 1.28 | 18.82 | 21.24 | 4.29 | 0.95 | 4.66 | 2.93 |
| Sm | 0.34 | 0.14 | 0.93 | 0.11 | 0.44 | 3.75 | 4.19 | 0.82 | 0.19 | 1.05 | 0.56 |
| Eu | 0.09 | 0.03 | 0.19 | 0.03 | 0.12 | 0.72 | 0.75 | 0.16 | 0.05 | 0.25 | 0.12 |
| Gd | 0.47 | 0.21 | 0.9 | 0.14 | 0.66 | 2.99 | 3.42 | 0.7 | 0.16 | 1.11 | 0.45 |
| Tb | 0.08 | 0.03 | 0.15 | 0.02 | 0.13 | 0.42 | 0.47 | 0.09 | 0.02 | 0.18 | 0.04 |
| Dy | 0.57 | 0.22 | 0.83 | 0.16 | 0.87 | 1.94 | 2.23 | 0.45 | 0.13 | 1 | 0.25 |
| Ho | 0.13 | 0.05 | 0.17 | 0.03 | 0.19 | 0.36 | 0.43 | 0.09 | 0.03 | 0.21 | 0.05 |
| Er | 0.39 | 0.16 | 0.5 | 0.1 | 0.55 | 0.93 | 1.07 | 0.24 | 0.08 | 0.57 | 0.13 |
| Tm | 0.06 | 0.03 | 0.08 | 0.02 | 0.08 | 0.12 | 0.14 | 0.04 | 0.01 | 0.08 | 0.01 |
| Yb | 0.4 | 0.2 | 0.44 | 0.12 | 0.5 | 0.66 | 0.75 | 0.18 | 0.08 | 0.45 | 0.15 |
| Lu | 0.06 | 0.03 | 0.07 | 0.02 | 0.07 | 0.09 | 0.11 | 0.03 | 0.02 | 0.07 | 0.01 |
| Cu | 15.37 | 8.29 | 46.31 | 5.96 | 6.11 | 120.61 | 144.75 | 54.06 | 32.87 | 62.57 | 120.67 |
| Zn | 80.2 | 71.85 | 396.68 | 48.24 | 42.82 | 355.11 | 755.22 | 221.36 | 337.46 | 574.29 | 759.94 |
| Pb | 22.16 | 11.03 | 24.16 | 8.3 | 5.73 | 32.54 | 38.86 | 16.01 | 13.99 | 23.94 | 9.96 |
| Calculated values and element (oxide) ratios | |||||||||||
| Mg# | 88.99 | 82.41 | 93.2 | 78.43 | 88.42 | 85.46 | 81.81 | 82.46 | 80.75 | 82.19 | 81.07 |
| Al2O3/TiO2 | 27.01 | 30.21 | 30.88 | 64.47 | 31.69 | 49.32 | 74.06 | 66 | 56.48 | 54.94 | 35.97 |
| CaO/TiO2 | 1.66 | 0.47 | 0.58 | 11.59 | 39.29 | 2.32 | 9.84 | 12.17 | 25.14 | 17 | 21.36 |
| CaO/Al2O3 | 0.06 | 0.02 | 0.02 | 0.18 | 1.24 | 0.05 | 0.13 | 0.18 | 0.45 | 0.31 | 0.59 |
| Ti/Sc | 72.33 | 65.65 | 48.9 | 11.73 | 37.47 | 19.44 | 7.14 | 15.09 | 18.18 | 13.53 | 83.72 |
| Ti/V | 4.76 | 5.83 | 3.83 | 2.04 | 6.88 | 1.32 | 0.83 | 1.72 | 3.94 | 2.54 | 19.23 |
| Ti/Zr | 101.37 | 86.47 | 51.18 | 14.41 | 83.08 | 19.48 | 8.48 | 10.17 | 18.37 | 14.12 | 27.33 |
| (La/Yb)CN | 3.12 | 0.93 | 5.5 | 2.08 | 2.5 | 7.08 | 3.11 | 15.49 | 17.46 | 16.7 | 1.13 |
| (La/Sm)CN | 2.51 | 0.8 | 3.3 | 2.3 | 2.21 | 2.79 | 2.4 | 3.09 | 2.86 | 2.71 | 2.51 |
| (Gd/Yb)CN | 0.96 | 0.84 | 1.64 | 0.95 | 1.07 | 3.66 | 3.71 | 3.2 | 1.69 | 1.98 | 2.43 |
| (Ce/Yb)CN | 1.74 | 1.44 | 4.79 | 1.39 | 0.77 | 13.9 | 14.27 | 12.13 | 6.22 | 4.31 | 11.61 |
| (Tb/Yb)CN | 0.93 | 0.75 | 1.47 | 0.87 | 1.11 | 2.81 | 2.84 | 2.36 | 1.33 | 1.82 | 1.26 |
| (Sm/Yb)CN | 0.92 | 0.76 | 2.3 | 1.02 | 0.95 | 6.18 | 6.12 | 5.01 | 2.66 | 2.54 | 4.1 |
| Ti/1000 | 0.72 | 0.61 | 0.36 | 0.1 | 0.59 | 0.14 | 0.06 | 0.07 | 0.13 | 0.1 | 0.19 |
| Th/Ce | 0.09 | 0.17 | 0.07 | 0.14 | 0.17 | 0.05 | 0.04 | 0.03 | 0.05 | 0.04 | 0.15 |
| La/Yb | 2.99 | 2.6 | 8.88 | 4.75 | 1.11 | 24.59 | 25.7 | 22.81 | 13.52 | 10.42 | 19.63 |
| Dy/Yb | 1.44 | 1.11 | 1.87 | 1.32 | 1.73 | 2.93 | 2.99 | 2.55 | 1.62 | 2.21 | 1.66 |
| Nb/Zr | 0.02 | 0.02 | 0.05 | 0.05 | 0.11 | 0.02 | 0.02 | 0.07 | 0.07 | 0.06 | 0.26 |
| Th/Zr | 0.04 | 0.03 | 0.19 | 0.05 | 0.05 | 0.28 | 0.29 | 0.28 | 0.15 | 0.21 | 0.46 |
| Nb/Y | 0.05 | 0.1 | 0.03 | 0.1 | 0.1 | 0.01 | 0.01 | 0.03 | 0.05 | 0.01 | 0.29 |
| Rb/Y | 0.57 | 0.96 | 1.62 | 1.26 | 0.24 | 2.88 | 4.24 | 4.5 | 9.83 | 4.44 | 1.83 |
| Sc/Y | 2.95 | 6.39 | 1.55 | 11.23 | 3.07 | 0.75 | 0.78 | 1.97 | 8.06 | 1.2 | 1.18 |
| Zr/Hf | 43.11 | 41.51 | 45.13 | 39.81 | 40.16 | 42.4 | 44.89 | 51.42 | 55.19 | 45.29 | 55.24 |
| U/Th | 2.98 | 0.59 | 9.84 | 0.93 | 0.48 | 3.5 | 3.59 | 21.65 | 23.92 | 12.41 | 3.01 |
| Eu/Eu* | 0.71 | 0.58 | 0.62 | 0.81 | 0.68 | 0.65 | 0.6 | 0.65 | 0.78 | 0.71 | 0.75 |
| (Th/Yb)PM | 3.41 | 5.23 | 6.93 | 4.05 | 2.73 | 14.45 | 12.34 | 8.43 | 6.44 | 3.25 | 37.78 |
| (Th/Eu)PM | 5.08 | 11.21 | 5.79 | 5.08 | 3.96 | 4.67 | 4.3 | 3.24 | 3.9 | 2.02 | 15.88 |
| (Eu/Yb)PM | 0.67 | 0.47 | 1.2 | 0.8 | 0.69 | 3.1 | 2.87 | 2.6 | 1.65 | 1.61 | 2.38 |
| (Nb/Nb*)PM | 0.1 | 0.16 | 0.03 | 0.13 | 0.49 | 0.01 | 0.01 | 0.02 | 0.05 | 0.02 | 0.11 |
| (Ta/Ta*)PM | 0.22 | 0.35 | 0.04 | 0.12 | 1.17 | 0.02 | 0.01 | 0.07 | 0.11 | 0.03 | 0.06 |
| (Zr/Zr*)PM | 0.7 | 1.41 | 0.1 | 0.51 | 0.44 | 0.05 | 0.04 | 0.03 | 0.1 | 0.04 | 0.12 |
| (Hf/Hf*)PM | 0.6 | 1.26 | 0.08 | 0.47 | 0.4 | 0.04 | 0.03 | 0.03 | 0.06 | 0.03 | 0.08 |
| (Ti/Ti*)PM | 0.71 | 1.49 | 0.16 | 0.34 | 0.42 | 0.02 | 0.01 | 0.04 | 0.32 | 0.04 | 0.21 |
| LLD% | X7-1 | X7-5 | X6-10 | X6-13 | X2-11 | X2-9 | X5U-13 | X9-3 | X5U-15 | X2-7 | X9-10 | |
|---|---|---|---|---|---|---|---|---|---|---|---|---|
| Main-element oxide contents in weight percent (wt%) | ||||||||||||
| SiO2 | <0.07 | 40.93 | 41.42 | 41.30 | 41.07 | 41.88 | 41.54 | 40.89 | 41.17 | 41.01 | 41.87 | 40.89 |
| Al2O3 | <0.05 | n.d. | n.d. | n.d. | n.d. | n.d. | n.d. | 0.05 | 0.05 | n.d. | n.d. | n.d. |
| Fe2O3 | 0.84 | 0.63 | 0.92 | 0.97 | 0.97 | 0.96 | 0.93 | 0.88 | 0.84 | 0.99 | 0.94 | |
| FeO | <0.22 | 6.80 | 5.11 | 7.46 | 7.87 | 7.83 | 7.81 | 7.52 | 7.14 | 6.79 | 8.00 | 7.60 |
| MgO | <0.06 | 49.70 | 51.40 | 49.86 | 49.57 | 49.97 | 49.61 | 49.16 | 49.40 | 49.98 | 50.26 | 48.96 |
| MnO | <0.24 | n.d. | n.d. | n.d. | n.d. | 0.24 | n.d. | n.d. | 0.31 | n.d. | n.d. | n.d. |
| NiO | <0.04 | 0.40 | 0.44 | 0.19 | 0.24 | 0.11 | 0.25 | 0.23 | 0.49 | 0.40 | 0.13 | 0.23 |
| CaO | <0.05 | 0.09 | 0.07 | 0.15 | 0.11 | 0.09 | 0.03 | 0.17 | 0.11 | 0.12 | 0.03 | 0.10 |
| Analytical sum | 98.76 | 99.07 | 99.88 | 99.83 | 101.09 | 100.21 | 98.95 | 99.55 | 99.13 | 101.28 | 98.71 | |
| Numbers of cations in atoms per formula unit (apfu) on the basis of 4O | ||||||||||||
| Mg | 1.817 | 1.858 | 1.808 | 1.802 | 1.792 | 1.792 | 1.801 | 1.799 | 1.821 | 1.797 | 1.797 | |
| Fe2+ | 0.14 | 0.104 | 0.152 | 0.16 | 0.157 | 0.158 | 0.155 | 0.146 | 0.139 | 0.161 | 0.156 | |
| Ca | 0.002 | 0.002 | 0.004 | 0.003 | 0.002 | 0.001 | 0.004 | 0.003 | 0.003 | 0.001 | 0.002 | |
| Mn | n.d. | n.d. | n.d. | n.d. | 0.005 | n.d. | n.d. | 0.006 | n.d. | n.d. | n.d. | |
| Ni | 0.008 | 0.009 | 0.004 | 0.005 | 0.002 | 0.005 | 0.005 | 0.01 | 0.008 | 0.003 | 0.005 | |
| Al | n.d. | n.d. | n.d. | n.d. | n.d. | n.d. | 0.001 | 0.001 | n.d. | n.d. | n.d. | |
| Fe3+ | 0.015 | 0.012 | 0.017 | 0.018 | 0.017 | 0.018 | 0.017 | 0.016 | 0.015 | 0.018 | 0.017 | |
| Σ | 1.982 | 1.985 | 1.985 | 1.988 | 1.975 | 1.974 | 1.983 | 1.981 | 1.986 | 1.98 | 1.977 | |
| Si | 1.004 | 1.004 | 1.005 | 1.002 | 1.007 | 1.007 | 1.005 | 1.006 | 1.002 | 1.004 | 1.007 | |
| Σ | 1.004 | 1.004 | 1.005 | 1.002 | 1.007 | 1.007 | 1.005 | 1.006 | 1.002 | 1.004 | 1.007 | |
| Calculated values | ||||||||||||
| Mg# | 0.929 | 0.947 | 0.923 | 0.918 | 0.919 | 0.919 | 0.921 | 0.925 | 0.929 | 0.918 | 0.92 | |
| Forsterite | 92.14 | 94.16 | 91.47 | 91 | 91.1 | 91.06 | 91.29 | 91.74 | 92.2 | 90.97 | 91.18 | |
| LLD% | X1-16 | X2-20 | X3-27 | X4-16 | X5-26 | A-17 | B-22 | C-31 | D-39 | |
|---|---|---|---|---|---|---|---|---|---|---|
| Main-element oxide contents in weight percent (wt%) | ||||||||||
| SiO2 | <0.07 | 57.72 | 58.07 | 57.56 | 57.72 | 57.59 | 58.41 | 57.88 | 58.18 | 58.19 |
| TiO2 | <0.05 | n.d. | n.d. | n.d. | n.d. | n.d. | n.d. | n.d. | n.d. | 0.06 |
| Al2O3 | <0.05 | 0.71 | 0.75 | 0.8 | 0.71 | 0.68 | 0.7 | 0.69 | 0.73 | 0.72 |
| Cr2O3 | <0.04 | 0.64 | 0.67 | 0.51 | 0.64 | 0.58 | 0.56 | 0.54 | 0.59 | 0.56 |
| Fe2O3 | n.d. | n.d. | 0.461 | 0.767 | n.d. | n.d. | n.d. | n.d. | n.d. | |
| FeO | <0.22 | 5.52 | 5.56 | 5.425 | 4.831 | 5.68 | 5.43 | 5.41 | 5.31 | 5.46 |
| MgO | <0.06 | 34.52 | 34.34 | 34.82 | 34.52 | 34.48 | 34.12 | 34.41 | 34.1 | 34.49 |
| MnO | <0.24 | 0.3 | n.d. | n.d. | 0.3 | n.d. | n.d. | n.d. | n.d. | n.d. |
| NiO | <0.04 | n.d. | n.d. | 0.18 | n.d. | 0.09 | n.d. | n.d. | n.d. | n.d. |
| Na2O | <0.06 | n.d. | n.d. | n.d. | n.d. | 0.06 | n.d. | n.d. | n.d. | n.d. |
| CaO | <0.05 | 0.6 | 0.68 | 0.65 | 0.6 | 0.62 | 0.75 | 0.76 | 0.76 | 0.69 |
| Analytical sum | 100.01 | 100.07 | 100.41 | 100.09 | 99.78 | 99.97 | 99.69 | 99.67 | 100.17 | |
| Numbers of cations in atoms per formula unit (apfu) on the basis of 6O | ||||||||||
| Si | - | 1.985 | 1.991 | 1.972 | 1.989 | 1.984 | 2.003 | 1.99 | 1.999 | 1.993 |
| AlIV | - | 0.015 | 0.009 | 0.028 | 0.011 | 0.016 | 0 | 0.01 | 0.001 | 0.029 |
| Σ | 2 | 2 | 2 | 2 | 2 | 2.003 | 2 | 2 | 2 | |
| AlVI | - | 0.014 | 0.021 | 0.004 | 0.018 | 0.012 | 0.028 | 0.018 | 0.029 | 0.022 |
| Cr | - | 0.017 | 0.018 | 0.014 | 0.017 | 0.016 | 0.015 | 0.015 | 0.016 | 0.015 |
| Ni | - | n.d. | n.d. | 0.005 | n.d. | 0.002 | n.d. | n.d. | n.d. | n.d. |
| Fe3+ | - | n.d. | n.d. | 0.012 | 0.02 | n.d. | n.d. | n.d. | n.d. | n.d. |
| Ti | - | n.d. | n.d. | n.d. | n.d. | n.d. | n.d. | n.d. | n.d. | 0.002 |
| Mg | - | 1.769 | 1.755 | 1.778 | 1.773 | 1.771 | 1.744 | 1.764 | 1.746 | 1.761 |
| Fe2+ | - | 0.159 | 0.159 | 0.155 | 0.139 | 0.164 | 0.156 | 0.156 | 0.153 | 0.156 |
| Mn | - | 0.009 | n.d. | n.d. | 0.009 | n.d. | n.d. | n.d. | n.d. | n.d. |
| Ca | - | 0.022 | 0.025 | 0.024 | 0.021 | 0.023 | 0.028 | 0.028 | 0.028 | 0.025 |
| Na | - | n.d. | n.d. | n.d. | n.d. | 0.004 | n.d. | n.d. | n.d. | n.d. |
| Σ | 1.99 | 1.978 | 1.992 | 1.997 | 1.992 | 1.971 | 1.981 | 1.972 | 1.981 | |
| Calculated values | ||||||||||
| Mg# | - | 0.918 | 0.917 | 0.92 | 0.927 | 0.915 | 0.918 | 0.919 | 0.92 | 0.918 |
| Cr# | - | 0.377 | 0.375 | 0.3 | 0.377 | 0.364 | 0.349 | 0.344 | 0.352 | 0.343 |
| LLD% | X6-17 | X2-4 | X2-5 | X8-9 | X8-13 | X8-27 | X2-2 | X2-4 | X2-4/1 | X2-6/1 | X9-8 | X9-9 | |
|---|---|---|---|---|---|---|---|---|---|---|---|---|---|
| Main-element oxide contents in weight percent (wt%) | |||||||||||||
| SiO2 | <0.07 | n.d. | n.d. | n.d. | n.d. | n.d. | n.d. | n.d. | n.d. | n.d. | n.d. | 0.08 | 0.1 |
| TiO2 | <0.05 | 0.17 | 0.17 | 0.14 | 0.19 | 0.18 | 0.15 | 0.20 | 0.18 | 0.17 | 0.19 | 0.18 | 0.17 |
| Al2O3 | <0.05 | 8.92 | 15.30 | 15.12 | 12.13 | 12.04 | 12.36 | 13.15 | 13.57 | 15.14 | 13.68 | 14.50 | 14.51 |
| Cr2O3 | <0.04 | 60.45 | 55.33 | 55.15 | 57.50 | 57.92 | 58.63 | 55.57 | 55.44 | 55.22 | 54.24 | 55.17 | 54.90 |
| Fe2O3 | 2.84 | 0.25 | 0.95 | 1.90 | 1.22 | 0.31 | 2.24 | 1.93 | 0.88 | 3.38 | 1.19 | 0.86 | |
| FeO | <0.22 | 18.06 | 17.09 | 17.43 | 19.19 | 20.06 | 20.46 | 20.60 | 19.52 | 17.33 | 19.45 | 16.90 | 17.87 |
| MgO | <0.06 | 9.90 | 11.15 | 10.72 | 9.72 | 9.00 | 8.83 | 8.92 | 9.65 | 11.16 | 9.79 | 11.33 | 10.62 |
| MnO | <0.24 | 0.42 | n.d. | 0.30 | 0.35 | 0.47 | 0.39 | 0.37 | 0.29 | 0.34 | n.d. | 0.25 | 0.26 |
| NiO | <0.04 | 0.16 | 0.07 | n.d. | n.d. | 0.10 | 0.25 | n.d. | n.d. | n.d. | 0.08 | n.d. | n.d. |
| CaO | <0.05 | n.d. | n.d. | 0.05 | n.d. | n.d. | n.d. | n.d. | n.d. | n.d. | n.d. | n.d. | n.d. |
| Analytical sum | 100.92 | 99.37 | 99.86 | 100.98 | 100.98 | 101.37 | 101.05 | 100.58 | 100.24 | 100.81 | 99.52 | 99.19 | |
| Numbers of cations in atoms per formula unit (apfu) on the basis of 4O | |||||||||||||
| Si | - | n.d. | n.d. | n.d. | n.d. | n.d. | n.d. | n.d. | n.d. | n.d. | n.d. | 0.003 | 0.003 |
| Al | - | 0.347 | 0.58 | 0.573 | 0.465 | 0.464 | 0.475 | 0.505 | 0.519 | 0.571 | 0.521 | 0.551 | 0.555 |
| Cr | - | 1.575 | 1.407 | 1.403 | 1.479 | 1.498 | 1.51 | 1.43 | 1.423 | 1.396 | 1.386 | 1.406 | 1.409 |
| Fe3+ | - | 0.07 | 0.006 | 0.023 | 0.047 | 0.03 | 0.008 | 0.055 | 0.047 | 0.021 | 0.082 | 0.029 | 0.021 |
| Ti | - | 0.004 | 0.004 | 0.003 | 0.005 | 0.004 | 0.004 | 0.005 | 0.004 | 0.004 | 0.005 | 0.004 | 0.004 |
| Σ | 1.996 | 1.997 | 2.002 | 1.996 | 1.996 | 1.997 | 1.995 | 1.993 | 1.992 | 1.994 | 1.993 | 1.992 | |
| Mg | - | 0.487 | 0.535 | 0.514 | 0.471 | 0.439 | 0.429 | 0.433 | 0.467 | 0.532 | 0.472 | 0.545 | 0.514 |
| Fe2+ | - | 0.498 | 0.46 | 0.469 | 0.522 | 0.549 | 0.557 | 0.561 | 0.53 | 0.464 | 0.526 | 0.456 | 0.485 |
| Ni | - | 0.004 | 0.002 | n.d. | n.d. | 0.003 | 0.007 | n.d. | n.d. | n.d. | 0.002 | n.d. | n.d. |
| Mn | - | 0.012 | n.d. | 0.008 | 0.01 | 0.013 | 0.011 | 0.01 | 0.008 | 0.009 | n.d. | 0.007 | 0.007 |
| Ca | - | n.d. | n.d. | 0.002 | n.d. | n.d. | n.d. | n.d. | n.d. | n.d. | n.d. | n.d. | n.d. |
| Σ | 1.001 | 0.997 | 0.993 | 1.003 | 1.004 | 1.004 | 1.004 | 1.005 | 1.005 | 1 | 1.008 | 1.006 | |
| Calculated values | |||||||||||||
| Mg# | - | 0.494 | 0.538 | 0.523 | 0.474 | 0.444 | 0.435 | 0.436 | 0.468 | 0.534 | 0.473 | 0.544 | 0.514 |
| Cr# | - | 0.82 | 0.708 | 0.71 | 0.761 | 0.763 | 0.761 | 0.739 | 0.733 | 0.71 | 0.727 | 0.719 | 0.717 |
| Fe3+ ratio | - | 0.035 | 0.003 | 0.011 | 0.023 | 0.015 | 0.004 | 0.028 | 0.024 | 0.011 | 0.041 | 0.015 | 0.011 |
| (Al2O3)melt | - | 9.93 | 12.82 | 12.76 | 11.58 | 11.54 | 11.68 | 12.01 | 12.18 | 12.76 | 12.22 | 12.53 | 12.54 |
| (TiO2)melt | - | 0.27 | 0.27 | 0.23 | 0.30 | 0.29 | 0.25 | 0.31 | 0.29 | 0.27 | 0.30 | 0.29 | 0.27 |
| LLD% | 2A | 9 | 13 | 14 | 22 | 23 | 26 | 33 | 36 | 39 | 40 | 41 | 43 | |
|---|---|---|---|---|---|---|---|---|---|---|---|---|---|---|
| SiO2 | <0.07 | n.d. | n.d. | 0.09 | 0.07 | 0.1 | n.d. | n.d. | n.d. | 0.07 | n.d. | 0.09 | n.d. | n.d. |
| TiO2 | <0.05 | 0.25 | 0.21 | 0.29 | 0.19 | 0.27 | 0.30 | 0.27 | 0.21 | 0.20 | 0.16 | 0.24 | 0.21 | 0.24 |
| Al2O3 | <0.05 | 12.98 | 13.63 | 12.74 | 15.42 | 14.42 | 15.25 | 13.06 | 13.05 | 12.01 | 11.59 | 11.32 | 12.51 | 11.92 |
| Cr2O3 | <0.04 | 53.07 | 52.56 | 54.05 | 50.27 | 51.50 | 50.17 | 52.91 | 53.70 | 55.64 | 56.76 | 56.14 | 54.72 | 56.05 |
| Fe2O3 | 3.44 | 3.21 | 3.43 | 4.09 | 3.38 | 4.23 | 3.98 | 3.61 | 3.39 | 3.48 | 3.92 | 4.22 | 3.84 | |
| FeO | <0.22 | 21.40 | 21.17 | 21.66 | 21.26 | 21.31 | 21.44 | 21.12 | 18.23 | 18.22 | 17.94 | 17.52 | 18.18 | 18.12 |
| MgO | <0.06 | 8.19 | 8.40 | 8.18 | 8.40 | 8.21 | 8.44 | 8.24 | 10.09 | 10.21 | 9.78 | 10.24 | 10.36 | 9.88 |
| MnO | <0.24 | 0.41 | 0.29 | 0.51 | 0.58 | 0.56 | 0.38 | 0.44 | 0.36 | 0.30 | 0.47 | 0.24 | 0.40 | 0.29 |
| NiO | <0.04 | n.d. | n.d. | n.d. | n.d. | n.d. | n.d. | 0.12 | n.d. | n.d. | 0.09 | 0.09 | n.d. | 0.10 |
| Na2O | <0.06 | n.d. | n.d. | n.d. | n.d. | n.d. | n.d. | n.d. | n.d. | n.d. | 0.09 | 0.09 | n.d. | 0.10 |
| CaO | <0.05 | n.d. | n.d. | n.d. | n.d. | n.d. | n.d. | n.d. | n.d. | n.d. | n.d. | n.d. | n.d. | n.d. |
| Analytical sum | 99.74 | 99.47 | 100.86 | 100.22 | 99.64 | 100.21 | 100.13 | 99.25 | 99.97 | 100.36 | 99.80 | 100.60 | 100.54 | |
| Numbers of cations in atoms per formula unit (apfu) on the basis of 4O | ||||||||||||||
| Si | n.d. | n.d. | 0.003 | 0.002 | 0.003 | n.d. | n.d. | n.d. | 0.002 | n.d. | 0.003 | n.d. | n.d. | |
| Al | 0.507 | 0.531 | 0.493 | 0.592 | 0.559 | 0.587 | 0.508 | 0.505 | 0.463 | 0.447 | 0.438 | 0.479 | 0.459 | |
| Cr | 1.39 | 1.374 | 1.403 | 1.295 | 1.34 | 1.294 | 1.381 | 1.395 | 1.44 | 1.47 | 1.458 | 1.405 | 1.447 | |
| Fe3+ | 0.086 | 0.08 | 0.085 | 0.1 | 0.084 | 0.104 | 0.099 | 0.089 | 0.084 | 0.086 | 0.097 | 0.103 | 0.094 | |
| Ti | 0.006 | 0.005 | 0.007 | 0.005 | 0.007 | 0.007 | 0.007 | 0.005 | 0.005 | 0.004 | 0.006 | 0.005 | 0.006 | |
| Σ | 1.989 | 1.99 | 1.991 | 1.994 | 1.993 | 1.992 | 1.995 | 1.994 | 1.994 | 2.007 | 2.002 | 1.992 | 2.006 | |
| Mg | 0.405 | 0.414 | 0.4 | 0.408 | 0.403 | 0.411 | 0.405 | 0.494 | 0.498 | 0.478 | 0.502 | 0.502 | 0.481 | |
| Fe2+ | 0.593 | 0.585 | 0.595 | 0.58 | 0.587 | 0.585 | 0.583 | 0.501 | 0.499 | 0.491 | 0.481 | 0.494 | 0.495 | |
| Ni | n.d. | n.d. | n.d. | n.d. | n.d. | n.d. | 0.003 | n.d. | n.d. | 0.002 | 0.002 | n.d. | 0.003 | |
| Mn | 0.012 | 0.008 | 0.014 | 0.016 | 0.016 | 0.011 | 0.012 | 0.01 | 0.008 | 0.013 | 0.007 | 0.011 | 0.008 | |
| Ca | 0 | 0 | 0 | 0 | 0 | 0 | 0 | 0 | 0 | 0 | 0 | 0 | 0 | |
| Na | n.d. | n.d. | n.d. | n.d. | n.d. | n.d. | n.d. | n.d. | n.d. | 0.006 | 0.006 | n.d. | 0.006 | |
| Σ | 1.01 | 1.007 | 1.009 | 1.004 | 1.006 | 1.007 | 1.003 | 1.005 | 1.005 | 0.99 | 0.998 | 1.007 | 0.993 | |
| Calculated values | ||||||||||||||
| Mg# | 0.405 | 0.414 | 0.402 | 0.413 | 0.407 | 0.412 | 0.410 | 0.497 | 0.500 | 0.493 | 0.510 | 0.504 | 0.493 | |
| Cr# | 0.733 | 0.721 | 0.740 | 0.686 | 0.706 | 0.688 | 0.731 | 0.734 | 0.757 | 0.767 | 0.769 | 0.746 | 0.759 | |
| Fe+3-ratio | 0.043 | 0.040 | 0.043 | 0.050 | 0.042 | 0.052 | 0.050 | 0.045 | 0.042 | 0.043 | 0.049 | 0.052 | 0.047 | |
| (Al2O3)melt | 11.94 | 12.20 | 11.84 | 12.86 | 12.50 | 12.80 | 11.97 | 11.97 | 11.52 | 11.33 | 11.21 | 11.74 | 11.48 | |
| (TiO2)melt | 0.38 | 0.33 | 0.43 | 0.30 | 0.40 | 0.44 | 0.40 | 0.33 | 0.31 | 0.26 | 0.36 | 0.33 | 0.36 | |
Disclaimer/Publisher’s Note: The statements, opinions and data contained in all publications are solely those of the individual author(s) and contributor(s) and not of MDPI and/or the editor(s). MDPI and/or the editor(s) disclaim responsibility for any injury to people or property resulting from any ideas, methods, instructions or products referred to in the content. |
© 2023 by the authors. Licensee MDPI, Basel, Switzerland. This article is an open access article distributed under the terms and conditions of the Creative Commons Attribution (CC BY) license (https://creativecommons.org/licenses/by/4.0/).
Share and Cite
Nayak, D.; Das, P.; Misra, S. Petrology and Geochemistry of Mesoarchean Sukinda Ultramafics, Southern Singhbhum Odisha Craton, India: Implications for Mantle Resources and the Geodynamic Setting. Minerals 2023, 13, 1440. https://doi.org/10.3390/min13111440
Nayak D, Das P, Misra S. Petrology and Geochemistry of Mesoarchean Sukinda Ultramafics, Southern Singhbhum Odisha Craton, India: Implications for Mantle Resources and the Geodynamic Setting. Minerals. 2023; 13(11):1440. https://doi.org/10.3390/min13111440
Chicago/Turabian StyleNayak, Debajyoti, Pranab Das, and Sagar Misra. 2023. "Petrology and Geochemistry of Mesoarchean Sukinda Ultramafics, Southern Singhbhum Odisha Craton, India: Implications for Mantle Resources and the Geodynamic Setting" Minerals 13, no. 11: 1440. https://doi.org/10.3390/min13111440