Effects of Short-Term Acidification on the Adsorption of Dissolved Organic Matter by Soil Minerals and Its Mechanism of Action


1
The Key Laboratory for Silviculture and Conservation of Ministry of Education, College of Forestry, Beijing Forestry University, Beijing 100083, China
2
Ordos Branch Station, Inner Mongolia Autonomous Region Environmental Monitoring General Station, Ordos 017000, China
*
Author to whom correspondence should be addressed.
Minerals 2023, 13(11), 1448; https://doi.org/10.3390/min13111448
Submission received: 25 September 2023
/
Revised: 1 November 2023
/
Accepted: 15 November 2023
/
Published: 17 November 2023
(This article belongs to the Section Environmental Mineralogy and Biogeochemistry)
Abstract
:In order to investigate the impact of soil acidification on the adsorption of dissolved organic matter by soil minerals and understand its mechanism, this study selected commonly found minerals in soils, namely illite, kaolin, and hematite, as the research objects. Glucose and tannic acid were considered as the representative compounds for studying the adsorption of dissolved organic matter in soils. By analyzing the effects of the three minerals on the adsorption characteristics of glucose and tannic acid after a short-term acidification treatment, this study aimed to explore the underlying mechanism. To achieve this, scanning electron microscopy and a specific surface area analyzer were utilized. The results of this study indicate that the adsorption modes of the minerals studied were unaffected by short-term acidification. Chemisorption, as well as surface and mesopore diffusion, were found to dominate the adsorption process. In terms of adsorption behavior, the minerals exhibited multilayer inhomogeneous adsorption with glucose and kaolin, while tannic acid showed monolayer adsorption with illite and hematite. When exposed to the same acidification conditions, the saturated adsorption of glucose and tannic acid was found to be illite ≥ hematite > kaolin. The kinetic adsorption processes exhibited three stages: fast adsorption, slow adsorption, and adsorption equilibrium. Interestingly, as the intensity of the acidification increased, the saturated adsorption capacity generally followed the trend of S3 (test minerals with pH adjusted to 3 value) > S5 (test minerals with pH adjusted to 5 value) > CK (the control group). The acidification-induced solvation led to an increase in the specific surface area and the number of active adsorption sites on the minerals. Additionally, the protonation reaction triggered a change in the surface charge, which in turn affected the hydrogen bonding, ligand exchange, and charge transfer between the minerals and glucose and tannic acids. These interactions ultimately enhanced the adsorption capacity.
1. Introduction
Dissolved organic matter (DOM) plays a crucial role in soil organic matter, influencing the migration and transformation of both organic and inorganic pollutants, as well as the bioavailability of essential nutrients like carbon, nitrogen, and phosphorus. It also has significant effects on mineral weathering, soil formation, microbial growth and metabolism, and the decomposition process of soil organic matter [1,2]. Glucose and tannic acid are essential components of DOM. Glucose is one of the most widely distributed and important monosaccharides in nature, as well as an energy source and intermediate product of metabolism in biological cells [3]. Tannins are naturally occurring plant polyphenols consisting of a glucose kernel linking multiple gallic acid dimers through an ester bond, which is cycled into the soil through plant metabolism. These two different types of organic matter are widely involved in various physical and chemical processes in the soil and play a crucial role in the soil ecosystem [4]. Soil organic carbon can form complexes with soil minerals, which helps protect it from degradation and contributes to its sequestration. Schmidt et al. [5] suggested that metal oxides and clay minerals interacting with soil organic carbon have important effects on soil organic carbon stability. Klaus et al. [6] found that the formation of mineral-bound organic carbon following the adsorption of soil minerals and organic carbon was the most persistent protective mechanism. Metal oxides and laminated silicate minerals (clay minerals) that have particle diameters of less than 2 μm are the primary soil minerals responsible for the absorption of organic carbon and have a higher potential for carbon sequestration [6,7,8].
Soil acidification has a significant impact on the transformation, structure, and adsorption behavior of clay minerals in soil. Severe soil acidification can accelerate the conversion of 2:1 clay minerals to 1:1 type [9,10]. The pH of the soil plays a crucial role in determining the surface charge and adsorption sites of minerals [11], and different minerals exhibit varying responses to changes in the pH. The pH conditions influence the particle size of minerals and trigger alterations in the surface properties of clay minerals and iron oxides, thereby affecting their ability to adsorb dissolved organic matter [12,13]. Most studies examining the effects of acidification on the adsorption behavior of organic matter focus on acidified soils. These results provide a comprehensive understanding of the multifactorial nature of soil, including the impacts of clay minerals, iron oxides, clusters, and microorganisms. However, there is a research gap on the specific response mechanisms of each factor to acidification. Clay minerals and iron oxides are essential adsorbents for dissolved organic matter, and the modifications in their characteristics under different acidification conditions, as well as their potential influence on the adsorption capacity and mode of organic matter, require further investigation and elucidation. This knowledge gap limits our understanding and control over the relationship between soil organic carbon and clay minerals and iron oxides. Therefore, a comprehensive exploration of the effects of various acidification conditions on the interaction mechanism between soil minerals and dissolved organic matter has become a very important but highly lacking research topic, which is crucial for gaining a profound understanding of the dynamic behavior and properties of organic matter in the environment.
In this study, glucose and tannic acid were selected as representative compounds of dissolved organic matter, while illite, kaolin, and hematite were chosen as the research subjects. The primary objective was to analyze the impact of different acidification intensities on the characteristics of these minerals. The study employed isothermal adsorption, kinetic adsorption, and various adsorption model fittings to investigate the adsorption modes, adsorption processes, and underlying mechanisms of glucose and tannic acid under different acidification conditions. The findings could serve as a theoretical foundation for future investigations into the mechanism of mineral stabilization of soil organic carbon and its influencing factors.
2. Materials and Methods
2.1. Test Materials
The minerals, including Illite, kaolin, and hematite, were all obtained from Shanlinshiyu Mineral Products Co., Ltd. (Guzhang county, China). Glucose and tannic acid were purchased from Shanghai McLean Reagent Co., Ltd. (Shanghai, China). Both compounds were of analytical purity (≥99.7%). The samples were analyzed using a Bruker X-ray diffractometer (Bruker D8 ADVANCE (Beijing, China)) to verify their single physical phase and adherence to the standard spectrum. The analysis confirmed that the samples exhibited sharp peaks, good crystallinity, and high purity, as shown in Figure 1.
2.2. Mineral Acidification Culture
In the experiment, 10 g of the test minerals (illite, kaolin, and hematite) was weighed and separately placed in 50 mL culture flasks. The pH of each flask was adjusted to 3 and 5 value using 1 mol/L H2SO4. These two pH-adjusted samples were labeled as S3 and S5, respectively. For the control group (CK), the same volume of deionized water (about 25 mL) was added to the culture flask. All the culture flasks were then sealed and kept at a temperature of 25 °C for a duration of 30 days. After the incubation period, the samples were dried at 40 °C and subsequently ground through a 300-mesh sieve (pore size of about 48 µm) for preservation. Three replicates were set for each treatment, ensuring the reliability and consistency of the experimental data.
2.3. Isothermal Adsorption and Adsorption Kinetic Tests
2.3.1. Isothermal Adsorption Test
For the acidified test minerals (S3 and S5), a weight of 0.10 g was measured and placed in 50 mL centrifuge tubes. Subsequently, 10 mL of deionized water and different concentrations of glucose solution (or tannic acid solution) were added to the tubes. The concentrations of the glucose and tannic acid solutions used were 0, 100, 150, 200, 250, 300, 400 mg/L for both solutions. The mixtures were then oscillated on a thermostatic oscillator at a speed of 200 revolutions per minute for a duration of 24 h. Following the incubation period, the samples underwent centrifugation at a speed of 3000 revolutions per minute for 15 min. The resulting supernatant was immediately filtered through a 0.45 μm microporous filter membrane. The concentration of glucose in the filtrate was determined using a total organic carbon (TOC) analyzer, while the concentration of tannic acid was determined using a UV spectrophotometer (a full sweep was performed in the wavelength range of 200–800 nm, and the UV absorption peak of tannic acid was found to be at 276 nm based on the spectrum.). The experimental temperature was maintained at 298 K.
2.3.2. Adsorption Kinetic Test
The acidified test minerals (S3 and S5) were weighed at 0.50 g and placed in 250 mL brown bottles. To each bottle, 100 mL of deionized water and 400 mg/L glucose solution (or 100 mg/L tannic acid solution) were added. At specific time intervals of 0, 0.5, 1, 3, 6, 12, and 24 h (and 1 min, 5 min, 10 min, 20 min, 30 min, 40 min, 1 h, 1.5 h, and 2 h for tannic acid), 20 mL of the suspension was extracted and transferred to a centrifuge tube. The subsequent steps of centrifugation at 3000 revolutions per minute for 15 min, and filtration through a 0.45 μm microporous filter membrane, were carried out as described in Section 2.3.1.
2.4. Analysis of Mineral Characterization
An SU 8010 field emission scanning electron microscope was used to conduct mineral micro-morphological characterization, while the determination of the specific surface area was performed using a 4-station fully automated specific surface area analyzer.
2.5. Data Processing
Isothermal adsorption lines were fitted with the Langmuir and Freundlich models.
Langmuir Equation:
Freundlich Equation:
where Qe is the equilibrium adsorption amount (mg/g); Qm is the maximum adsorption amount (mg/g); Ce is the equilibrium concentration (mg/L); KL is the adsorption equilibrium constant; KF is the constant related to the adsorption capacity; 1/n is the adsorption index; and the larger the value of n means the stronger the adsorption force.
The kinetic adsorption process was fitted with a proposed second-order kinetic equation, as follows:
where Qt and Qe are the amount of substance adsorbed (mg/g) at time t and adsorption equilibrium, respectively; and k is the adsorption rate constant (g/(mg·h)). Qe and k are obtained from the intercept and slope of the curves obtained from the t − t/Qt fit.
All data analysis was performed using SPSS 25.0 software and graphing was performed using Origin Pro 2022 software.
3. Results and Analysis
3.1. Microscopic Characterization of Soil Minerals
Distinct lamellar structures were observed in the microscopic characterization of un-acidified illite and kaolin, as depicted in Figure 2a,d, respectively. Hematite displayed a spindle-like structure (Figure 2g). Upon acidification, notable transformations took place. Passivation, lamellar edge curling, and clustering were observed in illite, kaolin, and hematite, respectively, as illustrated in Figure 2b,c,e,f,h,i). Among these changes, illite and hematite displayed the most noticeable alterations in their characterization.
All three minerals exhibited an augmentation in the specific surface area as the pH decreased (Figure 3). Notably, illite and hematite were notably impacted by the acidification, experiencing a significant increase in the specific surface area compared with the control (CK). While the average pore diameter of mesopores decreased with the declining pH for all minerals, the disparity between treatments did not reach statistical significance.
3.2. Effect of Short-Term Acidification on the Adsorption of Glucose by Soil Minerals
3.2.1. Isothermal Adsorption Characterization of Glucose Adsorption by soil Minerals
Comparing the Langmuir and Freundlich equation fittings, it was found that the Freundlich equation fitting had a higher R2 value of 0.95–0.99. This suggested that the Freundlich equation is more effective in demonstrating the variation process and adsorption mode of glucose saturation adsorption on the three minerals. This also indicated the possible existence of the multilayer adsorption of glucose on the mineral surfaces. The saturated adsorption of all three minerals increased as the concentration increased (Figure 4). Under the same concentration conditions, illite had a higher saturated adsorption (S3 > S5 ≈ CK) compared with kaolin and hematite (S3 ≈ S5 ≈ CK), but illite and kaolin had higher KF values than CK (Table 1), indicating that acidification could enhance the adsorption of glucose by the minerals and increase the amount of adsorption. At low concentrations (Ce < 100 mg/L), hematite S3 adsorbed slightly less than S5 and CK, but as the concentration increased, its adsorption capacity significantly increased.
3.2.2. Kinetic Characterization of Glucose Adsorption by Soil Minerals
Figure 5 showed that the adsorption process of illite and hematite was not affected by the acidification. Initially, there was a rapid increase in adsorption, but it slowed down over time and eventually reached equilibrium. The amount of adsorption at the same time increased with the increased acidification intensity, and the equilibrium point of adsorption arrival shifted forward significantly. For kaolin CK, there was a small amount of desorption close to the equilibrium point, followed by reaching equilibrium. However, no desorption was observed for the S3 and S5 adsorption processes. Additionally, the differences between kaolin S3 and S5 and CK were characterized by a significant forward shift in the equilibrium time point and an increase in the equilibrium adsorption, but the changes between the two were not significant.
The proposed second-order kinetic equation fitting effectively described the adsorption process of the three minerals on glucose. The correlation coefficients (R2) ranged from 0.931–0.999, and the theoretical adsorption quantities were fairly close to the measured values (Table 2). This suggests that the adsorption process may be primarily influenced by chemisorption.
3.3. Effect of Short-Term Acidification on the Adsorption of Tannic Acid by Soil Minerals
3.3.1. Isothermal Adsorption Characterization of Tannic Acid Adsorption by Soil Minerals
Based on the results of fitting the Langmuir and Freundlich models (Figure 6) and the corresponding parameters (Table 3), it can be observed that the Langmuir model is more appropriate for describing the adsorption process of tannic acid on illite and hematite, suggesting a monolayer adsorption may occur. In addition, the Freundlich model is better suited for describing the adsorption process of tannic acid on kaolin, indicating a possible multilayer adsorption. The saturated adsorption of all three minerals increased progressively as the concentration of tannic acid increased. Under the same concentration conditions, the saturated adsorption of the acidified minerals was in the order of S3 > S5 > CK. The maximum theoretical adsorption capacity (Qm) of the acidified illite, hematite, and kaolin (KF) were all significantly higher than CK, suggesting that acidification could enhance the adsorption of tannic acid by these minerals to some extent.
3.3.2. Kinetic Characterization of Tannic Acid Adsorption by Soil Minerals
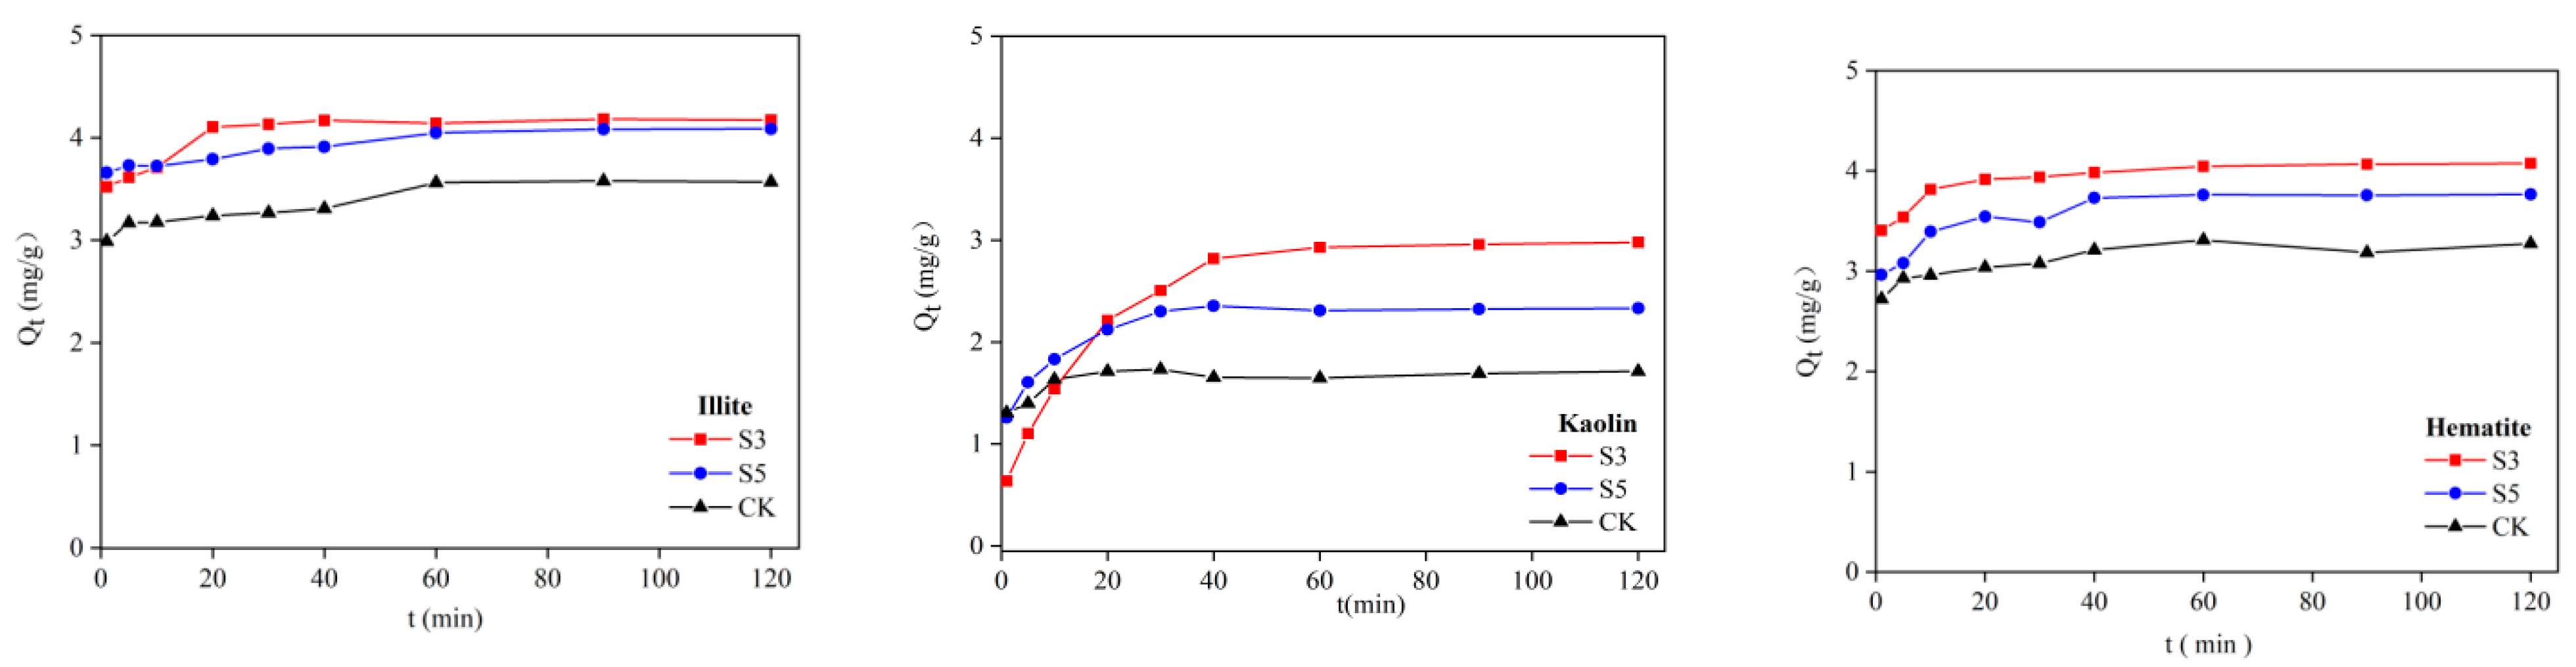
The temporal trend of tannic acid adsorption by the three minerals was similar in Figure 7. In the early stages of adsorption, there was a rapid increase in adsorption quantities, followed by a gradual decrease in the growth rate until reaching the adsorption equilibrium. With the increased acidification, the adsorption amount and the time required to reach equilibrium for all three minerals showed an increase and forward shift. The equilibrium adsorption of illite was approximately equal for S3 and S5, and higher than CK. On the other hand, the equilibrium adsorption of kaolin and hematite was higher for S3 compared with S5 and CK.
After applying the proposed second-order kinetic equations to analyze the adsorption process, it was observed (Table 4) that the correlation coefficients (R2) for the three tested minerals were all above 0.95. Additionally, the difference between the theoretical adsorption amount and the measured value was relatively small. This indicates that the proposed second-order kinetic equations effectively capture the adsorption process of tannic acid on the three minerals, suggesting that chemisorption may play a dominant role in this process. For illite, the adsorption rate constant (k) showed a trend of S5 > S3 > CK, suggesting that increasing the level of acidification could enhance the adsorption rate of tannic acid on illite. Conversely, for kaolin and hematite, the adsorption rate constants (k) showed a trend of CK > S5 > S3, indicating that short-term acidification resulted in a decrease in the adsorption rate of tannic acid in these minerals.
4. Discussion
4.1. Influence of Soil Minerals on Glucose and Tannic Acid Adsorption
The adsorption process of glucose and tannic acid by soil minerals can be divided into three phases: fast adsorption, slow adsorption, and equilibrium adsorption. Initially, the presence of active sites on the surfaces of clay minerals allows for the rapid binding of glucose and tannic acid molecules. As the active sites decrease, along with the availability of adsorption space and glucose and tannic acid content in the system, the adsorption rate gradually slows down and eventually reaches a state of saturation equilibrium. Some studies also separate the adsorption process into different stages: surface diffusion, mesopore diffusion, and micropore diffusion. In the surface diffusion stage, the initial mineral surface provides numerous adsorption sites and there is a significant difference in the glucose and tannic acid concentration, resulting in rapid adsorption. In the mesopore diffusion stage, glucose and tannic acid diffuse from the mineral surface into the interior, leading to a slower rate of diffusion. Finally, in the micropore diffusion stage, glucose and tannic acid enter the mineral’s interior through smaller micropores for inter-pore diffusion. Due to concentration differences and the small size of the pores, the diffusion rate is significantly reduced until equilibrium is reached [14,15]. In this experiment, the amount of glucose and tannic acid used is relatively large compared with the pore space of the minerals, making it difficult for them to enter the interlayers. Therefore, the transient adsorption on the outer surface is the dominant mechanism, suggesting that surface diffusion and mesopore diffusion are the main mechanisms for glucose and tannic acid adsorption by the three minerals.
The adsorption of glucose on the three minerals and kaolin on tannic acid was observed to be multilayer and inhomogeneous, while illite and hematite on tannic acid showed monolayer adsorption (Table 1 and Table 3). The adsorption process is influenced by both intraparticle diffusion and other factors [16]. Due to the limitations of the particle size scale, glucose and tannic acid are unable or face difficulty in undergoing internal diffusion within the minerals. Hence, the adsorption of the three minerals on glucose and tannic acid is more likely to be influenced by other factors. The small molecule glucose occupies adsorption sites on the mineral surfaces, forming overlapping layers of organic molecular structures, which create additional potential adsorption sites for glucose adsorption to continue [17]. Higher organic matter content facilitates the formation of layered structures with overlapping layers in the “mineral-organic matter” complex on the mineral surface, leading to a higher adsorption capacity [18,19]. Kaolin has a relatively small specific surface area (Figure 3), resulting in a rapid occupation of the limited active adsorption sites by macromolecular tannins. These tannins continue to be adsorbed through hydrogen bonding, exhibiting multilayer adsorption characteristics [20]. It has been observed that tannins with higher molecular weights can more rapidly reach the surface of soil minerals and occupy active adsorption sites on the surface [21,22], forming a spatial barrier that hinders the further adsorption of tannins [8,23]. This phenomenon aligns with the adsorption characteristics of tannins by illite and hematite observed in this study.
4.2. Mechanism of the Effect of Acidification on the Adsorption of Glucose and Tannic Acid by Soil Minerals
Illite has a limited internal pore structure, resulting in a relatively low physical adsorption capacity. However, upon acidification treatment, the surface of illite particles becomes rough and irregular, leading to an increase in the specific surface area [24]. This study confirms that acidification visibly alters the appearance of illite, causing it to transform from a distinct laminar structure to a scale-like structure. Additionally, the acidification results in blurred edge structures and “passivation”, all contributing to an increase in the specific surface area (Figure 2a–c). The level of acidification directly impacts the specific surface area (Figure 3), with more significant acidification leading to more exposed adsorption sites. The surfaces of illite are predominantly negatively charged. However, under acidic conditions, the end face of illite exhibits positive electrification due to protonation between Al-OH, Si-OH, and H+. The degree of acidification directly influences the level of protonation, thereby increasing the strength of positive electrification at the end face and enhancing the adsorption capacity [25].
Compared with illite and hematite, kaolin has the smallest specific surface area (Figure 3) and fewer available adsorption sites, making it less effective in adsorbing glucose and tannic acid. The acidification of kaolin leads to an increased specific surface area through an abstraction reaction [26]. Additionally, the dissociation of kaolin can cause cracking parallel to the facets, resulting in the production of Al-OH and Si-OH on the edge facets [27]. However, in this study, the short-term acidification did not significantly alter the appearance of kaolin (Figure 2d–f), and only a slight increase in the specific surface area was observed (Figure 3). Acidification can also alter the surface charge of kaolin. Under acidic conditions, a large amount of H+ protonates with -OH, Si-O, Al-O, and Al-OH on the surface of kaolin particles, forming positively charged groups [28]. This promotes the adsorption of glucose and tannic acid. Therefore, the changes in the kaolin adsorption capacity due to the short-term acidification can primarily be attributed to the protonation of H+ under acidic conditions.
The charge of the hematite surface highly depends on the pH of the solution it is in. Under low pH conditions, the surface hydroxyl groups and Fe-OH become protonated and bond to the negatively charged surface, resulting in the formation of more Fe-OH2+ groups. This protonation enhances the ability of hematite to adsorb organic matter. Conversely, at high pH levels, the Fe-OH groups on the surface of iron oxides react with OH− to form Fe-O− groups, resulting in a change from positive to electrically neutral or even slightly negative charge. This leads to an increased repulsive force between the surface groups and glucose and tannic acid, reducing the adsorption capacity [29]. Upon acidification, hematite exhibits varying degrees of detrital flakes and clusters, along with some dissolution (Figure 2h–i). This process results in decreased crystallinity, increased fine particle content, and an increase in the specific surface area (Figure 3). Consequently, more oxygen atoms and hydroxyls are exposed, creating more active sites and enhancing the adsorption capacity of glucose and tannins. These findings are consistent with the results of previous studies [30].
5. Conclusions
Short-term acidification did not alter the dominant mechanisms and process of glucose and tannic acid adsorption by all three minerals (illite, kaolin, and hematite). The dominant adsorption mechanisms mainly involved chemisorption as well as surface and mesopore diffusion. The adsorption of glucose by the three minerals and tannic acid by kaolin exhibited multilayer and inhomogeneous adsorption patterns, while the adsorption of tannic acid by illite and hematite displayed monolayer adsorption. The adsorption processes still exhibited a rapid adsorption stage, a slow adsorption stage, and an adsorption equilibrium stage. Acidification-induced dissolution resulted in an increase in the specific surface area and the number of active adsorption sites of the minerals to varying degrees. The protonation reaction also caused changes in the surface charge of the minerals. These changes affected the interactions such as hydrogen bonding, ligand exchange, and charge transfer between the minerals and glucose and tannic acid, thereby enhancing the adsorption capacity. The level of enhancement was directly proportional to the intensity of acidification.
Author Contributions
Conceptualization, Y.C., Y.W., X.W., Y.L. and W.D.; methodology, Y.C., Y.W., X.W., Y.L. and W.D.; formal analysis, Y.C., Y.L. and W.D.; acquisition of data, analysis, and interpretation of data, Y.C. and Y.W.; writing—original draft preparation, Y.C.; writing—review and editing, Y.C., Y.L. and W.D.; resources, supervision, funding acquisition, Y.L. and W.D. All authors have read and agreed to the published version of the manuscript.
Funding
This research was funded by the Ordos City Science and Technology Cooperation Major Special Project, grant number 2021EEDSCXQDFZ012.
Data Availability Statement
The original contributions proposed in the study are included in the article; any further inquiries can be directed to the corresponding author.
Acknowledgments
We would like to thank the reviewers and editors for their proofreading and helpful suggestions on the manuscript. We express heartfelt thanks to the scientists whose research reports were included in this meta-analysis.
Conflicts of Interest
The authors declare that they have no conflicts of interest to report regarding the present study.
References
- Adhikari, D.; Zhao, Q.; Das, K.; Mejia, J.; Huang, R.; Wang, X.; Poulson, S.R.; Tang, Y.; Roden, E.E.; Yang, Y. Dynamics of ferrihydrite-bound organic carbon during microbial Fe reduction. Geochim. Cosmochim. Acta 2017, 212, 221–233. [Google Scholar] [CrossRef]
- Williams, C.F.; Agassi, M.; Letey, J.; Farmer, W.J.; Nelson, S.D.; Ben-Hur, M. Facilitated transport of napropamide by dissolved organic matter through soil columns. Soil Sci. Soc. Am. J. 2000, 64, 590–594. [Google Scholar] [CrossRef]
- Hoyle, F.C.; Murphy, D.V.; Brookes, P.C. Microbial response to the addition of glucose in low-fertility soils. Biol. Fert. Soils 2008, 44, 571–579. [Google Scholar] [CrossRef]
- Kraus, T.E.C.; Dahlgren, R.A.; Zasoski, R.J. Tannins in nutrient dynamics of forest ecosystems—A review. Plant Soil 2003, 256, 41–66. [Google Scholar] [CrossRef]
- Schmidt, M.; Torn, M.S.; Abiven, S.; Dittmar, T.; Guggenberger, G.; Janssens, I.A.; Kleber, M.; Kgel-Knabner, I.; Lehmann, J.; Manning, D. Persistence of soil organic matter as an ecosystem property. Nature 2011, 478, 49–56. [Google Scholar] [CrossRef] [PubMed]
- Kaiser, K.; Guggenberger, G. The role of DOM sorption to mineral surfaces in the preservation of organic matter in soils. Org. Geochem. 2000, 31, 711–725. [Google Scholar] [CrossRef]
- Saidy, A.R.; Smernik, R.J.; Baldock, J.A.; Kaiser, K.; Sanderman, J. The sorption of organic carbon onto differing clay minerals in the presence and absence of hydrous iron oxide. Geoderma 2013, 209–210, 15–21. [Google Scholar] [CrossRef]
- Shaker, A.M.; Komy, Z.R.; Heggy, S.E.; Mohamed, E.S. Kinetic study for adsorption humic acid on soil minerals. J. Phys. Chem. A 2012, 116, 10889–10896. [Google Scholar] [CrossRef]
- Ulrich, B. An ecosystem approch to soil acidification. Soil Acidity 1991, 28–79. [Google Scholar]
- Xu, R.K.; Zhao, A.Z.; Jiang, J. Effect of acidification on CEC and mineral compositions of yellow brown soils in tea gardens. Ecol. Environ. Sci. 2011, 20, 1395–1398. [Google Scholar] [CrossRef]
- Zeng, L.; Li, X.M.; Liu, J.D. Adsorptive removal of phosphate from aqueous solutions using iron oxide tailings. Water Res. 2004, 38, 1318–1326. [Google Scholar] [CrossRef]
- Alekseeva, T.; Alekseev, A.; Xu, R.K.; Zhao, A.Z.; Kalinin, P. Effect of soil acidification induced by a tea plantation on chemical and mineralogical properties of Alfisols in eastern China. Environ. Geochem. Health 2011, 33, 137–148. [Google Scholar] [CrossRef] [PubMed]
- Wang, L.; Ying, R.R.; Shi, J.Q.; Long, T.; Lin, Y.S. Advancement in study on adsorption of organic matter on soil minerals and its mechanism. Acta Pedol. Sin. 2017, 54, 805–818. [Google Scholar]
- Allen, S.J.; McKay, G.; Khader, K.Y.H. Intraparticle diffusion of a basic dye during adsorption onto sphagnum peat. Environ. Pollut. 1989, 56, 39–50. [Google Scholar] [CrossRef]
- Ma, J.; Yu, F.; Zhou, L.; Jin, L.; Yang, M.; Luan, J.; Tang, Y.; Fan, H.; Yuan, Z.; Chen, J. Enhanced adsorptive removal of methyl orange and methylene blue from aqueous solution by alkali-activated multiwalled carbon nanotubes. ACS Appl. Mater. Interfaces 2012, 4, 5749–5760. [Google Scholar] [CrossRef] [PubMed]
- Martins, A.C.; Pezoti, O.; Cazetta, A.L.; Bedin, K.C.; Yamazaki, D.A.S.; Bandoch, G.F.G.; Asefa, T.; Visentainer, J.V.; Almeida, V.C. Removal of tetracycline by NaOH-activated carbon produced from macadamia nut shells: Kinetic and equilibrium studies. Chem. Eng. J. 2015, 260, 291–299. [Google Scholar] [CrossRef]
- Kleber, M.; Sollins, P.; Sutton, R.; Sollins, P.; Swanston, C.; Kramer, M. A conceptual model of organo-mineral interactions in soils: Self-assembly of organic molecular fragments into zonal structures on mineral surfaces. Biogeochemistry 2007, 85, 9–24. [Google Scholar] [CrossRef]
- Mayes, M.A.; Heal, K.R.; Brandt, C.C.; Phillips, J.R.; Jardine, P.M. Relation between soil order and sorption of dissolved organic carbon in temperate subsoils. Soil Sci. Soc. Am. J. 2012, 76, 1027–1037. [Google Scholar] [CrossRef]
- Sollins, P.; Swanston, C.; Kleber, M.; Filley, T.; Kramer, M.; Crow, S.; Caldwell, B.A.; Lajtha, K.; Bowden, R. Organic C and N stabilization in a forest soil: Evidence from sequential density fractionation. Soil Biol. Biochem. 2006, 38, 3313–3324. [Google Scholar] [CrossRef]
- Mikutta, R.; Kleber, M.; Torn, M.S.; Jahn, R. Stabilization of soil organic matter: Association with minerals or chemical recalcitrance? Biogeochemistry 2006, 77, 25–56. [Google Scholar] [CrossRef]
- Gu, B.; Schmitt, J.; Chen, Z.; Liang, L.; McCarthy, J.F. Adsorption and desorption of natural organic matter on iron oxide: Mechanisms and models. Environ. Sci. Technol. 1994, 28, 38–46. [Google Scholar] [CrossRef] [PubMed]
- Yang, K.; Lin, D.H.; Xing, B.S. Interactions of humic acid with nanosized inorganic oxides. Langmuir 2009, 25, 3571–3576. [Google Scholar] [CrossRef]
- Manash, D.R.; Sekh, M. The influence of functionality on the adsorption of p-hydroxy benzoate and phthalate at the hematite-electrolyte interface. J. Colloid Interf. Sci. 2007, 306, 205–215. [Google Scholar]
- Mietek, J.; Leonid, S. Improvement of the Kruk-Jaroniec-Sayari method for pore size analysis of ordered silicas with cylindrical mesopores. Langmuir 2006, 22, 6757–6760. [Google Scholar]
- Mortland, M.M. Formation and properties of clay-polymer complexes. Geoderma 1980, 23, 225–226. [Google Scholar] [CrossRef]
- Zhang, Y.L.; Zhu, J.; Shi, C.; Shang, L.L.; Ma, R. Modification of kaolin and its adsorption properties on Cr(VI). Res. Environ. Sci. 2013, 26, 561–568. [Google Scholar]
- Yin, H.R.; Wu, L.H.; Chen, H.; Ma, L.; Qi, F.Y. Research and application of Nanokaolin. Mater. Rep. 2006, S1, 196–199. [Google Scholar]
- Min, F.F.; Zhao, Q.; Li, H.L.; Peng, C.L. Study of electrokinetic properties of kaolinite in coal slime. J. China Univ. Min. Technol. 2013, 42, 284–290. [Google Scholar] [CrossRef]
- Gu, B.H.; Schmitt, J.; Chen, Z.H.; Liang, L.Y.; McCathy, J.F. Adsorption and desorption of different organic matter fractions on iron oxide. Geochim. Cosmochim. Acta 1995, 59, 219–229. [Google Scholar] [CrossRef]
- Qin, X.; Liu, F.; Wang, G.; Huang, G. Adsorption of humic acid from aqueous solution by hematite: Effects of pH and ionic strength. Environ. Earth Sci. 2015, 73, 4011–4017. [Google Scholar] [CrossRef]
Figure 1.
The XRD diffraction patterns of examined minerals: (a) illite; (b) kaolin; (c) hematite.
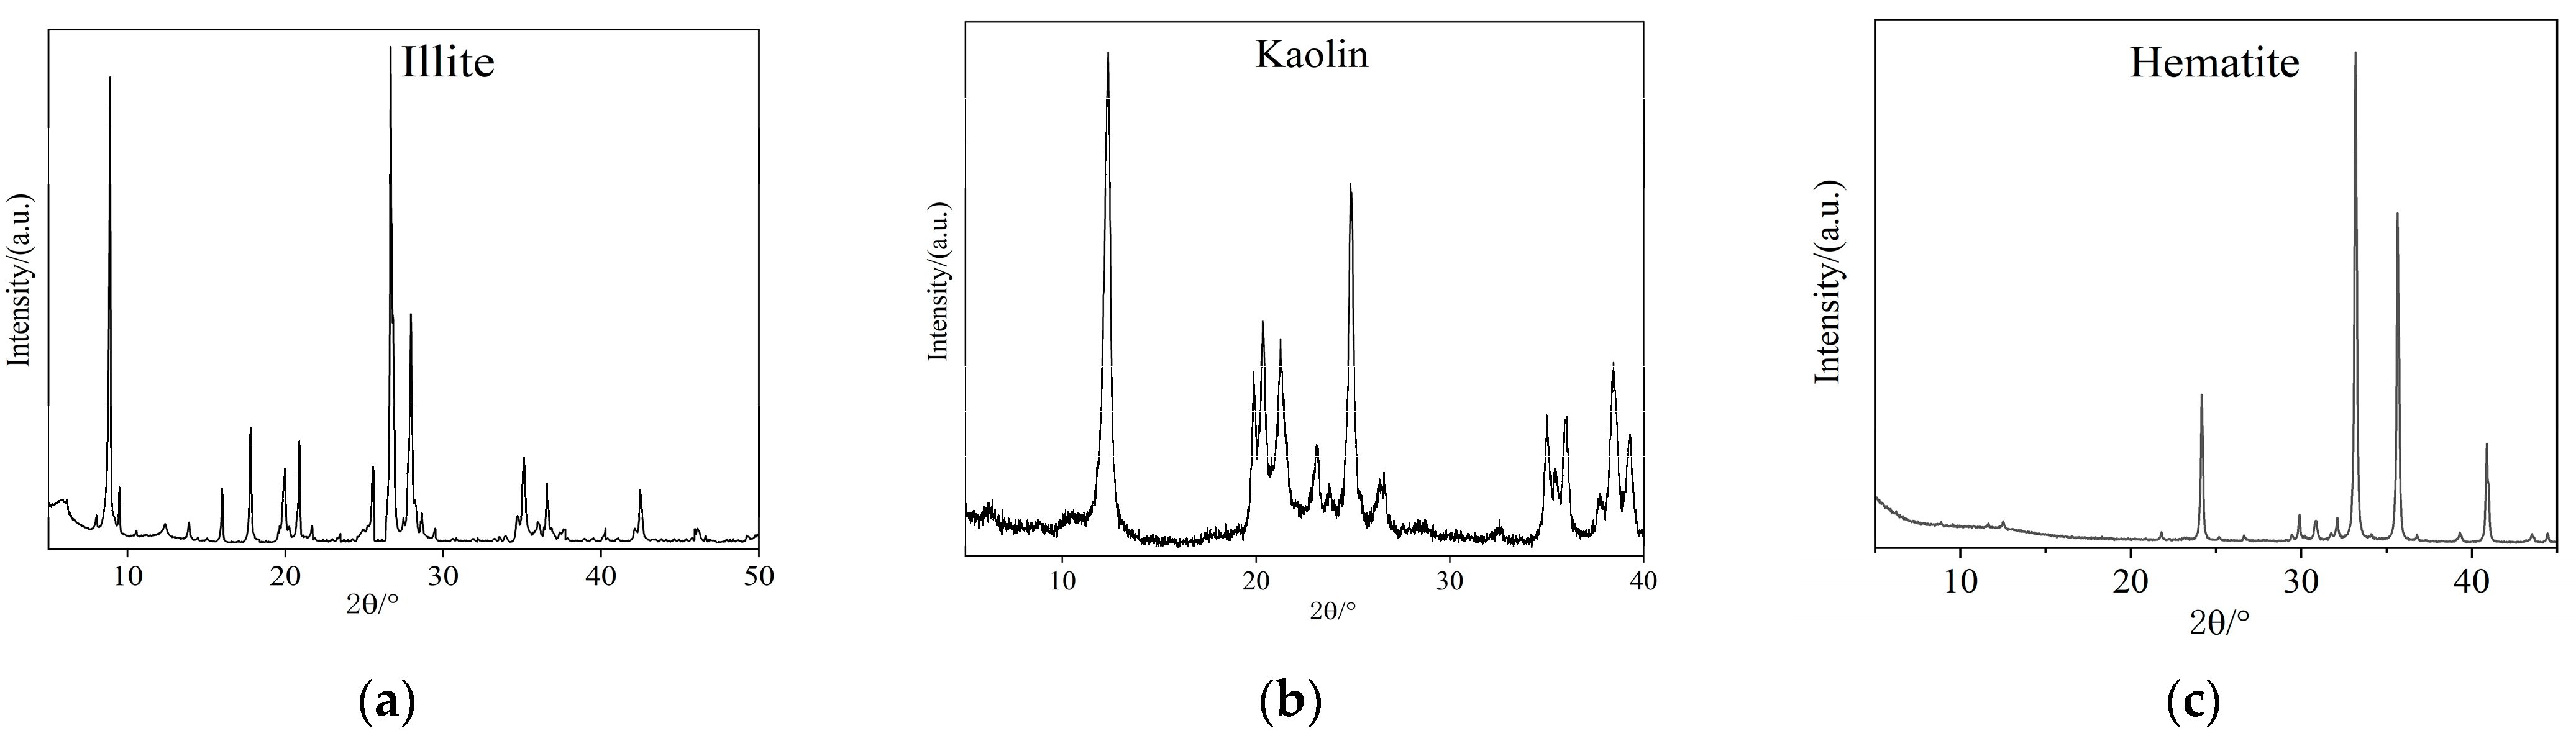
Figure 2.
FE-SEM photograph of examined minerals after different acidification treatments: (a–c): CK, S5, and S3 of illite after different acidification treatments; (d–f): CK, S5, and S3 of kaolin after different acidification treatments; (g–i): CK, S5, and S3 of hematite after different acidification treatments.
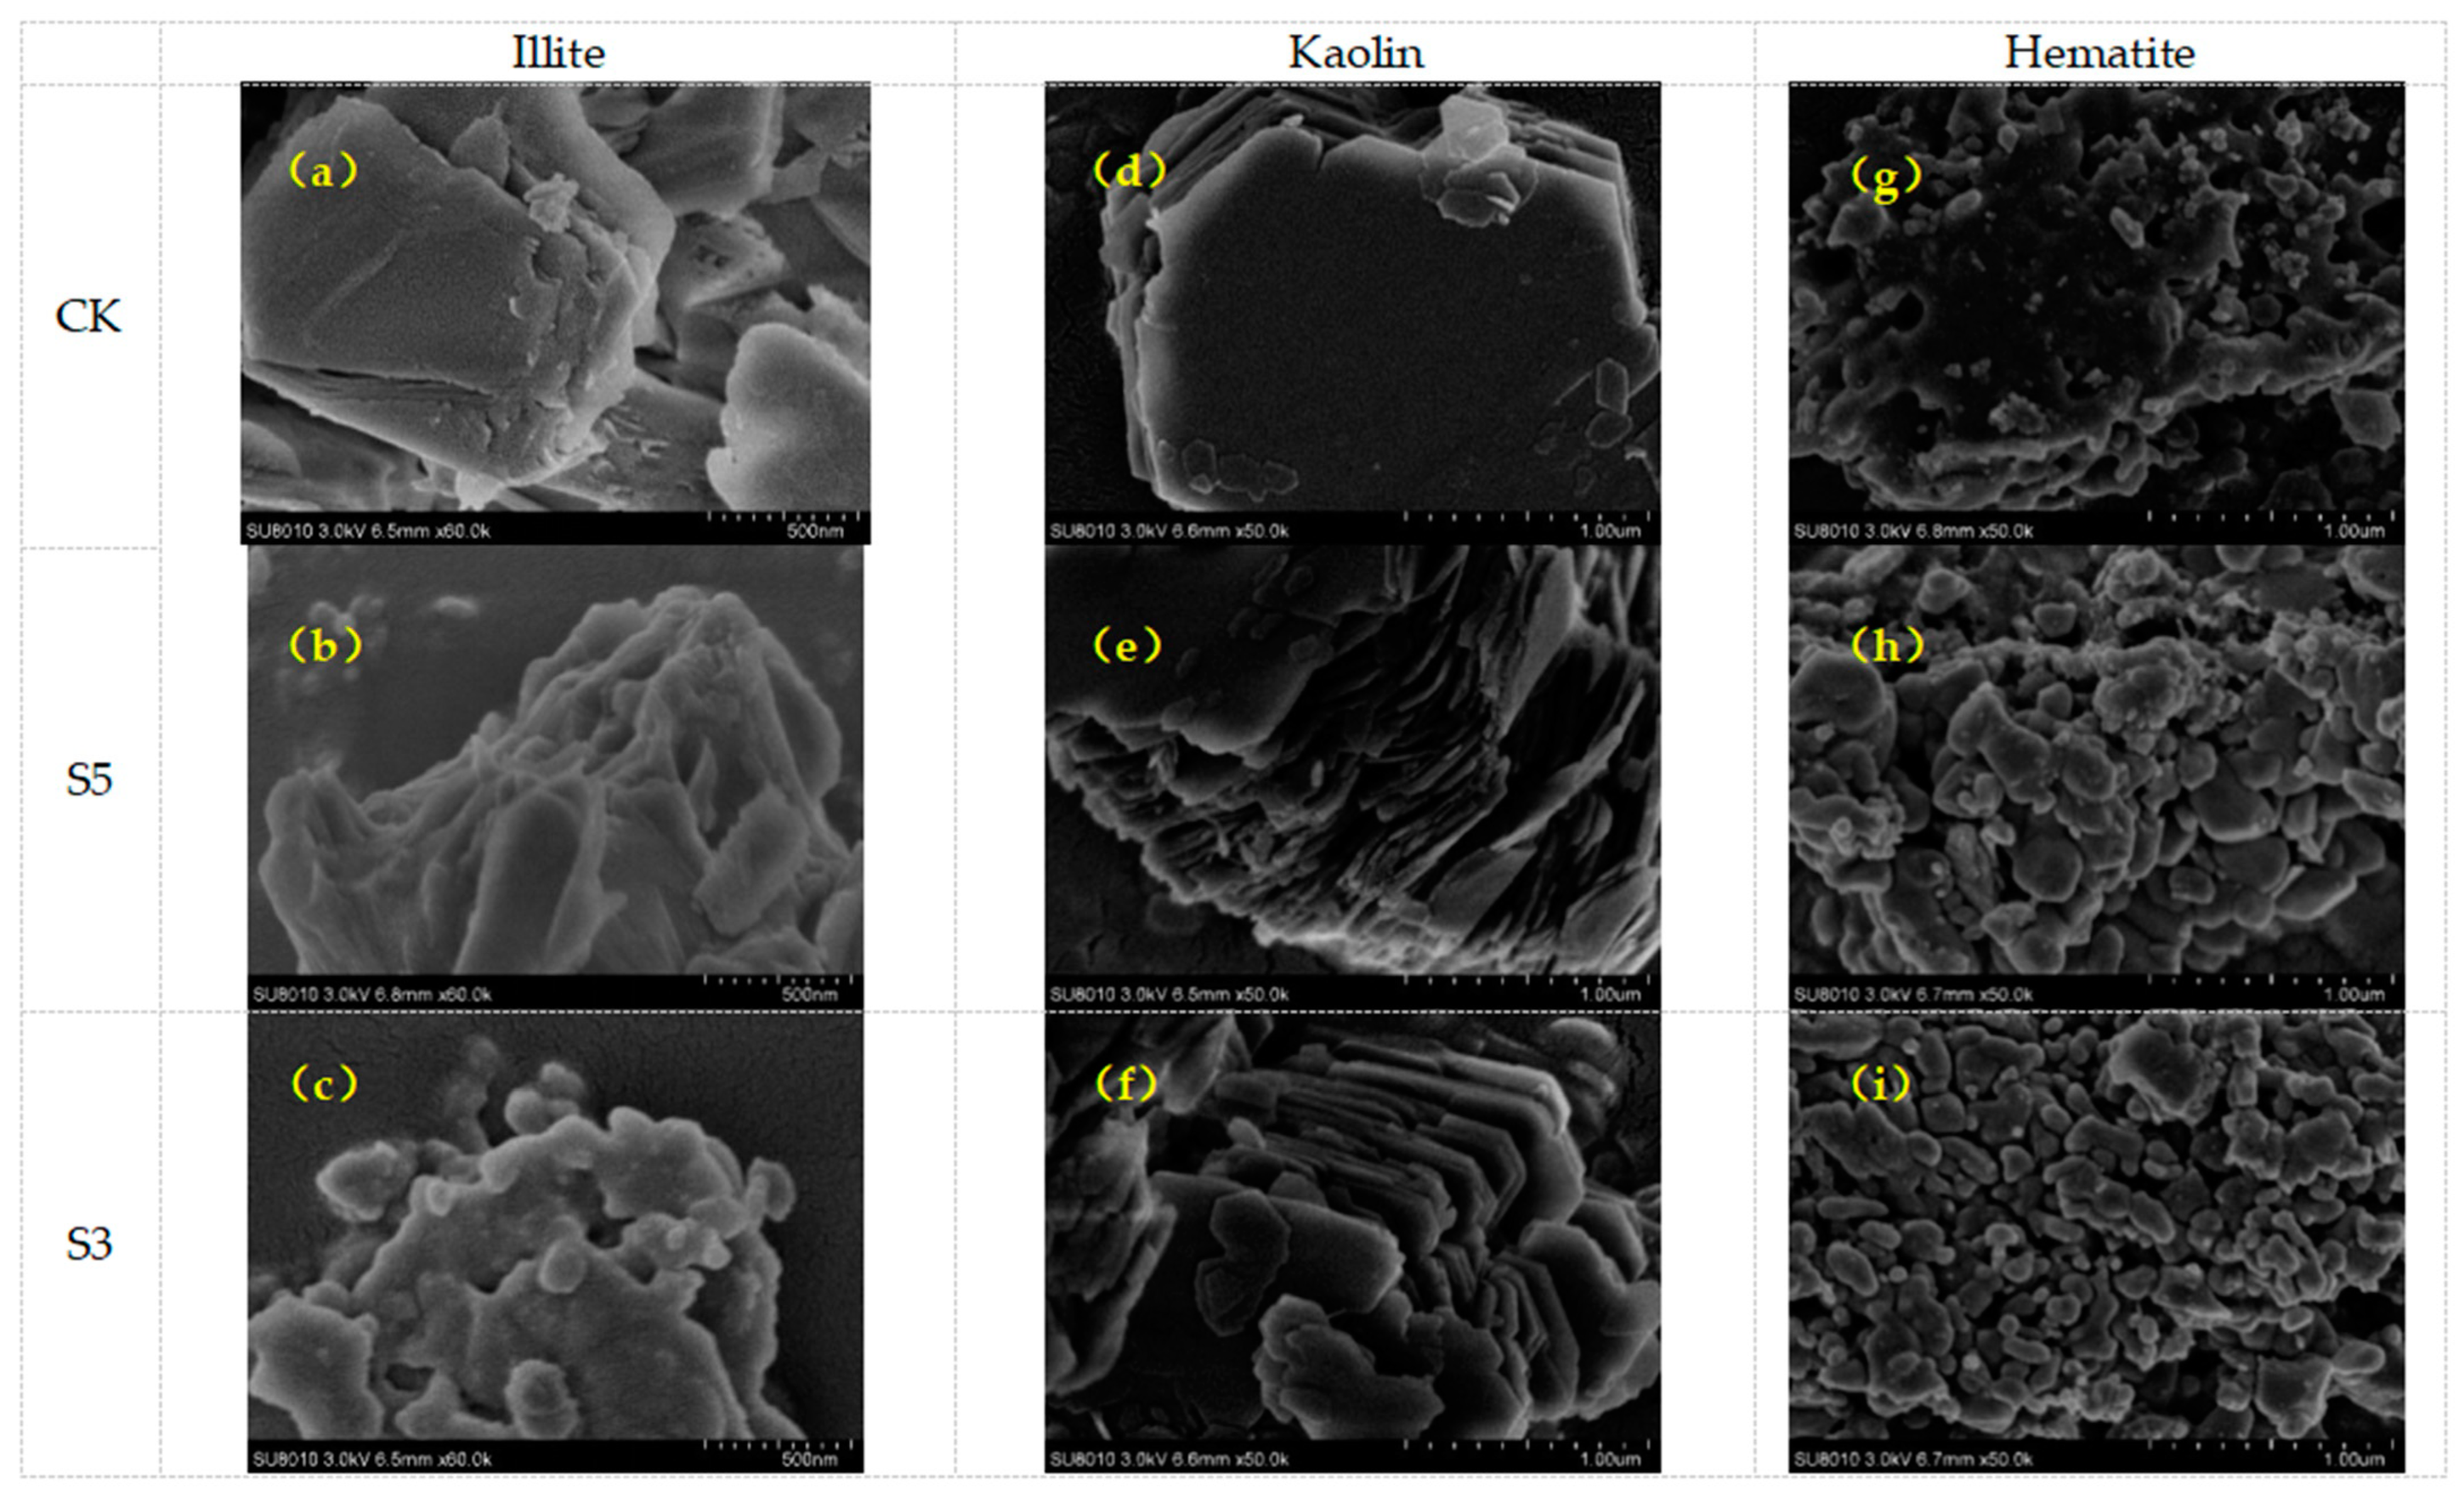
Figure 3.
Specific surface area of minerals after different acidification treatments. Note: different lower-case letters indicate the difference levels of the same mineral at different acidification treatments (p < 0.05).
Figure 3.
Specific surface area of minerals after different acidification treatments. Note: different lower-case letters indicate the difference levels of the same mineral at different acidification treatments (p < 0.05).
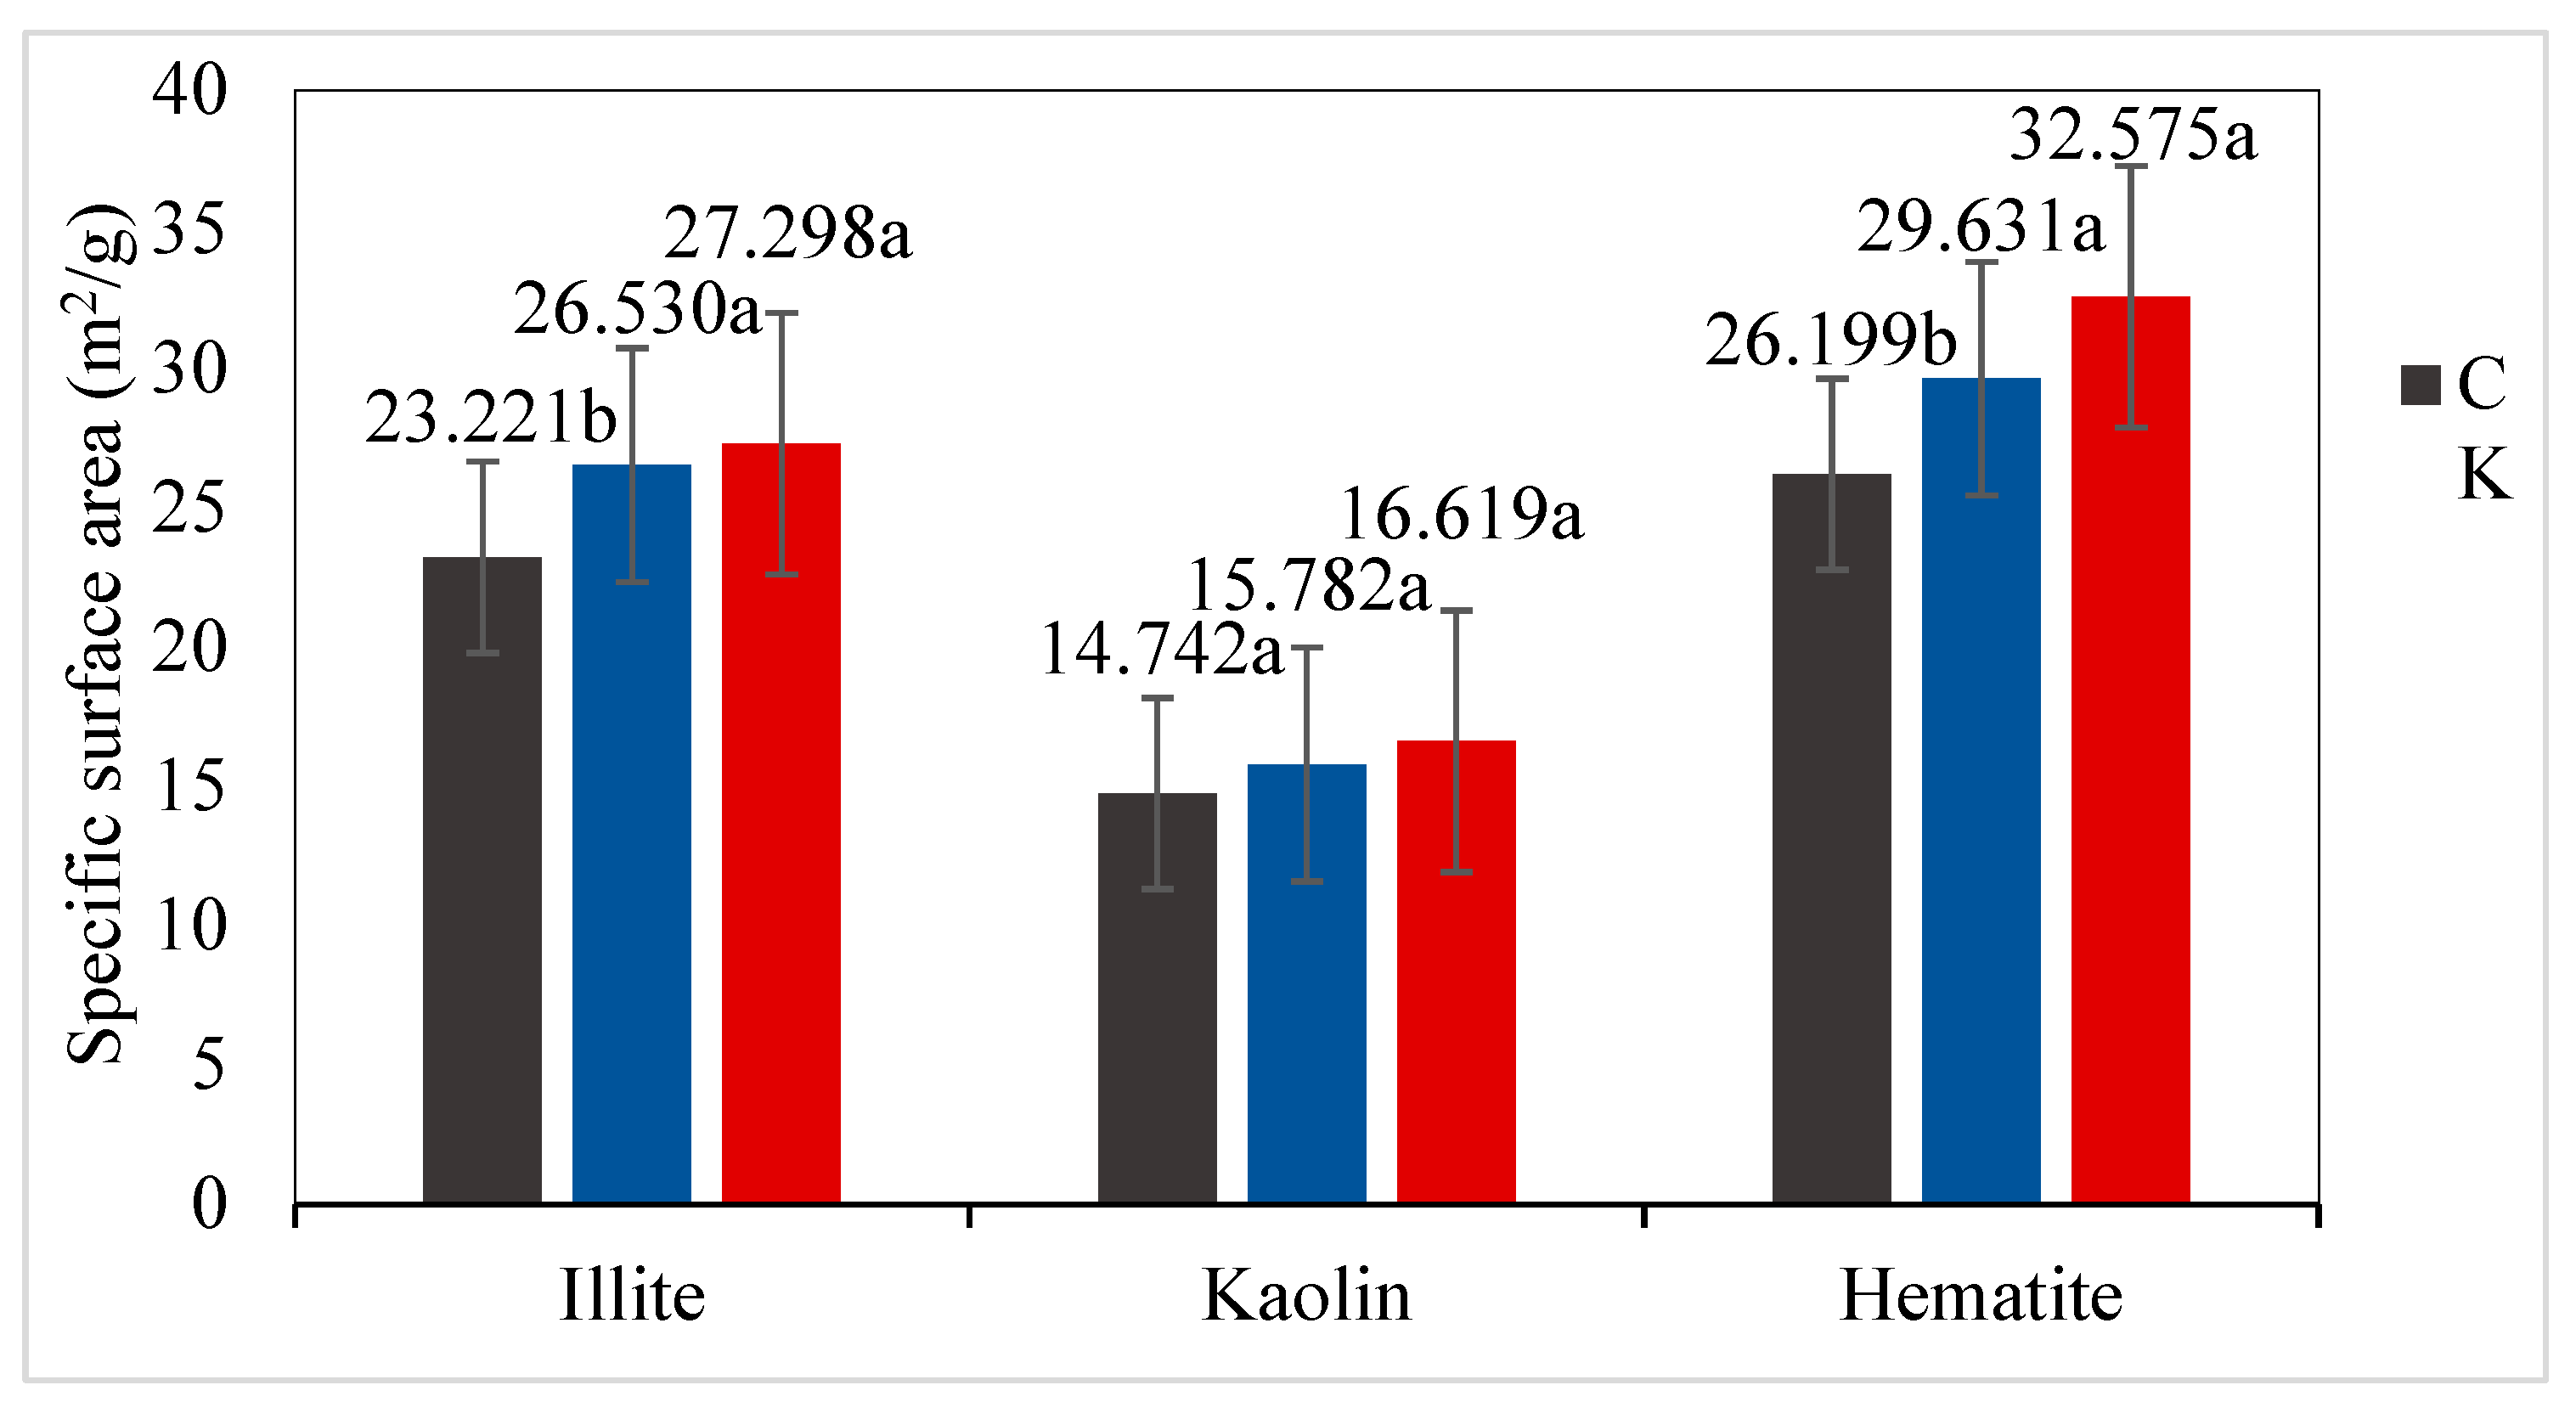
Figure 4.
Glucose adsorption isotherms of three minerals after different acidification treatments by Freundlich model.
Figure 4.
Glucose adsorption isotherms of three minerals after different acidification treatments by Freundlich model.
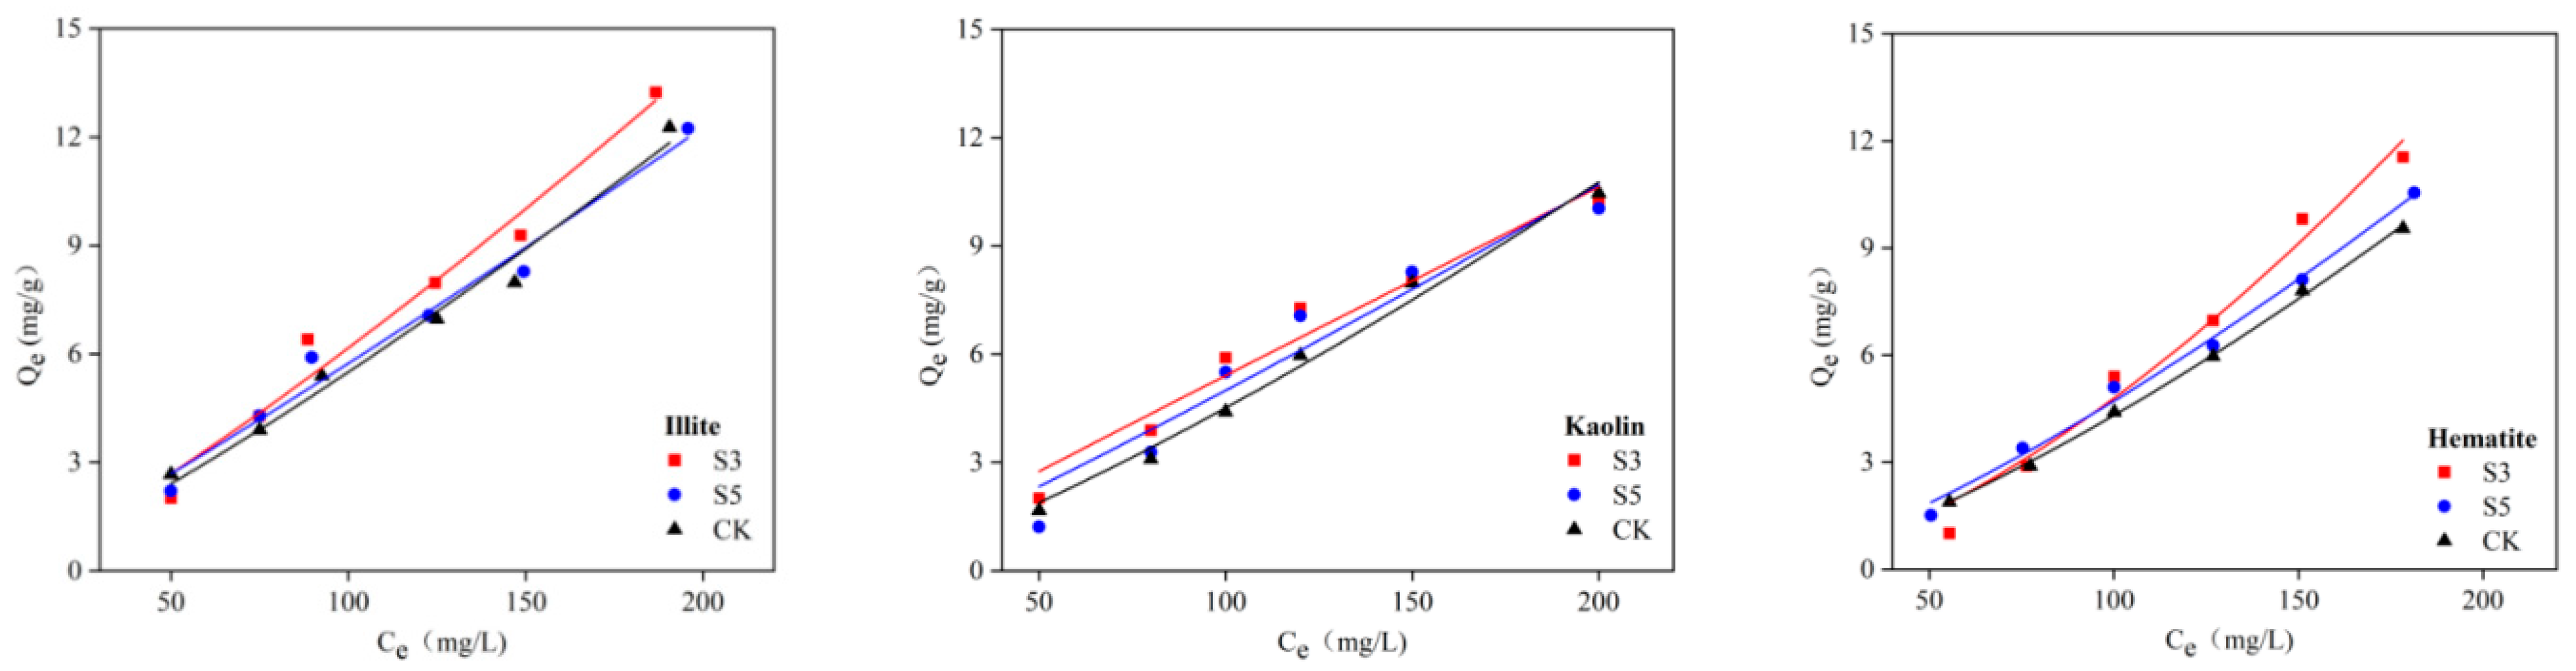
Figure 5.
Temporal change in glucose adsorption by mineral after different acidification treatments.
Figure 5.
Temporal change in glucose adsorption by mineral after different acidification treatments.

Figure 6.
Tannic acid adsorption isotherms of three minerals after different acidification treatments.
Figure 6.
Tannic acid adsorption isotherms of three minerals after different acidification treatments.
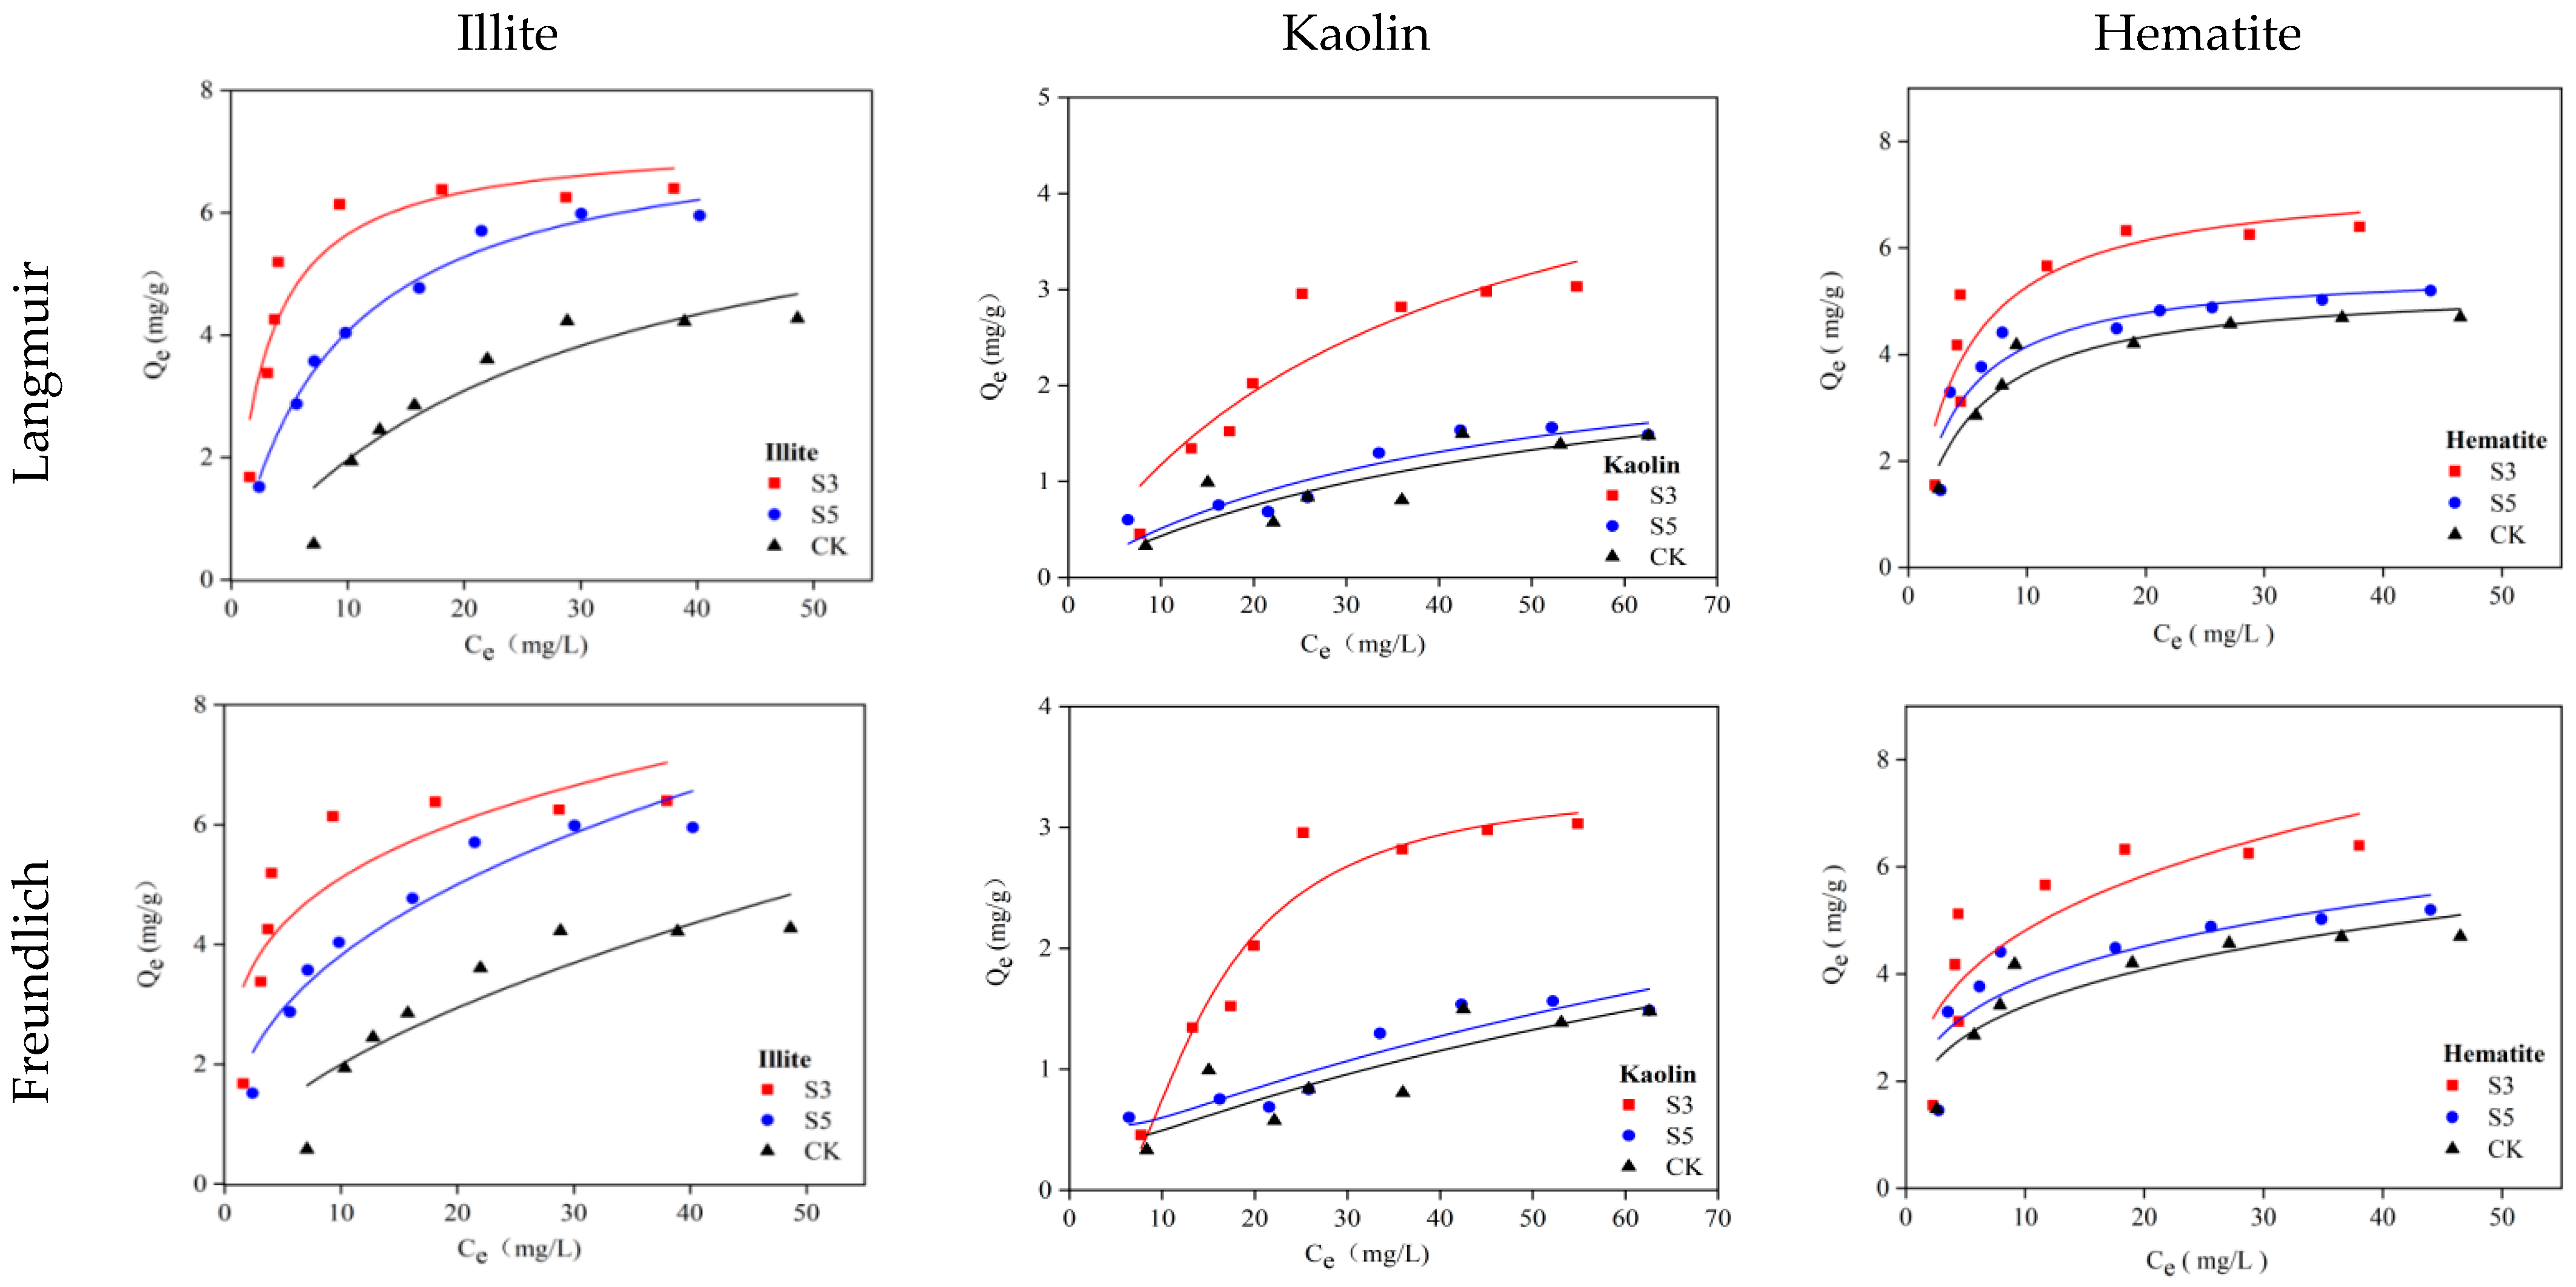
Figure 7.
Temporal change in tannic acid adsorption by mineral after different acidification treatments.
Figure 7.
Temporal change in tannic acid adsorption by mineral after different acidification treatments.

Table 1.
Isotherm fitting parameters of glucose adsorption by three minerals after different acidification treatments.
Table 1.
Isotherm fitting parameters of glucose adsorption by three minerals after different acidification treatments.
| Mineral | Treatment | Langmuir Fit | Freundlich Fit | ||||
|---|---|---|---|---|---|---|---|
| KL(L/mg) | Qm(mg/g) | R2 | KF [(mg/g)·(mg/L)n] | n | R2 | ||
| Illite | CK | 2.288 | 1.346 | 0.956 | 0.022 | 1.089 | 0.979 |
| S5 | 1.427 | 8.488 | 0.964 | 0.037 | 1.094 | 0.971 | |
| S3 | 6.051 | 3.992 | 0.942 | 0.024 | 1.196 | 0.969 | |
| Kaolin | CK | 2.374 | 1.184 | 0.945 | 0.013 | 1.055 | 0.986 |
| S5 | 1.251 | 6.450 | 0.933 | 0.031 | 1.098 | 0.977 | |
| S3 | 1.020 | 4.139 | 0.941 | 0.060 | 0.995 | 0.958 | |
| Hematite | CK | 1.593 | 7.823 | 0.923 | 0.007 | 1.390 | 0.998 |
| S5 | 2.903 | 1.540 | 0.932 | 0.009 | 1.343 | 0.991 | |
| S3 | 4.889 | 2.859 | 0.844 | 0.003 | 1.589 | 0.973 | |
Table 2.
Kinetic fitting parameters of glucose adsorption by mineral after different acidification treatments.
Table 2.
Kinetic fitting parameters of glucose adsorption by mineral after different acidification treatments.
| Mineral | Treatment | Qe Measured Value (mg/g) | Proposed Secondary Model | ||
|---|---|---|---|---|---|
| Qe Theoretical Value (mg/g) | k [g/(mg·h)] | R2 | |||
| Illite | CK | 11.640 | 12.289 | 0.089 | 0.997 |
| S5 | 12.945 | 13.517 | 0.097 | 0.994 | |
| S3 | 7.312 | 7.472 | 0.149 | 0.995 | |
| Kaolin | CK | 11.783 | 10.022 | 0.080 | 0.960 |
| S5 | 11.592 | 10.754 | 0.088 | 0.966 | |
| S3 | 11.759 | 10.828 | 0.065 | 0.931 | |
| Hematite | CK | 10.060 | 10.217 | 0.222 | 0.995 |
| S5 | 11.056 | 11.337 | 0.403 | 0.999 | |
| S3 | 12.394 | 13.326 | 0.393 | 0.997 | |
Table 3.
Isotherm fitting parameters of tannic acid adsorption by three minerals after different acidification treatments.
Table 3.
Isotherm fitting parameters of tannic acid adsorption by three minerals after different acidification treatments.
| Mineral | Treatment | Langmuir Fit | Freundlich Fit | ||||
|---|---|---|---|---|---|---|---|
| KL (L/mg) | Qm (mg/g) | R2 | KF[(mg/g)·(mg/L)n] | n | R2 | ||
| Illite | CK | 27.053 | 7.270 | 0.935 | 0.551 | 0.558 | 0.790 |
| S5 | 8.565 | 7.537 | 0.983 | 1.561 | 0.388 | 0.914 | |
| S3 | 2.780 | 7.519 | 0.920 | 2.947 | 0.239 | 0.662 | |
| Kaolin | CK | 49.839 | 2.650 | 0.454 | 0.146 | 0.561 | 0.896 |
| S5 | 43.630 | 2.734 | 0.794 | 0.016 | 0.558 | 0.984 | |
| S3 | 36.770 | 5.495 | 0.833 | 0.310 | 0.597 | 0.970 | |
| Hematite | CK | 4.612 | 5.336 | 0.916 | 1.860 | 0.262 | 0.760 |
| S5 | 4.198 | 5.768 | 0.859 | 1.898 | 0.284 | 0.730 | |
| S3 | 4.205 | 7.435 | 0.850 | 2.275 | 0.313 | 0.723 | |
Table 4.
Kinetic fitting parameters of tannic acid adsorption by mineral after different acidification treatments.
Table 4.
Kinetic fitting parameters of tannic acid adsorption by mineral after different acidification treatments.
| Mineral | Treatment | Qe Measured Value (mg/g) | Proposed Secondary Model | ||
|---|---|---|---|---|---|
| Qe Theoretical Value (mg/g) | k [g/(mg·h)] | R2 | |||
| Illite | CK | 3.571 | 3.509 | 0.265 | 0.995 |
| S5 | 4.086 | 3.896 | 0.959 | 0.999 | |
| S3 | 4.183 | 4.212 | 0.340 | 0.998 | |
| Kaolin | CK | 1.734 | 1.779 | 0.675 | 0.998 |
| S5 | 2.356 | 2.467 | 0.168 | 0.995 | |
| S3 | 2.819 | 2.778 | 0.036 | 0.964 | |
| Hematite | CK | 3.159 | 3.134 | 0.539 | 0.999 |
| S5 | 3.346 | 3.349 | 0.483 | 0.999 | |
| S3 | 3.306 | 3.347 | 0.210 | 0.998 | |
Disclaimer/Publisher’s Note: The statements, opinions and data contained in all publications are solely those of the individual author(s) and contributor(s) and not of MDPI and/or the editor(s). MDPI and/or the editor(s) disclaim responsibility for any injury to people or property resulting from any ideas, methods, instructions or products referred to in the content. |
© 2023 by the authors. Licensee MDPI, Basel, Switzerland. This article is an open access article distributed under the terms and conditions of the Creative Commons Attribution (CC BY) license (https://creativecommons.org/licenses/by/4.0/).
Share and Cite
MDPI and ACS Style
Chen, Y.; Wang, Y.; Wang, X.; Luan, Y.; Dai, W. Effects of Short-Term Acidification on the Adsorption of Dissolved Organic Matter by Soil Minerals and Its Mechanism of Action. Minerals 2023, 13, 1448. https://doi.org/10.3390/min13111448
AMA Style
Chen Y, Wang Y, Wang X, Luan Y, Dai W. Effects of Short-Term Acidification on the Adsorption of Dissolved Organic Matter by Soil Minerals and Its Mechanism of Action. Minerals. 2023; 13(11):1448. https://doi.org/10.3390/min13111448
Chicago/Turabian StyleChen, Yueting, Yue Wang, Xuqin Wang, Yaning Luan, and Wei Dai. 2023. "Effects of Short-Term Acidification on the Adsorption of Dissolved Organic Matter by Soil Minerals and Its Mechanism of Action" Minerals 13, no. 11: 1448. https://doi.org/10.3390/min13111448
Note that from the first issue of 2016, this journal uses article numbers instead of page numbers. See further details here.