
A Novel Chalcopyrite Depressant for Selective Separation of Molybdenite from Cu-Mo Sulfide Ores and Its Interaction Mechanisms

School of Mining Engineering, University of Science and Technology Liaoning, Anshan 110451, China
*
Authors to whom correspondence should be addressed.
Minerals 2023, 13(12), 1548; https://doi.org/10.3390/min13121548
Submission received: 8 October 2023
/
Revised: 11 December 2023
/
Accepted: 11 December 2023
/
Published: 15 December 2023
(This article belongs to the Special Issue Mineral Flotation: Theory and Technology)
Abstract
:In this study, GX2 was applied as a new high-efficiency chalcopyrite depressant to selectively separate molybdenite from Cu-Mo sulfide ores. The flotation performance and its interaction mechanisms with chalcopyrite and molybdenite were investigated using single-mineral and artificial-mixed-ore flotation, contact angle measurements, zeta-potential measurements, infrared spectroscopy, and X-ray optoelectronic spectrum analysis. The results indicated that molybdenite could be selectively separated from chalcopyrite under the optimal flotation conditions of pH 9.0, 80 mg/L GX2, 20 mg/L kerosene, 10 mg/L MIBC, and a flotation time of 3 min, while the molybdenite and chalcopyrite recoveries were around 90% and 5%, respectively. It was confirmed that GX2 could save ten times the depressant dosage compared to that of the Na2S baseline to achieve a similar separation efficiency. The contact angle test, zeta potential, infrared spectrum, and XPS results show that GX2 may be adsorbed on the surface of chalcopyrite via chemical adsorption, and the hydrophilic substances formed change its hydrophobicity, whereas the effect on the floatability of molybdenite is small, resulting in the excellent separation efficiency of chalcopyrite and molybdenite via flotation.
1. Introduction
Chalcopyrite (CuFeS2) and molybdenite (MoS2) are essential mineral resources for the extraction of copper and molybdenum metals, and they are usually associated with each other in Cu-Mo sulfide ores. Porphyry Cu-Mo ores are primary resources for producing copper and molybdenum metal, which account for 75% of Cu and 50% of Mo [1,2,3,4]. The usual flotation practice of separating molybdenite from chalcopyrite relies on a two-stage flotation process [5]: bulk chalcopyrite–molybdenite flotation to produce a mixed concentrate of those two minerals, followed by the depression of chalcopyrite (prevention of chalcopyrite flotation) with the simultaneous flotation of molybdenite to obtain separate concentrates of these minerals. However, due to the similar natural floatability of chalcopyrite and molybdenite [6], it is difficult to achieve efficient separation without introducing a reagent, such as a depressant, to increase the floatability differences. Therefore, developing an efficient depressant has become critical in molybdenite separation from chalcopyrite in the flotation field. In contrast to depressing molybdenite using hydrophilic polymers, the most common way to process the Co-Mo bulk concentrate is by rejecting chalcopyrite with the optimal reagents.
In recent decades, researchers have carried out much research on chalcopyrite depressants. It is well known that sodium sulfide, sodium hydrosulfide, Nokes reagent, and cyanide are the four common inorganic depressants used in Cu-Mo separation practice [3,4,7]. However, cyanide is highly toxic, affecting human health and the environment [8]. Sodium sulfide and sodium hydrosulfide may release hydrogen sulfide into the atmosphere, generating health risks [9]. In addition, large amounts of high-quality reagents are usually needed to achieve efficient separation, resulting in high costs and poor selectivity. Therefore, to overcome these unfavorable factors, organic depressants such as (3S,4S,5S,6R)-3,4,5,6-tetrahydroxyoxane-2-carboxylate (TTC) [10], Tiopronin [8], acetic acid-[(hydrazinylthioxomethyl)thio]-sodium [11,12], acetoacetamide (CSD2) [13], N-thiourea-maleamic acid (TMA) [8], Dithiouracil [14], 2,3-disulfanylbutanedioic acid (DMSA) [15,16], disodium carboxymethyltrithiocarbonate (DCMT) [17], disodium bis(carboxymethyl) trithiocarbonate (DBT) [18], acetic acid-[(hydrazinylthioxomethyl)thio]-sodium (AHS) [11], 4-amino-3-thioxo-3,4dihydro-1,2,4-triazin-5(2H)-one (ATDT) [7], 4-amino-5-mercapto1,2,4-triazole (AMT) [19], thiocarbonohydrazide (TCH) [20], pseudo glycolythiourea (PGA) [21], etc., have been developed. Most of these organic depressants have excellent performance in the separation of Cu-Mo sulfide minerals; however, it must be pointed out that these reagents have mainly been applied only in laboratory tests and are not widely used on the industrial scale yet. This might be due to the large dosage consumption, poor selectivity, stability, and high costs involved in the production process compared to traditional inorganic depressants. Therefore, developing more efficient, effective, non-toxic or less toxic, high-solubility, environmentally friendly, and cost-effective novel depressants is still a big challenge in mineral processing.
In this work, based on the literature review and a preliminary study, GX2 was synthesized and is proposed as a novel chalcopyrite depressant. The flotation performance was evaluated using single-mineral and artificial-mixed-ore flotation, and contact angle measurements, zeta-potential measurements, infrared spectroscopy, and X-ray optoelectronic spectrum analysis were used to investigate its interaction mechanisms.
2. Materials and Methods
2.1. Materials
Pure crystals of CuFeS2 and MoS2 obtained from a mine in Yunnan Province, China, were used as experimental samples in this research. The samples were first dry-crushed, and then the crushed mineral was “hand-picked” to reject any pieces containing visible non-sulfide mineral impurities. Then, the minerals were ground and screeded as a size fraction of −74 + 38 μm. The XRD (X-ray diffraction, D8 ADVANCE, Bruker AXS, Karlsruhe, Germany) patterns of chalcopyrite and molybdenite are given in Figure 1. The chemical composition analysis (Table 1) of samples showed that the purity of chalcopyrite and molybdenite was 95% and 96%, respectively, which met the test requirements. Potassium amyl xanthate (PAX) and kerosene were used as the collectors of chalcopyrite and molybdenite, respectively. Methyl isobutyl carbinol (MIBC) was used as a frother in all flotation experiments. GX2 was synthesized (mainly contains trithiocarbonate) in our laboratory and introduced as the chalcopyrite depressant to compare with the standard Na2S (95% purity). After the analysis and comparison, it was concluded that GX2 is characterized by low toxicity, low cost, and high solubility compared to Na2S. Hydrochloric acid (HCl) and sodium hydroxide (NaOH) were used as pH regulators to adjust the pulp pH. All of the above reagents were of analytical purity (>99%), and deionized water (conductivity < 5 μs/cm) was used throughout this work.
2.2. Flotation Tests
The flowsheet and conditions of flotation tests are given in Figure 2. About 2.5 g of the −74 + 38 μm size fraction of chalcopyrite was weighed on an analytical balance and placed in a 150 mL beaker. The pre-weighed amount of the mineral was mixed with 140 mL of distilled water. The mixture was placed for precisely 1 min in an ultrasonic bath (TQ-100MV). The beaker was then quickly removed from the bath and allowed to settle for 30 s. Fine fractions were then removed by decanting the suspension. This desliming procedure was repeated an additional two times until no slime was left in the suspension, with the last decanting step performed with 0.001 M KNO3 as the background electrolyte. Finally, a total of 2.0 g of chalcopyrite was obtained from the desliming process. Then, the deslimed chalcopyrite was first conditioned with 50 mL of a 0.001 M KNO3 solution for about 2 min, and the pH was adjusted to reach the experimental setting. After the measurement of pulp pH and Eh, a suitable amount of the depressant stock solution was added to the mixture, and the entire suspension was conditioned for a further 10 min. Afterward, an aliquot of a stock xanthate solution (1.0 g/L) or kerosene was added to achieve a specific final collector concentration (10 mg/L), and the mixture was allowed to condition for another 5 min. As described above, the standard reagent injection order was depressant first, followed by xanthate. The suspension was then transferred into a Hallimond tube and allowed 3 min flotation while nitrogen was passed through during the experiments. The concentrate and tailing were collected separately and weighed after drying. In the case of the artificial-mixed-ore test, the mass ratio of chalcopyrite and molybdenite was 3:1, with a total feed amount of 2.0 g, and the other conditions were the same as in the single-mineral flotation test.
2.3. Contact Angle Measurements
The contact angle of the minerals was measured using a JC2000C1 (Shanghai Zhongchen Digital Technology Equipment Co., Ltd., Shanghai, China) with the sessile drop method. Pure minerals with a particle size of −74 + 38 μm for flotation tests were used for contact angle measurements. After adjusting the pH to the required value, the mineral was conditioned at a certain concentration of depressant and stirred for a certain period, as described for the flotation tests, and then the suspension was filtered and dried in a vacuum oven at 25 °C for 12 h. Then, the prepared samples were tableted using a mold and included in the measurement process. Each contact angle test was conducted at least thrice, and the results reported are an average of three replicates.
2.4. Zeta-Potential Measurements
The zeta potential of the mineral surface was measured using a BcNano 90 Zeta (Bettersize Instruments Ltd., Dandong, China). A total of 0.4 g of a chalcopyrite or molybdenite sample (−38 μm) was put into a 50 mL beaker with an electrolyte solution of 0.01 M KNO3, and the suspension was dispersed by ultrasonic treatment for 2 min. Then, the pH value of the pulp was adjusted with either dilute sodium hydroxide or hydrochloric acid solution after adding a certain concentration of the depressant. After 5 min of agitation, followed by another 15 min for sedimentation, the supernatant was collected for the zeta-potential measurement.
2.5. FTIR Spectral Measurements
The infrared spectrometer measurements were recorded on a model Vertex 70v spectrometer (Bruker, Germany). A total of 1.0 g of a chalcopyrite or molybdenite sample (−38 μm) was mixed with 30 mL of an electrolyte solution of 0.01 M KNO3 in a 100 mL beaker and dispersed via ultrasonic treatment for 2 min. Then, the pH of the suspension was adjusted with diluted NaOH or HCl to reach the required value after adding a certain concentration of depressant. After 30 min of conditioning, the suspension was filtered, and the collected mineral was dried in a vacuum oven at 25 °C. The infrared spectra of the samples were acquired at room temperature in the range of 500–400 cm−1.
2.6. XPS Measurements
The X-ray Photoelectron Spectroscopy (XPS) test was performed on a Thermo Scientific K-Alpha XPS system (Thermo Fisher Scientific, Runcorn, UK). The sample preparation process was the same as the method described in Section 2.5. The collected data were analyzed with a Thermo Fisher Scientific Avantage 5.52 using the Shirley background subtraction and Gaussian/Lorentzian function. The binding energy was calibrated based on C 1s at 284.8 eV.
3. Results and Discussion
3.1. Single-Mineral Flotation
The effect of the collector (PAX and kerosene) and its dosage (10–50 mg/L) on the flotation of chalcopyrite and molybdenite were investigated under the conditions of pH 7, 10 mg/L MIBC, and a flotation time of 3 min. The results are shown in Figure 3a,b. It is confirmed that neither chalcopyrite nor molybdenite has very strong natural floatability; therefore, the recovery reaches around 90% at a PAX dosage of 10 mg/L. As can be seen in Figure 3a, the chalcopyrite and molybdenite recoveries do not significantly increase when increasing the PAX dosage to 50 mg/L. In the case of kerosene as a collector, the mineral recovery increased as the dosage rose from 10 to 50 mg/L. At a dosage of 20 mg/L, the recoveries of chalcopyrite and molybdenite were 90% and 92%, respectively. It should be pointed out that kerosene could be a favorable collector for both chalcopyrite and molybdenite; however, the recovery of molybdenite is always higher than that of chalcopyrite, indicating that kerosene is more suitable for molybdenite. Therefore, kerosene was selected as the collector for chalcopyrite and molybdenite flotation.
The effect of solution pH on the floatability of chalcopyrite and molybdenite was tested under the fixed conditions of 20 mg/L kerosene, 10 mg/L MIBC, and a flotation time of 3 min, and the results are given in Figure 4. It can be seen that both chalcopyrite and molybdenite showed good floatability within a wide pH range between 2.0 and 12.0. The recoveries of chalcopyrite and molybdenite reached almost 90% and then decreased at pH greater than 10.0. The chalcopyrite and molybdenite recoveries were 89% and 92%, with the pulp pH set at 10.0; therefore, it was applied as the optimal condition in the subsequent experiments.
According to the above results, it can be concluded that both chalcopyrite and molybdenite have excellent natural floatability, and adding a collector such as PAX can further enhance their flotation. Therefore, the depressant should be introduced into the suspension to enlarge their floatability difference and thereby achieve selective separation. The novel depressant GX2, which was synthesized in our laboratory, was introduced as the chalcopyrite depressant in this study. The effect of the GX2 dosage (0–80 mg/L) on the floatability of chalcopyrite and molybdenite was tested under the fixed conditions of 20 mg/L kerosene, 10 mg/L MIBC, pH 10.0, and a flotation time of 3 min, and the results are given in Figure 5. Obviously, the chalcopyrite recovery sharply decreased when increasing the GX2 dosage from 0 to 80 mg/L, and the minimum value was 5% only at a GX2 dosage of 80 mg/L. However, the molybdenite recovery did not change anymore with the addition of GX2 and remained around 90%.
3.2. Artificially Mixed Mineral Flotation
In order to further verify the separation effect of GX2 on chalcopyrite and molybdenite, a flotation test of artificially mixed ore (chalcopyrite-to-molybdenite mass ratio of 3:2) was conducted under the conditions of GX2 dosages of 0–80 mg/L or Na2S dosages of 30 and 300 mg/L, 20 mg/L kerosene, 10 mg/L MIBC, pH 10.0, and a flotation time of 3 min, and the results are shown in Figure 6. As can be seen in Figure 6, the recoveries of chalcopyrite and molybdenite is about 90% without adding a depressant (GX2), which is consistent with the results of the single-mineral flotation test. However, chalcopyrite recovery rapidly drops to below 5% when increasing the GX2 dosage to 60 mg/L. In comparison, the molybdenite recovery remains over 90%, indicating that GX2 can strongly depress chalcopyrite but does not affect molybdenite anymore; i.e., it has excellent selectivity for separating molybdenite from chalcopyrite. Compared with the Na2S baseline (see Figure 7), the recoveries of molybdenite and chalcopyrite were 10% and 90%, respectively, using 30 mg/L GX2; however, these values were 60% and 90%, respectively, when using 30 mg/L Na2S. The chalcopyrite and molybdenite recoveries were 20% and 80%, respectively, when increasing the Na2S dosage to 300 mg/L, which is similar to the result obtained at 30 mg/L GX2. The results indicate that GX2 is a more powerful depressant compared with the baseline of Na2S.
3.3. Contact Angle Measurements
The results of contact angle measurements with various GX2 dosages (0–80 mg/L) are presented in Figure 8. The contact angles of chalcopyrite and molybdenite were 60° and 90°, respectively, without the addition of GX2, i.e., a GX2 dosage of 0 mg/L, which is similar to that reported by other researchers [4,22]. The contact angle of chalcopyrite decreased from 60° to 30° after being treated with a GX2 solution, indicating that chalcopyrite became more hydrophilic after interacting with the depressant. In contrast, the contact angle of molybdenite did not change when treated with GX2 and remained around 90° with a wide range of depressant dosages (from 0 to 80 mg/L), which is in excellent agreement with the results obtained in the flotation tests.
The contact angle tests provided enough direct visual evidence for the flotation separation of molybdenite from chalcopyrite. GX2 can reduce the floatability of chalcopyrite and does not affect that of molybdenite; i.e., the depressant can enlarge their floatability difference and achieve selective separation.
3.4. Zeta-Potential Measurements
To investigate the potential determining effect of GX2 at the solid–liquid interface of sulfide minerals, zeta-potential tests were conducted in the pH range of 2.0–12.0. Figure 9 illustrates that the zeta potentials of chalcopyrite and molybdenite decreased with the increase in pH over the entire range of tested pH. It can be seen that molybdenite is always negatively charged at all pH values in all conditions tested. The electronegativity on the molybdenite surface increases significantly in the pH range of 4.0 to 8.0, probably due to the oxidation and hydrolysis of MoO3 to HMoO4− and MoO42−. In addition, the results clearly show that the zeta potential of molybdenite treated with GX2 is shifted toward a low electronegativity, indicating that the presence of GX2 has little impact on the zeta potential of molybdenite and only promotes a small decrease in its electronegativity.
On the other hand, it is clear that after the addition of 30 mg/L GX2, the zeta potential of chalcopyrite showed an overall downward trend, and the potential decrease was most significant at pH from 8.0 to 12.0. The value of chalcopyrite’s isoelectronic point (IEP) was pH 4.0, which is very close to the values reported by other researchers [4,23]. It must be noted that the value of the IEP of chalcopyrite varies in the literature [20,24,25]. The sulfide surface–solution interface is affected by the oxidation state of the mineral surface, mineral purity, preconditioning, and pretreatment [23]. As a result, the same sulfide minerals can have variable isoelectronic points. Compared with the untreated chalcopyrite, the zeta potential of the sulfide minerals is more negative after interacting with GX2 in all tested pH ranges. This decline in zeta potential indicates the specific adsorption of GX2 and its decomposition species on the chalcopyrite.
Moreover, the shift for chalcopyrite was more significant than for molybdenite, suggesting that GX2 adsorbed more intensely on the chalcopyrite surface relative to molybdenite in the tested pH range. This phenomenon can be explained by more negative charges on the chalcopyrite surface than on molybdenite.
3.5. FTIR Measurements
FTIR measurements are useful in characterizing the possible adsorption mechanism of flotation reagents on mineral surfaces. Figure 10 shows the infrared spectrum of GX2 and minerals (chalcopyrite and molybdenite) before and after being treated with GX2.
In the spectrum of GX2 shown in Figure 10a, the absorption peaks at 1147.97 cm−1 are assigned to the C=S stretching mode (1250–1020 cm−1) [26,27,28]. Absorption peaks at 1615.47 cm−1 and 1434.53 cm−1 appear in the spectrum of GX2 and are assigned to the unsaturated C=C vibration band of the benzene ring and the -CH2- stretching vibration band, respectively. The peaks located at 916.97 cm−1 and 680.85 cm−1 correspond to the stretching vibration band of C-S [29]. A peak at 490.76 cm−1 appears in the spectrum of GX2 and is probably caused by the stretching vibration of Na-S because the bands of M (metal)-S are usually located in the wavenumber range below 500 cm−1 [26].
After being treated with GX2, the characteristic absorption peaks of C-S (1022.59 cm−1) and -CH- (1447.35 cm−1) appeared in the chalcopyrite spectrum, indicating the adsorption of GX2 on the chalcopyrite surface. Additionally, two new peaks appeared at 466.80 cm−1 and 797.11 cm−1, which could be assigned to the stretching vibration of Cu-S. This evidence suggests that GX2 may act on the surface of chalcopyrite via chemisorption. However, an interesting phenomenon noted is that the characteristic peak of GX2 did not appear in the GX2-treated molybdenite spectrum (Figure 10b), which is almost the same as the case of molybdenite only. The results indicate that GX2 can selectively adsorb on the chalcopyrite surface but not on the molybdenite surface; Cu2+ or Cu sites on the chalcopyrite can chelate with the GX2 action group. These results are consistent with the flotation tests in Section 3.1 and Section 3.2.
3.6. XPS Analysis
In order to investigate the adsorption mechanism of GX2 on the chalcopyrite surface, XPS tests of GX2 and chalcopyrite treated with/without GX2 were conducted, and the results are given in Figure 11. The C 1s spectra of GX2 and chalcopyrite before and after treatment with GX2 are shown in Figure 11a. The C 1s peaks of untreated chalcopyrite are located at 284.80 eV (C-C or C-H), 286.38 eV (C-OH or C-O-C), and 289.08 eV (C=O). The three peaks at 284.80 eV, 286.25 eV, and 288.84 eV in chalcopyrite after GX2 treatment may represent C-C or C-H, C-S or C-O, and C atoms bonded to O/S (C=S/C=O), respectively [18].
The high-resolution Cu 2p spectra of GX2 and chalcopyrite after treatment with GX2 are shown in Figure 11b. The Cu 2p XPS spectrum of the original chalcopyrite is divided into two peaks, i.e., 2p3/2 and 2p1/2, among which the Cu 2p3/2 peak is fitted to 932.25 eV and 935.24 eV, corresponding to CuFeS2 and Cu(OH)2, respectively, which is consistent with the reports in the literature [30,31]. It is important to note that the generation of Cu(OH)2 might result from the slight oxidation of the surface of the untreated chalcopyrite caused by the KNO3 background aqueous solution or exposure to air. It was found that after treatment with GX2, the Cu 2p3/2 peak shifted from 932.25 eV to a lower binding energy of 931.75 eV, with a difference of 0.5 eV. The decrease in binding energy might result from an increased Cu(I) electron density, indicating that Cu obtained electrons from GX2 or that GX2 strongly interacted with Cu(I) on the chalcopyrite surface. This evidence demonstrated that a chemical reaction had taken place between chalcopyrite and GX2; i.e., GX2 may adsorb on the chalcopyrite surface via chemisorption.
The Fe 2p spectra of chalcopyrite before and after GX2 treatment are shown in Figure 11c. In the case of untreated chalcopyrite, the peak located at 708.32 eV (Fe 2p3/2) corresponds to chalcopyrite [32,33], and the peaks at 711.41 eV (Fe 2p3/2) and 714.12 eV (Fe 2p3/2) correspond to FeOOH and Fe2(SO4)3, respectively [34]. It is noted that the Fe 2p peak shifted from 708.32 eV to 708.04 eV after treating chalcopyrite with GX2. The peak located at 708.04 eV can be attributed to pyrite (FeS2), which is also demonstrated by the S 2p spectrum (162.61 eV). Furthermore, it can be seen in Figure 11b,c that the binding energy of both Cu 2p (Cu 2p3/2) and Fe 2p (Fe 2p3/2) shifted to a lower value after treatment with GX2, where the decreases are −0.5 eV and −1.92 eV and −0.28 eV, −0.13 eV, and −0.34 eV, respectively. It is clear that the binding energy changes in Cu 2p are much greater than those of Fe 2p, suggesting that GX2 may be more prone to react with Cu atoms on the chalcopyrite surface.
The high-resolution S 2p spectra of GX2 and chalcopyrite before/after GX2 treatment are shown in Figure 11d. The fitted S 2p spectrum of GX2 consisted of two components, i.e., C=S located at 161.63 eV [19] and -SH at 168.13 eV, indicating the existence of the main group of the GX2 structure. Four (4) distinctive binding energy peaks located at 161.12, 162.43, 164.70, and 168.65 eV appeared in the S 2p spectrum of untreated chalcopyrite and were assigned to monosulfide (S2−), disulfide (S22−), polysulfide (Sn2−/S0), and sulfate (SO42−), which is in good agreement with previous studies [35,36,37]. After being treated with GX2, the spectrum of chalcopyrite can be fitted to five binding energies at 161.11, 162.44, 164.56, 162.79, and 168.63 eV. The first three peaks correspond to monosulfides (S2−), disulfides (S22−), and polysulfides (Sn2−/S0), which are contributed by the original chalcopyrite. Moreover, the peaks at 162.79 eV and 168.63 eV are attributed to the components in GX2; however, the binding energies shifted upward by 1.16 eV and 0.5 eV, respectively, compared with those of GX2 only. The significant increase in binding energy demonstrates that the electron density of S atoms decreases after the adsorption of GX2 on the chalcopyrite surface, which may be due to the electron transfer of S atoms to the Cu atom, leading to the formation of a GX2-Cu complex after GX2 adsorption on the chalcopyrite surface. All of these results suggest that GX2 might adsorb on the chalcopyrite surface via chemisorption, which is in excellent agreement with the FT-IR results.
Figure 12a shows the Mo 3d energy spectra of molybdenite before and after GX2 treatment. It can be seen that four peaks at 226.83 eV, 229.62 eV, 232.76 eV, and 235.40 eV were found in the case of the original molybdenite. The peaks at 229.62 and 232.76 eV correspond to Mo 3d5/2 and Mo 3d3/2 arising from MoS2, representing 3d doublets with an energy difference of about 3.1 eV [38]. Additionally, the peaks at 226.83 and 235.40 eV can be provided by S 2s in MoS2 and Mo in MoO3. After GX2 treatment, all of these peaks shift to lower binding energies by 0.14, 0.08, 0.15, and 0.07 eV, respectively, and change to 229.48, 232.61, 226.75, and 235.33 eV, compared to the original molybdenite. It must be pointed out that the degree of the peak shift of the Cu 2p spectrum is higher after treatment with GX2 than that of the Mo 3d spectrum of molybdenite, which indicates that GX2 reacts more readily with chalcopyrite and the affinity for molybdenite is relatively weak. Figure 12b shows the S 2p spectra of molybdenite before and after GX2 treatment. The S 2p spectrum of untreated molybdenite has two main peaks at 162.50 and 163.69 eV, representing S 2p3/2 and S 2p1/2 of MoS2. On the other hand, the peak locations of S 2p3/2 and S 2p1/2 of MoS2 were slightly shifted to 162.44 and 163.61 eV, with energy offsets of 0.05 and 0.08 eV, respectively, indicating that GX2 does not influence molybdenite.
4. Conclusions
In this study, GX2 was used as a chalcopyrite depressant in the flotation separation of Cu-Mo sulfide ores. The flotation performance and its interaction mechanisms with chalcopyrite and molybdenite were investigated using single-mineral and artificial-mixed-ore flotation, contact angle measurements, zeta-potential measurements, infrared spectroscopy, and X-ray optoelectronic spectrum analysis.
The results presented in this work show that GX2 could selectively separate molybdenite from chalcopyrite, while around 90% of MoS2 was recovered in the concentrate and over 95% of CuFeS2 was rejected in the tailing, under the optimal conditions of pH 9.0, 80 mg/L GX2, 20 mg/L kerosene, 10 mg/L MIBC, and a flotation time of 3 min. It was confirmed that GX2 could save ten times the depressant dosage compared to that of the Na2S baseline and achieve a similar separation efficiency. The contact angle test, zeta-potential measurements, infrared spectra, and XPS results show that GX2 may chemically bond to Cu ions on the chalcopyrite surface through its function groups to form a GX2-Cu complex, which is a hydrophilic substance that could change its floatability. However, it does not substantially affect the floatability of molybdenite, resulting in the excellent separation efficiency of chalcopyrite and molybdenite via flotation.
Author Contributions
B.H. conceived and designed the experimental methodology; M.Y., L.J., W.X. and Y.L. performed the experiments and analyzed the data. B.H. contributed reagents and materials. All authors have read and agreed to the published version of the manuscript.
Funding
This research was funded by the Outstanding Young Talents Project of the University of Science and Technology Liaoning (grant number: 2021YQ05) and Liaoning Provincial Department of Education Fund (grant number: JYTMS20230953).
Data Availability Statement
Data are contained within the article.
Conflicts of Interest
The authors declare no conflict of interest.
References
- Suyantara, G.P.W.; Hirajima, T.; Miki, H.; Sasaki, K.; Yamane, M.; Takida, E.; Kuroiwa, S.; Imaizumi, Y. Effect of Fenton-like oxidation reagent on hydrophobicity and floatability of chalcopyrite and molybdenite. Colloids Surf. A Physicochem. Eng. Asp. 2018, 554, 34–48. [Google Scholar] [CrossRef]
- Castro, S.; Lopez-Valdivieso, A.; Laskowski, J.S. Review of the flotation of molybdenite. Part I: Surface properties and floatability. Int. J. Miner. Process. 2016, 148, 48–58. [Google Scholar] [CrossRef]
- Zhang, X.; Lu, L.; Cao, Y.; Yang, J.; Che, W.; Liu, J. The flotation separation of molybdenite from chalcopyrite using a polymer depressant and insights to its adsorption mechanism. Chem. Eng. J. 2020, 395, 125137. [Google Scholar] [CrossRef]
- Yang, B.; Yan, H.; Zeng, M.; Huang, P.; Jia, F.; Teng, A. A novel copper depressant for selective flotation of chalcopyrite and molybdenite. Miner. Eng. 2020, 151, 106309. [Google Scholar] [CrossRef]
- Ansari, A.; Pawlik, M. Floatability of chalcopyrite and molybdenite in the presence of lignosulfonates. Part II. Hallimond tube flotation. Miner. Eng. 2007, 20, 609–616. [Google Scholar] [CrossRef]
- Zhao, Q.; Liu, W.; Wei, D.; Wang, W.; Cui, B.; Liu, W. Effect of copper ions on the flotation separation of chalcopyrite and molybdenite using sodium sulfide as a depressant. Miner. Eng. 2018, 115, 44–52. [Google Scholar] [CrossRef]
- Yin, Z.; Sun, W.; Hu, Y.; Zhang, C.; Guan, Q.; Zhang, C. Separation of Molybdenite from Chalcopyrite in the Presence of Novel Depressant 4-Amino-3-thioxo-3,4-dihydro-1,2,4-triazin-5(2H)-one. Minerals 2017, 7, 146. [Google Scholar] [CrossRef]
- Xu, H.; Ye, T.; Zhang, X.; Lu, L.; Xiong, W.; Zhu, Y. Insights into the adsorption mechanism of N-thiourea-maleamic acid on chalcopyrite surface in the flotation separation of Cu-Mo sulfide ores. J. Mol. Liq. 2022, 350, 118554. [Google Scholar] [CrossRef]
- Wu, D.; Peng, H.; Abdalla, M. Effect of sodium sulfide waste water recycling on the separation of chalcopyrite and molybdenite. Physicochem. Probl. Miner. Process. 2017, 54, 629–638. [Google Scholar] [CrossRef]
- Mweene, L.; Khanal, G.P.; Kawala, J.; Subramanian, S. Investigations into the flotation of molybdenite in the presence of chalcopyrite using (3S,4S,5S,6R)-3,4,5,6-tetrahydroxyoxane-2-carboxylate acid as a novel selective depressant: An experimental and theoretical perspective. J. Mol. Liq. 2022, 368, 120661. [Google Scholar] [CrossRef]
- Yin, Z.; Sun, W.; Hu, Y.; Zhang, C.; Guan, Q.; Liu, R.; Chen, P.; Tian, M. Utilization of acetic acid-[(hydrazinylthioxomethyl)thio]-sodium as a novel selective depressant for chalcopyrite in the flotation separation of molybdenite. Sep. Purif. Technol. 2017, 179, 248–256. [Google Scholar] [CrossRef]
- Yin, Z.; Sun, W.; Hu, Y.; Liu, R.; Jiang, W.; Zhang, C.; Guan, Q.; Zhang, C. Synthesis of acetic acid-[(hydrazinylthioxomethyl)thio]-sodium and its application on the flotation separation of molybdenite from galena. J. Ind. Eng. Chem. 2017, 52, 82–88. [Google Scholar] [CrossRef]
- Zhang, W.J.; Jin, X.; Feng, Z.T.; Zheng, R.J.; Cao, J.; Chen, J.; Sun, W.; Xu, S.H.; Gao, Z.Y. Collectorless flotation separation of molybdenite from complex sulfide minerals employing a bi-carbonyl depressant. Sep. Purif. Technol. 2023, 322, 124207. [Google Scholar] [CrossRef]
- Wang, X.; Zhao, B.; Liu, J.; Zhu, Y.; Han, Y. Dithiouracil, a highly efficient depressant for the selective separation of molybdenite from chalcopyrite by flotation: Applications and mechanism. Miner. Eng. 2022, 175, 107287. [Google Scholar] [CrossRef]
- Li, M.-Y.; Wei, D.-Z.; Shen, Y.-B.; Liu, W.-G.; Gao, S.-L.; Liang, G.-Q. Selective depression effect in flotation separation of copper–molybdenum sulfides using 2,3-disulfanylbutanedioic acid. Trans. Nonferrous Met. Soc. China 2015, 25, 3126–3132. [Google Scholar] [CrossRef]
- Li, M.; Wei, D.; Liu, Q.; Liu, W.; Zheng, J.; Sun, H. Flotation separation of copper–molybdenum sulfides using chitosan as a selective depressant. Miner. Eng. 2015, 83, 217–222. [Google Scholar] [CrossRef]
- Yin, Z.; Sun, W.; Hu, Y.; Zhai, J.; Guan, J. Evaluation of the replacement of NaCN with depressant mixtures in the separation of copper–molybdenum sulphide ore by flotation. Sep. Purif. Technol. 2017, 173, 9–16. [Google Scholar] [CrossRef]
- Yin, Z.-G.; Sun, W.; Hu, Y.-H.; Guan, Q.-J.; Zhang, C.-H.; Gao, Y.-S.; Zhai, J.-H. Depressing behaviors and mechanism of disodium bis (carboxymethyl) trithiocarbonate on separation of chalcopyrite and molybdenite. Trans. Nonferrous Met. Soc. China 2017, 27, 883–890. [Google Scholar] [CrossRef]
- Yin, Z.G.; Hu, Y.H.; Sun, W.; Zhang, C.Y.; He, J.Y.; Xu, Z.J.; Zou, J.X.; Guan, C.P.; Zhang, C.H.; Guan, Q.J.; et al. Adsorption Mechanism of 4-Amino-5-mercapto-1,2,4-triazole as Flotation Reagent on Chalcopyrite. Langmuir 2018, 34, 4071–4083. [Google Scholar] [CrossRef]
- Guan, C.; Yin, Z.; Ahmed Khoso, S.; Sun, W.; Hu, Y. Performance Analysis of Thiocarbonohydrazide as a Novel Selective Depressant for Chalcopyrite in Molybdenite-Chalcopyrite Separation. Minerals 2018, 8, 142. [Google Scholar] [CrossRef]
- Chen, J.-H.; Lan, L.-H.; Liao, X.-J. Depression effect of pseudo glycolythiourea acid in flotation separation of copper–molybdenum. Trans. Nonferrous Met. Soc. China 2013, 23, 824–831. [Google Scholar] [CrossRef]
- Li, Y.; Yang, X.; Fu, J.; Li, W.; Hu, C. New insights into the beneficial roles of dispersants in reducing negative influence of Mg2+ on molybdenite flotation. RSC Adv. 2020, 10, 27401–27406. [Google Scholar] [CrossRef]
- Reyes-Bozo, L.; Escudey, M.; Vyhmeister, E.; Higueras, P.; Godoy-Faúndez, A.; Salazar, J.L.; Valdés-González, H.; Wolf-Sepúlveda, G.; Herrera-Urbina, R. Adsorption of biosolids and their main components on chalcopyrite, molybdenite and pyrite: Zeta potential and FTIR spectroscopy studies. Miner. Eng. 2015, 78, 128–135. [Google Scholar] [CrossRef]
- Yin, Z.; Chen, S.; Xu, Z.; Zhang, C.; He, J.; Zou, J.; Chen, D.; Sun, W. Flotation separation of molybdenite from chalcopyrite using an environmentally-efficient depressant L-cysteine and its adsoption mechanism. Miner. Eng. 2020, 156, 106438. [Google Scholar] [CrossRef]
- Yan, H.; Yang, B.; Zeng, M.; Huang, P.; Teng, A. Selective flotation of Cu-Mo sulfides using xanthan gum as a novel depressant. Miner. Eng. 2020, 156, 106486. [Google Scholar] [CrossRef]
- Chen, A.L.; Zhao, Z.W.; Chen, X.Y.; Liu, X.H.; Cao, C.F. Decoppering capability of nickel thiocarbonate in nickel electrolyte. Hydrometallurgy 2014, 144, 23–26. [Google Scholar] [CrossRef]
- Burke, J.M.; Fackler, J.P., Jr. Vibrational spectra of the thiocarbonate complexes of nickel (II), palladium (II), and platinum (II). Inorg. Chem. 1972, 11, 2744–2749. [Google Scholar] [CrossRef]
- Sahibed-Dine, A.; Aboulayt, A.; Bensitel, M.; Mohammed-Saad, A.B.; Daturi, M.; Lavalley, J.C. IR study of CS2 adsorption on metal oxides: Relation with their surface oxygen basicity and mobility. J. Mol. Catal. A Chem. 2000, 162, 125–134. [Google Scholar] [CrossRef]
- Kardouche, N.G.; Owen, L.N. Dithiols. Part XXVII. Conversion of aliphatic and alicyclic carbonates and thiocarbonates into trithiocarbonates. J. Chem. Soc. Perkin Trans. 1975, 1, 754–761. [Google Scholar] [CrossRef]
- Chimonyo, W.; Wiese, J.; Corin, K.; O’Connor, C. The use of oxidising agents for control of electrochemical potential in flotation. Miner. Eng. 2017, 109, 135–143. [Google Scholar] [CrossRef]
- Chen, Y.; Chen, X.; Peng, Y. The depression of molybdenite flotation by sodium metabisulphite in fresh water and seawater. Miner. Eng. 2021, 168, 106939. [Google Scholar] [CrossRef]
- Chen, G.B.; Sun, J.R.; Yang, H.Y.; Ma, P.C.; Gao, S.X. Rapid Atmospheric Leaching of Chalcopyrite Using a Novel Reagent of Trichloroisocyanuric Acid. Minerals 2021, 11, 1012. [Google Scholar] [CrossRef]
- Khoshkhoo, M.; Dopson, M.; Shchukarev, A.; Sandström, Å. Chalcopyrite leaching and bioleaching: An X-ray photoelectron spectroscopic (XPS) investigation on the nature of hindered dissolution. Hydrometallurgy 2014, 149, 220–227. [Google Scholar] [CrossRef]
- Miki, H.; Hirajima, T.; Muta, Y.; Suyantara, G.; Sasaki, K. Effect of Sodium Sulfite on Floatability of Chalcopyrite and Molybdenite. Minerals 2018, 8, 172. [Google Scholar] [CrossRef]
- Yang, Y.; Harmer, S.; Chen, M. Synchrotron-based XPS and NEXAFS study of surface chemical species during electrochemical oxidation of chalcopyrite. Hydrometallurgy 2015, 156, 89–98. [Google Scholar] [CrossRef]
- Chanturia, V.A.; Bunin, I.Z.; Ryazantseva, M.V.; Khabarova, I.A. X-ray photoelectron spectroscopy-based analysis of change in the composition and chemical state of atoms on chalcopyrite and sphalerite surface before and after the nanosecond electromagnetic pulse treatment. J. Min. Sci. 2013, 49, 489–498. [Google Scholar] [CrossRef]
- Harmer, S.L.; Thomas, J.E.; Fornasiero, D.; Gerson, A.R. The evolution of surface layers formed during chalcopyrite leaching. Geochim. Cosmochim. Acta 2006, 70, 4392–4402. [Google Scholar] [CrossRef]
- Wang, H.W.; Skeldon, P.; Thompson, G.E. XPS studies of MoS2 formation from ammonium tetrathiomolybdate solutions. Surf. Coat. Technol. 1997, 91, 200–207. [Google Scholar] [CrossRef]
Figure 1.
XRD patterns of (a) chalcopyrite and (b) molybdenite.
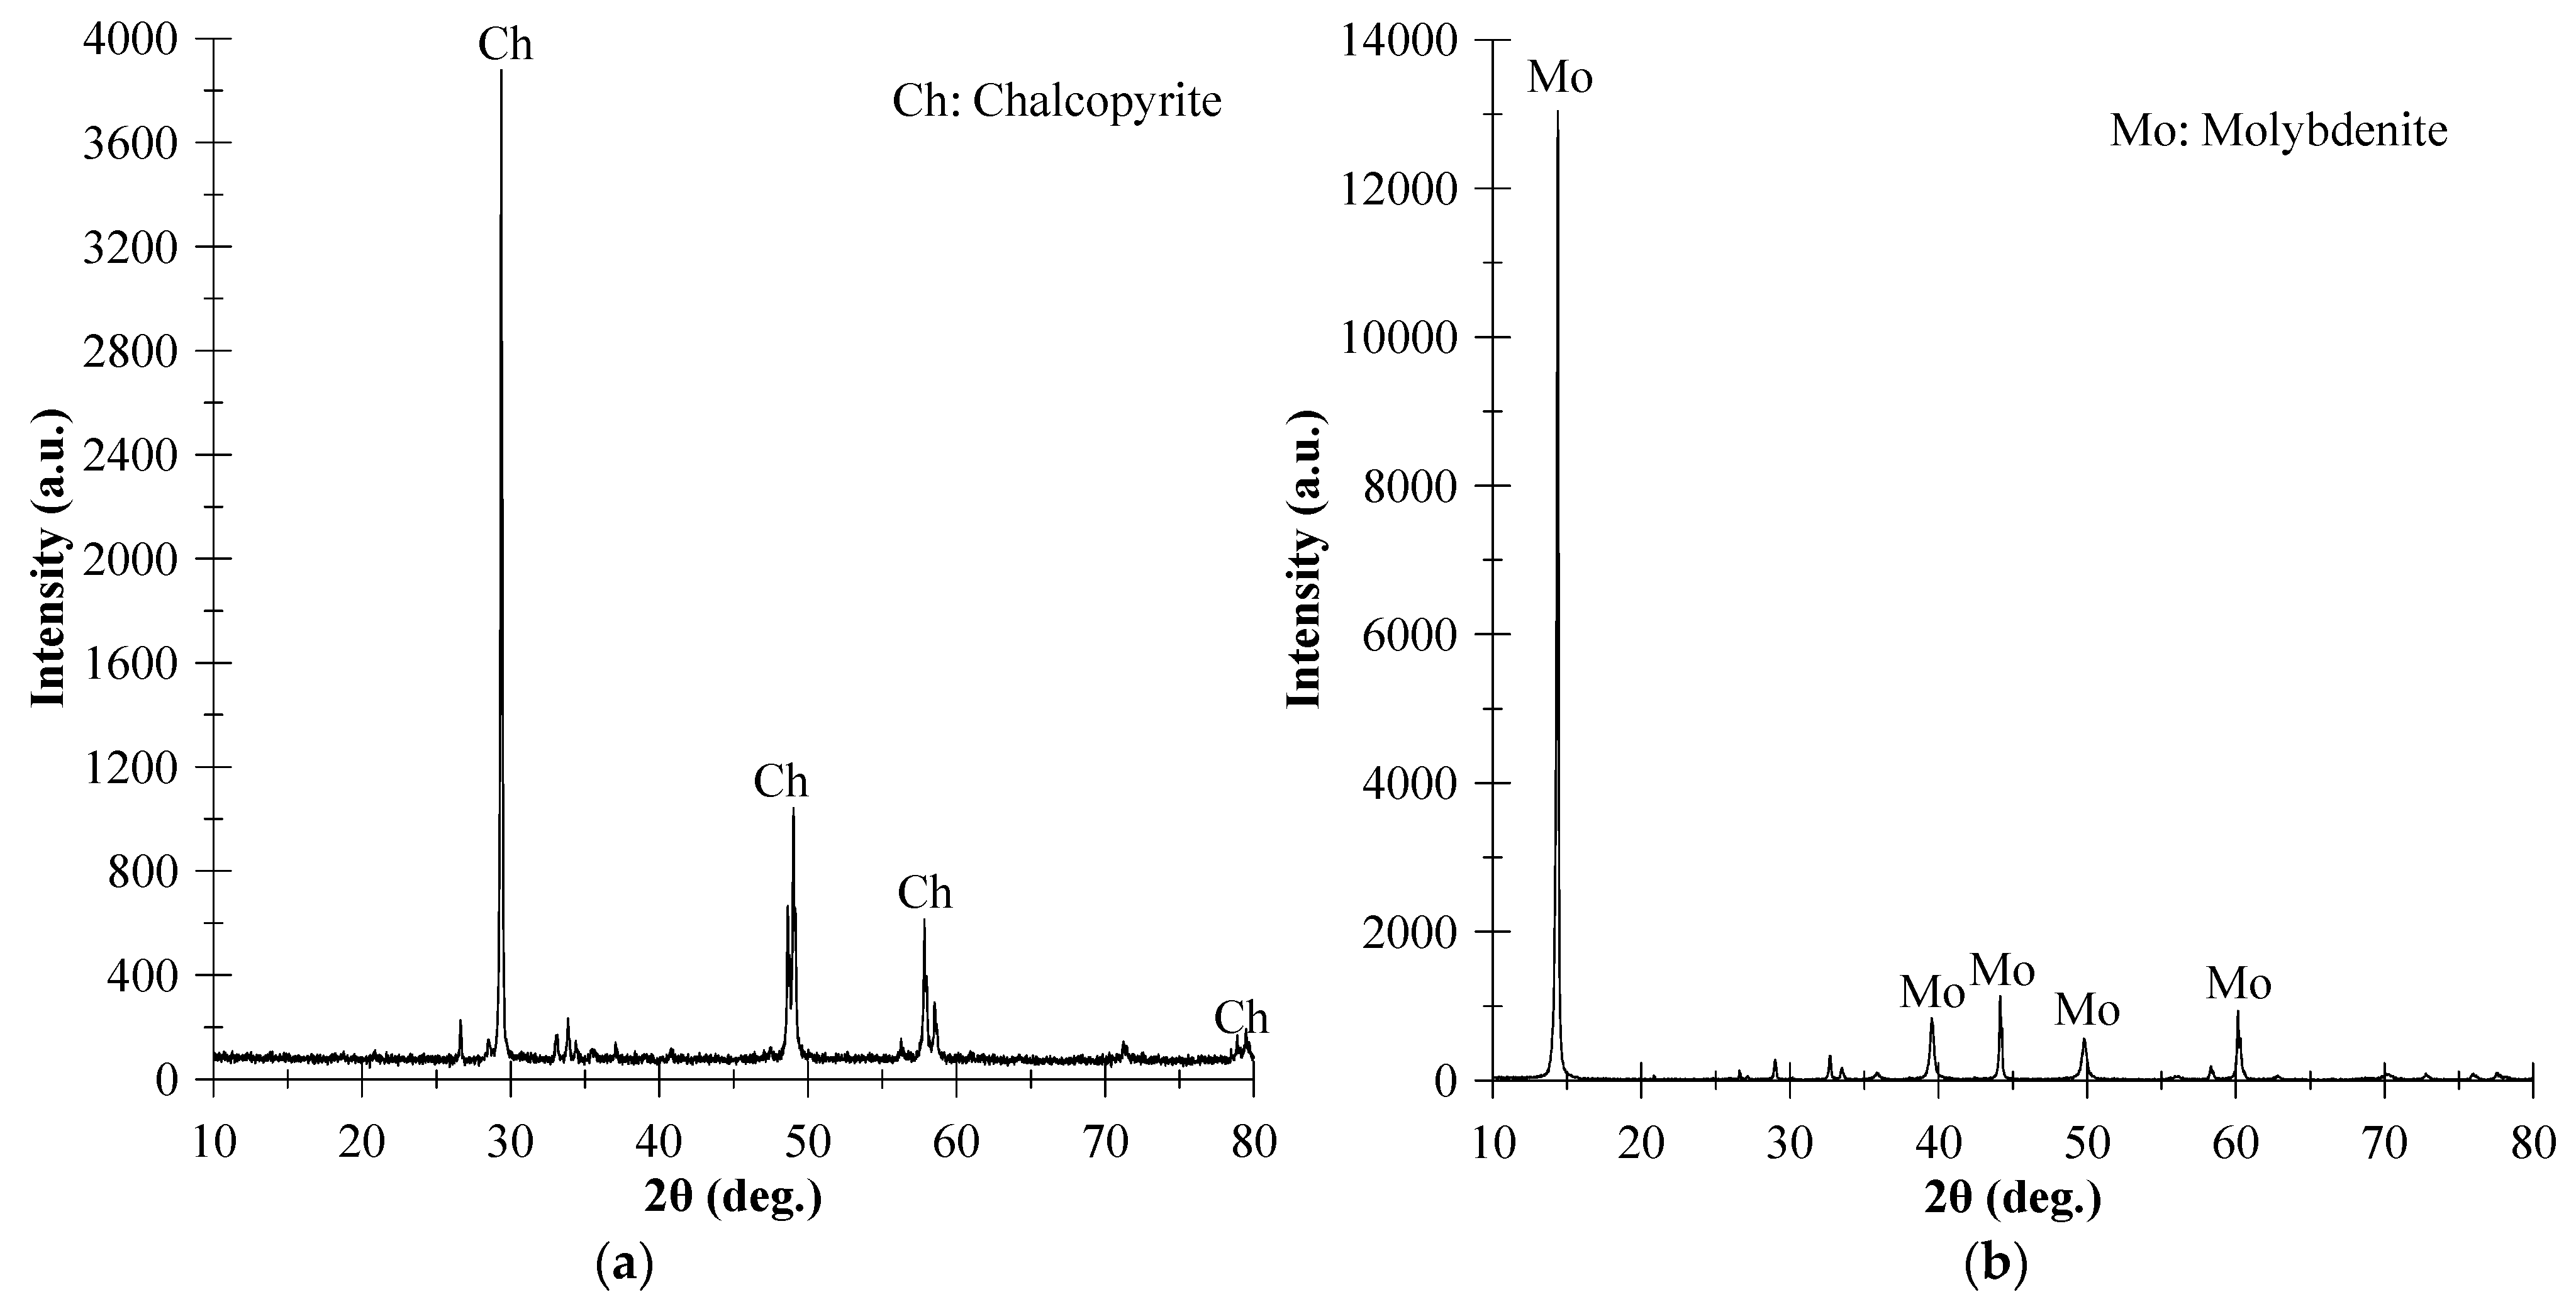
Figure 2.
The flowsheet and conditions of flotation tests.

Figure 3.
The effect of (a) PAX and (b) kerosene dosage on chalcopyrite and molybdenite flotation.
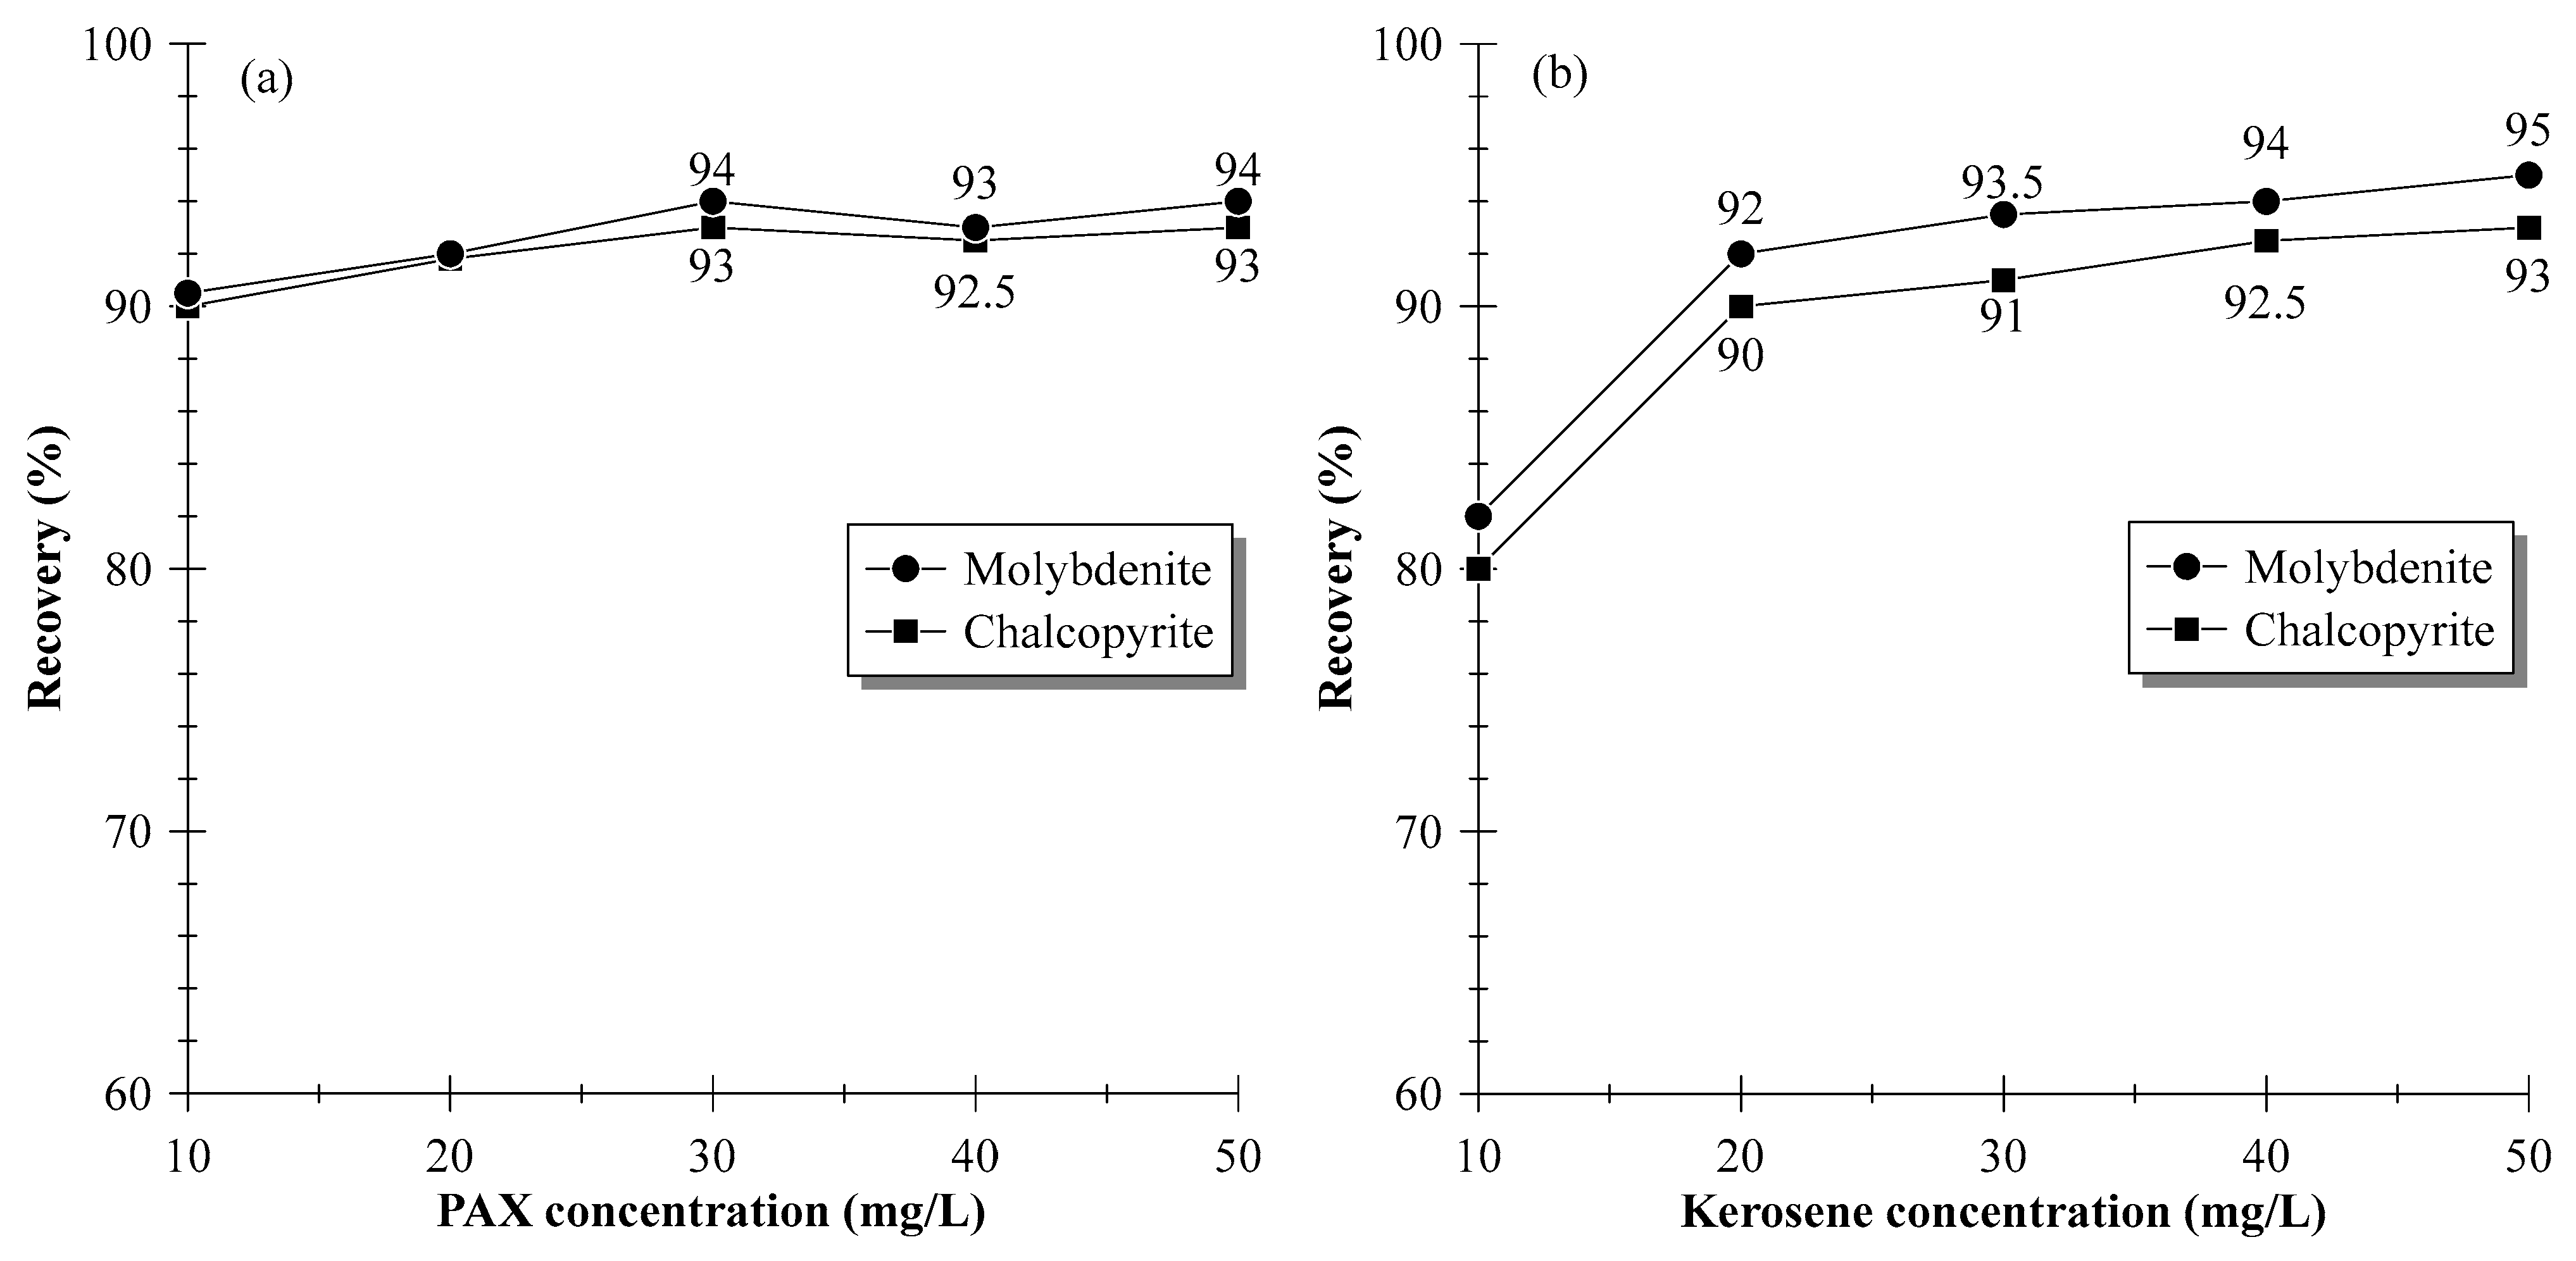
Figure 4.
The effect of pH on chalcopyrite and molybdenite flotation.
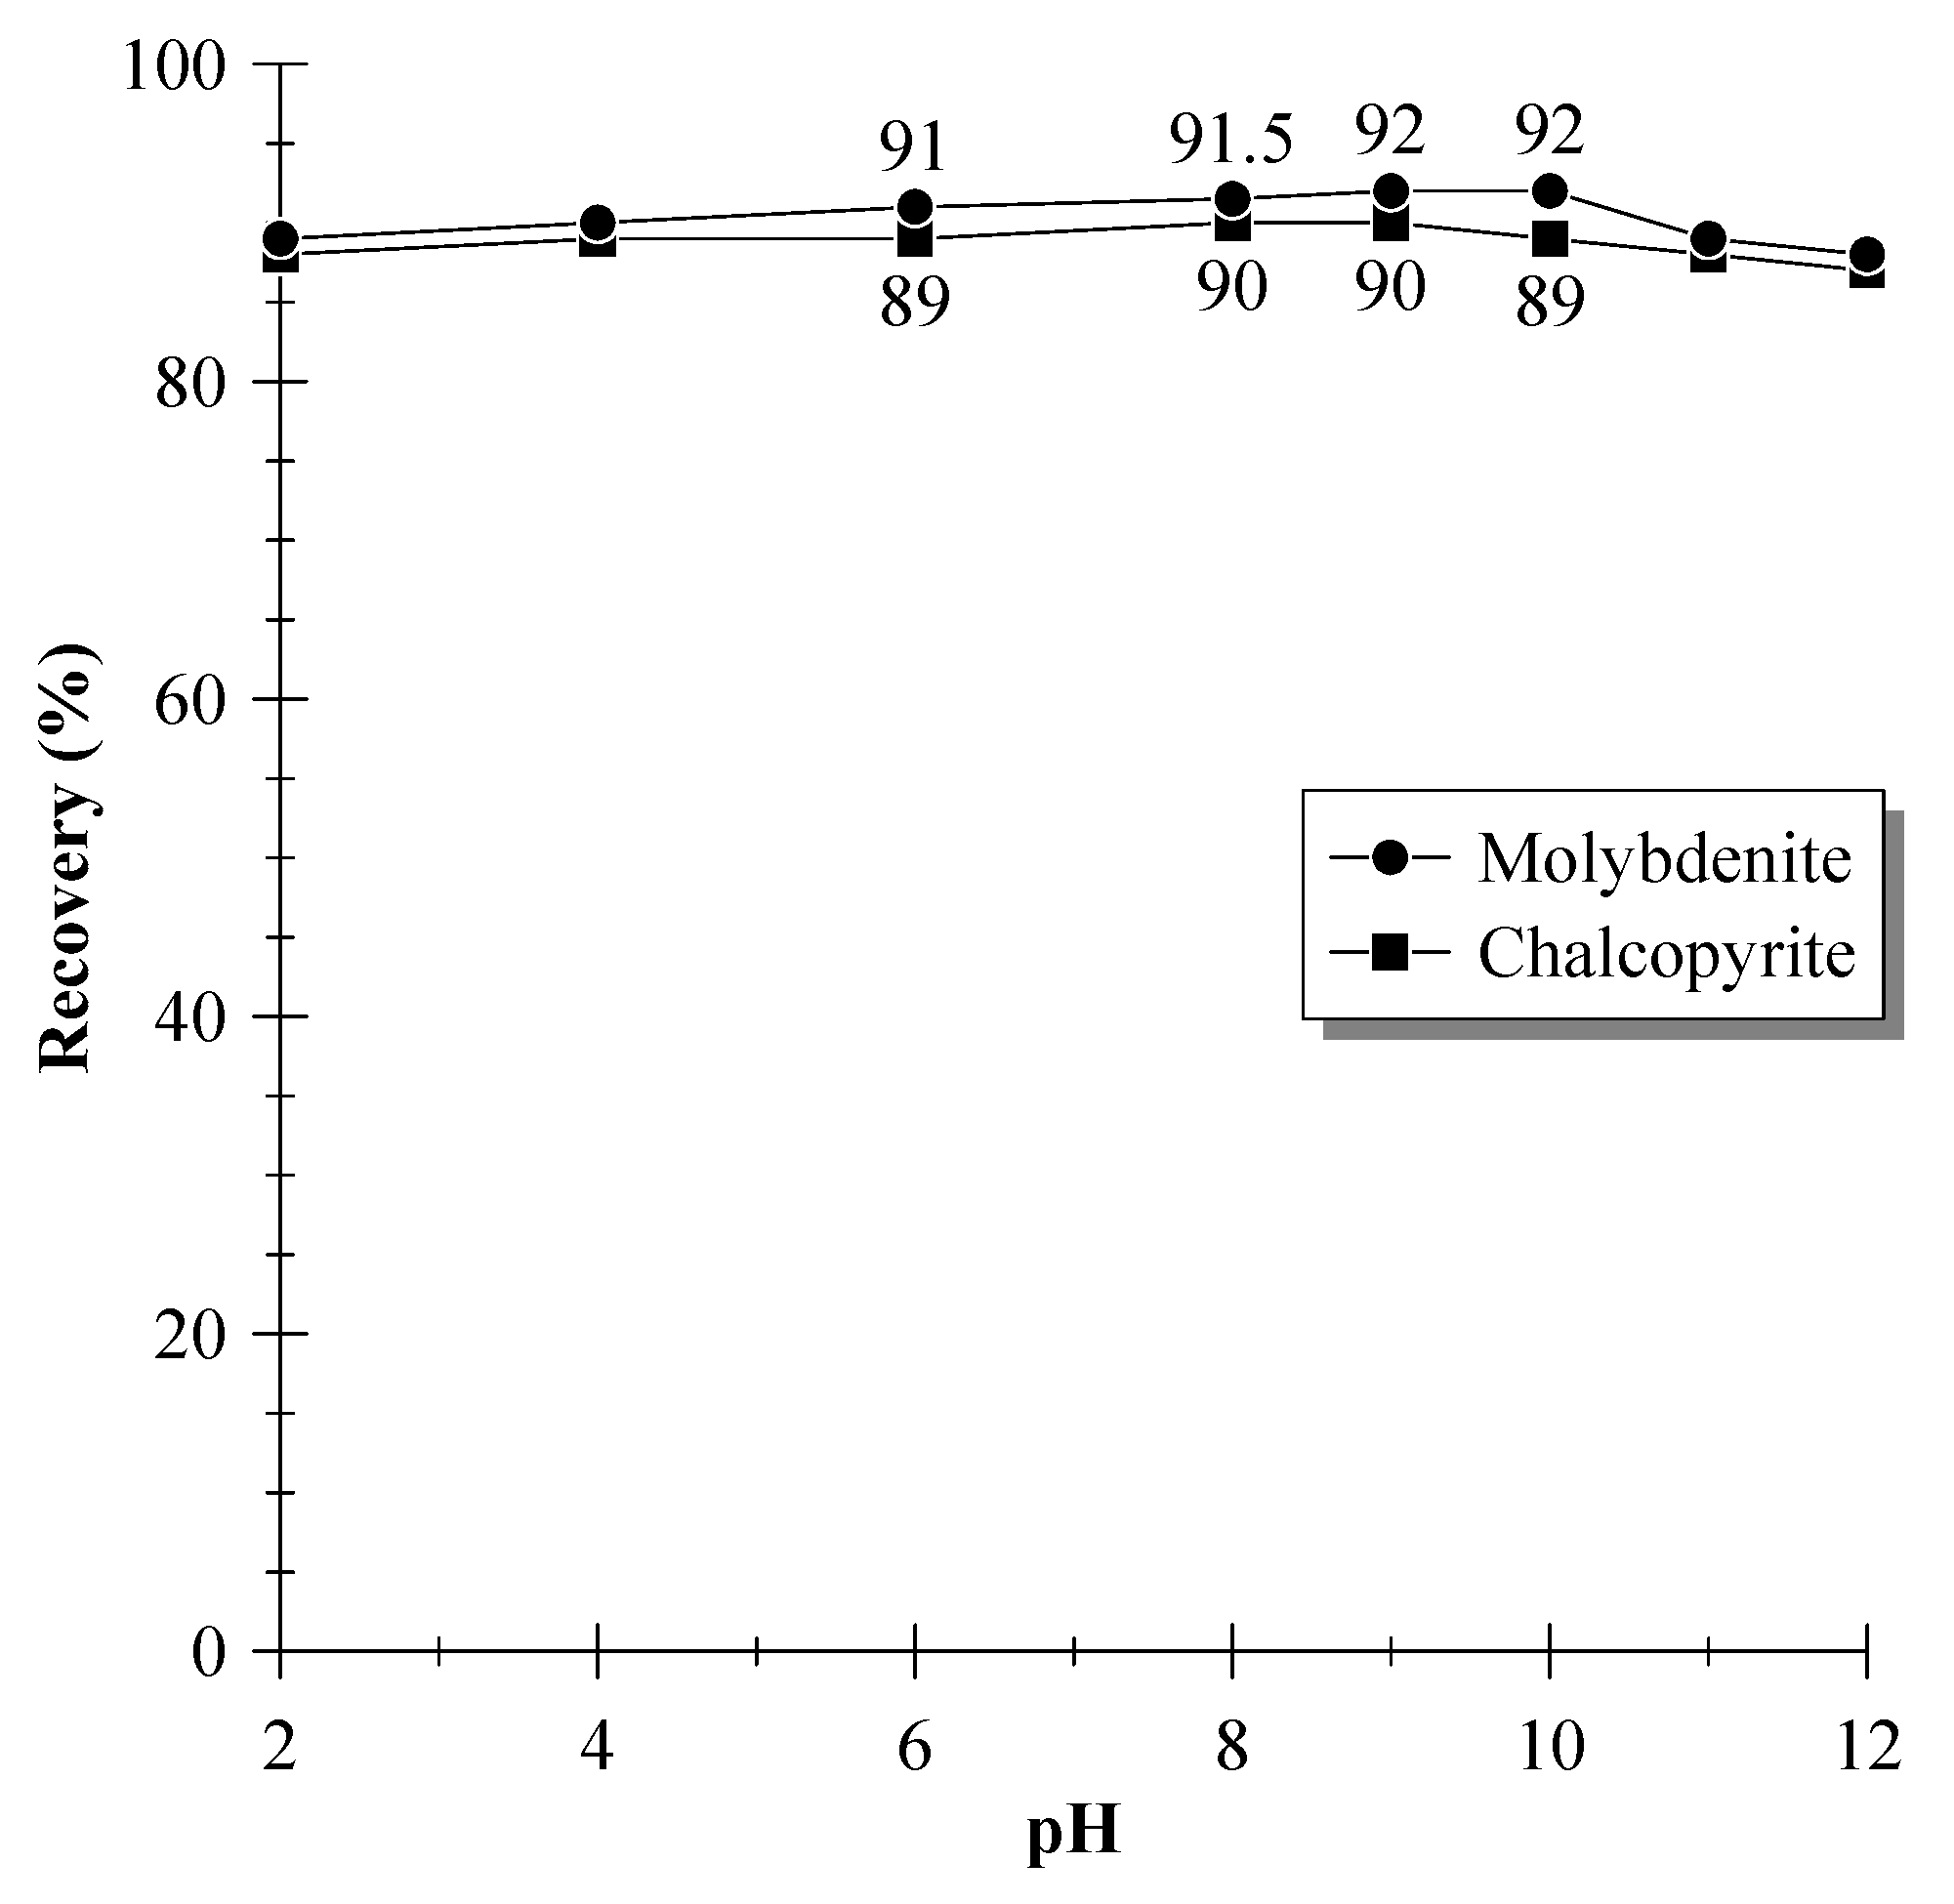
Figure 5.
The floatability of chalcopyrite and molybdenite as a function of GX2 dosage.
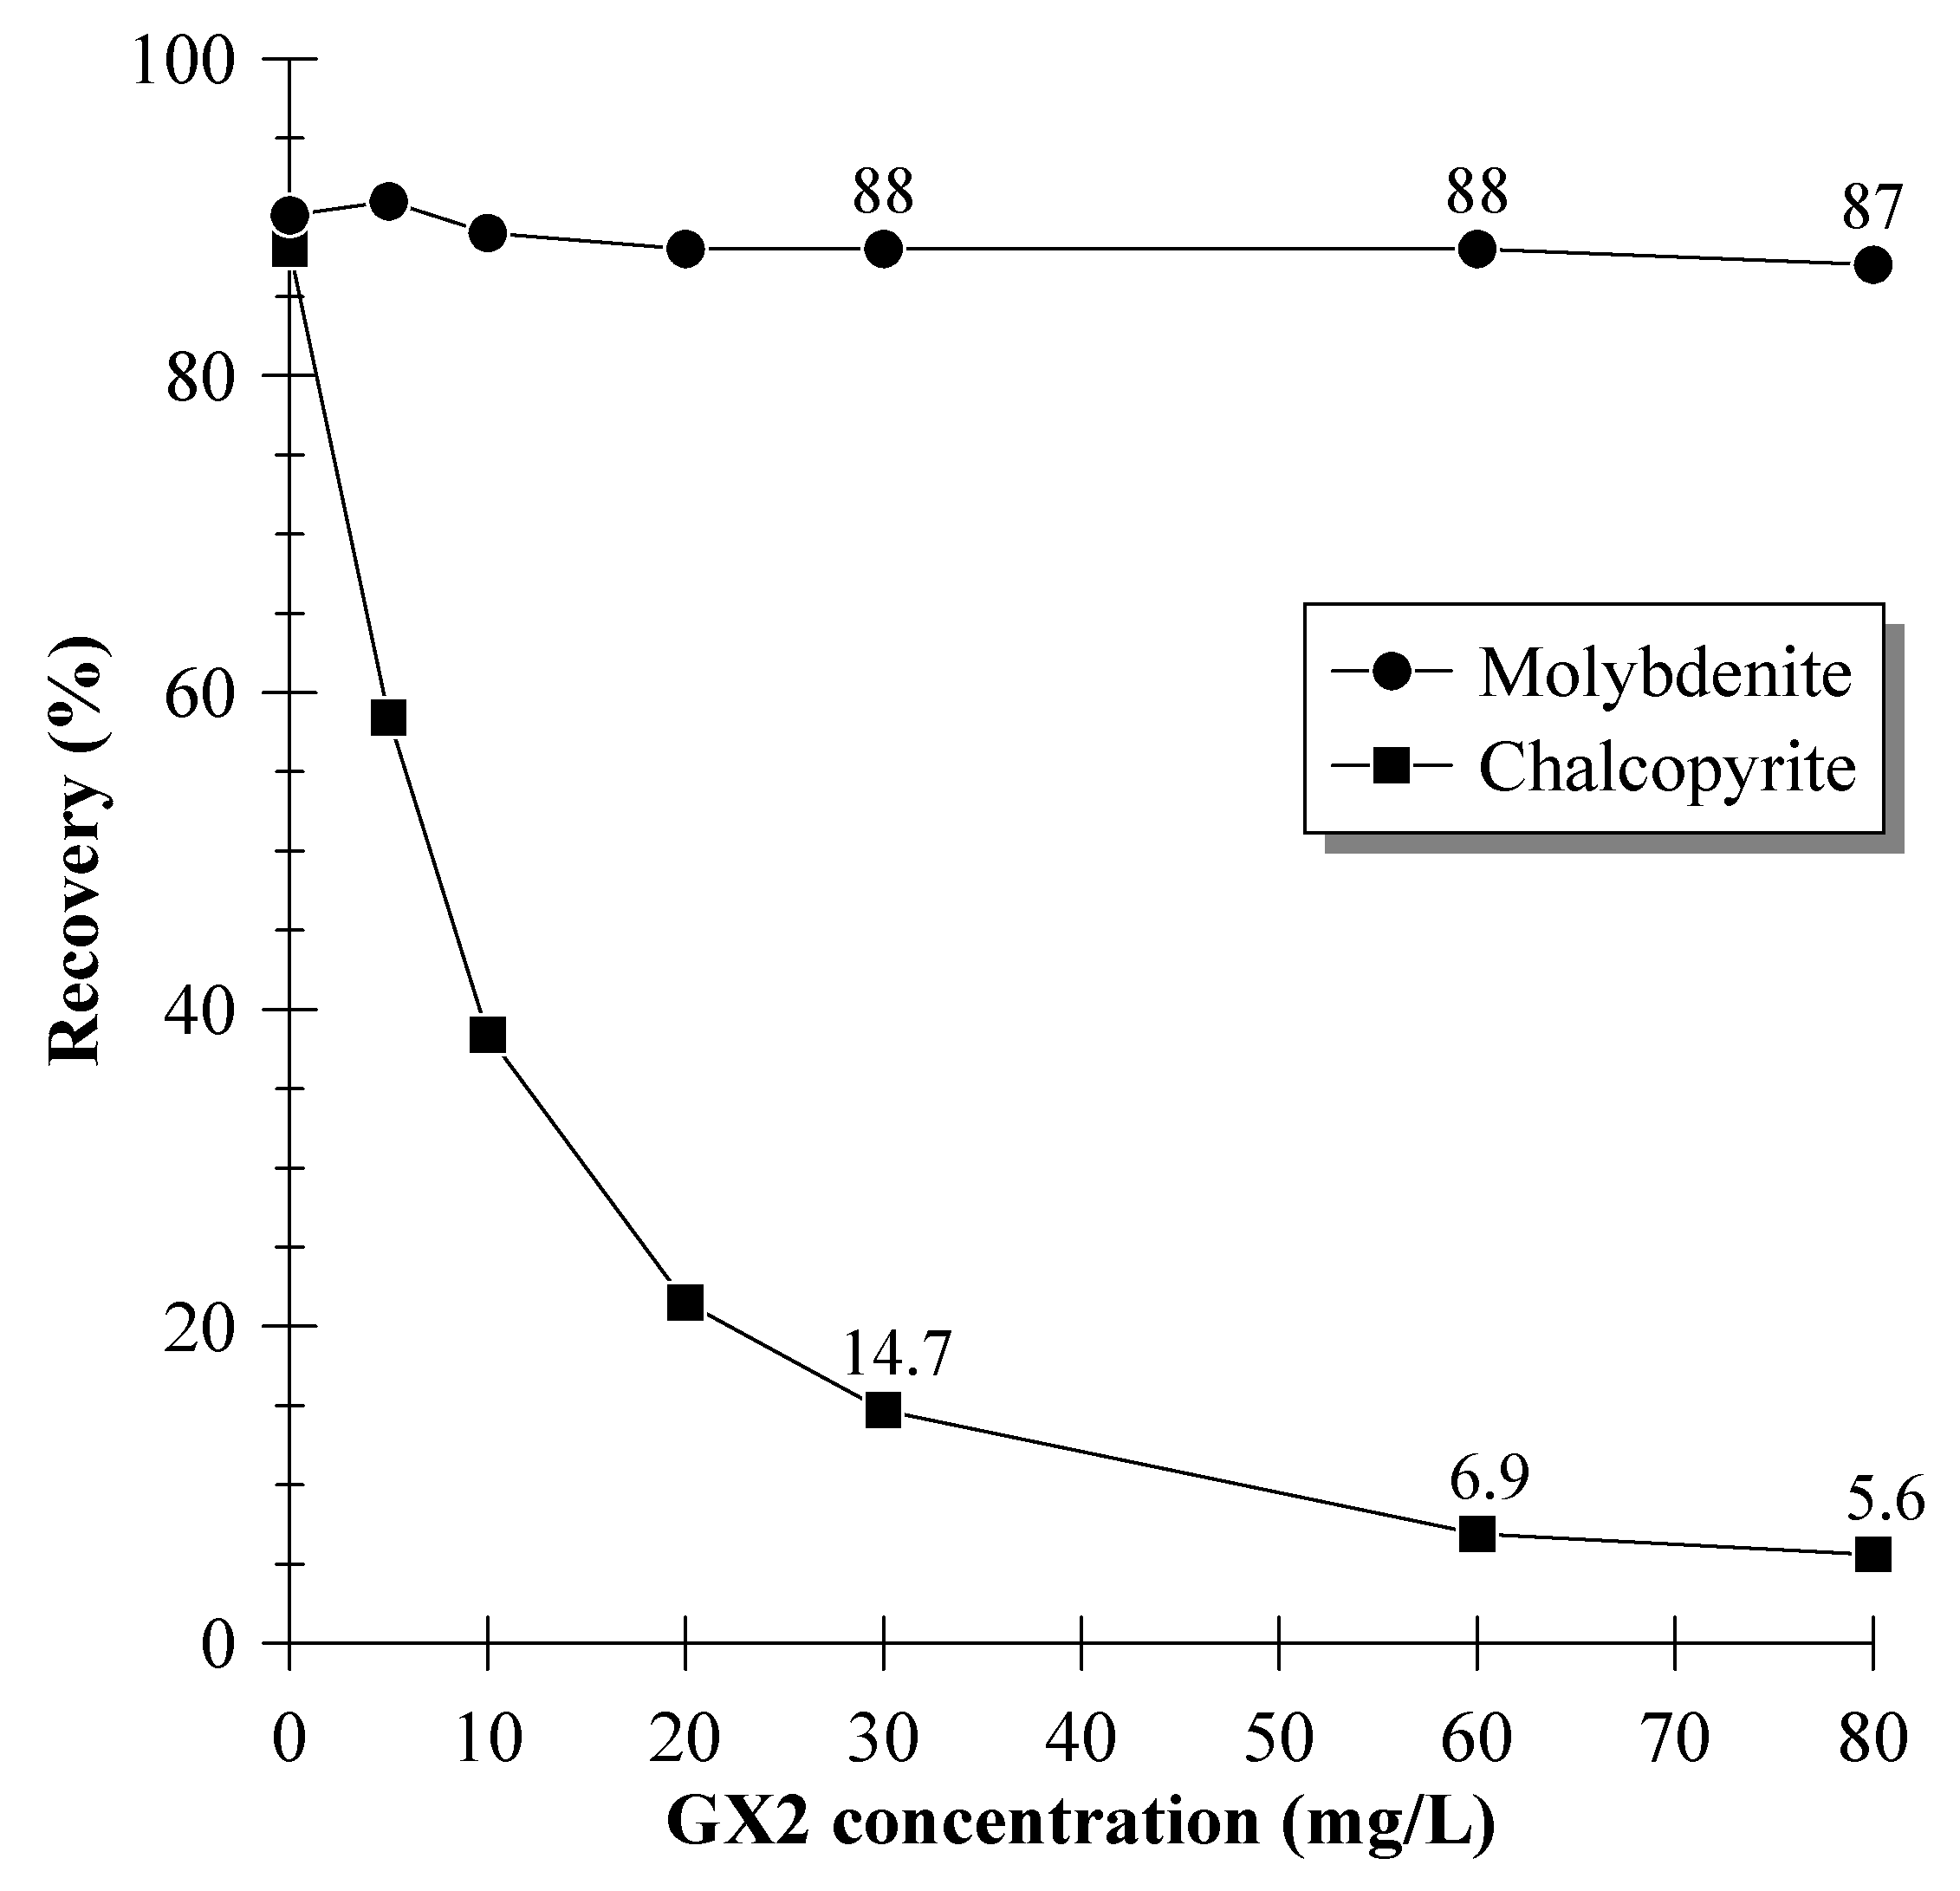
Figure 6.
Effect of GX2 dosage on the flotation separation of Cu-Mo artificial mixed ore.
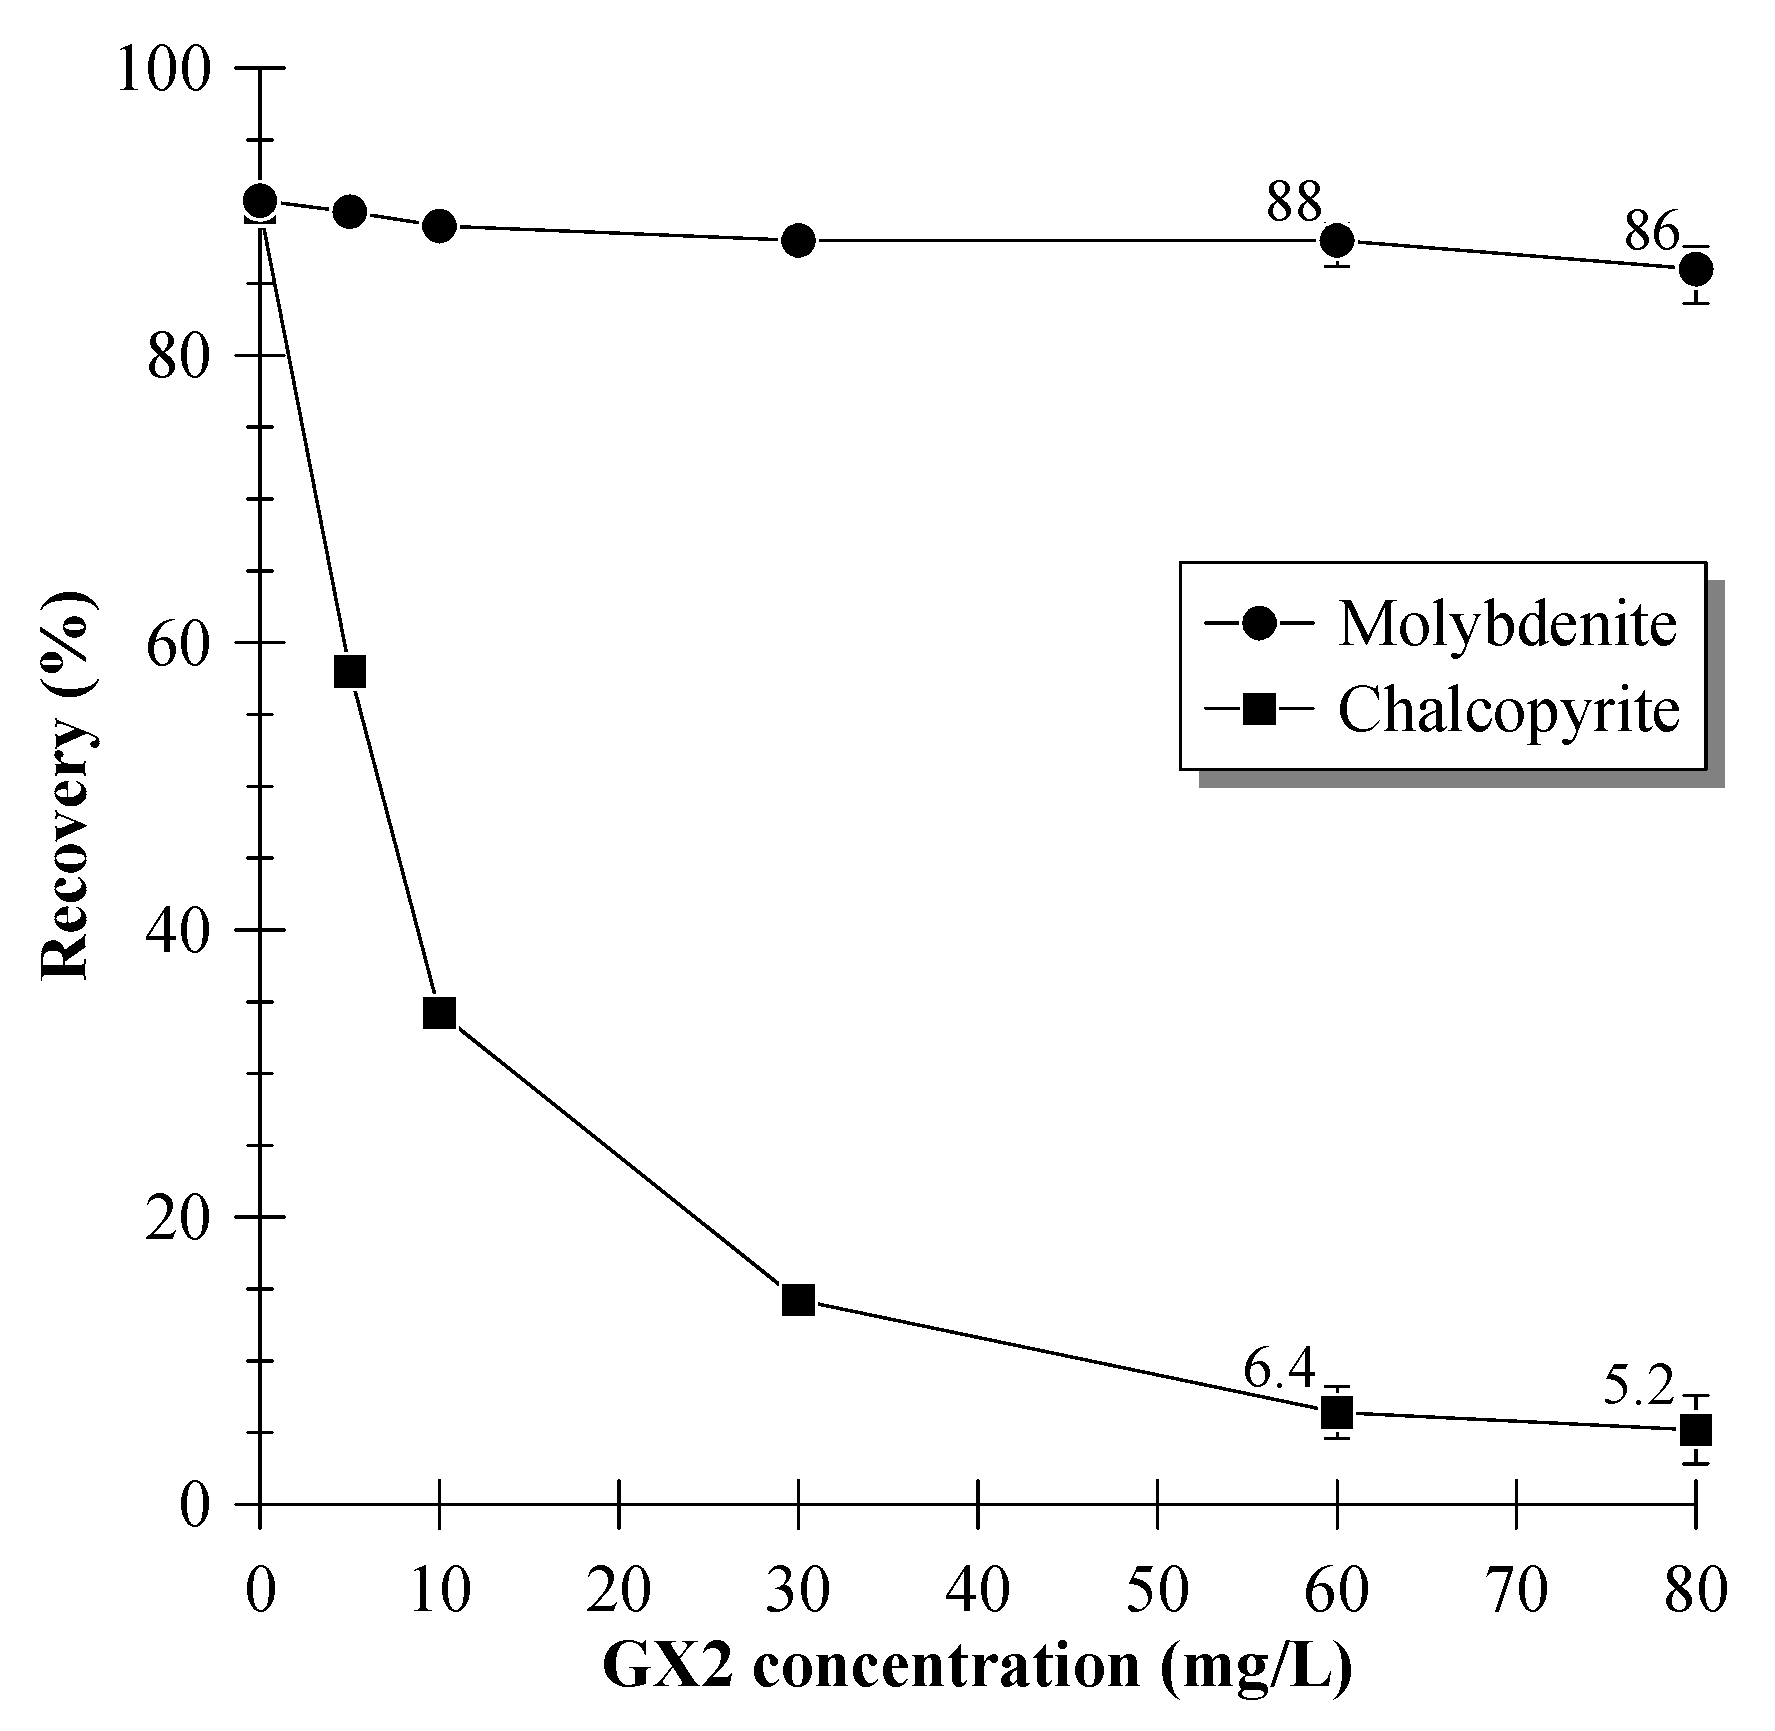
Figure 7.
Effect of GX2 and Na2S on the flotation separation of Cu-Mo artificial mixed ore.
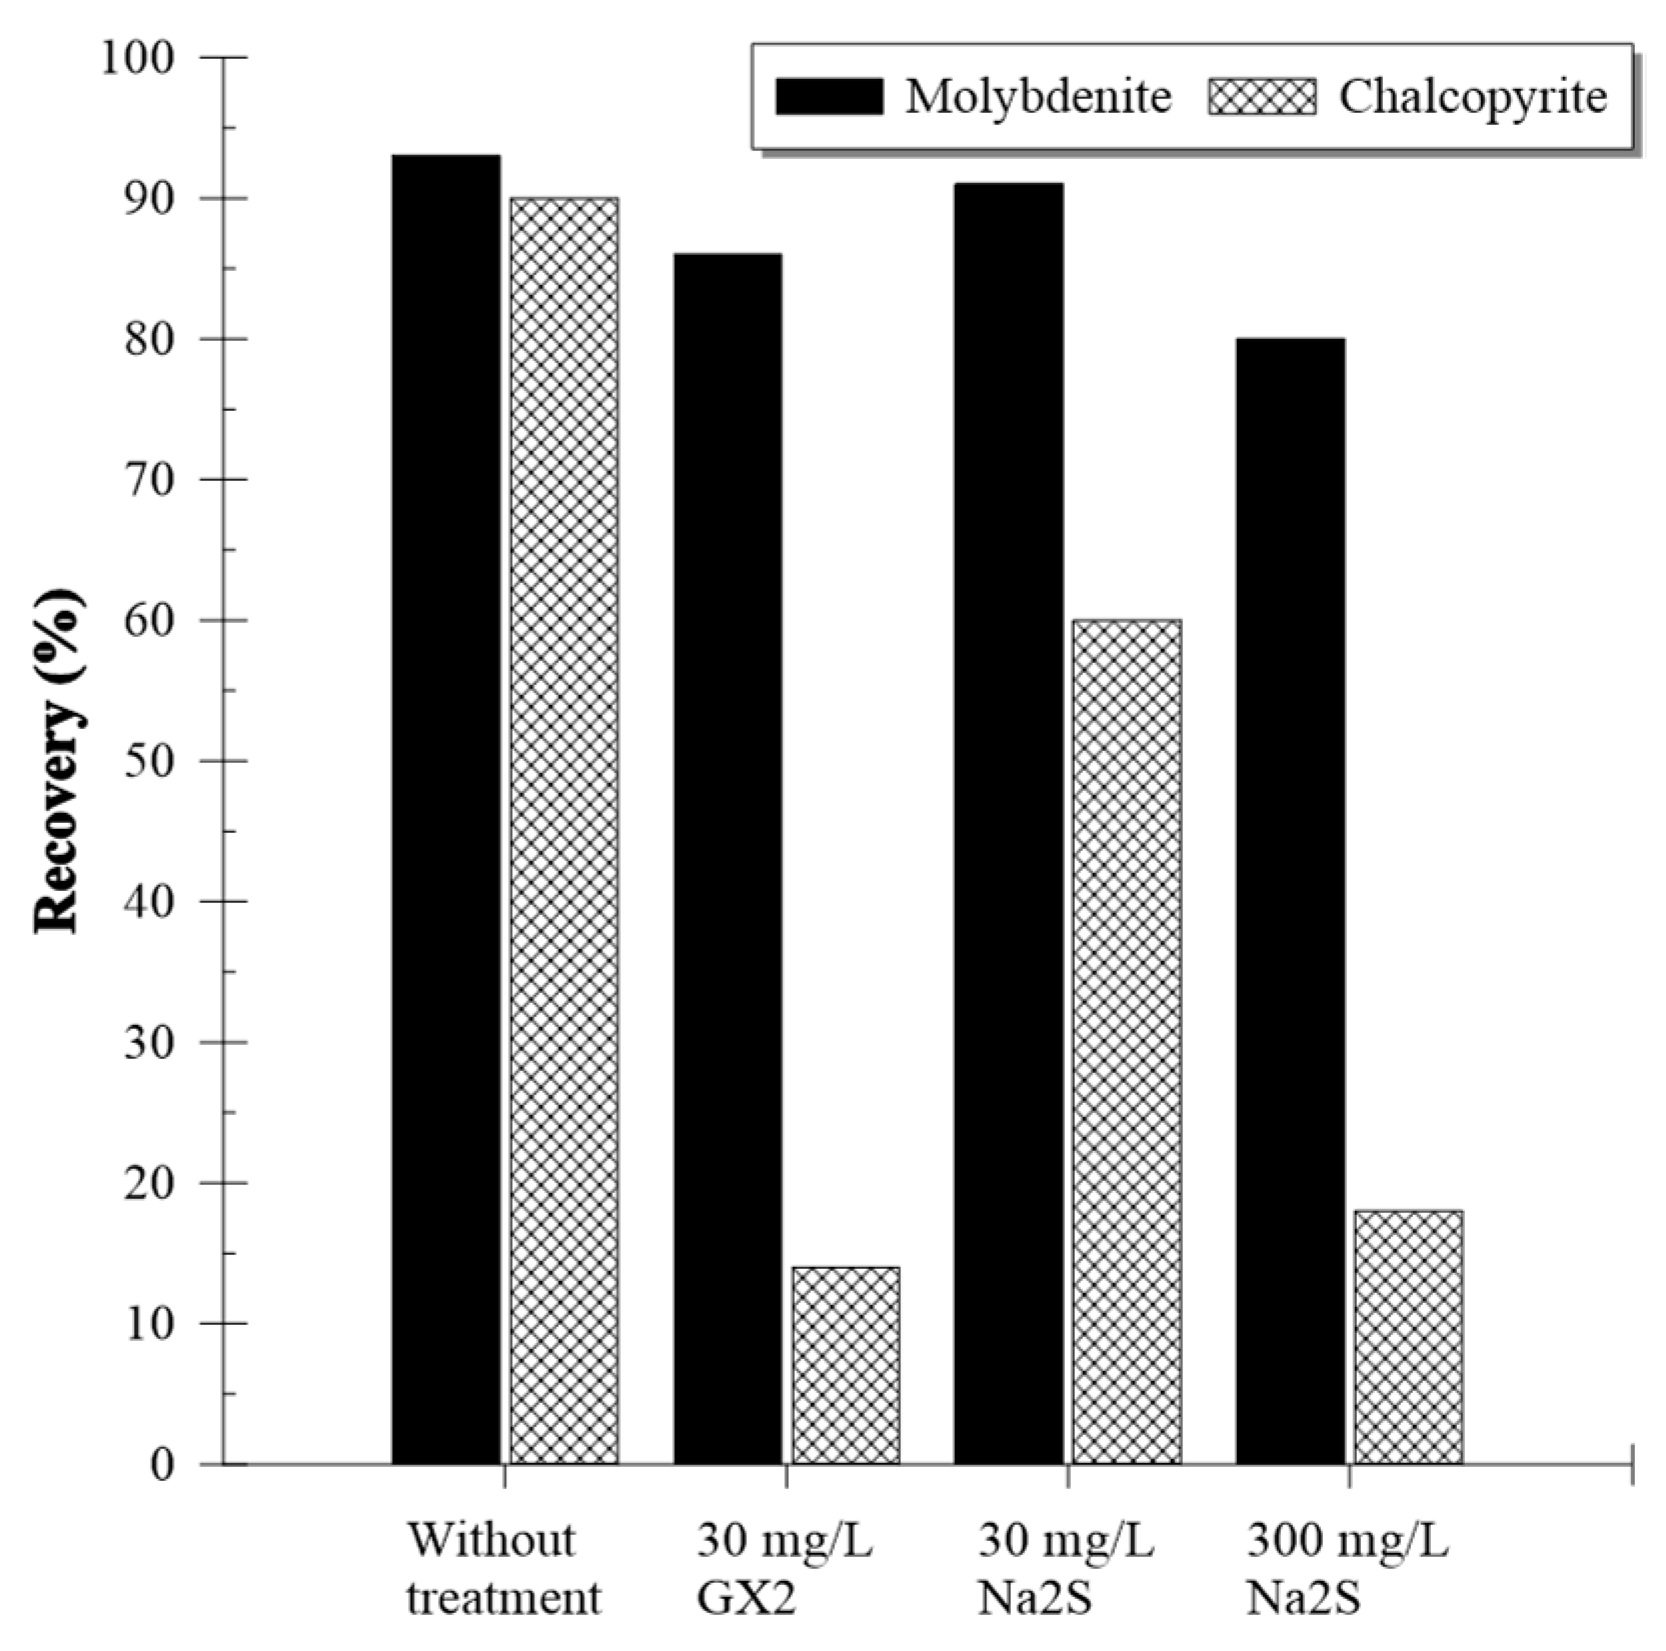
Figure 8.
The contact angles of chalcopyrite and molybdenite after being treated with various GX2 dosages.
Figure 8.
The contact angles of chalcopyrite and molybdenite after being treated with various GX2 dosages.
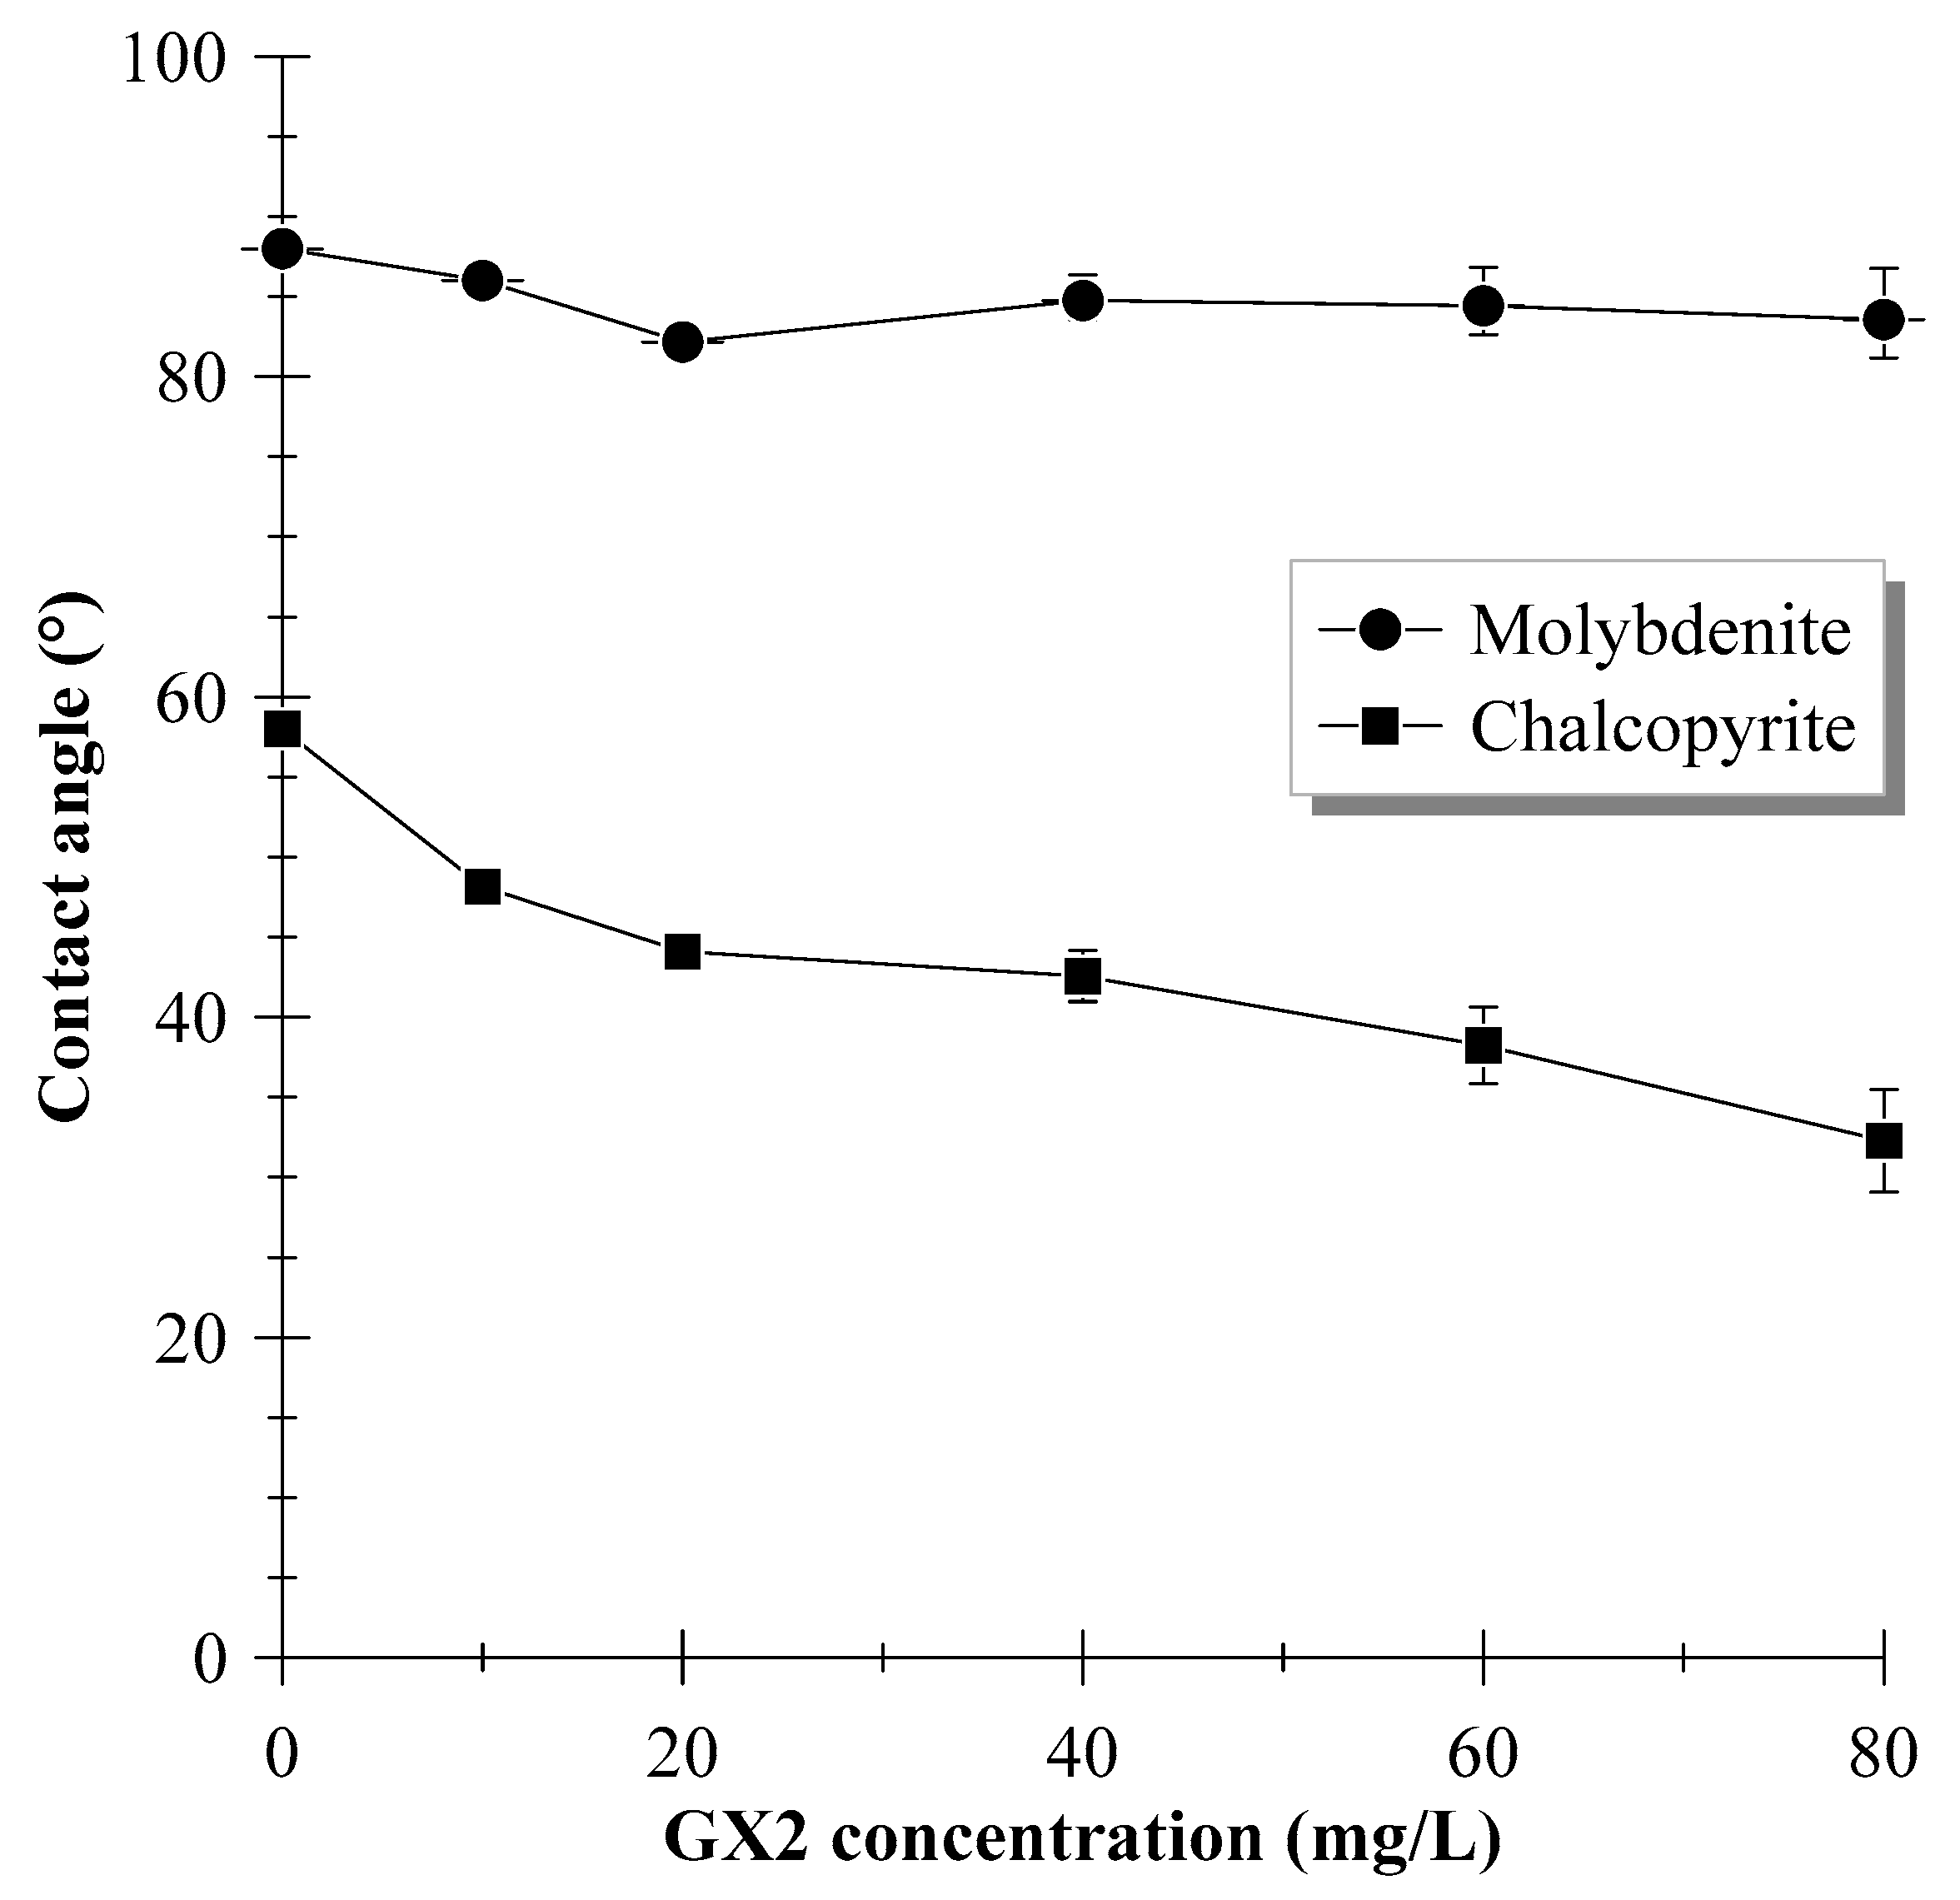
Figure 9.
Zeta potentials of chalcopyrite and molybdenite with and without GX2 in pH range of 2.0–10.0.
Figure 9.
Zeta potentials of chalcopyrite and molybdenite with and without GX2 in pH range of 2.0–10.0.
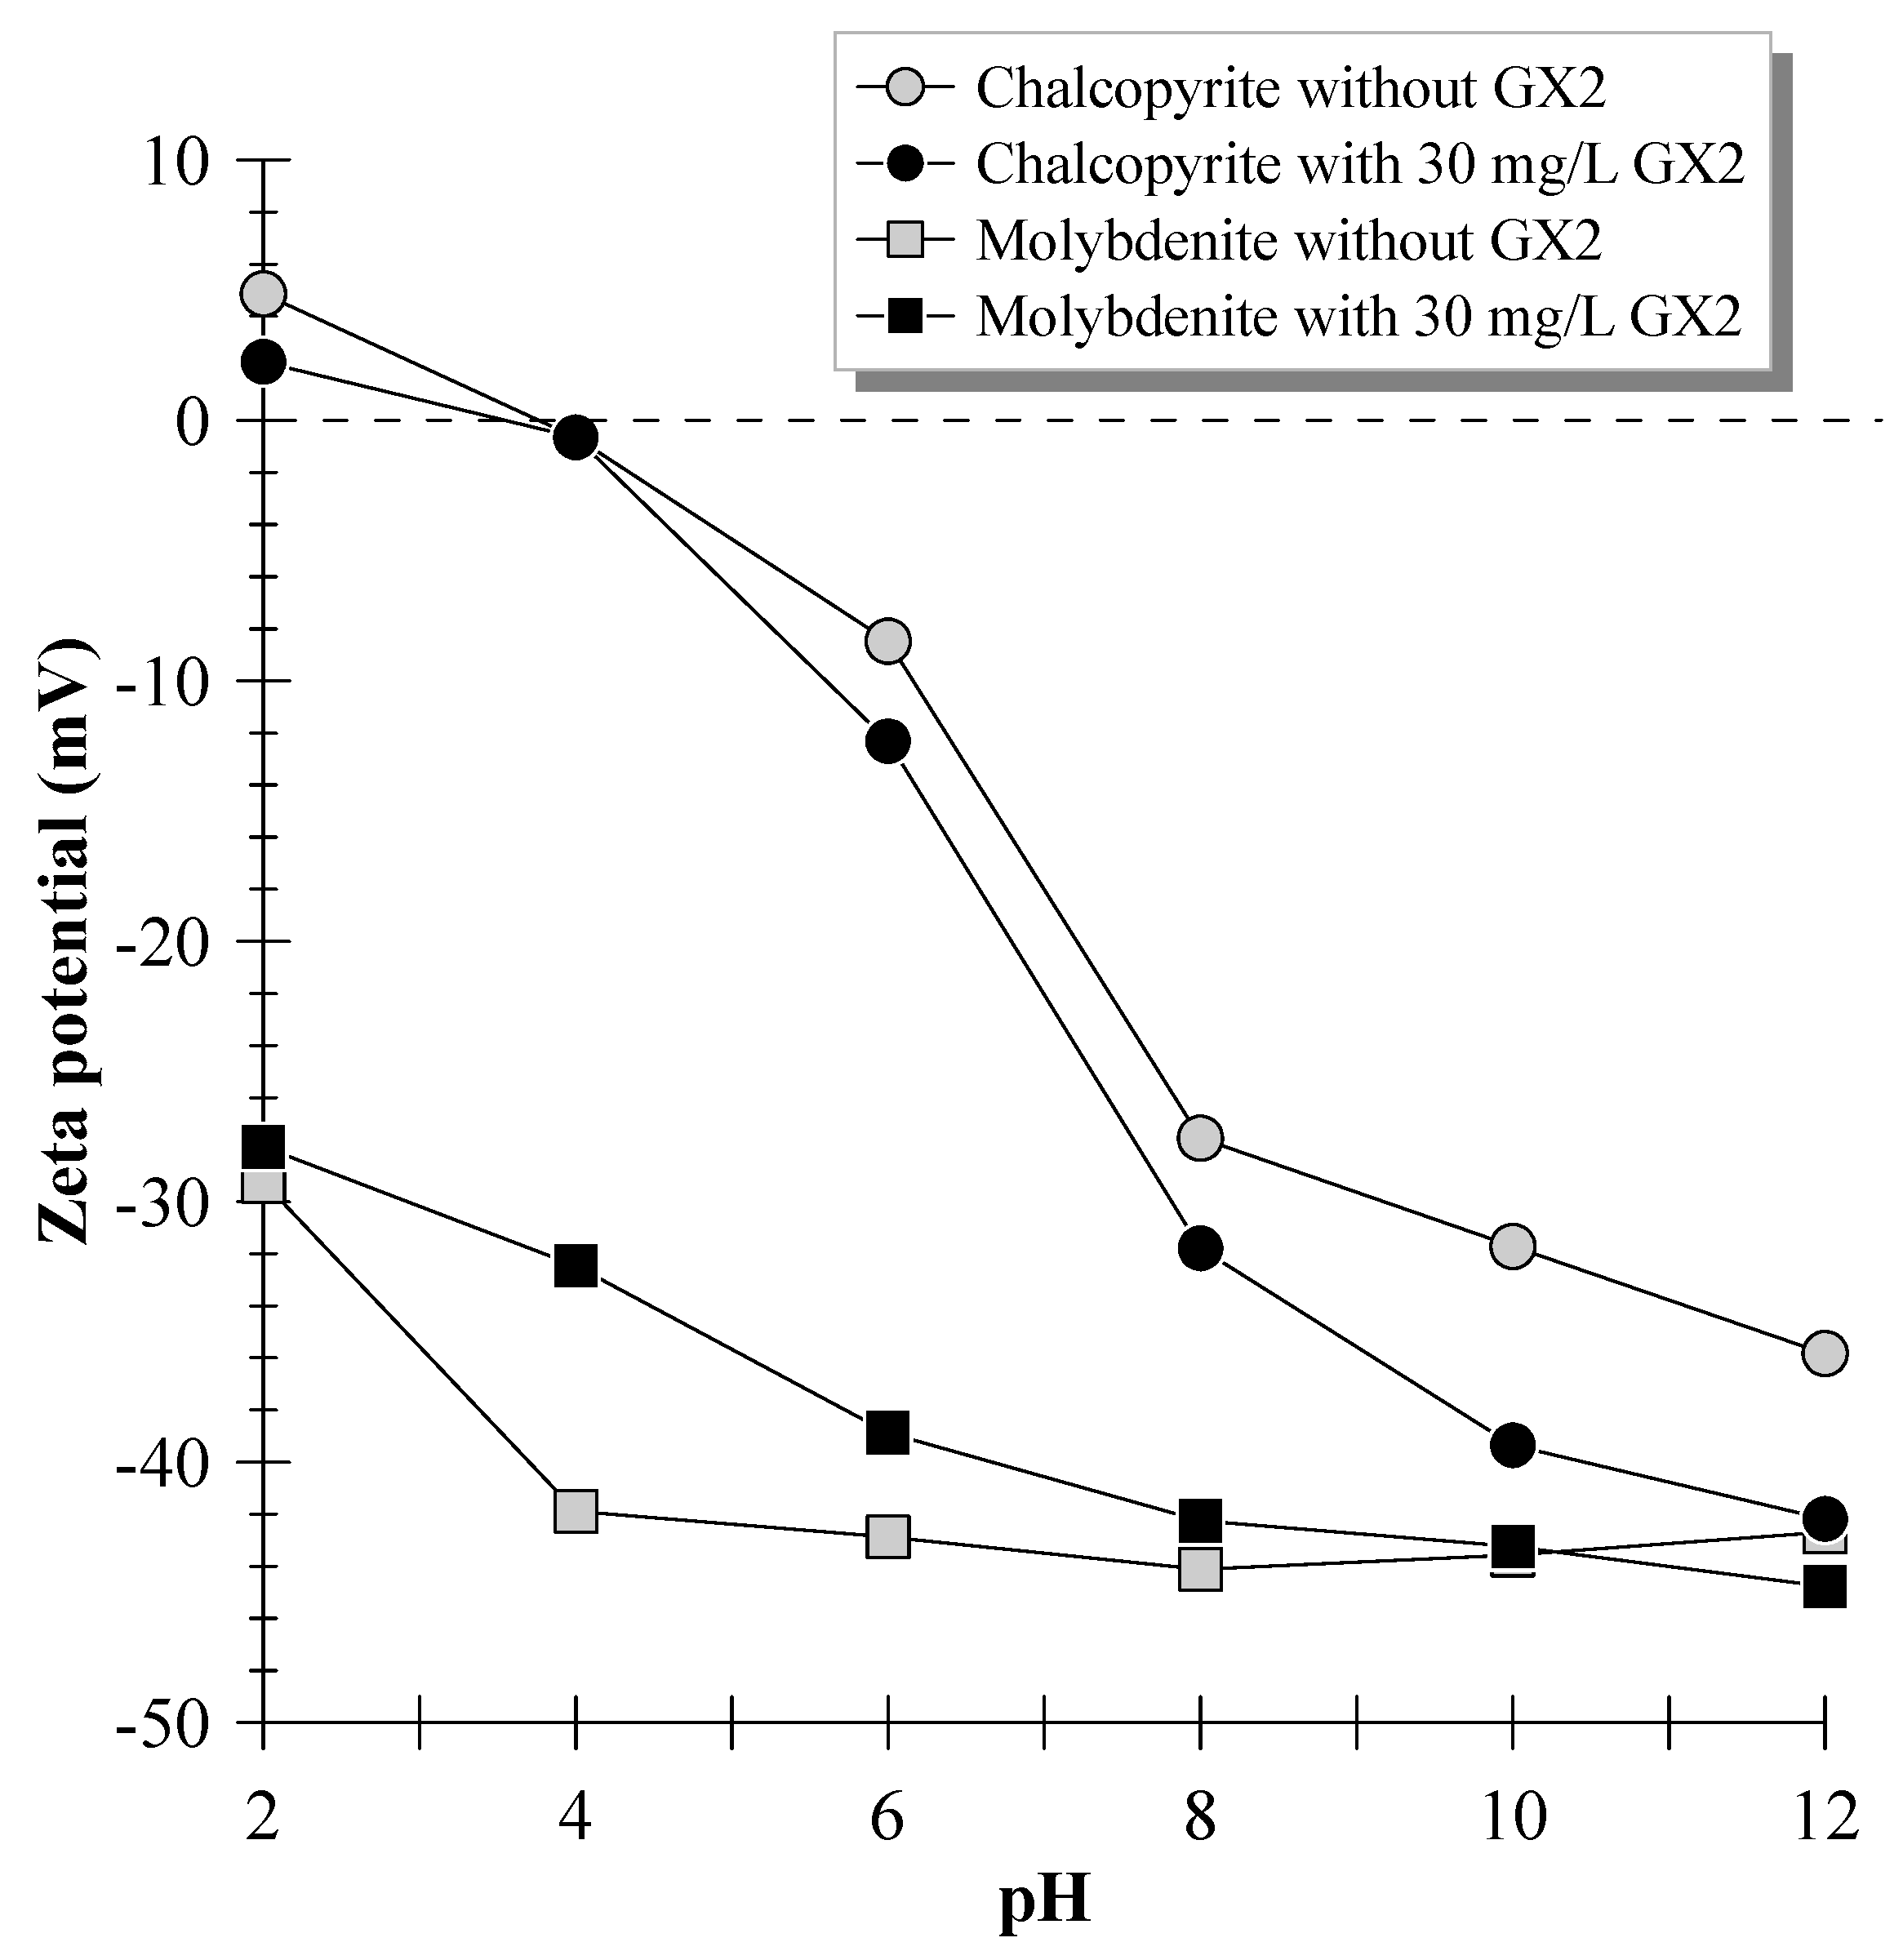
Figure 10.
Infrared spectra of GX2 and minerals ((a) chalcopyrite and (b) molybdenite) before and after treatment with GX2 at pH 1.0.
Figure 10.
Infrared spectra of GX2 and minerals ((a) chalcopyrite and (b) molybdenite) before and after treatment with GX2 at pH 1.0.
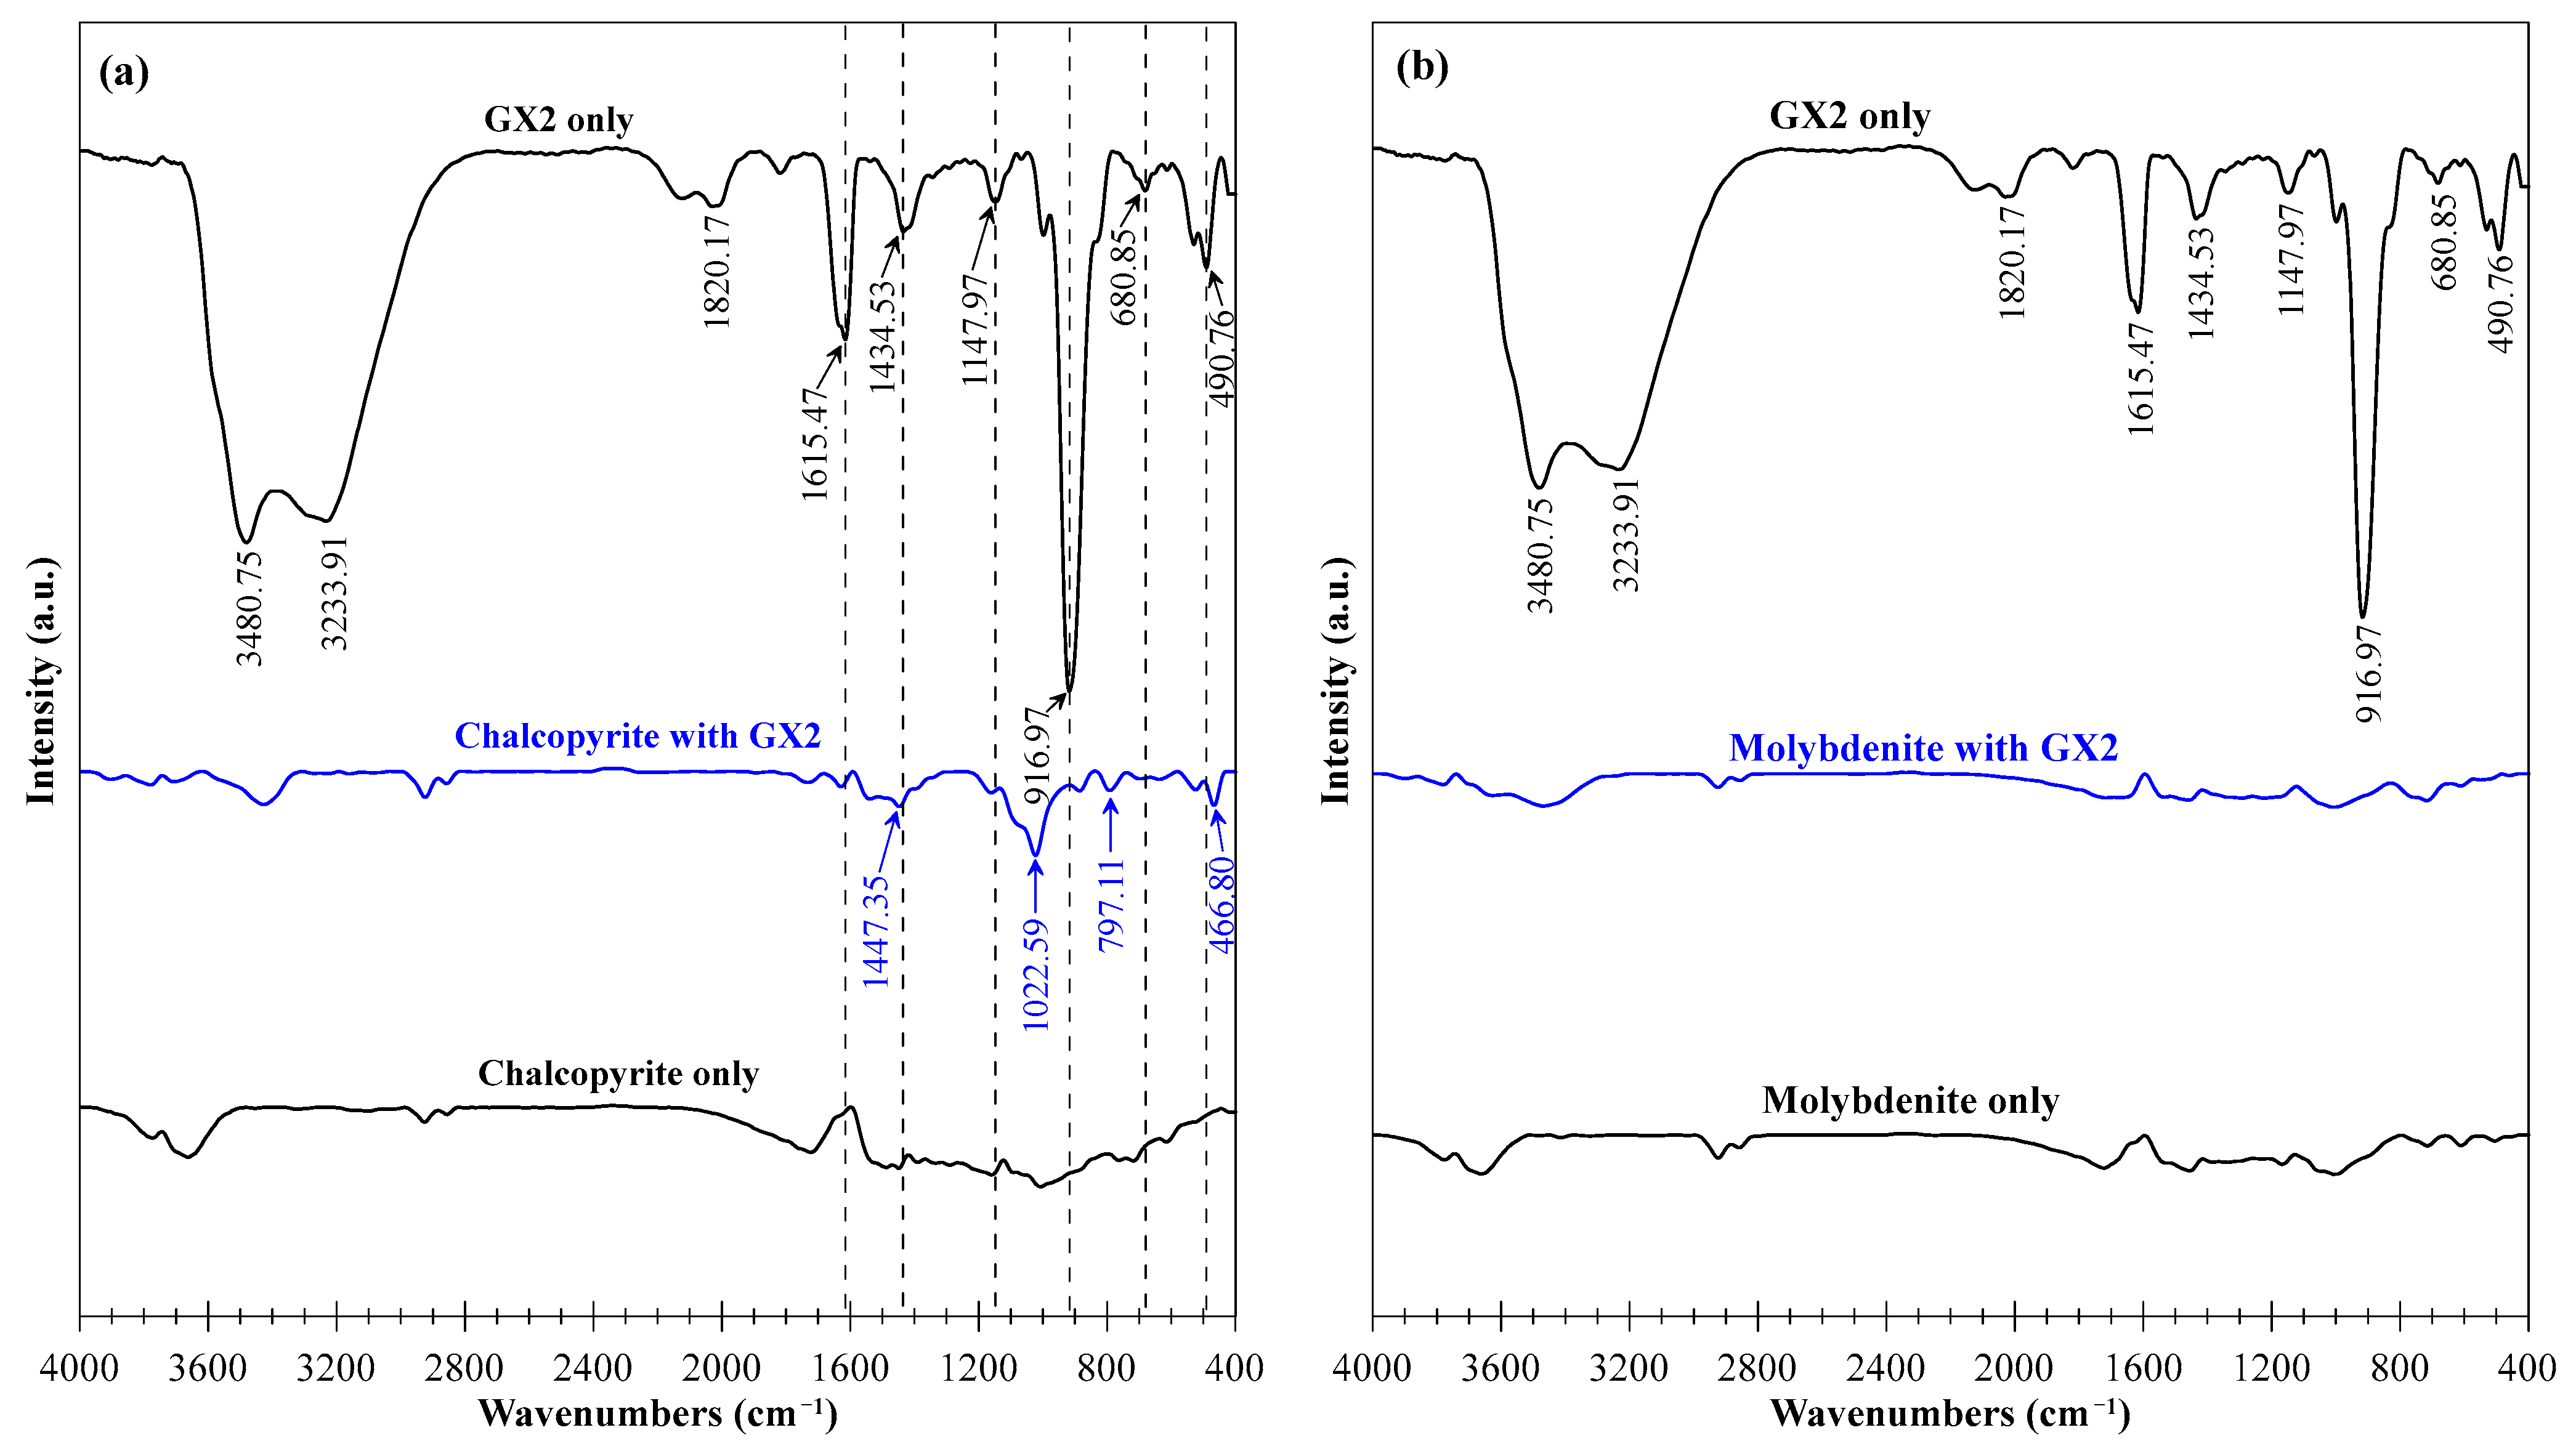
Figure 11.
High-resolution (a) C 1s, (b) Cu 2p, (c) Fe 2p, and (d) S 2p XPS spectra of GX2 and untreated and treated chalcopyrite.
Figure 11.
High-resolution (a) C 1s, (b) Cu 2p, (c) Fe 2p, and (d) S 2p XPS spectra of GX2 and untreated and treated chalcopyrite.

Figure 12.
High-resolution (a) Mo 3d and (b) S 2p XPS spectra of GX2 and untreated and treated molybdenite.
Figure 12.
High-resolution (a) Mo 3d and (b) S 2p XPS spectra of GX2 and untreated and treated molybdenite.


Table 1.
The chemical compositions of chalcopyrite and molybdenite.
| Elements | Chalcopyrite | Molybdenite |
|---|---|---|
| Cu | 30.50 | - |
| Fe | 29.18 | - |
| S | 33.30 | 48.52 |
| Mo | - | 56.83 |
Disclaimer/Publisher’s Note: The statements, opinions and data contained in all publications are solely those of the individual author(s) and contributor(s) and not of MDPI and/or the editor(s). MDPI and/or the editor(s) disclaim responsibility for any injury to people or property resulting from any ideas, methods, instructions or products referred to in the content. |
© 2023 by the authors. Licensee MDPI, Basel, Switzerland. This article is an open access article distributed under the terms and conditions of the Creative Commons Attribution (CC BY) license (https://creativecommons.org/licenses/by/4.0/).
Share and Cite
MDPI and ACS Style
Lin, Y.; Xu, W.; Jiang, L.; Han, B.; Yang, M. A Novel Chalcopyrite Depressant for Selective Separation of Molybdenite from Cu-Mo Sulfide Ores and Its Interaction Mechanisms. Minerals 2023, 13, 1548. https://doi.org/10.3390/min13121548
AMA Style
Lin Y, Xu W, Jiang L, Han B, Yang M. A Novel Chalcopyrite Depressant for Selective Separation of Molybdenite from Cu-Mo Sulfide Ores and Its Interaction Mechanisms. Minerals. 2023; 13(12):1548. https://doi.org/10.3390/min13121548
Chicago/Turabian StyleLin, Yuemeng, Wentao Xu, Lishuai Jiang, Baisui Han, and Mengyue Yang. 2023. "A Novel Chalcopyrite Depressant for Selective Separation of Molybdenite from Cu-Mo Sulfide Ores and Its Interaction Mechanisms" Minerals 13, no. 12: 1548. https://doi.org/10.3390/min13121548
Note that from the first issue of 2016, this journal uses article numbers instead of page numbers. See further details here.