
Semi-Quantitative Analyses of Ferromanganese Nodules from the Pacific Ocean Using Synchrotron X-ray Powder Diffraction
 , , , , ,
  and
and 
Abstract
:1. Introduction
2. Materials and Methods
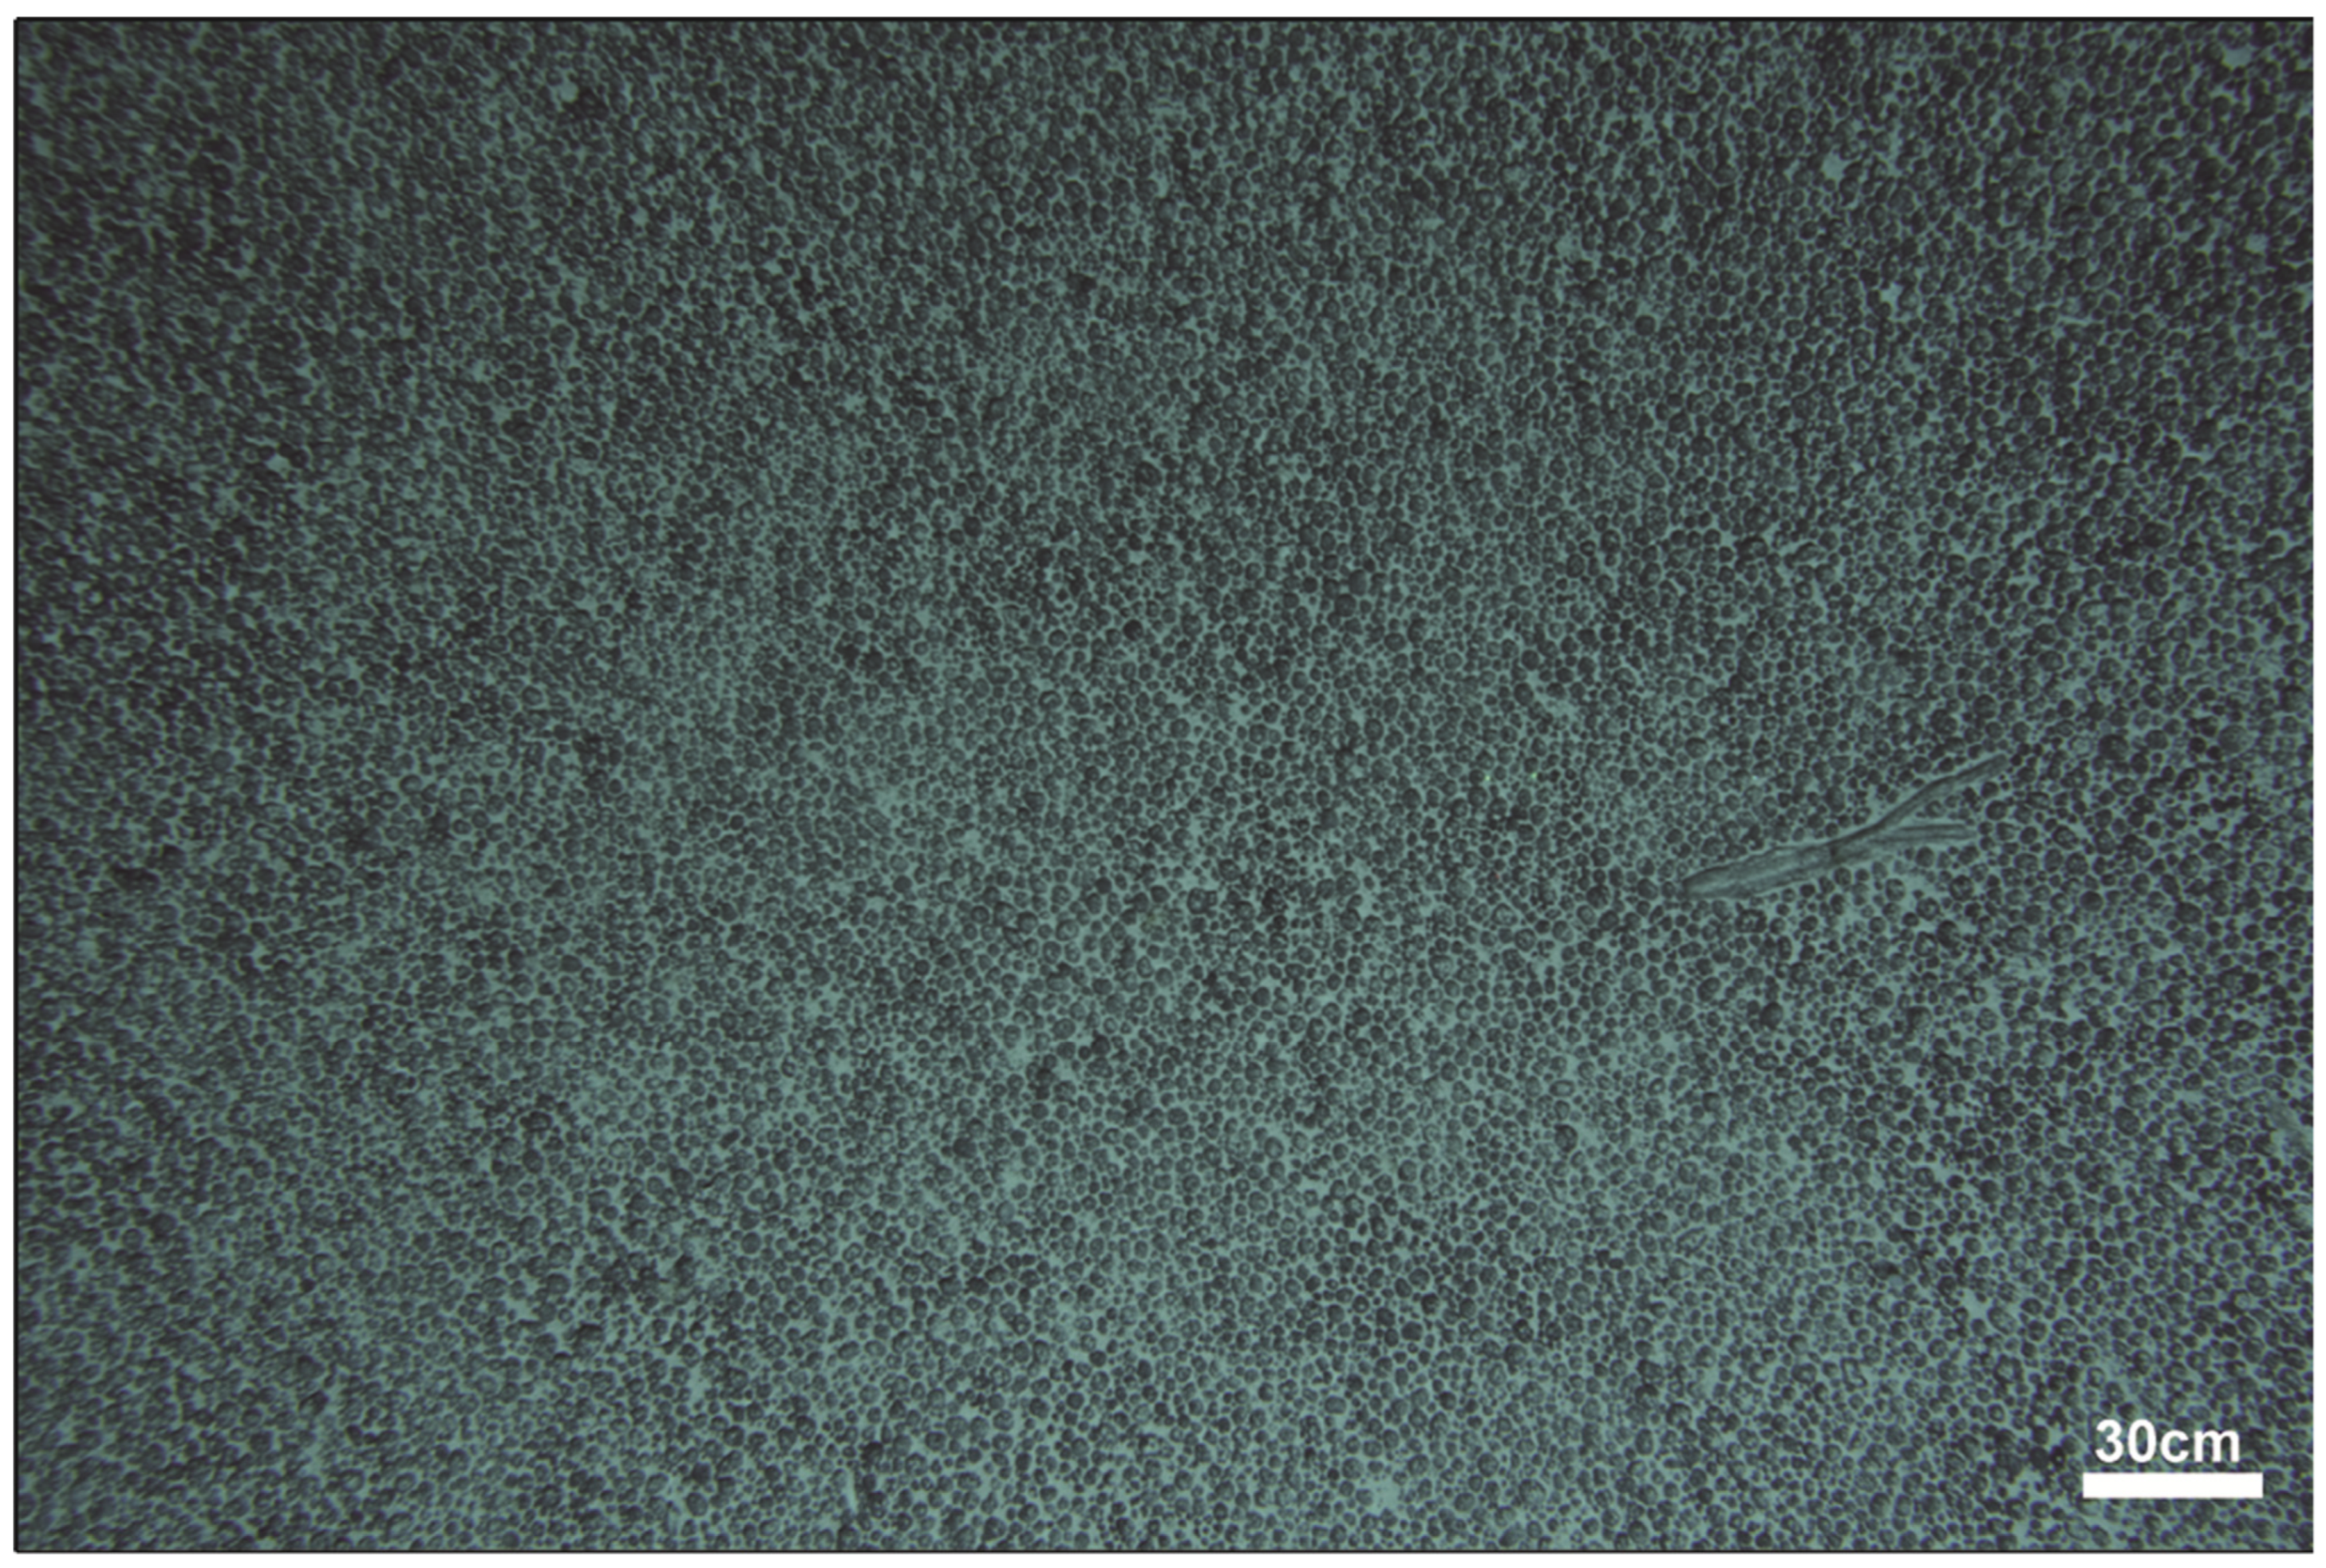
2.1. Samples
2.2. Chemical Analysis
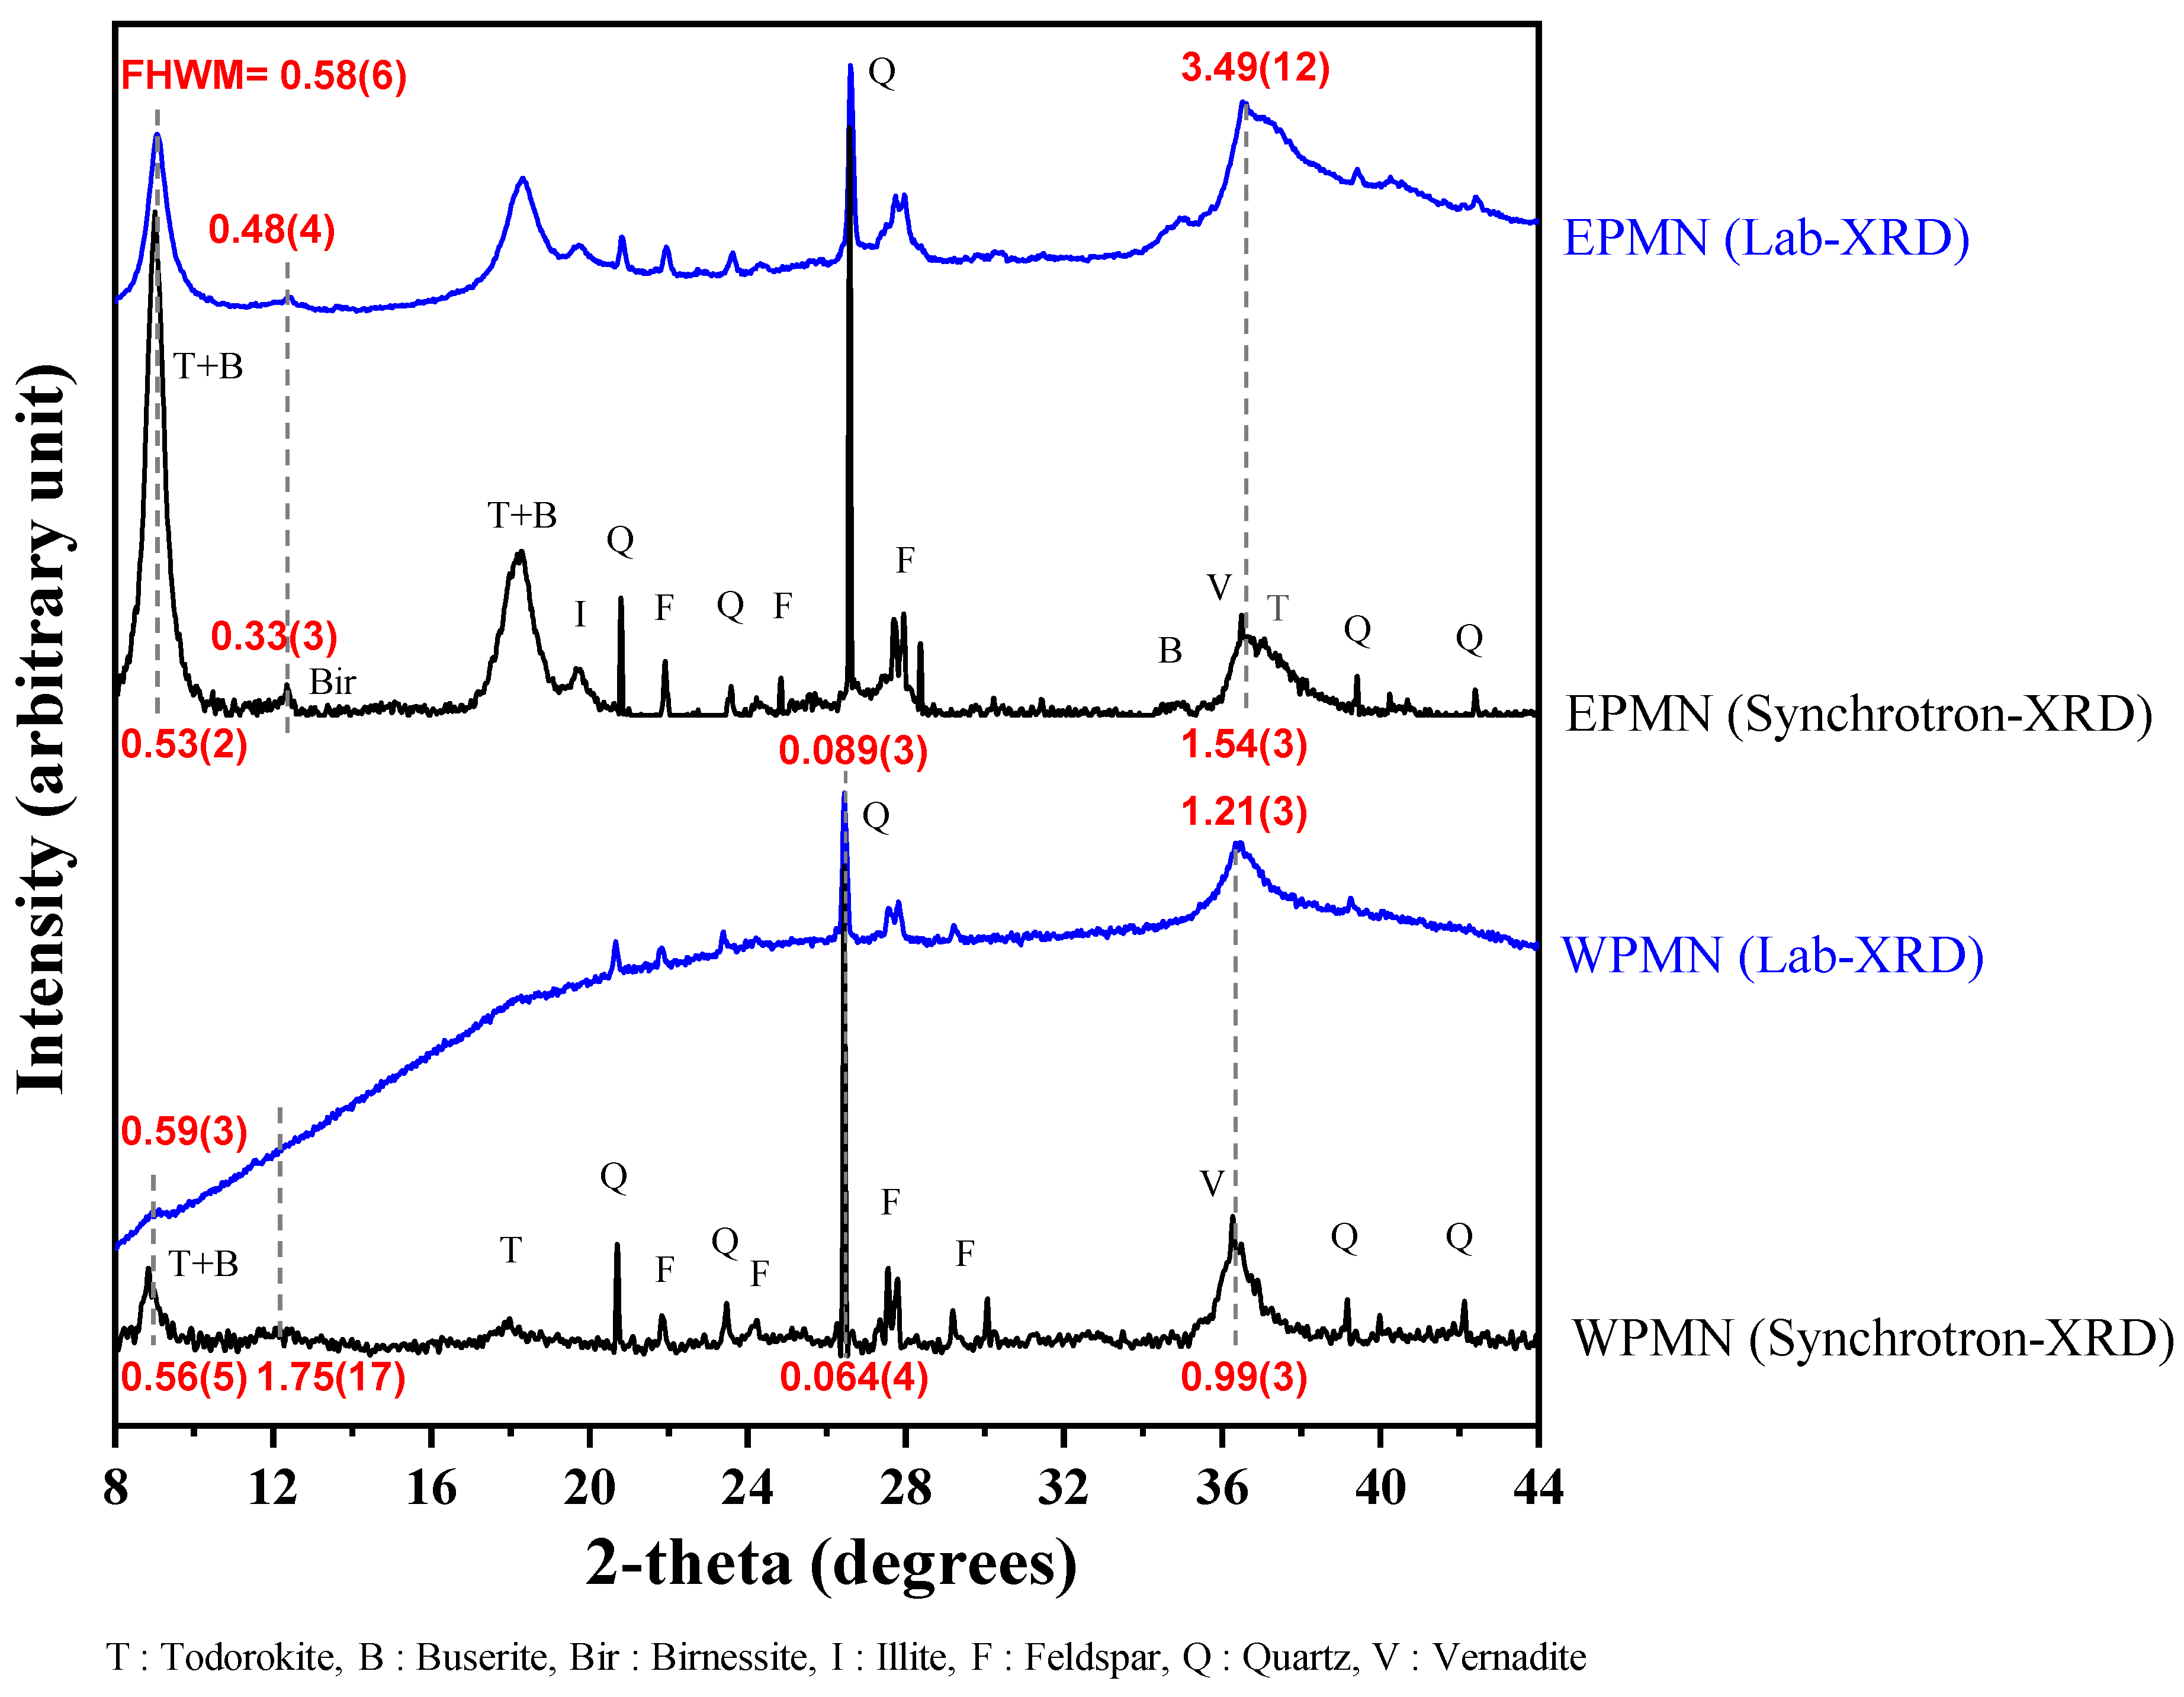
2.3. Synchrotron X-ray Powder Diffraction
2.4. Phase Identification and Semi-Quantitative Analysis
3. Results and Discussion

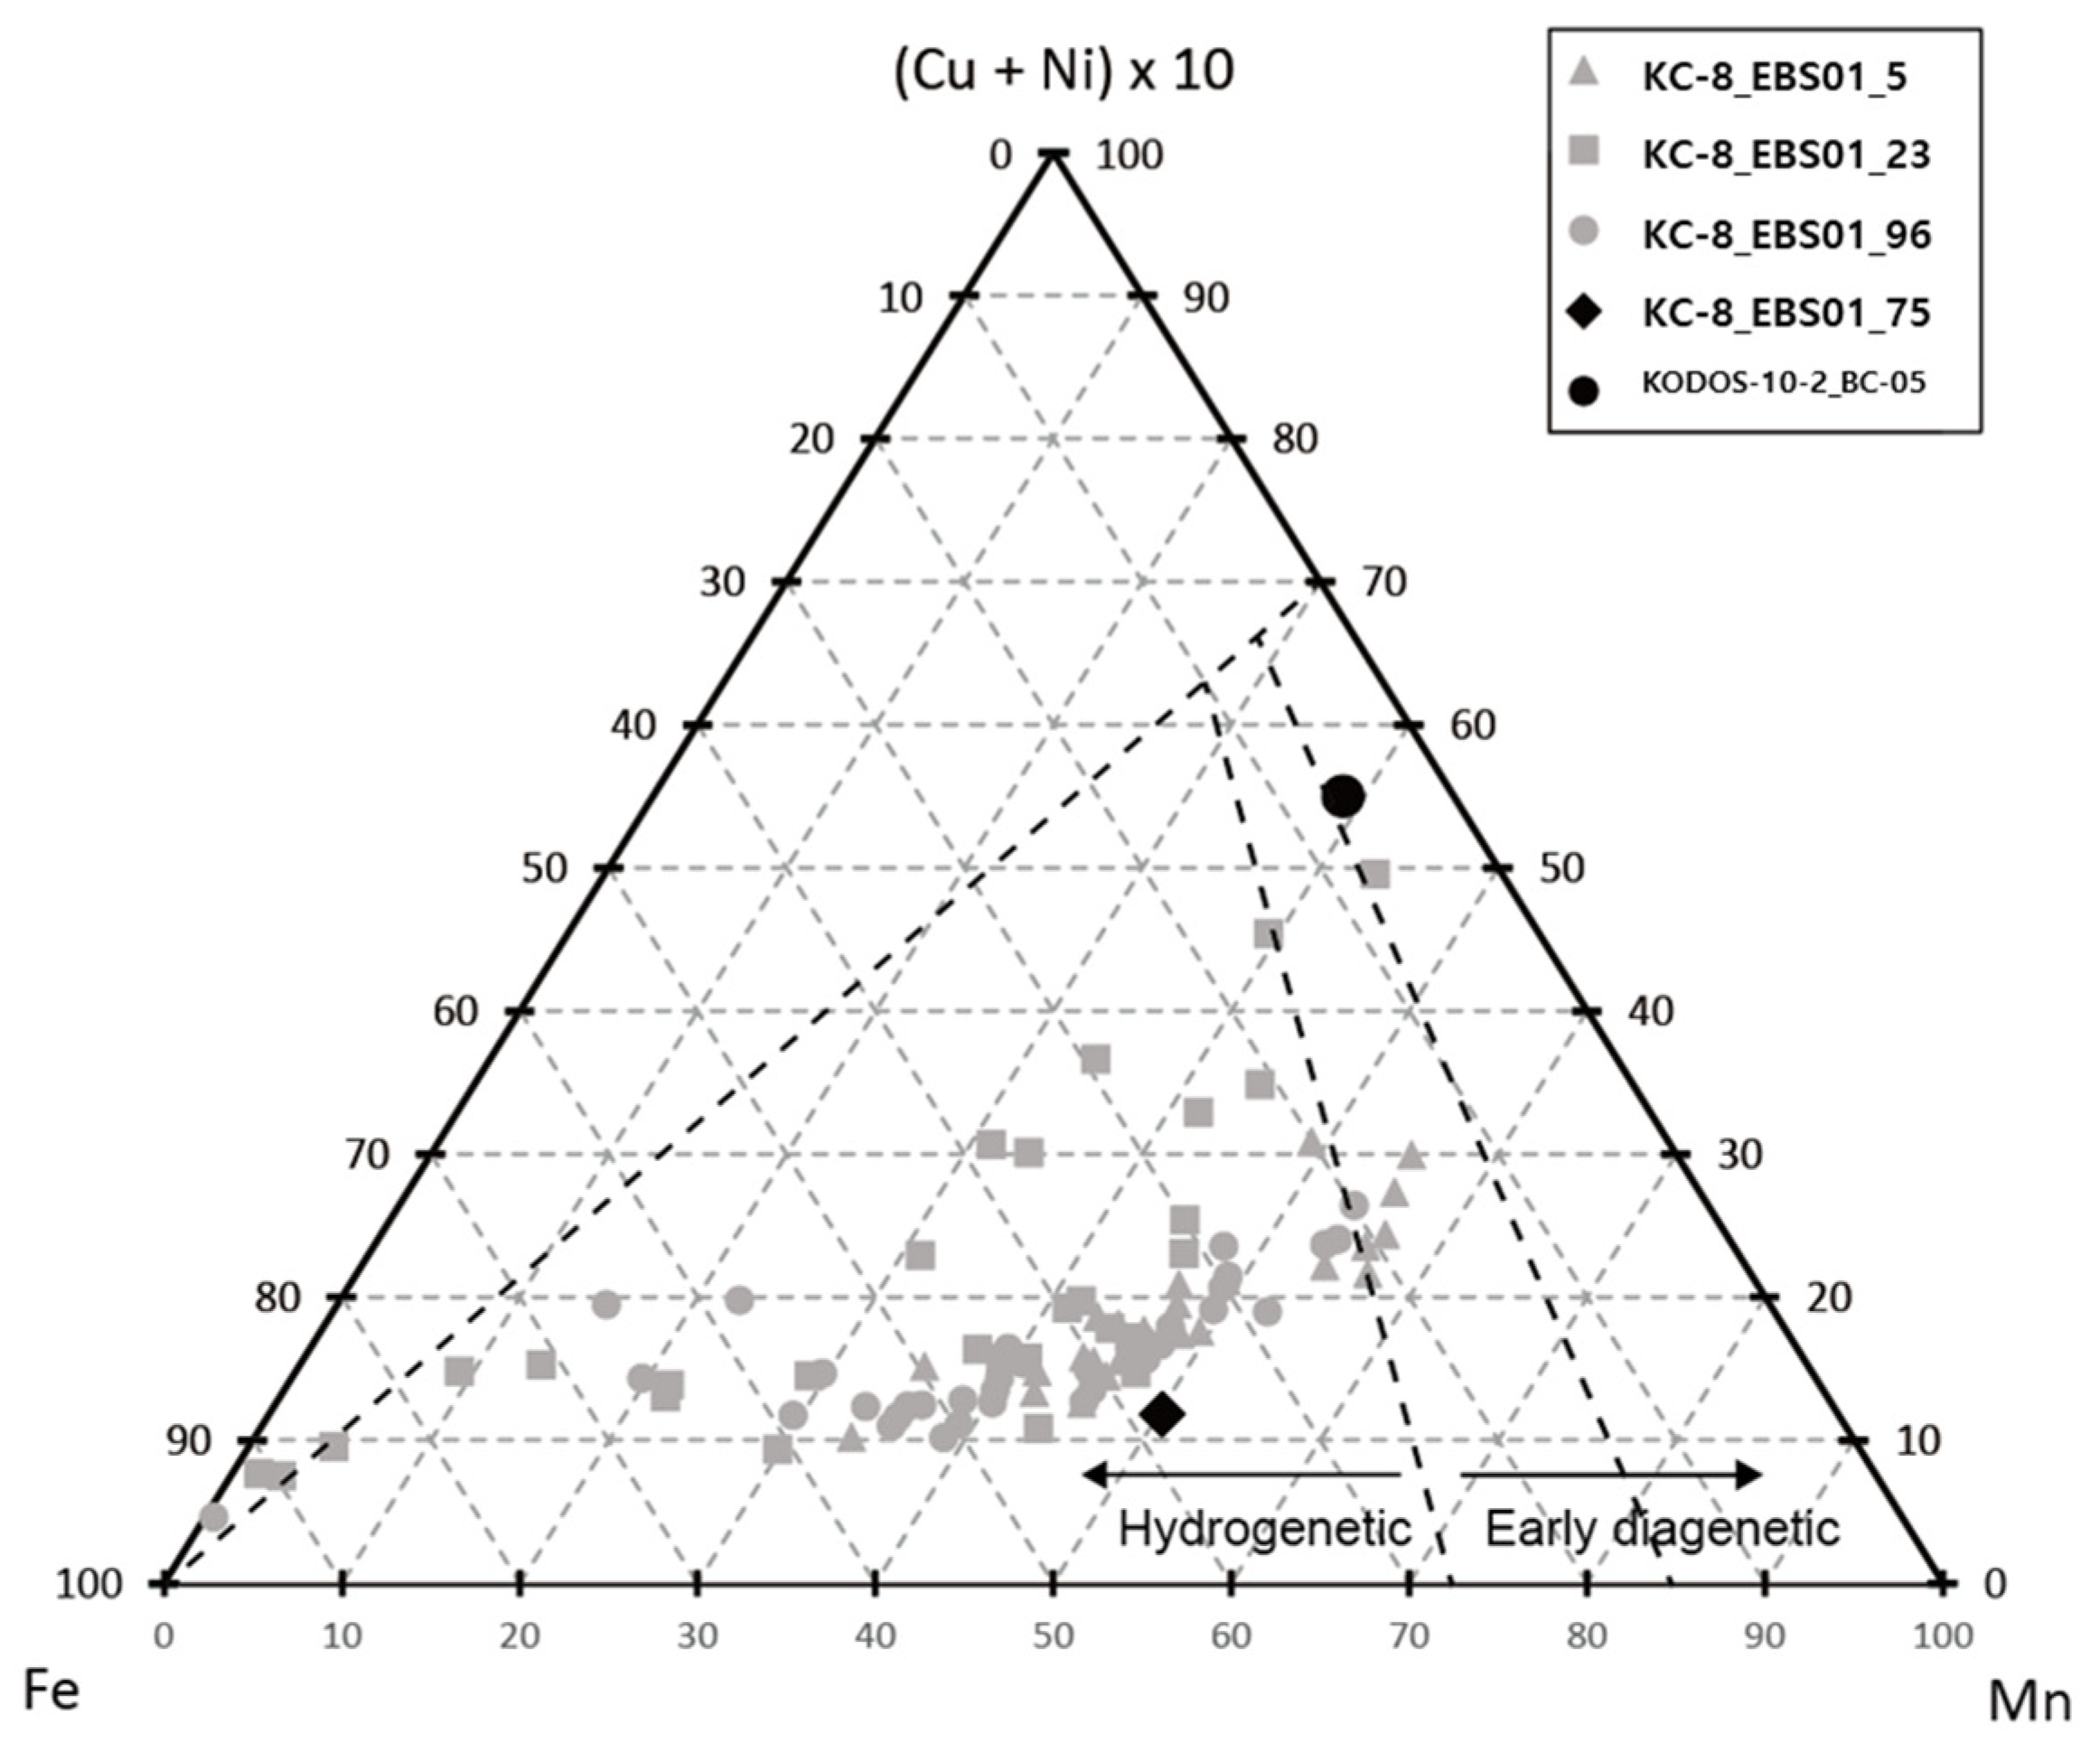
| Location | Elements (%) | Mn/Fe | ||||||||||||
|---|---|---|---|---|---|---|---|---|---|---|---|---|---|---|
| Mn | Fe | Si | Al | Mg | Ca | Na | K | Cl | Ti | Co | Ni | Cu | ||
| KC-8 | 34.3 (1) | 26.0 (1) | 10.9 (1) | 4.4 (1) | 5.0 (1) | 4.2 (1) | 8.5 (1) | 0.9 (1) | 2.0 (1) | 1.7 (1) | 1.2 (1) | 0.8 (1) | 1.32 | |
| KODOS-10 | 40.0 (1) | 6.4 (1) | 17.8 (1) | 7.2 (1) | 6.1 (1) | 2.3 (1) | 10.2 (1) | 1.9 (1) | 1.8 (1) | 0.6 (1) | 1.6 (1) | 4.1 (1) | 6.24 | |
| Southern Pacific Ocean a | 16.1 | 16.1 | 7.3 | 3.0 | 1.3 | 2.0 | 1.8 | 0.9 | 1.00 | |||||
| Indian Ocean b | 24.4 | 7.1 | 10.0 | 2.9 | 1.7 | 1.9 | 1.1 | 0.2 | 3.42 | |||||
| East Siberian Sea c | 49.9 | 2.2 | 5.5 | 2.8 | 1.8 | 1.5 | 2.5 | 2.0 | 22.6 | |||||

| KC-8 | KODOS-10 |
|---|---|
| Quartz | Quartz |
| Feldspar | Feldspar |
| Buserite | Todorokite |
| Vernadite | Buserite |
| Vernadite | |
| Birnessite | |
| Illite |
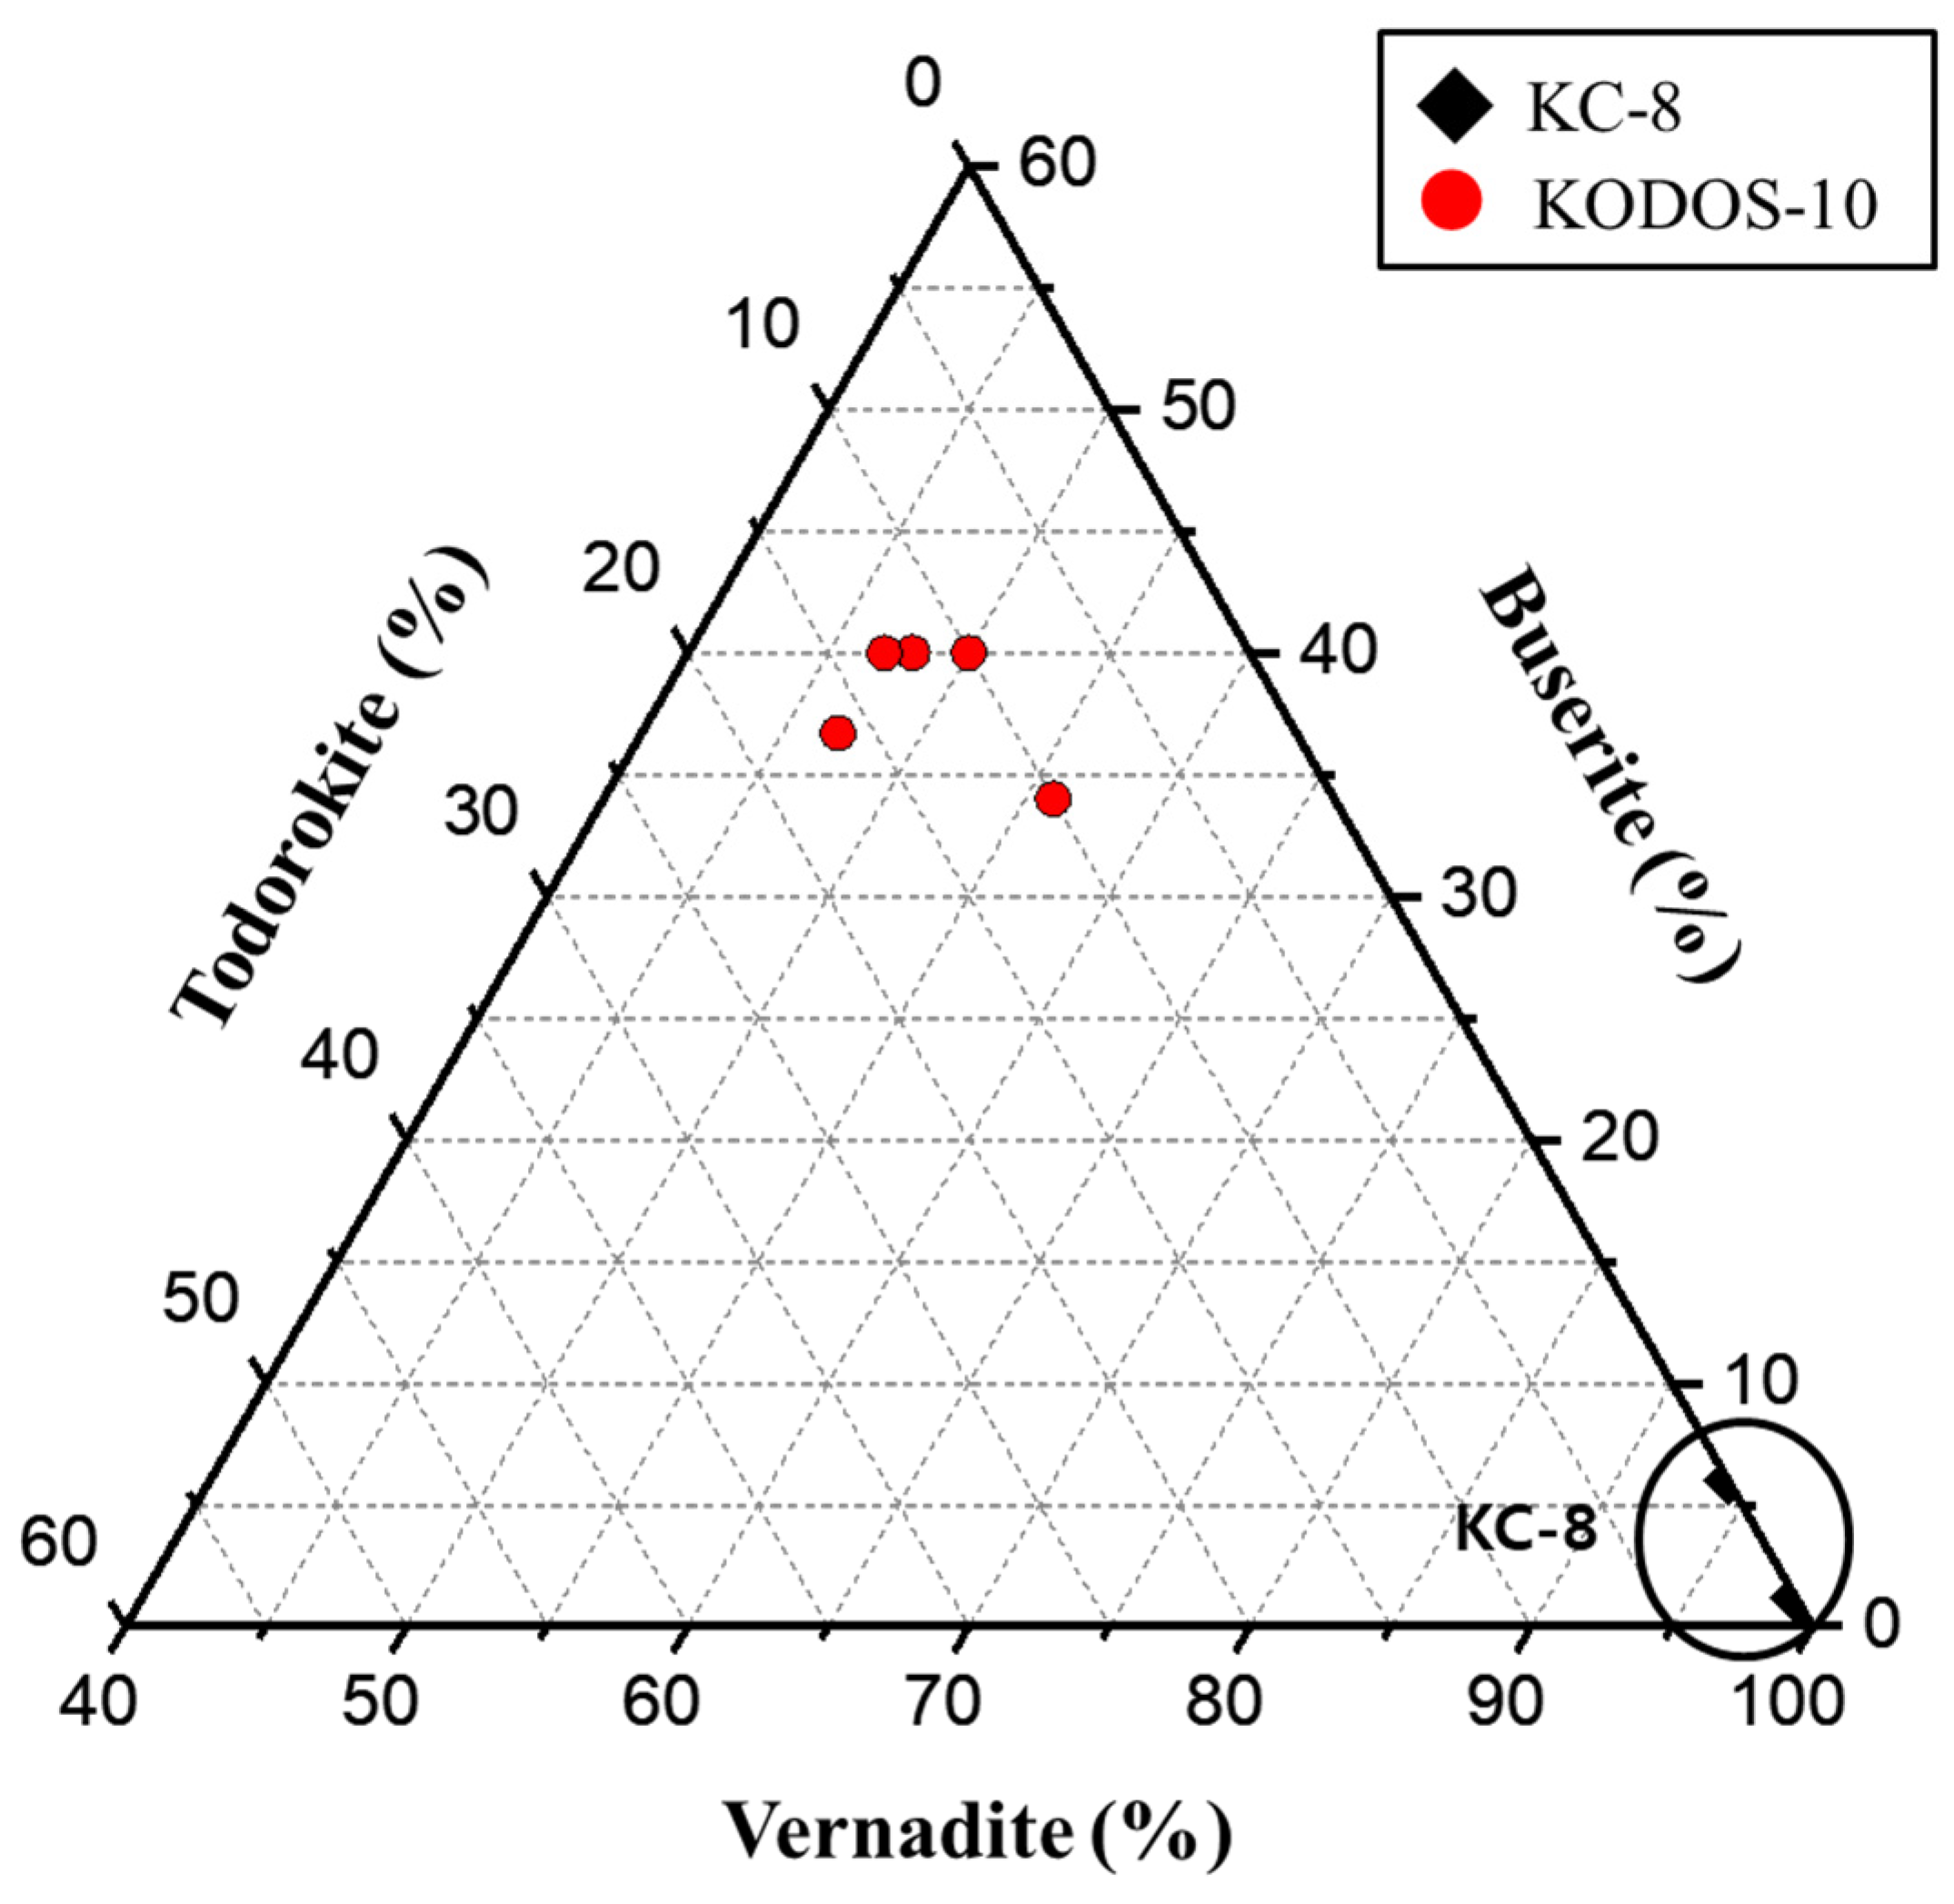
| Sample | Sum | ||||
|---|---|---|---|---|---|
| No. | Todorokite | Buserite | Vernadite | ||
| KC-8 (KC-8_1_EBS01_75) | 1 | 0 | 1.0(1) | 99(4) | 100(2) |
| 2 | 0 | 1(1) | 99(3) | 100(2) | |
| 3 | 0 | 0 | 100(4) | 100(4) | |
| 4 | 0 | 6(1) | 94(5) | 100(3) | |
| 5 | 0 | 1(1) | 99(3) | 100(2) | |
| KODOS-10 (KODOS10-2_BC-05) | 1 | 16.3(8) | 36.7(9) | 47(2) | 100.0(8) |
| 2 | 10(3) | 40(2) | 50(2) | 100(2) | |
| 3 | 10.5(2) | 33.6(4) | 56(2) | 100.1(9) | |
| 4 | 12.4(3) | 39.8(5) | 48(1) | 100.2(6) | |
| 5 | 12.6(2) | 40.1(3) | 47(1) | 99.7(5) | |
| Sample | Measurements | FWHM (°) | |||
|---|---|---|---|---|---|
| 9° at 2θ | 12° | 26.5° | 36.5° | ||
| KC-8 | Synchrotron-XRD | 0.56(5) | 1.75(17) | 0.064(4) | 0.99(3) |
| Lab-XRD | 0.59(3) | - | 0.089(3) | 1.21(3) | |
| KODOS-10 | Synchrotron-XRD | 0.53(2) | 0.33(3) | - | 1.54(3) |
| Lab-XRD | 0.58(6) | 0.48(4) | - | 3.49(12) | |
4. Conclusions
Author Contributions
Funding
Data Availability Statement
Acknowledgments
Conflicts of Interest
References
- Glasby, G.P.; Ren, X.; Shi, X.; Pulyaeva, I.A. Co–rich Mn crusts from the Magellan Seamount cluster: The long journey through time. Geo-Mar. Lett. 2007, 27, 315–323. [Google Scholar] [CrossRef]
- Hein, J.R.; Koschinsky, A. 13.11–Deep-Ocean Ferromanganese Crusts and Nodules. In Treatise on Geochemistry, 2nd ed.; Holland, H.D., Turekian, K.K., Eds.; Elsevier: Oxford, UK, 2014; pp. 273–291. [Google Scholar] [CrossRef]
- Zhang, W.; Cheng, C.Y. Manganese metallurgy review. Part I: Leaching of ores/secondary materials and recovery of electrolytic/chemical manganese dioxide. Hydrometallurgy 2007, 89, 137–159. [Google Scholar] [CrossRef]
- Hein, J.; Koschinsky, A.; Kuhn, T. Deep-ocean polymetallic nodules as a resource for critical materials. Nat. Rev. Earth Environ. 2020, 1, 158–169. [Google Scholar] [CrossRef]
- Kuhn, T.; Wegorzewski, A.; Rühlemann, C.; Vink, A. Composition, Formation, and Occurrence of Polymetallic Nodules. In Deep-Sea Mining; Springer: Cham, Switzerland, 2017; pp. 23–63. [Google Scholar] [CrossRef]
- Murton, B.; Parson, L.; Hunter, P.; Miles, P. Global Non-Living Resources on the Extended Continental Shelf: Prospects at the Year 2000; International Seabed Authority: Kingston, Jamaica, 2001. [Google Scholar]
- Park, J.; Jung, J.; Ko, Y.; Lee, Y.; Yang, K. Reconstruction of the Paleo-Ocean Environment Using Mineralogical and Geochemical Analyses of Mixed-Type Ferromanganese Nodules from the Tabletop of Western Pacific Magellan Seamount. Geochem. Geophys. Geosystems 2023, 24, e2022GC010768. [Google Scholar] [CrossRef]
- Halbach, P.; Hebisch, U.; Scherhag, C. Geochemical variations of ferromanganese nodules and crusts from different provinces of the Pacific Ocean and their genetic control. Chem. Geol. 1981, 34, 3–17. [Google Scholar] [CrossRef]
- Burns, R.G.; Mee Burns, V. Mechanism for nucleation and growth of manganese nodules. Nature 1975, 255, 130–131. [Google Scholar] [CrossRef]
- Burns, V.; Burns, R. Observations of processes leading to the uptake of transition metals in manganese nodules. Genèse Nodules Manganèse 1979, 289, 387–404. [Google Scholar]
- Burns, R.; Burns, V. Mineralogy. In Marine Manganese Deposits: Elsevier Oceanography Series; Elsevier: Amsterdam, The Netherlands, 1977; Volume 15, pp. 185–248. [Google Scholar]
- Manceau, A.; Lanson, M.; Takahashi, Y. Mineralogy and crystal chemistry of Mn, Fe, Co, Ni, and Cu in a deep-sea Pacific polymetallic nodule. Am. Mineral. 2014, 99, 2068–2083. [Google Scholar] [CrossRef]
- Wegorzewski, A.V.; Grangeon, S.; Webb, S.M.; Heller, C.; Kuhn, T. Mineralogical transformations in polymetallic nodules and the change of Ni, Cu and Co crystal-chemistry upon burial in sediments. Geochim. Cosmochim. Acta 2020, 282, 19–37. [Google Scholar] [CrossRef]
- Atkins, A.L.; Shaw, S.; Peacock, C.L. Release of Ni from birnessite during transformation of birnessite to todorokite: Implications for Ni cycling in marine sediments. Geochim. Cosmochim. Acta 2016, 189, 158–183. [Google Scholar] [CrossRef]
- Muñoz-Royo, C.; Peacock, T.; Alford, M.H.; Smith, J.A.; Le Boyer, A.; Kulkarni, C.S.; Lermusiaux, P.F.J.; Haley, P.J.; Mirabito, C.; Wang, D.; et al. Extent of impact of deep-sea nodule mining midwater plumes is influenced by sediment loading, turbulence and thresholds. Commun. Earth Environ. 2021, 2, 148. [Google Scholar] [CrossRef]
- González, F.; Somoza, L.; Hein, J.; Medialdea, T.; León, R.; Urgorri, V.; Reyes, J.; Martín-Rubí, J. Phosphorites, Co-rich Mn nodules, and Fe-Mn crusts from Galicia Bank, NE Atlantic: Reflections of Cenozoic tectonics and paleoceanography. Geochem. Geophys. Geosystems 2016, 17, 346–374. [Google Scholar] [CrossRef]
- Vereshchagin, O.; Perova, E.; Brusnitsyn, A.; Ershova, V.; Khudoley, A.; Shilovskikh, V.; Molchanova, E. Ferro-manganese nodules from the Kara Sea: Mineralogy, geochemistry and genesis. Ore Geol. Rev. 2019, 106, 192–204. [Google Scholar] [CrossRef]
- Kamitsubo, H. SPring-8 program. J. Synchrotron Radiat. 1998, 5, 162–167. [Google Scholar] [CrossRef] [PubMed]
- Withers, P.J. Synchrotron X-ray Diffraction. In Practical Residual Stress Measurement Methods; Wiley: Hoboken, NJ, USA, 2013; pp. 163–194. [Google Scholar] [CrossRef]
- Brown, G.E.; Foster, A.L.; Ostergren, J.D. Mineral surfaces and bioavailability of heavy metals: A molecular-scale perspective. Proc. Natl. Acad. Sci. USA 1999, 96, 3388–3395. [Google Scholar] [CrossRef] [PubMed]
- Manceau, A.; Marcus, M.A.; Tamura, N. Quantitative speciation of heavy metals in soils and sediments by synchrotron X-ray techniques. Rev. Mineral. Geochem. 2002, 49, 341–428. [Google Scholar] [CrossRef]
- Manceau, A.; Tamura, N.; Celestre, R.S.; MacDowell, A.A.; Geoffroy, N.; Sposito, G.; Padmore, H.A. Molecular-scale speciation of Zn and Ni in soil ferromanganese nodules from loess soils of the Mississippi Basin. Environ. Sci. Technol. 2003, 37, 75–80. [Google Scholar] [CrossRef]
- Yu, X.-L.; Fu, Y.-N.; Brookes, P.C.; Lu, S.-G. Insights into the formation process and environmental fingerprints of iron–manganese nodules in subtropical soils of China. Soil Sci. Soc. Am. J. 2015, 79, 1101–1114. [Google Scholar] [CrossRef]
- Jiang, X.D.; Zhao, X.; Chou, Y.M.; Liu, Q.S.; Roberts, A.P.; Ren, J.B.; Sun, X.M.; Li, J.H.; Tang, X.; Zhao, X.Y.; et al. Characterization and Quantification of Magnetofossils Within Abyssal Manganese Nodules from the Western Pacific Ocean and Implications for Nodule Formation. Geochem. Geophys. Geosystems 2020, 21, e2019GC008811. [Google Scholar] [CrossRef]
- Vodyanitskii, Y.N. The composition of Fe-Mn nodules as determined by synchrotron X-ray analysis (Review of publications). Eurasian Soil Sci. 2006, 39, 147–156. [Google Scholar] [CrossRef]
- Bau, M.; Koschinsky, A.; Dulski, P.; Hein, J.R. Comparison of the partitioning behaviours of yttrium, rare earth elements, and titanium between hydrogenetic marine ferromanganese crusts and seawater. Geochim. Cosmochim. Acta 1996, 60, 1709–1725. [Google Scholar] [CrossRef]
- Wegorzewski, A.; Kuhn, T. The influence of suboxic diagenesis on the formation of Manganese nodules in the Clarion Clipperton nodule belt of the Pacific Ocean. Mar. Geol. 2014, 357, 123–138. [Google Scholar] [CrossRef]
- Halbach, P. Processes controlling the heavy metal distribution in Pacific ferromanganese nodules and crusts. Geol. Rundsch. 1986, 75, 235–247. [Google Scholar] [CrossRef]
- Glasby, G. The mineralogy of manganese nodules from a range of marine environments. Mar. Geol. 1972, 13, 57–72. [Google Scholar] [CrossRef]
- Reykhard, L.Y.; Shulga, N. Fe-Mn nodule morphotypes from the NE Clarion-Clipperton Fracture Zone, Pacific Ocean: Comparison of mineralogy, geochemistry and genesis. Ore Geol. Rev. 2019, 110, 102933. [Google Scholar] [CrossRef]
- Lee, S.; Xu, H. XRD and TEM studies on nanophase manganese oxides in freshwater ferromanganese nodules from Green Bay, Lake Michigan. Clays Clay Miner. 2016, 64, 523–536. [Google Scholar] [CrossRef]
- Bish, D.L.; Post, J.E. Thermal behavior of complex, tunnel-structure manganese oxides. Am. Mineral. 1989, 74, 177–186. [Google Scholar]
- Shen, Y.F.; Zerger, R.P.; DeGuzman, R.N.; Suib, S.L.; McCurdy, L.; Potter, D.I.; O’Young, C.L. Manganese Oxide Octahedral Molecular Sieves: Preparation, Characterization, and Applications. Science 1993, 260, 511–515. [Google Scholar] [CrossRef]
- Ching, S.; Krukowska, K.S.; Suib, S.L. A new synthetic route to todorokite-type manganese oxides. Inorganica Chim. Acta 1999, 294, 123–132. [Google Scholar] [CrossRef]
- Uspenskaya, T.Y.; Gorshkov, A.; Sivtsov, A. Mineralogy and internal structure of Fe-Mn nodules from the Clarion-Clipperton fracture zone. Int. Geol. Rev. 1987, 29, 363–371. [Google Scholar] [CrossRef]
- Schreiner, W.N.; Jenkins, R. A Second Derivative Algorithm for Identification of Peaks in Powder Diffraction Patterns. Adv. X-ray Anal. 1979, 23, 287–293. [Google Scholar] [CrossRef]
- Biscaye, P.E. Mineralogy and Sedimentation of Recent Deep-Sea Clay in the Atlantic Ocean and Adjacent Seas and Oceans. GSA Bull. 1965, 76, 803–832. [Google Scholar] [CrossRef]
- Yu, H.J.; Shin, E.J.; Koo, H.J.; Cho, H.G. Semi-quantitative Analysis of Manganese Oxide Mineral in Manganese Nodule from the East Siberian Sea. Korean J. Mineral. Petrol. 2020, 33, 427–437. [Google Scholar]
- Hein, J.R.; Mizell, K.; Koschinsky, A.; Conrad, T.A. Deep-ocean mineral deposits as a source of critical metals for high- and green-technology applications: Comparison with land-based resources. Ore Geol. Rev. 2013, 51, 1–14. [Google Scholar] [CrossRef]
- Jauhari, P.; Pattan, J. Ferromanganese nodules from the central Indian Ocean basin. In Handbook of Marine Mineral Deposits; Routledge: London, UK, 2017; pp. 171–196. [Google Scholar]
- Pattan, J.; Rao, C.M.; Migdisov, A.; Colley, S.; Higgs, N.; Demidenko, L. Ferromanganese nodules and their associated sediments from the Central Indian Ocean Basin: Rare earth element geochemistry. Mar. Georesources Geotechnol. 2001, 19, 155–165. [Google Scholar] [CrossRef]
- Baturin, G.; Dubinchuk, V. On the composition of ferromanganese nodules of the Indian Ocean. Proc. Dokl. Earth Sci. 2010, 343, 1179–1184. [Google Scholar] [CrossRef]
- Pattan, J.N.; Parthiban, G. Geochemistry of ferromanganese nodule–sediment pairs from Central Indian Ocean Basin. J. Asian Earth Sci. 2011, 40, 569–580. [Google Scholar] [CrossRef]
- Balaram, V.; Mathur, R.; Banakar, V.; Hein, J.R.; Rao, C.; Rao, T.G.; Dasaram, B. Determination of the platinum–group elements (PGE) and gold (Au) in manganese nodule reference samples by nickel sulfide fire-assay and Te coprecipitation with ICP-MS. Indian J. Geo-Mar. Sci. 2006, 35, 7–16. [Google Scholar]
- Dymond, J.; Lyle, M.; Finney, B.; Piper, D.Z.; Murphy, K.; Conard, R.; Pisias, N. Ferromanganese nodules from MANOP Sites H, S, and R—Control of mineralogical and chemical composition by multiple accretionary processes. Geochim. Cosmochim. Acta 1984, 48, 931–949. [Google Scholar] [CrossRef]
- Hein, J.R.; Spinardi, F.; Okamoto, N.; Mizell, K.; Thorburn, D.; Tawake, A. Critical metals in manganese nodules from the Cook Islands EEZ, abundances and distributions. Ore Geol. Rev. 2015, 68, 97–116. [Google Scholar] [CrossRef]
- Wegorzewski, A.V.; Kuhn, T.; Dohrmann, R.; Wirth, R.; Grangeon, S. Mineralogical characterization of individual growth structures of Mn-nodules with different Ni+Cu content from the central Pacific Ocean. Am. Mineral. 2015, 100, 2497–2508. [Google Scholar] [CrossRef]
- Su, R.; Sun, F.; Li, X.; Chu, F.; Sun, G.; Li, J.; Wang, H.; Li, Z.; Zhang, C.; Zhang, W.; et al. Diverse early diagenetic processes of ferromanganese nodules from the eastern Pacific Ocean: Evidence from mineralogy and in-situ geochemistry. Int. Geol. Rev. 2022, 65, 2131–2147. [Google Scholar] [CrossRef]

Disclaimer/Publisher’s Note: The statements, opinions and data contained in all publications are solely those of the individual author(s) and contributor(s) and not of MDPI and/or the editor(s). MDPI and/or the editor(s) disclaim responsibility for any injury to people or property resulting from any ideas, methods, instructions or products referred to in the content. |
© 2023 by the authors. Licensee MDPI, Basel, Switzerland. This article is an open access article distributed under the terms and conditions of the Creative Commons Attribution (CC BY) license (https://creativecommons.org/licenses/by/4.0/).
Share and Cite
Jung, J.; Lee, S.; Yang, K.; Kim, J.; Hyeong, K.; Ko, Y.; An, H.; Park, J.; Seoung, D.; Lee, Y. Semi-Quantitative Analyses of Ferromanganese Nodules from the Pacific Ocean Using Synchrotron X-ray Powder Diffraction. Minerals 2023, 13, 1555. https://doi.org/10.3390/min13121555
Jung J, Lee S, Yang K, Kim J, Hyeong K, Ko Y, An H, Park J, Seoung D, Lee Y. Semi-Quantitative Analyses of Ferromanganese Nodules from the Pacific Ocean Using Synchrotron X-ray Powder Diffraction. Minerals. 2023; 13(12):1555. https://doi.org/10.3390/min13121555
Chicago/Turabian StyleJung, Jaewoo, Soojin Lee, Kiho Yang, Jonguk Kim, Kiseong Hyeong, Youngtak Ko, Hyeonho An, Jinsub Park, Donghoon Seoung, and Yongmoon Lee. 2023. "Semi-Quantitative Analyses of Ferromanganese Nodules from the Pacific Ocean Using Synchrotron X-ray Powder Diffraction" Minerals 13, no. 12: 1555. https://doi.org/10.3390/min13121555