
Measuring Ultrasonic and Electrical Properties of Early-Age Cemented Tailings Backfill

School of Energy and Mining Engineering, China University of Mining and Technology (Beijing), Beijing 100083, China
*
Author to whom correspondence should be addressed.
Minerals 2023, 13(2), 135; https://doi.org/10.3390/min13020135
Submission received: 15 December 2022
/
Revised: 9 January 2023
/
Accepted: 13 January 2023
/
Published: 17 January 2023
(This article belongs to the Special Issue Backfilling Materials for Underground Mining, Volume III)
Abstract
:The setting behavior strongly affects the workability and loading capacity of a fresh cemented tailings backfill (CTB). The Vicat test is a conventional way to measure the setting time of a fresh cementitious mixture, using a standard needle to detect penetration resistance. However, this method is limited to laboratory testing, it is difficult to carry out in underground closed stopes. In this study, two nondestructive methods, the ultrasonic pulse and electrical conductivity tests, contrasting two traditional methods, hydration heat measurement and the Vicat test, are used to illustrate the setting process of early-age CTB. The effect of cement content (e.g., 2.5%, 5% and 7.5%) and tailings type (silica tailings and iron mine tailings) on the hydration heat of early-age CTB are recorded as well. The results show that, as the CTBs change from solid–liquid mixtures to solids, the ultrasonic pulse frequency converts from low to high and the electrical conductivity turns from growth to decline. As the degree of hydration increases, the solid connections continuously increase, which increases the ultrasonic amplitude rapidly and decreases electrical conductivity. The TG value can be effectively used to predict the initial set time of cemented silica tailings backfill. For cemented iron tailings backfill, although the solid phase ultrasonic path is formed, more hydration products are needed to reach the specific shear stiffness, meaning the initial set lags behind the change in ultrasonic frequency signal.
1. Introduction
The conventional method of tailings disposal is storage in surface facilities, where they present several potential environmental risks. There is an increasing interest in backfilling underground voids (or stopes), thus reducing the risks of environmental hazards and minimizing the loss of ore due to dilution. The use of cemented tailings backfill (CTB) technology in mines as a both economic and environmental method of tailings disposal in the world has been proved over the past few decades. The mechanic property of CTB mainly depends on the microstructural development of bonds between hydration products and tailings, which is usually accompanied by physical and chemical changes. In general, it is known that the fundamental properties of CTB such as durability, strength, physical properties and microstructure are affected by the components, cement content, aggregate and mineral additives, etc. [1,2,3]. The setting time (e.g., initial set and final set) is one of the important parameters when presenting workability and microstructure development. According to the optimal concentration parameters of CTB slurry, the interval between two filling times and the required strength of barricades have been determined. The setting time is commonly tested using a Vicat needle test for a cementitious mixture such as cemented mortar and concrete [4,5]. Nevertheless, it is generally realized that the testing values are arbitrary, and errors are prone to occurring in the field. In addition, the testing procedure is not easy to operate and time-consuming, and its reliability depends on the penetration needle type and the sample size.
Hence, alternative techniques have been attempted, such as electrical and ultrasonic measurements, to determine the hydration process and strength of CTB. The electrical method is one of the important non-destructive methods. Brameshuber [6] found the initial set time was close to the point corresponding to the first minimum of the differential curve of slurry conductivity. Tamas [7] conducted a resistivity test on cement to investgate the variance in resistance values during cement hydration. The results showed that the resistance/conductivity differential curve had a minimum/maximum value in the middle of acceleration, which may have been caused by the transformation of ettringite (AFt) into single sulfur calcium aluminate hydrate (AFm). In addition, Wei [8] and Xu [9] concluded that resistivity testing can provide useful information on changes in ion concentration and the porosity of hydrated cement-based materials in pore liquids. Sallehi [10] induced the formation factor to illustrate the setting process and believed that the formation factor–time curve can be utilized as a new method to determine the initial set time of cement-based materials.
Previous works showed that ultrasonic methods are also proposed to monitor the microstructure and strength evolution of cement-based materials in both laboratory and field conditions. Elastic wave propagation through water-filled porosity determines wave velocity, so hydration degree and dormant phase was experimentally determined via ultrasonic pulse wave measurement [11]. The influence of admixture component [12,13], content [14,15,16] and aggregate size [10,17] on cemented paste was also investigated using the measurement of ultrasonic pulse waves. In addition, the amplitude and spectrum of ultrasonic waves can characterize the hydration process of cemented tailings backfill (CTB) as well [18,19]. Studies over the past two decades on compressional waveforms have shown that the amplitude and spectrum of compressional waves are sensitive enough to the physical changes in concrete caused by the hydration reaction to distinguish its hydration process. As such, the threshold values [20] and the TG factor [21,22] are effectively and accurately used to determine the setting time and are less affected by the composition of a material.
However, there are few research results regarding the ultrasonic and electrical properties of the early-age CTB. The non-destructive monitoring method of early-age CTB is helpful to shorten the secondary filling time interval and realize the real-time monitoring of the CTB setting process in stopes. Therefore, a series of experimental work is performed to monitor the setting behavior of the early-age cemented tailings backfill. The evolution of the ultrasonic waveforms, EC value, initial set time and hydration heat are measured simultaneously with different cement contents (2.5%, 5% and 7.5%) and different aggregates (silica tailings and iron tailings) in order to explore the ultrasonic and electrical properties of early-age cement tailings backfill.
2. Materials and Sample Preparation
2.1. Materials
Cement (P.O. 42.5) with a specific gravity of 3.1 was used. The silica tailings (ST) and iron mine tailings (FT) were homogeneously mixed with cement and water to fabricate the fresh CTB sample. The FT mainly consisted of SiO2, Fe2O3, MgO and Al2O3, and the average specific gravity was 2.6 g/cm3. The ST was used to minimize chemical minerals’ effects on the test results. The main oxide composition of ST was silica dioxide (99.6%), and the average specific gravity was 3.56 g/cm3. The particle size distribution of the tailings was measured using a Microtra S3500 Laser Particle Size Analyzer and is presented in Figure 1, and the mineralogical components of the tailings and cement are shown in Table 1.
2.2. Sample Preparation and Mix Proportion
The mix proportions of the fresh CTB samples were consistent with those in an iron mine field. The concentration was 70% by mass, and the cement content was designed to be 2.5%, 5% or 7.5% by mass; the corresponding water-to-cement ratio was 17, 9 or 6, respectively. The mixtures were mixed for 10 min using a planetary mixer. The fresh cemented silica tailings backfill samples with the same cement proportions were also tested to confirm the experiment results. A sample of fresh CTB was prepared for ultrasonic pulse wave measurement, and another sample was used for electrical conductivity measurement. All the fresh CTB samples were cured in a chamber with 20 ± 1 °C and 90 ± 5% relative humidity [23]. The detailed mix design is shown in Table 2.
2.3. Experimental Measurement Methods
2.3.1. Electrical Conductivity Measurement
Electrical conductivity (EC) is the representation of ions’ transmission in a liquid and the hydration degree [24,25]. A electrical conductivity detector (HSTL-102STRDDL) was used to measure the EC of the fresh CTB sample with an accuracy of 3%. The EC sensor had two electrodes with a length of 55 mm and a diameter of 3 mm. The electrodes were placed into the middle of fresh CTB samples during measuring, and the EC of the mixture was recorded about every 10 min.
2.3.2. Hydration Heat Measurement
The heat generated via the cement hydration reaction was measured with an isothermal calorimeter (Tam, Air). The fresh well-mixed CTB was placed into a sealed thermal insulation container and cured in a capsule with a constant temperature of 20 ± 0.1 °C. The temperature change inside the capsule was monitored using a temperature sensor with a precision of 0.01 °C about every 5 min.
2.3.3. Ultrasonic Pulse Measurement
A non-mental ultrasonic detector (ZBL-U520) was used to monitor the ultrasonic signal of fresh CTB, and a U-shaped rubber foam element was used as the container for the CTB samples, which effectively blocked the transmission of ultrasonic waves through the mold, as shown in Figure 2. Two ultrasonic transducers were configured at two ends of the CTB sample, the amplitude and frequency of the ultrasonic pulse wave transmitting through the sample was continuously recorded.
2.4. Ultrasonic Signal Processing
The received signal would change with the evolution of the CTB sample in structure when ultrasonic pulse transmitted through the CTB sample, as shown in Figure 3a. Fast Fourier Transform (FFT) has been recognized as a standard signal processing technique for analyzing ultrasound signals [26]. The typical received signal is shown in Figure 3a, and the corresponding frequency distribution extracted via FFT is shown in Figure 3b. Figure 3c and Figure 3d, respectively, illustrate the frequency domain distribution of silica tailings backfill and iron tailings backfill over time. It can be observed that, as the hydration time increased, the received ultrasonic signal increased sharply, and the frequency converted from low to high.
An ultrasonic parameter called a TG factor was introduced, defined as a dimensionless ratio between maximum amplitudes of two dominant frequency ranges which appear in a frequency spectrum of received ultrasonic signals [21,22]. The TG was calculated according to the formula:
where a1 and a2 stand for the maximum amplitude of the frequencies from the low and high frequency ranges, respectively. According to Figure 3b, the low frequency range is 0–65 Hz, and the high frequency range is 65–200 Hz. The TG varies between −1 and 1, where −1 corresponds to the case when the higher frequencies are completely damped, and, analogically, a TG equal to 1 corresponds to the case with a total lack of lower frequencies in the frequency spectrum.
3. Experimental Results
3.1. Ultrasonic Pulse Evolution over Curing Time
The effect of cement content on the frequency distribution of the cemented silica tailings backfill sample and the cemented iron tailings backfill sample is shown in Figure 4 and Figure 5, respectively. As shown in Figure 4, the frequency distribution is similar for different cement contents. It shows that the main frequency domain is first from around 20 Hz to 40 Hz with a brief spike appearing in amplitude, and then, the amplitude reduces to 0, and lastly, the amplitude increases again and the main frequency domain is increased to around 80 Hz. A similar result is observed with the cemented iron tailings backfill in Figure 5. However, the first peak of low frequency is unobservable due to the fine particles in the tailing producing large scattering and energy attenuation to the ultrasonic pulse [27,28].
Combined with the above results, the consolidation process of fresh CTB can be divided into three stages according to the propagation characteristics of ultrasonic waves, as shown in Figure 4. In the liquid propagation stage (stage І), the amplitude of the ultrasonic wave rises first and then decreases, as shown in Figure 4a. Within the first 200 min, due to an increasing number of contacts between particles [29] and entrapped air bubbles migrating to the surface of the material [30,31], the amplitude of the ultrasonic wave slightly rises. However, due to the viscous absorption of liquid inside the fresh CTB, high-frequency signals cannot be transmitted through tailings particles, only low-frequency signals, so the main frequency domain is from around 20 Hz to 40 Hz. In the transitional stage (stage Ⅱ), the amount of hydration product is continuously accumulated on the surface of tailings particles. The liquid propagation path is weakened, but the solid propagation path through the connection between hydrates and tailings is gradually formed [32,33]. Therefore, the amplitude of the transmitted ultrasonic wave is lower than that in the liquid propagation stage. In the solid propagation stage (stage Ш), as the hydration reaction accelerates, a large amount of the connected solid phase increases, and the solid propagation path is completely formed, resulting in an increase in the ultrasonic wave velocity and amplitude inside early-age CTB [34]. The dominant frequency is from around 60 Hz to 84 Hz. In this stage, the effect of cement content on the maximum amplitude of early-age CTB is significantly enhanced with the increase in cement content.
3.2. Electrical Conductivity Evolution over Curing Time
Figure 6 and Figure 7 illustrate the electrical conductivity and the conductivity derivative of cemented silica tailings backfill samples and cemented iron tailings backfill samples, respectively. As shown in Figure 6a, the evolution of electrical conductivity for the cemented silica tailings backfill sample is divided into four stages: in the dissolution stage (oa section), the electrical conductivity rises rapidly as soon as mixing occurs; in the induction stage (ab section), as the water film is wrapped on the cement particles, the dissolution rate of the cement slows down, resulting in the electrical conductivity increasing slowly; in the acceleration stage (bc section), due to the effect of osmotic pressure, the water film on the cement surface fails, and the cement hydration enters the accelerated stage controlled by the hydration reaction. Hydration products C-S-H and CH are rapidly formed in this stage, which causes the ions in the free water to have to go through a more tortuous path, resulting in a decrease in electrical conductivity [10]. In the stable stage (after c point), the liquid path is completely closed, and the electrical conductivity declines slowly with hydration. Figure 6 also shows that the solid propagation stage (stage Ш) of the received ultrasonic signal coincides with an acceleration stage (bc section) of electrical conductivity. This verifies that the increase in rigid connections formed by hydration products is the main reason for the rapid growth of ultrasonic signals for CTBs. Meanwhile, with the increase in cement content, the induction stage (ab section) of electrical conductivity is shortened, and the solid propagation stage of the ultrasonic wave is advanced. It is believed that a lower water–cement ratio helps facilitate the hydration process, and more hydration products are formed at the same time.
Similar results are shown in the cemented iron tailings backfill samples, as shown in Figure 7. However, the post-peak decline in electrical conductivity is small, and the bc section lasts longer in cemented iron tailings backfill samples. This is due to the large specific surface of fine iron tailings, as it takes more hydration products to achieve the increase in the tortuosity of the liquid’s path.
3.3. Hydration Heat and Initial Set
Figure 8 shows the temperature, cumulative heat production and heat production rate curves of the cemented silica tailings backfill sample and the iron tailings backfill sample at the 7-day age. As shown in the figure, with the increase in hydration time, the temperature rises first and then decreases (Figure 8a), and the cumulative heat increases with the extension of time (Figure 8b). In addition, the cumulative heat increases with the cement content increase. The obtained results also show that the hydration heat process of cemented silicon tailings backfill is similar to the conventional cement, including an early induction stage, induction stage, hydration acceleration stage, hydration deceleration stage and hydration stable stage (Figure 8c). In comparison, the stages of the hydration heat process are difficult to divide in cemented iron tailings backfill. This may be caused by the mineralogical components of tailings, which contain a large proportion of CaO and MgO (Table 1). In the early induction and induction stage, the ions in the liquid need to reach a certain concentration before the crystal nucleus can appear and grow into hydration products [35]. Additionally, a large number of Ca2+ and Mg2+ ions are formed after the iron tailings backfill is prepared, which advances the date when the ion concentration in the liquid reaches the critical value, so the cemented iron tailings backfill enters the accelerated stage in advance. Figure 8d shows the variation in the initial set time of cemented silica tailings backfill samples and iron tailings backfill samples with different cement contents. It can be concluded that as the cement content increases, the initial set time of the CTB samples shorten.
3.4. Discussions
It can be concluded from the above results that the hydration process of CTB samples would change with different chemical compositions of the aggregate, but these changes can be sensitive to identification and partition using ultrasonic and hydration heat test methods. Therefore, in order to further explore the possibility of ultrasonically screening the hydration process of CTB samples, the frequency variation process is further discussed.
3.4.1. Relationship between TG and Rate of Heat Production
The relationships between TG and the heat production rate of the cemented silica tailings backfill sample and the iron tailings backfill sample are shown in Figure 9 and Figure 10, respectively. As shown in the figures, the TG is around −1 at first, then rises as the hydration heat turns into the acceleration stage, and stays above 0 at last. The change in TG displays the evolution of ultrasonic frequency from low to high as hydration occurs. It is worth noting that, for the cemented silica tailings backfill, when the initial set time is reached, the TG rises up to exactly 0 (Figure 9). In other words, the moment when the frequency of the received signal changes from low to high corresponds with the initial set time of the cemented silica tailings backfill. This result has been verified by research on concrete and cement [21,22].
Meanwhile, for the iron tailings backfill, the initial set is obviously later than the moment TG reaches 0 (Figure 10). The iron tailings contain fine particles and large amounts of CaO and MgO which would affect the hydration process. However, CaO and MgO should promote hydration and advance the initial set time rather than delay it, which can be easily seen from the results of the electrical conductivity and hydration heat tests. Therefore, the fine particles delay the initial set time. Tested using the Vicat apparatus, the sample is considered as the initial set when the specified shear stiffness is reached. It is effectively applied to judge the initial set of cemented materials with coarse tailings, for which the initial set is reached shortly after entering the accelerated stage. However, for fine iron tailings, a larger specific surface area would require more hydration products (e.g., C-S-H, CH and AFt) to reach the specified shear stiffness; this is the reason why the initial set time lags far behind the moment the TG value reaches 0.
3.4.2. Relationship between TG and UPV
According to the first arrival time and the ranges, a change in the velocity of the ultrasonic wave with time can be reached, and the relationship between TG and UPV is shown in Figure 11 and Figure 12. From Figure 11, five main stages can be seen according to the Vp-t curve of the cemented silica tailings backfill sample: the dormant stage (before a point), in which, because of the scattering of air and particles in the solution, the ultrasonic wave speed is low and the signal is difficult to receive; the steady increase stage (after d point), in which the Vp steadily increases with the accumulation of hydration products; the initial stage (ab stage), in which the Vp rapidly increases with the contact of particles; the deceleration stage (bc stage), in which hydration gel is coated on the surface of tailings particles, slowing down the growth rate of Vp; the acceleration stage (cd stage), in which the solid propagation channel is formed, and the Vp increases rapidly with the growth of the solid connection rate. Nevertheless, the middle three stages (between a and d point) are difficult to divide in cemented iron tailings backfill. This could be explained by differences in the hydration process between the two types of tailings shown in Figure 8c, in which the advance of the hydration acceleration stage leads to the overlap of the initial stage and the deceleration stage in the Vp-t curve. In addition, it can be seen that the Vp is in the range of 900~1000 m/s in cemented silica tailings backfill when the TG reaches 0, while the Vp is in the range of 800~900 m/s in cemented iron tailings backfill. The results indicate that the use of a specific wave velocity as the initial set index is greatly affected by materials.
3.4.3. Setting Model of Cemented Tailings Backfill
The stage deadlines of CTB obtained via the multi-physical test are summarized in Table 3. The obtained results show that the deadline of the transitional stage tested using an ultrasonic wave is close to the deadline of the induction stage tested via the EC, and this time is before the initial set time. The setting process characteristic of cemented tailings backfill is illustrated in Figure 13. It shows that, at stage І, the received ultrasonic signal and the electrical conductivity rise due to the particle subsidence and the dissolution of cement. At stage Ц, the cement continues to dissolve, which continuously enhances the electrical conductivity, but the C-S-H gel is formed on the surfaces of particles blocking the penetration of ultrasonic waves, which causes the received ultrasonic signal to weaken. At stage Ш, the C-S-H extends to form a fibrous rigid structure, so that between the tailings, the solid connecting path is formed and the liquid phase path is cut off. The CTB samples begin to stiffen (initial set) when enough C-S-H fibers accumulate. Additionally, at the same time, the stable solid phase ultrasonic path is formed, leading to the frequency of the received signal changing from low to high. However, it is worth noting that for fine tailings, although the solid phase ultrasonic path is formed, more hydration products are needed to reached the specific shear stiffness, so it takes a longer hydration time to reach the initial set time. On the other words, the traditional intrusion test (the Vicat test) is insufficient in measuring the initial set time of ultrafine tailings particles, while the nondestructive methods (the ultrasonic pulse and electrical conductivity tests) are more sensitive to the setting processes of those.
4. Conclusions
After contrasting the ultrasonic pulse and electrical conductivity test with the hydration heat measurement and Vicat test, by monitoring the setting behavior of the early-age cemented tailings backfill with different cement contents (2.5%, 5% and 7.5%) and different aggregates (silica tailings and iron tailings), the obtained results are as follows:
- According to the early ultrasonic waveform changes, the early hydration process of the CTB samples can be divided into three stages: the liquid propagation stage with low frequency as the dominant frequency, the transitional stage and the solid propagation stage with high frequency as the dominant frequency.
- The active mineral components in tailings (e.g., CaO and MgO) will promote cement hydration and shorten the induction stage.
- For the cemented silica tailings backfill, the initial set time is 396, 475 and 503 min with the cement content of 2.5%, 5% and 7.5%, respectively, while for the cemented iron tailings backfill, the initial set time increases to 602, 710 and 960 min with the cement content of 2.5%, 5% and 7.5%, respectively. The fine iron tailings greatly delay the arrival of the initial set time.
- Based on the changes in the ultrasonic amplitude and EC values, the solid connection and liquid channel closure of the early-age CTB can be obtained, respectively.
- The TG value can effectively reflect the early-age hydration process and determine the initial set time of cemented silica tailings backfill. Meanwhile, for cemented iron mine tailings, further research is needed.
Author Contributions
Conceptualization, W.X.; methodology, W.W.; validation, Y.Z.; formal analysis, W.W; investigation, W.X.; resources, W.W.; data curation, W.W.; writing—original draft preparation, W.W.; writing—review and editing, W.W.; visualization, Y.Z.; supervision, W.X. All authors have read and agreed to the published version of the manuscript.
Funding
This research was funded by the National Key Technologies Research & Development Program (Grant number: 2018YFE0123000 and 2018YFC0808403), YueQi Young Scholar project (800015Z1185) and the Fundamental Research Funds for the Central Universities (2022YJSNY06).
Conflicts of Interest
The authors declare no conflict of interest.
References
- Li, J.; Cao, S.; Yilmaz, E. Compressive fatigue behavior and failure evolution of additive fiber-reinforced cemented tailings composites. Int. J. Miner. Metall. Mater. 2022, 29, 2351. [Google Scholar] [CrossRef]
- Li, J.; Cao, S.; Yilmaz, E. Characterization of Macro Mechanical Properties and Microstructures of Cement-Based Composites Prepared from Fly Ash, Gypsum and Steel Slag. Minerals 2022, 12, 6. [Google Scholar] [CrossRef]
- Rybak, J.; Kongar-Syuryun, C.; Tyulyaeva, Y.; Khayrutdinov, A.M. Creation of Backfill Materials Based on Industrial Waste. Minerals 2021, 11, 739. [Google Scholar] [CrossRef]
- Ylmén, R.; Jäglid, U.; Steenari, B.M.; Panas, I. Early hydration and setting of Portland cement monitored by IR, SEM and Vicat techniques. Cem. Concr. Res. 2009, 39, 433–439. [Google Scholar] [CrossRef]
- Wang, L.G.; Ju, S.Y.; Chu, H.Y.; Liu, Z.Y.; Jiang, J.Y. Hydration process and microstructure evolution of low exothermic concrete produced with urea. Constr. Build. Mater. 2020, 248, 118640. [Google Scholar] [CrossRef]
- Brameshuber, W.; Brockmann, T. Electrical conductivity measurements to characterize the setting and hardening of mortars. J. Nondestruct. Test. 2003, 8, 16–19. [Google Scholar]
- Tamás, F.D.; Farkas, E.; Vörös, M.; Roy, D.M. Low-frequency electrical conductivity of cement, clinker and clinker mineral pastes. Cem. Concr. Res. 1987, 17, 340–348. [Google Scholar] [CrossRef]
- Wei, X.S. Interpretation of Hydration Process of Cement-Based Materials Using Electrical Resistivity Measurement. Ph.D. Thesis, Hong Kong University of Science and Technology, Hong Kong, China, 2004. [Google Scholar]
- Xu, W.B.; Zhang, Y.L.; Zuo, X.H.; Hong, M. Time-dependent rheological and mechanical properties of silica fume modified cemented tailings backfill in low temperature environment. Cem. Concr. Compos. 2020, 114, 103804. [Google Scholar] [CrossRef]
- Sallehi, H.; Ghods, P.; Isgor, O.B. Formation factor of fresh cementitious pastes. Cem. Concr. Compos. 2018, 91, 174–188. [Google Scholar] [CrossRef]
- Carette, J.; Staquet, S. Monitoring the setting process of s by ultrasonic P-wave and S-wave transmission velocity measurement. Constr. Build. Mater. 2015, 94, 196–208. [Google Scholar] [CrossRef]
- Zhang, J.; Weissinger, E.A.; Peethamparan, S.; Scherer, G. Early hydration and setting of oil well cement. Cem. Concr. Res. 2010, 40, 1023–1033. [Google Scholar] [CrossRef]
- Xu, X.; Sun, X.; Yao, W.; Wu, P.; Qiu, J.; Guo, Z.; Liu, N. Strength and ultrasonic characteristics of cemented paste backfill incorporating foaming agent. Minerals 2021, 11, 681. [Google Scholar] [CrossRef]
- Ylmaz, T.; Ercikdi, B. Predicting the uniaxial compressive strength of cemented paste backfill from ultrasonic pulse velocity test. Nondestruct. Test. Eval. 2015, 31, 247–266. [Google Scholar] [CrossRef]
- Lee, H.K.; Lee, K.M.; Kim, Y.H.; Yim, H. Ultrasonic in-situ monitoring of setting process of high-performance concrete. Cem. Concr. Res. 2004, 34, 631–640. [Google Scholar] [CrossRef]
- Tian, X.; Xu, W. Prediction of the mechanical performance of cemented tailings backfill using ultrasonic pulse velocity measurement. Minerals 2022, 12, 986. [Google Scholar] [CrossRef]
- Robeyst, N.; Gruyaert, E.; Belie, N.D. Ultrasonic monitoring of setting and hardening behaviour of concrete and with blast-furnace slag cement. In Proceedings of the 12th International Congress on the Chemistry of Cement (ICCC 2007), Montréal, QC, Canada, 8–13 July 2007. [Google Scholar]
- Yan, B.; Zhu, W.; Hou, C.; Yilmaz, E.; Saadatc, M. Characterization of early age behavior of cemented paste backfill through the magnitude and frequency spectrum of ultrasonic P-wave. Constr. Build. Mater. 2020, 249, 118733. [Google Scholar] [CrossRef]
- Huang, C.; He, W.; Lu, B.; Wang, M. Study on acoustic emission and coda wave characteristics of layered cemented tailings backfill under uniaxial compression. Minerals 2022, 12, 896. [Google Scholar] [CrossRef]
- Robeyst, N.; Christian, U.; Grosse, C.U. Measuring the change in ultrasonic p-wave energy transmitted in fresh with additives to monitor the setting. Cem. Concr. Res. 2009, 39, 868–875. [Google Scholar] [CrossRef]
- Gams, M.; Trtnik, G. A new US procedure to determine setting period of cement pastes, s, and concretes. Cem. Concr. Res. 2013, 53, 9–17. [Google Scholar] [CrossRef]
- Trtnik, G.; Gams, M. The use of frequency spectrum of ultrasonic P-waves to monitor the setting process of cement pastes. Cem. Concr. Res. 2013, 43, 1–11. [Google Scholar] [CrossRef]
- Ghirian, A.; Fall, M. Coupled thermo-hydro-mechanical-chemical behavior of cemented paste backfill in column experiments. Part I: Physical, hydraulic and thermal processes and characteristics. Eng. Geol. 2013, 170, 11–23. [Google Scholar] [CrossRef]
- Koleva, D.; Copuroglu, O.; Breugel, K.; Ye, G.; Dewit, J.H.W. Electrical resistivity and microstructural properties of concrete materials in conditions of current flow. Cem. Concr. Compos. 2008, 30, 731–744. [Google Scholar] [CrossRef]
- Courard, L.; Michel, F.; Perkowicz, S.; Garbacz, A. Effects of limestone fillers on surface free energy and electrical conductivity of the interstitial liquid of cement mixes. Cem. Concr. Compos. 2014, 45, 111–116. [Google Scholar] [CrossRef] [Green Version]
- Duhamel, P.; Vetterli, M. Fast fourier transforms: A tutorial review and a state of the art. Signal Process. 1990, 19, 259–299. [Google Scholar] [CrossRef] [Green Version]
- Nelson, P.V.; Povey, M.; Wang, Y. An ultrasound velocity and attenuation scanner for viewing the temporal evolution of a dispersed phase in fluids. Rev. Sci. Instrum. 2001, 72, 4234–4241. [Google Scholar] [CrossRef]
- Challis, R.; Povey, M.; Mather, M.; Holmes, A. Ultrasound techniques for characterizing colloidal dispersions. Rep. Prog. Phys. 2005, 68, 1541–1550. [Google Scholar] [CrossRef]
- Feylessoufi, A.; Tenoudji, F.C.; Morin, V.; Richard, P. Early ages shrinkage mechanisms of ultra-high-performance cement-based materials. Cem. Concr. Res. 2001, 31, 1573–1579. [Google Scholar] [CrossRef]
- Sayers, C.; Dahlin, A. Propagation of ultrasound through hydrating cement pastes at early times. Adv. Cem. Based Mater. 1993, 1, 12–21. [Google Scholar] [CrossRef]
- Ye, G.; Breugel, K.; Fraaij, A. Experimental study and numerical simulation on the formation of microstructure in cementitious materials at early age. Cem. Concr. Res. 2003, 33, 233–239. [Google Scholar] [CrossRef]
- Paglia, C.; Wombacher, F.; Bhni, H. The influence of alkali-free and alkaline shotcrete accelerators within cement systems: I. Characterization of the setting behavior. Cem. Concr. Res. 2001, 31, 913–918. [Google Scholar] [CrossRef]
- Punurai, W.; Jarzynski, J.; Qu, J.; Kim, J.E. Characterization of multi-scale porosity in cement paste by advanced ultrasonic techniques. Cem. Concr. Res. 2007, 37, 38–46. [Google Scholar] [CrossRef]
- Jupe, A.; Wilkinson, A.; Funkhouser, G. Simultaneous study of mechanical property development and early hydration chemistry in Portland cement slurries using X-ray diffraction and ultrasound reflection. Cem. Concr. Res. 2012, 42, 1166–1173. [Google Scholar] [CrossRef]
- Schutter, G.D.; Taerwe, L. General hydration model for Portland cement and blast furnace slag cement. Cem. Concr. Res. 1995, 25, 593–604. [Google Scholar] [CrossRef]
Figure 1.
Particle size distribution of the silica tailings and iron mine tailings.

Figure 2.
Experimental test procedures of CTB samples.
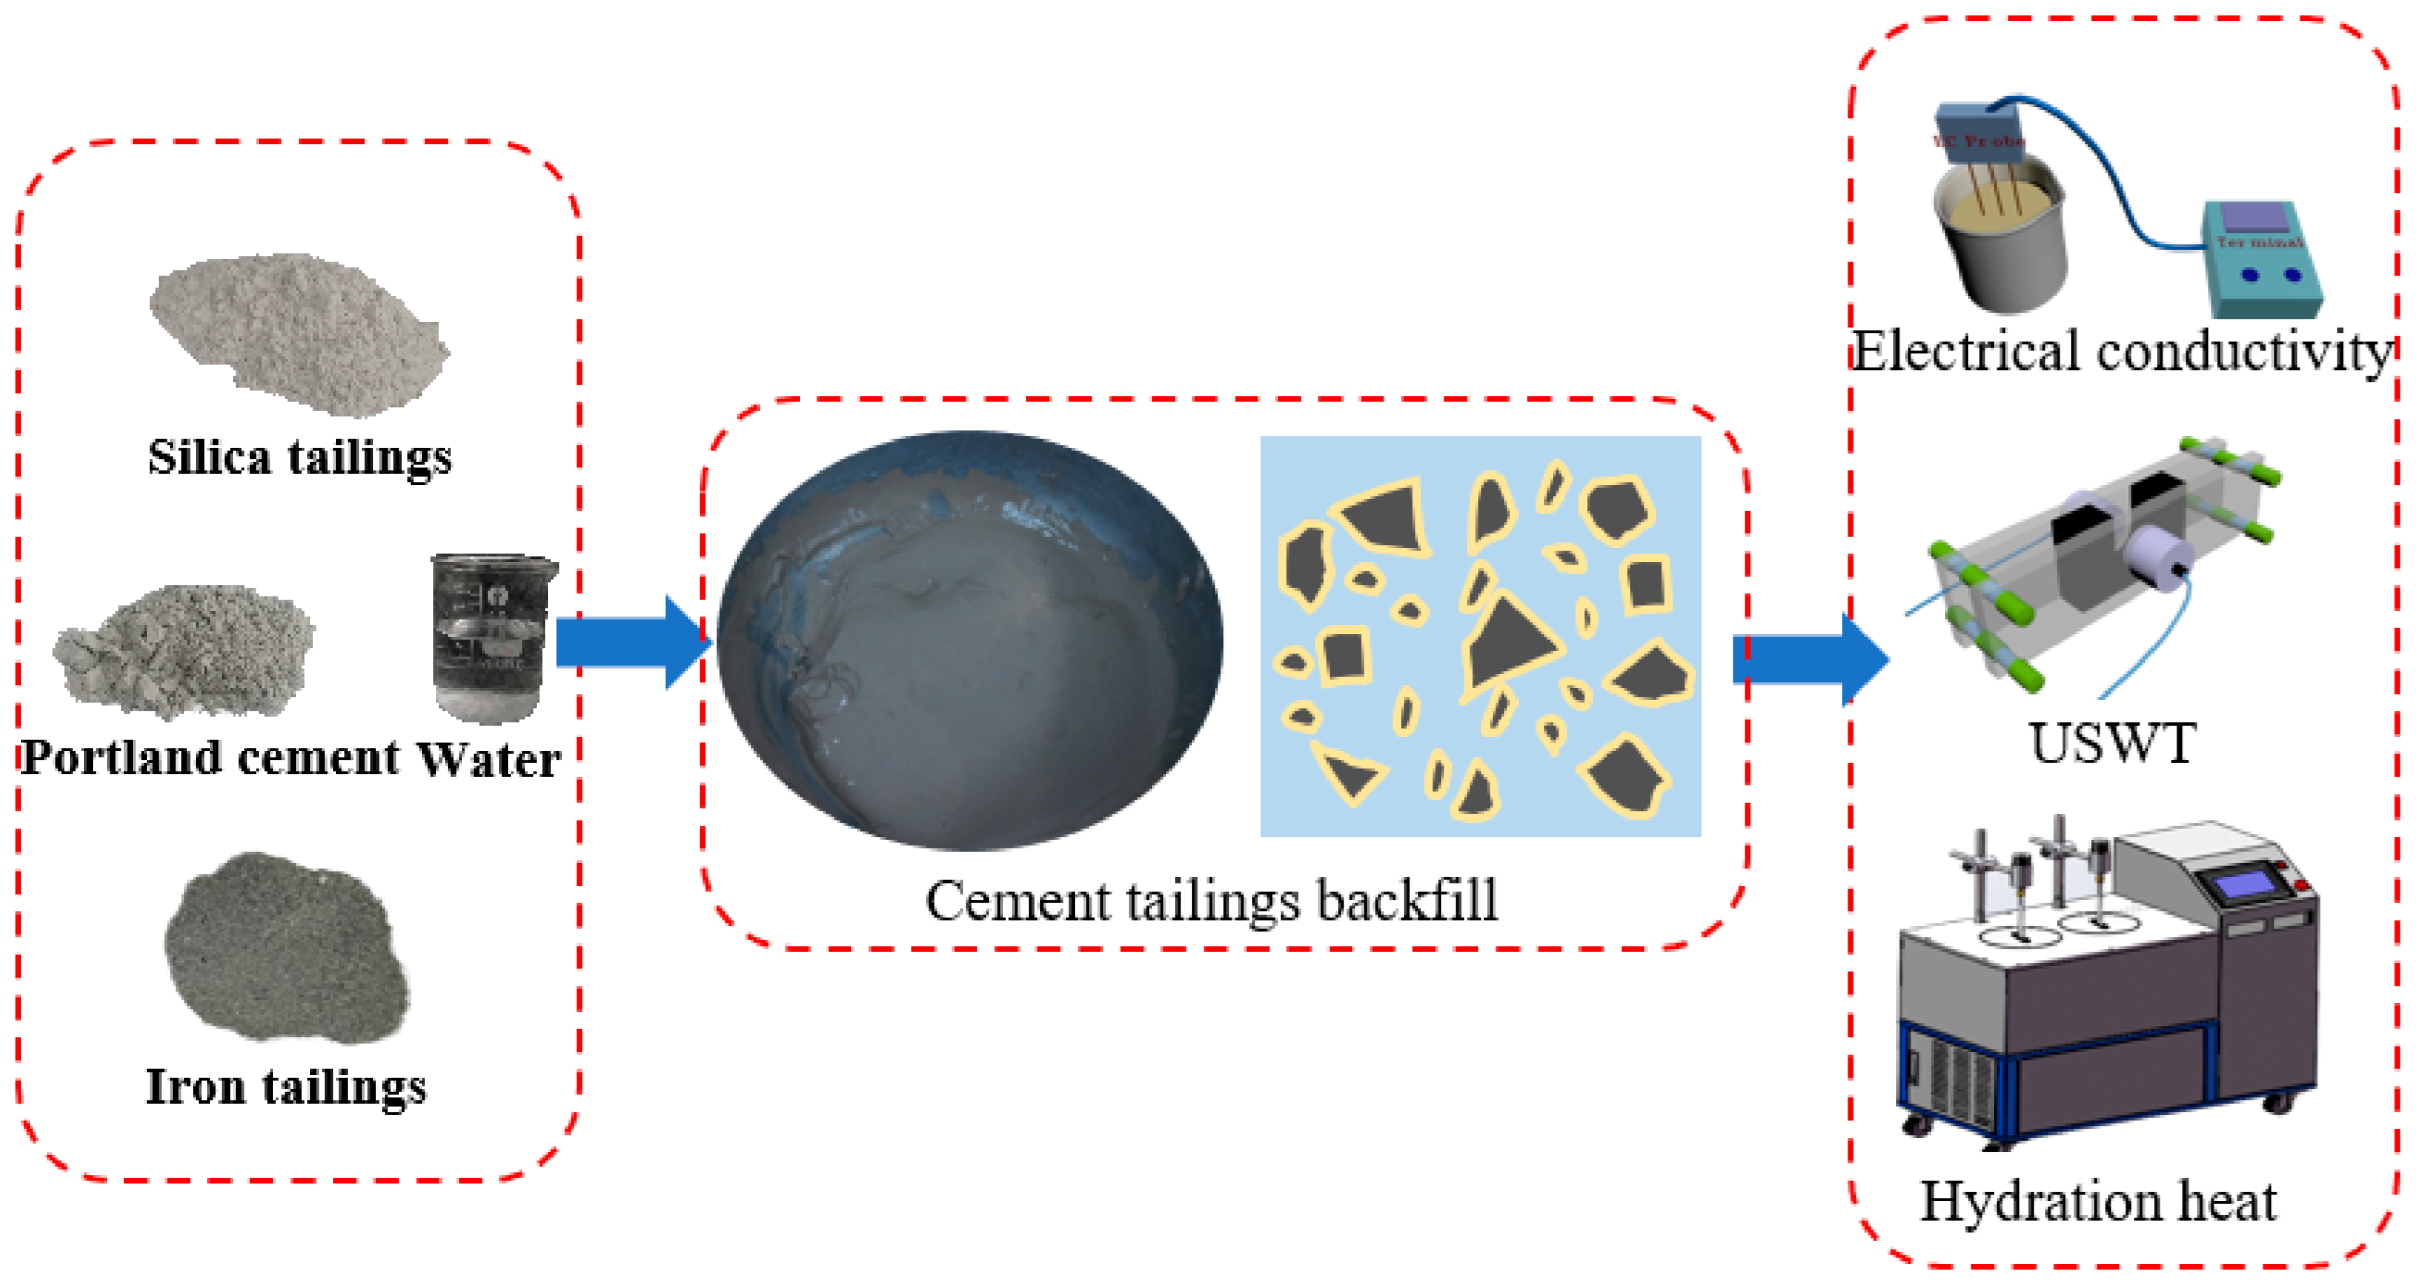
Figure 3.
Typical evolution of the frequency spectrum over time. (a) Received signals; (b) frequency domain extracted via FFT; (c) silica tailings backfill with 5% cement; (d) iron tailings backfill with 5% cement.
Figure 3.
Typical evolution of the frequency spectrum over time. (a) Received signals; (b) frequency domain extracted via FFT; (c) silica tailings backfill with 5% cement; (d) iron tailings backfill with 5% cement.
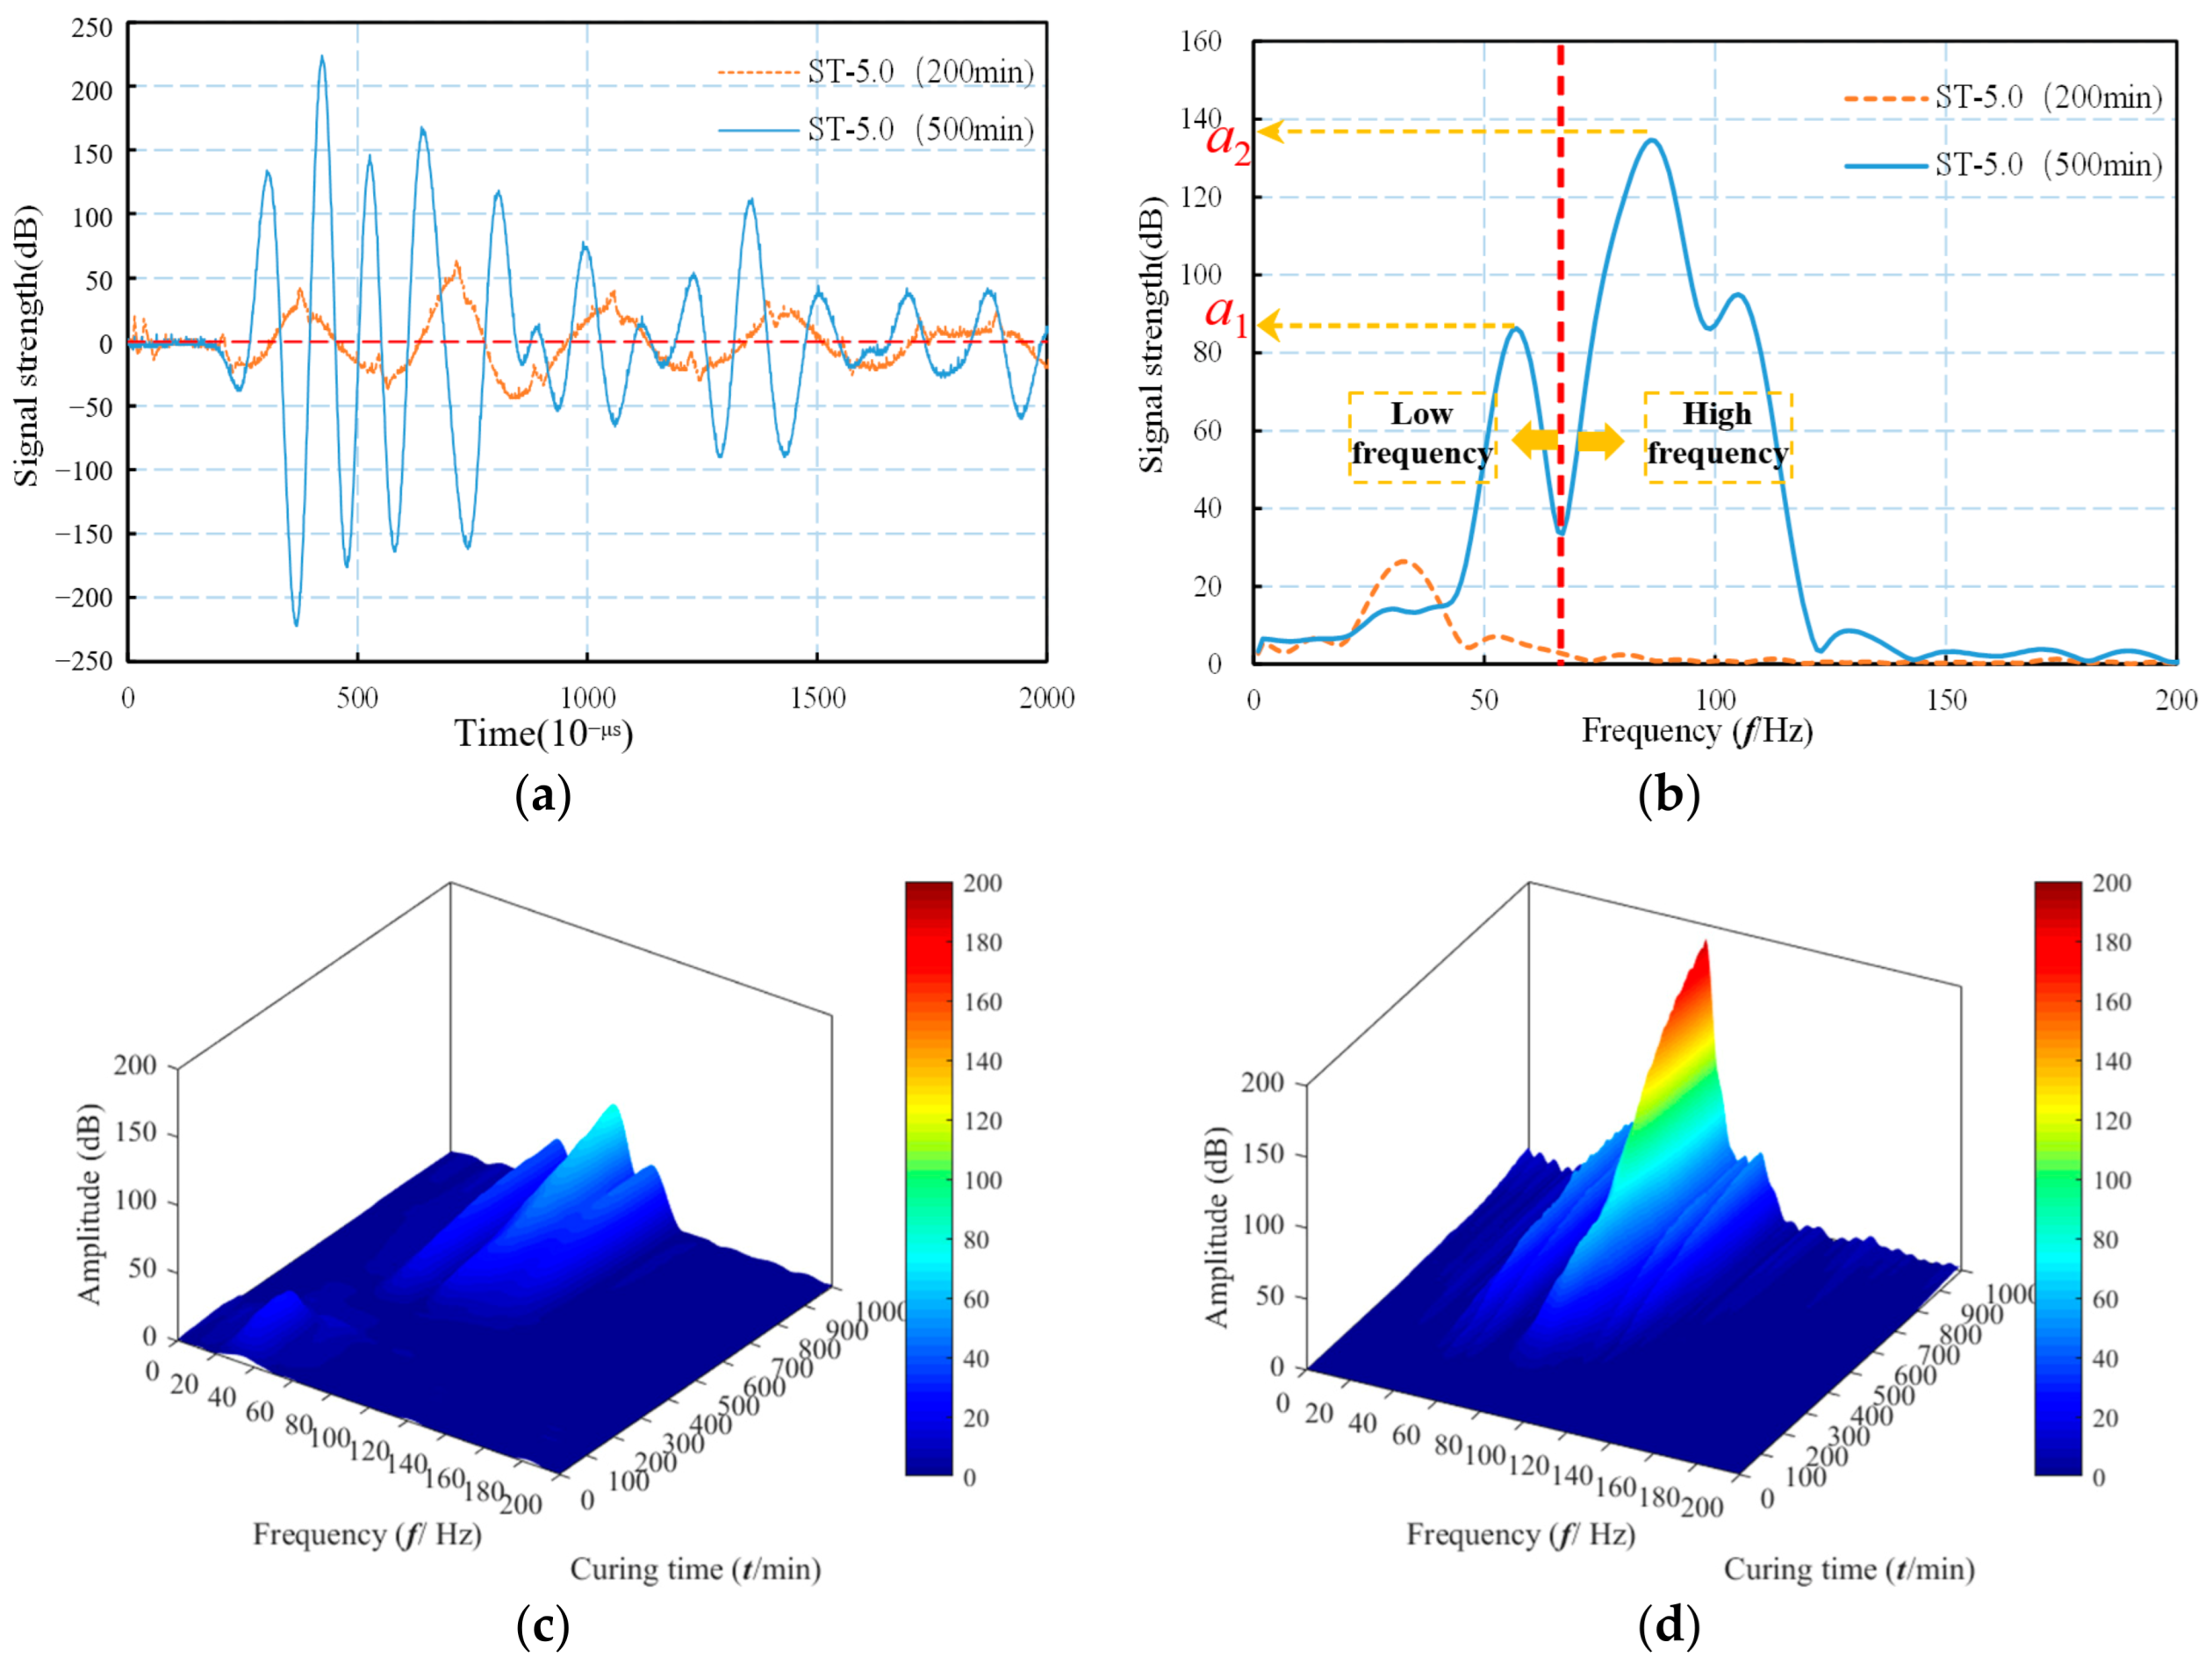
Figure 4.
Frequency distribution of cemented silica tailings backfill with different cement content. (a) ST-7.5% cement; (b) ST-5.0% cement; (c) ST-2.5% cement.
Figure 4.
Frequency distribution of cemented silica tailings backfill with different cement content. (a) ST-7.5% cement; (b) ST-5.0% cement; (c) ST-2.5% cement.
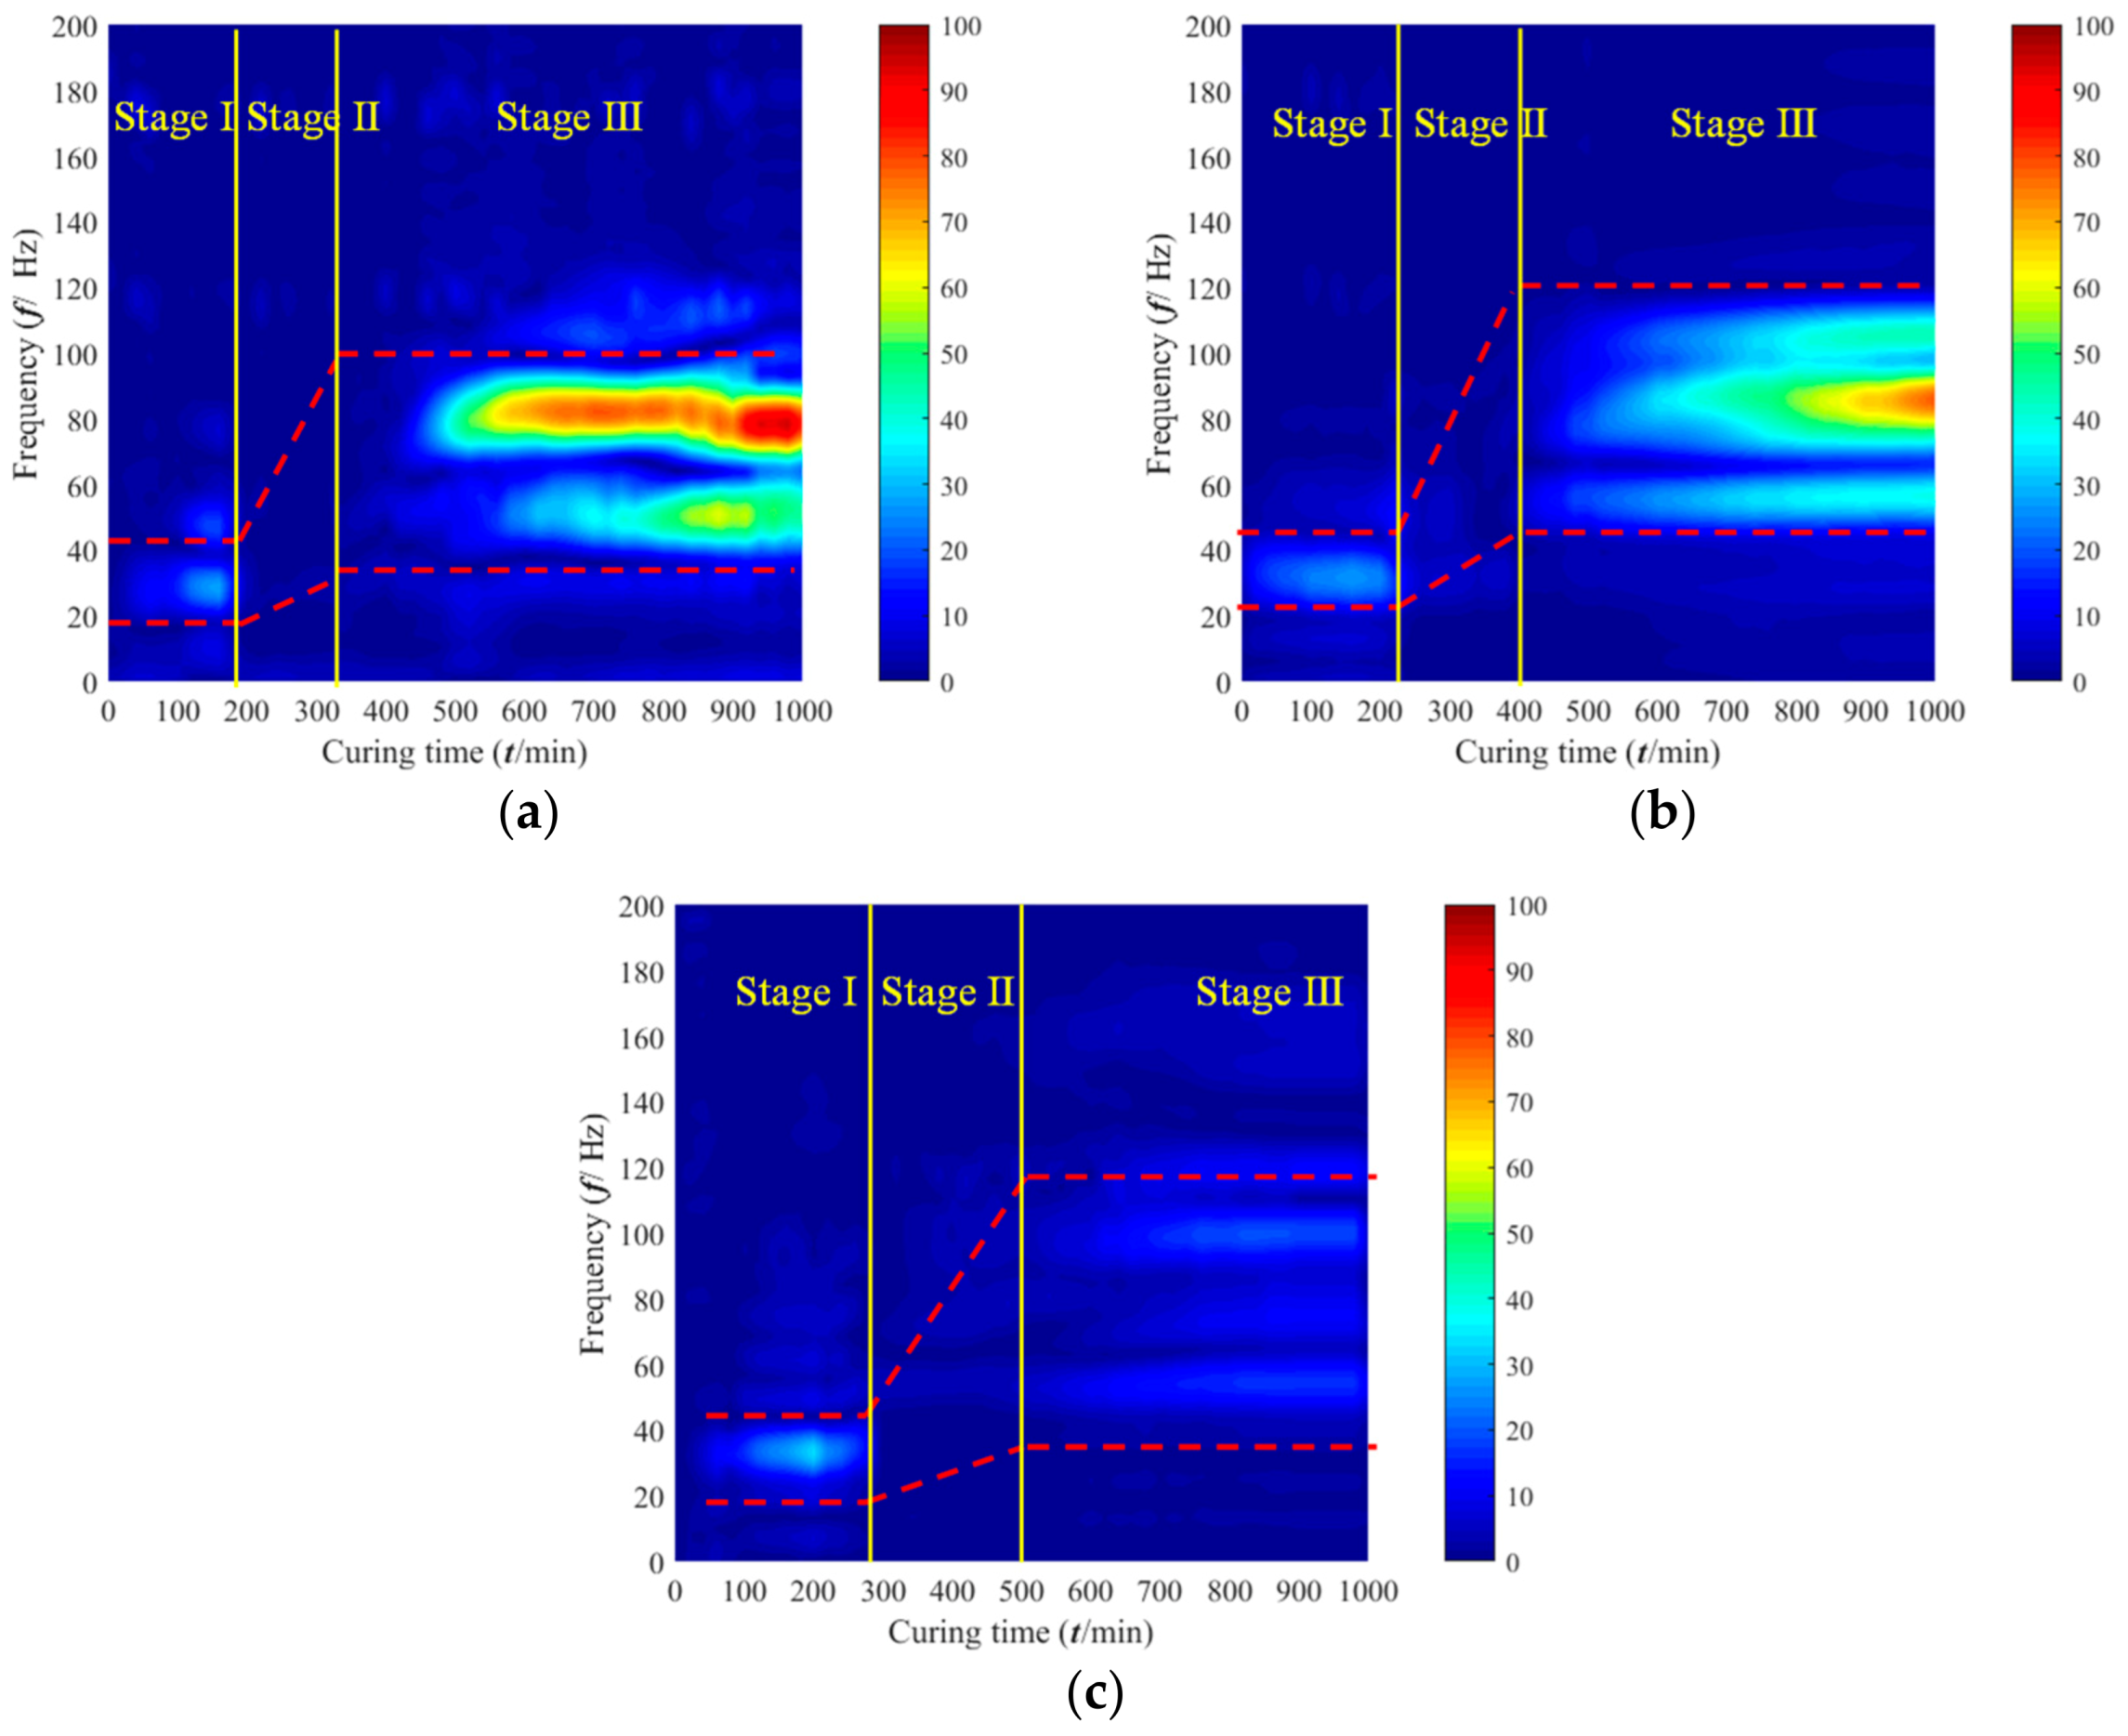
Figure 5.
Frequency distribution of cemented iron tailings backfill with different cement content. (a) FT-7.5% cement; (b) FT-5.0% cement; (c) FT-2.5% cement.
Figure 5.
Frequency distribution of cemented iron tailings backfill with different cement content. (a) FT-7.5% cement; (b) FT-5.0% cement; (c) FT-2.5% cement.
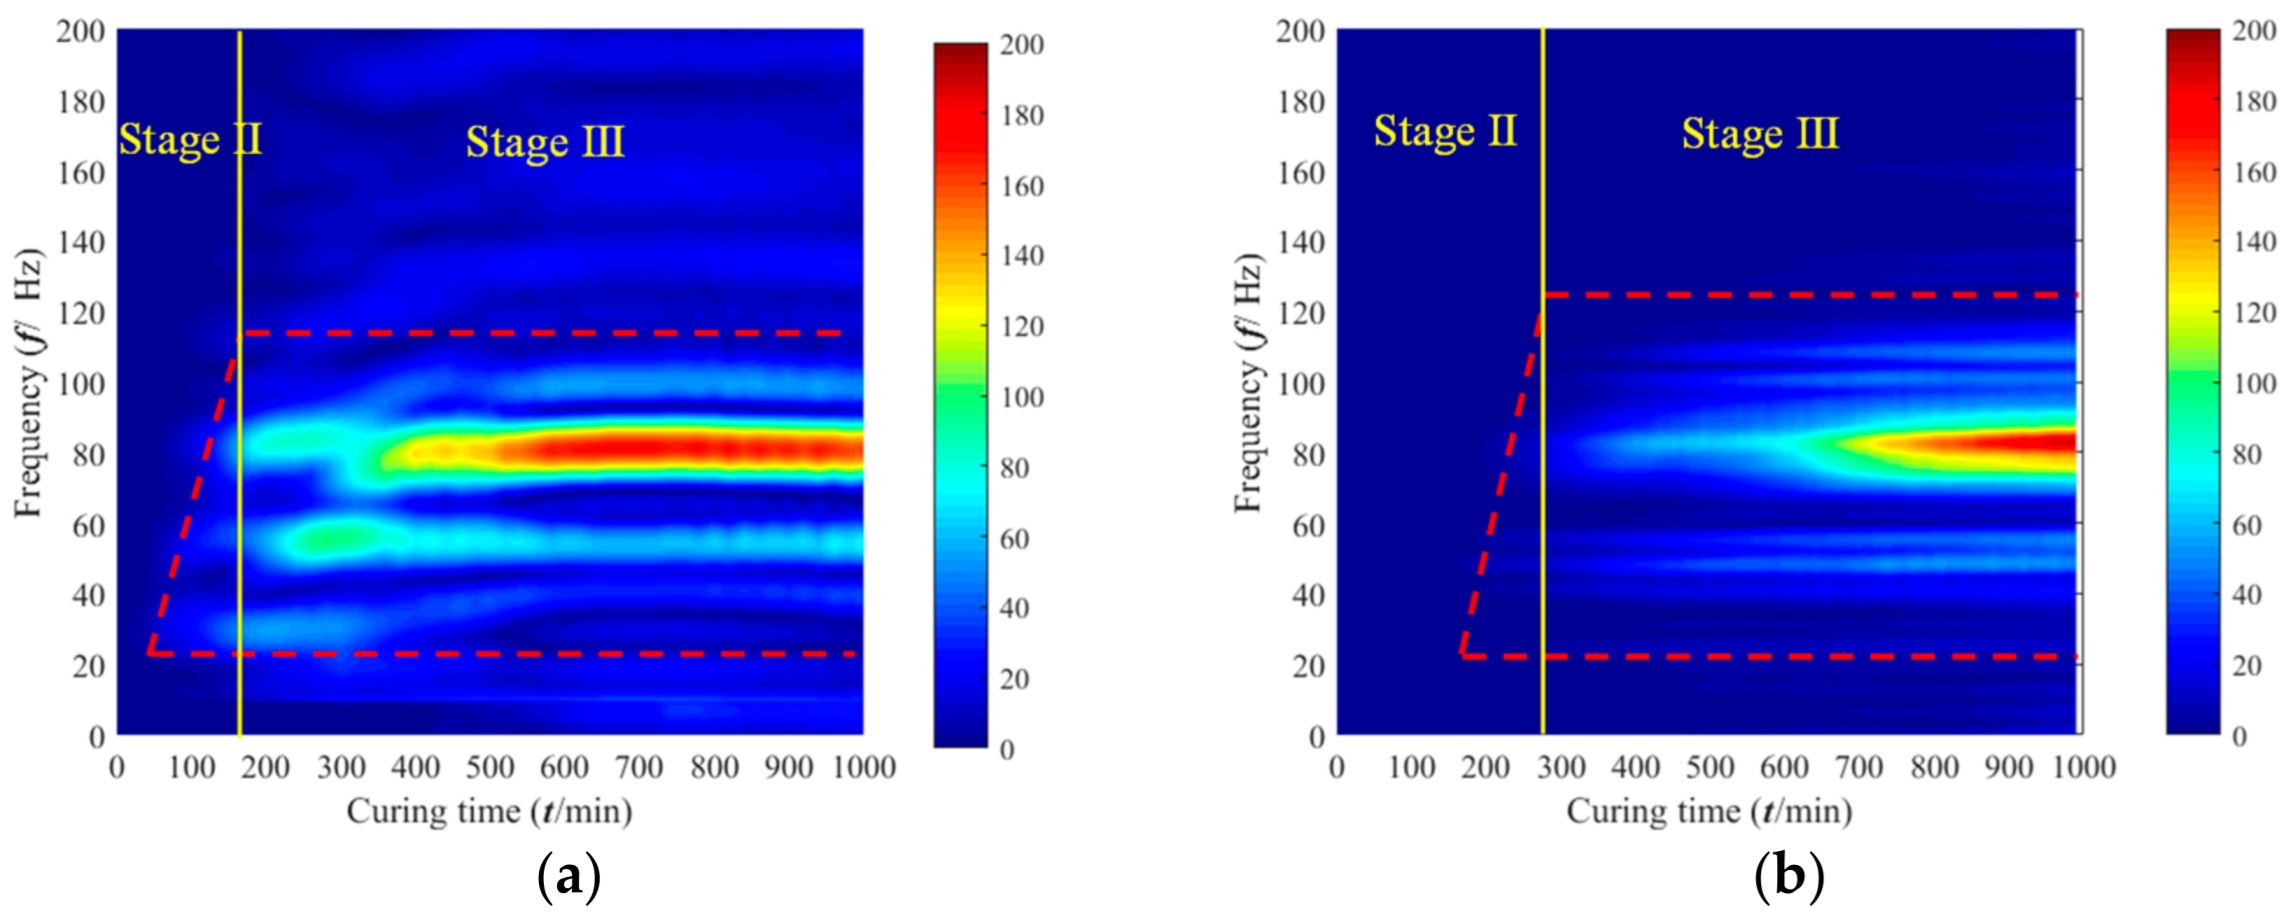
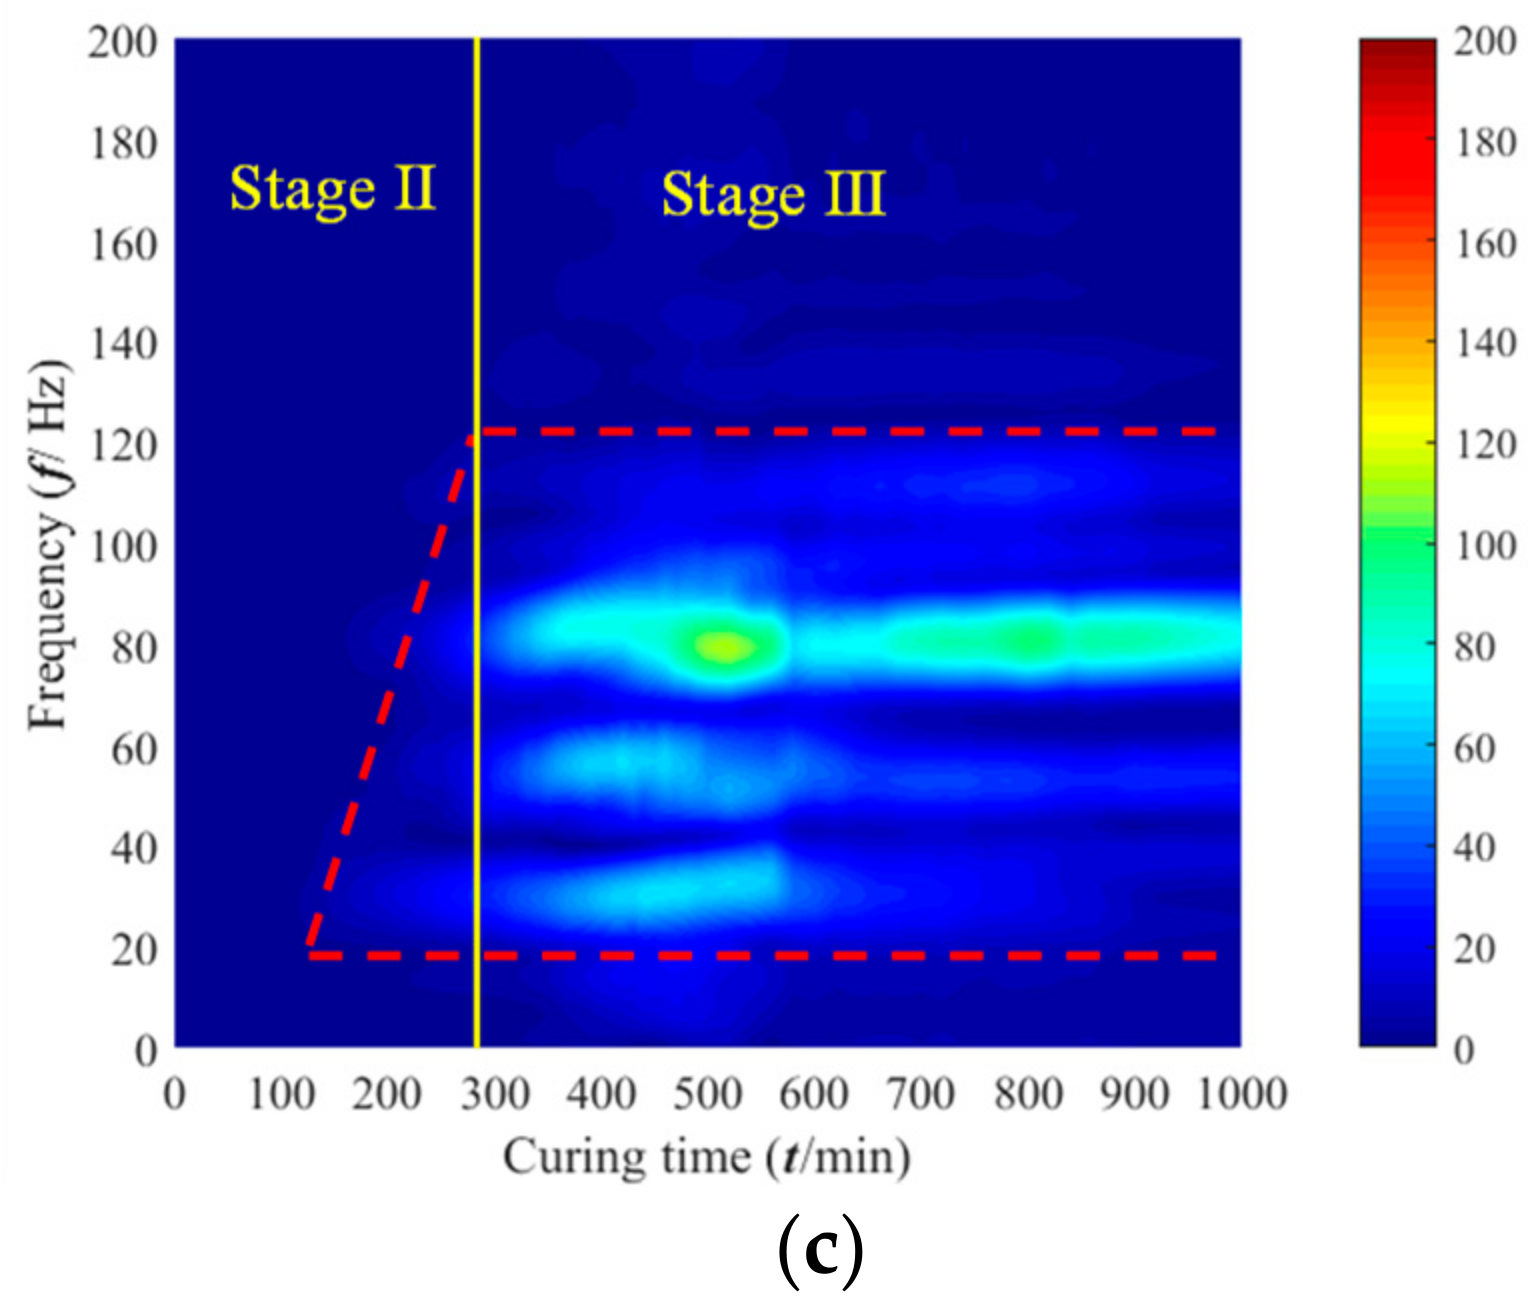
Figure 6.
Relationship between EC and the amplitude of cemented silica tailings backfill with different cement content. (a) ST-7.5% cement; (b) ST-5.0% cement; (c) ST-2.5% cement.
Figure 6.
Relationship between EC and the amplitude of cemented silica tailings backfill with different cement content. (a) ST-7.5% cement; (b) ST-5.0% cement; (c) ST-2.5% cement.
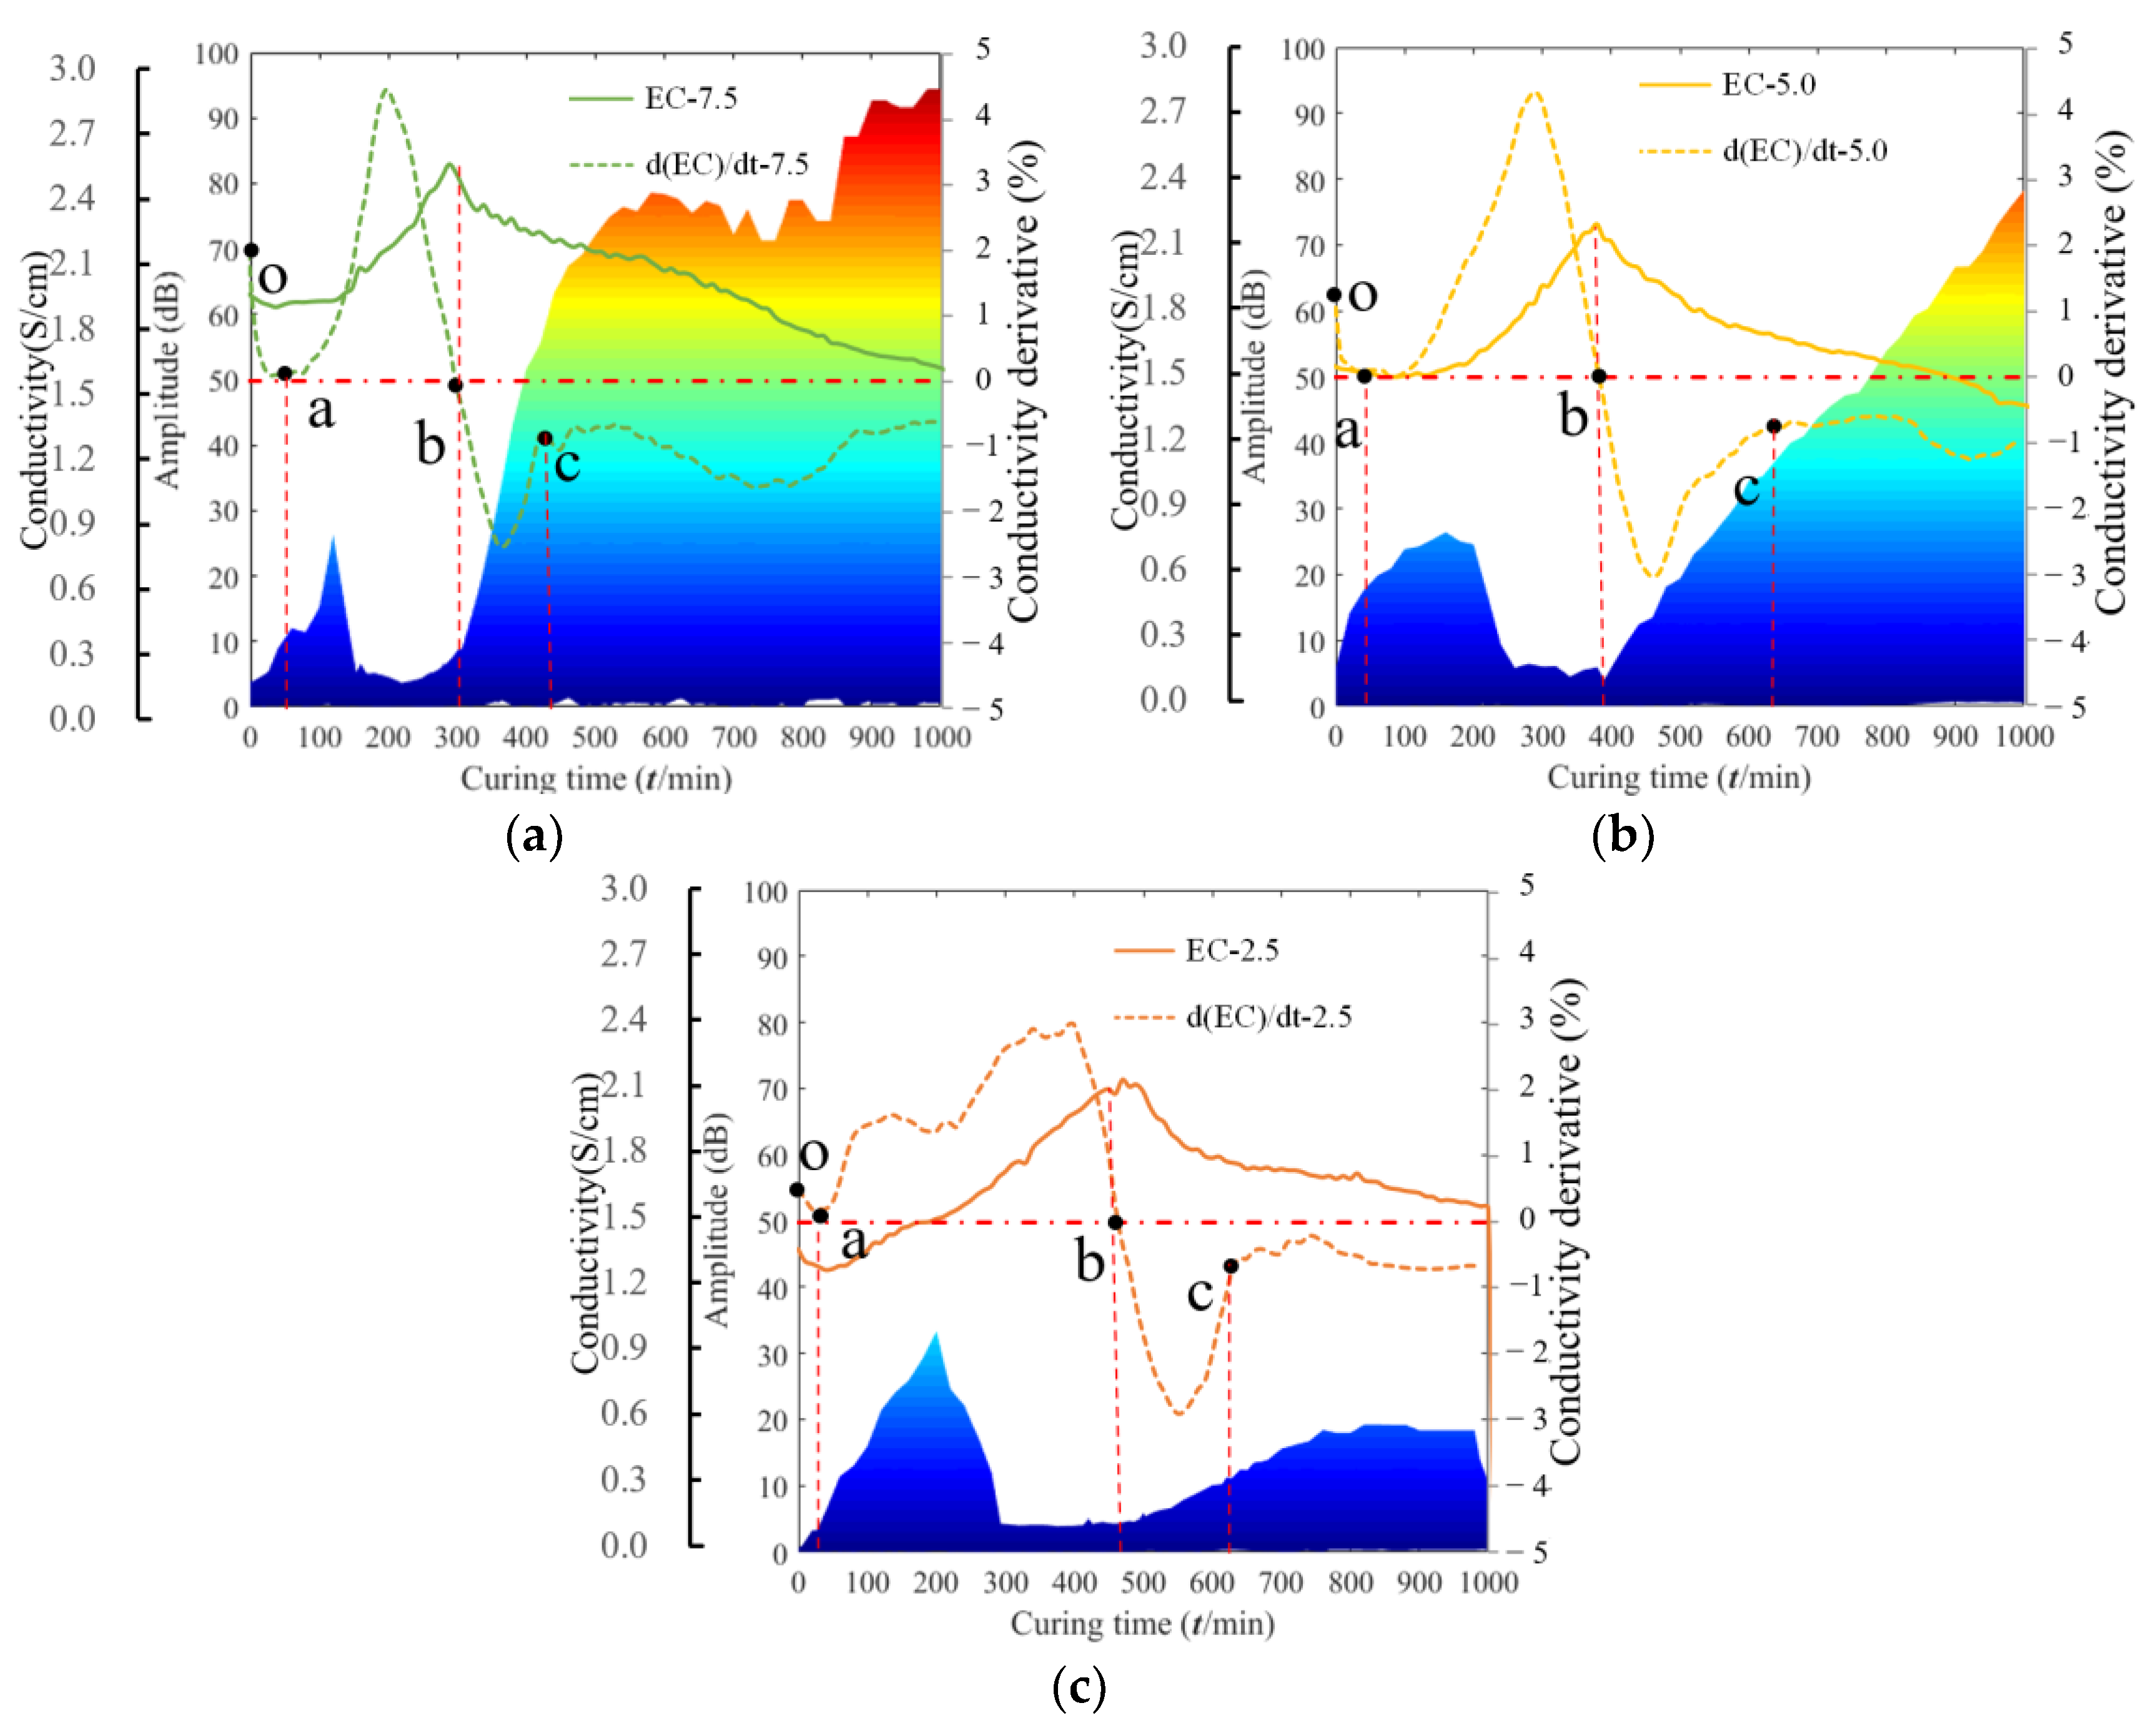
Figure 7.
Relationship between EC and the amplitude of cemented iron tailings backfill with different cement content. (a) FT-7.5% cement; (b) FT-5.0% cement; (c) FT-2.5% cement.
Figure 7.
Relationship between EC and the amplitude of cemented iron tailings backfill with different cement content. (a) FT-7.5% cement; (b) FT-5.0% cement; (c) FT-2.5% cement.
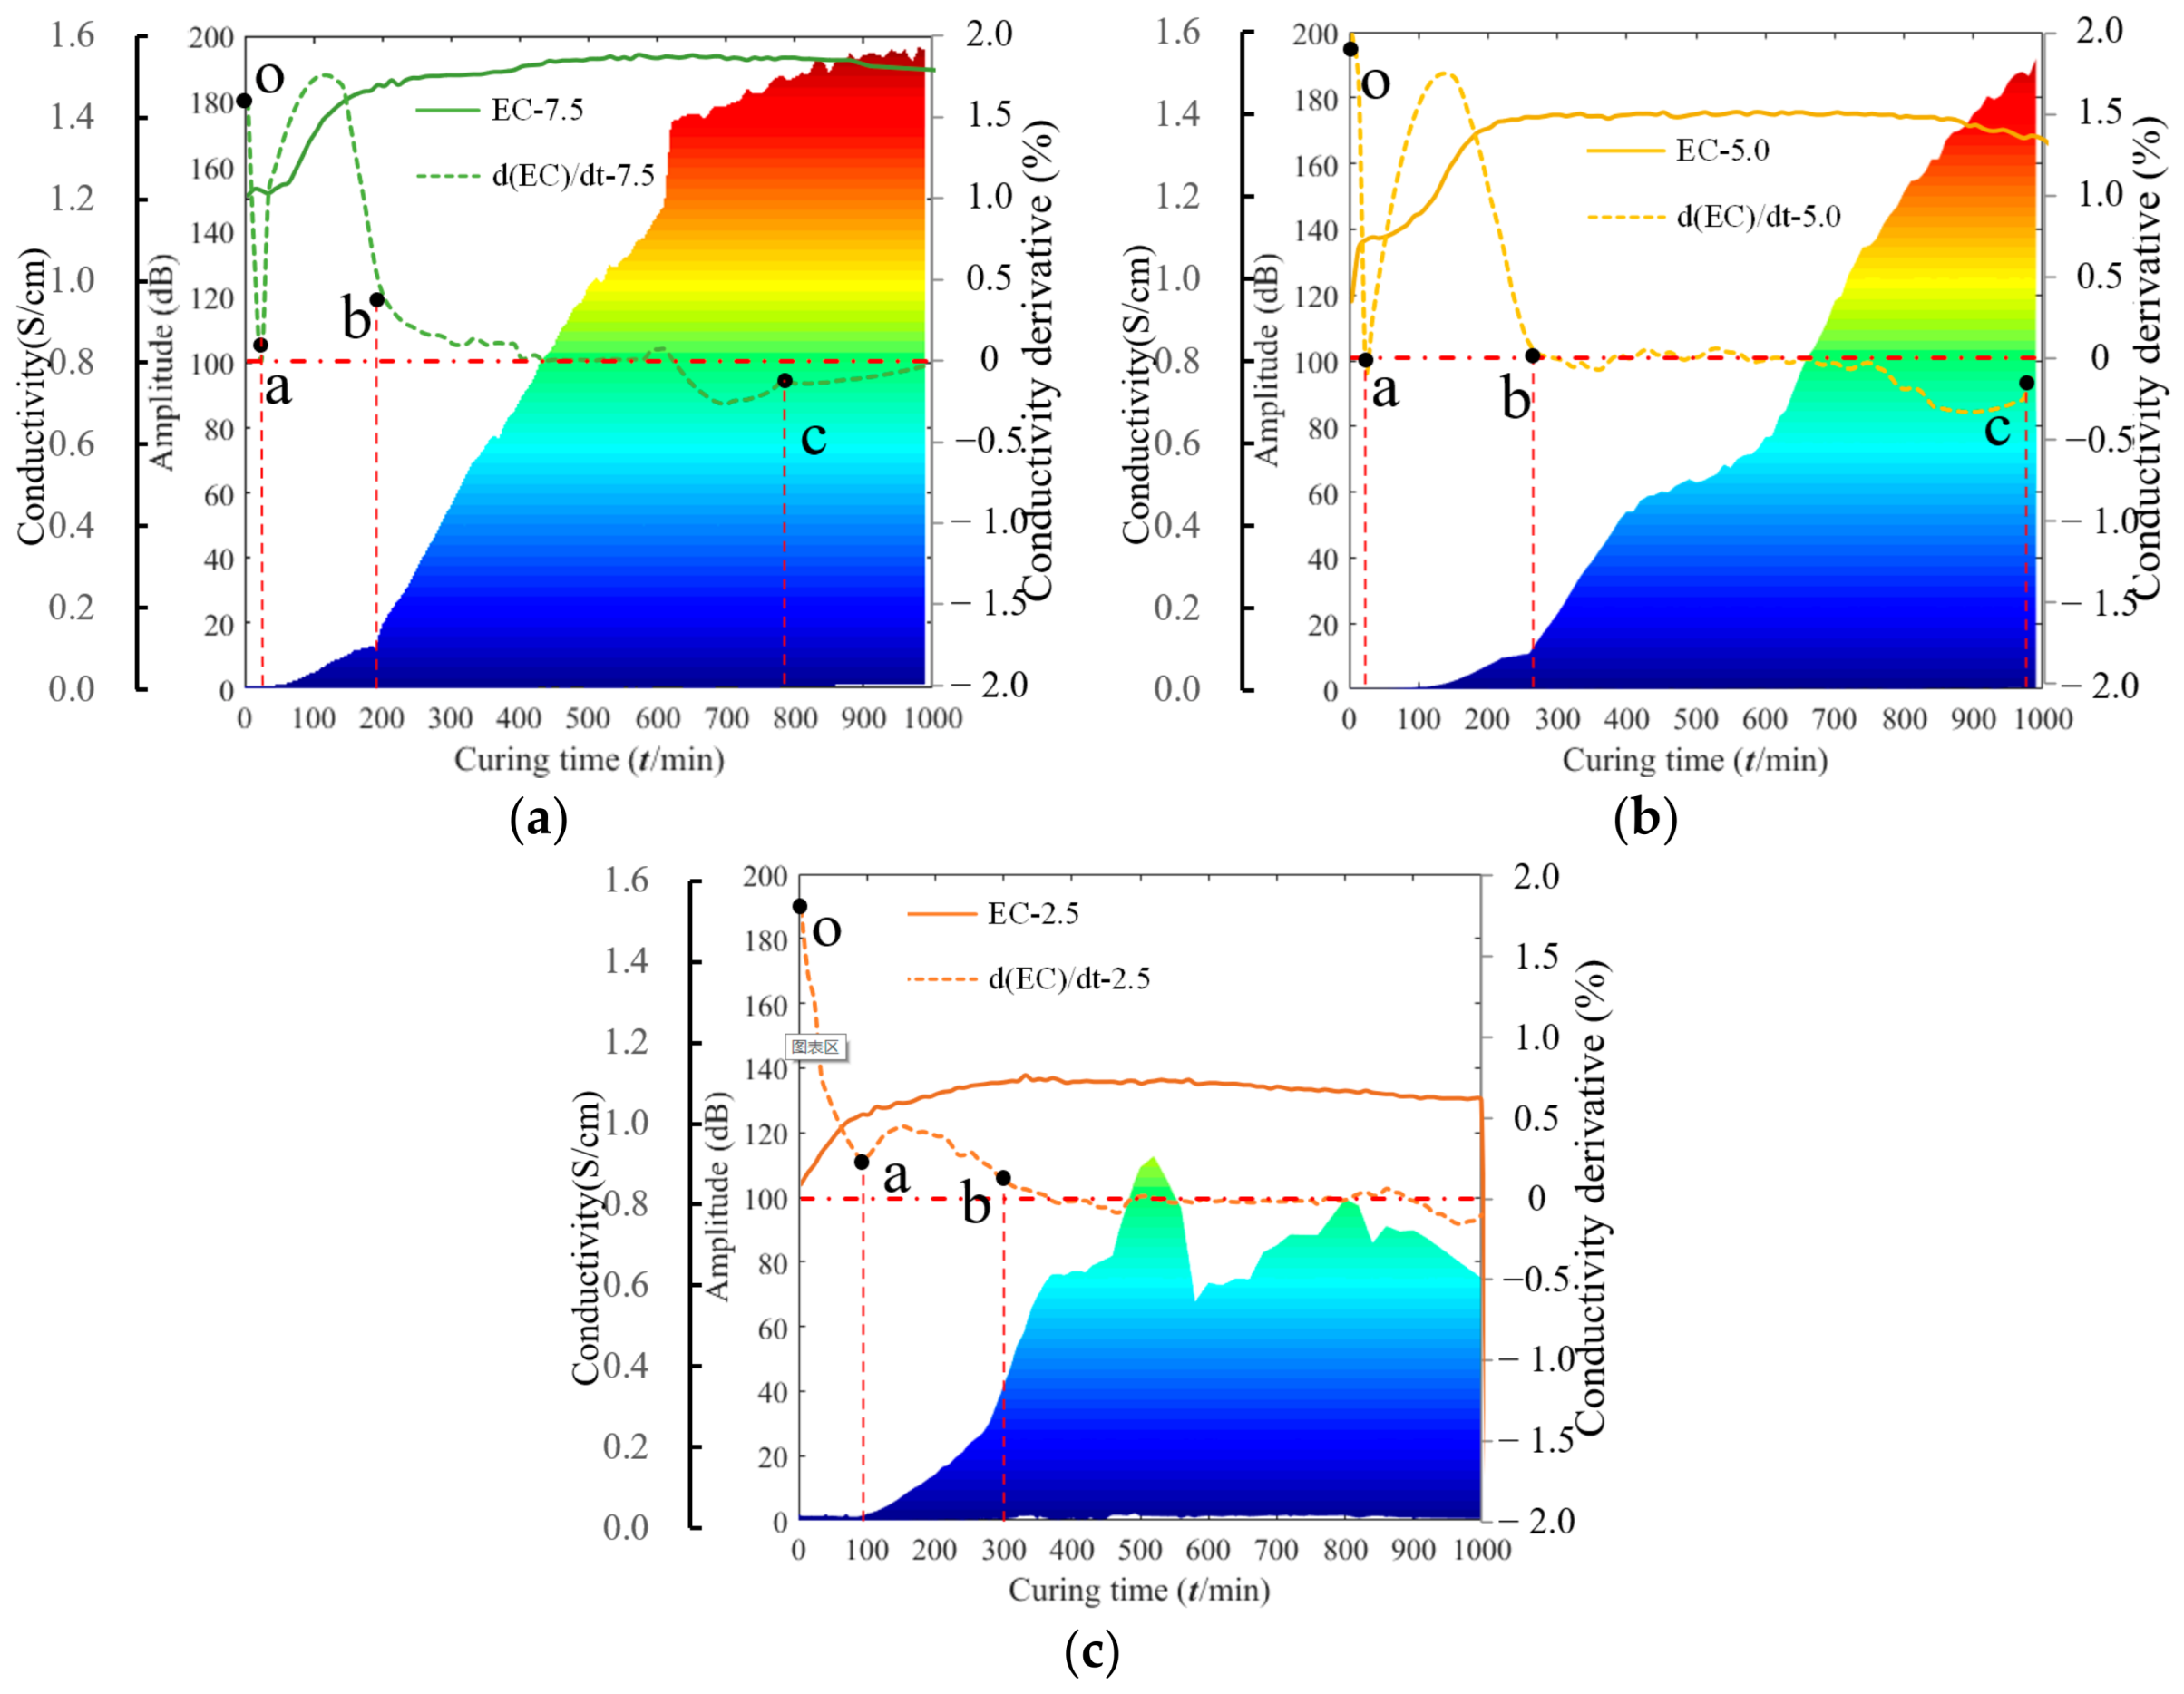
Figure 8.
Evolution of (a) temperature, (b) cumulative heat production, (c) heat production rate curves and (d) initial set time of cemented silica tailings backfill and cemented iron tailings backfill with different cement contents.
Figure 8.
Evolution of (a) temperature, (b) cumulative heat production, (c) heat production rate curves and (d) initial set time of cemented silica tailings backfill and cemented iron tailings backfill with different cement contents.

Figure 9.
Relationship between TG and hydration heat production rate of cemented silica tailings backfill with different cement content. (a) ST-7.5% cement; (b) ST-5.0% cement; (c) ST-2.5% cement.
Figure 9.
Relationship between TG and hydration heat production rate of cemented silica tailings backfill with different cement content. (a) ST-7.5% cement; (b) ST-5.0% cement; (c) ST-2.5% cement.
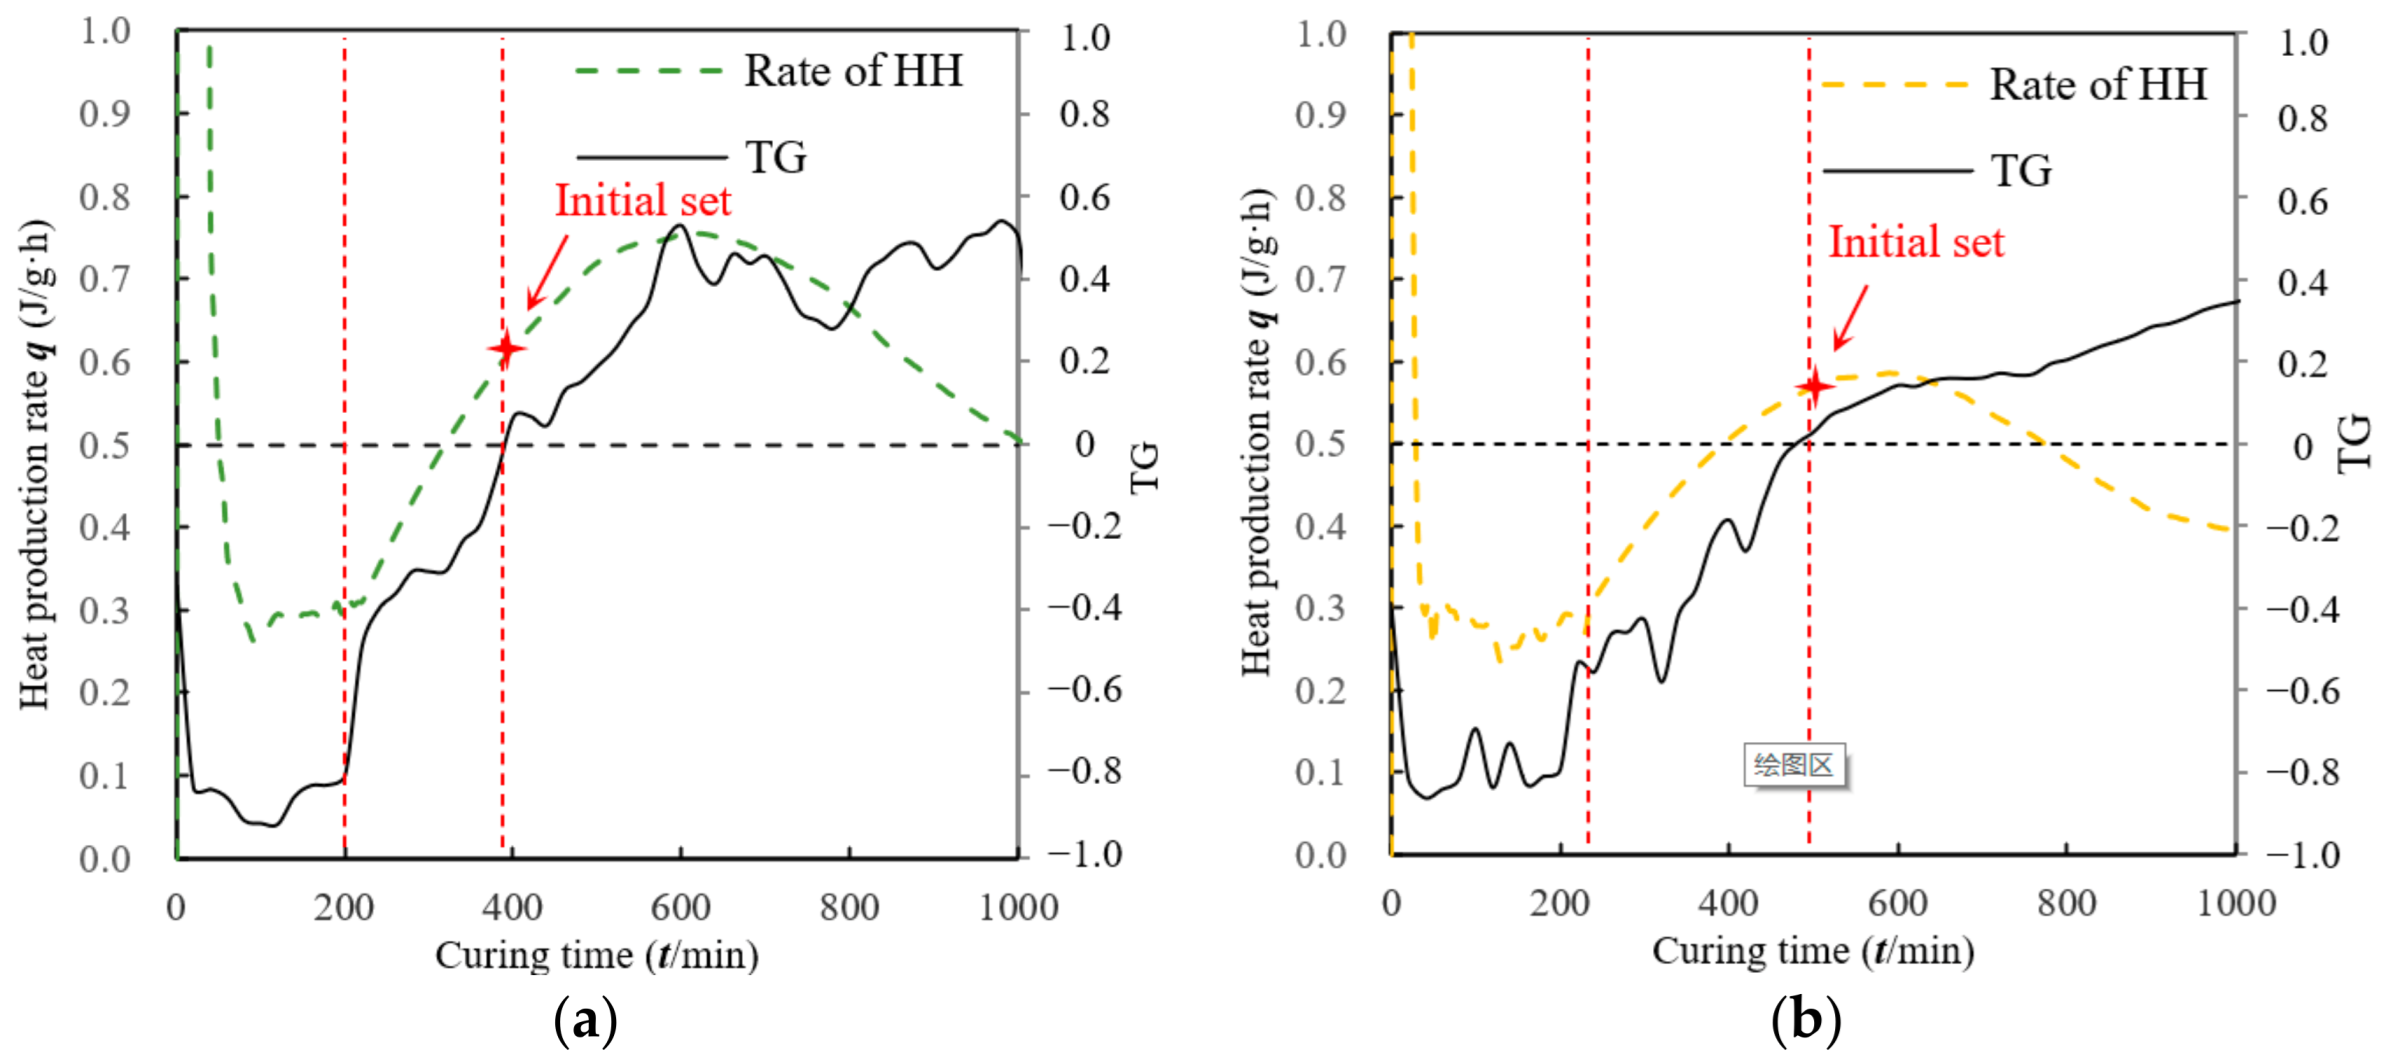

Figure 10.
Relationship between TG and hydration heat production rate of cemented iron tailings backfill with different cement contents. (a) FT-7.5% cement (b) FT-5.0% cement; (c) FT-2.5% cement.
Figure 10.
Relationship between TG and hydration heat production rate of cemented iron tailings backfill with different cement contents. (a) FT-7.5% cement (b) FT-5.0% cement; (c) FT-2.5% cement.
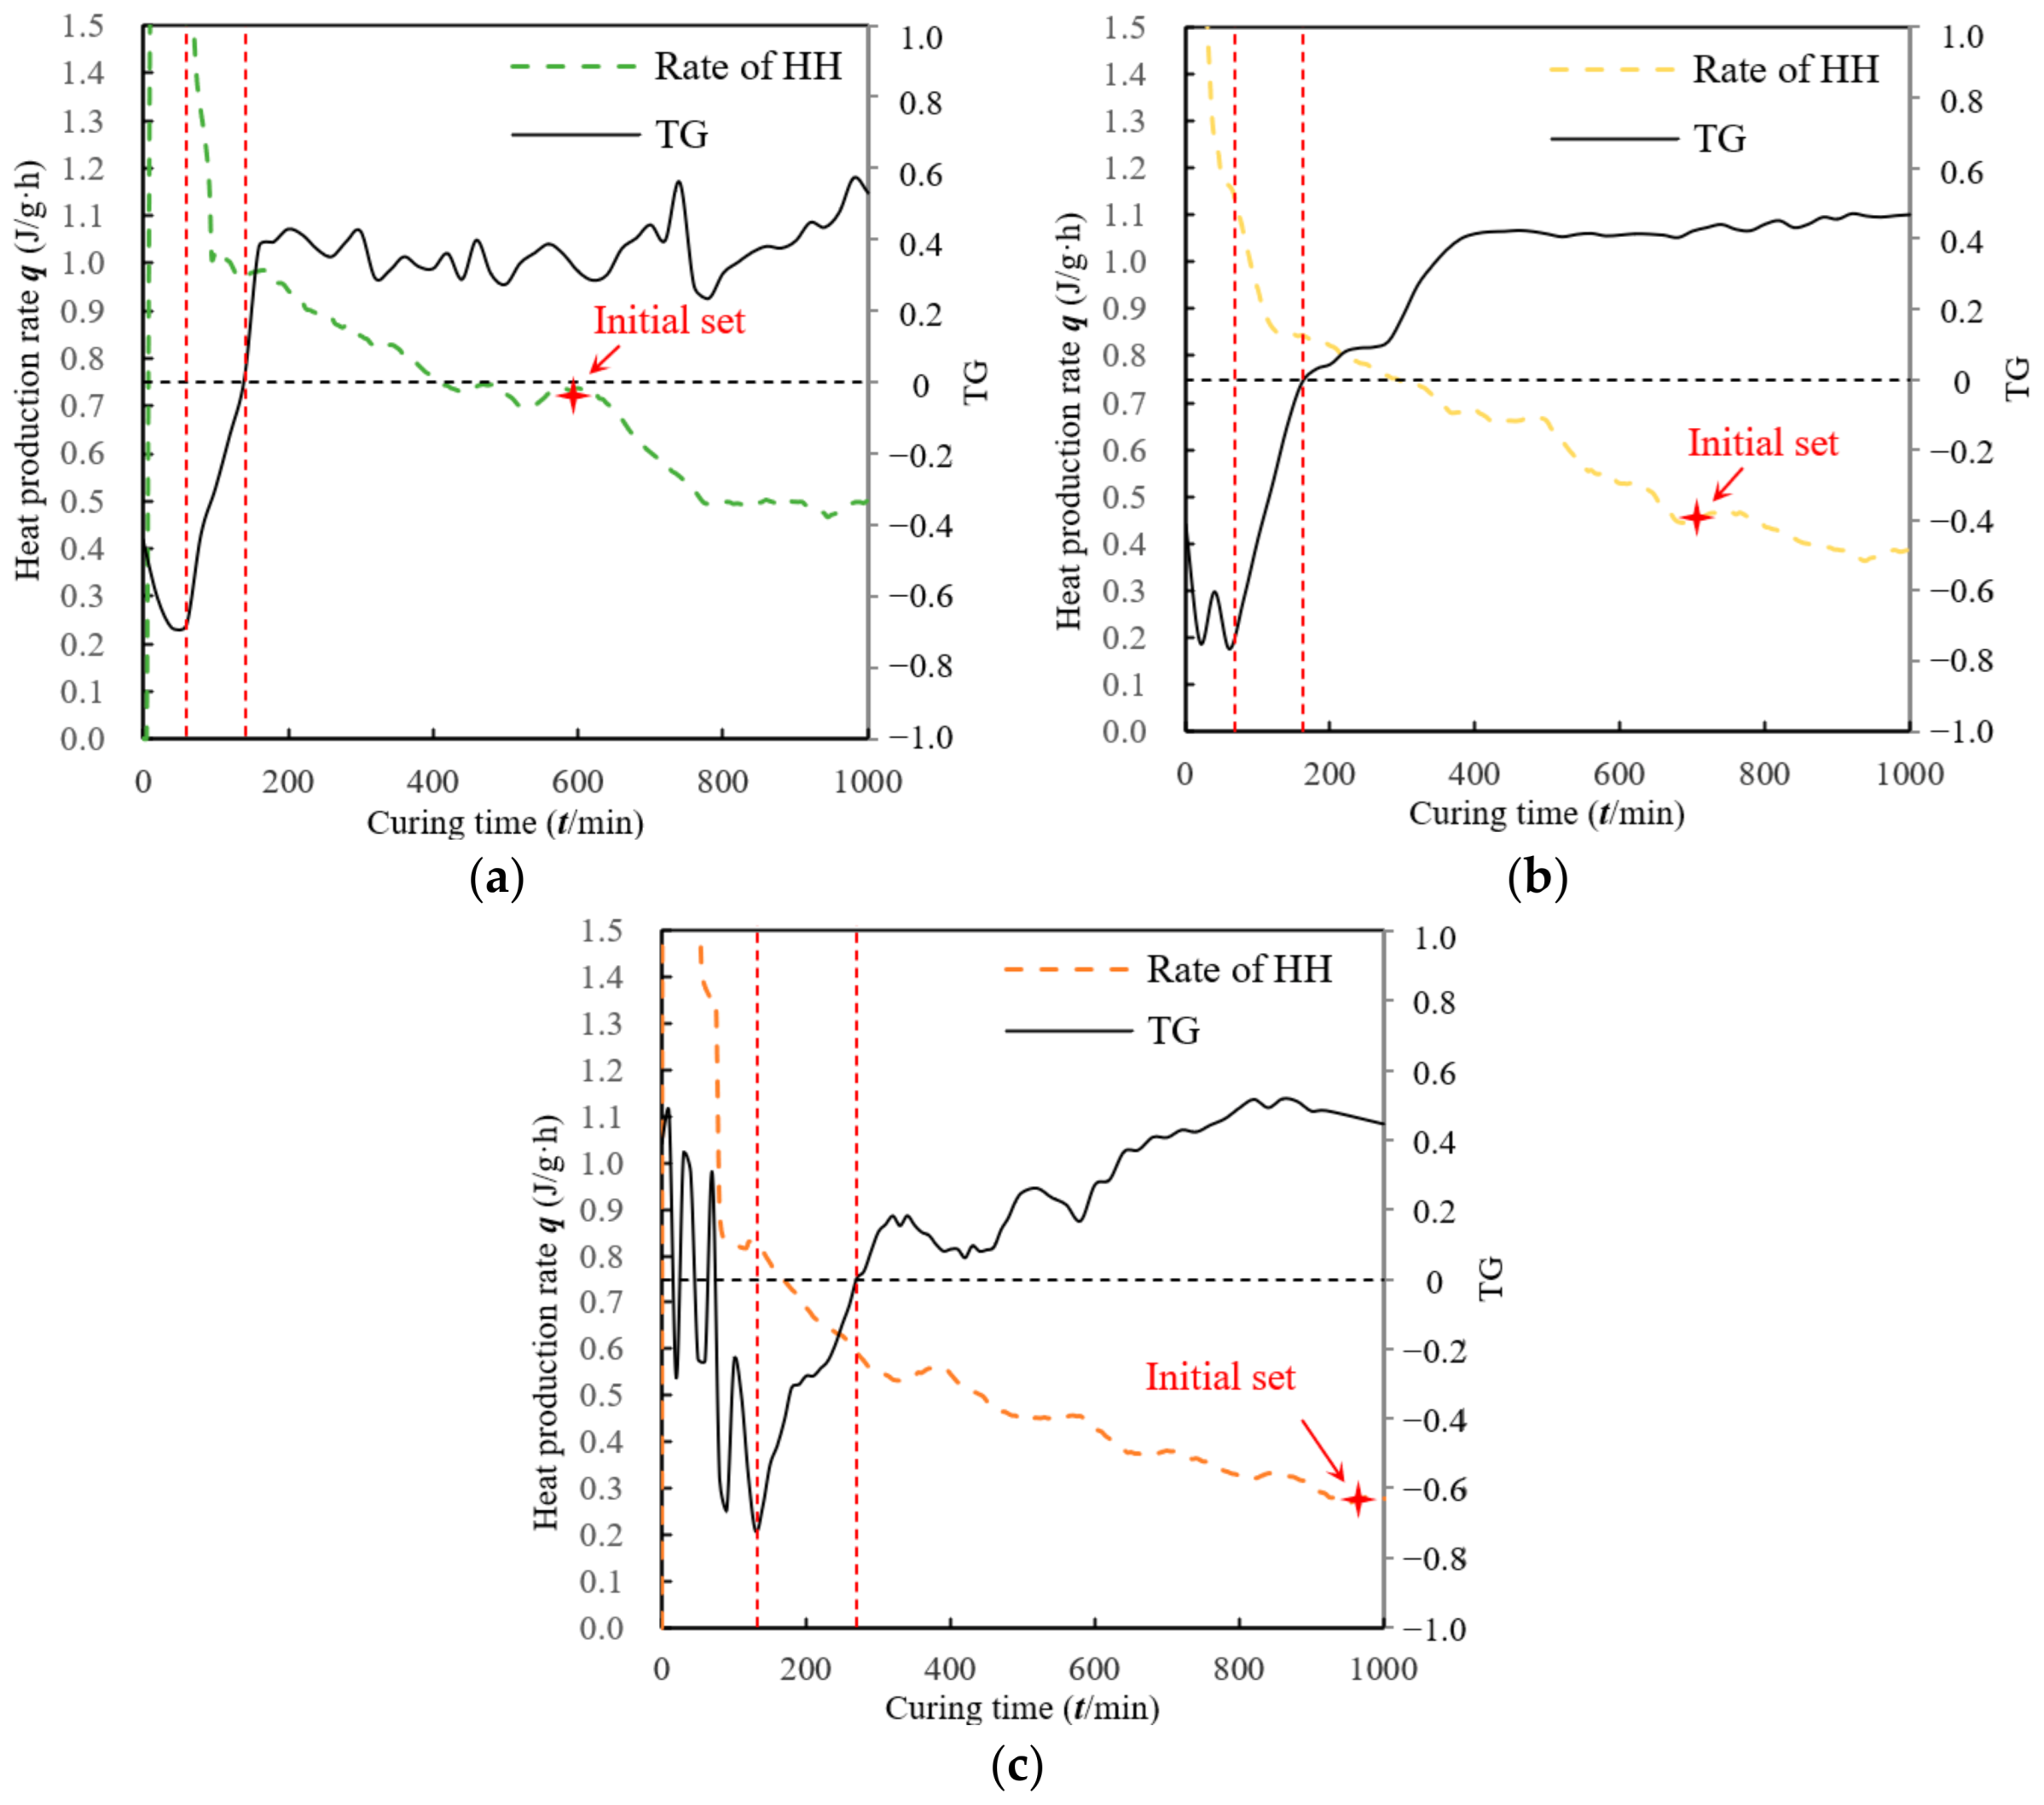
Figure 11.
Relationship between TG and Vp of cemented silica tailings backfill and cemented silica tailings backfill with different cement contents. (a) ST-7.5% cement; (b) ST-5.0% cement; (c) ST-2.5% cement.
Figure 11.
Relationship between TG and Vp of cemented silica tailings backfill and cemented silica tailings backfill with different cement contents. (a) ST-7.5% cement; (b) ST-5.0% cement; (c) ST-2.5% cement.

Figure 12.
Relationship between TG and Vp of cemented iron tailings backfill with different cement contents. (a) FT-7.5% cement; (b) FT-5.0% cement; (c) FT-2.5% cement.
Figure 12.
Relationship between TG and Vp of cemented iron tailings backfill with different cement contents. (a) FT-7.5% cement; (b) FT-5.0% cement; (c) FT-2.5% cement.

Figure 13.
Setting processing characteristic of cemented tailings backfill.


Table 1.
Mineralogical components of the tailings and cement.
| Component | SiO2 | MgO | Fe2O3 | Al2O3 | CaO | P205 | K2O | SO3 | Others |
|---|---|---|---|---|---|---|---|---|---|
| Silica tailings (%) | 99.60 | 0 | 0 | 0 | 0 | 0 | 0 | 0 | 0.40 |
| Iron tailings (%) | 41.25 | 15.00 | 12.60 | 12.03 | 10.02 | 3.18 | 3.11 | 0.82 | 1.99 |
| Cement (%) | 20.34 | 1.09 | 3.11 | 5.02 | 64.78 | 0 | 0.10 | 2.20 | 3.36 |
Table 2.
Detailed mix proportions of CTB samples.
| Aggregate | Cement Content (wt. %) | Solid Content (wt. %) | Water-to-Cement Ratio | Sampling Interval |
|---|---|---|---|---|
| ST, FT | 2.5, 5, 7.5 | 70 | 17, 9, 6 | 10 min |
Table 3.
The stage deadlines of CTB obtained via the multi-physical test in the setting process (minute).
Table 3.
The stage deadlines of CTB obtained via the multi-physical test in the setting process (minute).
| Aggregate | Cement (%) | Ultrasonic Pulse | Electrical Conductivity | Vicat | |||
|---|---|---|---|---|---|---|---|
| Liquid Stage | Transitional Stage | Dissolution Stage | Induction Stage | Acceleration Stage | Initial Set Time | ||
| ST | 2.5 | 280 | 490 | 40 | 480 | 660 | 503 |
| 5.0 | 260 | 390 | 50 | 390 | 620 | 475 | |
| 7.5 | 160 | 310 | 50 | 300 | 440 | 396 | |
| FT | 2.5 | 290 | 80 | 300 | 1020 | 960 | |
| 5.0 | 280 | 30 | 280 | 970 | 710 | ||
| 7.5 | 200 | 20 | 200 | 810 | 602 | ||
Disclaimer/Publisher’s Note: The statements, opinions and data contained in all publications are solely those of the individual author(s) and contributor(s) and not of MDPI and/or the editor(s). MDPI and/or the editor(s) disclaim responsibility for any injury to people or property resulting from any ideas, methods, instructions or products referred to in the content. |
© 2023 by the authors. Licensee MDPI, Basel, Switzerland. This article is an open access article distributed under the terms and conditions of the Creative Commons Attribution (CC BY) license (https://creativecommons.org/licenses/by/4.0/).
Share and Cite
MDPI and ACS Style
Wu, W.; Xu, W.; Zhang, Y. Measuring Ultrasonic and Electrical Properties of Early-Age Cemented Tailings Backfill. Minerals 2023, 13, 135. https://doi.org/10.3390/min13020135
AMA Style
Wu W, Xu W, Zhang Y. Measuring Ultrasonic and Electrical Properties of Early-Age Cemented Tailings Backfill. Minerals. 2023; 13(2):135. https://doi.org/10.3390/min13020135
Chicago/Turabian StyleWu, Weilv, Wenbin Xu, and Yalun Zhang. 2023. "Measuring Ultrasonic and Electrical Properties of Early-Age Cemented Tailings Backfill" Minerals 13, no. 2: 135. https://doi.org/10.3390/min13020135
Note that from the first issue of 2016, this journal uses article numbers instead of page numbers. See further details here.