Study on the Application of a Reflux Classifier in the Classification of Ultrafine Ilmenite

1
Pangang Group Research Institute Co., Ltd., Panzhihua 617000, China
2
School of Minerals Processing and Bioengineering, Central South University, Changsha 410083, China
*
Author to whom correspondence should be addressed.
Minerals 2023, 13(3), 304; https://doi.org/10.3390/min13030304
Submission received: 20 January 2023
/
Revised: 6 February 2023
/
Accepted: 13 February 2023
/
Published: 21 February 2023
(This article belongs to the Section Mineral Processing and Extractive Metallurgy)
Abstract
:Mineral classification is an important preparation operation in the process of beneficiation. The classification effect directly affects the production capacity of grinding machines, product quality, subsequent separation of the concentrate grade, and recovery. To improve mineral classification accuracy and provide technical ideas for enriching the separation of fine materials, this paper proposes the use of a trapezoidal inclined channel agitated reflux classifier (TARC) to classify ultra-fine ilmenite. The principle of this separating system is based on a hindered settling effect and fluidization theory. This study focuses on the factors influencing the particle separation through the optimization of different experimental conditions. A satisfactory 10 µm classification efficiency of 67.89% could be obtained when the ore pulp concentration was 15%, the agitation speed was 350 r/min, and the underflow flux was 16 cm3/min. The TARC realized a continuous feeding classification of fine particles within a narrow particle size range, with 10 µm as the limit size, and an effective reduction in the entrainment of fine particles in the underflow and coarse particles in the overflow phenomena, thus achieving improved classification efficiency.
1. Introduction
The large-scale classification of ultra-fine (<38 µm) particles is a growing challenge for the minerals industry. Due to the limitations of existing technologies, ultrafine particles are often discarded as part of the tailings. For example, Panzhihua Titanium Company is the largest titanium concentrate production base in China, but the distribution of particle sizes is extremely uneven. A particle size of −74 µm accounts for about 60% of the company’s mineral resources, with a grade of 8.0%–10.0% [1,2], and −40 µm ilmenite ore accounts for about 30%. Solving the problems of concentration and classification is one of the key considerations in studying titanium separation technologies. Effective concentration classification can reduce 80% of the selected volume to provide materials with better separation performance for separation operations, which can greatly improve concentrate grade and separation efficiency [2].
The reflux classifier (RC) is an innovative device offering advantages in both particle size classification and density separation [3]. The device consists of fluidized bed sections and sets of parallel inclined plates at different elevations. Each set of plates spans the whole cross-sectional area of fluidized bed sections. The RC, a piece of solid–liquid fluidized bed separation equipment with a large processing capacity, was invented by Australian Professor Galvin in 2002 and was originally used for coal separation [4]. Compared with conventional fluidized bed equipment, the RC was equipped with a parallel inclined plate zone on the upper part of the bed. And compared to RC, TARC (trapezoidal inclined channel agitated reflux classifier) was equipped with a stirring device in the column area. There has a schematic representation of the TARC as shown in Figure 1 below. In an experiment on iron ores with particle sizes of less than 0.5 mm, one study used a RC and reported that the parallel inclined plate zone served as the key structure in the system [5]. The authors also found that sufficient fluidization water was essential for the separation of coarse-grained coal of 2–8 mm [6]. Meanwhile, Liu used a RC to realize the gravity separation and enrichment of low-grade and fine-grained antimony ore flotation tailings and achieved good results [7]. A RC was also used to conduct gravity separation and pre-enrichment for low-grade and fine-grained antimonite flotation tailings, which greatly improved the separation efficiency of the whole process. In the process of gravity separation, particles tend to be classified by their size rather than density under certain circumstances, thus allowing for lighter gangue minerals with large particle sizes to pass through the bed and enter the underflow [8].
The RC is more efficient in processing fine-grained materials in the field of classification. After nearly a decade of research by Galvin et al., a full-size 2 m diameter REFLUXTM flotation cell (RFCTM) was successfully commissioned and run for the first time in a coal preparation plant. The results showed that the recovery rate of hydrophobic particles was 83% and that of hydrophilic particles was less than 20% in the size range of 1–50 µm [9]. Previously, a new type of flotation device, the reflux flotation cell, was introduced to provide a universal solution for improving fine and coarse particle flotation while maintaining high throughput [10].
In this study, an initial attempt was carried out to classify fine-grained ilmenite using a TARC to explore its application potential in the fine-grained classification field. The classification process was optimized by single-factor experiments. A −10 µm particle recovery (PR) as well as classification efficiency were comprehensively considered to evaluate the influence of each factor on particle classification behavior in the equipment. Laser particle size measurement was used for product analysis of various experiments.
2. Theory
Different sizes and densities of particles produce various settling speeds and stratification in a settling medium. Thus, this stratification phenomenon is used to divide the material into different particle classes. The classification of the material is not only related to the size of the particles but also to the density and shape. In gravity field classification, differences in the settling velocities of particles with varying particle sizes in the media flow are the main reason the materials are separated by size. Therefore, the settling theory of particles in the media layer can be used as the basis for material classification [11,12,13].
However, the settling of particles in experiments is not free from media interference, which can affect the settling of particle populations [12]. Richardson and Zaki considered the interference settling end velocity as a function of the free settling and particle volume concentration [13], as expressed in the following formula:
where μti is the final velocity of the free settling of particles, cm/s; is the volume fraction of suspension occupied by the particle group, %; and n is a constant parameter.
However, this equation can only describe the final settling velocity of a single type of particle; it cannot describe the final settling velocity of a particle group when the particle group properties (particle size and density) are different. Galvin et al. optimized the formula from the perspective of the total pressure contribution [14]. In a fluidized bed with interference settlement of only one particle, the total pressure PT at a height H is given by:
Thus, the total pressure gradient can be expressed as:
where PT is the total pressure at a certain height, Pa; H is the height of a liquid surface, cm; ρi is the particle density; ρf is the fluid density, g/cm3; and g is the acceleration of gravity, m/s2. The dissipative pressure gradient in this equation can be expressed as:
Substituting this equation into Equation (2), Equation (5) can be obtained as follows:
It can be seen from this equation that the final interference settling velocity of particles is a function of the dissipative pressure gradient, which can be caused by a single particle group or a complex particle group. For a suspension system containing two kinds of particles, the dissipative tension gradient can be expressed as follows:
Another common expression of Equation (6) is given in Equation (7):
where is the concentration of suspension, g/L.
The RC features a set of inclined channels above a fluidized bed and is capable of processing particles as fine as 10 µm [15]. Conventional fluidization water is introduced via a distributor at the base to fluidize the feed entering at a higher elevation. In the inclined plate area of the TARC, the Boycott effect accelerates the settling of particles [16], causing coarse particles to fall back to the lower layer of the inclined plate until they return to the column area and eventually become settled sand. Then, the flow passes up through the system of inclined channels, transporting slower-settling fine/low-density particles to the overflow. Particles segregate onto the inclined surfaces, returning to the lower zone. Finally, the valve releases faster-settling, coarse particles to the underflow [6]. Moreover, the fluidization bed characteristics reveal the separation mechanism inside the RC.
3. Experiment
3.1. Equipment
The experimental equipment includes a TARC. As shown in Figure 2, it consists of four parts: a fluidization water distributer, a vertical column, inclined channels, and a stirring device. The fluidization water distributer is at the bottom of the equipment and provides continuous and uniform water into the fluidized bed. The fluidization water can not only be used to fluidize particles but also to wash ultrafine particles in the fluidized bed [5]. The stirring blade of the stirring device is at the lowest level of the vertical column, and appropriate mechanical agitation will dilute the fluidized bed. The dispersion of particles in this region is enhanced, and the mechanical entrainments are reduced [9]. The trapezoidal inclined plate divides the classification zone into several classification intervals, each with the same operating principle. Classification based on the principle of shallow inclined layer settling greatly enhances the capacity of the equipment [17]. In addition, secondary classification of particles occurs in the inclined plate area. Coarse particles settle on the inclined plate and slide back to the vertical column, after which fine particles flow with the slurry to overflow, greatly improving classification accuracy [18].
3.2. Materials
Experimental samples were obtained from the tailings of a titanium concentration plant in Panzhihua, Sichuan. The fine particles were directly tested after concentration. The particle size range was 0–50 µm, and the size distribution is shown in Figure 3. In addition, d(50) is 9.455 µm, and d(90) is 33.947 µm. The multi-element analysis of the ore is shown in Table 1. The main metal contents were Si, Fe, and Ti. The main vein mineral in the ore was quartz, and the original ore sample was a multi-metal mixed ore.
3.3. Experimental Design
The objective of this study was to examine the effects of multiple factors and variables on the classification performance of the TARC. Numerous tests and an enormous workload were required to conduct a comprehensive test. Therefore, single-factor multi-level tests were performed to determine the influence of individual factors on the classification performance, in which one factor was changed while the other parameters were kept constant. The factor-level table used in the single-factor multi-level test is shown in Table 2.
In this experiment, the classification efficiency is the percentage of the weight of a grade in the classification overflow to the weight of the same grain grade in the classifier feed. This is an index to examine how well the classifier works. The calculation formula for classification efficiency is the same as the screening efficiency, generally adopting the R. T. Hancock formula calculator [11]. This is expressed as follows:
where E is the classification efficiency, %; α is the fine material content of feed, %; β is the fine material content of overflow, %; and θ is the fine material content of settled sand, %.
We used a −10 µm particle recovery (PR) in the overflow to characterize particle size distribution with the following formula:
where R is the −10 µm PR in the overflow, %; is the accumulated fraction of −10 µm in the overflow, %; and is the accumulated fraction of −10 µm in the underflow, %.
At the same time, this paper analyzes the classification performance by taking the classification efficiency, yield of overflow, and PR as evaluation indexes. When the three indexes differ significantly, the classification efficiency index is guaranteed first.
3.4. Experimental Operation
An experimental platform was built in this study to investigate the influence of operational parameters on the classification performance of the TARC, as shown in Figure 4. A sample with a certain concentration of ore pulp was prepared during the experiment. After evenly mixing in the ① mixing barrel, the materials were allowed to enter the TARC at a certain pressure by the ② peristaltic pump. Then, the ③ water flowmeter was adjusted to the appropriate flow rate. After the water rose above the slant, the ④ underflow peristaltic pump was turned on, followed by the chronograph. Then, we waited for the equipment to run for 60 min to stabilize the state. Once the system was stabilized, a certain amount of the separated product was taken from the overflow and the underflow for sampling and analysis. The particle distribution was measured by the laser particle size meter Hydro 2000MU (A). After testing, the classification efficiency was calculated according to Equation (8).
4. Results and Discussion
4.1. Ore Pulp Concentration Results
A RC was used previously in a pre-concentration experiment of antimony oxide [8]. When the factors of feeding, underflow, and ascending water were 225, 30, and 133 cm3/min, respectively, a better result could be achieved. On this basis, the experimental conditions of the TARC were initially set. The following conditions were set: tentatively proposed feed flux of 200 cm3/min, agitation speed of 350 r/min, fluidization water flux of 100 cm3/min, and underflow flux of 20 cm3/min. Under these conditions, the influence of the feed concentration on classification efficiency was explored, and the experimental results are presented (Figure 5). The overflow products became finer upon increasing the feed concentration. Meanwhile, as the feed concentration increased from 10% to 25%, the content of −10 µm particles in the underflow decreased from 39.01% to 21.87%. The results showed that when the feed concentration was low, the particles maintained a good dispersion state under the action of fluidization water. Furthermore, the classification efficiency increased with the increase in ore pulp concentration. As the feed concentration increased from 10% to 15%, the classification efficiency increased from 41.29% to 59.78%, and the classification efficiency reached the maximum value. Increasing the particle concentration can lead to increased viscosity of the slurry. Then, the resulting increase in the fluid drag force on the particles enhanced the interference between particles and increased the particle resistance, resulting in more particles entering the underflow. At the same time, the increase in the feed concentration will lead to an increase in the equipment’s processing capacity. If the feed concentration was too high, the processing capacity of the device reached its peak, and the column classification zone contained more particles, so the particle agglomeration phenomenon was serious. Therefore, under the proposed initial condition data, a classification efficiency of 10 µm particles was taken as the evaluation standard, and the optimal feed concentration was determined to be 15%.
4.2. Agitation Speed Results
We set the ore pulp concentration at 15%, the feed flux at 200 cm3/min, the fluidization water flux at 100 cm3/min, and the underflow flux at 20 cm3/min to investigate the influence of the agitation speed on the classification index. The experimental results are shown in Figure 6. As can be seen, the content of −10 µm particles in the underflow decreased from 34.99% to 22.58% with the increase in the agitation speed from 0 to 350 r/min. The stirring device had a significant impact on the classification index. On the whole, each index increased first and then decreased with the increasing agitation speed. The mechanical entraining phenomenon at the bottom of the equipment was very serious [19]. The stirring device allowed the particles to facilitate greater dispersion and strengthened the fluidity of the slurry in the equipment. In addition, the rising water flow caused by the stirring device had a useful role in washing the particles, making it easier for the fine particles to discharge through the overflow. This was an important reason for the increase in yield and the PR of overflow. When the fluidization bed was diluted by agitation, the density of the bed decreased, which results in a reduction in the hindered settling ratio. Particles tend to be classified by their size rather than density, which allows the classification efficiency to be greatly increased [9]. However, an excessively high agitation speed changed the pressure difference during the separation in the column and disrupted the movement state of particles in the column area. It also inevitably brought some coarse particles into the overflow, thus directly leading to a rapid decline in the classification efficiency. When the agitation speed was 350 r/min, the overflow yield was 47.37%, the PR was 76.62%, and the classification efficiency was 59.78%; the three indexes achieved the maximum value under the same experimental conditions. Therefore, it was determined that the best agitation speed obtained by the equipment was 350 r/min.
4.3. Feed Flux Results
We set the ore pulp concentration at 15%, the agitation speed at 350 r/min, the fluidization water flux at 100 cm3/min, and the underflow flux at 20 cm3/min to investigate the effect of the feed flux on the classification index. The experimental results are shown in Figure 7. The higher the feed flux, the more particles for the TARC were needed to process simultaneously, but the classification zone remained limited. That is to say, the processing capacity of the equipment will be increased with the increase in the feed flux, but it will not increase without limit. With the increase in the feed flux, the three classification indexes were improved, especially when the feed flux increased to 200 cm3/min. Furthermore, the classification efficiency reached the maximum value of 59.78%, but the overflow yield was too low at the same condition. When the feed flux increased to 300 cm3/min, the overflow yield was 52.64%, the PR was 76.9%, and the classification efficiency was 57%. On the one hand, if the feed flux was too high, some particles directly entered the overflow due to the unreasonable feed structure. These particles were not effectively separated, which was also the main factor that reduced the separation performance [20]. On the other hand, this will cause the peristaltic pump to clog and destroy the classification stability of the equipment, which negatively affects the continuation of the subsequent classification process. In Figure 7, the classification efficiency has shown a decreasing trend by increasing the feed flux, but it seemed that the yield and PR have not decreased, because continuing to increase the feed flux will lead to clogging of the peristaltic pump, which cannot support stable experiments. The TARC has not reached the maximum value of the feed flux in the experiment. Therefore, the optimal feed flux was 300 cm3/min.
4.4. Underflow Flux Results
We set the ore pulp concentration at 15%, the agitation speed at 350 r/min, the feed flux at 300 cm3/min, and the fluidization water flux at 100 cm3/min to investigate the effect of the underflow flux on the classification index. The experimental results are shown in Figure 8. As can be seen, the content of −10 µm particles in the underflow decreased from 29.77% to 21.8% with the decrease in the underflow flux from 20 cm3/min to 16 cm3/min. The underflow flux had a great influence on the overflow yield. The classification efficiency was poor when the underflow flux was too low. Increasing the underflow flux caused the adhesion of the fine particles to the coarse particles to be discharged through the underflow, resulting in a sharp decrease in the overflow yield and a gradual reduction in the PR. Thus, a suitable underflow flux is crucial to the classification process [21]. When the underflow flux was 16 cm3/min, the overflow yield was 60.41%, the PR was 85.32%, and the classification efficiency was 61.40%, which ensured a better classification index. Therefore, the optimal underflow flux was 16 cm3/min.
4.5. Fluidization Water Flux Results
We set the ore pulp concentration at 15%, the agitation speed at 350 r/min, the feed flux at 300 cm3/min, and the underflow flux at 16 cm3/min to investigate the influence of the fluidization water flux on the classification index. The fluidization water not only ensured that the particles were in a better dispersion state, but it was also used for the leaching of ultrafine particles in the fluidized bed [5]. An excessively high rising water flow will inevitably bring particles with a size greater than 10 µm into the overflow products; thus, it is important to determine the value of the fluidization water. The experimental results are shown in Figure 9. As can be seen, when the fluidization water flux was 100 cm3/min, the −10 µm classification efficiency was 67.87%. When changing the fluidization water flux, the classification indexes fluctuated within about 5% of the original values and maintained a relatively excellent result. The recovery rate and overflow yield gradually became stable with the change. When the fluidization water flux was too high, the classification efficiency suddenly decreased. The reason for this was that the water flow drove some coarse particles to enter the inclined plane with the slurry and finally discharged from the overflow; these particles were the main reason for the reduction in classification efficiency. When the fluidization water flux was 100 cm3/min, the overflow yield was 59.36%, the PR was 88.89%, and the −10 µm classification efficiency was 67.87%, which achieved a better and stable index. Therefore, the fixed experimental condition of the fluidization water flux was 100 cm3/min.
4.6. Discussion on Experimental Products
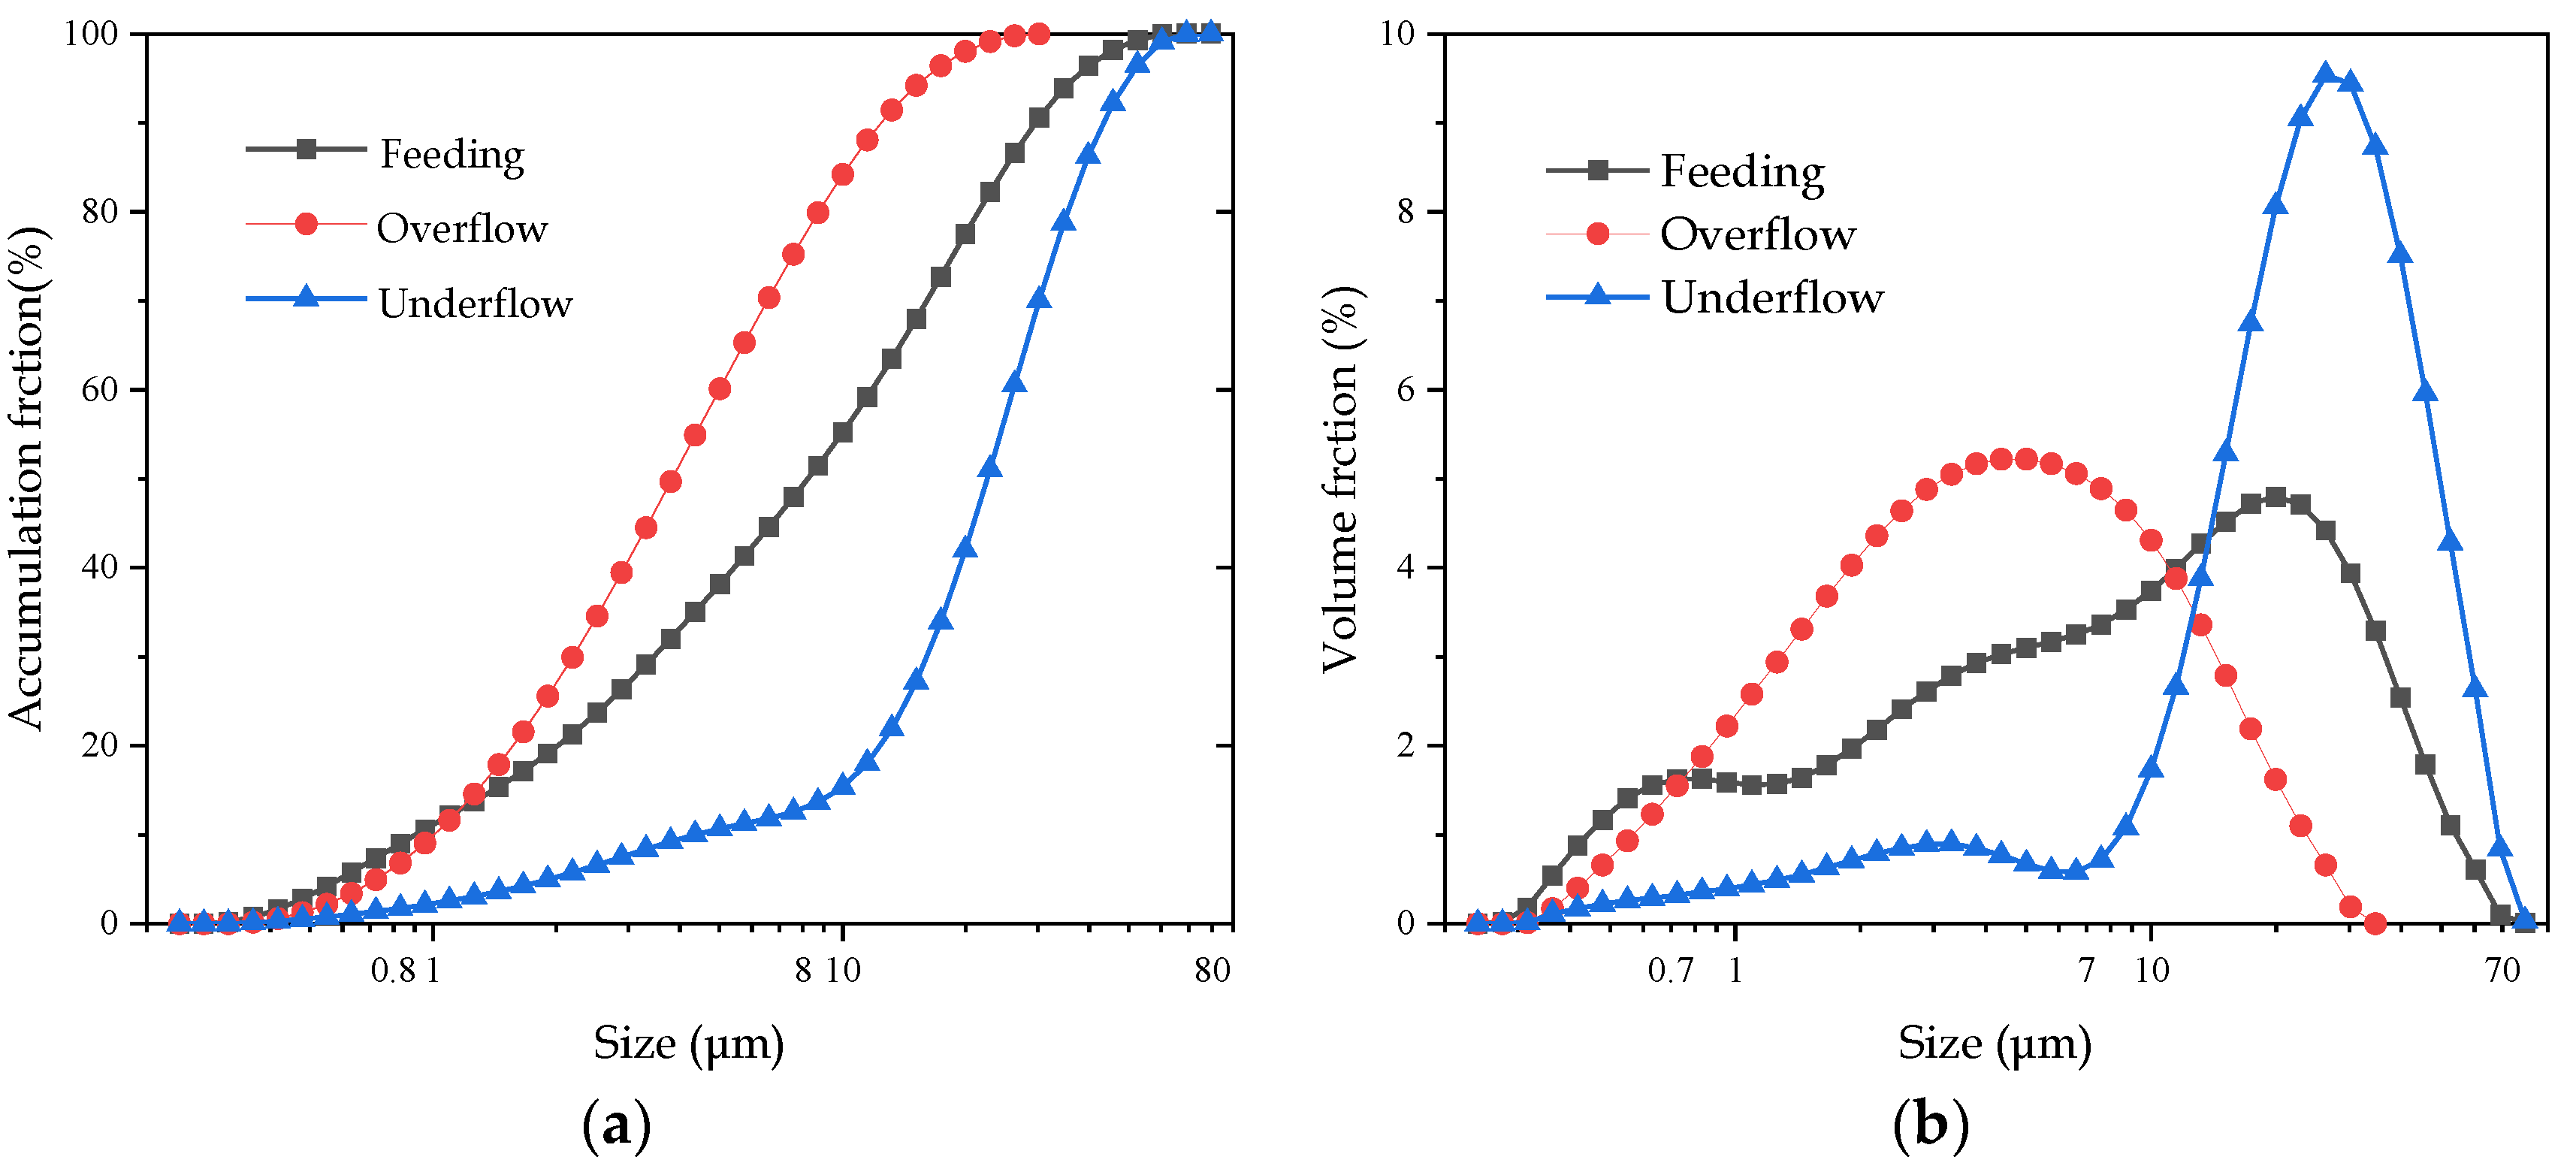
According to the experiment, the best classification conditions for the TARC were as follows: feed concentration of 15%, agitation speed of 350 r/min, feed flux of 300 cm3/min, underflow flux of 16 cm3/min, and fluidization water flux of 100 cm3/min. Under these conditions, the TARC can achieve the best classification index. Furthermore, the overflow yield was 59.36%, the PR was 88.89%, and the classification efficiency was 67.87%, as shown in Figure 10. The product overflow accumulation curve was shifted to the left compared with the original ore as a whole, and the underflow was shifted to the right. The accumulation content of −10 µm in the original ore was 55.22%, but the accumulation content of −10 µm particles in the overflow product was 84.21%, whereas that in the underflow was only 15.37%. From the particle size analysis in Table 3, it could be seen that d50 = 9.455 µm and d90 = 33.947 µm in the raw ore, d50 = 4.402 µm and d90 = 14.220 µm in the overflow product, and d50 = 25.902 µm and d90 = 49.617 µm in the underflow. Overall, the particle size of the overflow product was smaller, and the underflow product was larger. The fact that the particle size of the underflow particles was slightly larger than the raw material can be attributed to the inevitable agglomeration of particles in the experiment. From the particle metal elements of Ti analysis in Table 4, the product grade in the underflow was slightly higher because the Ti element was more concentrated in +10 µm particles. The metal recoveries of both the overflow and the underflow were close to 50%, which indicated that the TARC reduced the effect of particle density on the experimental process under the adjustment of experimental parameters. Adjusting the operational parameters of the TARC reduced the entrainment of fine particles in the underflow and coarse particles in the overflow phenomena. In turn, this reduced the product mismatch rate and improved the overall classification efficiency to some extent. The experiments showed that the TARC could achieve the separation of mineral particles according to size under certain experimental conditions, as well as maintain a high yield and recovery rate. These findings prove that the TARC has good potential in performing classification operations.
5. Conclusions
In this work, a new type of classification device, trapezoidal inclined channels (TARC), was first used in the fine-grained classification of ilmenite. This device can achieve good results in mineral separation. The effects of feed concentration, agitation speed, feed flux, underflow flux, and fluidization water flux on the classification effect were investigated in the experiment using the single-condition variable method.
Based on the classification optimization experiment of the TARC, the results indicated that when the slurry concentration was 15%, the agitation speed was 350 r/min, the feed flux was 300 cm3/min, the underflow flux was 16 cm3/min, and the fluidization water flux was 100 cm3/min, respectively, the classification efficiency of 10 µm was 67.87%, the overflow yield was 59.36%, and the particle recovery of −10 µm in the overflow was 88.89%.
The appropriate agitation speed helps to dilute the concentration of slurry in the column zone, which ensures a positive dispersion between the particles and enables better separation of particles according to their size. The fluidization water can be used to wash the ultra-fine particles in the column zone, which is conducive to the classification process. With the combined effect of operating parameters such as the agitation speed, the underflow flux, and the fluidization water flux, the TARC can also separate particles by size. In the classification process, the effect of the parameters’ interaction and the strength of the influence of each parameter should be the focus of further research.
Author Contributions
Y.G. wrote the first draft of the manuscript and revised the manuscript. D.L. provided the research ideas and formulated the overall research objectives. Z.L. conducted the experiments and analyzed the test data. Y.Z. and F.C. offered some valuable suggestions for the contents of the manuscript. All authors have read and agreed to the published version of the manuscript.
Funding
This work was supported by the State Key Laboratory of Comprehensive Utilization of Vanadium and Titanium Resources (2021P4FZG05A). This project was also supported by the National Key Research and Development Program of China (2021YFC2903202) and the National Natural Science Foundation of China (52174270; 52174267; 51974366; 51674290).
Data Availability Statement
Not applicable.
Conflicts of Interest
The authors declare no conflict of interest.
References
- Kun, W.; Huan, D.; Liu, R. Genesis of giant Fe-Ti oxide deposits in the Panxi region, SW China: A review. Geol. J. 2020, 55, 3782–3795. [Google Scholar]
- Raiymbekov, Y.; Besterekov, U.; Abdurazova, P.; Nazarbek, U. Review of methods and technologies for the enrichment of low-grade phosphorites. Rev. Inorg. Chem. 2022, 42, 385–395. [Google Scholar] [CrossRef]
- Nguyentranlam, G.; Galvin, K.P. The development of an innovative classifier. In Proceedings of the 28th Australasian Chemical Engineering Conference, Perth, Australia, 9–12 July 2000; pp. 290–296. [Google Scholar]
- Galvin, K.P.; Doroodchi, E.; Callen, A.M. Pilot plant trial of the reflux classifier. Miner. Eng. 2002, 15, 19–25. [Google Scholar] [CrossRef]
- Galvin, K.P.; Zhou, J.; Dickinson, J.E. Desliming of dense minerals in fluidized beds. Miner. Eng. 2012, 39, 9–18. [Google Scholar] [CrossRef]
- Galvin, K.P.; Callen, A.M.; Spear, S. Gravity separation of coarse particles using the Reflux Classifier. Miner. Eng. 2010, 23, 339–349. [Google Scholar] [CrossRef]
- Liu, Z.Q.; Lu, D.F.; Wang, Y.H.; Chu, H.R.; Zheng, X.Y.; Chen, F.L. Application of reflux classifier with closely spaced inclined channels in pre-concentrate process of fine antimony oxide particles. J. Cent. South Univ. 2020, 27, 3290–3301. [Google Scholar] [CrossRef]
- Chu, H.R.; Wang, Y.H.; Lu, D.F.; Liu, Z.Q.; Zheng, X.Y. Pre-concentration of fine antimony oxide tailings using an agitated reflux classifier. Powder Technol. 2020, 376, 565–572. [Google Scholar] [CrossRef]
- Iveson, S.M.; Sutherland, J.L.; Cole, M.J.; Borrow, D.J.; Zhou, J.; Galvin, K.P. Full-Scale trial of the REFLUX(TM) flotation cell. Miner. Eng. 2022, 179, 107447. [Google Scholar] [CrossRef]
- Chen, J.R.; Chimonyo, W.; Peng, Y.J. Flotation behavior in reflux flotation cell–A critical review. Miner. Eng. 2022, 181, 107519. [Google Scholar] [CrossRef]
- Zhou, X.L.; Wang, X.; Zhang, X.M. The Efficiency Change of Spiral Classifier with Different Overflow Discharge Methods. Adv. Mater. Res. 2011, 412, 453–458. [Google Scholar] [CrossRef]
- Piazza, R. Settled and unsettled issues in particle settling. Rep. Prog. Phys. Phys. Soc. 2014, 77, 056602. [Google Scholar] [CrossRef] [PubMed]
- Richardson, J.F.; Zaki, W.N. Sedimentation and fluidisation Part I. Chem. Eng. Res. Des. 1997, 75, s82–s100. [Google Scholar] [CrossRef]
- Galvin, K.P.; Pratten, S.; Lam, G.N.T. A generalized empirical description for particle slip velocities in liquid fluidized beds. Chem. Eng. Sci. 1999, 54, 1045–1052. [Google Scholar] [CrossRef]
- Hunter, D.M.; Iveson, S.M.; Galvin, K.P. Gravity Separation of Ultra-fine Iron Ore in the Reflux Classifier. In Proceedings of the Iron Ore Conference, Perth, Australia, 13–15 July 2015. [Google Scholar]
- Boycott, A.E. Sedimentation of blood corpuscles. Nature 1920, 104, 152. [Google Scholar] [CrossRef] [Green Version]
- Nguyentranlam, G.; Galvin, K.P. Applications of the Reflux Classifier in solid–liquid operations. Int. J. Miner. Process. 2004, 73, 83–89. [Google Scholar] [CrossRef]
- Nakamura, H.; Kuroda, K. The cause of the accelerated sedimentation rate of suspensions in inclined channel. Keijo J. Med. 1973, 8, 256–296. [Google Scholar]
- Chu, H.R.; Liu, Z.Q.; Wang, Y.H.; Lu, D.F.; Zheng, X.Y. Agitation effect on particle dispersion and separation in an agitated reflux classifier. Miner. Eng. 2022, 187, 107804. [Google Scholar] [CrossRef]
- Li, J.; Agarwal, A.; Lveson, S.M.; Kiani, A.; Dickinson, J.; Zhou, J. Recovery and concentration of buoyant cenospheres using an Inverted Reflux Classifier. Fuel Process. Technol. 2014, 123, 127–139. [Google Scholar] [CrossRef]
- Zhou, J.; Walton, K.; Laskovski, D.; Duncan, P.; Galvin, K.P. Enhanced separation of mineral sands using the Reflux Classifier. Miner. Eng. 2006, 19, 1573–1579. [Google Scholar] [CrossRef]
Figure 1.
Schematic representation of the TARC (trapezoidal inclined channel agitated reflux classifier).
Figure 1.
Schematic representation of the TARC (trapezoidal inclined channel agitated reflux classifier).
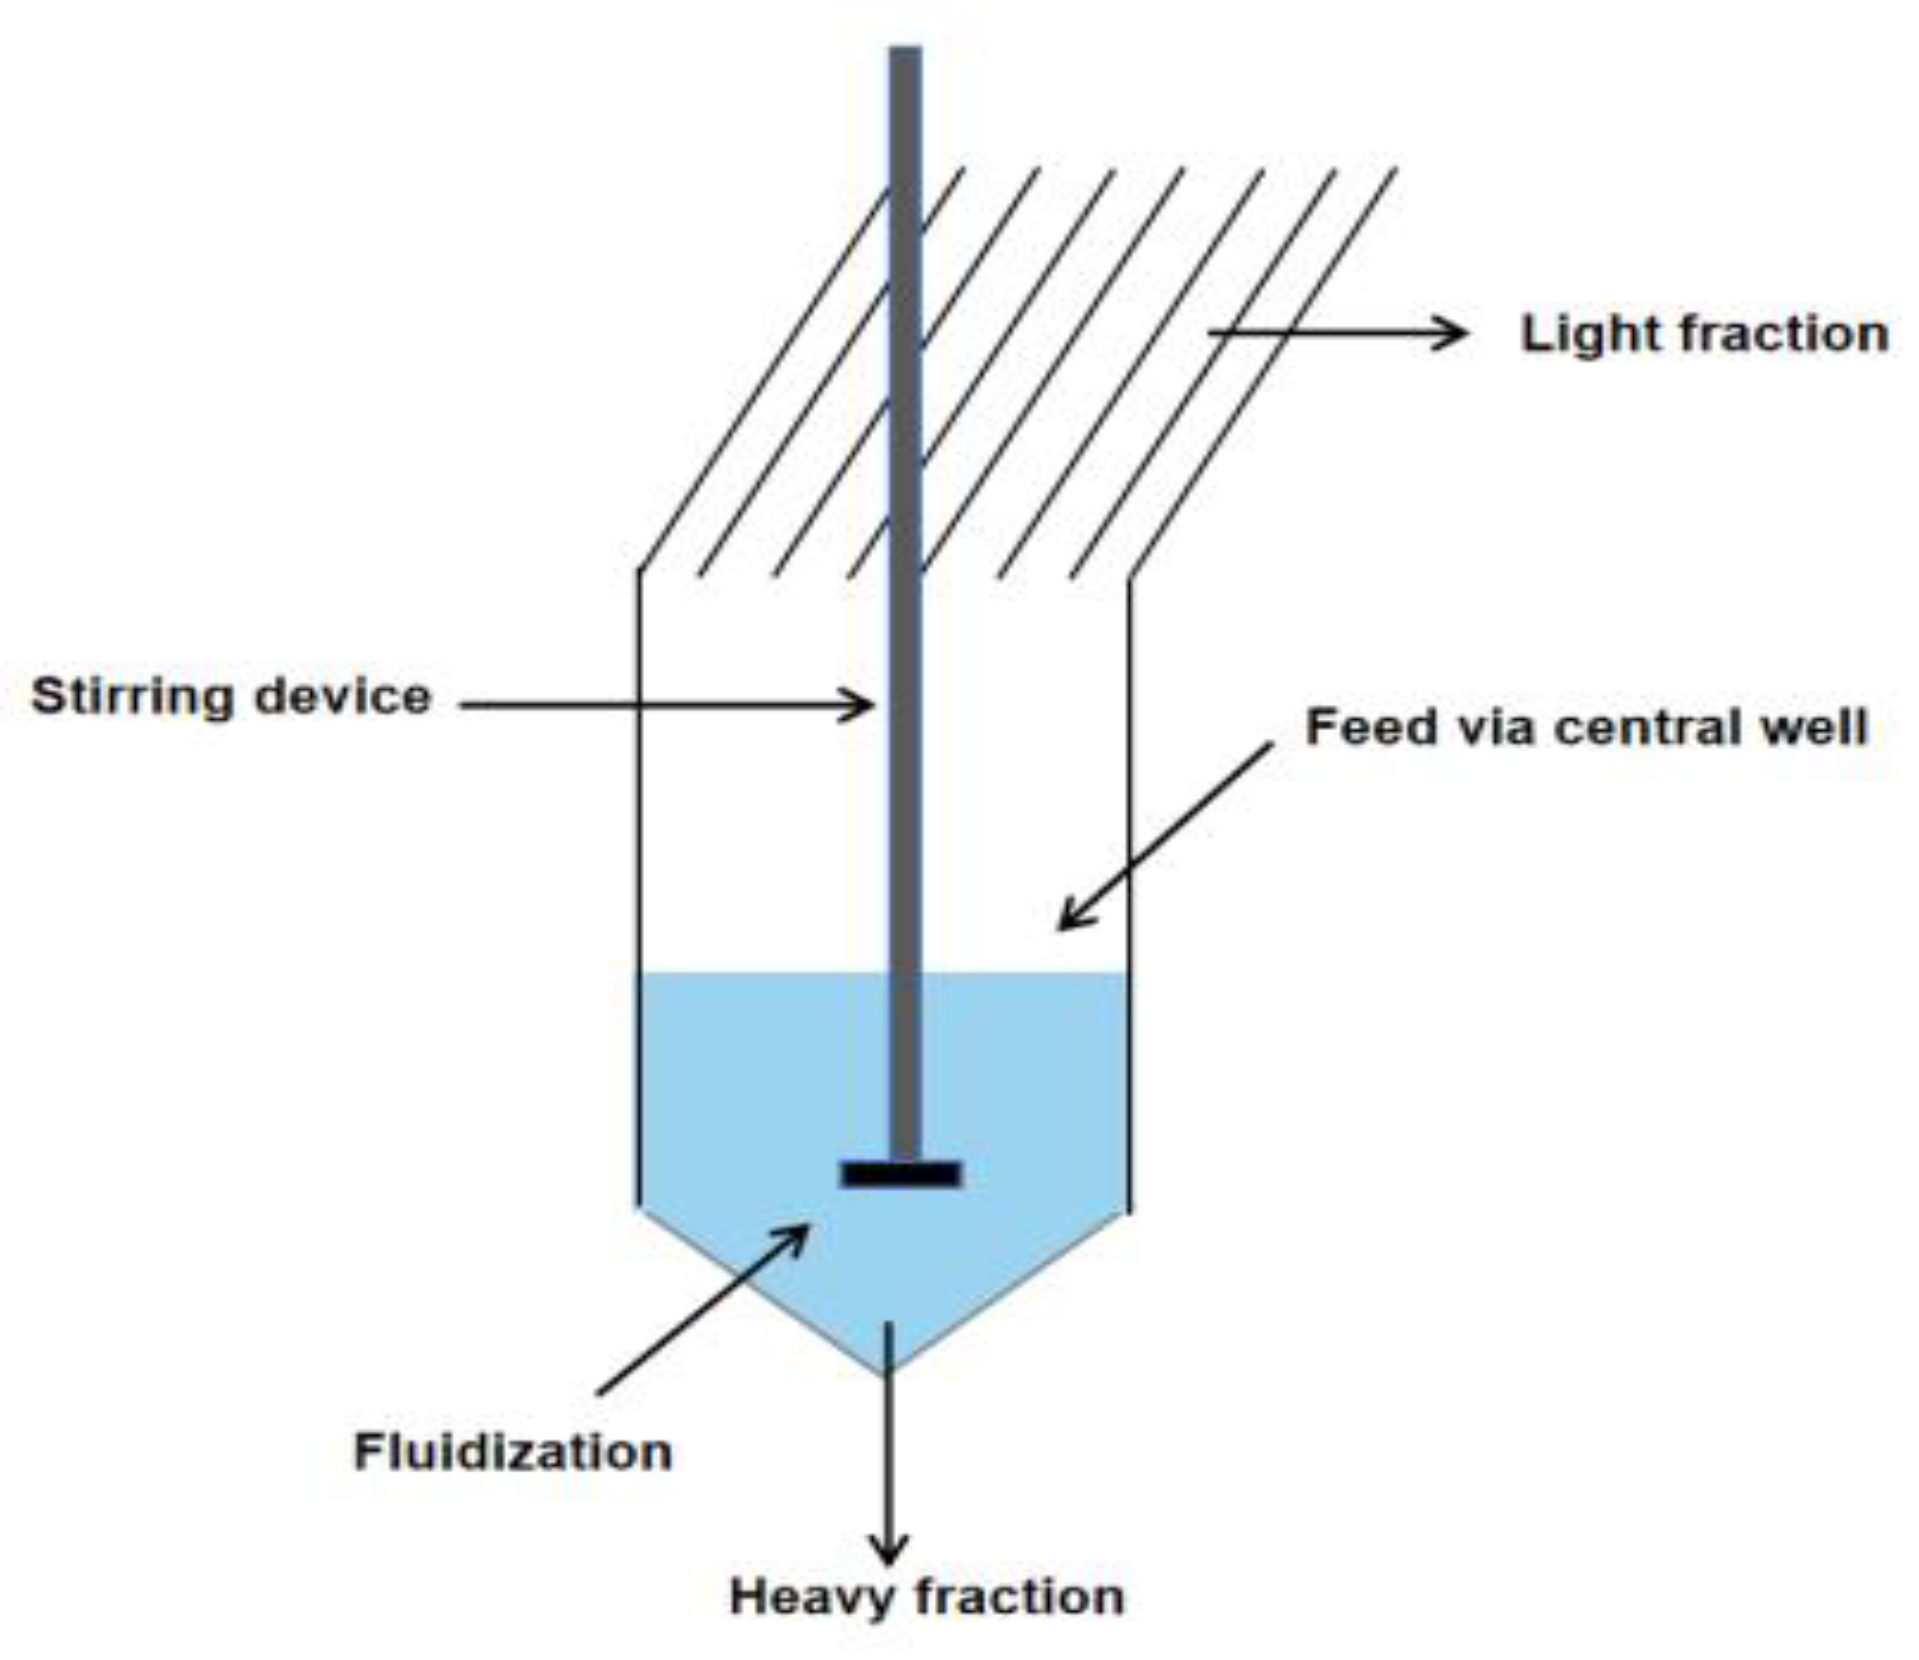
Figure 2.
Diagram of the TARC (trapezoidal inclined channel agitated reflux classifier).

Figure 3.
The particle size distribution of the feed sample.
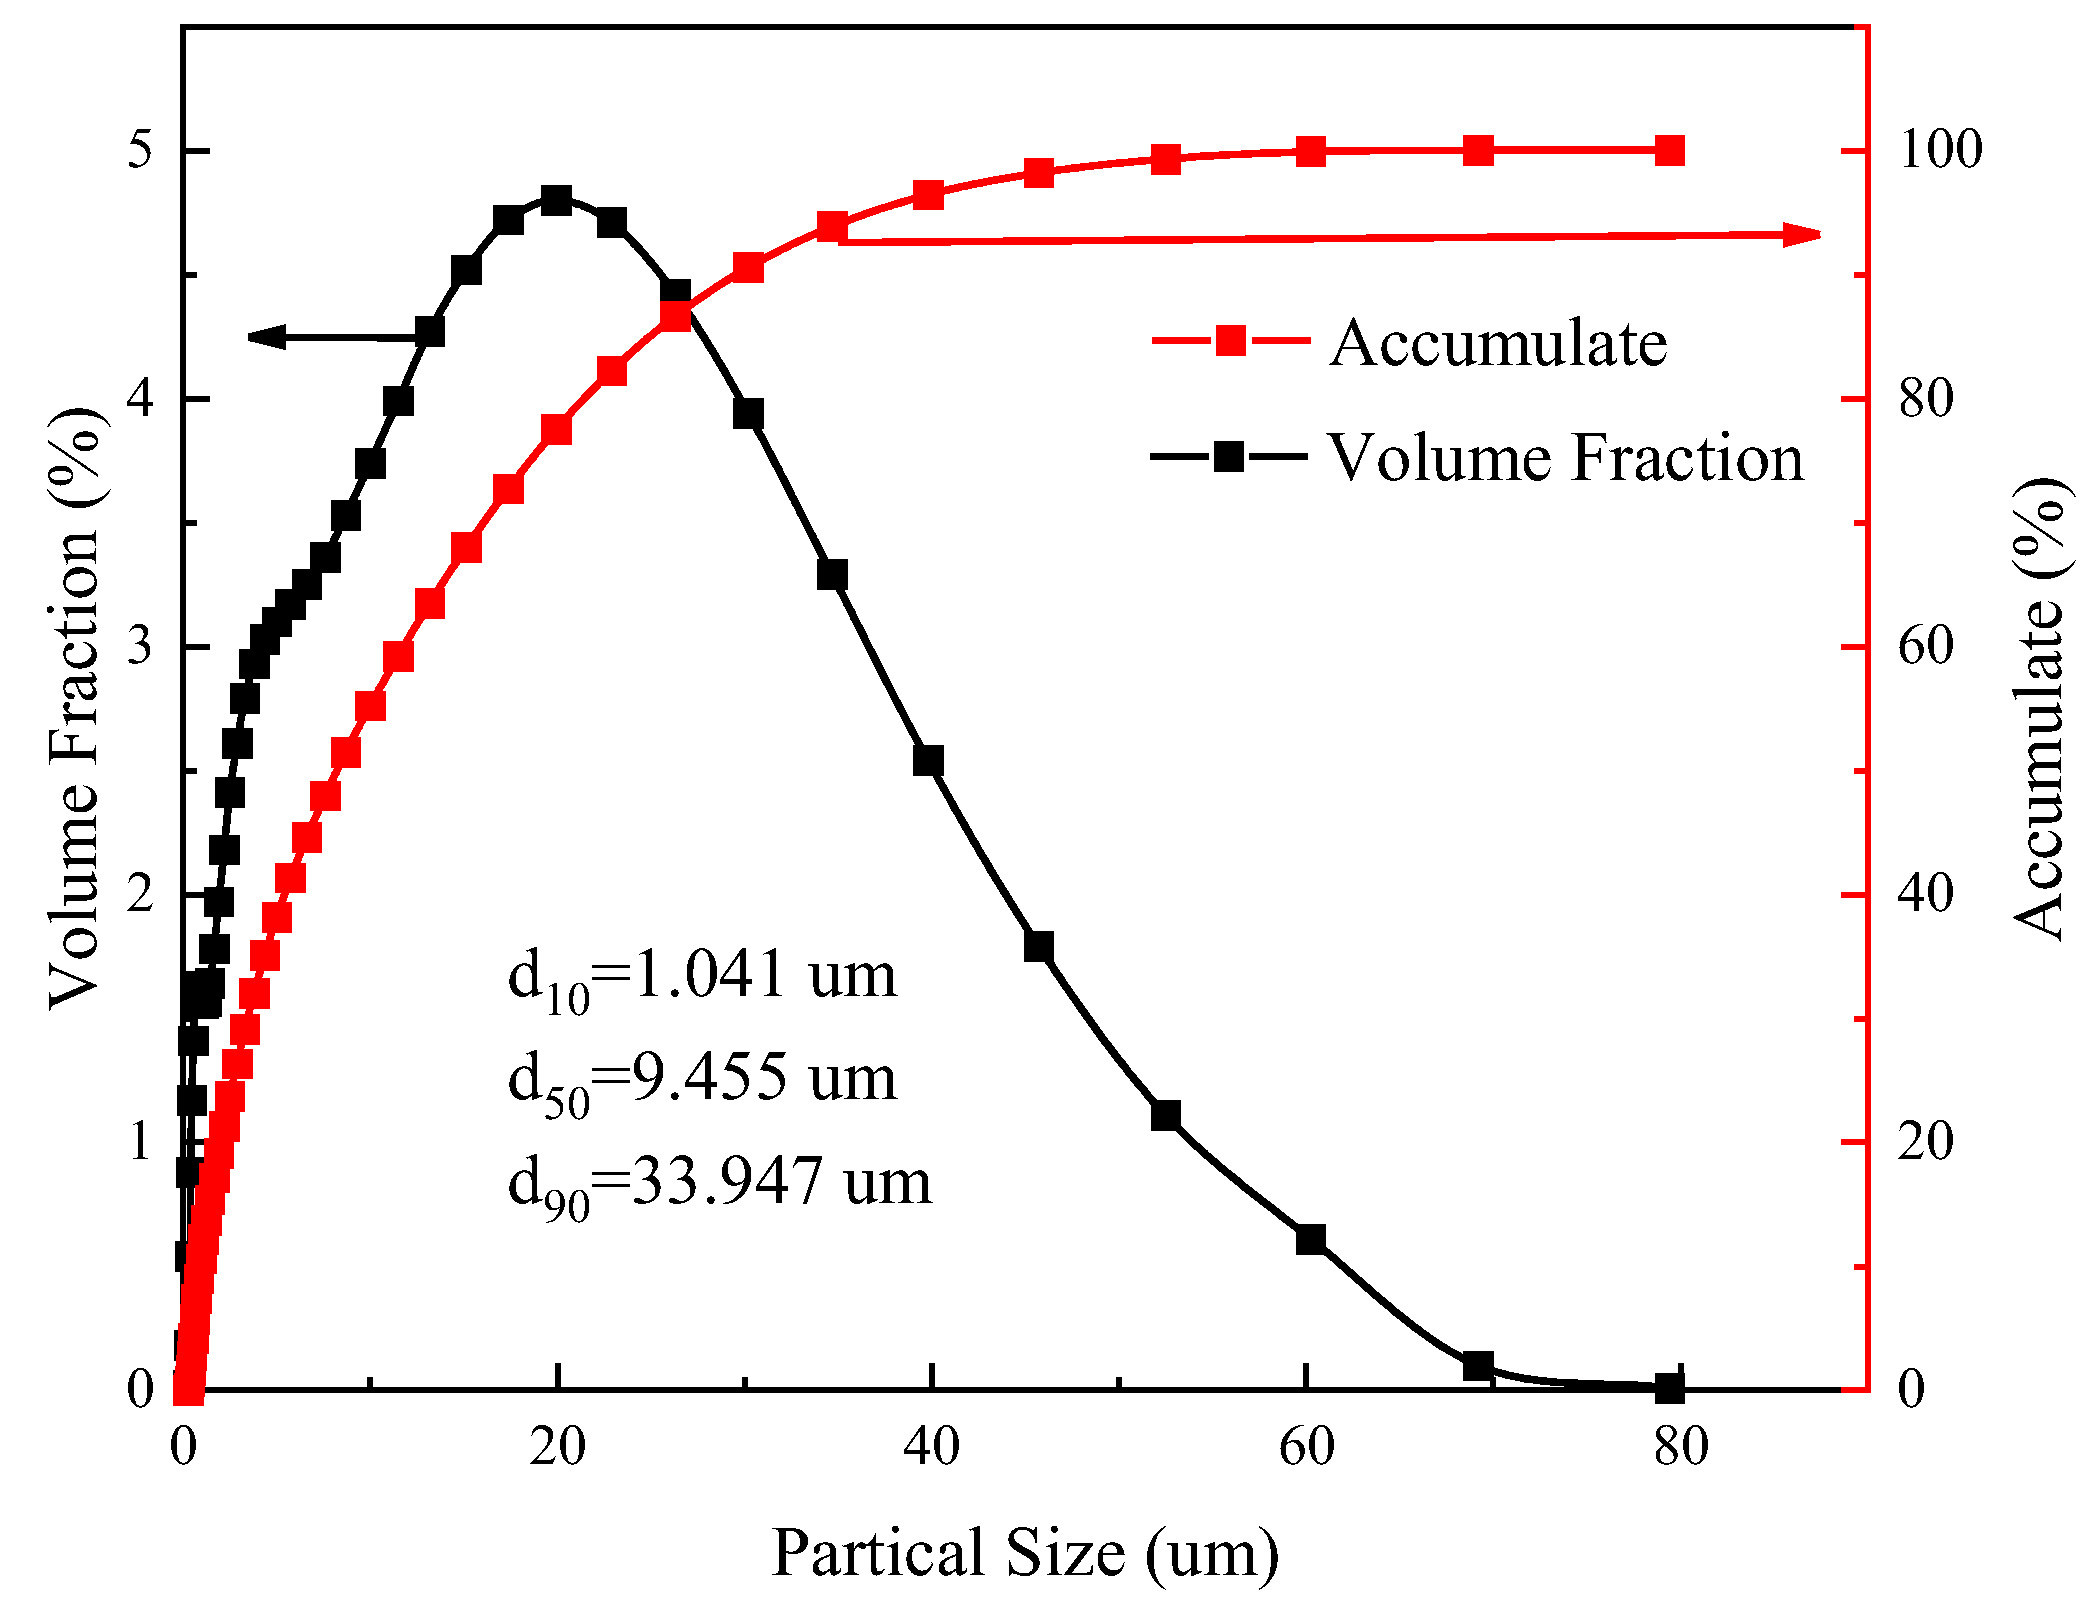
Figure 4.
Experiment platform.
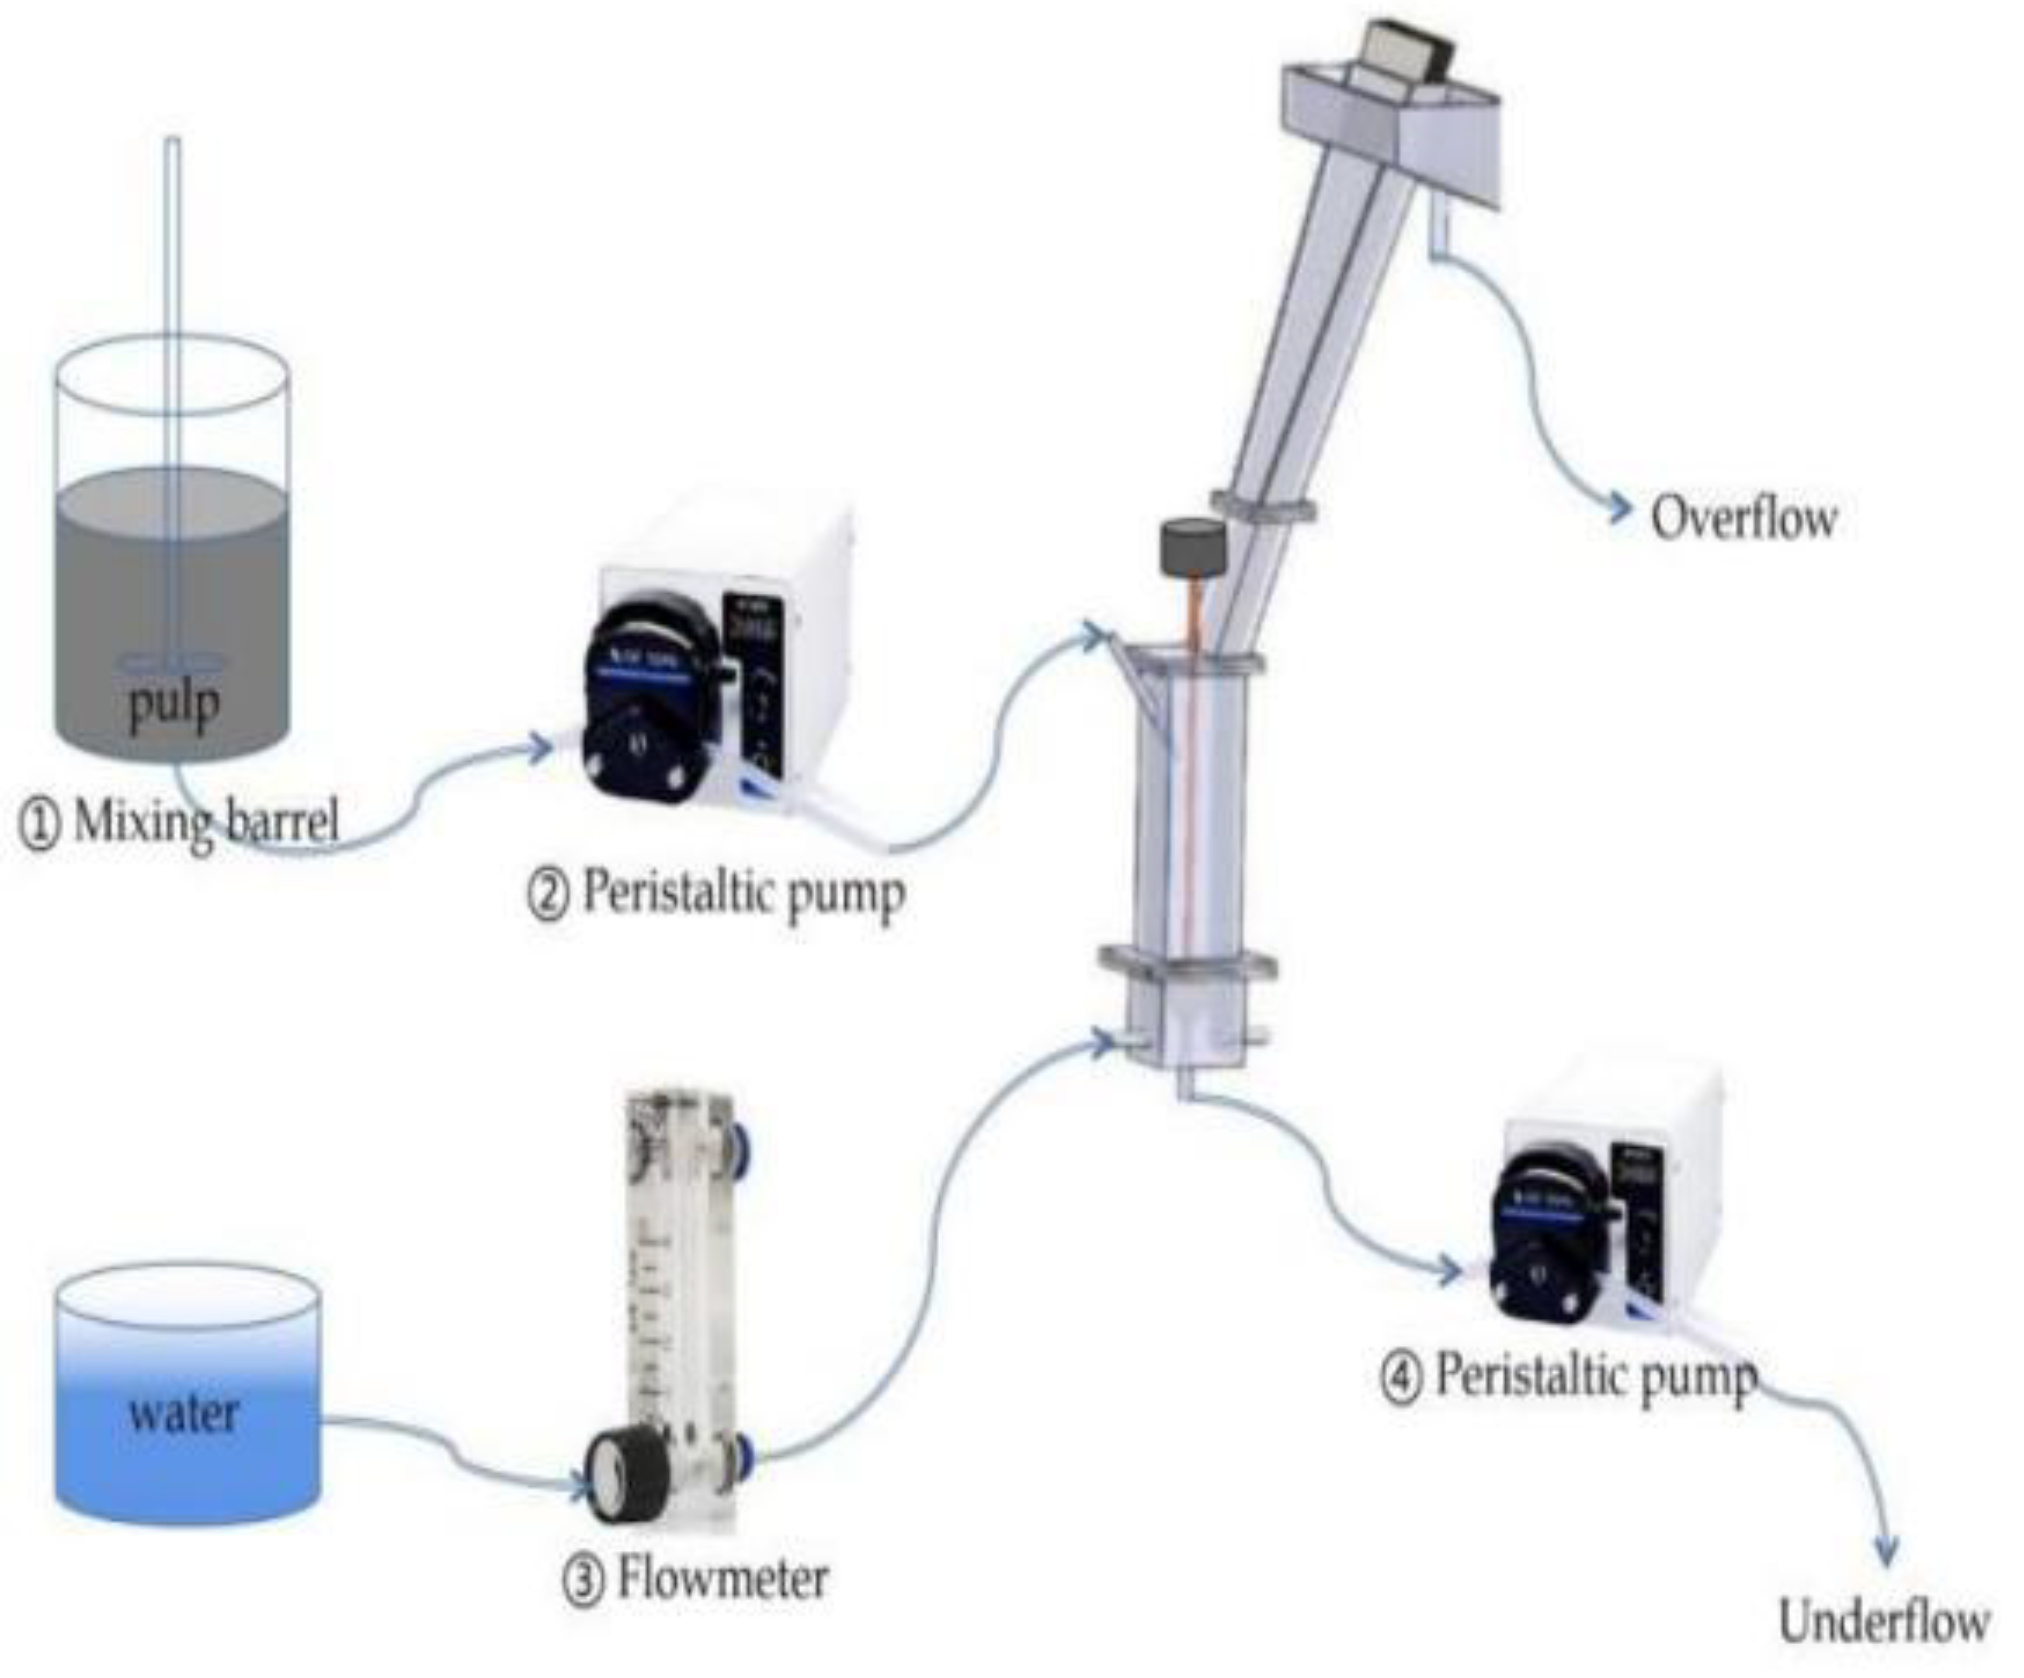
Figure 5.
(a) Overflow particle size; (b) underflow particle size; (c) classification index. Experiment on the effect of ore pulp concentration condition.
Figure 5.
(a) Overflow particle size; (b) underflow particle size; (c) classification index. Experiment on the effect of ore pulp concentration condition.

Figure 6.
(a) Overflow particle size; (b) underflow particle size; (c) classification index. Experiment on the effect of agitation speed condition.
Figure 6.
(a) Overflow particle size; (b) underflow particle size; (c) classification index. Experiment on the effect of agitation speed condition.
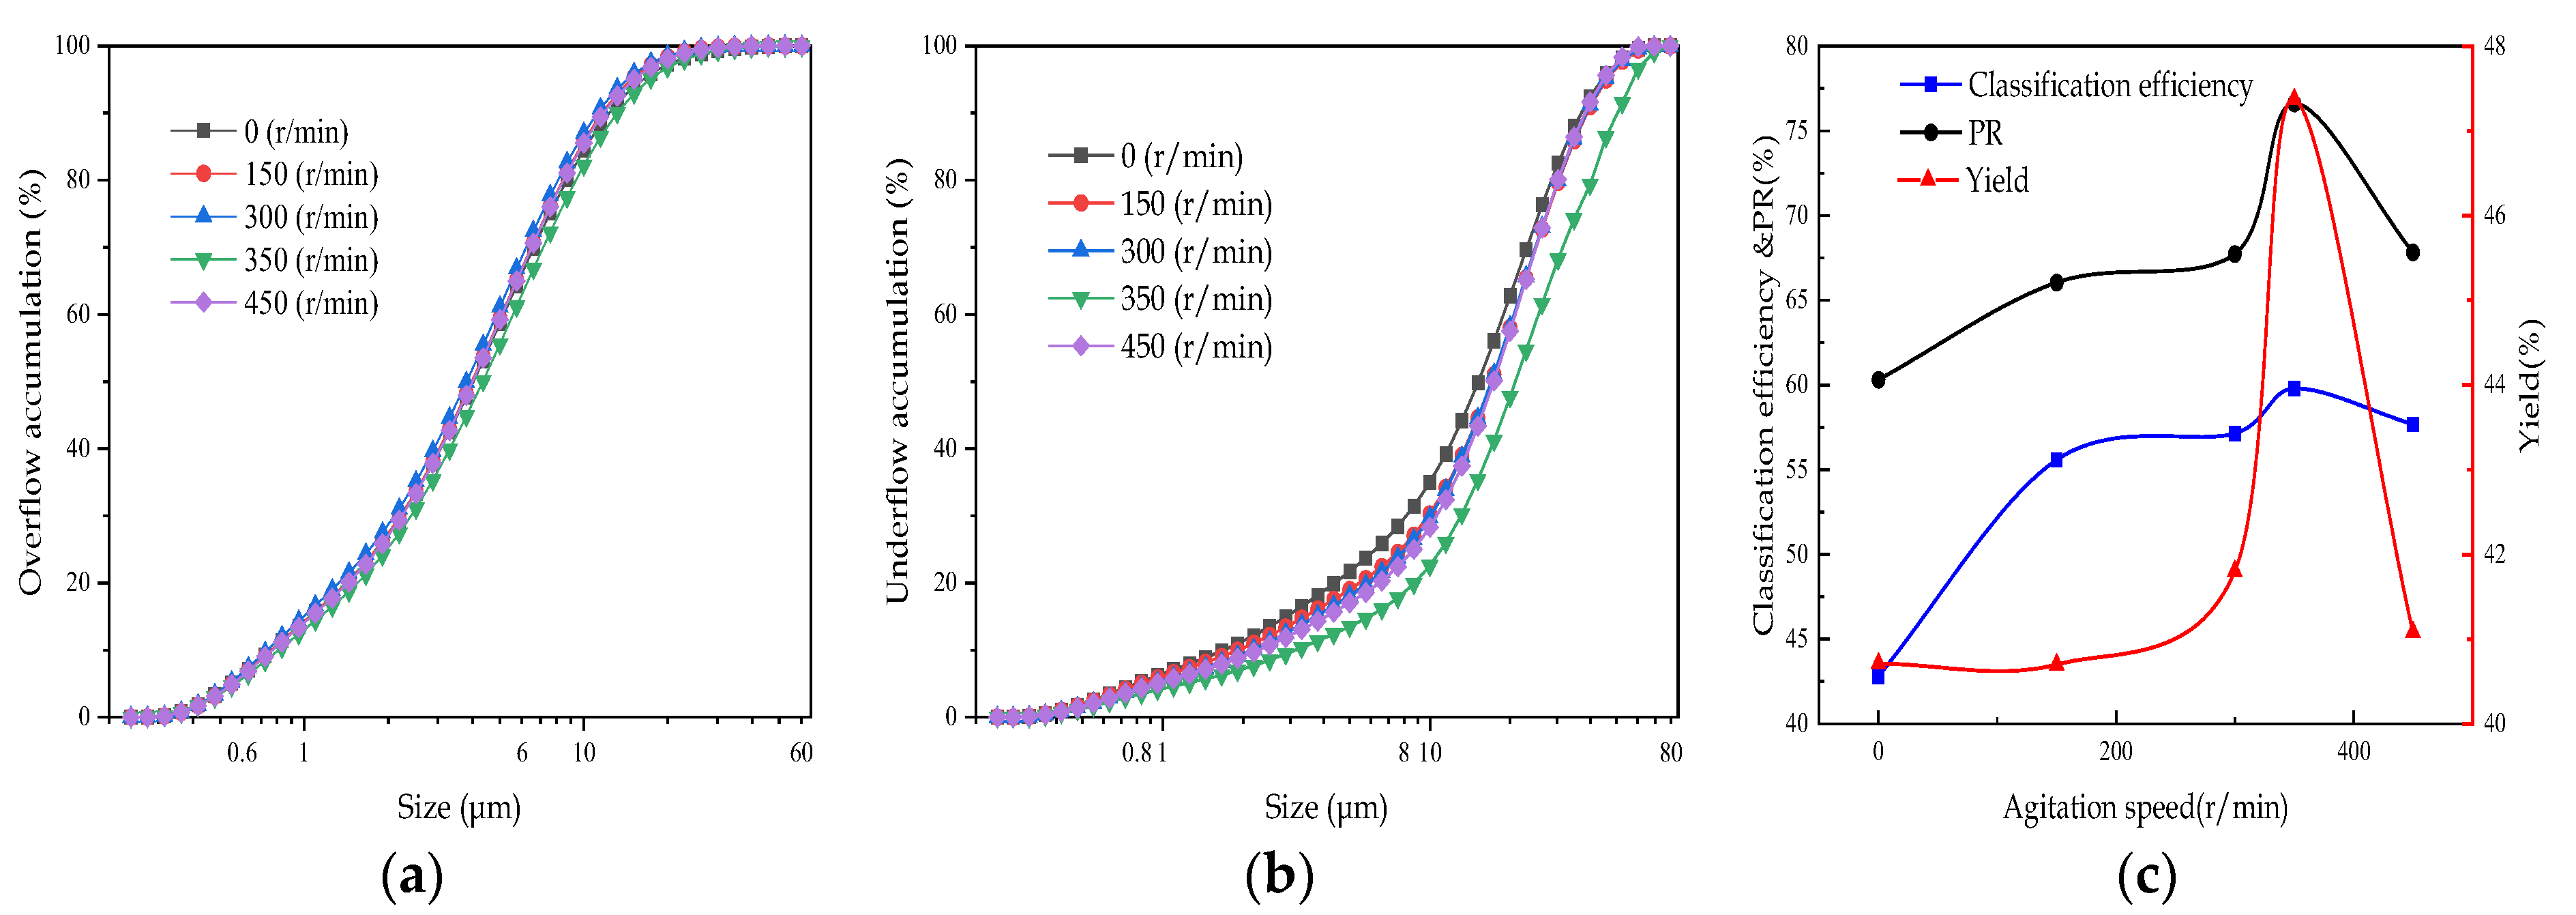
Figure 7.
(a) Overflow particle size; (b) underflow particle size; (c) classification index. Experiment on the effect of feed flux condition.
Figure 7.
(a) Overflow particle size; (b) underflow particle size; (c) classification index. Experiment on the effect of feed flux condition.

Figure 8.
(a) Overflow particle size; (b) underflow particle size; (c) classification index. Experiment on the effect of underflow flux condition.
Figure 8.
(a) Overflow particle size; (b) underflow particle size; (c) classification index. Experiment on the effect of underflow flux condition.

Figure 9.
(a) Overflow particle size; (b) underflow particle size; (c) classification index. Experiment on the effect of fluidization water flux condition.
Figure 9.
(a) Overflow particle size; (b) underflow particle size; (c) classification index. Experiment on the effect of fluidization water flux condition.
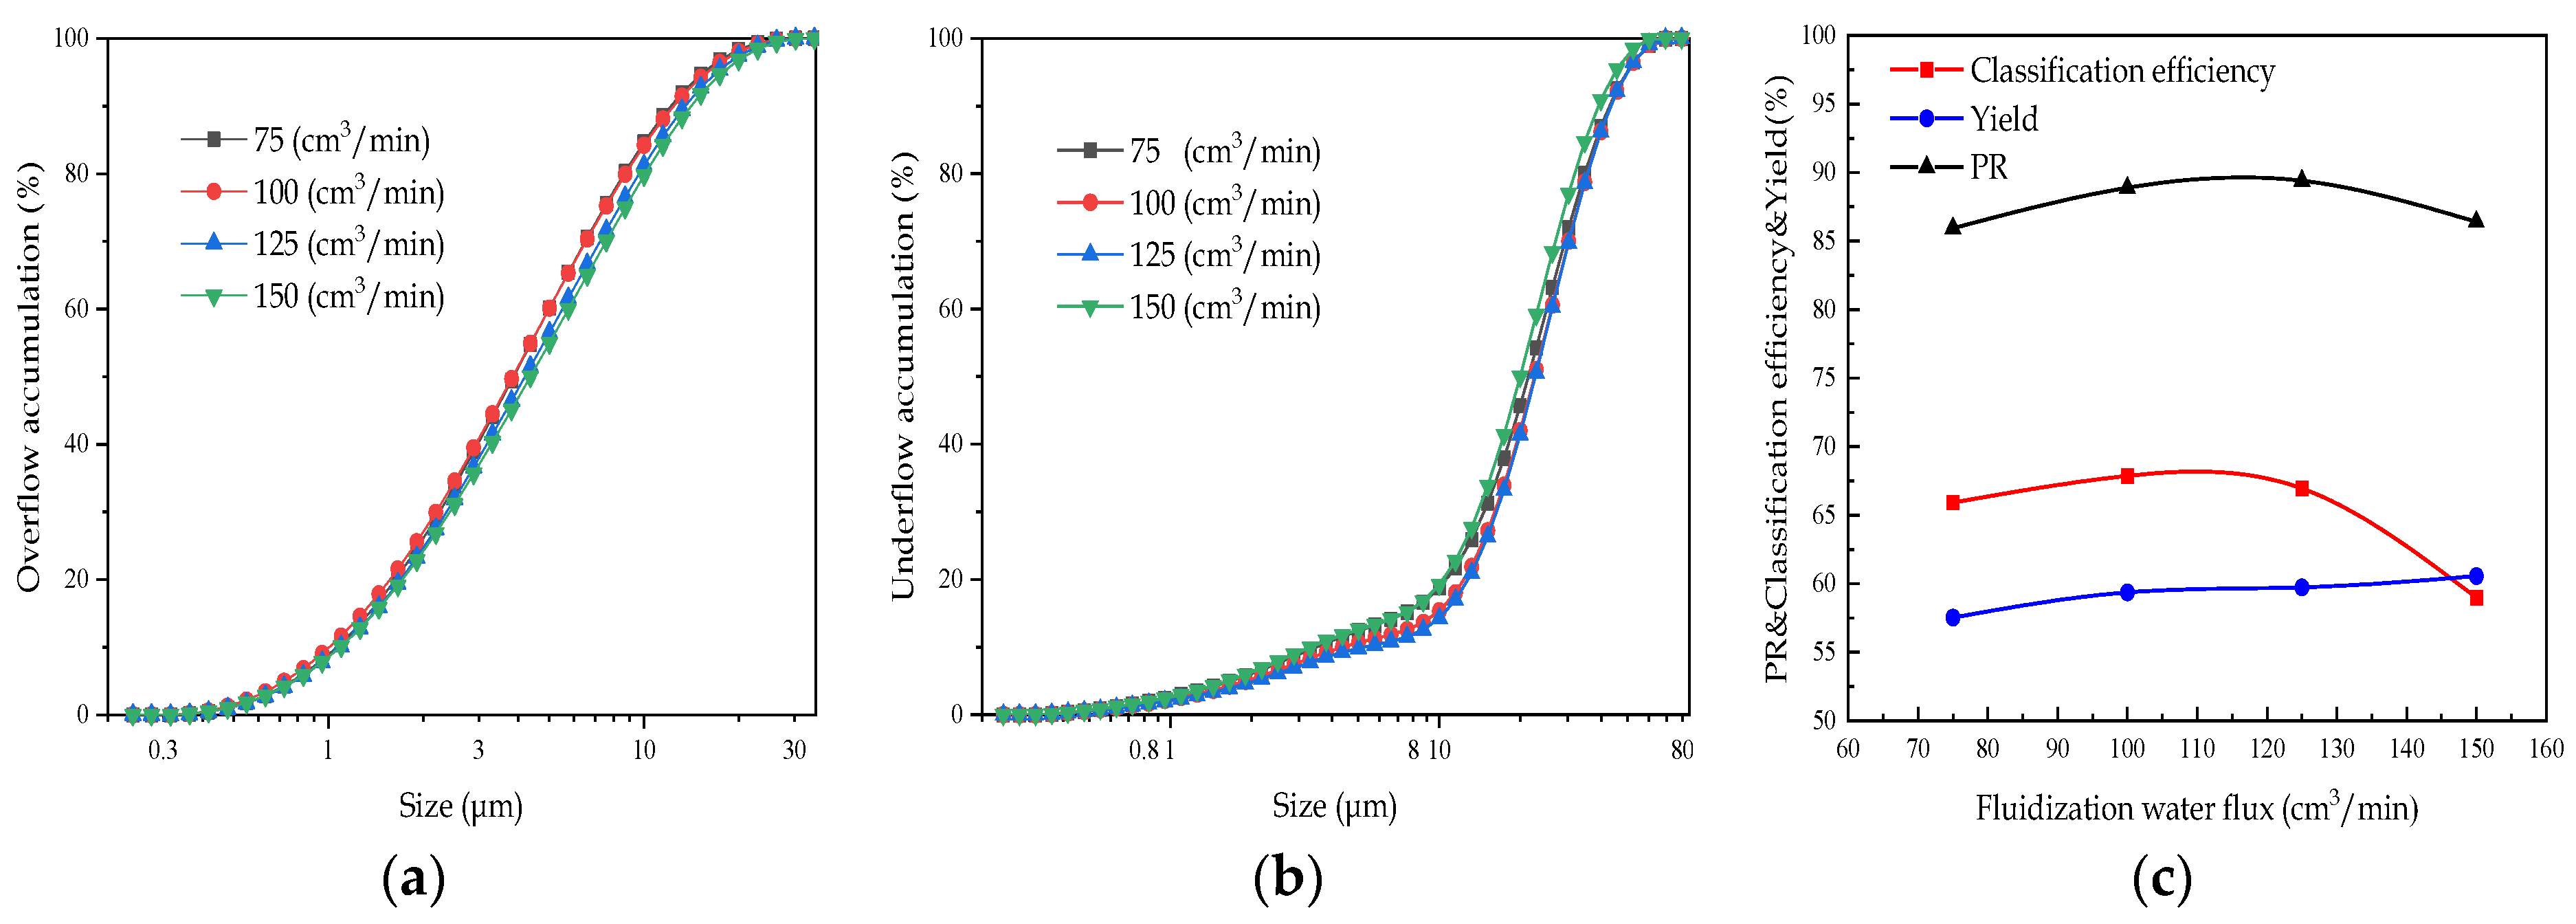
Figure 10.
(a) The accumulation fraction of products; (b) the volume fraction of products. Product particle size analysis.
Figure 10.
(a) The accumulation fraction of products; (b) the volume fraction of products. Product particle size analysis.

Table 1.
Multi-element analysis.
| Element | Content (%) | Element | Content (%) |
|---|---|---|---|
| Si | 26.34 | Mn | 0.1665 |
| Fe | 15.82 | Sr | 0.0311 |
| Al | 6.12 | Cu | 0.0281 |
| Mg | 5.65 | Zn | 0.0170 |
| Ca | 5.62 | Ni | 0.0147 |
| Ti | 4.71 | Sn | 0.0090 |
Table 2.
Factor-level table of single-factor test.
| Experimental Conditions | Conditional Variables | |||
|---|---|---|---|---|
| Ore pulp concentration (%) | 10 | 15 | 20 | 25 |
| Agitation speed (r/min) | 0 | 150 | 350 | 450 |
| Feed flux (ml/min) | 100 | 200 | 300 | 400 |
| Underflow flux (ml/min) | 12 | 16 | 20 | 24 |
| Fluidization water flux (ml/min) | 75 | 100 | 125 | 150 |
Table 3.
Particle size analysis.
| Product | −10 μm Accumulation (%) | d(10) | d(50) | d(90) |
|---|---|---|---|---|
| Feed | 55.22 | 1.401 | 9.455 | 33.947 |
| Overflow | 84.21 | 1.157 | 4.402 | 14.220 |
| Underflow | 15.37 | 5.082 | 25.902 | 49.617 |
Table 4.
Particle metal elements analysis.
| Product (Ti) | Yield (%) | Grade (%) | Recovery (%) |
|---|---|---|---|
| Overflow | 59.36 | 4.028 | 51.08 |
| Underflow | 40.64 | 5.635 | 48.92 |
| Total | 100.00 | 4.681 | 100.00 |
Disclaimer/Publisher’s Note: The statements, opinions and data contained in all publications are solely those of the individual author(s) and contributor(s) and not of MDPI and/or the editor(s). MDPI and/or the editor(s) disclaim responsibility for any injury to people or property resulting from any ideas, methods, instructions or products referred to in the content. |
© 2023 by the authors. Licensee MDPI, Basel, Switzerland. This article is an open access article distributed under the terms and conditions of the Creative Commons Attribution (CC BY) license (https://creativecommons.org/licenses/by/4.0/).
Share and Cite
MDPI and ACS Style
Chen, F.; Gao, Y.; Lu, D.; Liu, Z.; Zhao, Y. Study on the Application of a Reflux Classifier in the Classification of Ultrafine Ilmenite. Minerals 2023, 13, 304. https://doi.org/10.3390/min13030304
AMA Style
Chen F, Gao Y, Lu D, Liu Z, Zhao Y. Study on the Application of a Reflux Classifier in the Classification of Ultrafine Ilmenite. Minerals. 2023; 13(3):304. https://doi.org/10.3390/min13030304
Chicago/Turabian StyleChen, Fulin, Yu Gao, Dongfang Lu, Zhenqiang Liu, and Yan Zhao. 2023. "Study on the Application of a Reflux Classifier in the Classification of Ultrafine Ilmenite" Minerals 13, no. 3: 304. https://doi.org/10.3390/min13030304
Note that from the first issue of 2016, this journal uses article numbers instead of page numbers. See further details here.