

High-Speed Dynamic Camera Analysis of the Hematite Floc–Bubble Mineralization Process


1
College of Mining Engineering, North China University of Science and Technology, Tangshan 063009, China
2
Collaborative Innovation Center of Green Development and Ecological Restoration of Mineral Resources, Tangshan 063009, China
*
Author to whom correspondence should be addressed.
Minerals 2023, 13(7), 964; https://doi.org/10.3390/min13070964
Submission received: 20 June 2023
/
Revised: 12 July 2023
/
Accepted: 18 July 2023
/
Published: 20 July 2023
(This article belongs to the Topic Green Low-Carbon Technology for Metalliferous Minerals)
Abstract
:The most efficient method for recovering microfine-grained hematite ore is flocculation flotation. Because the flocculation–bubble mineralization process in flocculation flotation has yet to be well investigated, a series of experimental investigations on hematite flocculation–bubble were conducted to better understand the hematite flocculation–bubble interaction process. The results show that as the flocculant size increases, the sliding time of the flocculant to the bottom of the bubble shortens, and the change in the instantaneous dynamic velocity is slower when the diameter of the fixed bead is 544.52 μm, which is more favorable to flocculant adhesion on the bubble surface. When the bubble diameter is 544.52 μm and the floc diameter is 39.65 μm, the shortest time is 49.5 ms, and the maximum value of instantaneous velocity is 28.67 μm·ms−1. According to the force analysis of the floc on the bubble surface, when the particle size of the floc is 39.65 μm and the bubble diameter is 544.52 μm, the desorption force is 4.99 × 10⁻³ mN·m−1 larger, and the adhesion force is 7.08 × 10⁻⁴ mN·m−1 smaller. The smaller Bond constant Bo′ is 0.14. In that moment, the flocs in the sodium solution are very stable.
1. Introduction
Microfine-embedded minerals typically need to be finely ground to achieve a better monomer dissociation. The microfine-mineral beneficiation method is primarily realized by the flotation process [1,2]. With the increasing exploitation of mineral resources, the development and utilization of these difficult-to-select, microfine-embedded minerals have gradually become on the agenda. Because it is difficult to effectively select minerals with particle sizes below 10 μm because of the large specific surface area of microfine minerals, low adhesion probability, high solubility in water, high adsorption of pharmaceuticals, heterogeneous coalescence between different mineral grains, mineral mud cover, and severe mechanical inclusions, flocculation of microfine minerals is necessary to form flocs for flotation [3,4].
The flocculation flotation of microfine particles has been used in practice, and much research has been conducted on the theory of flotation bubble mineralization. However, the interaction between floc particles and bubbles is still in the early stages of research, and the conditions affecting bubble mineralization still need to be thoroughly studied [5,6,7]. The complex physicochemical process of bubble–particle interaction in flotation systems is influenced by the flotation system agent as well as bubble size [8], bubble dispersion [9], and particle size [10].
The likelihood of a collision between flocs and bubbles is mainly influenced by their sizes, which are directly related to floc size and inversely proportional to bubble size [11]. Because such attachment demands a suitably wide contact angle and the hydrophobicity of the particle surface gradually increases with an increasing contact angle, not all flocs adhere to the bubbles [12]. Floating tiny and ultrafine particles is challenging because of the low bubble–particle collision efficiency [13]. The efficiency of particle–bubble collisions must be increased to improve fine particle flotation [14]. Numerous experimental findings have demonstrated that the low sorting efficiency of micro fines is due to their low likelihood of colliding with bubbles. The small mass, low inertia, and high specific surface area of microfine minerals make it difficult for them to penetrate the flow line and collide with bubbles when subjected to fluid viscous forces, as it is simple to follow the flow line around the bubbles and bypass the bubbles. In addition to bubble collision, the size of flocs and bubbles significantly impacts how well they adhere to one another [15,16,17,18]. Therefore, thoroughly understanding bubble–particle interactions is essential for raising flotation sorting efficiency.
Using high-speed dynamic cameras, the motion of hematite flocs on bubble surfaces is evaluated in this study to reveal the motion velocity and sliding trajectory of flocs with various particle sizes and various bubble diameters and provide a scientific foundation for optimizing and improving the flotation process.
2. Materials and Methods
2.1. Materials
(1) Experimental raw materials
The raw materials used in the experiment were pure hematite. The results of a chemical multi-element analysis carried out on the experimental raw materials are displayed in Table 1.
As shown in Table 1, the whole iron grade of the test raw material is 67.90%, and the main impurities are MgO, Al2O3, etc. The content of other components is relatively small.
Figure 1 shows the results of the laser particle size analysis performed on the experimental material. The volume-weighted average particle size was 10.06 μm.
(2) Preparation of flocculants
After 30 min of ultrasonic treatment, the experimental materials were put into a magnetic stirrer at 800–900 r/min for 10 min, and then different concentrations of sodium oleate solution were added into the beaker and stirred for 2 min to produce hematite flocs with particle sizes of 32.96, 34.80, 36.65, 38.48, and 39.65 μm. The physical properties of the prepared flocs were analyzed, and the results are shown in Table 2.
2.2. Test Observation Device
The experimental observation system consists of a magnetic stirrer, peristaltic pump, high-speed camera, light source, fine-tuning platform, observation room, and computer, as shown in Figure 2. During the flocculation process, a magnetic stirrer was used to provide mechanical stirring. A peristaltic pump was used to take samples from the stirring tank to maintain the original shape of the floc. By adjusting the position of the observation chamber, we changed the camera to a suitable focal length to achieve the most precise image for observation, and the computer outputted the observed floc images. In the experiment, a TS-3 high-speed camera was used. After tweaking the parameters, it was discovered that when the shutter speed was 5458 ms and the FPS was 183, the experimental process was clear and complete. The TS-3 high-speed camera can capture 183 images per second, with a time gap of around 0.5 ms between shots.
2.3. Image Processing
The camera’s photos needed to be processed using software to depict the mineralization of the hematite flocs and bubbles accurately because of the influence of the experimental apparatus. The center of the flocs and bubbles was used as the object of study, and the position change of the flocs during the sliding on the bubble surface was measured using Image-Pro Plus and protractor software. The image processing process for the flocs on the bubble surface was as follows: the merge files tool of Sequence in the Image-Pro Plus software was opened to import a set of images and pre-process them. In Figure 3, the measurement parameters are displayed.
Figure 3 shows that after a drop distance of H, the hematite flocs discharged via the feed aperture collide with air bubbles. In the diagram, R stands for the bubble diameter, A for the floc’s lateral position on the bubble surface, C for its longitudinal position on the bubble surface, θ for the floc’s angle concerning the bubble center, and v for the floc’s instantaneous sliding velocity.
3. Floc–Bubble Mineralization Process
When the flocs’ particle sizes and the bubbles’ diameters vary, the flocs’ sliding states change. After the collision between flocs and bubbles, the liquid film on the bubbles’ surfaces extends to the flocs’ surfaces to “wrap” the flocs. In contrast, the sinking process of the flocs is not visible because the wrapping process covers it, and the outline of the flocs can be fully photographed, as shown in Figure 4.
3.1. Variation in the Position of Flocs of Different Particle Sizes on the Bubble Surface
The sliding trajectories of hematite flocs of various particle sizes on the bubble surface differ. When the downy particle size is high, the inertial force is large, the flocculent settles faster, and an inertial collision becomes more critical. The greater the particle size, the quicker the flocs move in a circular motion, and the flocs are the first to slide to the maximum lateral and minimum longitudinal positions before moving to the bottom of the bubble and stabilizing. Figure 5 depicts the movement of hematite flocs on the bubble surface at a bubble diameter of 407.59 μm.
The greater the particle size of the flocs when they collide with the bubbles, the shorter the duration spent on the bubble surface, as seen in Figure 5a. The flocs with particle sizes of 39.65 μm, 38.48 μm, and 36.65 μm pass through the maximum lateral position at t = 16.5–22 ms; the flocs with particle sizes of 34.80 μm and 32.96 μm pass through the leading lateral position at t = 22–27.5 ms. At t = 22–27.5 ms, flocs with particle sizes of 34.80 μm and 32.96 μm pass through the maximum lateral position.
The longitudinal position of the flocs remains static for some time after colliding with the bubbles, as shown in Figure 5b, and the greater the particle size of the flocs, the shorter the holding period. The flocs with particle sizes of 39.65 μm, 38.48 μm, and 36.65 μm pass through the longitudinal position of zero at t = 16.5–22 ms, while the flocs with particle sizes of 34.80 μm and 32.96 μm pass through the longitudinal part of zero at t = 22–27.5 ms. The flocs with particle sizes of 34.80 μm and 32.96 μm pass through the longitudinal zero position at t = 22–27.5 ms, while the flocs with particle sizes of 32.96 μm pass through at t = 27.5–33 ms.
From Figure 5c, it is clear that from t = 0 to 11 ms, there is slight angular variation in the sliding trajectory of flocs, and from t = 11 to 44 ms, there is a lot of angular variance. The sliding circuits of flocs with particle sizes of 39.65 μm and 38.49 μm exhibit 180° of angular variation from t = 49.5 ms, and those of flocs with particle sizes of 36.65 μm and 34.80 μm exhibit 180° of angular deviation from t = 55 ms. The flocs with 36.65 μm and 34.80 μm particle sizes have an angle of 180° at t = 55 ms, and those with 32.96 μm particle sizes have an angle of 180° at t = 60.5 ms. From t = 0 to 11 ms, it is clear that the slope of the sliding curve is smaller for smaller floc sizes. The flotation efficiency is decreased because the gravity is lower, and the time it takes to reach the bottom of the bubble is longer when the floc size is tiny.
Figure 5d shows that the instantaneous sliding velocity of the floc changes more quickly at t = 5.5–11 ms the larger the floc’s particle size; at t = 11–16.5 ms, the speed of the floc significantly increases; at t = 16.5–22 ms, it decreases again; at t = 33–38.5 ms, it increases slightly; and at t = 38.5.5–44 ms, the instantaneous sliding velocity of flocs somewhat increases. At t > 44 ms, the fast sliding speed of flocs generally tends to decrease. The stability on the bubble surface is weaker, the time spent is longer, the fluctuation range of the instantaneous sliding velocity is more extensive, and flocs’ particle size is smaller.
3.2. Variation in Floc Position on the Surface of Bubbles with Different Diameters
Assuming a floc size of 39.65 mm, a drop height of 21 mm, and a collision angle of 0°, Figure 6 depicts the motion position of hematite flocs on the surface of bubbles with diameters of 407.59 μm, 544.52 μm, and 636.15 μm.
According to Figure 6a, for bubble diameters of 636.15 μm, 544.52 μm, and 407.59 μm, the flocs glide through the maximum lateral position at t = 16.5–27.5 ms and require 55, 49.5, and 60.5 ms, respectively, to reach the bottom of the bubble.
The greater the bubble diameter, the shorter the time for the flocs to maintain their longitudinal position following the impact, as seen in Figure 6b. At t = 16.5 ms, the flocs on the bubble’s surface with a diameter of 407.59 μm are in the same longitudinal position as those on the bubble’s surface with a diameter of 544.52 μm. The larger the diameter of the bubble, the faster the change in the transverse position of the floc from t = 0 to 11 ms and the slower the difference in longitudinal position, which is due to the larger diameter of the bubble, the gentler curvature, and the more significant component of the transverse support force on the floc.
Figure 6c shows that the angle of the floc on the bubble’s surface with a diameter of 407.59 μm is 180° at t = 60.5 ms; the angle of the floc on the bubble’s surface with a diameter of 544.52 μm is 180° at t = 49.5 ms; and the angle of the floc on the bubble’s surface with a diameter of 636.15 μm is 180° at t = 55 ms. When the bubble had a diameter of 544.52 μm, the flocs had the shortest movement time on the bubble’s surface.
The higher the bubble diameter, the greater the fluctuation range of the instantaneous sliding velocity of the flocs on the bubble surface, as shown in Figure 6d. For a bubble diameter of 636.15 μm, the fast sliding speed of flocs is 35.30 μm·ms−1 at t = 16.5 ms; for a bubble diameter of 544.52 μm, the instantaneous sliding velocity of flocs is 30.56 μm·ms−1 at t = 22 ms; and for a bubble diameter of 407.59 μm, the instantaneous sliding velocity of flocs is 30. At t = 11 ms, flocs’ maximum instantaneous sliding velocity is 18.56 μm·ms−1 for a bubble diameter of 407.59 μm. Because the flocs on the bubble with a diameter of 544.52 μm took the least time to slide over the bubble’s surface and the fluctuation of the instantaneous sliding velocity was reduced, the bubble with a diameter of 544.52 μm was deemed better suited for flotation.
4. Study on the Mechanism of Hematite Flocculant–Bubble Mineralization
4.1. Analysis of the Forces on the Surface of the Flocs on the Bubble
The forces on the bubble’s surface can be classified as adhesion or desorption forces from a kinetic standpoint. The forces impacting the floc on the bubble surface are the combined forces of adhesion and desorption, and the Bond constant Bo′ (ratio of desorption to adhesion) is the parameter determining floc–bubble stability, which can be described with Equation (1):
The detach and attach forces can be expressed as:
where FDetach is the detach force, mN·m−1; FAttach is the attach force, mN·m−1; Fg is the gravitational force of the floc, mN·m−1; Fb is the static buoyancy of the floc immersed in the liquid, mN·m−1; Fd is the additional separation force, mN·m−1; Fσ is the capillary pressure of the bubble, mN·m−1; Fca is the capillary force at the three-phase interface, mN·m−1; and Fhyd is the liquid static pressure in the region of the three-phase contact line, mN·m−1.
The hematite flocs were thought to be spherical because their shape resembled a sphere during the experiments. The directions of these forces are depicted in Figure 7 [19]. In 1999, Heindel T. J. summarized the directions of Fg, Fb, Fd, F, Fca, and Fhyd.
Because the static buoyancy of the floc submerged in the liquid and the gravity of the floc are both vertical, as can be seen in Figure 7, the two forces are combined to form the apparent gravity Fwt, whose expression is
where Rp is the radius of the floc, cm; ρp is the floc body density, g·cm−3; ρl is the density of the liquid, g·cm−3; and g is the acceleration of gravity, 10 g·s−2.
Equations (2) and (3) are divided to calculate the forces on the right side of the equal sign as follows:
where ac is the fluid acceleration, m·s−2; ε is the turbulent energy density, m2·s−3; θ is the contact angle, °; and σ is the surface tension, mN·m−1.
The experiments in this work were carried out in a system with a stationary solution and no additional separation forces. The effect of liquid static pressure, also disregarded in this paper’s discussion, is another factor that many researchers will overlook. As a result, the adhesion force on the three-phase contact line solely consists of the capillary force. Next, the adhesion and detachment forces are expressed as follows:
The Bond constant Bo′ is denoted using Equations (9) and (10), and it is supplied by:
by substituting σ1 = 66.7 mN·m−1, σ2 = 25.1 mN·m−1, ρl = 1 g/cm3, RB = 203.795 μm, 272.26 μm, 318.075 μm, RP = 32.96 μm, 34.80 μm, 36.65 μm, 38.48 μm, and 39.65 μm. Substituting the above equation, we then calculated the results as shown in Figure 8 and Figure 9.
According to Figure 8, the diameter of the fixed bubble is 544.52 μm, and the Bo′ in sodium oleate solution is 0.14177 when the flocculant particle size is 39.65 μm and 0.118665 when it is 32.96 μm. Bo′ rises as the flocculant particle size is increased. As a result, the stability of the bubbles, the flocs’ contact angle, and the adhesion and desorption forces of the flocs all rise as the flocs’ particle size increases in sodium oleate solution. In the same liquid, Bo′ increases with the increase in floc particle size, and Bo′ increases with the increase in bubble diameter, because the adhesion force of the floc is independent of the bubble diameter, and the desorption force decreases as the bubble diameter increases. Additionally, Bo′ increases with the increase in the particle size of the floc because the desorption force decreases as the bubble diameter increases.
As seen in Figure 9, the adhesion force to the floc increases as the particle size decreases. The adhesion force in sodium oleate solution is 2.16 × 10³ mN·m−1 when the flocculant size is 32.96 μm. The adhesion force in sodium oleate solution is 4.17 × 10³ mN·m−1 when the flocculant size is 36.65 μm. The adhesion force in sodium oleate solution is 4.99 × 10³ mN·m−1 when the flocculant size is 39.65 μm. The desorption force in sodium oleate solution rises as the floc diameter does. On the surface of a bubble with a diameter of 544.52 μm, a floc with a diameter of 32.96 μm is subjected to an adhesion force of 2.56 × 10⁴ mN·m−1, and on the surface of a bubble with a diameter of 636.15 μm, it is subjected to an adhesion force of 2.17 × 10⁴ mN·m−1. In addition, as the floc grows, its desorption force and the speed at which it slides across the bubble’s surface grow.
4.2. Collision–Adhesion Process of Flocs and Bubbles
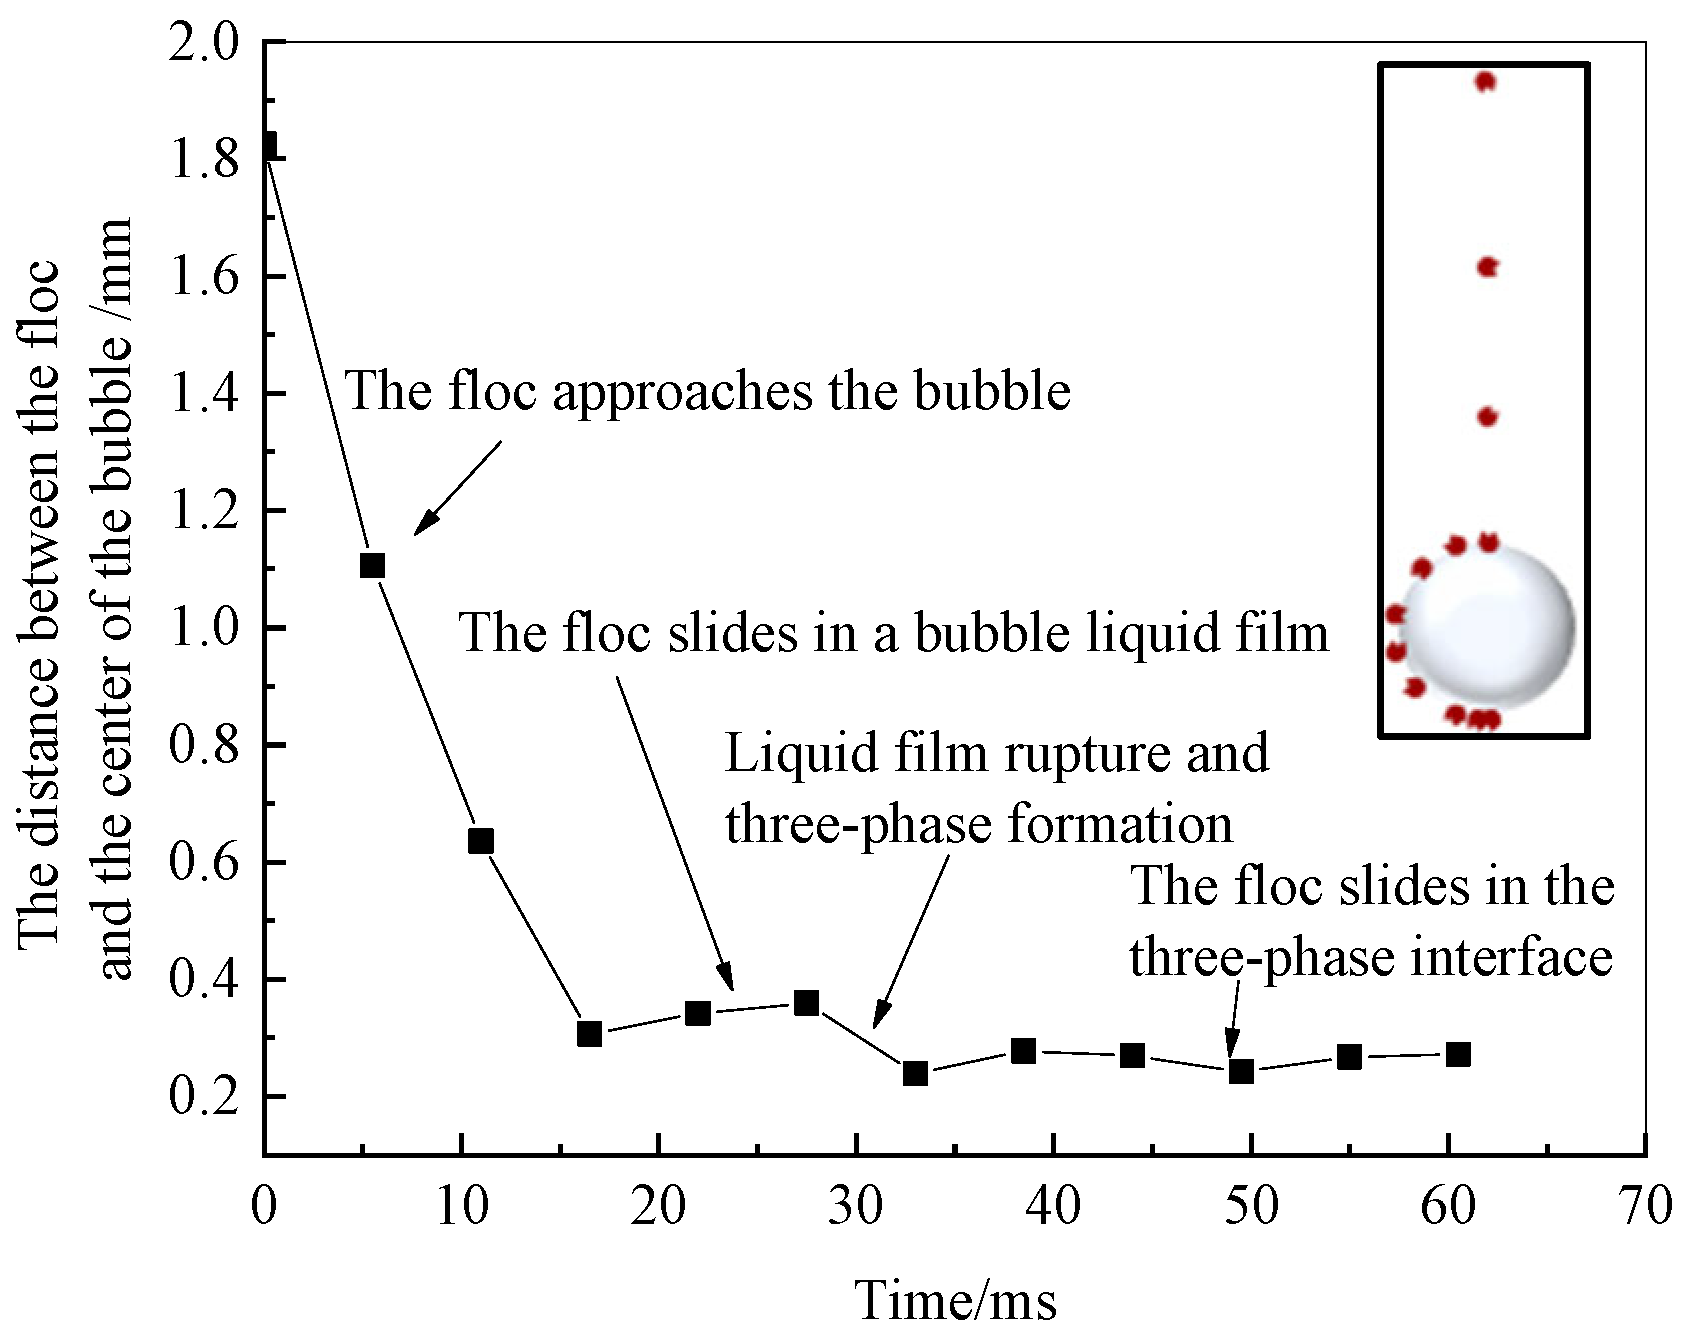
Figure 10 depicts the adherence of a hematite floc with a particle size of 39.65 microns to the surface of a bubble with a diameter of 544.52 μm. In Figure 11, the distance between the flocs and the bubble center is depicted, beginning at 1.83 mm (t = 0 ms) from the bubble center during the falling process.
As seen in Figure 10, the liquid layer on the bubble’s surface quickly stretches to the floc’s surface to “wrap” the particles when the floc and bubble collide. As a result, the floc’s sinking process is obscured by the wrapping process. In the diagram, the liquid film between the particles and the bubbles gradually becomes more apparent (brighter and larger), yet the shape of the particles is always clearly discernible. The flocs flip as they come into contact with the bubbles because of their asymmetrical design, stabilize on the bubble surface following the flip, and then glide along the bubble surface.
Figure 11 depicts the process by which a single flocculate slides to the bottom of the bubble after 60.5 ms, beginning 1.83 mm from the bubble’s center (at this point, t = 0 ms). The distance between the floc and the center of the bubble is measured during this procedure. According to Figure 11, the flocs have the smallest distance of 0.27 mm from the bubble’s center at t = 44 ms. It appears that a stable three-phase wetting periphery is formed between the flocs and the surface of the bow at this point; as the flocs gradually approach the bubble and collide, the distance from the center of the bubble decreases after impacting the surface of the bubble, and the flocs slide along the outer edge of the bubble to the bottom of the bubble and stabilize after buffering.
In summary, there are three stages to the floc migration process: (1) Before impacting the bubble surface, the floc’s radial position rapidly changes, simulating the precise settling movement of particles in solution; (2) the floc’s movement slows down as it comes to touch the bubble’s surface, and the longitudinal position stays the same for a while. At this point, the liquid film covering the bubble’s surface encloses the portion of the particle touching it, enabling the particle to slip through the liquid film between the two; (3) because this floc is hydrophobic, the liquid bubble film ruptures at this point. This rupture initiates a gas–liquid–solid three-phase contact, which causes an instantaneous change in the floc’s vertical position. This contact typically lasts for about 5.5 ms. A stable three-phase interface forms at this point, and the distance between the floc and the bubble center does not change as the floc slides.
5. Conclusions
- At a fixed bubble diameter of 544.52 μm, as the floc diameter increases, the time it takes for the floc to slide to the bottom of the bubble and stabilize decreases, and the instantaneous dynamic velocity changes more gradually, which is more conducive to the floc adhering to the bubble surface. The floc’s diameter reached 49.5 ms, and its highest instantaneous velocity was 28.67 μm·ms−1.
- The time taken for the floc to adhere to the bottom of the bubble is the shortest and the fluctuation range of the instantaneous sliding velocity of the floc is the smallest with a fixed floc size of 39.65 μm and bubble diameter of 544.52 μm, which make it more likely for the floc to adhere to the bubble surface after the collision.
- After looking into the process of flocs on bubble surfaces, it was discovered that floc particle size RP and bubble width RB are the two key variables influencing the force of particles on bubble surfaces. The desorption force on the flocs is reduced and the Bond constant Bo′ is increased with increasing floc particle size. Conversely, the adhesion force on the flocs increases and the desorption force increases with growing floc particle size.
Author Contributions
J.Z. and F.N. designed the experiments, Y.C. performed the experiments, Y.C. analyzed the data, Z.C. and J.Z. wrote the paper, and F.N. improved the paper. All authors have read and agreed to the published version of the manuscript.
Funding
This research was funded by the National Natural Science Foundation of China (Grant No. 51874135), the Natural Science Foundation of Hebei Province (Grant No. E2022209108).
Data Availability Statement
Data are available on request due to restrictions, e.g., privacy or ethical. The data presented in this study are available on request from the corresponding author. The data are not publicly available.
Conflicts of Interest
The authors declare no conflict of interest.
References
- Panda, L.; Venugopal, R.; Mandre, N.R. Selective flocculation of chromite tailings. Trans. Indian Inst. Met. 2021, 74, 619–628. [Google Scholar] [CrossRef]
- Cheng, G.; Zhang, M.; Li, Y.; Lau, E. Improving micro-fine mineral flotation via micro/nano technologies. Sep. Sci. Technol. 2023, 58, 520–537. [Google Scholar] [CrossRef]
- Yu, P.; Ding, Z.; Bi, Y.; Li, J.; Wen, S.; Bai, S. Surface modification of ilmenite by introducing copper-ammonia ion and its response to flotation in H2SO4-H2O2 system. Miner. Eng. 2021, 171, 107102. [Google Scholar] [CrossRef]
- Li, H.; Liu, M.; Liu, Q. The effect of non-polar oil on fine hematite flocculation and flotation using sodium oleate or hydroxamic acids as a collector. Miner. Eng. 2018, 119, 105–115. [Google Scholar] [CrossRef]
- Chen, S.; Chen, X.; Wan, D.; Yi, X.; Sun, X.; Ji, L.; Wang, G. A lattice Boltzmann study of the collisions in a particle-bubble system under turbulent flows. Powder Technol. 2020, 361, 759–768. [Google Scholar] [CrossRef]
- Dianyu, E.; Zhou, P.; Guo, S.; Zeng, J.; Cui, J.; Jiang, Y.; Kuang, S. Particle shape effect on hydrodynamics and heat transfer in spouted bed: A CFD-DEM study. Particuology 2022, 10, 10–21. [Google Scholar]
- Hassanzadeh, A.; Azizi, A.; Kouachi, S.; Karimi, M.; Celik, M.S. Estimation of flotation rate constant and particle-bubble interactions considering key hydrodynamic parameters and their interrelations. Miner. Eng. 2019, 141, 105836. [Google Scholar] [CrossRef]
- Zhang, F.; Sun, L.; Yang, H.; Gui, X.; Schönherr, H.; Kappl, M.; Cao, Y.; Xing, Y. Recent advances for understanding the role of nanobubbles in particles flotation. Adv. Colloid Interface Sci. 2021, 291, 102403. [Google Scholar] [CrossRef] [PubMed]
- Nikolaev, A.A. Mineralization kinetics of air bubbles with coarse sphalerite particles in brackish solutions of sulfhydryl collectors. J. Min. Sci. 2021, 57, 1025–1032. [Google Scholar] [CrossRef]
- Samygin, V.D. Mineralization kinetics of air bubbles allowing for the particle detachment and time of buoying of aggregates. Russ. J. Non-Ferr. Met. 2016, 57, 389–394. [Google Scholar] [CrossRef]
- Nikolaev, A.A.; Petrova, A.A.; Goryachev, B.E. Pyrite grain and air bubble attachment kinetics in agitated pulp. J. Min. Sci. 2016, 52, 352–359. [Google Scholar] [CrossRef]
- Dai, Z.F.; Fornasiero, D.; Ralston, J. Particle–bubble collision models—A review. Adv. Colloid Interface Sci. 2000, 85, 231–256. [Google Scholar] [CrossRef] [PubMed]
- Zhang, F.; Cao, Y.; Yan, X.; Wang, L.; Xu, Y. A study of bubble mineralization by modified glass microspheres based on a high-speed dynamic microscopic test system. Minerals 2019, 9, 350. [Google Scholar] [CrossRef] [Green Version]
- Mohammadi, M.; Nazari, M.; Kayhani, M.H.; Ahmadi, G. Experimental study and visualization of the particle-bubble collision process. J. Appl. Mech. Tech. Phys. 2022, 63, 903–913. [Google Scholar] [CrossRef]
- Arriagad, S.; Jaques, A.; Vinnett, L.; Acuña, C. A modified Yoon and Luttrell model for predicting the efficiency of particle-bubble collision. Powder Technol. Int. J. Sci. Technol. Wet Dry Part. Syst. 2020, 361, 990–994. [Google Scholar] [CrossRef]
- Yao, N.; Liu, J.; Sun, X.; Liu, Y.; Chen, S.; Wang, G. A rational interpretation of the role of turbulence in particle-bubble interactions. Minerals 2021, 11, 1006. [Google Scholar] [CrossRef]
- Brozek, M. Probability of particle-bubble collision in pneumo-mechanical flotation cell. Arch. Metall. Mater. 2010, 55, 293–304. [Google Scholar]
- Hassanzadeh, A.; Kouachi, S.; Hasanzadeh, M.; Çelik, M. A new insight to the role of bubble properties on inertial effect in particle–bubble interaction. J. Dispers. Sci. Technol. 2016, 38, 953–960. [Google Scholar] [CrossRef]
- Heindel, T.J. The fundamentals of flotation deinking. Atlanta Ga. Inst. 1999, 82, 23–36. [Google Scholar]
Figure 1.
Results of particle size analysis of raw materials.

Figure 2.
Experimental apparatus diagram.
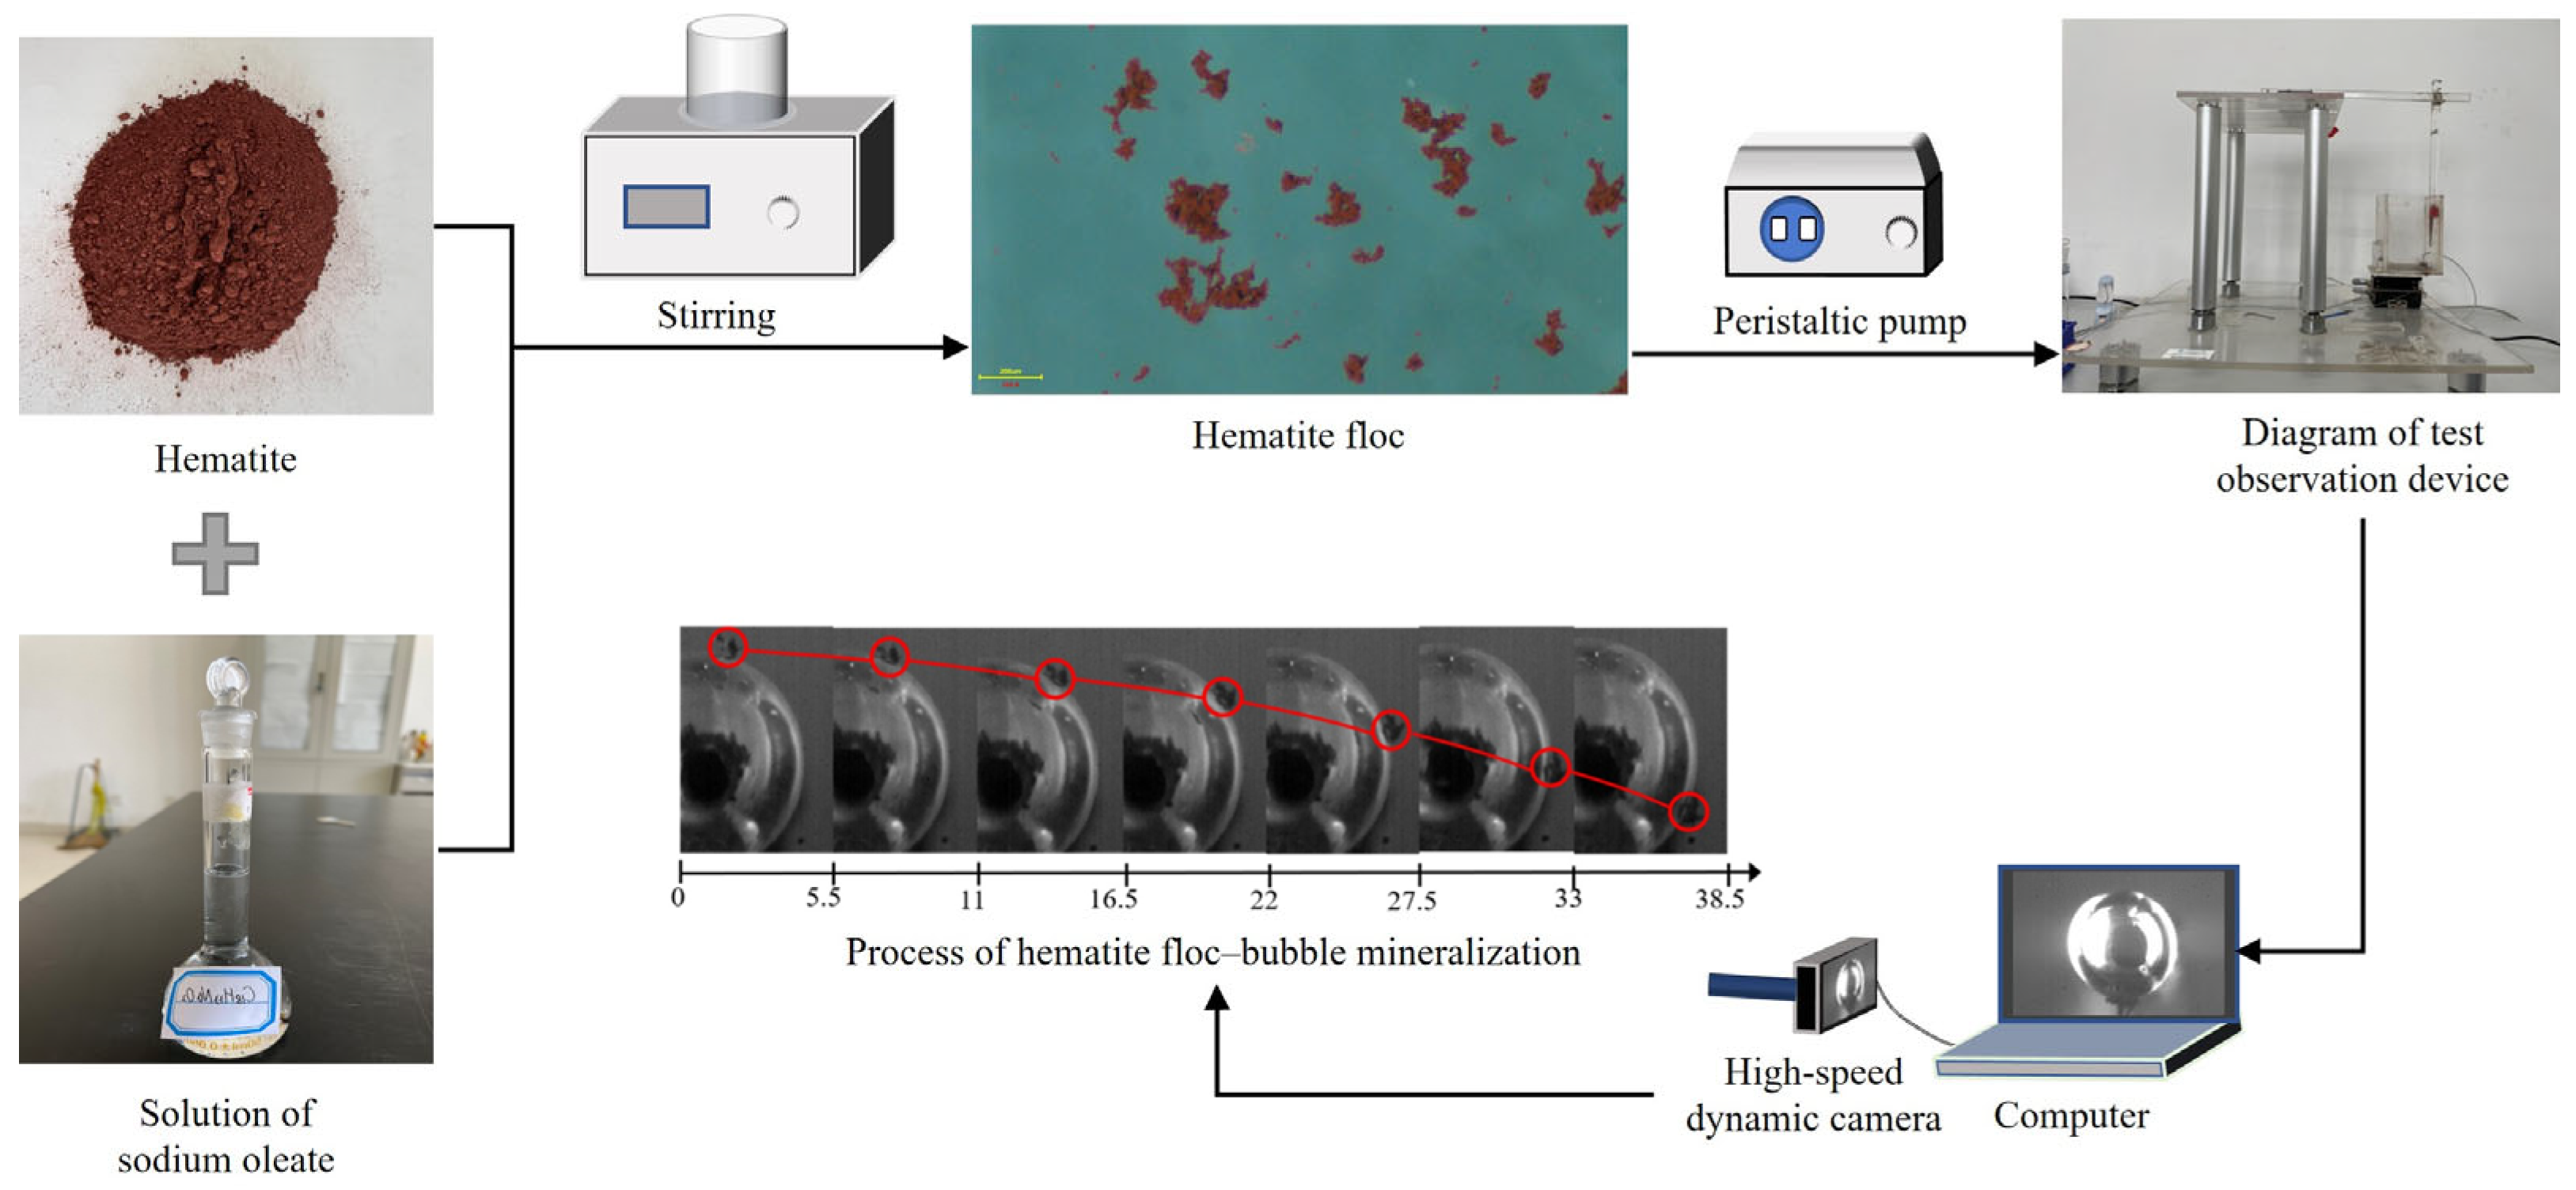
Figure 3.
Diagram of measurement parameters.
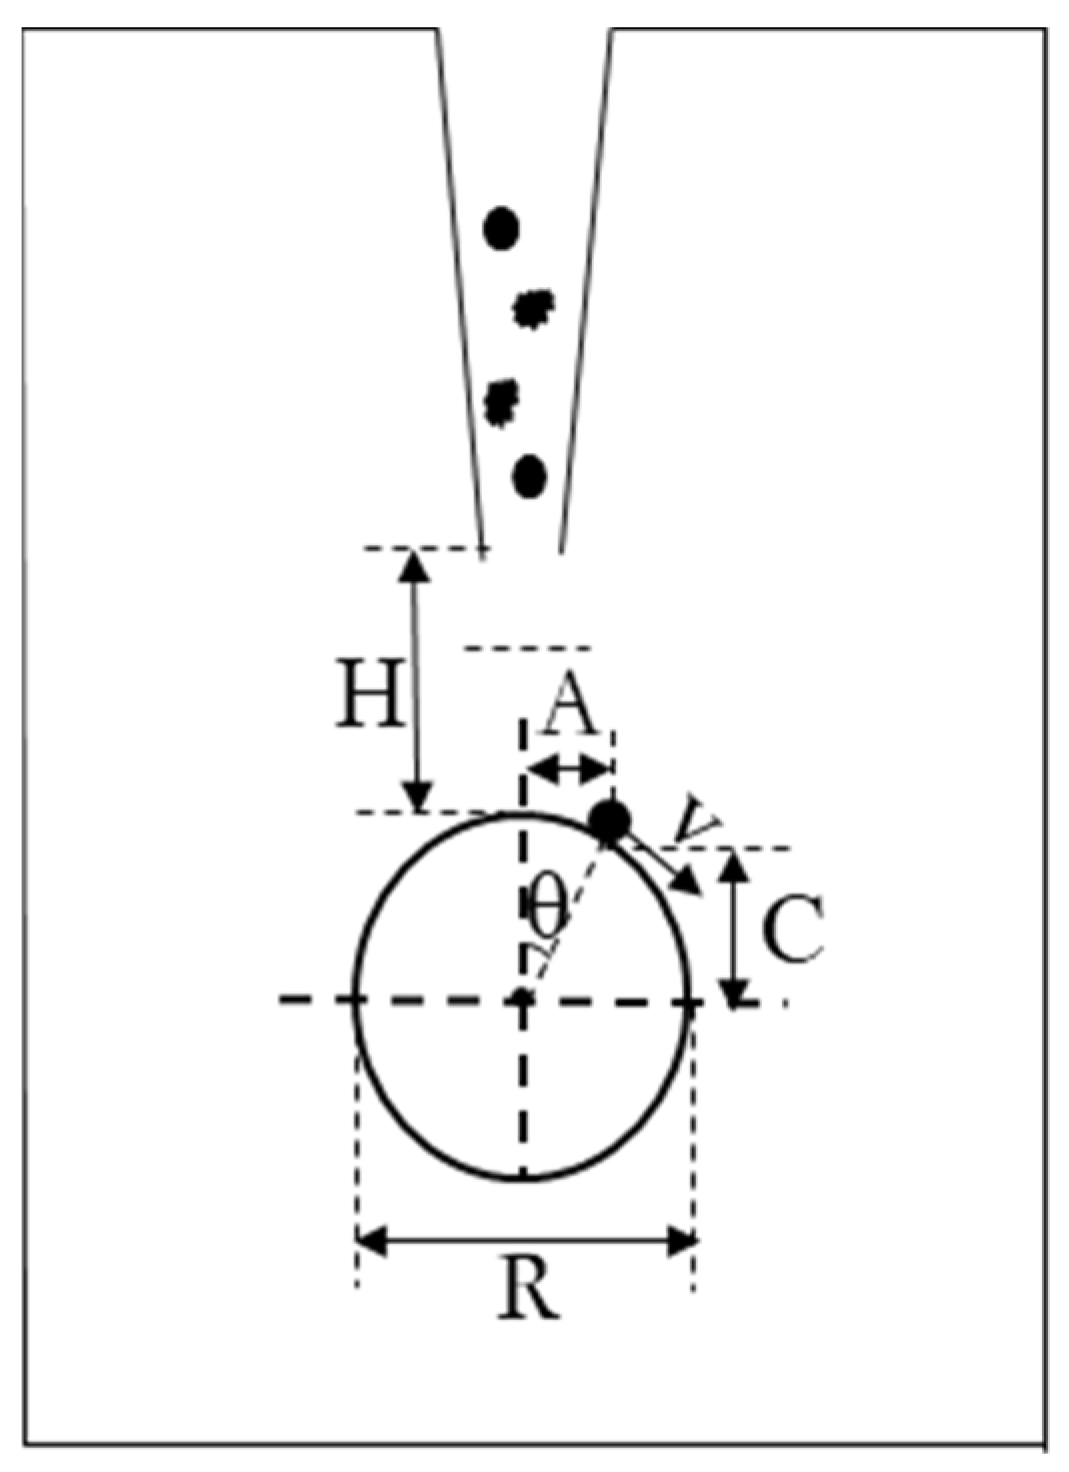
Figure 4.
State of the floc on the bubble surface.
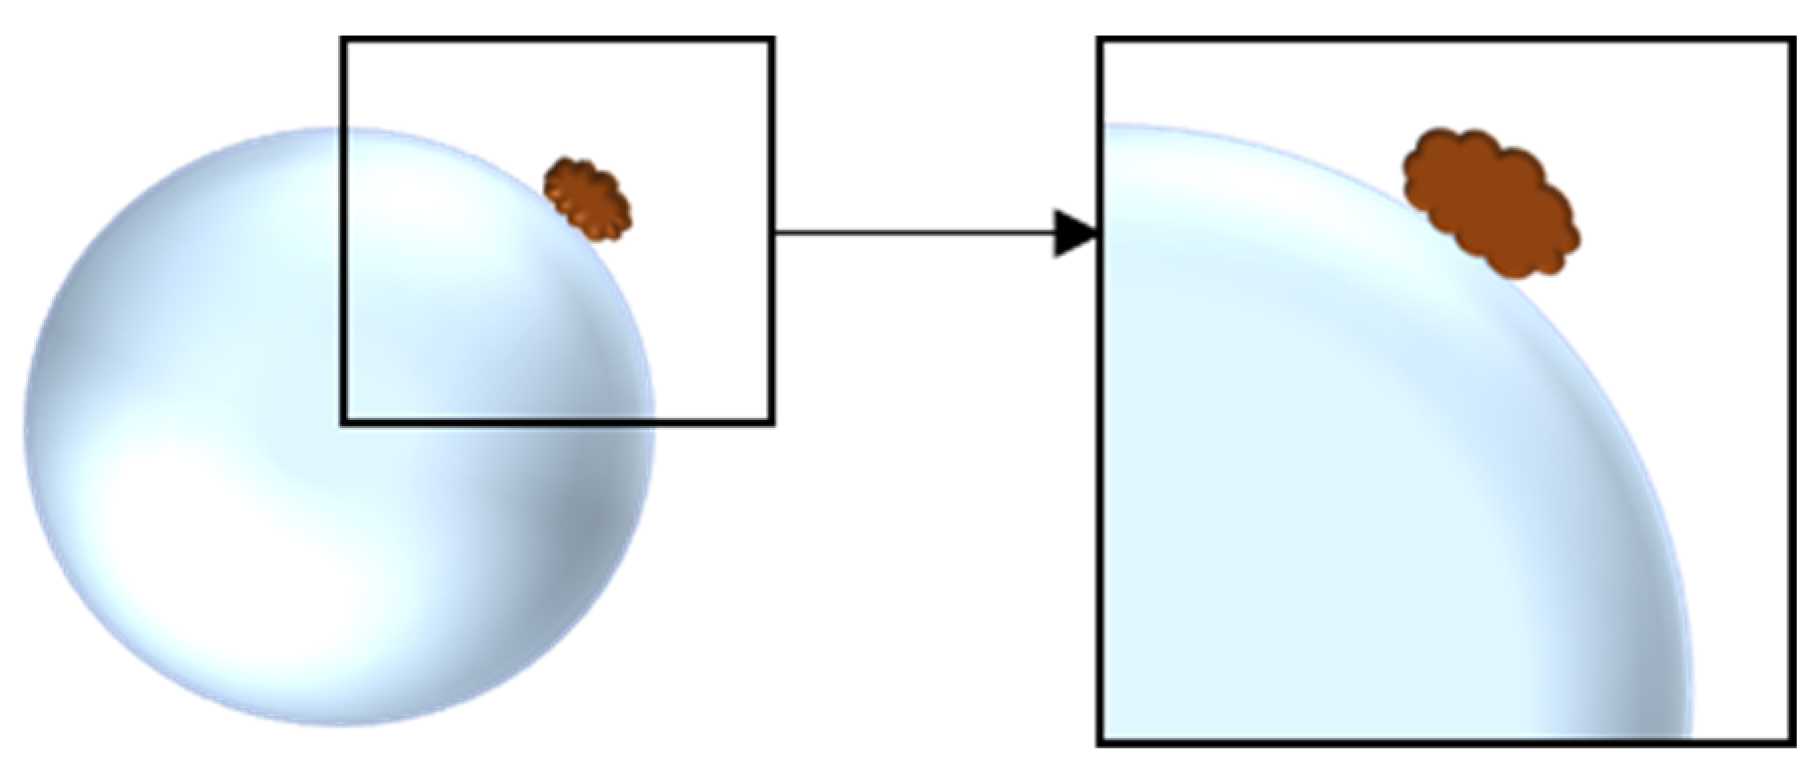
Figure 5.
The position of motion of different floc particle sizes on the surface of the bubble changes.
Figure 5.
The position of motion of different floc particle sizes on the surface of the bubble changes.
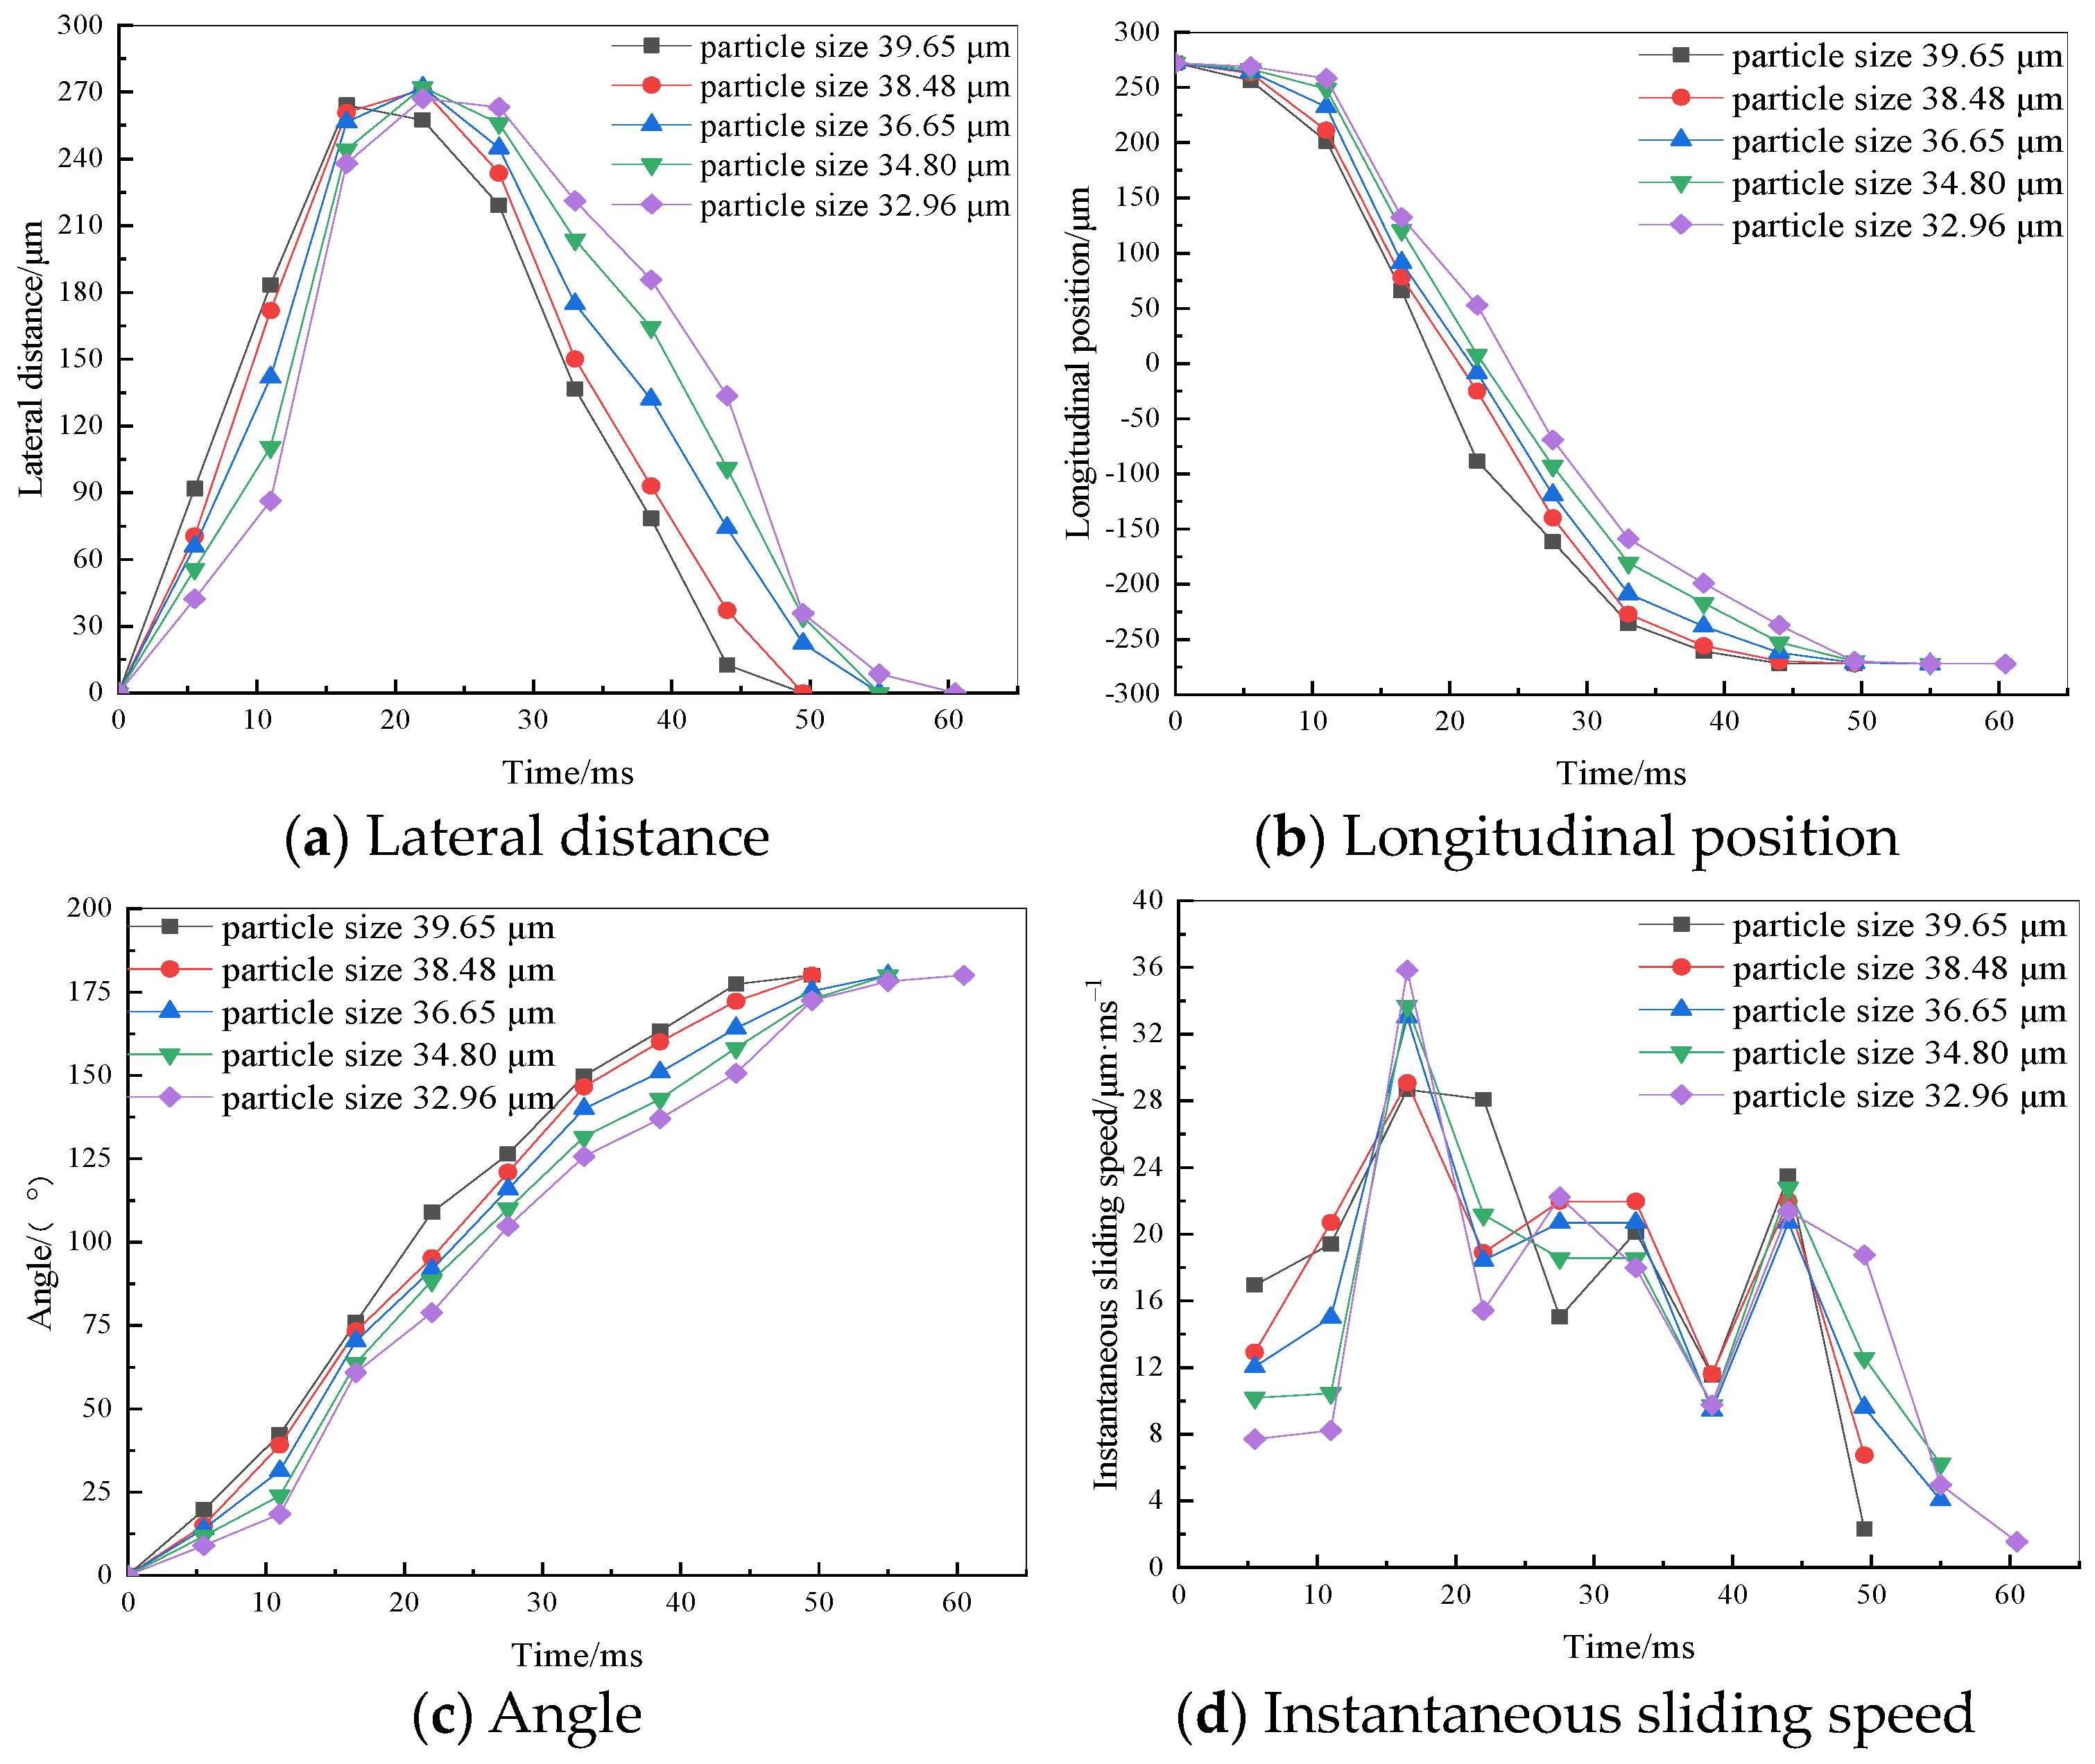
Figure 6.
The position of flocs on the surface of bubbles of different sizes varies.
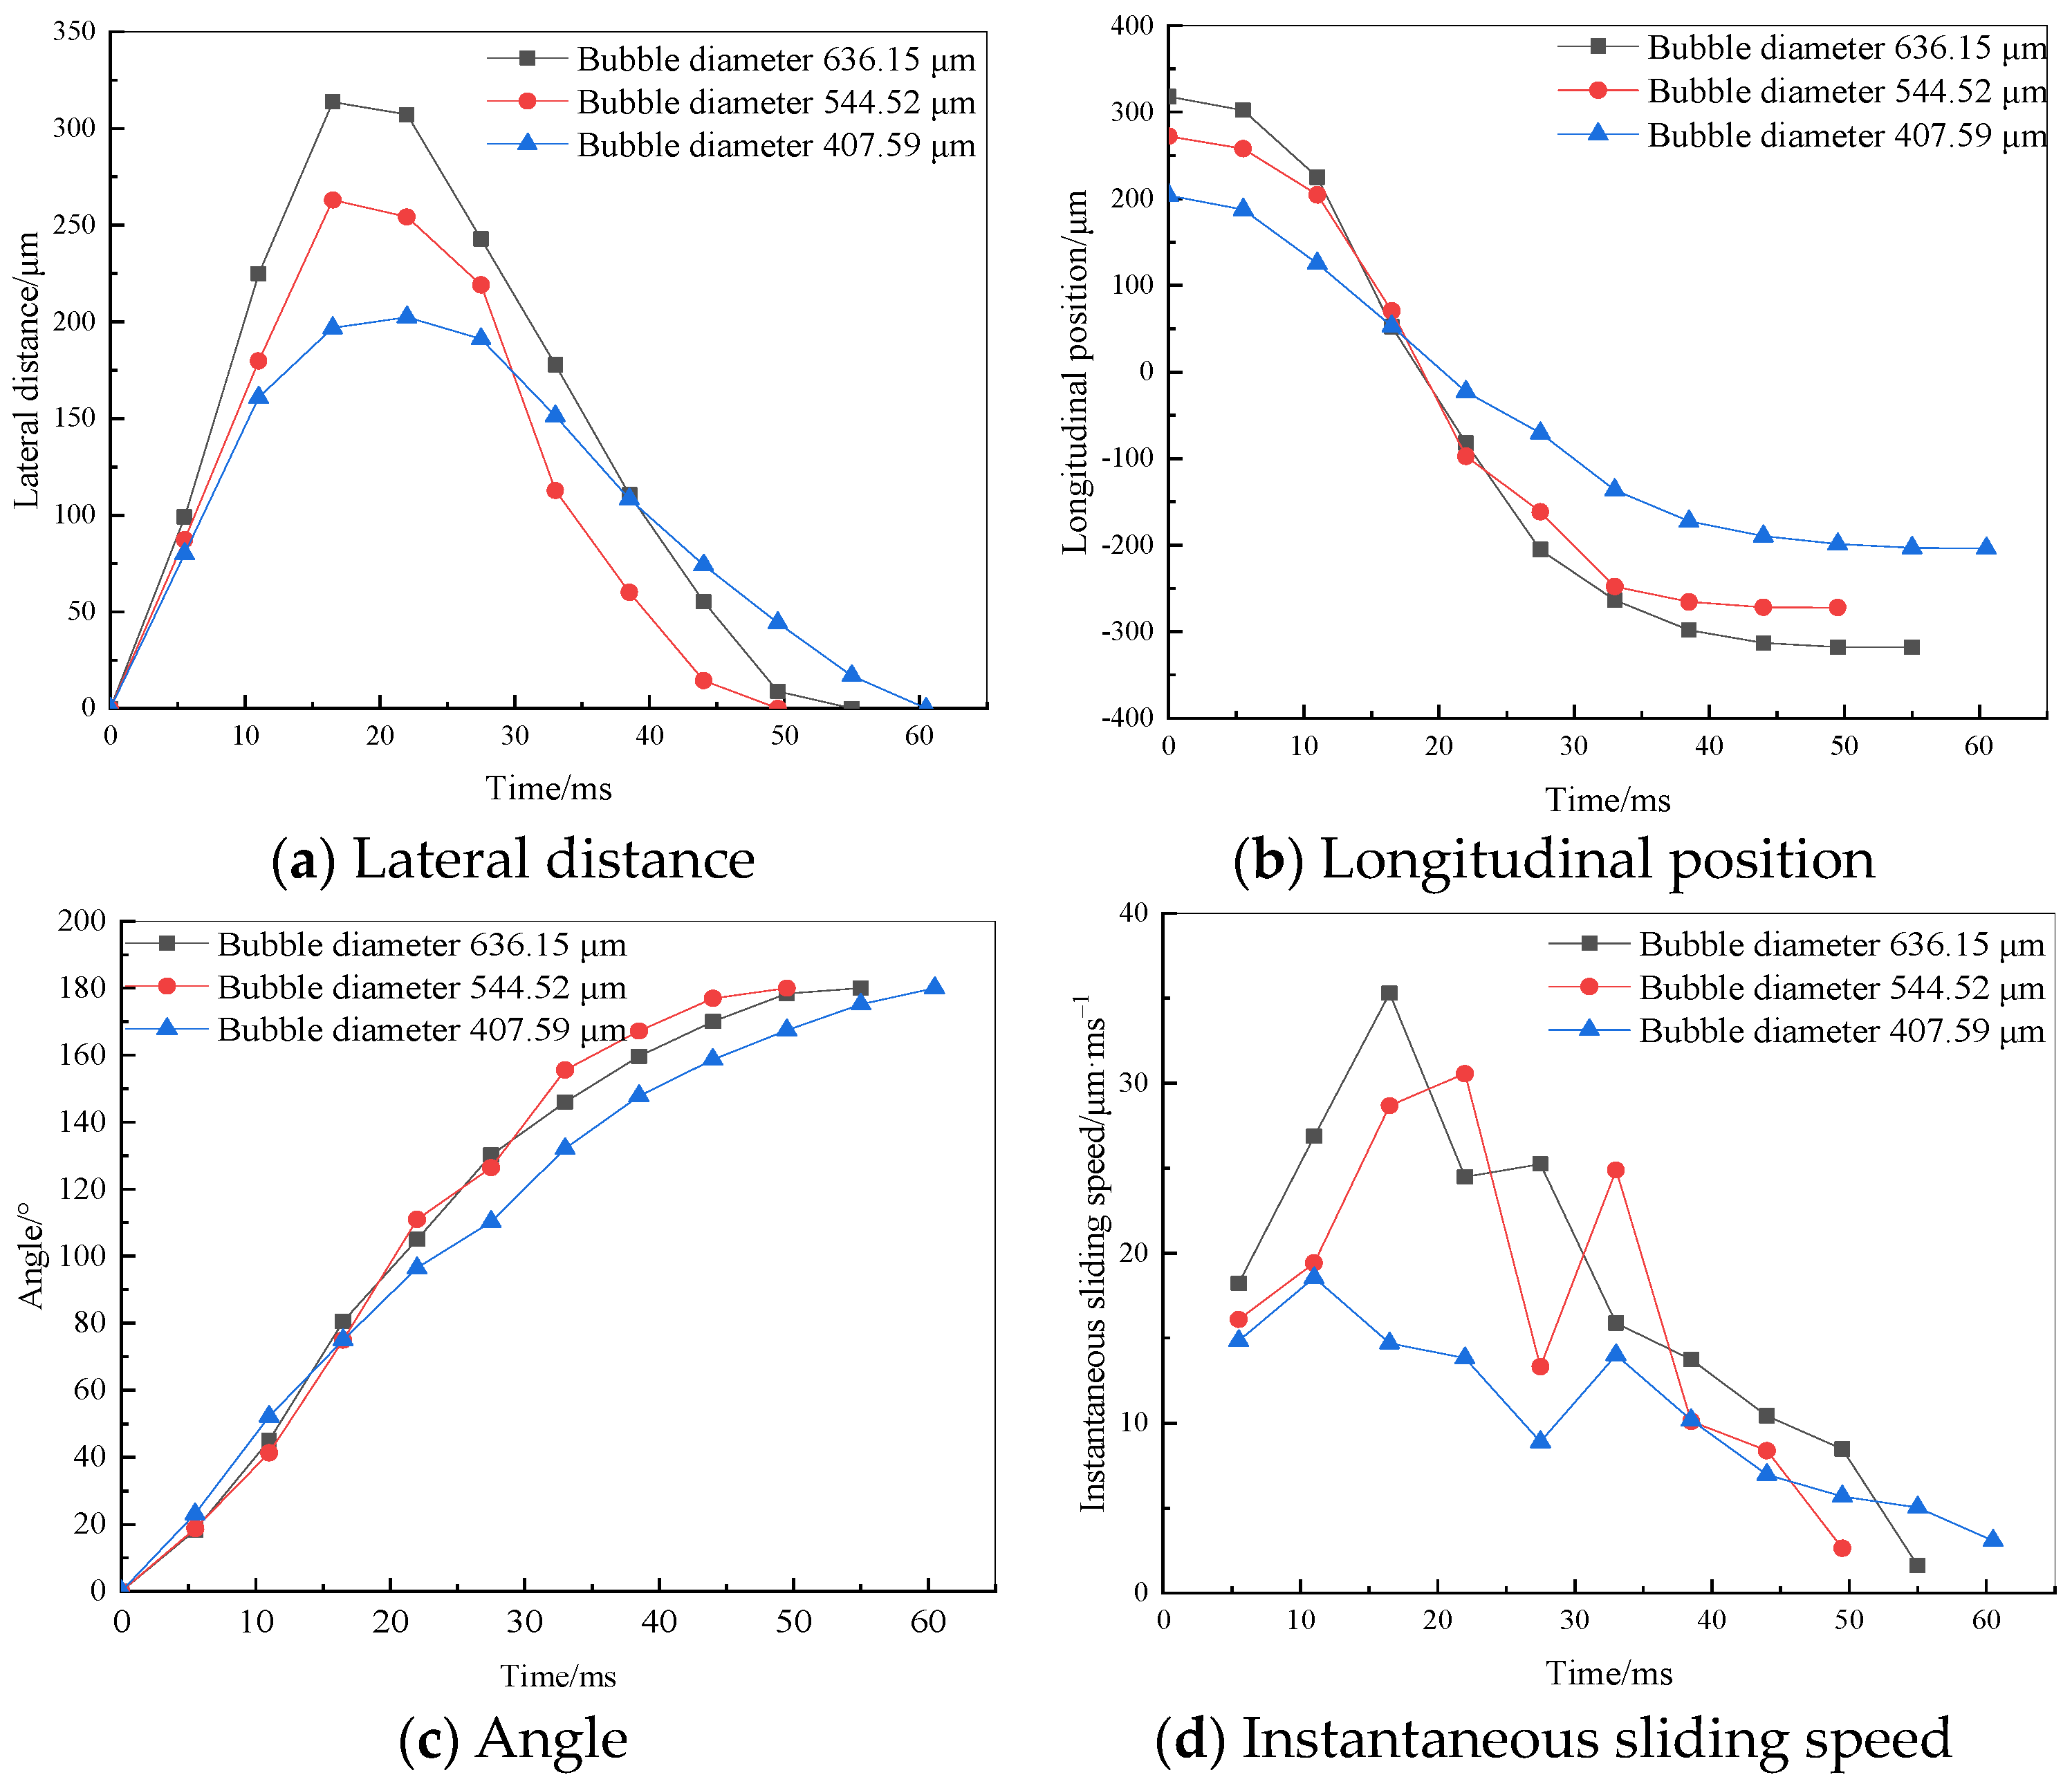
Figure 7.
Diagram of force analysis.

Figure 8.
Bond constant Bo′.
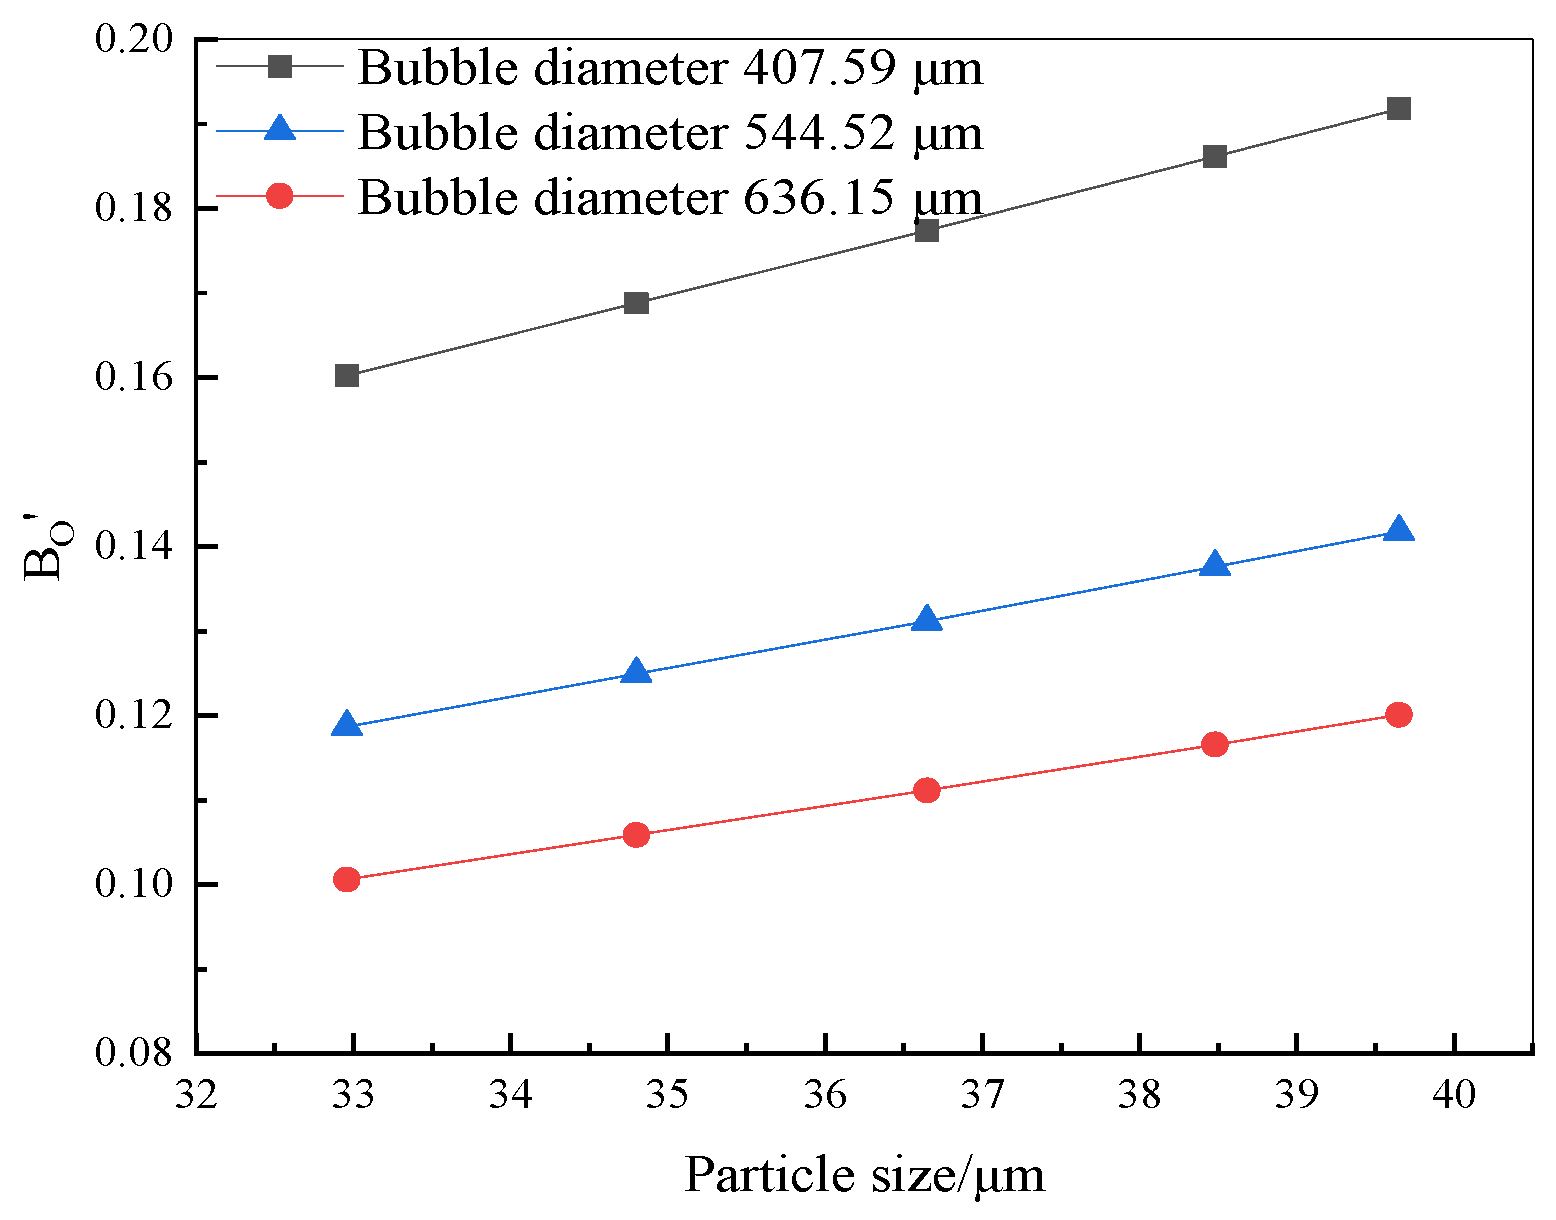
Figure 9.
Adhesion and desorption of floc.
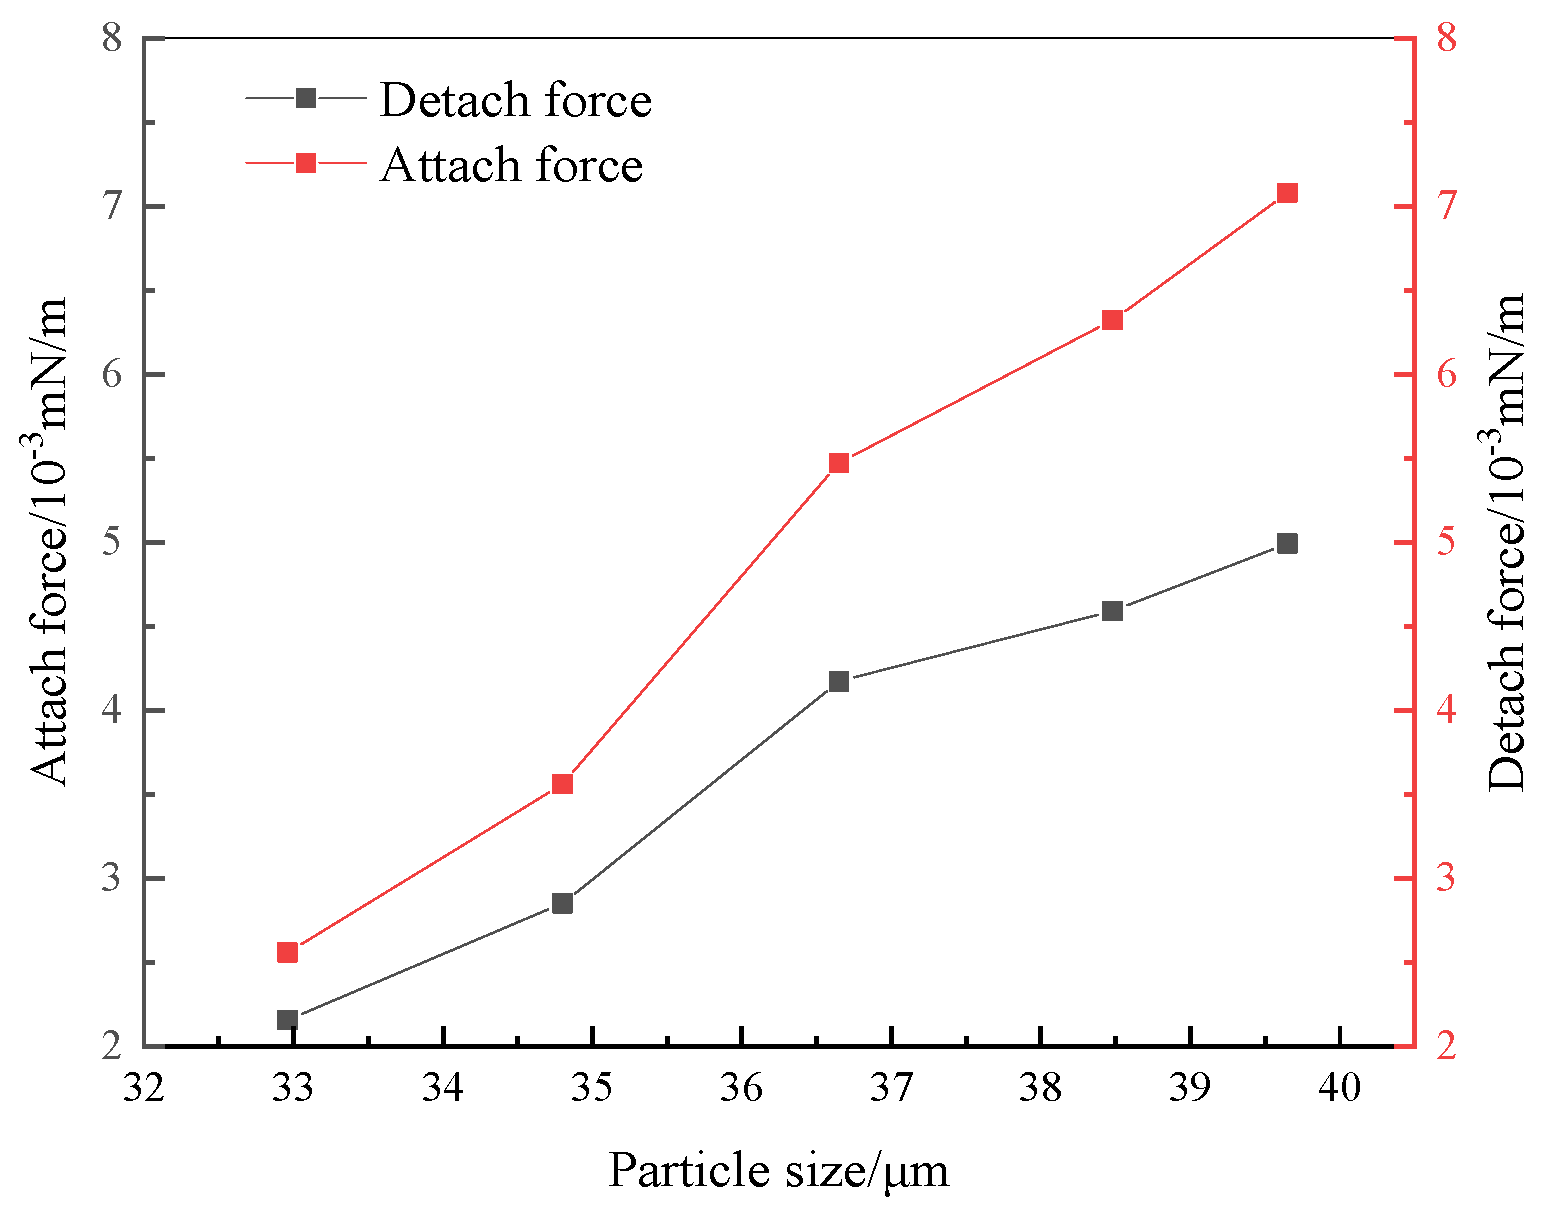
Figure 10.
Trajectory of flocs on the surface of bubbles.

Figure 11.
Trajectory of flocs falling on the surface of bubbles.

Table 1.
Chemical multi-elemental analysis results of the experimental raw materials %.
| Ingredients | Fe | Fe2O3 | K2O | MgO | Al2O3 | CaO | TiO2 |
|---|---|---|---|---|---|---|---|
| Content | 67.90 | 98.42 | 0.04 | 0.53 | 0.78 | 0.05 | 0.18 |
Table 2.
Physical properties of hematite flocs.
| Solution of Sodium Oleate/mg·L−1 | Particle Size/μm | Fractal Dimension | Aperture/nm | Contact Angle/° | Specific Surface Area/cm2·g−1 |
|---|---|---|---|---|---|
| 120 | 32.96 | 1.8283 | 19.979 | 80.21 | 3.500 |
| 140 | 34.80 | 1.8251 | 20.520 | 92.25 | 3.350 |
| 160 | 36.65 | 1.8239 | 21.090 | 116.31 | 3.269 |
| 180 | 38.48 | 1.8204 | 21.528 | 125.17 | 3.144 |
| 200 | 39.65 | 1.8172 | 21.716 | 126.63 | 3.112 |
Disclaimer/Publisher’s Note: The statements, opinions and data contained in all publications are solely those of the individual author(s) and contributor(s) and not of MDPI and/or the editor(s). MDPI and/or the editor(s) disclaim responsibility for any injury to people or property resulting from any ideas, methods, instructions or products referred to in the content. |
© 2023 by the authors. Licensee MDPI, Basel, Switzerland. This article is an open access article distributed under the terms and conditions of the Creative Commons Attribution (CC BY) license (https://creativecommons.org/licenses/by/4.0/).
Share and Cite
MDPI and ACS Style
Niu, F.; Chen, Y.; Zhang, J.; Chang, Z. High-Speed Dynamic Camera Analysis of the Hematite Floc–Bubble Mineralization Process. Minerals 2023, 13, 964. https://doi.org/10.3390/min13070964
AMA Style
Niu F, Chen Y, Zhang J, Chang Z. High-Speed Dynamic Camera Analysis of the Hematite Floc–Bubble Mineralization Process. Minerals. 2023; 13(7):964. https://doi.org/10.3390/min13070964
Chicago/Turabian StyleNiu, Fusheng, Yuying Chen, Jinxia Zhang, and Zhenjia Chang. 2023. "High-Speed Dynamic Camera Analysis of the Hematite Floc–Bubble Mineralization Process" Minerals 13, no. 7: 964. https://doi.org/10.3390/min13070964
Note that from the first issue of 2016, this journal uses article numbers instead of page numbers. See further details here.