

Timurid, Ottoman, Safavid and Qajar Ceramics: Raman and Composition Classification of the Different Types of Glaze and Pigments

1
de la Molécule aux Nano-Objets, Réactivité, Interactions et Spectroscopies (MONARIS UMR8233), Sorbonne Université, CNRS, 4 Place Jussieu, 75005 Paris, France
2
Surface Science and Technology Center (KUYTAM), College of Sciences, Rumelifeneri Campus, Koç University, 34450 Istanbul, Turkey
*
Author to whom correspondence should be addressed.
Minerals 2023, 13(7), 977; https://doi.org/10.3390/min13070977
Submission received: 5 June 2023
/
Revised: 20 July 2023
/
Accepted: 21 July 2023
/
Published: 23 July 2023
(This article belongs to the Special Issue Vibrational Spectroscopy in Mineralogy and Archaeology)
Abstract
:Raw materials significantly determine the final composition and properties of a fired ceramic. Raman analysis which characterizes micro- and nanostructures of (coloured) glazes, opacified or not, was applied to shards mostly collected before the 1960s, currently at the Louvre Museum, originated in Anatolia, the Caucasus, Iran and Central Asia, which are, for most of them, characterized by the use of black lines to separate coloured areas, and dated to the period between the 12th and 19th centuries. Measurements were carried out in the laboratory with a blue laser excitation and/or on the conservation site with a mobile device (green laser). Three types of glazes were identified by their nanostructure of the silicate network: (i) a lead-rich glaze analogous to that of Byzantine, Zirid to Hafsid and al-Andalus productions, (ii) a lead-alkali glaze typical of the Ottoman productions of Iznik-Kütahya, and (iii) a mixed (poor lead/lead-free)-alkali glaze typical of Safavid productions. The colour determines the precise composition of the glaze. The identification is not only based on the signature of the stretching mode of the SiO4 tetrahedron (position of the wavenumber of the component(s)) but also on the position and shape of the continuous luminescence of the Raman background, characteristic of the raw materials used. Lead-tin yellow, Fe-rich, Mn-rich and Cr-rich black pigments and opacifiers made of cassiterite and wollastonite were also identified. The results (type of glaze and deduced processing temperature) were discussed in the light of the ternary phase diagrams visualizing elemental composition determined in previous works and the microstructure examination on the polished section (defining single or multistep firing cycles). Continuity was highlighted on the one hand between the tiles of Bursa, Edirne and Istanbul (Ottoman Iznik-like production) and on the other hand between those of Samarkand area (Timurid) and Iran. The procedure was then applied in the study of three objects (two dishes and a bowl) which are very representative of the productions of the Turkish-Persian cultural areas: a polychrome mina’i cup with decoration representing a rider, an Ottoman Iznik fritware with polychrome floral decoration, and a blue-and-white Safavid ceramic with a decoration representing a shrub.
Keywords:
Raman spectroscopy; composition; blue; black line; yellow; glaze; raw materials; firing; silicate glass; pigments; Ottoman; Safavid; Qajar; Timurid; authentication1. Introduction
In Islamic countries, tileworks formed an emblematic element of the buildings [1] and technical progress on the decoration, surface treatments, and firing processes of the tileworks ornamenting the walls of these buildings increased their magnificence. In many cases the date of the laying of the tiles or construction of the building is documented which gives a certain reliability of dating to the tiles, often better than can be achieved with unmarked pieces of crockery. From the Samarkand area, towards the end of the 14th century, a type of decoration using a black line to separate the coloured areas was developed to cover the walls of mosques, madrasas, palaces, and other buildings with ceramic tiles [1,2,3,4,5,6]. This black line made it possible to obtain a visual appearance similar to that obtained by the ceramics made from individually hand-chiselled tile pieces [7,8,9]. The black line, made of refractory matter, also limits the mixing of the different colours in the glaze during the firing (glaze reaching molten state at the highest firing temperature) and hence avoiding blurs [10,11]. In fact, this isolation technique of coloured areas has different names whose significance covers actually different types of decoration. The hand-chiselled tile decoration can be related to mosaic technique, which decorates floors and walls, practiced on a large scale by the Romans and then the Byzantines who used tesserae of rock or glass [12,13,14,15]. It can be thought that the arrangement of tiles offering a similar decoration separated with black lines had certain advantages in implementation. In Uzbekistan (Samarkand, Bukhara) and more generally in Central Asia, the technique of cut ceramic tiles appeared around the 12th century and became widespread in the 14th century, in competition with the ceramics decorated with black lines [4,5,6]. However, before the 14th century, cut terracotta decoration, in which separate ceramic elements were fixed in place with a thick layer of gypsum solution, was the dominant mode of polychromatic ceramic decoration on monuments.
Even though the pastes of this type of black-line decorated ceramics and tiles have been widely and continuously studied in detail with regard to their composition and microstructure [16,17,18,19,20,21,22,23,24,25,26,27,28], most of these works were destructive, focused on the paste and some colouring agents and extracted little information on the nanostructure of the glazed coatings which does not allow giving a global overview. The studies of glazes, colouring agents and pigments, and the microstructure of coated glassy layers have mainly concerned ceramic productions from areas such as Anatolia and Transoxiana to Persia and India (geographical area corresponding to the current countries from West to East of Türkiye, Syria, Iran, Turkmenistan, Afghanistan, and Uzbekistan [24,28,29,30,31,32,33,34,35,36,37,38,39,40,41,42,43,44,45,46,47,48]).
Over the past few years, we have demonstrated the interest of Raman microspectroscopy in documenting non-invasively the nature of the crystalline (coloured pigments and opacifiers) and amorphous (silicate matrix constituting the glazes) phases, either with a laboratory examination using a bench-top instrument or on-site using mobile instrumentation [29,31,49,50,51,52,53]. Indeed, the Raman spectrum is a precise fingerprint of the nanostructure of the amorphous silicate network depending not only on its composition but also on the conditions of implementation [53,54,55,56,57,58,59,60,61,62,63,64]. This molecular approach can be supplemented with the information about the elemental composition, information that can be obtained in the laboratory by elemental analysis using different methods (SEM-EDS, XRF, PIXE, PIGE, LA-ICP-MS) [65] but also on-site by portable X-ray fluorescence spectroscopy (pXRF) [46,47,50,51].
The ceramics and glasses manufactured before the middle of the 19th century used incompletely purified raw materials (rocks/ores or by-products of metal production) and the chemical elements characteristic of the geological context or process remained in the final materials, dissolved in the main phase or present as crystalline residues/precipitates. It has been shown that the identification of the latter minority phases (Raman microspectroscopy) and the measurement of the associated elements (pXRF) therefore make it possible to recognize glazes that have been prepared with the raw materials of the same geological origin [50] or according to the manufacturing processes causing the same type of pollution [53].
Analysis with mobile instruments allows the study of rare or immovable objects such as tiled wall revetments in a perfectly non-invasive way [46,47]. However, the performance of many mobile instruments is inferior to those of laboratory instruments and the examination of objects only allows analysis from the surface, without knowledge of/access to stratigraphy (e.g., the thickness of the layer(s) placed on the paste). A good knowledge of similar artefacts must be acquired on shards with access to the stratigraphy, on old or fresh fractures, or even better on polished sections.
We present here the study with Raman microspectroscopy of about forty shards, now at the Musée du Louvre Collection. The corpus covers ‘black line’ delimited coloured decoration and some blue-and-white productions originating from Anatolia, Central Asia and the Caucasus to Persia for periods ranging from the 12th to the 19th century. The examination of polished sections to document the stratigraphy, information required for a comprehensive Raman study, also allows discussing the enamelling process (type of glass, pigments, opacifiers, enamelling on raw paste or biscuit, single or double firing, etc.). Very preliminary data regarding the composition and phase identification of some pigments have been published [63,64] and a more complete study of the elemental composition will appear [65]. We then apply the procedure to a few objects in a private collection, which are representative of the main glaze type identified in the study of tiles (lead-rich, mixed lead-alkali and alkali-rich (coloured) glaze) and try to check if the background of the Raman spectrum can give complementary information, as pointed out in some previous studies [53,66]. However, the background of the Raman spectrum, i.e., luminescence, can also be an effective marker of the geology of the raw materials. Spectroscopic and elemental analyses will be compared to classify the different enamels and highlight some possible affiliations according to the places and periods of production.
2. Materials and Methods
2.1. Artefacts
Table 1 and Table 2 list the shards studied, belonging, respectively, to the collections of the Louvre Museum (Islamic Art Department) and from a private collection. Figure 1 and Figure 2 show a selection of these shards, some being also analyzed on-site with a mobile Raman set-up (Figure 1 and Supplementary Materials). Figure 3 presents the three representative objects which will be used to illustrate the Raman identification procedure established from the study of the shards.
The samples from the collection of the Louvre Museum [67] cover the periods from the end of the 12th century to the 18th century (plus some later restorations) for Iran, Central Asia and the Caucasus and the 15th and 16th centuries for Anatolia and modern territory of Türkiye (there also some restorations). Samples are listed according to their (assumed) geographical origin. A sample of early al-Andalus productions (attributed to the 10th–11th centuries) and a Mamluk shard (14th–15th centuries) which are very characteristic of lead-rich glazed pottery are added for comparison. If the fact that these shards were part of the reference collections of eminent specialists, their provenance is often indirect (for example, through their purchase from intermediaries) and their exact origin (place and building) still remains uncertain. The indication of place can correspond either to the place of production, or the place of discovery (often unknown), and the supposed place of its last use, etc. Question marks are added for the most uncertain attributions. Re-uses are possible. Discussion of these attributions is beyond the scope of this article.
The tile shards of the Laure Soustiel collection (Figure 2) consist of two very representative Iznik fritwares, a blue-and-white Baba Nakkash ware made during the reign of Sultan Selim I (1510–1520), already studied [29], and a polychrome tile decorated with flower and leaves (ca. 1575), in addition to two Iranian polychrome tile fragments depicting a personage and floral/animal decoration delimited with a black line (Safavid, 17th century) as well as a blue-and-white Safavid dish shard. A Mamluk shard serves as an example of typical lead-rich enamel.
The three pieces of tableware examined (Figure 3) are (i) a (restored) polychrome mina’i Iranian bowl, with a decoration depicting Faridun astride a cow Birmaya (middle 12th to early 13th century), (ii) a polychrome Iznik dish decorated with a flower and saz leaves (ca. 1580), and (iii) a Safavid blue-and-white dish decorated with a Chinese landscape (17th century).
2.2. Techniques
A small wafer (~2 mm thick) has been cut from most of the shards and embedded in a resin and polished using different abrasive papers with grade up to 1/4 µm diamond grains in order to obtain a fine polished even surface. The polished section is examined using an Olympus BX53 optical microscope (Olympus Corp., Tokyo, Japan) or a SEM microscope after coating the surface with carbon (JEOL 5510LV, Tokyo, Japan). We will compare the Raman conclusions with some elementary composition data extracted from PhD work under redaction [65].
Raman spectra were recorded with two instruments: A Labram HR800 spectrometer (HORIBA Scientific Jobin-Yvon, Longjumeau, France) excited by an Ar+ ion plasma laser Innova I90C 6UV (Coherent Inc., Santa Clara, CA, USA) allowing multiple wavelengths from ultraviolet to red light is used in the laboratory. The 457.9 nm line was used with approximately 0.3 mW (dark coloured enamels) to 2 mW (glaze and light-coloured glaze) power of illumination on the sample surface analyzed by using long working distance objectives (LWD) of 10×, 50× or 100× magnification (Olympus Corp., Tokyo, Japan). The 600 g/mm grating was used in order to record a spectrum with a large spectral range (50–4500 cm−1 with 3 windows; confocal hole: 200 µm). Analyzed spots are smaller than 20 × 20, 5 × 5 and 2 × 2 µm2, respectively; the in-depth penetration is rather similar for the colourless and poorly coloured glazes, about 5–10 times less for dark coloured areas. It is well established that blue (or violet) laser excitation is the most efficient one to record the Raman fingerprint of silicates [52,53,57,58,59,60]. We have chosen the 50–4500 cm−1 window in order to see the shape of the fluorescence bands. This HR800 instrument was used to study polished sections of shards listed in Table 1 and the upper surface of shards listed in Table 2 and three artefacts. Three to five spectra are recorded for each coloured area in order to check that they are representative.
In order to evaluate the possibility to conduct on-site study, a mobile Raman set up having a HE532 instrument (HORIBA Scientific Jobin-Yvon, Longjumeau, France) equipped with a 532 nm 300 mW Ventus laser (Quantum Laser Ltd. (now Novanta Photonics), Taunton, UK) was implemented in the storage room of the Louvre Museum (Figure 1). For each coloured area in the objects, at least three Raman spectra were recorded for each coloured area to control the representativeness of the collected data on a statistical basis. The spectral window is 80–3200 cm−1. The reliability of the Raman spectrum recorded with mobile set-up starts above 80 cm−1 but a flat spectral background is only obtained over 500 cm−1 and a baseline made of four linear segments was subtracted according to the previous procedure [58]. A 50× (17 mm long working distance, Nikon France SAS, Champigny-sur-Marne, France) objective was used (surface spot size < ~5 × 5 µm2; in-depth ~5–10 µm, the values varying with the colour), perpendicular to the sample surface, which allows the recording of spectra not/poorly contaminated by the sub-layers and/or the silicate matrix if grains are bigger than ~5 µm. Obviously, the power of illumination at the sample should be minimal (~1 mW) for dark-coloured areas due to the absorption of light, although up to 20 mW is required for the light-coloured enamels and more for body and colourless glaze. Unfortunately, laser illumination can induce phase transformation and oxidation of heavy absorbing phases (e.g., iron oxides) even under a low power of illumination. This instrument was used for an on-site study of some of the upper glazed surface of shards/tiles listed in Table 1 (see Supplementary Materials).
Raman measurements are very local (over a few µm2 to tens of µm2), almost the size of the grains/aggregates of pigments or opacifiers. They can be considered as fairly representative when they are made in many spots. Fluorescence background analysis is conducted with a blue excitation to maximize the fluorescence emission with the laboratory-type Raman instrument that provides a flat baseline. The use of a blue laser makes it possible to eliminate most of the fluorescence arising from the biological films formed on ancient objects, in particular coming from excavations. The other analytical techniques (Particle induced X-ray Emission (PIXE)/Particle Induced Gamma-ray Emission (PIGE), Scanning Electron Miscroscope (SEM)-Energy Dispersive Spectroscopy (EDS)) are local (less than a few lens of microns). The representativeness of the elementary composition measurements is always questionable for heterogeneous coloured enamels. This is why our approach will seek to be statistical by focusing first on the characteristics common to the groups identified from analytical data and not just historical or geographical considerations. This will be the subject of further work.
The ternary and binary scattering plots and hierarchical clustering dendrograms are drawn for the interpretation and discussion of the results with the software Statistica 196 13.5.0.17 (TIBCO Software Inc., Palo Alto, CA, USA).
3. Results
Raman microspectroscopy has the advantage of being able to identify both crystalline and amorphous phases in a perfectly non-invasive way and if necessary, with mobile instruments in variable volumes of material, from less than one µm3 to several thousand µm3 depending on the choice of optics [49]. This microspectroscopy is more efficient than the elementary compositional methods for distinguishing between opacifiers and pigments and, advantageous compared to microdiffraction methods (diffractometers with rotating anodes or Synchrotron), for being able to be implemented on the object conservation site [29,31,32,49]. Since the 1950s, the characterization and classification of ceramics paste but also the vitreous silicate coating carrying the decoration is made from the composition measured in a volume of variable material according to the technique used (and the authors’ choices). The inner side of this bulky material is often unknown, whereas the multiphase character gives a composite property to this coating. Therefore, the analysis should be performed phase/layer by phase/layer. Nevertheless, abundant literature ‘determines’ and discusses the ‘compositions’ of glazes and in this work we will confront the elementary composition data with Raman analysis in order to be able to establish the links between these two approaches.
3.1. Microstructures and Enamelling Processes
Figure 4 compares a selection of the optical microscopy images of polished sections of some shards selected from Table 1 for their representativeness. A few representative SEM micrographs are also presented in Figure 5. Additional polished shard sections are presented in Supplementary Materials. As shown in Figure 4, the pastes are characterized by variable reddish colourations due to the different iron content and/or different calcium content (as well as established for the Anatolian productions [47], the level of calcium influencing the colour of the paste [68]). The thicknesses of the glazes vary between 100 and 500 µm and can be made up to several layers covering the paste, with different types of glaze–base glaze, glaze–paste, or glaze–slip interfaces.
The thinner layers of enamel are observed for the al-Andalous shard (~150 µm, 10th–11th c., MAO 2083/39 shard, Figure 4c–e), and for the yellow upper layer, for example, the Safavid shard (<100 µm, turn of the 17th–18th c. MAO 2025d, Figure 4f), and the Samarkand shard (turn of 13th–14th c., MAO 936/922, Figure 4a,b) which has an extremely thin upper layer (~10 µm), as for some mina’i (Figure 5e, MAO 936/319). We will see further that these thin glaze layers exhibit a lead-rich composition, i.e., a poor viscosity glaze promoting a low thickness.
Differences between samples can be found in the presence or absence of an intermediate layer, under the upper vitrified surface layer and over the paste, which can be called slip or ‘engobe.’ For instance, the interface of the restoration tile (1864) of the mosque of Bursa (MAO 936/822, Figure 5b) is rough in keeping with glaze-body co-firing. A similar feature is observed for the Samarkand (15th c., AFI 698, Figure 4j) and Transoxiana (MAO 936/573, Figure 5a) shards. This layer is made of quartz grains smaller than in the paste, is typical of Iznik productions (Figure 2) [2,19,20,21,22,28,29] and is better visible on the SEM data (e.g., MAO 936/822, Figure 5b) than using the optical microscope (e.g., AFI 698, Figure 4j).
The following criteria are usually considered indicative of the method of enamelling. A well-defined enamel–support interface indicates firing after that of the support, and therefore at a lower temperature. Numerous bubbles in the enamel, in particular at the enamel–support interface (Figure 4k,l and Figure 5c), are consistent with a strong reaction arising from the deposit of the glaze powder on an unfired support and thus confirm a glaze-body co-firing. Strong inter-diffusion is also associated with this single-firing procedure. Unevenness and limited extent of a top layer of enamel will indicate subsequent firing at a much lower temperature than that of the substrate firing. Thus, the MAO 936/593 shard (Figure 4h,k, Iran Safavid, 17th c.) clearly shows a well-defined interface between the upper yellow layer and the under glassy layer that indicate the yellow enamel was deposited and fired last on an already fired support (we will see in Table 3 that being very rich in lead, its ‘melting’ temperature (i.e., the temperature which confers the viscosity and wettability necessary for enamelling) is inferior to that of the underlayer (colourless glaze)). It retains a curved drop-shaped surface, stopped by a very thin black line on the left in Figure 4h. The interface with the white glaze layer is abrupt whatever the location (Figure 4k). The same is true, for example, for the paste–glaze interface of MAO 2083/39 (al-Andalus, Figure 4c) which indicates a deposition of the glaze on pre-fired support or a support with a high refractoriness. Obviously different glassy compositions and Raman fingerprints should be identified on a single artefact. On the other hand, for the MAO 936/822 shard (yellow layer, 1864 restoration), MAO 936/277a (turquoise layer, 12th–13th centuries, Iran) and MAO 936/922 (very thin red layer, Samarkand, turn of 14th–15th c.), the interfaces are progressive, indicating co-firing with the lower layer and/or the paste. The same is true for the MAO 936/593 shard (blue layer, Iran, 17th c.) where the interface between the upper blue layer and the underlying white layer is diffuse.
It is obvious that very different procedures were used: glaze–paste co-firing, firing on already fired body/biscuit and overglaze depositing and special firing. Discussing each case is out of the scope of this work. However, Table 3 summarizes our conclusions concerning the suspicions of single or double firing, etc. Note that some of the mina’i glazes appear very thin, like the red layer (Figure 5 top right). It is the same for gilding, the gold particles being of the order of a micron which is classical [69].
From the analysis of the sections and also from the information that can be collected by observation of contemporary traditional potters, we can propose the following sequences of fabrications. On the shaped paste, the potter puts a ‘preparation layer,’ slip or glaze, and traces the decoration by drawing the black lines, colours the delimited areas with or without pre-firing, which allows on a single tile to obtain the same visual effect as the assembly of pieces of cut monochrome tiles. An attempt to summarize the procedures should be considered more precisely from each stratigraphy (Supplementary Materials).
From the 15th centuries, productions in Central Asia and Iran possessed an opacified-type glaze layer with cassiterite (and wollastonite) which is deposited on the likely unfired body. Gold, if any, is then applied before the drawing of black (rarely red) lines. A firing before the deposit of coloured overglaze is then made.
Different stratigraphies are observed for 15th century Ottoman artefacts [28,65]. First productions (i.e., Baba Nakkash blue-and-white) are rather similar to Timurid artefacts. Then, the opacified layer is replaced with a layer made of angular quartz grains. Black lines, glaze and coloured overglazes are then applied and fired. Only for some tiles of Bursa Green complex, the glaze seems to be applied directly on the body. Sixteenth-century Ottoman tiles generally exhibit a quartz-rich slip made of thinner grains.
3.2. Raman Classification of Glaze
Figure 6 presents a representative selection of the Raman spectra recorded on the shards under blue laser excitation. All recorded spectra are given in Supplementary Materials.
We are interested firstly in the Raman signature of the silicate matrix of enamels formed of stretching (between ~850 and 1200 cm−1) and bending (between 400 and 600 cm−1) modes of the vibrational unit of silicates, the tetrahedron SiO4 [54,55,56,57]. As well established [51,52,53,54,55,56,57,58,59,60] the spectrum is a fingerprint of the nanostructure of the silicate amorphous network. The components of the stretching mode massif are characteristic of the different types of SiO4 tetrahedron forming the silicate glassy phase, isolated (Q0) tetrahedron, bound by one (Q1), two (Q2), three (Q3) or four (Q4) of their vertices and therefore of the nanostructure and composition of the glass, in particular controlled by the flux/silica ratio and thus the melting temperature.
Typically, the wavenumber of the Q0 component peak (isolated SiO4 tetrahedron) is located at about 800–850 cm−1 and that of Q4 component (full polymerized tetrahedron) at about 1100–1200 cm−1 [57,58,59,60]. The ‘melting’ temperature of a silicate is roughly proportional to the number of Si-O-Si bonds, i.e., minimal for silicates built of an isolated tetrahedron (Q0) and maximal for pure silica (Q4) [57,58,59].
Considering the whole set of samples, three types of spectra are evident (Figure 6 and Supplementary Materials, list of wavenumbers in Table 3):
- (i)
- (ii)
- (iii)
The first type of spectrum (i) which we call lead-rich glaze signature in Table 3 (Pb-G) is identical to that of glazes that are very rich in lead (20 to 40 wt% SiO2, 50 to 70 wt% PbO, 8–10 wt% Na2O + K2O + CaO) as observed for Rum Seljuks (10th–12th centuries) pottery [37], Zirids (11th–12th centuries) and Almohads (13th–15th centuries) terracotta, fired at a temperature below ~1000–1100 °C [70], as well as for Byzantine pottery from the 12th–13th centuries [36,41,71]. Here it is observed for the al-Andalus shards (MAO 2083/39) and for yellow- or green- (and sometimes black-) coloured glazes e.g., (see Table 1 for the inventory numbers), MAO 936/644b yellow (Iran 17th–19th c.); MAO 936/646b yellow (Iran, 19th c.), MAO 936/593 yellow (Armenia, 19th c.), MAO 936/822 yellow (Türkiye, 1864 restoration), AD 3919/1006 yellow and MAO 936/2002 yellow (Iran, 17th c.), MAO 936/573 black (Transoxiana, 15th c.), MAO 936/642 black (Iran 17th–19th c.) and Mamluk glazed terra cotta (13th–16th centuries, see further). Similarity between mina’i and al-Andalus, but also Rum Seljuks and Byzantine enamelling techniques appears obvious regarding the Raman SiO4 fingerprint.
The second type of spectrum (ii) is observed for Iznik and Kütahya fritware [29,31,32]. We will call it lead-alkali glaze (Pb-Na-G). The typical composition of these glazes is SiO2 45–47 wt%, Na2O 8–14 wt%, PbO 25–30 wt%, K2O ~1 wt%, and CaO ~1 wt%. It is observed for the shards MAO 936/277a turquoise (Iran, 12th–13th c.); MAO 936/1127a (mina’i, 12th–13th c.); OA 3919/1006 (Ottoman, 16th-17th c.) glaze, blue MAO 936/319 (mina’i, 12th–13th c.), white blue MAO 936/822 (Türkiye, 1864) (see Table 3). Figure 7a shows full-range spectra recorded on a polychrome Iznik tile that can be considered as a reference object.
The third type of spectrum (iii) appears to be typical of Safavid productions and we will call it (mixed) (earth) alkali glaze ((Pb)Ca-Na-K-G). Safavid tile glaze compositions are close to SiO2 50–70 wt%, Na2O 12 wt%, K2O 4 wt%, CaO 4 wt%, PbO 20–30 wt%, Al2O3 2 wt%, according to Matin, Gholamnejad and Akenar [72]. However, Crowe [73] reports a lead-free composition for a series of 37 measurements made on different blue-and-white Savafid tableware shards: SiO2 67.7 wt%, Na2O 12.9 wt%, K2O 2.8 wt%, CaO 4.9 wt%, Al2O3 2 wt%, MgO 3.1 wt%, and MnO 0.1 wt%. This type of Raman fingerprint is observed for the shards black, blue, white MAO 936/1002 (Iran, 17th c.); white, blue MAO 2025d (Iran, 18th–19th c.); white, red MAO 936–922 (Samarkand 15th c.); blue, white, glaze AFI 698 (15th c.), red, turquoise, white MAO 936–573 (Transoxiana, 15th c.); white, brown MAO 936/921 (Samarkand turn of 14th–15th c.); blue, white, underlayer MAO 936–576 (Samarkand, 15th c;); blue, white, MAO 936/923 (Samarkand, 15th c.). The lead-free and lead-poor compositions fit with the third type of Raman signature, in which the Qn components are observed below 950 cm−1 and do not exhibit significant intensity [59].
Similarity between the Samarkand/Timurid and Safavid enamelling technique is obvious regarding their Raman fingerprint.
Figure 6 and Figure 7 show full-range spectra for different coloured areas of tiles belonging to the three identified types. We will discuss the fluorescence background further. As shown in Figure 6 and in Supplementary Materials, there is variability in each group regarding the profile of the SiO4 stretching band, i.e., variations regarding the intensity and the precise position of the Qn components. This variability is very low for the 16th century Iznik productions, as has been shown in previous works [29,31] due to the control of the Ottoman nakkaşhane. The ratio of the areas of the bending and stretching modes measures the degree of polymerization of the SiO4 tetrahedron and is therefore related to the melting temperature of the silicate matrix [57]. This ratio is about 0.4–0.5 for lead-rich glazes (melting temperature < 800 °C) but reaches 0.7 to 1 for lead-alkali glazes (melting temperature between ~900 and 1050 °C, values that have been already measured in studies of Iznik and Kütahya productions [29,31].
3.3. Identification of Opacifiers
One characteristic plays an important role for the quality of the decoration: the need to mask the colour of the paste—and/or to achieve a smoother surface—either with a white slip or by adding an opacifier in the glaze in order to be able to make the final decor. The presence of a crystalline phase (generally characterized by narrow Raman peaks) in an amorphous silicate matrix (characterized by broad bands) is easy to demonstrate, fine peaks, even of weak intensity being clearly detected visually, and magnified after removal of the ‘continuous background’ (see Supplementary Materials). Cassiterite (SnO2), an opacifier used since Roman times [14] is characterized by an intense peak at ~635 cm−1 and a weaker one at 775 cm−1 [14,29,31] (Figure 6 and Figure 8). The samples in which cassiterite is observed are listed in Table 3.
The variations in intensities measured on a series of spots of a few µm2 of a sample section indicate a heterogeneous distribution of opacifiers; indeed the examination by optical or electron microscopy shows clouds of about 10 to 20 µm in diameter which are visible for example in Figure 4a,b,d and Figure 5a,b, and Figures S7 and S10–S12 (Supplementary Materials), as observed in the soft-paste French porcelain lead-based glazes studied by Maggetti et al. [74], indicating precipitation-nucleation after (partial) dissolution in the molten glaze. In a few cases belonging to the second group of glazes, doublets at 635–970 cm−1 or at 665–990 cm−1 are observed (e.g., Figure S3b): they are characteristic of the two forms of wollastonite CaSiO3 (alpha and beta phases [66,75,76,77]) indicating calcium saturation of the lead-containing glaze. Precipitation of wollastonite is very common in glazes, the formation of either alpha or beta phase being function of the firing cycle [77]. The presence of alpha quartz is also evident by the strongest peak of this phase at 465 cm−1 (e.g., Figures S15, S20–S24 and S35) [29]. A secondary classification can therefore be made according to the opacifier and possibly the presence of a slip-layer of enriched in angular quartz grains.
3.4. Black Lines
The use of black lines to separate the coloured areas is explained both for aesthetic and technical reasons. The phases constituting these lines are spinels based on iron, manganese and chromium oxides being both refractory and capable of accommodating in their structure different transition ions, that is to say the copper and manganese colouring ions used for green and aubergine colours [29], thus stopping the ‘burrs’ of colour [29,31].
Figure 8 presents the signatures of the different types of pigments encountered for the different samples under blue laser excitation (all the spectra recorded with the green laser excitation are presented for each family on geographical and colour criteria after subtraction of the continuous background in Supplementary Materials, Figures S19–S50. Conclusions are the same as from blue-excited Raman spectrum): Figure 8a,b correspond to the black lines. Figure 8c,d correspond to the colours varying from yellow to green, based on the use of Naples yellow-type pigment [73,74,75,76,77,78,79,80,81,82,83].
Four types of signatures are observed for the black lines (Figure 8a,b), the first two are fairly well understood and documented, and the other two are rarer and less documented:
- (i)
- the first is characterized by an intense peak between ~630 and 695 cm−1 typical of the spinel phase (AB2O4 cubic structure in which A and B atoms are transition metals) rich in iron and/or manganese [84,85,86,87,88,89,90]; the width of the peak, which can be asymmetrical as a function of the site occupancy in the spinel structure [84], can vary by a factor of 2 to 3 (~50 to 150 cm−1) due to ion substitution disorder and non-stoichiometry (oxygen vacancies). Since the main peak can be described as the A1g mode of a B-O stretching mode, its position is a rough indication of the composition: at higher wavenumber for a cobalt-rich (e.g., 690 cm−1), weaker for iron-rich spinel (~670 cm−1), even lower for spinels rich in manganese or nickel (~630 cm−1).
- (ii)
- (iii)
- the third is a very broad peak centred on 600 cm−1 (Figure 8a) which shows similarities with that of the matter rich in manganese oxide.
- (iv)
These different signatures can be observed ‘pure’ or associated in the same object (e.g., in Istanbul Ottoman shard OA 3919/1010, 16th century, Figure 8b). This indicates the use of minerals of varying composition with a high uncertainty in the raw material selection process. The volume of glassy silicate matrix is limited in black line. We assume that the ‘precursor’ (ink) used to draw the black line mainly contains a mixture of chromite/spinel and limestone/lime.
3.5. Yellow and Red Areas
The lead-tin yellows with their intense peak around 135–140 cm−1 corresponding to the T’ mode of the Pb2+ ion lattice of the pyrochlore structure and the doublet of wide and weak bands at ~325 and 450 cm−1 [41,47,78,79,80,81,82,83] are easily detected, whatever the excitation laser and the instrument. The wavenumber of the intense Pb2+ peak position depends both on the non-stoichiometry of the pyrochlore phase (substitution by antimony, silicon, etc.) and on the synthesis/nucleation temperature [78,79,80,81,82,83], these parameters determining the structural distortion of the pyrochlore phase. Only the shard MAO 936/822 (1864 restoration tile, Bursa, Figure 8c) shows the fingerprint of a pigment rich in antimony with its characteristic intense mode at ~510 cm−1 [83]. The resonant character of the hematite spectrum recorded on the red coloured areas (e.g., Figure 8c) does not allow the nature of the silicate matrix of the glaze to be identified, the intensity of the silicate phase being not enhanced.
3.6. Elemental Composition Classification and Comparison with the Raman Data
Figure 9 compares the ternary diagrams constructed from the compositions (oxides in wt%) available in the references [63,64,65]. Data from reference [73] on Safavid tablewares and from references [28,46,47] on Iznik productions (collected artefacts, tiles already in place on famous building walls, and shards excavated from ancient Iznik kilns) are added for comparison. The choice of representing composition with ternary diagrams results in the fact that they allow us to compare, by associations of elements, certain characteristics of the glazes such as their silicate matrix and fluxing compounds used by the craftsmen and the use of (similar) raw materials. For the comparison of a large number of compositions, the approach using ternary diagrams is much more didactic than the discussion of values presented in a succession of tables. We will consider the diagrams comparing the relative proportions of the main fluxes (PbO, Na2O, K2O and CaO) that determine the nanostructure of the glassy network and hence the broad-band Raman fingerprint, and the addition of materials that can lead to the presence of opacifier (SnO2), and of pigments (Sb2O3, ZnO, MnO, Fe2O3, CoO, Cr2O3, As2O3, NiO) giving rise to narrow Raman peaks. Visualizing the distribution of data in ternary diagrams allows us to observe clusters of points and thus to associate one or more samples with each other, groups indicating the use of the same/similar raw materials and glazing processes.
3.6.1. Flux
Consider first the ternary diagram PbO-(Na2O+K2O)-CaO. All these oxides, usually called flux, react with silica to form a viscous phase at much lower temperature than pure silica. We see that most of the data are aligned for a constant ratio (K2O)/CaO, and that the yellow glazes are all very rich in lead. The extrapolation for lead-free composition is also consistent with the (lead-free) mean composition of blue-and-white Safavid tableware glazes reported by Crowe [73]: all data are distributed along a line going from the PbO summit to the centre of the Crowe data (Safavid glaze [73]). As the distribution of the values for the yellow enamels is rather weak whereas the measurement of the lead content can be affected by the variable thicknesses of the glaze layer(s), one can consider that this distribution of the yellow points corresponds to the uncertainty of the measurements. The distribution of the Crowe data gives an illustration of the heterogeneity of processing for similar artefacts. To be considered as different clusters, the differences must be greater. Thus, taking into account the intrinsic dispersion, three or four groups can be identified along the line of Figure 9a. It is clear that the red enamels have a very particular composition, almost free of sodium and potassium.
If we look precisely at the origins of the shards, roughly we have first from the bottom the Safavid tableware group (lead-free glaze) and then the Iranian Safavid/Qajar tile shards poorer in lead (second group) than those of the Istanbul Ottoman tiles (third group) and close to PbO summit, lead-rich glazes (Figure 9a,c). We therefore have a conclusion similar to the Raman classification, with the yellow enamels very rich in lead (Pb-G), the Iranian (Safavid, Qajar) and Timurid shards being the least rich ((Pb)Na-K-Ca-G) and the intermediate Anatolian (Ottoman) productions (Pb-Na-G). Examination of the ternary alkali-earth-alkali diagram (Figure 9c,d) confirms a constant K2O/CaO ratio and a variation in the sodium content.
Figure 10a compares the flux types with the previous measurements concerning the tiles of Topkapi Sarayi (dated from 15th to 17th centuries) [28], Edirne mosques (15th–16th centuries) [46] and shards excavated from Iznik ancient kilns (14th–17th centuries) [47]. The convergence of the results is evident. To facilitate the discussion, the inventory numbers of the shards whose data are at the periphery of the point clusters or isolated are indicated. Examination of colours other than yellow, red and ‘white’ confirms the classification with Iranian productions less rich in lead. We know that the borax which also provides more or less sodium and lithium was used for Anatolian productions [48] and this may explain differences between boron-based and boron-free glaze. Unfortunately, only the PIGE technique can measure the Li and B content in a non-invasive way and hence data are missing.
3.6.2. Opacifiers
The examination of the SnO2-PbO-SiO2 ternary diagram (Figure 9 and Figure 10c) shows compositions without tin (most red-coloured glazes) and with tin (yellows and some colourless glazes). Bursa tiles are the richest ones. In a previous work on Ifriqiya terra cotta (Zirids period), we also noted that the oldest artefacts contained larger amount of tin [70].
The plot of the tin oxide/lead oxide ratio (Figure 10c) confirms the different levels of SnO2 content (almost no tin for colourless glaze, and very minor (SnO2/PbO < ~0.06), minor (~0.5) and high (~1.6) according the Raman observations with three types of spectra showing a cassiterite-free spectrum (Ottoman 16th c.), small (Ottoman 15th c.) and intense (Iran 17th–18th c.) cassiterite signature, respectively. It is well established that tin remains dissolved in (standard) Iznik glaze without precipitation of cassiterite [29,45]. Most of the contents are close to 8–10 %wt SnO2, which corresponds to the minimal contents required for the precipitation of cassiterite. Values between 2 and 4 %wt SnO2 may result from the addition of lead containing some tin (obtained from ores or bronze recycling?). With typical tin content in bronze being close to 10%, mixing different raw material is likely. Figure 11 shows hierarchical classification of white (WH) and colourless (GL) glazes using silica and flux content as variable. The classification is obvious, Ottoman productions (2 sub-groups for Istanbul artefact and Bursa ones), and Iran productions (2 sub–groups including Ottoman tiles at Jerusalem) associated to Timurid artefacts.
Examination of the ternary diagrams of the characteristic oxides of the chromophores of black and brown enamels (iron, manganese and chromium oxides), blue (cobalt, arsenic and nickel oxides), yellow (zinc, tin and antimony oxides) and turquoise (lead, copper and iron oxides) are shown in Figure 11b and Figure 12.
3.6.3. Black Lines
The compositions of the black lines appear variable in lead content (Figure 9f), much richer in calcium, in agreement with the observation of wollastonite (CaSiO3) in many spectra of Figure 8 (narrow Raman peaks close to 1000 cm−1 [66,76,77]). The low Na2O and K2O content favours the refractoriness. One can think that the lead content arises from the contamination with lead of the adjacent coloured glaze. In addition, only chalk should have been mixed with spinel/chromite ores. The CoO/MnO ratio is given in Figure 10d. Classification based on elemental composition confirms the conclusions of the Raman analysis for the black pigments. The hierarchical classification from the contents of transition oxides (Figure 12c) as well as the examination of the ternary diagrams (Figure 12a,b) define the four groups corresponding to those identified by Raman spectroscopy: three types of spinel, rich, respectively, in iron, manganese and chromium oxide, plus rarer mixed cases which, as shown by the Raman analysis, can be explained by the simultaneous presence of the different phases. Previous local elemental analyses [63,64,73] also identify these different phases, in particular MgCr2O4.
Despite the dispersion of the results, it can be observed as previously reported [63,64] that the Timurid decorations preferentially use a spinel with an iron base and a little manganese, and the Ottoman decorations of the 15th century use a spinel richer in iron. The 16th century Ottoman artefacts use preferentially the chromite type like the Safavid productions. A previous study on the variability of elementary composition information on the same shard [91] makes it possible to estimate that for example the two subgroups observed in Figure 12b for Safavid tablewares are significant. Consequently, for example, for the ternary diagram of Figure 12a at least 7 subgroups are identifiable for the black lines and 5 for the colour brown. Variability ores is consistent with the use of ores from different mining or the change of the types of ore with the advancement of the exploitation of the mining. However, as in this work we want to identify the main categories, we will only be interested in the groups.
3.6.4. Blue
Concerning blue-coloured enamels, we identified four groups both using ternary diagrams and hierarchical classification (Figure 12c), as observed in a review [88] of the previous literature: cobalt sources rich in arsenic (two groups with or without nickel, Figure 12e), cobalt containing nickel but no arsenic (generally corresponding to light blue colour) and ‘pure’ cobalt. Ratio (Figure 10d) and hierarchical diagram (Figure 12a) show that Iranian and Ottoman sources of cobalt are different. The presence of arsenic in Timurid and Safavid productions has already been noted and in agreement with the treatises of Abu al-Qâsem Kâshâni [92,93,94] and attributed to the use of minerals from the mines of Kashan in Iran [94,95,96,97,98]. However, the hierarchical classification concerning the blue zones (Figure 12e) does not allow the definition of more precise groups. This indicates a large variability of the ores of cobalt and that arsenic and nickel contents are insufficient tools of classification using the multivariate analyses. The examination of the ternary diagrams of contents determining the sintering (flux) or the colours (transition metals) appears more effective to identify the common characteristics or the differences concerning the various productions.
Al-Qâsem also mentions the mines of Anârak (Iran) which are associated with the cobalt mixed with bismuth and nickel. Safavid tableware data are included for hierarchical classification. For instance, for black areas, we find a classification similar to Figure 11a, Iranian Safavid/Qajar production, Ottoman production, then Timurid.
Some of the Isfahan tiles (AD 15117, AFI 2299, MAO 936/644b, MAO 936/642, MAO 2025d (Iran) and the tile of Green Complex (Bursa, MAO 936/822) contain rather pure cobalt in the dark blue decor. This gives arguments for a more precise dating of the shards. Thus, for AD 15517, AFI 2299, MAO 936/644b, MAO 936/642 and MAO 2025d this refers to the end of the assigned date as proposed in Table 1 which is valid, when preparative chemistry permitted the purification of cobalt, i.e., after the middle of the 19th century [88]. The use of purified cobalt in MAO 936/822, which is a restoration tile dated 1864, contains rather pure cobalt in the dark blue decoration in conformity with its production date. The effectiveness of the control of metals associated with cobalt proves again its effectiveness as an element of dating.
3.6.5. Yellow Pigment
For the yellow glazes (Figure 11b), only the 1864 restoration (MAO 936–822 shard) uses an antimony-based pyrochlore in agreement with the Raman analysis (spectrum with ~505 cm−1 strong peak). Almost all turquoises are rich in lead, as for the yellow glaze.
3.7. Correlation between Raman Fingerprint and Raw Materials: Luminescence Contribution—Application to the Identification of Objects
The spectrum obtained on a Raman spectrometer is not only made up of the fundamental Raman vibration modes, or in the event of (pre)resonance effect with also the overtones and combinations of these fundamental modes (as for some magnesium chromite spectra), but also of the fluorescence bands. The removal of the continuous background leads to a loss of information. The fluorescence spectrum usually consists of broad bands, the width at half height, if expressed in cm−1, of 500 cm−1 and more. They can be very intense and completely mask the Raman spectrum. The origins are multiple. We will only consider here the case of inorganic matter. The fluorescence can be intrinsic, resulting from the illumination of the phases present in the bulk, amorphous or crystalline, in particular if they have semiconductor properties or contain ions of transition metals or rare earths, i.e., with 3d or 4f electronic shells partially filled, or extrinsic due to the presence of organic/biological pollution at the sample surface/porosity resulting from prolonged contact with the ground (archaeological samples), or from contact with organic solvents or liquids (for example cutting or polishing lubricants). Presence of oxygen vacancies more or less filled with proton or water gives rise to luminescence [99]. The energy of the illuminating laser must be sufficient to excite the fluorescence. This is why a NIR or IR laser does not excite certain fluorescence but the intensity of the Raman scattering decreases with the power factor of 4. This is why an excitation with a violet, blue or otherwise green laser is preferred in the analysis of glass and ceramics.
If the fluorescence results from the surface contamination, its signal will decrease in a few tens of minutes under illumination, or even disappear if the power is sufficient to clean the surface. For a material with little porosity, empirically, it takes a few minutes under ~1 mW/µm2 with a blue laser and ~10 mW/µm2 with a green laser. A fluorescence spectrum that is stable over time under such powers will a priori be intrinsic. Although the energy scale is expressed in cm−1, the scale having a physical meaning is the absolute scale in nm. The other type of intrinsic fluorescence corresponds to electronic transitions involving the 3d or 4f electron layers [53,66]. They are widely studied for ions allowing laser emissions in appropriate matrices such as Eu and Nd ions, for example, in glasses or crystalline phases garnet (YAG) or fluorite (CaF2) type [100,101]. The spectrum consists of series of multiple narrow peaks. This type of fluorescence is quite common in modern pigments where the matrix is of the zircon (ZrSiO4), zirconia (ZrO2), rutile (TiO2) or cassiterite (SnO2) type, the colour being obtained by addition of small amount of transition metal or rare earth ions [53]. Wollastonite is expected to be the host framework of the luminescence source in glazed ceramics [53,66,102,103]. The fluorescence spectrum is used as a marker of the geological origin of certain minerals [66,104,105]. The objective is not only to identify the components of fluorescence but also to focus on what the fingerprint that the background consists of can bring. Indeed, the shape of the continuous fluorescence background has been proposed as an additional marker of the origin of the raw materials [53], in support of the correlations relating to the presence of associated, minor or trace elements detected by XRF.
3.8. Application to Tableware
We will consider the spectra of Figure 7 corresponding to the three types of enamels and Figure 13 which compares the spectra for three objects: a polychrome Iznik dish of the 16th century, a Safavid blue-and-white dish of the 17th century, and a bowl decorated with mina’i of the 12th–13th century. The Raman fingerprint of the silicate glaze allows one to classify the different artefacts. The different backgrounds and Raman fingerprints are obvious. The SiO4 stretching band of polychrome dish is characteristic of Iznik production (doublet at ~990–1050 cm−1 (Pb-Na-G fingerprint) [29]. The black line of Iznik dish exhibits the Raman signature of chromite (ca. 850 cm−1 peak). The Safavid dish shows the strong stretching band at ~1100 cm−1 characteristic of (Pb)Na-K-Ca-G fingerprint whatever the colour of the glaze.
The mina’i decoration shows variable spectroscopic signatures: red decoration exhibits the lowest wavenumber position of SiO4 stretching band, below 1000 cm−1 characteristic of lead-rich glaze (Pb-G); black hair, turquoise and dark green areas show a doublet at about 990–1050 cm−1 characteristic of lead-alkali glaze; surprisingly, the spectrum of the white carnation of the figure head exhibits a peak at ~1100 cm−1 characteristic of lead-free glaze. The variety of technical solutions used shows the technological advance acquired by the Iranian potters of the Middle-Ages and the technical complexity of realization involving several firings and the importance of collecting Raman spectra from all parts of the setting. Indeed, both the positions in wavenumber and the ratio of the areas of the deformation and elongation modes of the SiO4 tetrahedron are incompatible with the same melting temperature [57,58,59] and therefore several firings were necessary.
The spectra of the Iznik shard in Figure 7 show a fluorescence having its maximum around 2900 cm−1 while for the Safavid shard most zones show a band having in addition a component around 3700 cm−1. The Iznik dish in Figure 13 shows a band whose maximum is very close (around 2500 cm−1) for the turquoise and colourless glazes (spectrum not shown) and beyond 4500 cm−1 for the black and blue glazes. For the Safavid dish, the fluorescence has two components, one with a maximum around 1700 cm−1 and the other above 4500 cm−1. This confirms the possibility of using the fluorescence signature as an additional marker. The observation of the continuous fluorescence background gives additional arguments for the identification of the place of production. The fluorescence profile is almost identical for the production of Iznik ware, the regularity of production of these objects having already been demonstrated spectroscopically concerning the Raman signature of the vibration modes [29]. At the present, the traditional Iznik style ceramic and tile productions continue in different workshops in Türkiye. The firing procedure and the layering (body, slip, decor and glaze) remains the same, but the trace elements vary related to the use of different raw materials. Particularly, the presence of barite (up to 3.7 wt%) in the new productions distinguish the older ones. Moreover, most modern glazes contain a higher amount of lead oxide (44–55 wt%). The content of CaO and MgO decreases compared to the traditional production [106].
4. Conclusions
This study showed that the Raman analysis and the examination of the distributions of the elementary compositions in ternary diagrams led to the same classification of the objects. The three types of glazes identified (lead-rich, mixed lead-(earth) alkali and (earth) alkali-rich) have already been proposed previously [107] considering only the composition. As shown in the spectra of Figure 6 and dendrogram of Figure 11a, the lead-alkali and alkali-rich groups correspond to Ottoman and non-Ottoman productions (Safavid-Qajar and Timurids). If the glaze of Safavid tiles contains some lead, the use of lead-free glaze for Safavid tableware indicates that the toxic effects of lead for health and wellness were known at that time. Identification of the glaze composition type from the Raman spectrum is thus obvious by a simple visual examination. One of the other strengths of the Raman analysis of glazes and pigments/opacifiers is the localized nature of the analysis which allows a specific zooming of the different parts of the decoration, at different scales (differentiation between crystalline grains and glassy matrix) as this work shows several types of glazes that can be associated in the same ceramic or different pigments in a single black line. For instance, overglazes coloured with lead-tin yellow pigments belong to lead-rich composition and spinel of different composition can be present.
Not only the visual examination of the Raman signatures but also the examination of the clustering of the data in diagrams as well as the hierarchical classification shows the technical relation between the Ottoman tiles of Bursa, Edirne, and those of the buildings of Istanbul (e.g., Baghdad Kiosk, Şehzade Mosque) and even tiles of Jerusalem of our corpus. However, the tiles of Timurid appear to be in terms of glazes linked to Iranian Safavid and Qajar productions. The mina’i decorations use mainly lead-containing enamels in which the compositions are variable and some of the decorations are made with glazes without or with very low lead. This shows the importance of local analysis to identify technological innovations concerning enamelling carried out in the Iranian world.
To date, data concerning old mines are rare and the intrinsic variability of many mining sites means that knowledge of the ores exploited in the past is certainly impossible in many cases. The information obtained by comparing the different analyses is therefore the surest method to identify in the results the clusters compatible with the use of the same raw materials. The study of the stratigraphy of the layers of enamel and the interfaces between layers and the comparison with the studies of artisanal practices also provided information to be compared with the localized analyses (surface of the enamel, interfacial zones, etc.) that allow Raman analysis. We were able to conduct the analyses of these precious objects in the storage/exhibition rooms of the museum since there is no need for sample preparation with the Raman analysis. Both the similarity of the SiO4 Raman signature characteristic of the process and the fluorescence background profile characteristic of the raw materials are significant. It can be thus concluded that the ratio of the band areas of the vibrations of deformation and elongation which is roughly proportional to the melting temperature, is a little higher for the alkaline glazes (Safavid-Qajar). This information shows that these glazes are fired at a higher temperature than the lead-alkaline (Ottoman) glazes.
Supplementary Materials
The following supporting information can be downloaded at: https://www.mdpi.com/article/10.3390/min13070977/s1, Figures S1–S21: As-recorded Raman spectra and micrographs of polished shards (488 nm excitation); Figures S22–S58, baseline-subtracted Raman (532 nm excitation) respectively for white (Figures S22–S28), green (Figures S28–S31), yellow (Figures S32–S35), turquoise (Figures S36–S40), blue 517 (Figures S41–S47), brown (Figures S48–S50), black line (Figures S51–S56) and red (Figures S57 and S58), assembled as a function of the different origins assigned.
Author Contributions
Conceptualization, P.C.; methodology, P.C. and G.S.F.; investigation, P.C.; writing—original draft preparation, P.C. and G.S.F.; writing—review and editing, P.C. and G.S.F. All authors have read and agreed to the published version of the manuscript.
Funding
This research received no external funding.
Data Availability Statement
Raman data are given as Supplementary Materials. Composition tables are available on request from L. Martinet and the authors.
Acknowledgments
The authors kindly acknowledge Lucile Martinet for the permission to use her elementary composition data to compare them with Raman data and for providing some photographs of the shards. Charlotte Maury (Musée du Louvre, Paris) is acknowledged for the critical reading of manuscript and Laure Soustiel for much advice and the access to artefacts.
Conflicts of Interest
The authors declare no conflict of interest.
References
- Soustiel, J.; Porter, Y. Tombeaux de Paradis: Le Shâh-e Zende de Samarcande et la Céramique Architecturale d’Asie Centrale; Editions d’Art Monelle Hayot: Saint-Rémy-en-l’Eau, France, 2003. [Google Scholar]
- Soustiel, J. La Céramique Islamique—Le Guide du Connaisseur; Office du Livre; Editions Vilo: Fribourg, Switzerland, 1985. [Google Scholar]
- Yilmaz, G. Edirne’nin erken Osmanli devri yapilarinda çini süsleme. Trak. Üniversitesi Edeb. Fakültesi Derg. 2015, 5, 59–80. [Google Scholar]
- Golombek, L. Timurid potters abroad, N°2 La Civiltà Timuride come fenomeno internazionale vol II (Letteratura-Arte). Oriento Mod. 1996, 15, 577–586. [Google Scholar] [CrossRef]
- Grazhdankina, N.S.; Rakhimov, M.K.; Pletnev, I.E. Architectural Ceramics of Uzbekistan; Bureau de l’UNESCO: Tachkent, Uzbekistan, 2006; Available online: https://unesdoc.unesco.org/ark:/48223/pf0000189335 (accessed on 4 June 2023).
- Aube, S.; Lorain, T.; Bendezu-Sarmiento, J. The Complex of Gawhar Shad in Herat: New Findings about its Architecture and Ceramic Tile Decorations. Iran 2020, 58, 62–83. [Google Scholar] [CrossRef]
- Ben Amara, A.; Schvoerer, M.; Haddad, M.; Akerraz, A. Recherche d’indices sur les techniques de fabrication de Zelliges du XIVe siècle (Chellah, Maroc). Rev. D’archéometrie 2003, 27, 103–113. [Google Scholar] [CrossRef]
- El Amraoui, M.; Azzou, A.; Haddad, M.; Bejjit, L.; Ait Lyazidi, S.; El Amraoui, Y. Zelliges from Dar-El Beïda Palace in Meknes (Morocco): Optical Absorption and Raman Spectrometry. Spectrosc. Lett. 2007, 40, 777–783. [Google Scholar] [CrossRef]
- Henni Ibtissem, M.; Khaldi, M. L’art du Zellige Dans L’architecture Musulmane. Cas des Mosquées Zianides de Tlemcen. 2018. Available online: https://e-biblio.univ-mosta.dz/bitstream/handle/123456789/11974/L%20art?sequence=1 (accessed on 4 May 2023).
- Pérez-Arantegui, J.; Soto, M.; Castillo, J.R. Examination of the ‘Cuerda Seca’ decoration technique on Islamic ceramics from Al-Andalus (Spain). J. Cult. Herit. 1999, 26, 935–941. [Google Scholar] [CrossRef]
- Chapoulié, R.; Delery, C.; Daniel, F.; Venrell-Saz, M. Cuerda Seca ceramics from Al-Andalus, Islamic Spain and Portugal (10th–12th centuries AD): Investigation with SEM-EDX and Cathodoluminescence. Archaeometry 2005, 47, 519–534. [Google Scholar] [CrossRef]
- Colomban, P.; March, G.; Mazerolles, L.; Karmous, T.; Ayed, N.; Ennabli, A.; Slim, H. Raman identification of materials used for jewellery and mosaics in Ifriqiya. J. Raman Spectrosc. 2003, 34, 205–213. [Google Scholar] [CrossRef]
- Ricciardi, P.; Colomban, P.; Tournié, A.; Macchiarola, M.; Ayed, N. A non-invasive study of Roman age mosaic glass tesserae by means of Raman Spectroscopy. J. Archaeol. Sci. 2009, 36, 2551–2559. [Google Scholar] [CrossRef]
- Neri, E.; Morvan, C.; Colomban, P.; Guerra, M.P.; Prigent, V. Late Roman and Byzantine Mosaic opaque “Glass-ceramics” Tesserae (5th–9th century). Ceram. Int. 2016, 42, 18859–18869. [Google Scholar] [CrossRef] [Green Version]
- El Halim, M.; Daoudi, L.; El Alaoui El Fels, A.; Rebbouh, L.; El Ouahabi, M.; Fagel, N. Non-destructive portable X-ray Fluorescence (pXRF) method for the characterization of Islamic architectural ceramic: Example of Saadian tombs and El Badi palace ceramics (Marrakech, Morocco). J. Archaeol. Sci. Rep. 2020, 32, 102422. [Google Scholar] [CrossRef]
- Kiefer, C. Les Céramiques siliceuses d’Anatolie et du Moyen-Orient. Bull. Soc. Fr. Ceram. 1956, 30, 3–24. [Google Scholar]
- Kiefer, C. Les Céramiques siliceuses d’Anatolie et du Moyen-Orient. Bull. Soc. Fr. Ceram. 1956, 31, 17–34. [Google Scholar]
- Kiefer, C. Supplement Materials in La Céramique Islamique—Le Guide du Connaisseur; J. Soustiel Office du Livre; Editions Vilo: Fribourg, Switzerland, 1985; pp. 368–380. [Google Scholar]
- Tite, M.S. Iznik pottery: An investigation of the method of production. Archaeometry 1989, 31, 115–132. [Google Scholar] [CrossRef]
- Henderson, J.; Raby, J. The Technology of Fifteenth Century Turkish Tiles: An Interim Statement on the Origins of the Iznik Industry; World Archaeol. 21 (1) Ceramic Technology; Taylor & Francis, Ltd.: London, UK, 1989; pp. 115–132. [Google Scholar]
- Henderson, J.; Atasoy, N.; Raby, J. Iznik, ceramics: A technical examination. In Iznik: The Pottery of Ottoman Turkey; Petsopoulos, Y., Ed.; Alexandria Press: London, UK, 1989; pp. 65–70. [Google Scholar]
- Atasoy, N.; Raby, J. Part 2: 1480–1560: Development and growth of Iznik pottery. In Iznik: The Pottery of Ottoman Turkey; Petsopoulos, Y., Ed.; Alexandria Press: London, UK, 1989; pp. 50–64. [Google Scholar]
- Necipoglu, S. From International Timurid to Ottoman: A Change of Taste in Sixteenth-Century Ceramic Tiles. Muqarnas 1990, 7, 136–170. Available online: https://www.academia.edu/42017931/From_International_Timurid_to_Ottoman_A_Change_of_Taste_in_Sixteenth–Century_Ceramic_Tiles (accessed on 25 May 2023). [CrossRef]
- Okyar, F. Characterization of Iznik Ceramics. Ph.D. Thesis, Istanbul Technical University, Istanbul, Turkey, 1995. [Google Scholar]
- Paynter, S.; Okyar, F.; Wolf, S.; Tite, M.S. The production of Iznik pottery—A reassessment. Archaeometry 2004, 46, 421–437. [Google Scholar] [CrossRef]
- Denny, W.B. Iznik La Ceramique Turque et l’Art Ottoman; Citadelles and Mazenod: Paris, France, 2004. [Google Scholar]
- Tite, M.S.; Wolf, S.; Mason, R.B. The technological development of stonepaste ceramics from the Islamic Middle East. J. Archaeol. Sci. 2011, 38, 570–580. [Google Scholar] [CrossRef]
- Simsek, G. Characterization of Structure of Alkali and Lead-Alkali Glazes by Raman Spectrometry. Ph.D. Thesis, Istanbul Technical University, Istanbul, Turkey, 2011. [Google Scholar]
- Colomban, P.; Milande, V.; Le Bihan, L. On-site Raman analysis of Iznik pottery glazes and pigments. J. Raman Spectrosc. 2004, 35, 527–535. [Google Scholar] [CrossRef] [Green Version]
- Demirci, E.N.; Caner-Saltik, A.; Turkmenoglu, S.; Ozcilingir-Arkun, O.; Bakirer, O. Raw material characteristics and technological properties of some glazed ceramics and tiles in Anatolia, Euro Ceramics VIII, PTS 1-3. Key Eng. Mater. 2004, 264–268, 2395–2398. [Google Scholar] [CrossRef]
- Colomban, P.; de Laveaucoupet, R.; Milande, V. On Site Raman Analysis of Kütahya fritwares. J. Raman Spectrosc. 2005, 36, 857–863. [Google Scholar] [CrossRef]
- Simsek, G.; Colomban, P.; Milande, V. Tentative differentiation between Iznik tiles and copies with Raman spectroscopy using both laboratory and portable instrument. J. Raman Spectrosc. 2010, 41, 529–536. [Google Scholar] [CrossRef]
- O’Kane, B. Tiles of many hues: The development of Iranian Cuerda seca Tiles and the Transfer of Tilework Technology-Appendix. In And Diverse Are Their Hues: Color in Islamic Art and Culture; Blair, S.S., Bloom, J.M., Eds.; Yale University Press: New Haven, CT, USA, 2011; pp. 201–203. [Google Scholar]
- Mahi, K. Les «Maitres de Tabriz», Céramistes dans L’empire Ottoman: Une mise au Point sur leur Identification. Eurasian Stud. 2017, 15, 36–79. Available online: https://brill.com/view/journals/eurs/15/1/article-p36_36.xml (accessed on 25 May 2023). [CrossRef]
- Holakkoei, P. Technological Study of the Seventeenth Century Haft Rang Tiles in Iran with a Comparative Views to the Cuerda Seca in Spain. Ph.D. Thesis, Università Degli Studi di Ferrara, Ferrara, Italy, 2012. [Google Scholar]
- Simsek, G.; Geckinli, A.E. An assessment study of tiles from Topkapi Palace Museum with energy-dispersive X-ray and Raman spectrometers. J. Raman Spectrosc. 2012, 43, 917–927. [Google Scholar] [CrossRef]
- Caner Saltık, E.N.; Colomban, P.; Soulet, V.; Demirci, S.; Türkmenoğlu, A.; Özçilingir Akgün, S.; Bakırer, Ö. Analyses of Anatolian medieval ceramic glazes using XRD and non-destructive Raman micro-spectrometry. In Proceedings of the Colloque du GMPCA, Archaeometrie 2013, Bordeaux, France, 16–19 April 2013. [Google Scholar]
- Gulmini, M.; Giannini, R.; Lega, A.M.; Mirti, P. Technology of production of Ghazhanid glazed pottery from Bust and Lashkar-I Bazar (Afghanistan). Archaeometry 2013, 55, 569–590. [Google Scholar] [CrossRef]
- Özçatal, M.; Yaygıngöl, M.; Issi, A.; Kara, A.; Turan, S.; Okyar, F.; Taş, P.; Nastova, I.; Grupče, O.; Minčeva-Šukarova, B. Characterization of lead glazed potteries from Smyrna (Izmir/Turkey) using multiple analytical techniques; Part I: Glaze and engobe. Ceram. Int. 2014, 40, 2143–2151. [Google Scholar] [CrossRef]
- Constantinescu, B.; Cristea-Stan, D.; Kovács, I.; Szökefalvi-Nagy, Z. External milli-beam PIXE analysis of the mineral pigments of glazed Iznik (Turkey) ceramics. Period. Mineral. 2014, 83, 159–169. [Google Scholar]
- Kirmizi, B.; Göktürk, E.H.; Colomban, P. Colouring agents in the pottery glazes of Western Anatolia: New evidence for the use of Naples yellow pigment variations during the late Byzantine period. Archaeometry 2015, 57, 476–496. [Google Scholar] [CrossRef]
- Tite, M.; Watson, O.; Pradell, T.; Matin, M.; Molina, G.; Domoney, K.; Bouquillon, A. Revisiting the beginnings of tin-opacified Islamic glazes. J. Archaeol. Sci. 2015, 57, 80–91. [Google Scholar] [CrossRef] [Green Version]
- Tite, M.S.; Shortland, A.J.; Schibille, N.; Degryse, P. New Data on the Soda Flux Used in the Production of Iznik Glazes and Byzantine Glasses. Archaeometry 2016, 58, 57–67. [Google Scholar] [CrossRef]
- Wen, R.; Pollard, A.M. The pigments applied to Islamic Mina’i wares and the correlation with Chinese blue-and-white porcelain. Archaeometry 2016, 58, 1–16. [Google Scholar] [CrossRef]
- Olcer, S. 15th and 16th centuries blue-white ceramics: Comparison of Ottoman, Safavid and Chinese Samples in the style context. STD XXVII 2018, 27, 265–301. (In Turkish) [Google Scholar]
- Simsek, G.; Unsalan, O.; Bayraktar, K.; Colomban, P. On-site pXRF analysis of glaze composition and colouring agents of “Iznik” tiles at Edirne mosque (15th and 16th-centuries). Ceram. Int. 2019, 45, 595–605. [Google Scholar] [CrossRef]
- Simsek, G.; Demirsar Arli, B.; Kaya, S.; Colomban, P. On-site pXRF analysis of body, glaze and colouring agents of the tiles at excavation site of Iznik kilns. J. Eur. Ceram. Soc. 2019, 39, 2199–2209. [Google Scholar] [CrossRef]
- Burlot, J.; Waksman, S.Y.; MacDonald, B.; Higgins, B. LA-ICP-MS analyses to determine provenances of Na-based fluxes and Co-based pigments used in early Ottoman pottery. In Proceedings of the 43rd Symposium International d’Archéométrie (ISA), Lisbonne, Portugal, 16–20 May 2022. [Google Scholar]
- Edwards, H.G.M.; Vandenabeele, P.; Colomban, P. Raman Spectroscopy of Cultural Heritage Preservation; Springer: Cham, Switzerland, 2023. [Google Scholar]
- Colomban, P.; Simsek Franci, G.; Burlot, J.; Gallet, X.; Zhao, B.; Clais, J.B. Non-Invasive on-Site pXRF Analysis of Coloring Agents, Marks and Enamels of Qing Imperial and Non-Imperial Porcelain. Ceramics 2023, 6, 447–474. [Google Scholar] [CrossRef]
- Colomban, P.; Gironda, M.; Edwards, H.G.M.; Mesqui, V. The enamels of the first (softpaste) European blue-and-white porcelains: Rouen, Saint-Cloud and Paris factories: Complementarity of Raman and X-ray fluorescence analyses with mobile instruments to identify the cobalt ore. J. Raman Spectrosc. 2021, 52, 2246–2261. [Google Scholar] [CrossRef]
- Colomban, P.; Ngo, A.-T.; Fournery, N. Non-invasive Raman Analysis of 18th Century Chinese Export/Armorial Overglazed Porcelain: Identification of the Different Enameling Technology. Heritage 2022, 5, 233–259. [Google Scholar] [CrossRef]
- Colomban, P. Full Spectral Range Raman Signatures Related to Changes in Enameling Technologies from the 18th to the 20th Century: Guidelines, Effectiveness and Limitations of the Raman Analysis. Materials 2022, 15, 3158. [Google Scholar] [CrossRef]
- Mysen, B.; Virgo, D.; Scarfe, C.M. Relations between the anionic structure and viscosity of silicate melts—A Raman spectroscopic study. Am. Mineral. 1980, 65, 690–710. [Google Scholar]
- Mysen, B.; Finger, L.W.; Virgo, D.; Seifert, F.A. Curve-fitting of Raman-spectra of silicate-glasses. Am. Mineral. 1982, 67, 686–695. [Google Scholar]
- McMillan, P. Structural studies of silicate-glasses and melts—Applications and limitations of Raman spectroscopy. Am. Mineral. 1984, 69, 622–644. [Google Scholar]
- Colomban, P. Polymerisation Degree and Raman Identification of Ancient Glasses used for Jewellery, Ceramics Enamels and Mosaics. J. Non-Crystall. Solids 2003, 323, 180–187. [Google Scholar] [CrossRef]
- Colomban, P.; Paulsen, O. Raman Determination of the Structure and Composition of Glazes. J. Am. Ceram. Soc. 2005, 88, 390–395. [Google Scholar] [CrossRef]
- Colomban, P.; Tournié, A.; Bellot-Gurlet, L. Raman identification of glassy silicates used in ceramics, glass and jewellery: A tentative differentiation guide. J. Raman Spectrosc. 2006, 37, 841–852. [Google Scholar] [CrossRef] [Green Version]
- Colomban, P. Non-destructive Raman analysis of ancient glasses and glazes, ch. 4.2. In Modern Methods for Analysing Archaeological and Historical Glass, 1st ed.; Janssens, K., Ed.; John Wiley and Sons Ltd.: London, UK, 2012; pp. 275–300. [Google Scholar]
- Jacquemin, M.; Simon, P.; Canizares, A.; Hennet, L.; Bessada, C.; Skrelic, D.; Gouillart, E.; Burov, E. High-sensitivity Raman imaging of the surface of casted glass plates. J. Raman Spectrosc. 2021, 52, 1048–1054. [Google Scholar] [CrossRef]
- Simsek, G.; Colomban, P.; Casadio, F.; Bellot-Gurlet, L.; Faber, K.; Zelleke, G.; Milande, V.; Tilliard, L. On-site identification of early Böttger red stonewares using portable XRF/Raman instruments: 2, glaze and gilding analysis. J. Am. Ceram.Soc. 2015, 98, 3006–3013. [Google Scholar] [CrossRef] [Green Version]
- Martinet, L.; Ben Amara, A.; Pacheco, C.; Lemasson, Q.; Moignard, B.; Pichon, L.; Colomban, P. Colored Glaze Tiles during the Ottoman Empire (beginning of the 15th to the/mid 16th century)? In Proceedings of the EMAC 2015 Proceeding 13th European Meeting on Ancient Ceramics, Athens, Greece, 24–26 September 2015. [Google Scholar]
- Martinet, L. “Cloisonné” Colored Glaze Tiles during the Ottoman Era (Fifteenth-Sixteenth Centuries). In Glazed Wares, as Cultural Agents in the Byzantine, Seljuk, and Ottoman Lands, Proceedings of the 13th International Anamed Annual Symposium, 6–7 December 2018; Kontogiannis, N.D., Böhlendorf-Arslan, B., Yenisehirlioglu, F., Eds.; Koç University Press: Istanbul, Turkiye, 2021; pp. 257–267. [Google Scholar]
- Martinet, L. Colored Glaze Tiles during the Ottoman Era (Fifteenth-Sixteenth Centuries, EHESS, Paris, France, in Redaction). Ph.D. Thesis, Universite DE Versailles Saint-Quentin-en-Yvelines, Paris, France, 2015. [Google Scholar]
- Kamura, S.; Tani, T.; Matsuo, H.; Onaka, Y.; Fujisawa, T.; Unno, M. New Probe for Porcelain Glazes by Luminescence at Near-Infrared Excitation. ACS Omega 2021, 6, 7829–7833. [Google Scholar] [CrossRef]
- Available online: https://collections.louvre.fr; (accessed on 20 March 2023).
- Munier, P. Technologie des Faïences; Gauthier-Villars: Paris, France, 1957. [Google Scholar]
- Colomban, P.; Calligaro, T.; Vibert-Guigue, C.; Nguyen, Q.L.; Edwards, H.G.M. Accrochage des dorures sur les céramiques et tesselles anciennes. Rev. D’archéométrie 2006, 29, 7–20. [Google Scholar] [CrossRef] [Green Version]
- Colomban, P.; Sagon, G.; Louhichi, A.; Binous, H.; Ayed, N. Identification par microscopie Raman des tessons et pigments de glaçures de céramiques de l’Ifriqiya (Dougga, XI-XVIIIe siècles). Rev. D’archéométrie 2001, 25, 101–112. [Google Scholar] [CrossRef]
- Tanevska, V.; Colomban, P.; Minceva-Sukarova, B.; Grupce, O. Study of pottery from the Republic of Macedonia I: Raman analysis of Byzantine glazed pottery excavated from Prilep and Skopje (12th–14th century). J. Raman Spectrosc. 2009, 40, 1240–1248. [Google Scholar] [CrossRef]
- Matin, M.; Gholamnejad, M.; Abkenar, A.N. ‘We must send you a sample’—A Persian–European dialogue: Insights into late nineteenth-century ceramic technology based on chemical analysis of tiles from the Ettehadieh house complex, Tehran, Iran. R. S. Note Rec. 2021, 75, 5–37. [Google Scholar] [CrossRef]
- Crowe, Y. Persia and China Safavid Blue and White Ceramics in the Victoria & Albert Museum 1501–1738; Thames & Hudson Ltd.: London, UK; La Borie, France; Geneva, Switzerland, 2002; pp. 290–304. [Google Scholar]
- Maggetti, M.; d’Albis, A. Phase and compositional analysis of a Sèvres soft paste porcelain plate from 1781, with a review of early porcelain techniques. Eur. J. Mineral. 2017, 29, 347–367. [Google Scholar] [CrossRef] [Green Version]
- Colomban, P.; Robert, I.; Roche, C.; Sagon, G.; Milande, V. Identification des porcelaines “tendres” du 18ème siècle par spectroscopie Raman: Saint-Cloud, Chantilly, Mennecy et Vincennes/Sèvres. Rev. D’archéométrie 2004, 28, 153–167. [Google Scholar] [CrossRef]
- Liem, N.Q.; Thanh, N.T.; Colomban, P. Reliability of Raman Microspectrometry in Analysis of Ancient Ceramics: The case of Ancient Vietnamese Porcelains and Celadon Glazes. J. Raman Spectrosc. 2002, 33, 287–294. [Google Scholar] [CrossRef]
- Böhme, N.; Hauke, K.; Neuroth, M.; Geisler, T. In situ Raman imaging of high-temperature solid-state reactions in the CaSO4–SiO2 system. Int. J. Coal Sci. Technol. 2019, 6, 247–259. [Google Scholar] [CrossRef] [Green Version]
- Sakellariou, K.; Miliani, C.; Morresi, A.; Ombelli, M. Spectroscopic investigation of yellow majolica glazes. J. Raman Spectrosc. 2004, 35, 61–67. [Google Scholar] [CrossRef]
- Sandalinas, C.; Ruiz-Moreno, S.; Lopez-Gil, A.; Miralles, J. Experimental confirmation by Raman spectroscopy of a Pb-Sn-Sb triple oxide yellow pigment in sixteenth-century Italian pottery. J. Raman Spectrosc. 2006, 37, 1146–1153. [Google Scholar] [CrossRef]
- Rosi, F.; Manuali, V.; Miliani, C.; Brunetti, B.G.; Sgamellotti, A.; Grygar, T.; Hradil, D. Raman scattering features of lead pyroantimonate compounds. Part I: XRD and Raman characterization of Pb2Sb2O7 doped with tin and zinc. J. Raman Spectrosc. 2009, 40, 107–111. [Google Scholar] [CrossRef]
- Pereira, M.; de Lacerda-Aroso, T.; Gomes, M.J.M.; Mata, A.; Alves, L.C.; Colomban, P. Ancient Portuguese ceramic wall tiles (“Azulejos”): Characterization of the glaze and ceramic pigments. J. Nano Res. 2009, 8, 79–88. [Google Scholar] [CrossRef]
- Pelosi, C.; Agresti, G.; Santamaria, U.; Mattei, E. Artificial Yellow Pigments: Production and Characterization through Spectroscopic Methods of Analysis. E-Preserv. Sci. 2010, 7, 108–115. Available online: http://www.morana-rtd.com/e-preservationscience/2010/Pelosi-10-05-2010.pdf (accessed on 25 May 2023).
- Colomban, P.; Kırmızı, B.; Gougeon, C.; Gironda, M.; Cardinal, C. Pigments and glassy matrix of the 17th–18th century enamelled French watches: A non-invasive on-site Raman and pXRF study. J. Cult. Herit. 2020, 44, 1–14. [Google Scholar] [CrossRef]
- Cvejic, Z.; Rakic, S.; Kremenovic, A.; Antic, B.; Jovalekic, C.; Colomban, P. Nanosize ferrites obtained by ball milling. Crystal structure, cation distribution, size-strain analysis and Raman investigations. Solid State Sci. 2006, 8, 908–915. [Google Scholar] [CrossRef]
- Froment, F.; Tournié, A.; Colomban, P. Raman identification of natural red to yellow pigments: Ochre and iron-containing ores. J. Raman Spectrosc. 2008, 39, 560–568. [Google Scholar] [CrossRef]
- Colomban, P.; Jullian, S.; Parlier, M.; Monge-Cadet, P. Identification of the high-temperature impact/friction of aeroengine blades and cases by micro Raman spectroscopy. Aerosp. Sci. Technol. 1999, 3, 447–459. [Google Scholar] [CrossRef]
- Pinto, A.; Sciau, P.; Zhu, T.; Zhao, B.; Groenen, J. Raman study of Ming porcelain dark spots: Probing Mn-rich spinels. J. Raman Spectrosc. 2019, 50, 711–719. [Google Scholar] [CrossRef]
- Colomban, P.; Kırmızı, B.; Simsek Franci, G. Cobalt and associated impurities in blue (and green) glass, glaze and enamel: Relationships between raw materials, processing, composition, phases and international trade. Minerals 2021, 11, 633. [Google Scholar] [CrossRef]
- Wang, M.; Wang, T.; Wang, F.; Hole, C.; Cao, J.; Zhu, J.; Zhang, P.; Shi, P.; Sciau, P. Raman study of rusty oil spotted glaze produced in Linfen kilns (Shanxi province, AD 1115–1368). J. Raman Spectrosc. 2020, 53, 582–592. [Google Scholar] [CrossRef]
- Colomban, P.; Sagon, G.; Faurel, X. Differentiation of antique ceramics from the Raman spectra of their coloured glazes and paintings. J. Raman Spectrosc. 2001, 32, 351–360. [Google Scholar] [CrossRef]
- Burlot, J.; Gallet, X.; Franci, G.S.; Bellot-Gurlet, L.; Colomban, P. Non-Invasive On-Site pXRF Analysis of Coloring Agents of Under- and Over-Glazes: Variability and Representativity of Measurements on Porcelain. Colorants 2023, 2, 42–57. [Google Scholar] [CrossRef]
- Porter, Y. Textes persans sur la céramique. In La Science dans le Monde Iranien; Vesel, Z., Ed.; Institut Français de Recherche en Iran: Teheran, Iran, 1998; pp. 165–189. [Google Scholar]
- Holakooei, P.; Mishmastnehi, M.; Arani, A.M.; Röhrs, S.; Franke, U. Materials and technique of lajvardina ceramics from the thirteenth to fourteenth century Iran. Archaeol. Anthtr. Sci. 2023, 15, 33. [Google Scholar] [CrossRef]
- Porter, Y. Le Cobalt dans le Monde Iranien (IXe-XVIe Siècles). Taoci 2000, 1, 5–14. Available online: https://www.academia.edu/12424228/Le_cobalt_dans_le_monde_iranien_IXe_XVIe_si%C3%A8cles_Notes_sur_son_utilisation_en_c%C3%A9ramique_et_son_commerce_TAOCI_1_2000_pp_5_14 (accessed on 25 May 2023).
- Matin, M.; Pollard, A.M. From ore to pigment: A description of the minerals and experimental study of cobalt ore processing from the Kâshân mine, Iran. Archaeometry 2017, 59, 731–746. [Google Scholar] [CrossRef]
- Matin, M.; Pollard, A.M. Historical accounts of cobalt ore processing from the Kashan mine, Iran. Iran 2015, 53, 171–183. [Google Scholar] [CrossRef]
- Allan, J.W. Abu’l-Qasim’s treatise on ceramics. Iran 1973, 11, 111–120. [Google Scholar] [CrossRef]
- Holakooei, P. A medieval Persian treatise on coloured and enamelled glass: Bayan Al-Sana’at. Iran 2016, 54, 95–106. [Google Scholar] [CrossRef]
- Slodczyk, A.; Colomban, P.; Willemin, S.; Lacroix, O.; Sala, B. Indirect Raman identification of the proton insertion in the high-temperature [Ba/Sr][Zr/Ti]O3-modified perovskite protonic conductors. J. Raman Spectrosc. 2009, 40, 513–521. [Google Scholar] [CrossRef]
- Hagemann, H.; Ayoubipour, S.; Delgado, T.; Schnyder, C.; Gnos, E. Probing luminescence of rare earth ions in natural fluorites using Raman microscopes: Comparison of some rose (pink) fluorites. J. Raman Spectrosc. 2022, 53, 1464–1470. [Google Scholar] [CrossRef]
- El Marraki, A.; Schvoerer, M.; Bechtel, F. Luminescence de cristaux de dévitrivication de wollastonite dans des verres non dopés et dopés en Eu, Dy et Tm. Phys. Status Solidi A 2000, 181, 491–507. [Google Scholar] [CrossRef]
- Colomban, P.; Milande, V.; Lucas, H. On-site Raman analysis of Medici porcelain. J. Raman Spectrosc. 2004, 35, 68–72. [Google Scholar] [CrossRef]
- Colomban, P. Raman µSpectrometry, A unique tool for on-site analysis and identification of ancient ceramics and glasses. In Materials Issues in Art and Archaeology, Vandiver, P., Mass, J., Murray, A., Eds. Mater. Res. Soc. Symp. Proc. 2005, 852, OO8.3. [Google Scholar]
- Ruvalcaba Cornejo, C. Luminescence in Rare Earth Ion-Doped Oxide Compounds. In Luminescence—An Outlook on the Phenomena and Their Applications; Thirumalai, J., Ed.; IntechOpen Book Series: London, UK, 2016; Available online: https://www.intechopen.com/chapters/52672 (accessed on 20 January 2022).
- Dieke, G.H. Spectra and Energy Levels of Rare Earth Ions in Crystals; Wiley Interscience: New York, NY, USA, 1968. [Google Scholar]
- Artal-Isbrand, P.; Newman, R. An examination of contemporary Iznik-style Turkish ceramics. Mater. Res. Soc. 1997, 462, 229–238. [Google Scholar] [CrossRef]
- Röhrs, S.; Dumazet, A.; Kuntz, K.; Franke, U. Bodies and Glazes of Architectural Ceramics from the Ilkhanid Period at Takht-e Soleyman (North-Western Iran). Minerals 2022, 12, 158. [Google Scholar] [CrossRef]
Figure 1.
Selection of Timurid, Ottoman and Safavid tile fragments from Musée du Louvre Collection under examination using mobile Raman set-up in their storage room. Inventory numbers are given (see Table 1 for details; photograph: P. Colomban).
Figure 1.
Selection of Timurid, Ottoman and Safavid tile fragments from Musée du Louvre Collection under examination using mobile Raman set-up in their storage room. Inventory numbers are given (see Table 1 for details; photograph: P. Colomban).

Figure 2.
Tiles and dish fragments from the private collection: (a) Iznik dish, Baba Nakkas-style; (b) polychrome Iznik tile; (b′) section; (c) Safavid tile; (d) Safavid tile; (e) Safavid dish; (f) Mamluk vessel; see Table 2 for details, photograph: P. Colomban.
Figure 2.
Tiles and dish fragments from the private collection: (a) Iznik dish, Baba Nakkas-style; (b) polychrome Iznik tile; (b′) section; (c) Safavid tile; (d) Safavid tile; (e) Safavid dish; (f) Mamluk vessel; see Table 2 for details, photograph: P. Colomban.
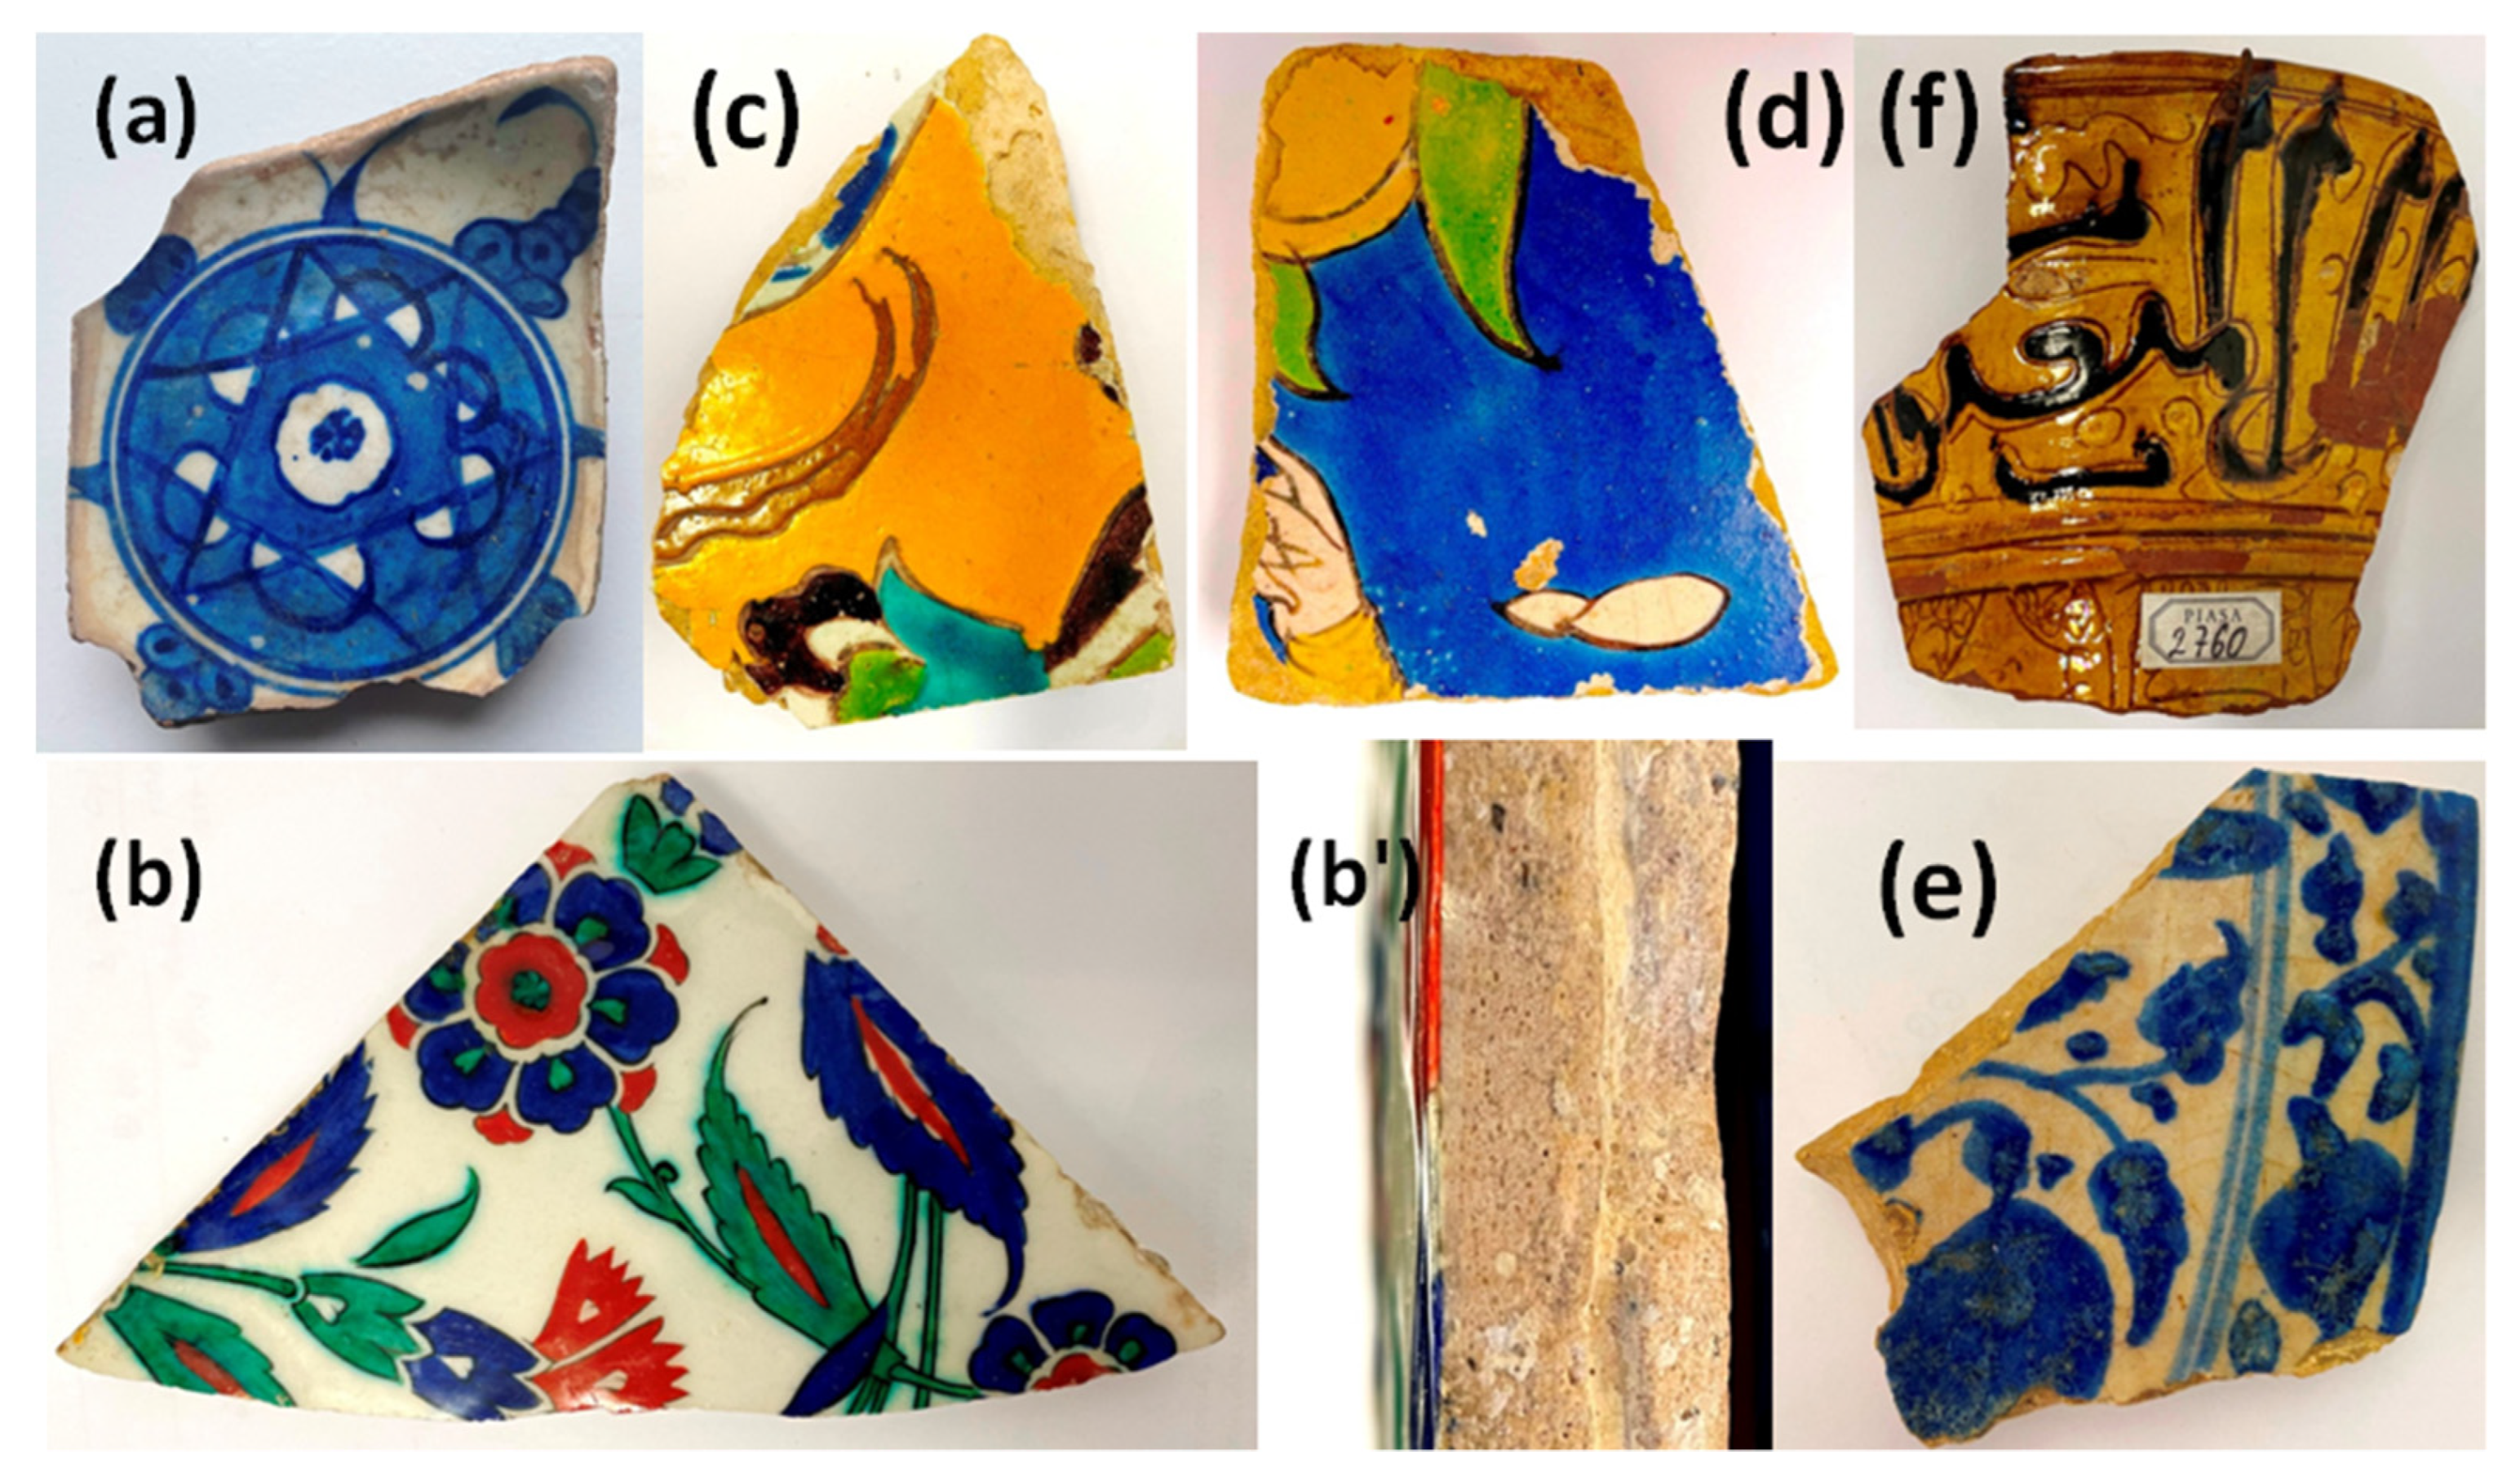
Figure 3.
Selected artefacts from private collection: (a) Iznik dish; (b) Safavid dish; (c) mina’i bowl; see Table 2 for details, photograph: P. Colomban.
Figure 3.
Selected artefacts from private collection: (a) Iznik dish; (b) Safavid dish; (c) mina’i bowl; see Table 2 for details, photograph: P. Colomban.
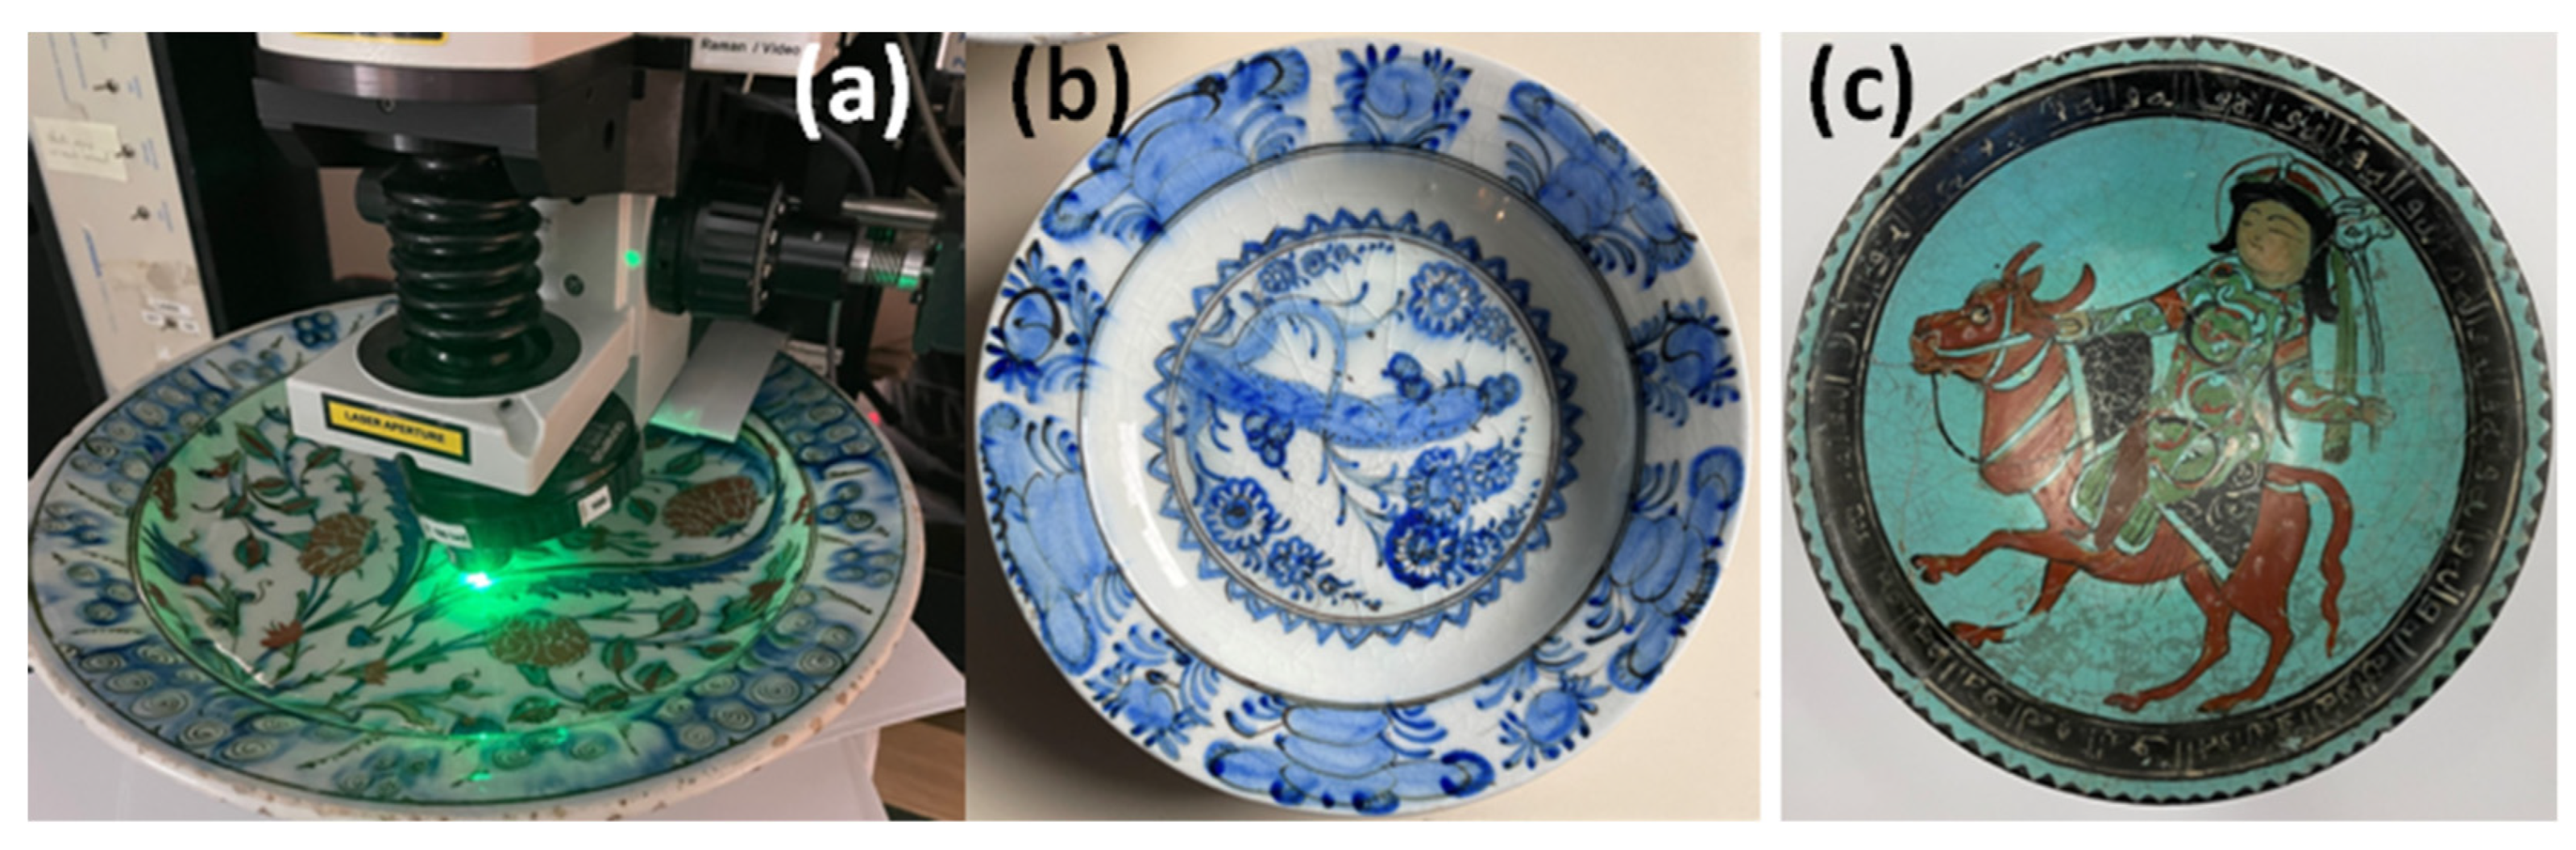
Figure 4.
Representative optical views of polished sections of the different enamelling/firing procedures (al-Andalus, Timurid and Safavid/Qajar shards, see Table 1 for details: bar = 500 µm, photograph: P. Colomban).
Figure 4.
Representative optical views of polished sections of the different enamelling/firing procedures (al-Andalus, Timurid and Safavid/Qajar shards, see Table 1 for details: bar = 500 µm, photograph: P. Colomban).
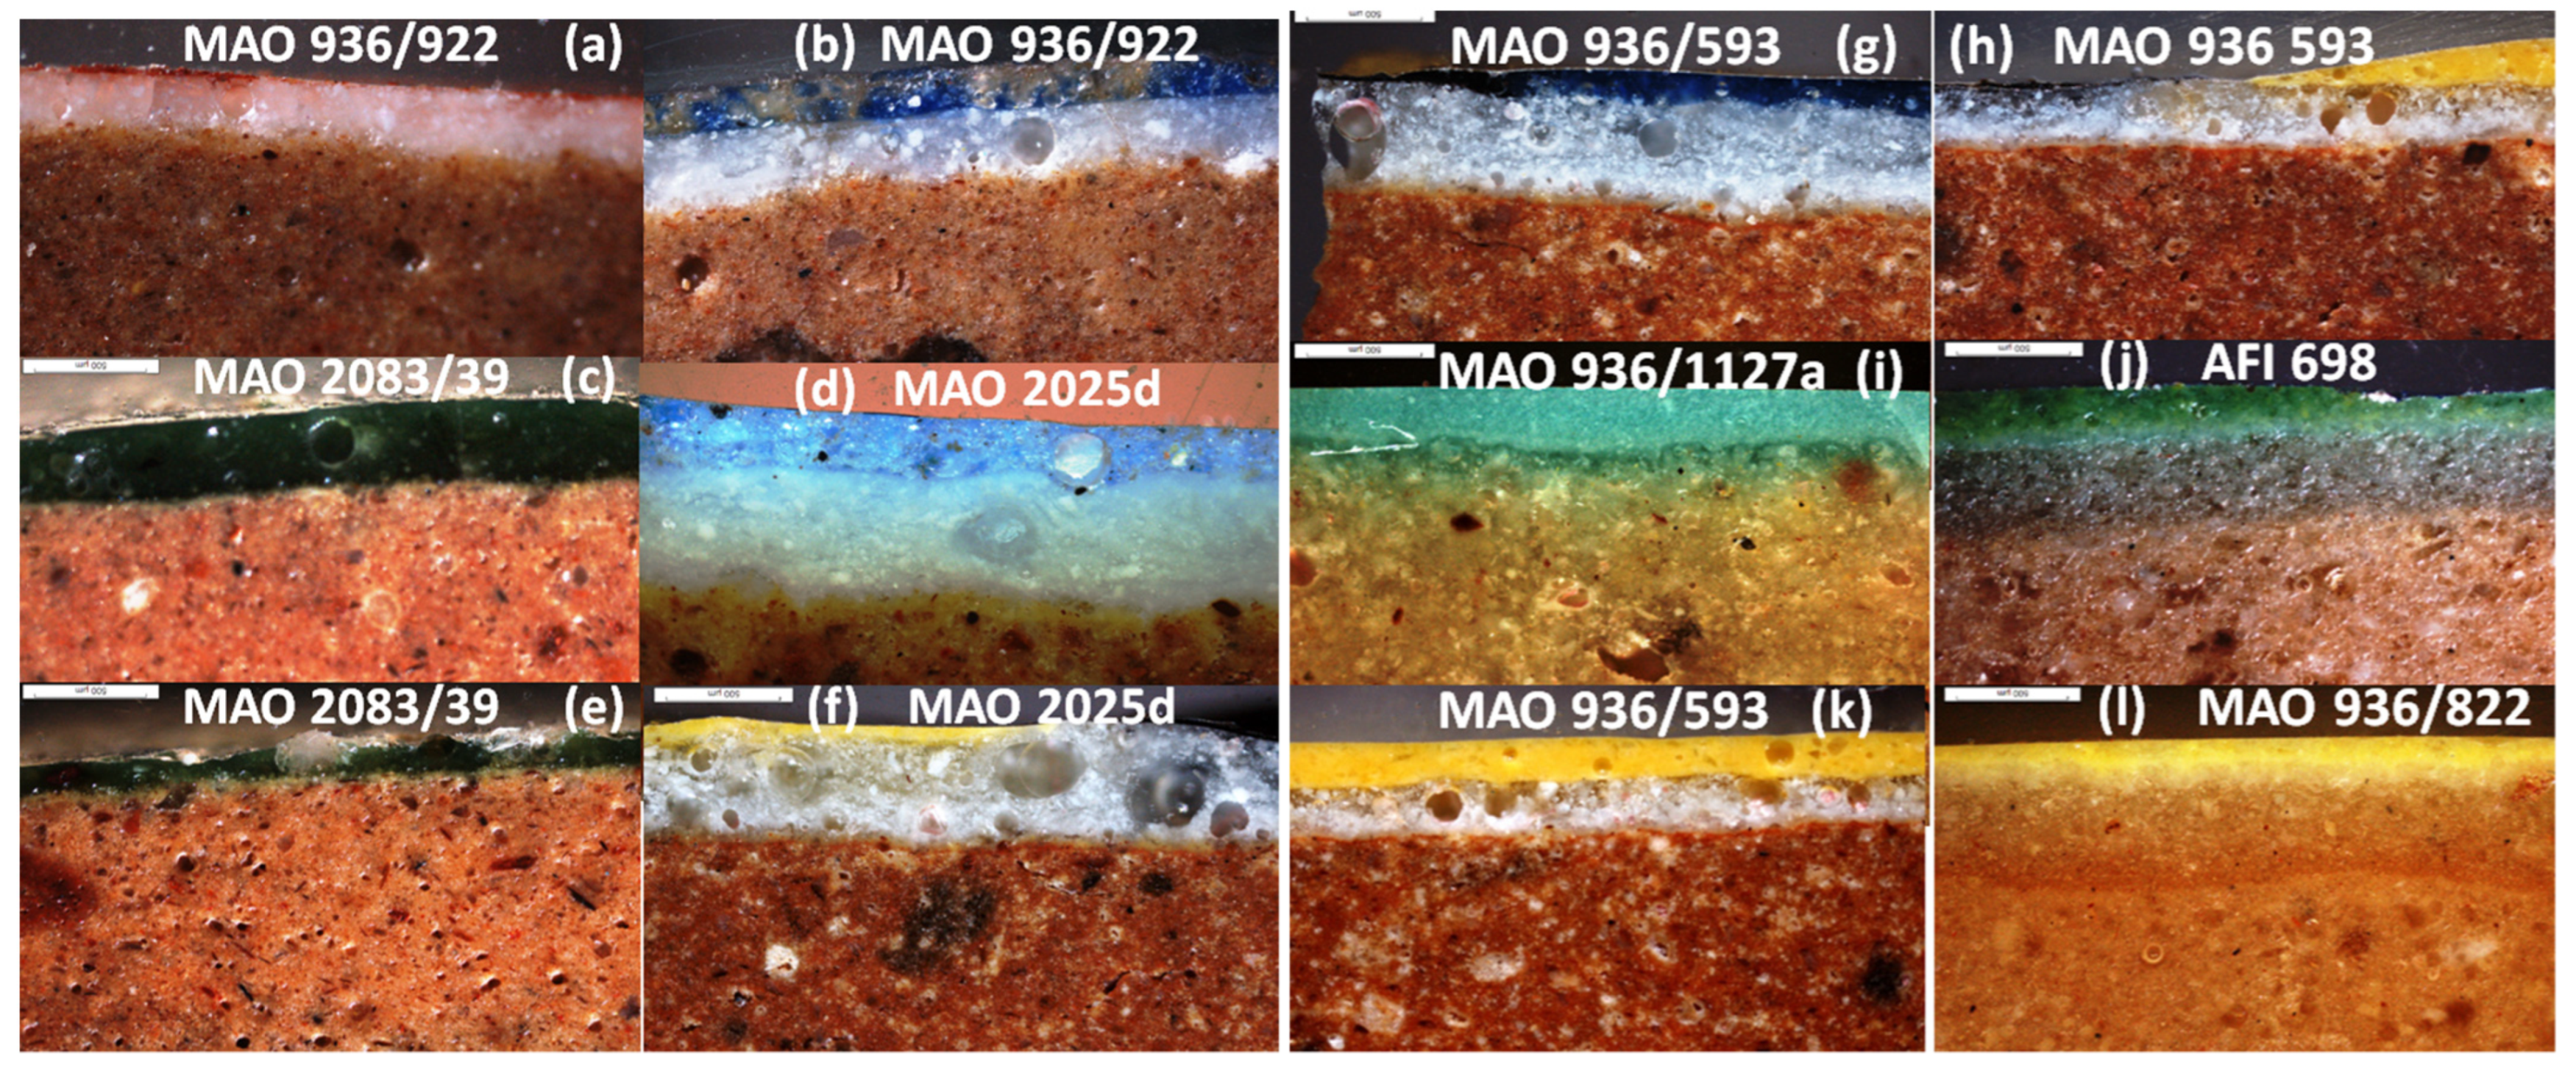
Figure 5.
Representative SEM micrographs of polished sections of the different enamelling/firing procedures ((a–d), see Table 1 for details: bar = 500 µm); (e) optical views of a mina’i shard (top) and a gilded tile (bottom) are given on the right (photograph: P. Colomban).
Figure 5.
Representative SEM micrographs of polished sections of the different enamelling/firing procedures ((a–d), see Table 1 for details: bar = 500 µm); (e) optical views of a mina’i shard (top) and a gilded tile (bottom) are given on the right (photograph: P. Colomban).
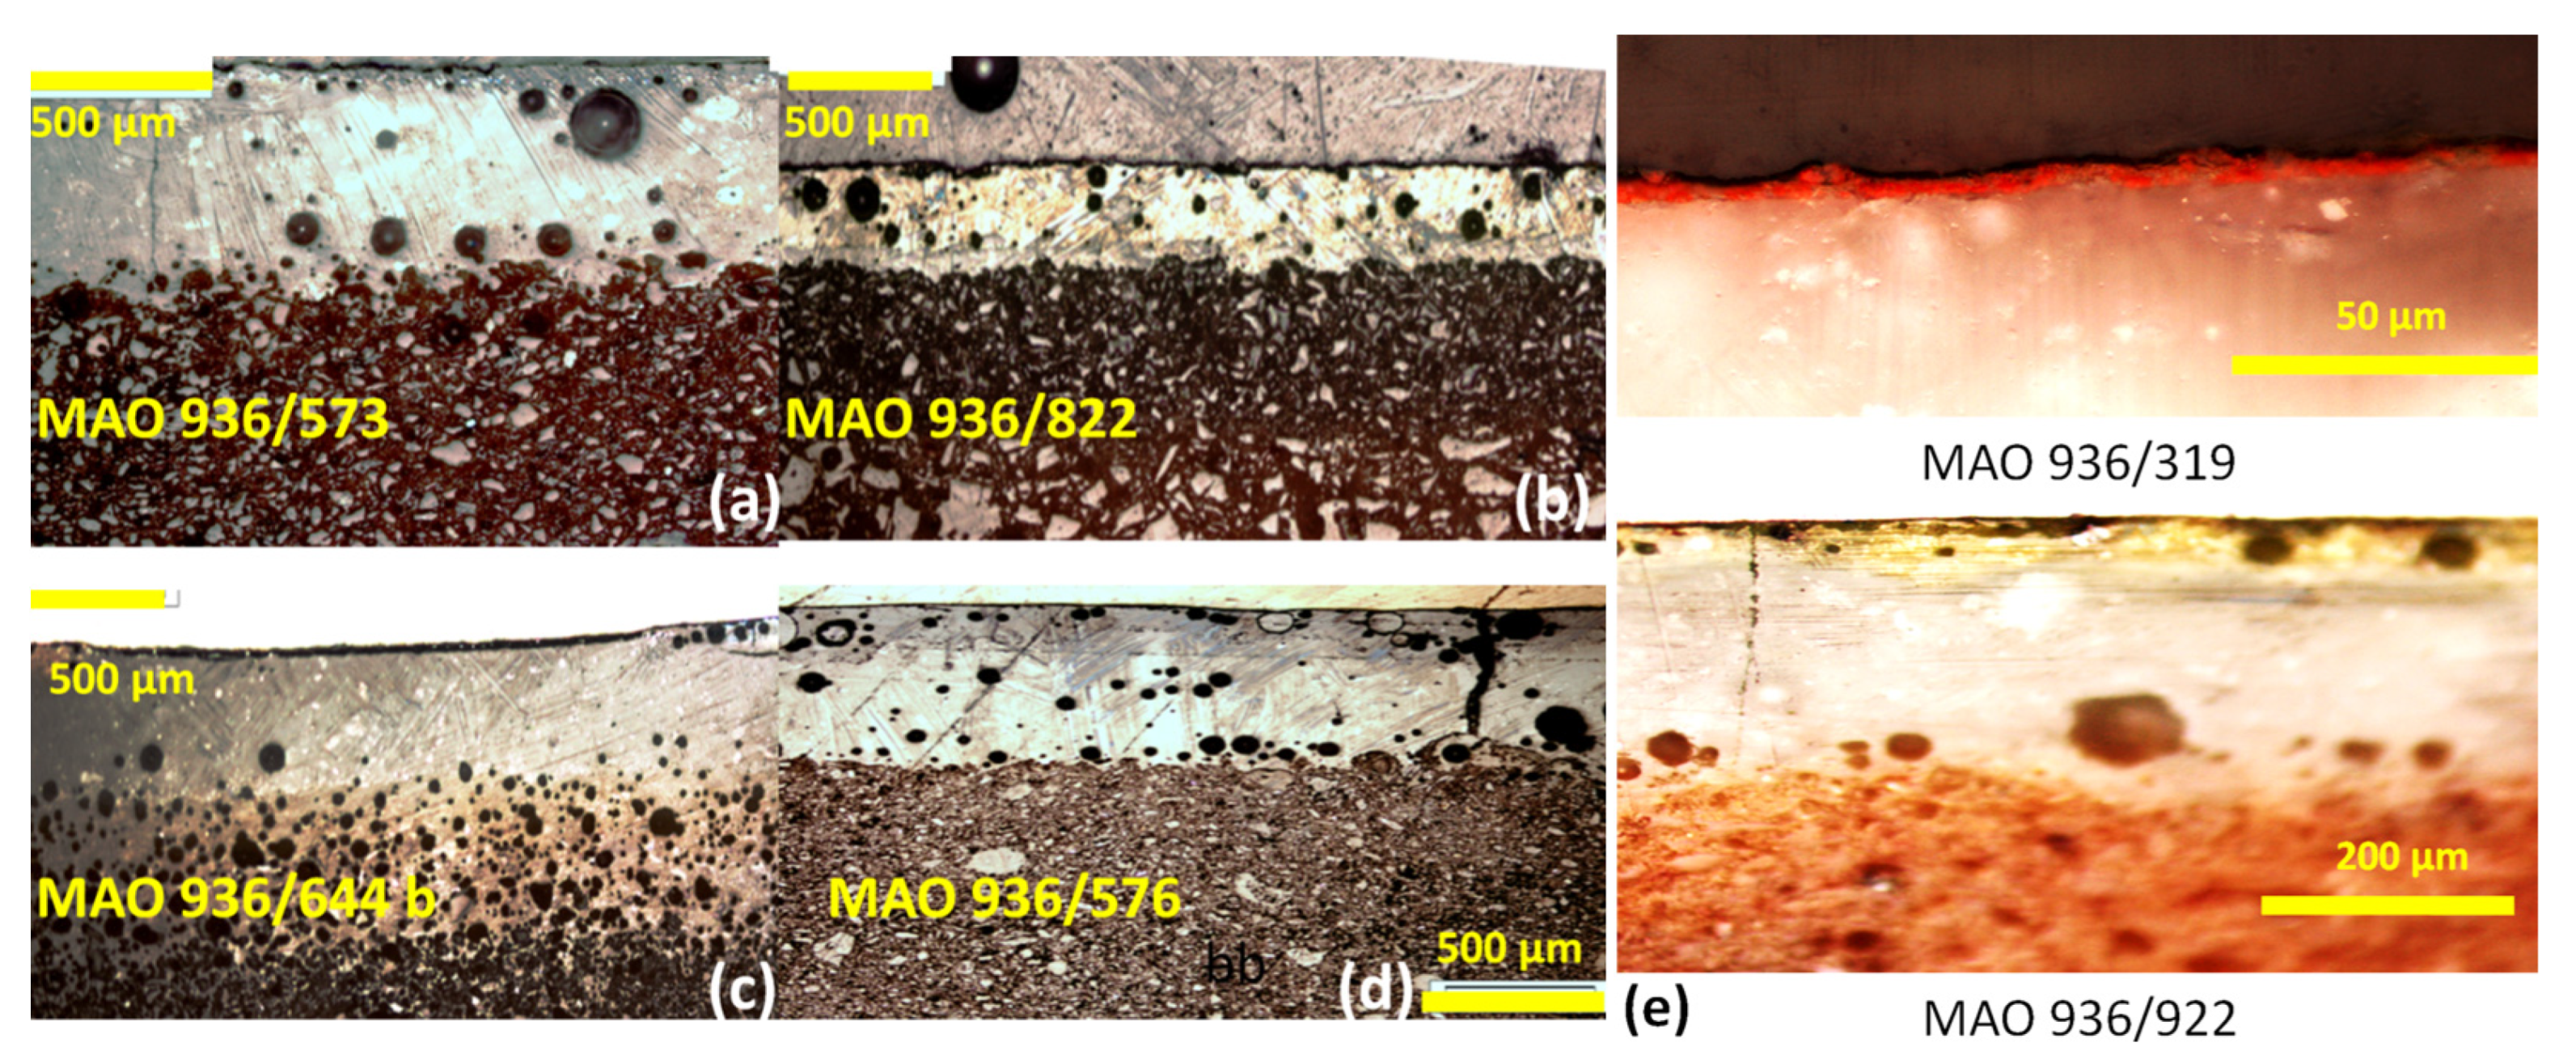
Figure 6.
Selected Raman spectra showing the different types of silicate glassy matrices (a) full spectral range studied, (b) zoom of the 50–1500 cm−1 wavenumber range). Inventory numbers are given without their alphabetical prefixes so as not to overload the figure (e.g., 923 in the place of MAO 936/923), see Table 1.
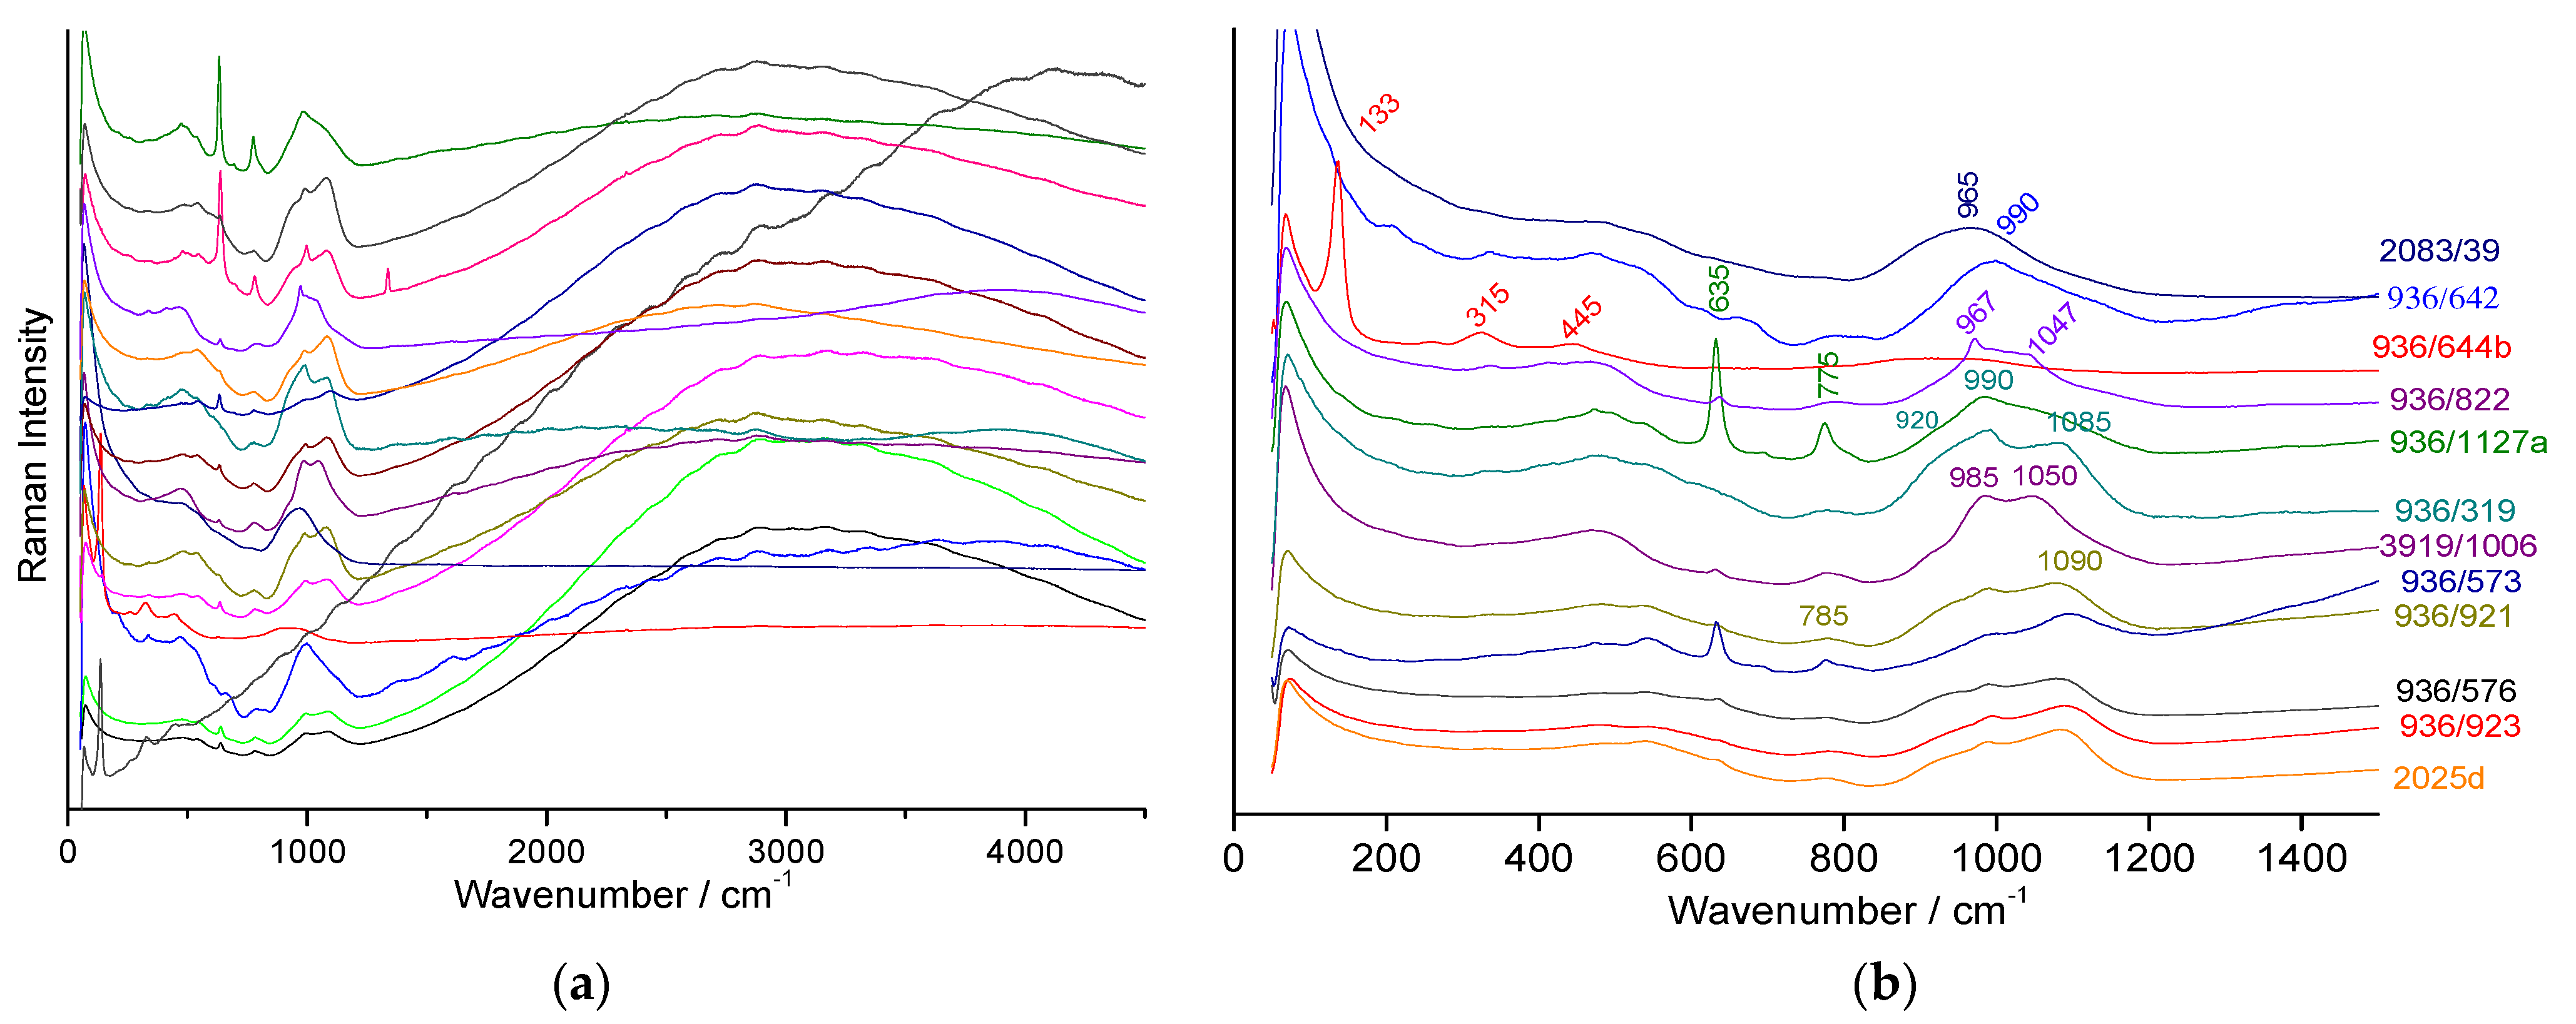
Figure 7.
Raman spectra showing the three different types of glaze signatures recorded on different coloured areas of Iznik ((a), Pb-Na-G), Safavid ((b), (Pb)Na-K-Ca-G) tiles and on a Mamluk cup fragment ((c), Pb-G).
Figure 7.
Raman spectra showing the three different types of glaze signatures recorded on different coloured areas of Iznik ((a), Pb-Na-G), Safavid ((b), (Pb)Na-K-Ca-G) tiles and on a Mamluk cup fragment ((c), Pb-G).
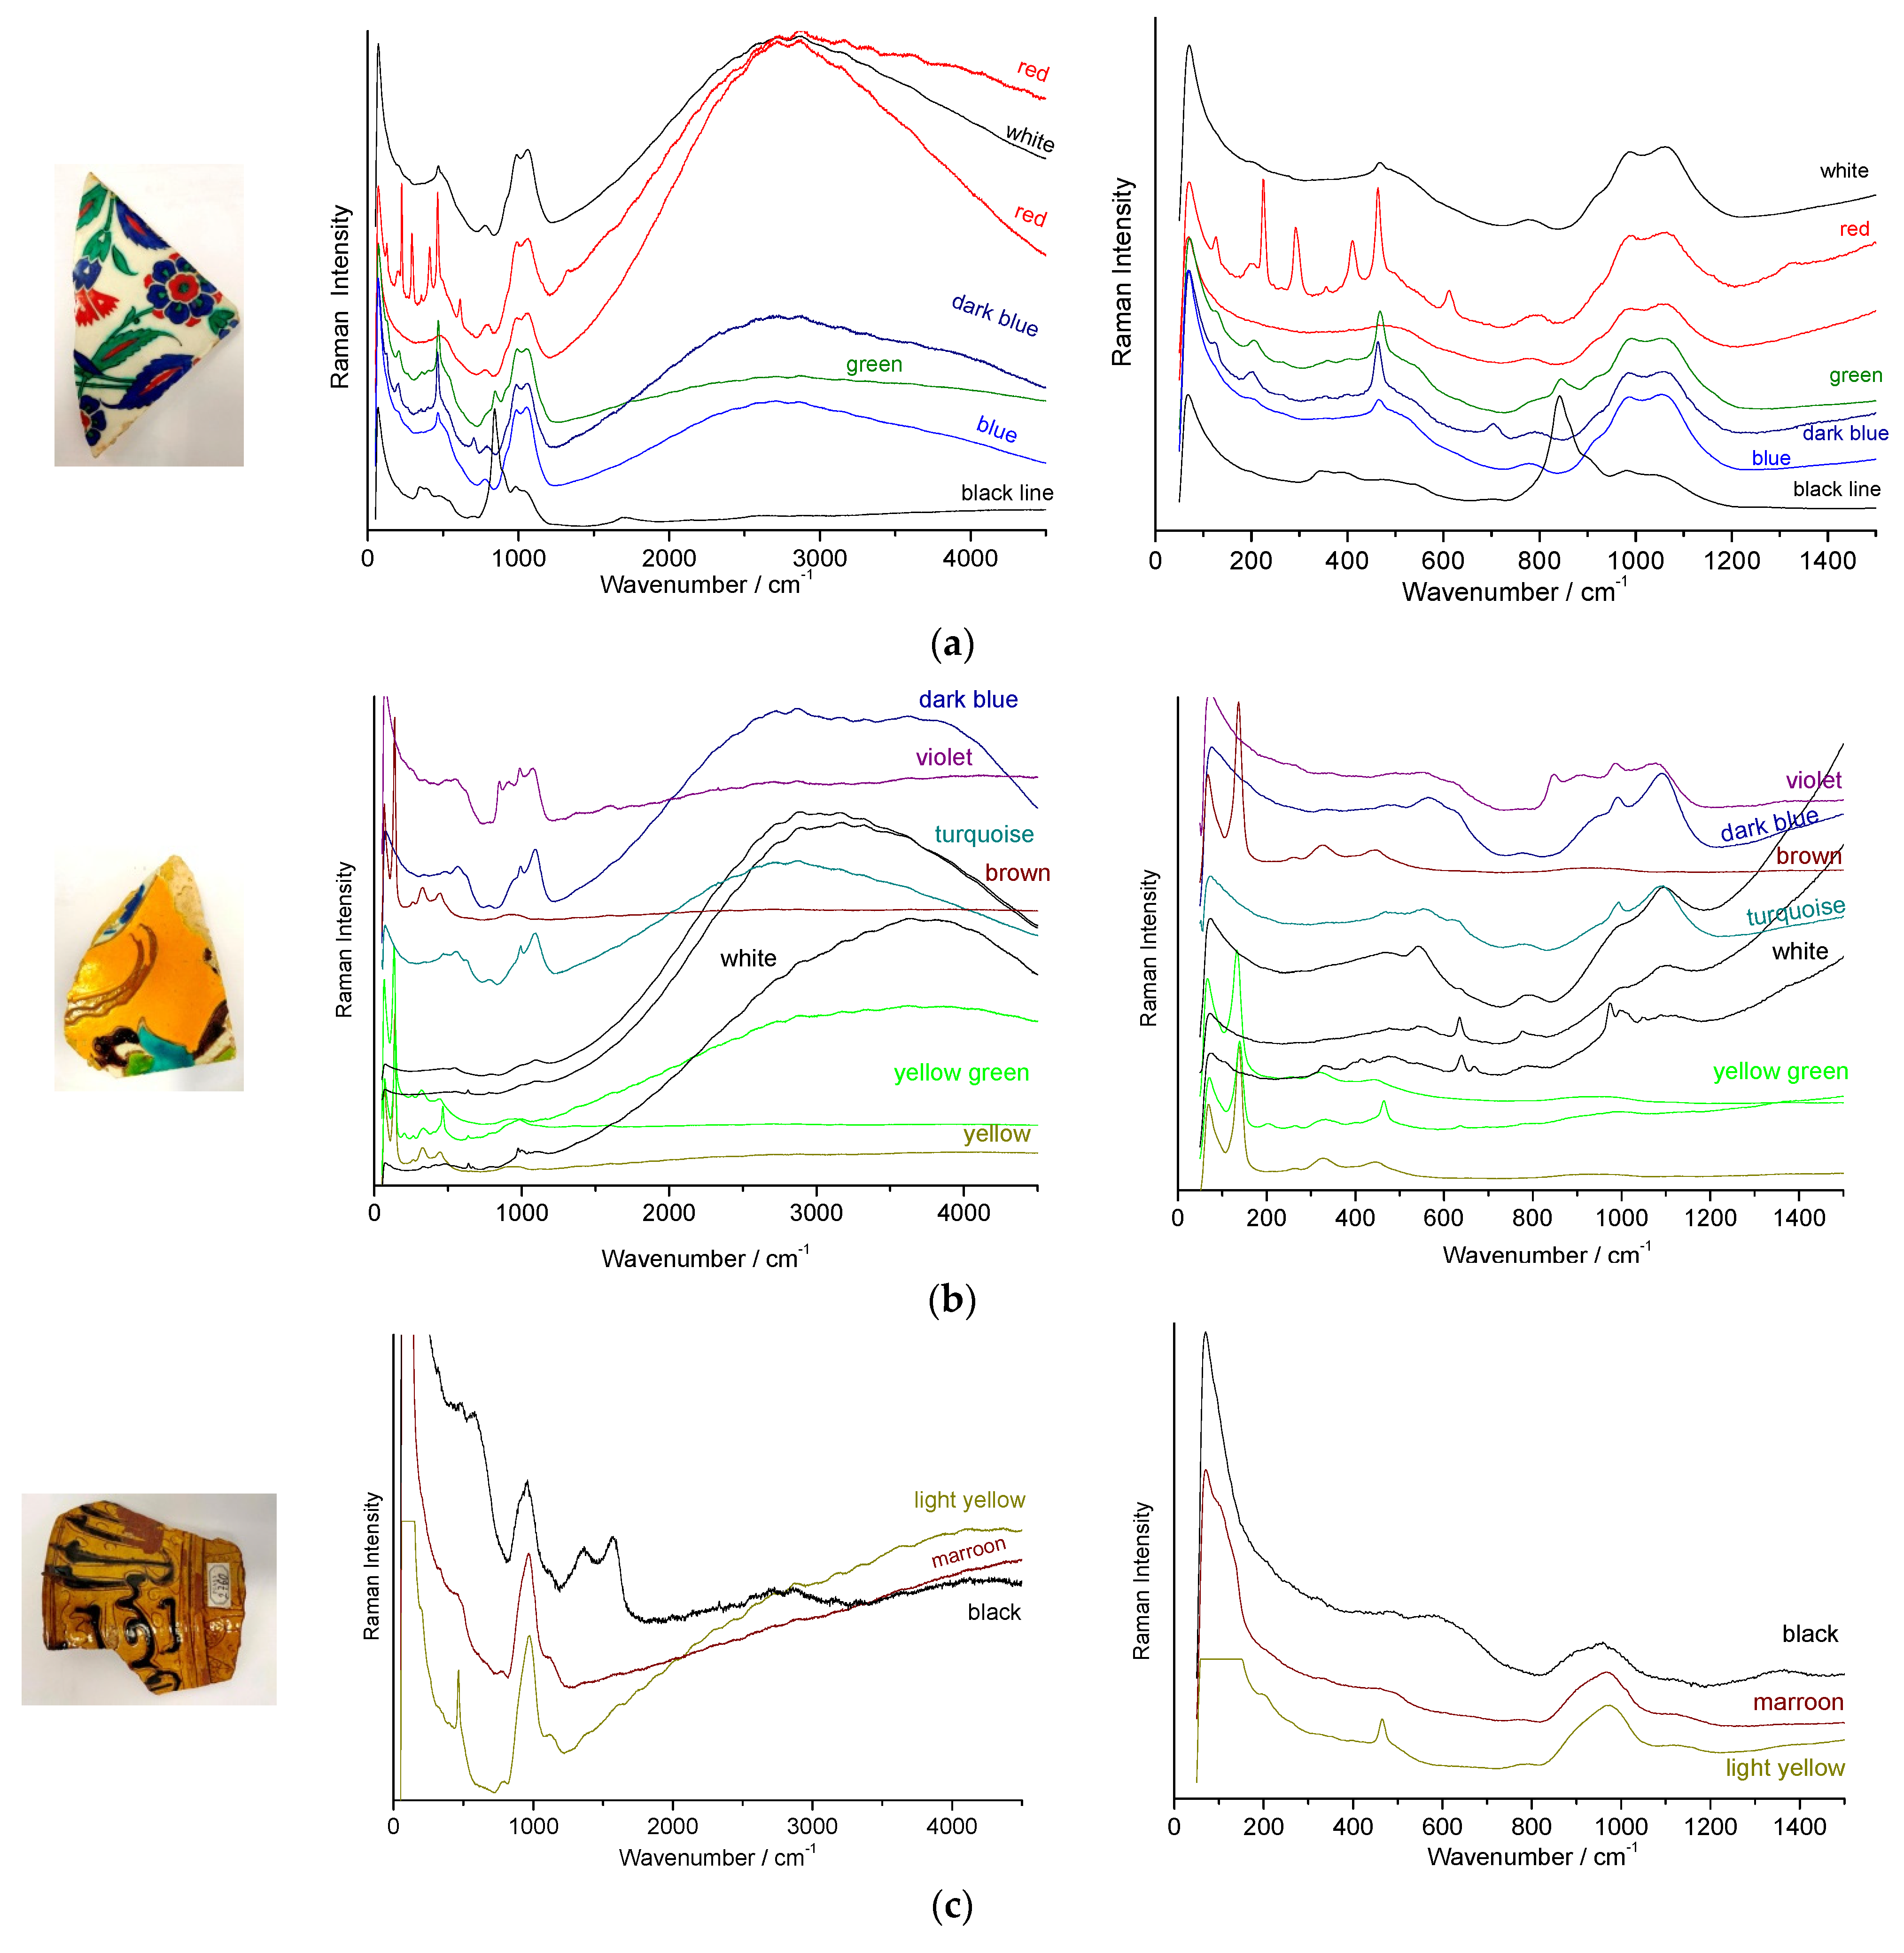
Figure 8.
Representative Raman spectra recorded on black lines (a,b) and yellow (c) and green areas (d). The last digits of the inventory numbers are given; see Table 1. In (c) MAO 2070-spectrum corresponds to red colour.
Figure 8.
Representative Raman spectra recorded on black lines (a,b) and yellow (c) and green areas (d). The last digits of the inventory numbers are given; see Table 1. In (c) MAO 2070-spectrum corresponds to red colour.
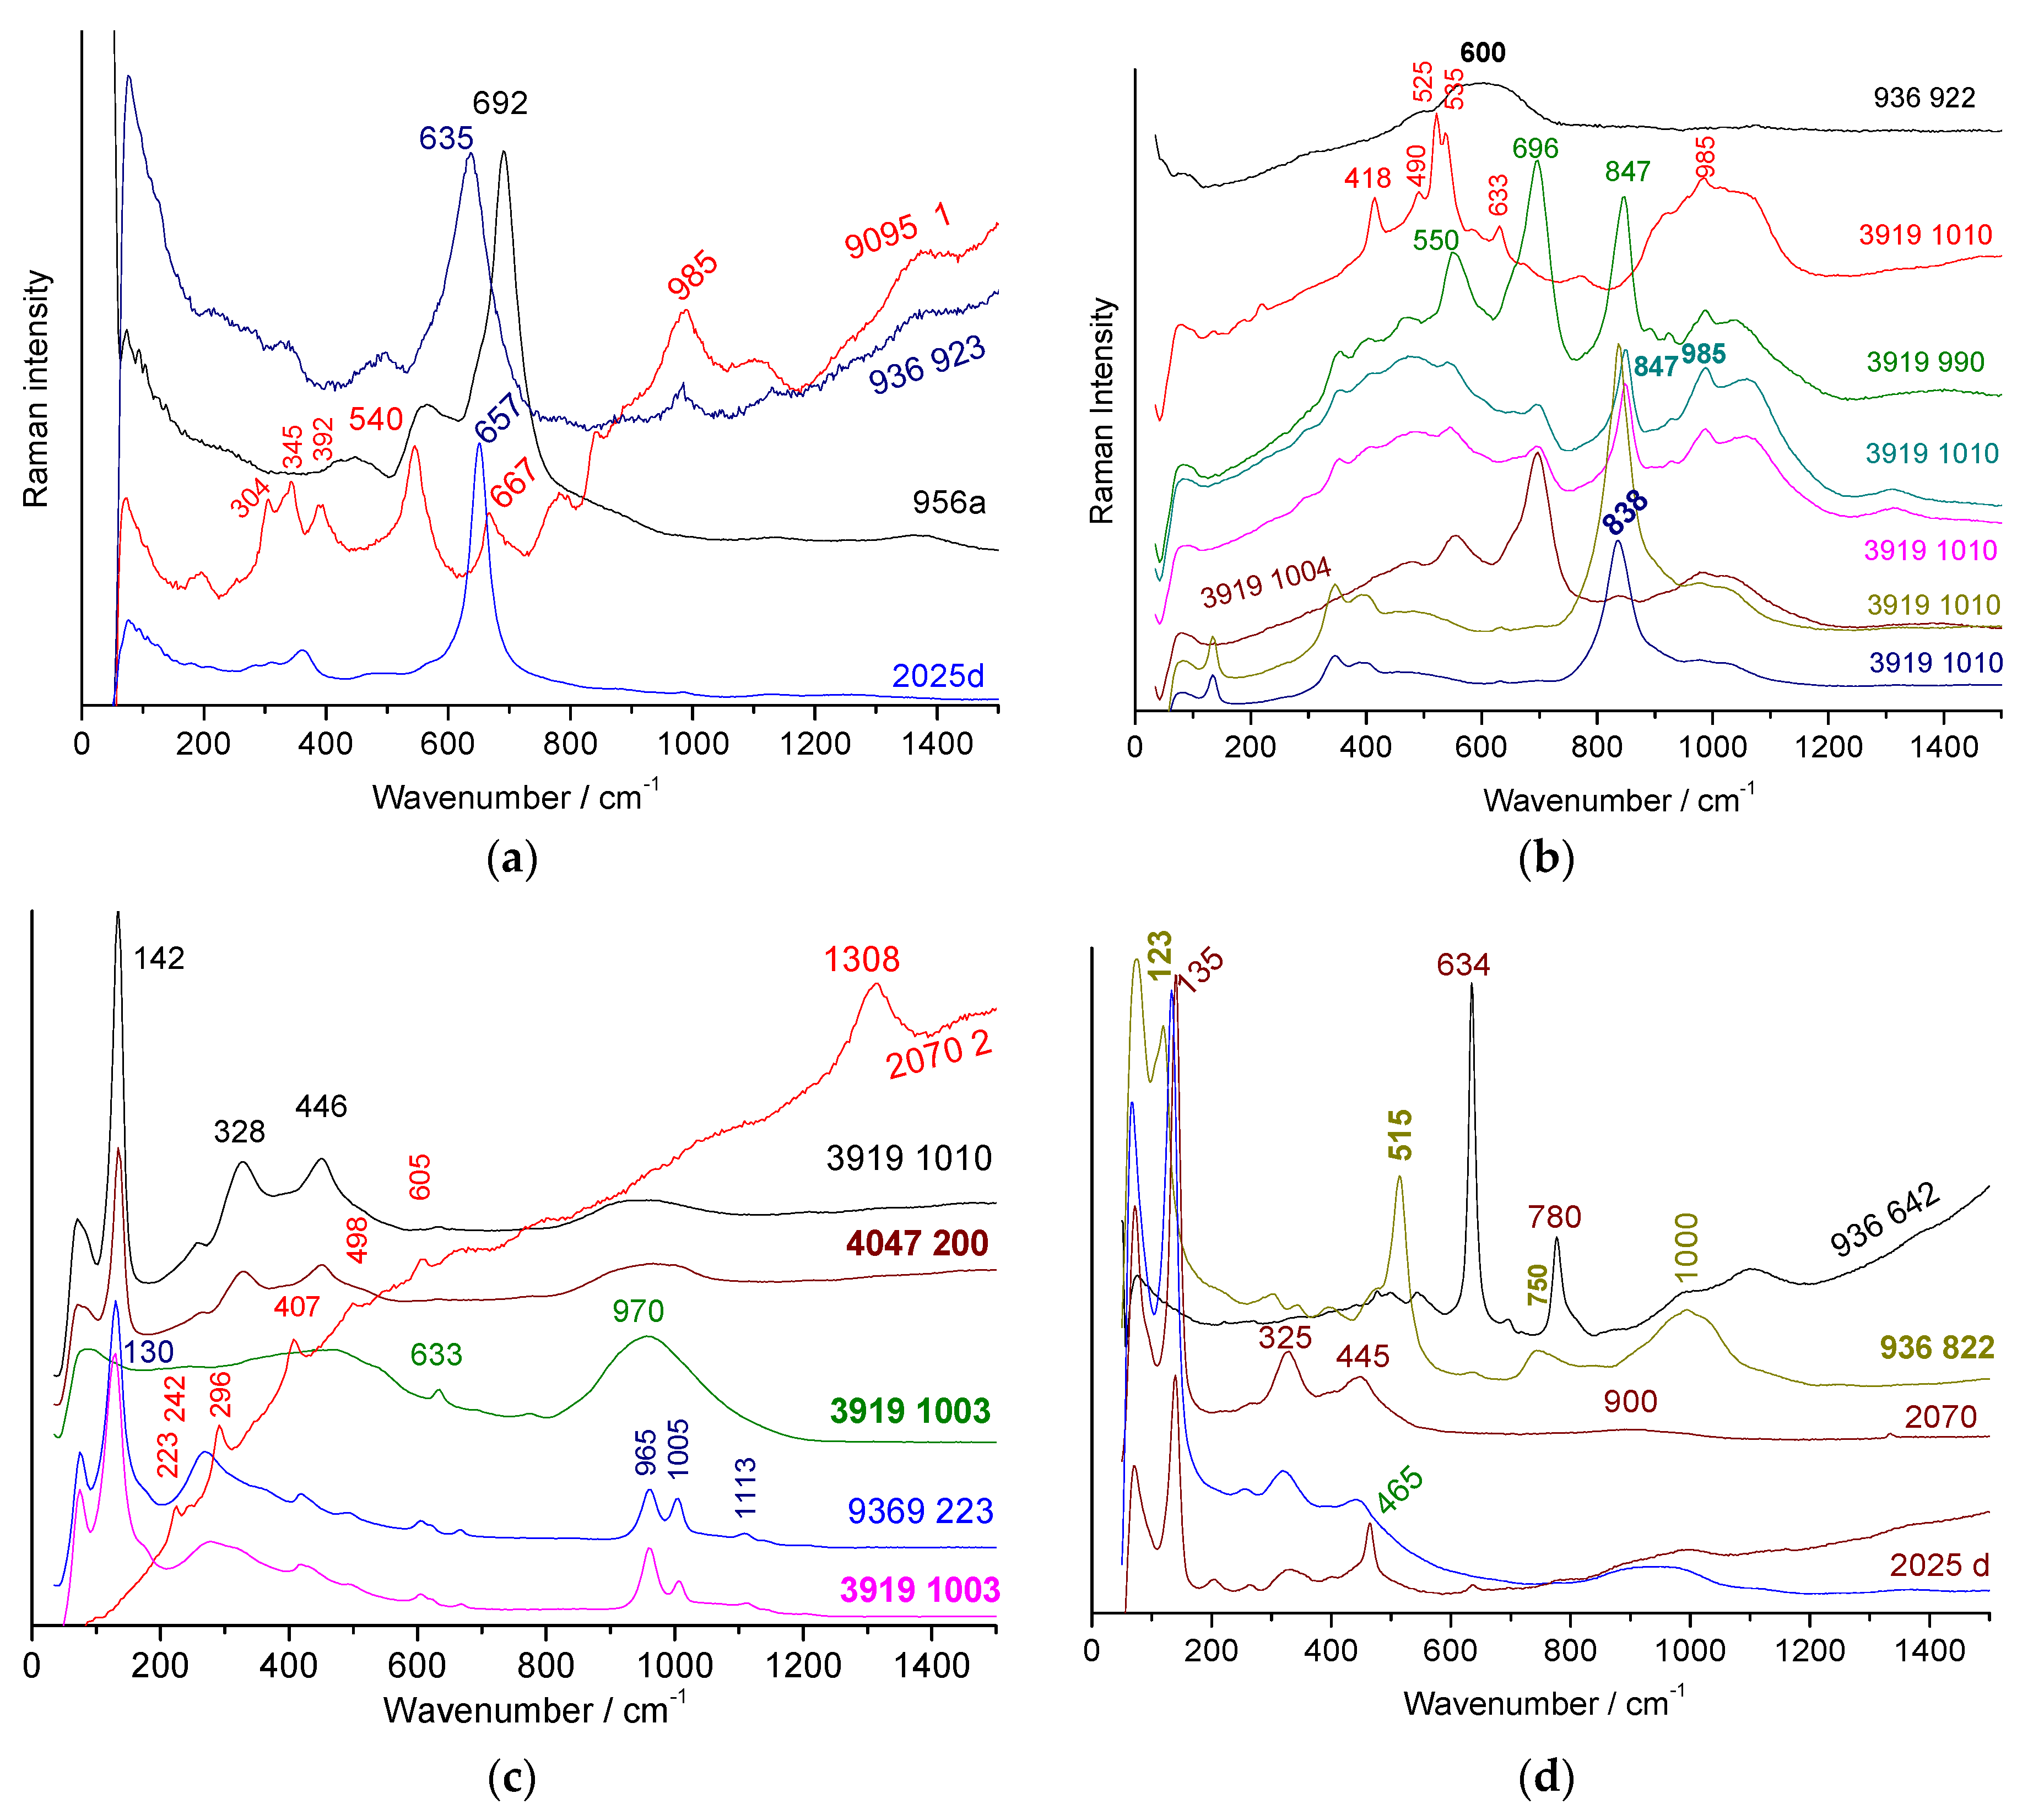
Figure 9.
Ternary diagrams made with data of reference [65] comparing wt% oxide contents acting as fluxes (a–d,f) and opacifiers (e). The inventory number of shards not part of or on the periphery of the clusters is indicated (see Table 1 for detailed information). The method of measurement and the colours of the glazes are indicated in the plots. Comparison is made with the Crowe data ((b,d), colourless glaze) relayed to Safavid blue-and-white tableware [73].
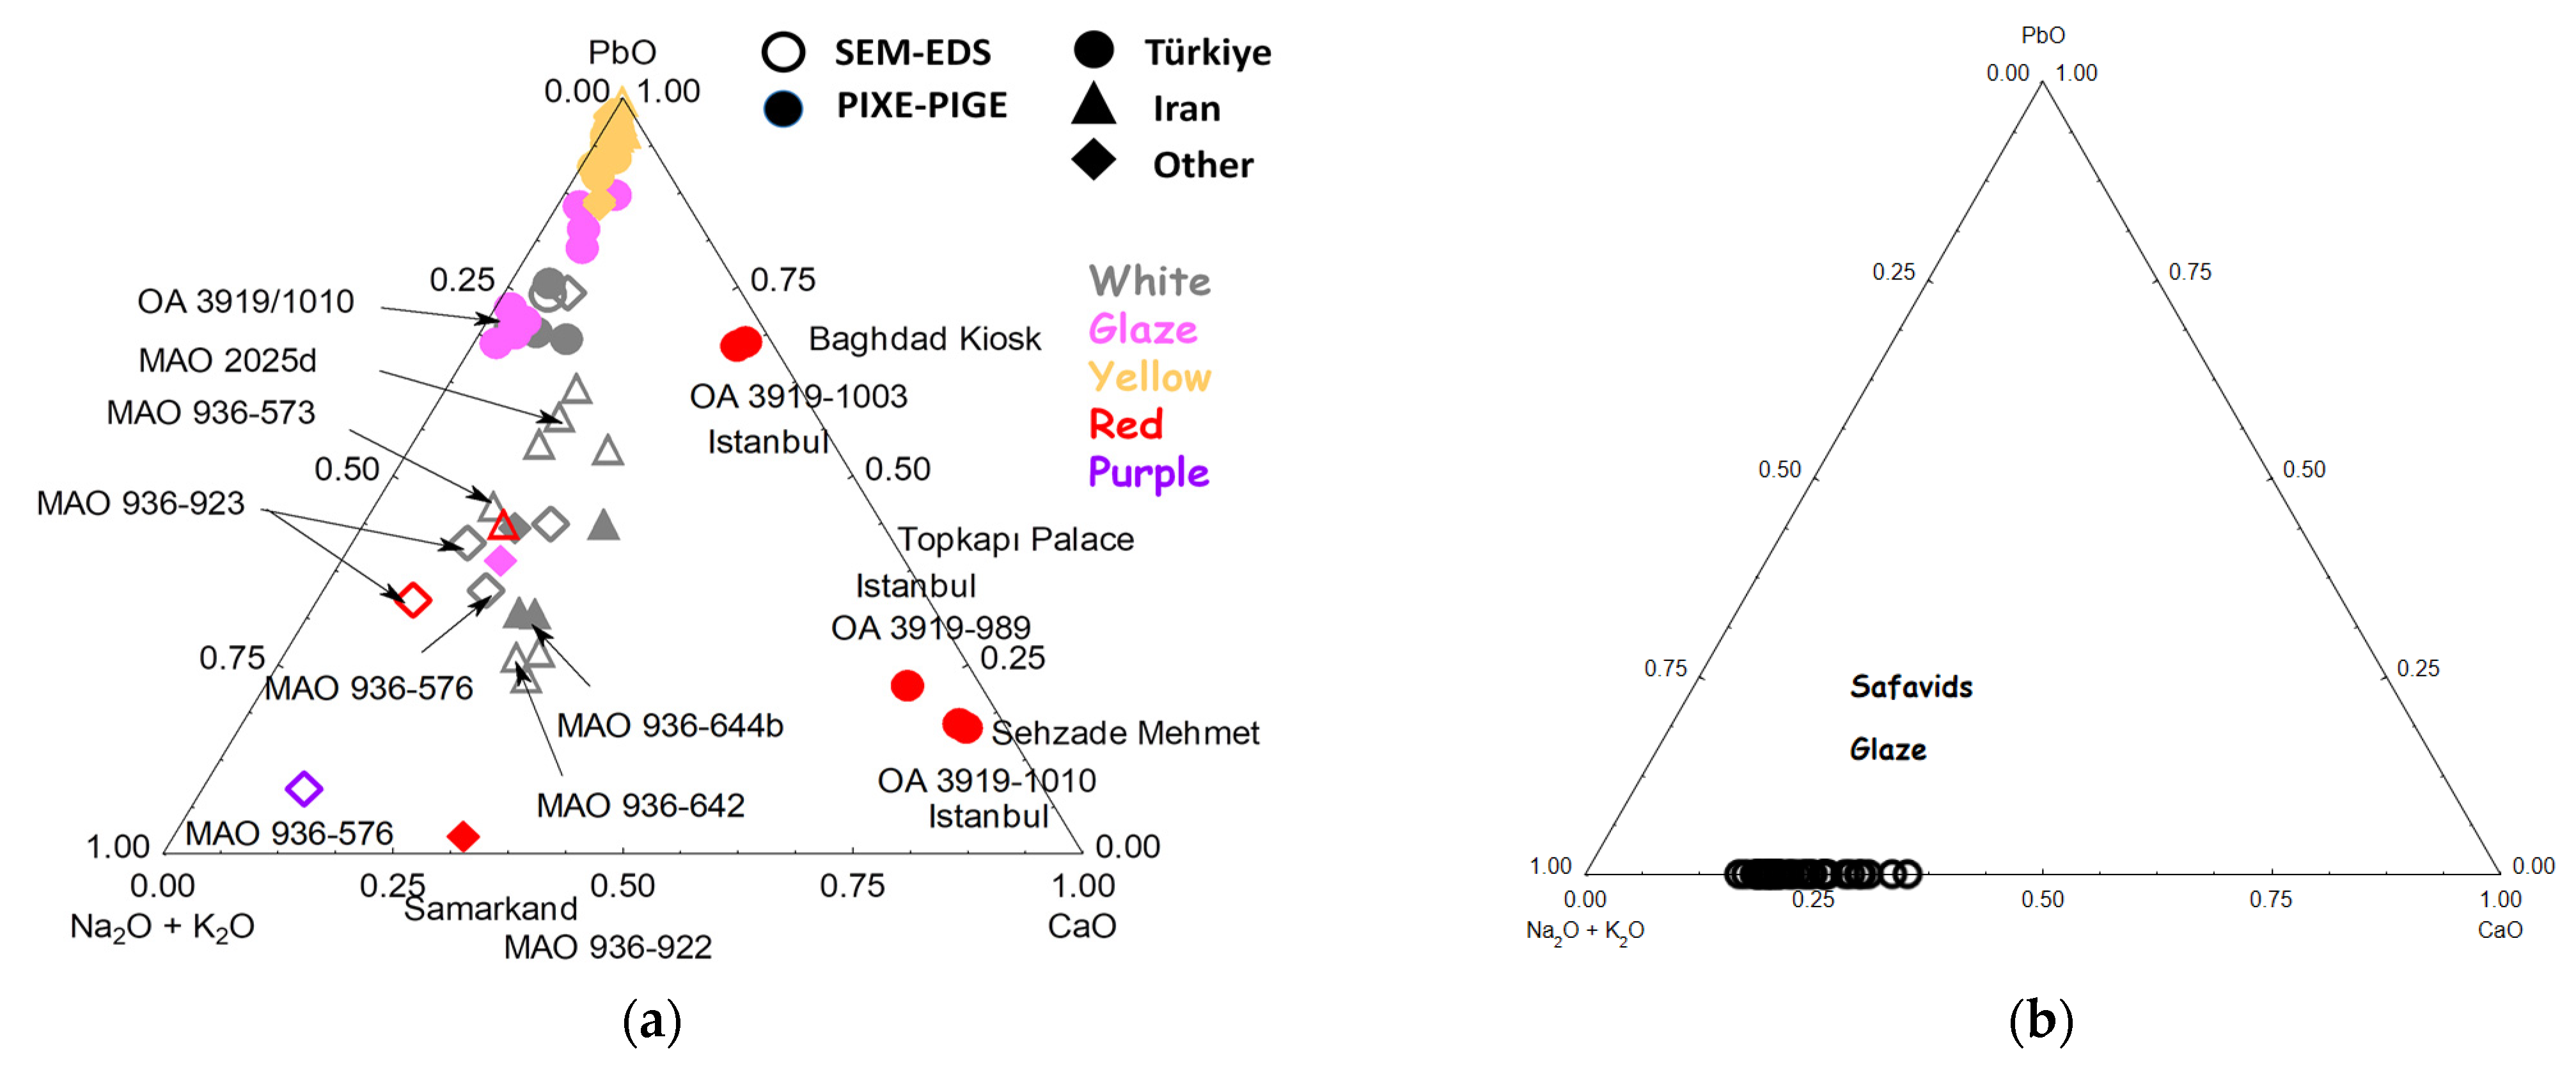
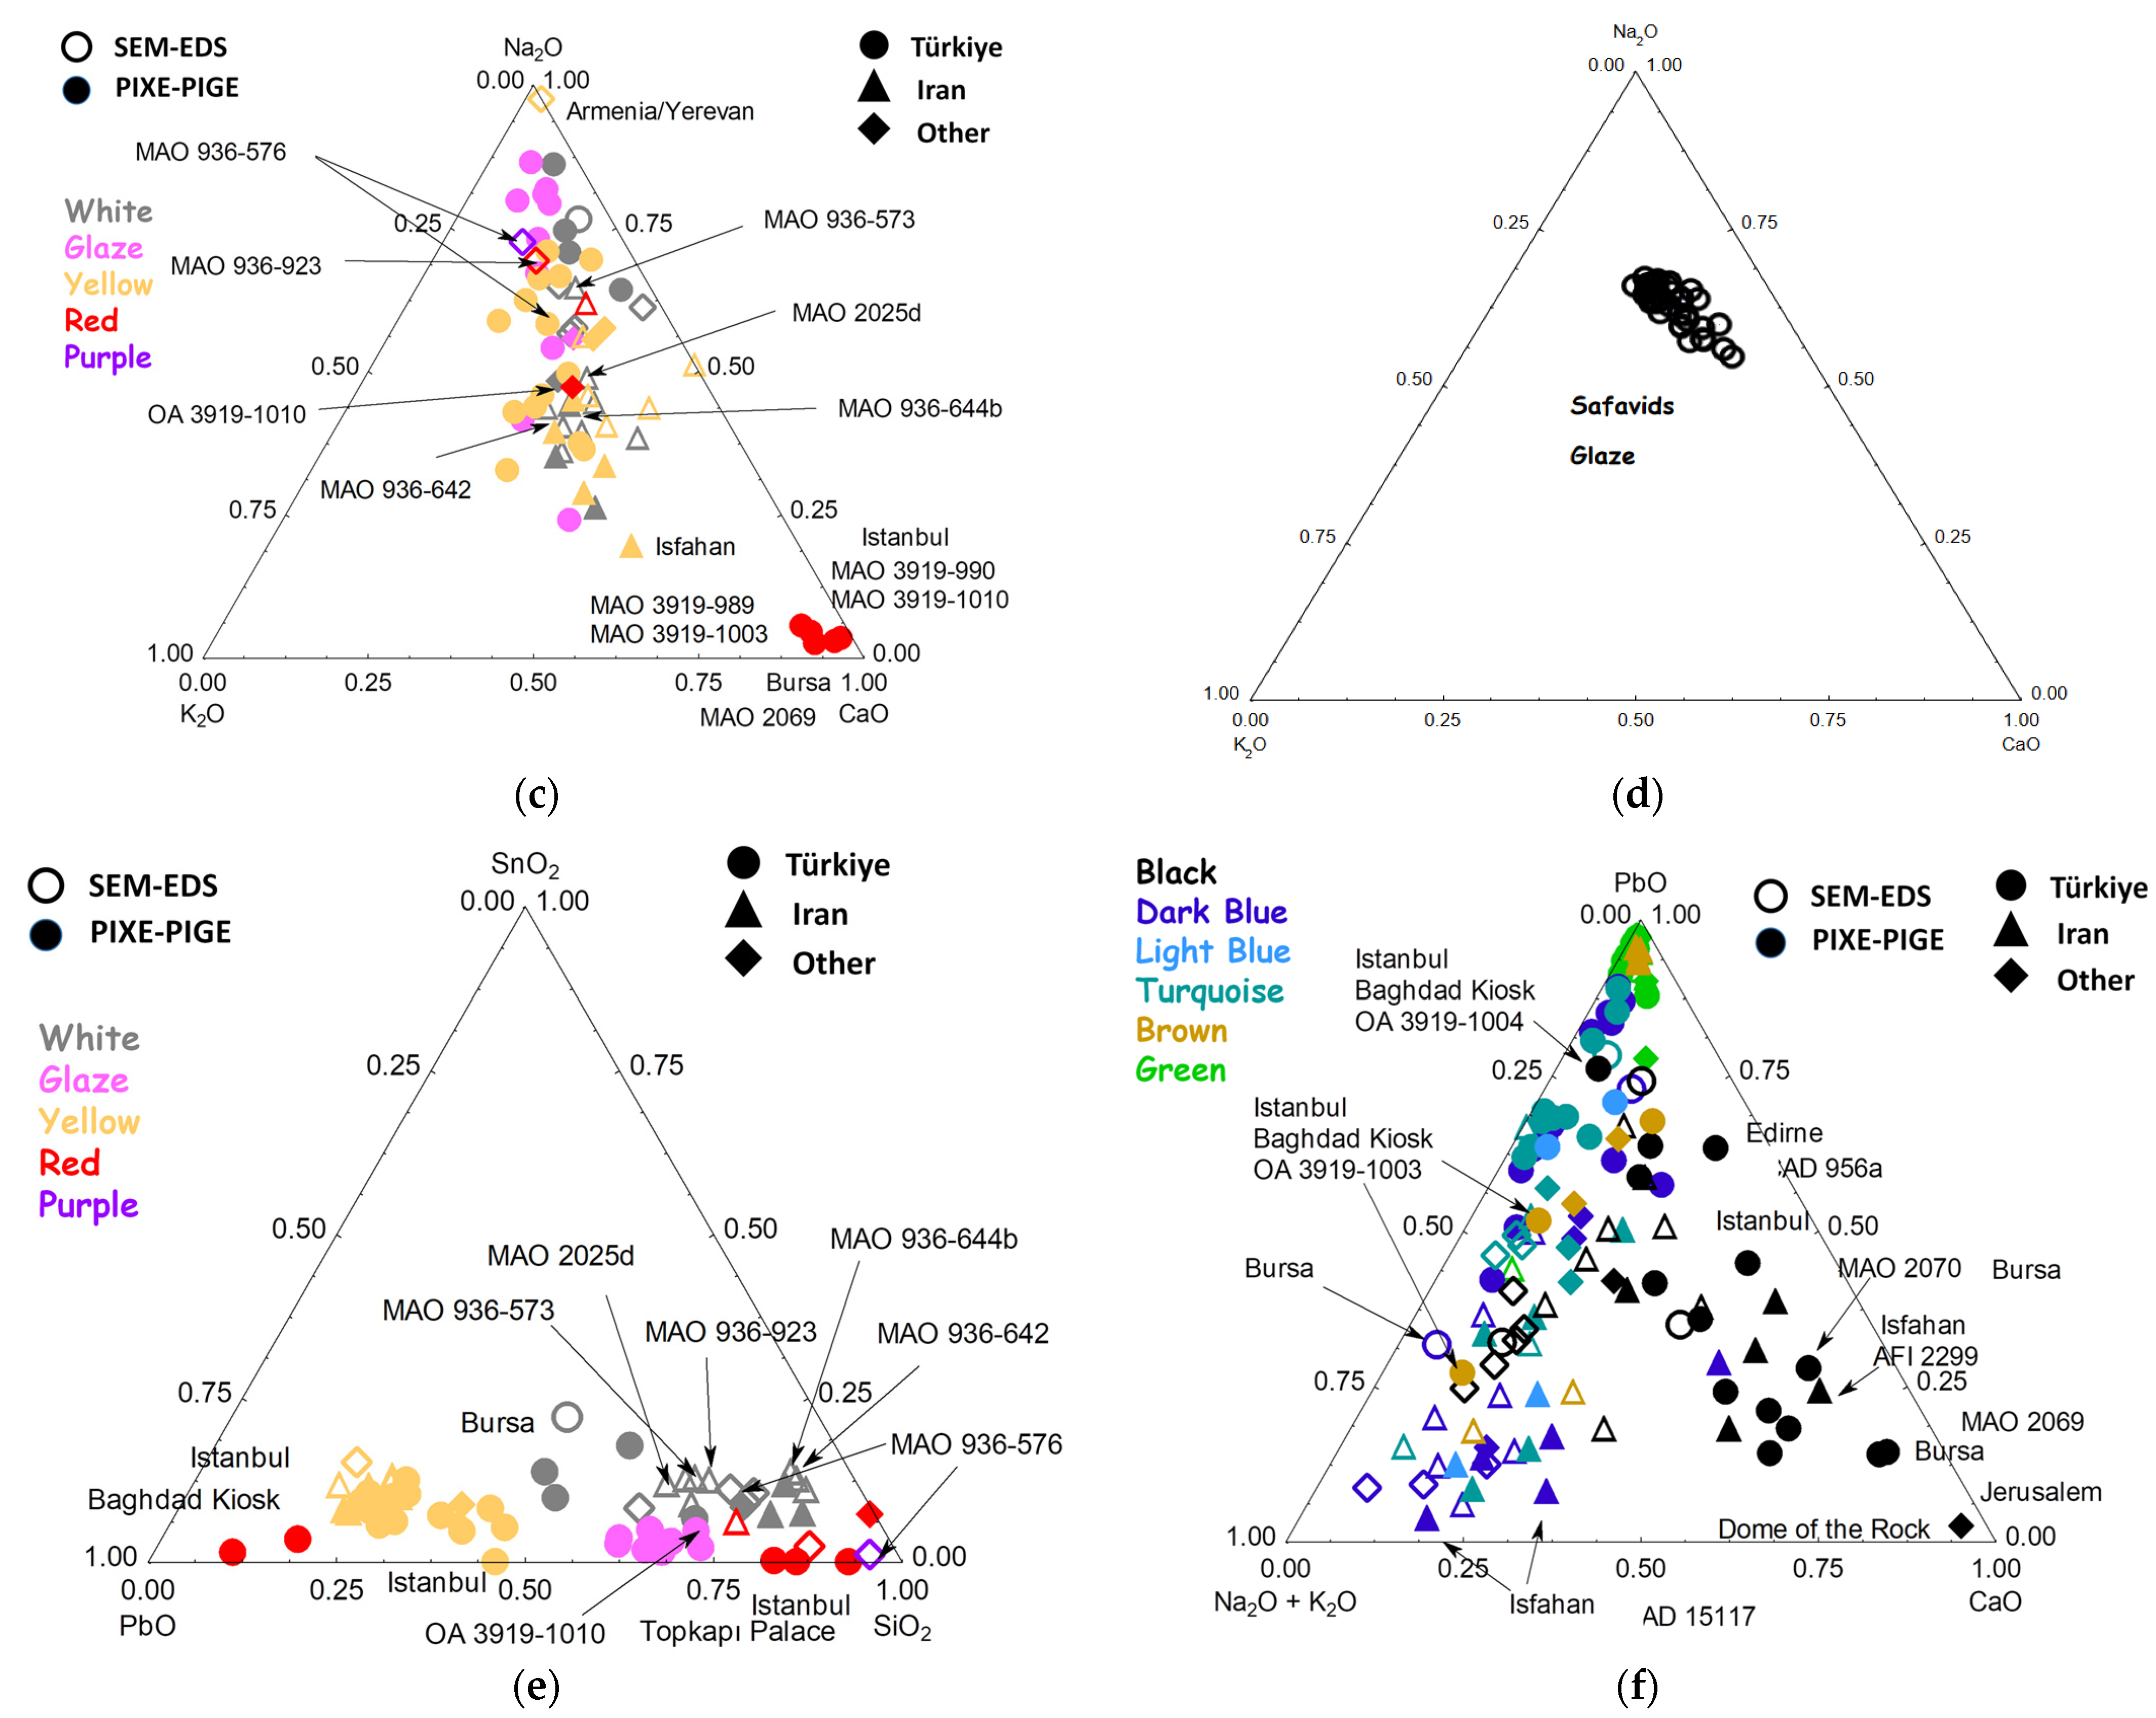
Figure 10.
Relative composition diagrams made with data of reference [65] comparing wt% oxide flux (a) and tin versus lead (b) oxide contents measured in this work with previous measurements on Iznik tiles from Edirne mosque [46], Topkapi Palace [28] and Iznik kilns excavation [47]. The comparison of SnO2/PbO ((c), white/colourless glaze) and CoO/MnO ((d), blue areas) ratios show different groups. Main groups are indicated (GL: colourless glaze; WH: white glaze (*: campaign in 2015; +: campaign in 2013); underlined: Raman spectra given in Figure 6, others in Supplementary Materials; see previous captions for the explanation of labels).

Figure 11.
Hierarchical similarity dendrogram built from data of reference [65] for white and colourless glaze ((a), the variables used are indicated) and ZnO-SnO2-SbO2 ternary composition diagram of yellow glaze ((b) *: campaign in 2015;); see previous captions and Table 1 for the explanation of labels; R: particularly representative Raman spectrum).

Figure 12.
Ternary diagrams from data of reference [65] comparing relative amount of colouring transition metal oxides (and lead oxide) for the black (a,c), brown (a), blue (e), red (f) and turquoise (f) areas. Comparison is made with SEM-EDS analysis of black phase (magnesium chromite) reported by Crowe (b) for Safavid tablewares (see details in [73]). Hierarchical dendrograms are built for the data related for black (c,d) and blue (g) areas. Labels are explicated in d (*: campaign in 2015; +: campaign in 2013).
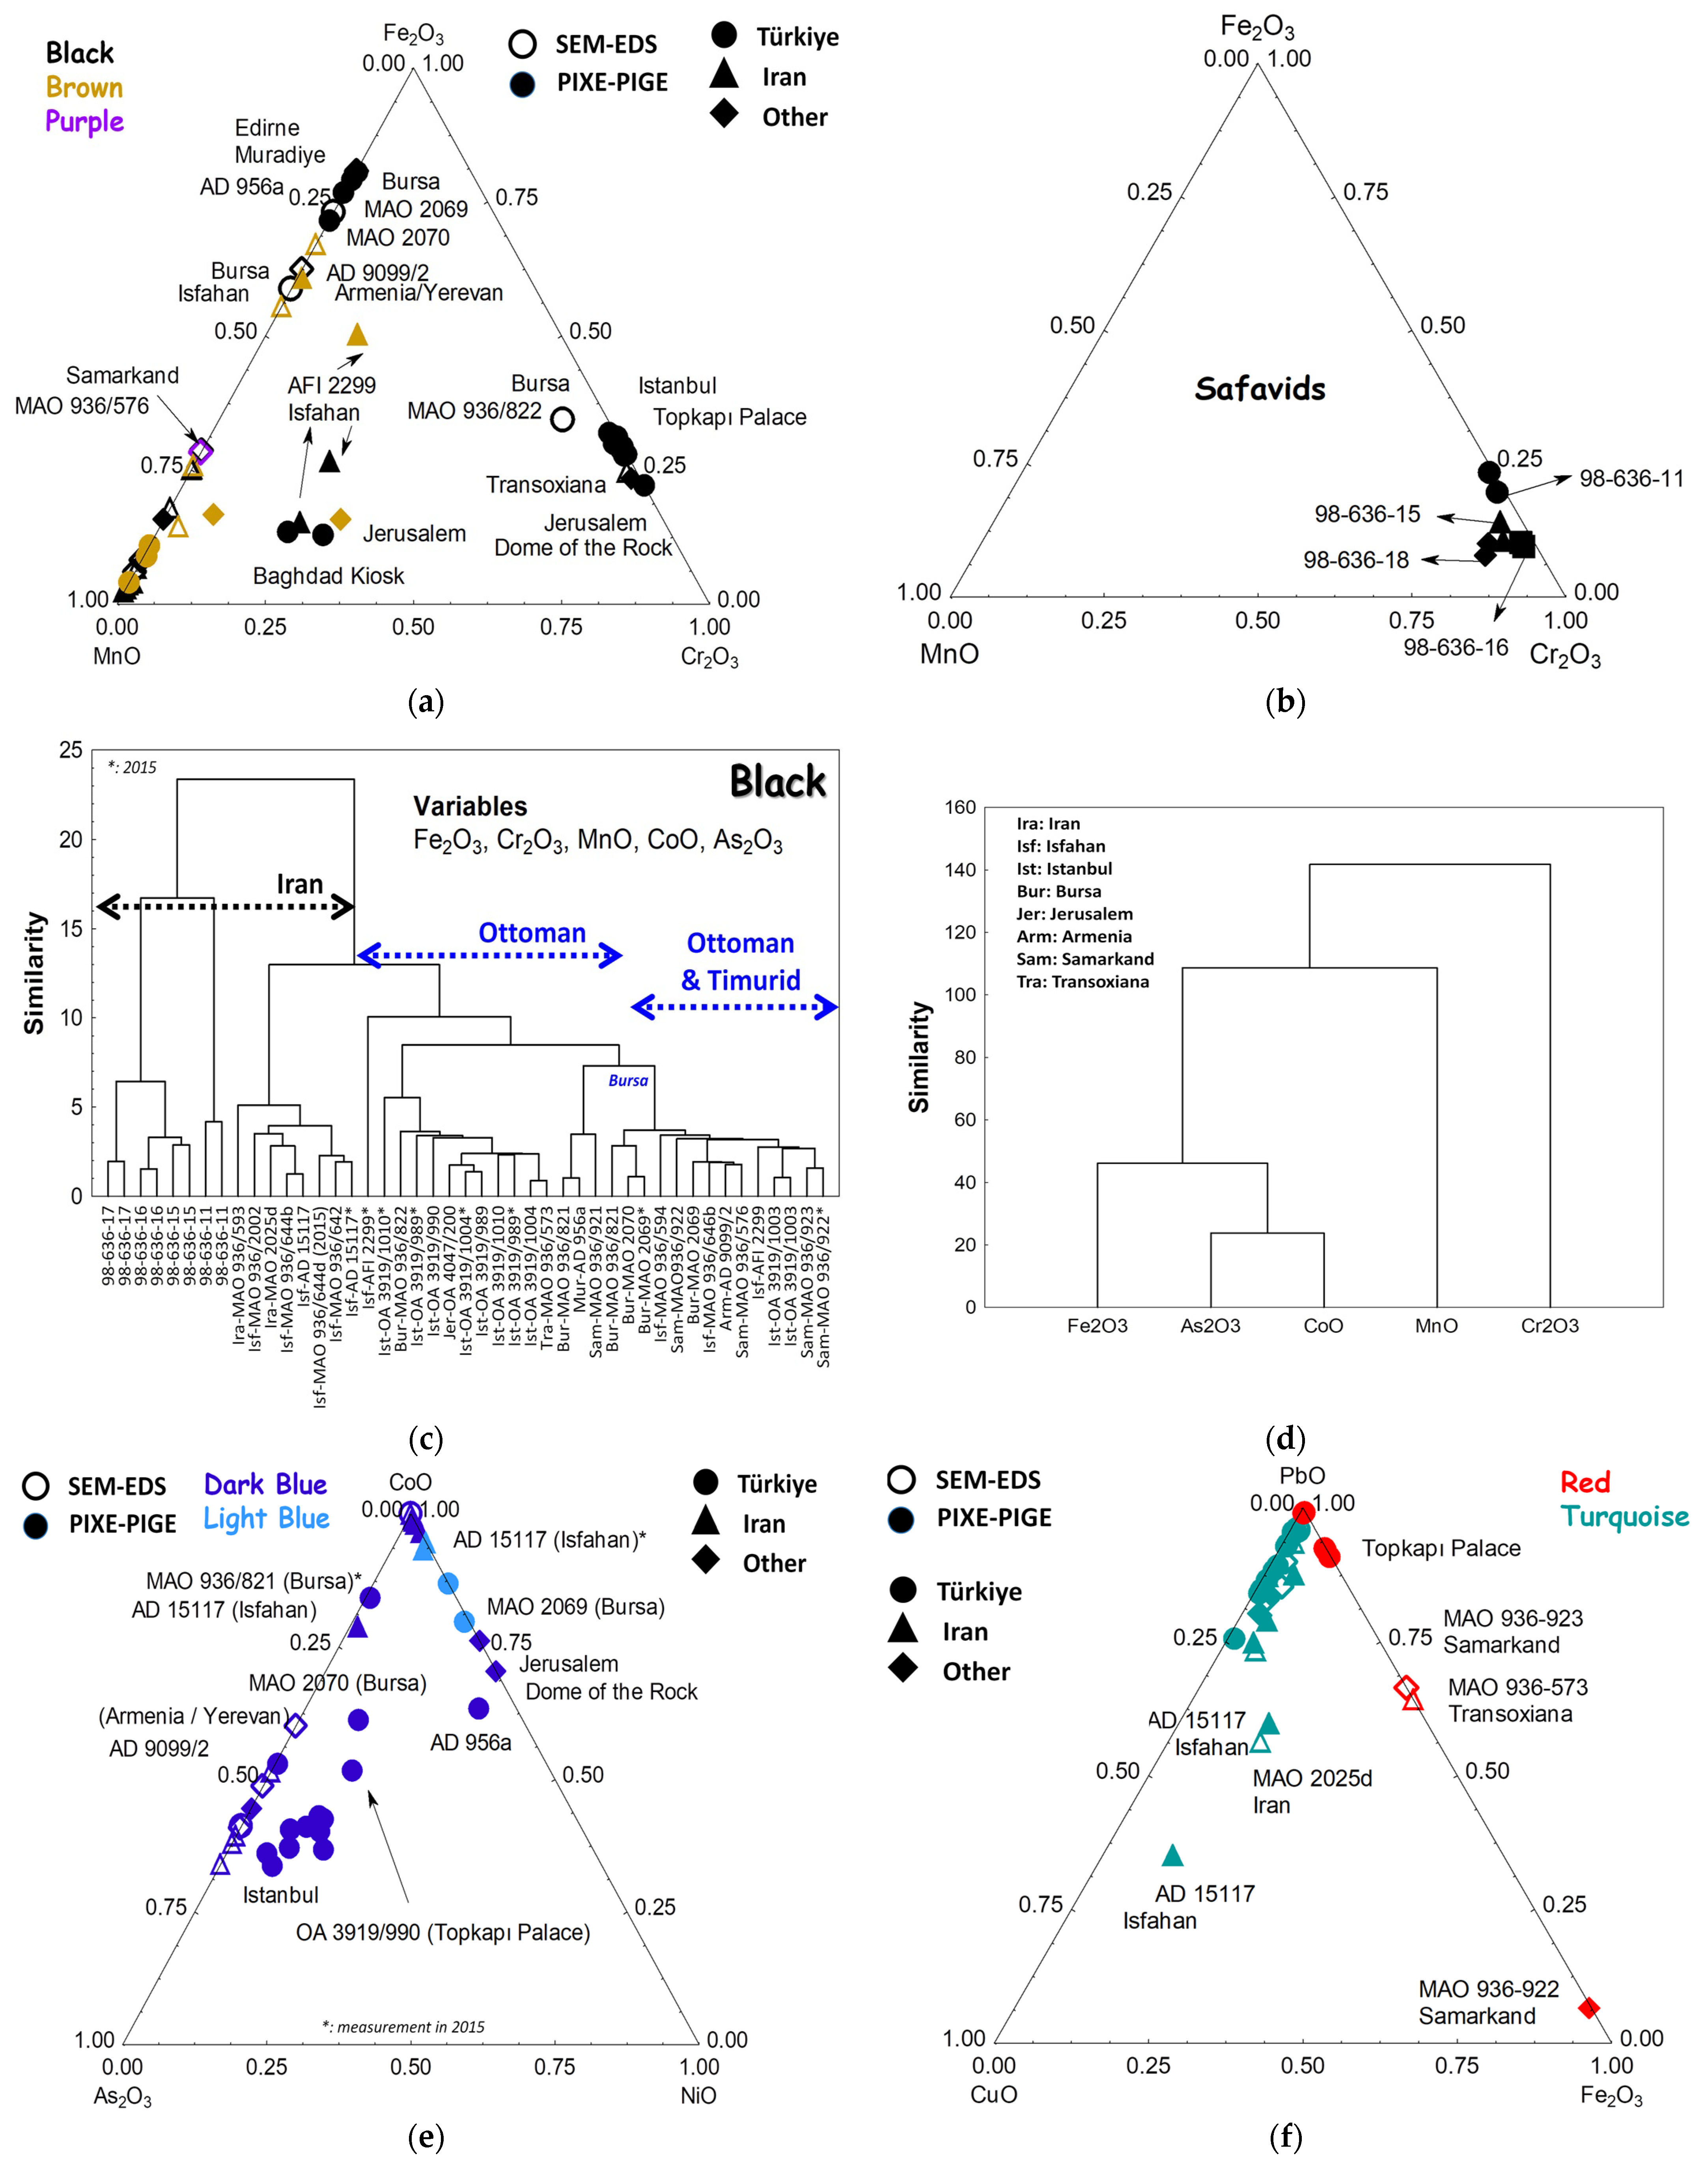

Figure 13.
Representative Raman spectra obtained on the ‘blue’ and ‘white’ areas of the polychrome Iznik dish with floral decoration (a). The spectral window showing fundamental modes is enlarged on the right part. Representative Raman spectra obtained on the ‘blue’ and ‘white’ areas of the Persian production dish with a decoration representing a shrub in a Chinese landscape (b). On the right, zoom of the domain presenting the spectral range of fundamental modes. Representative Raman spectra obtained on the mina’i cup depicting a rider (c). On the right, zoom of the domain presenting the spectral range of fundamental modes.
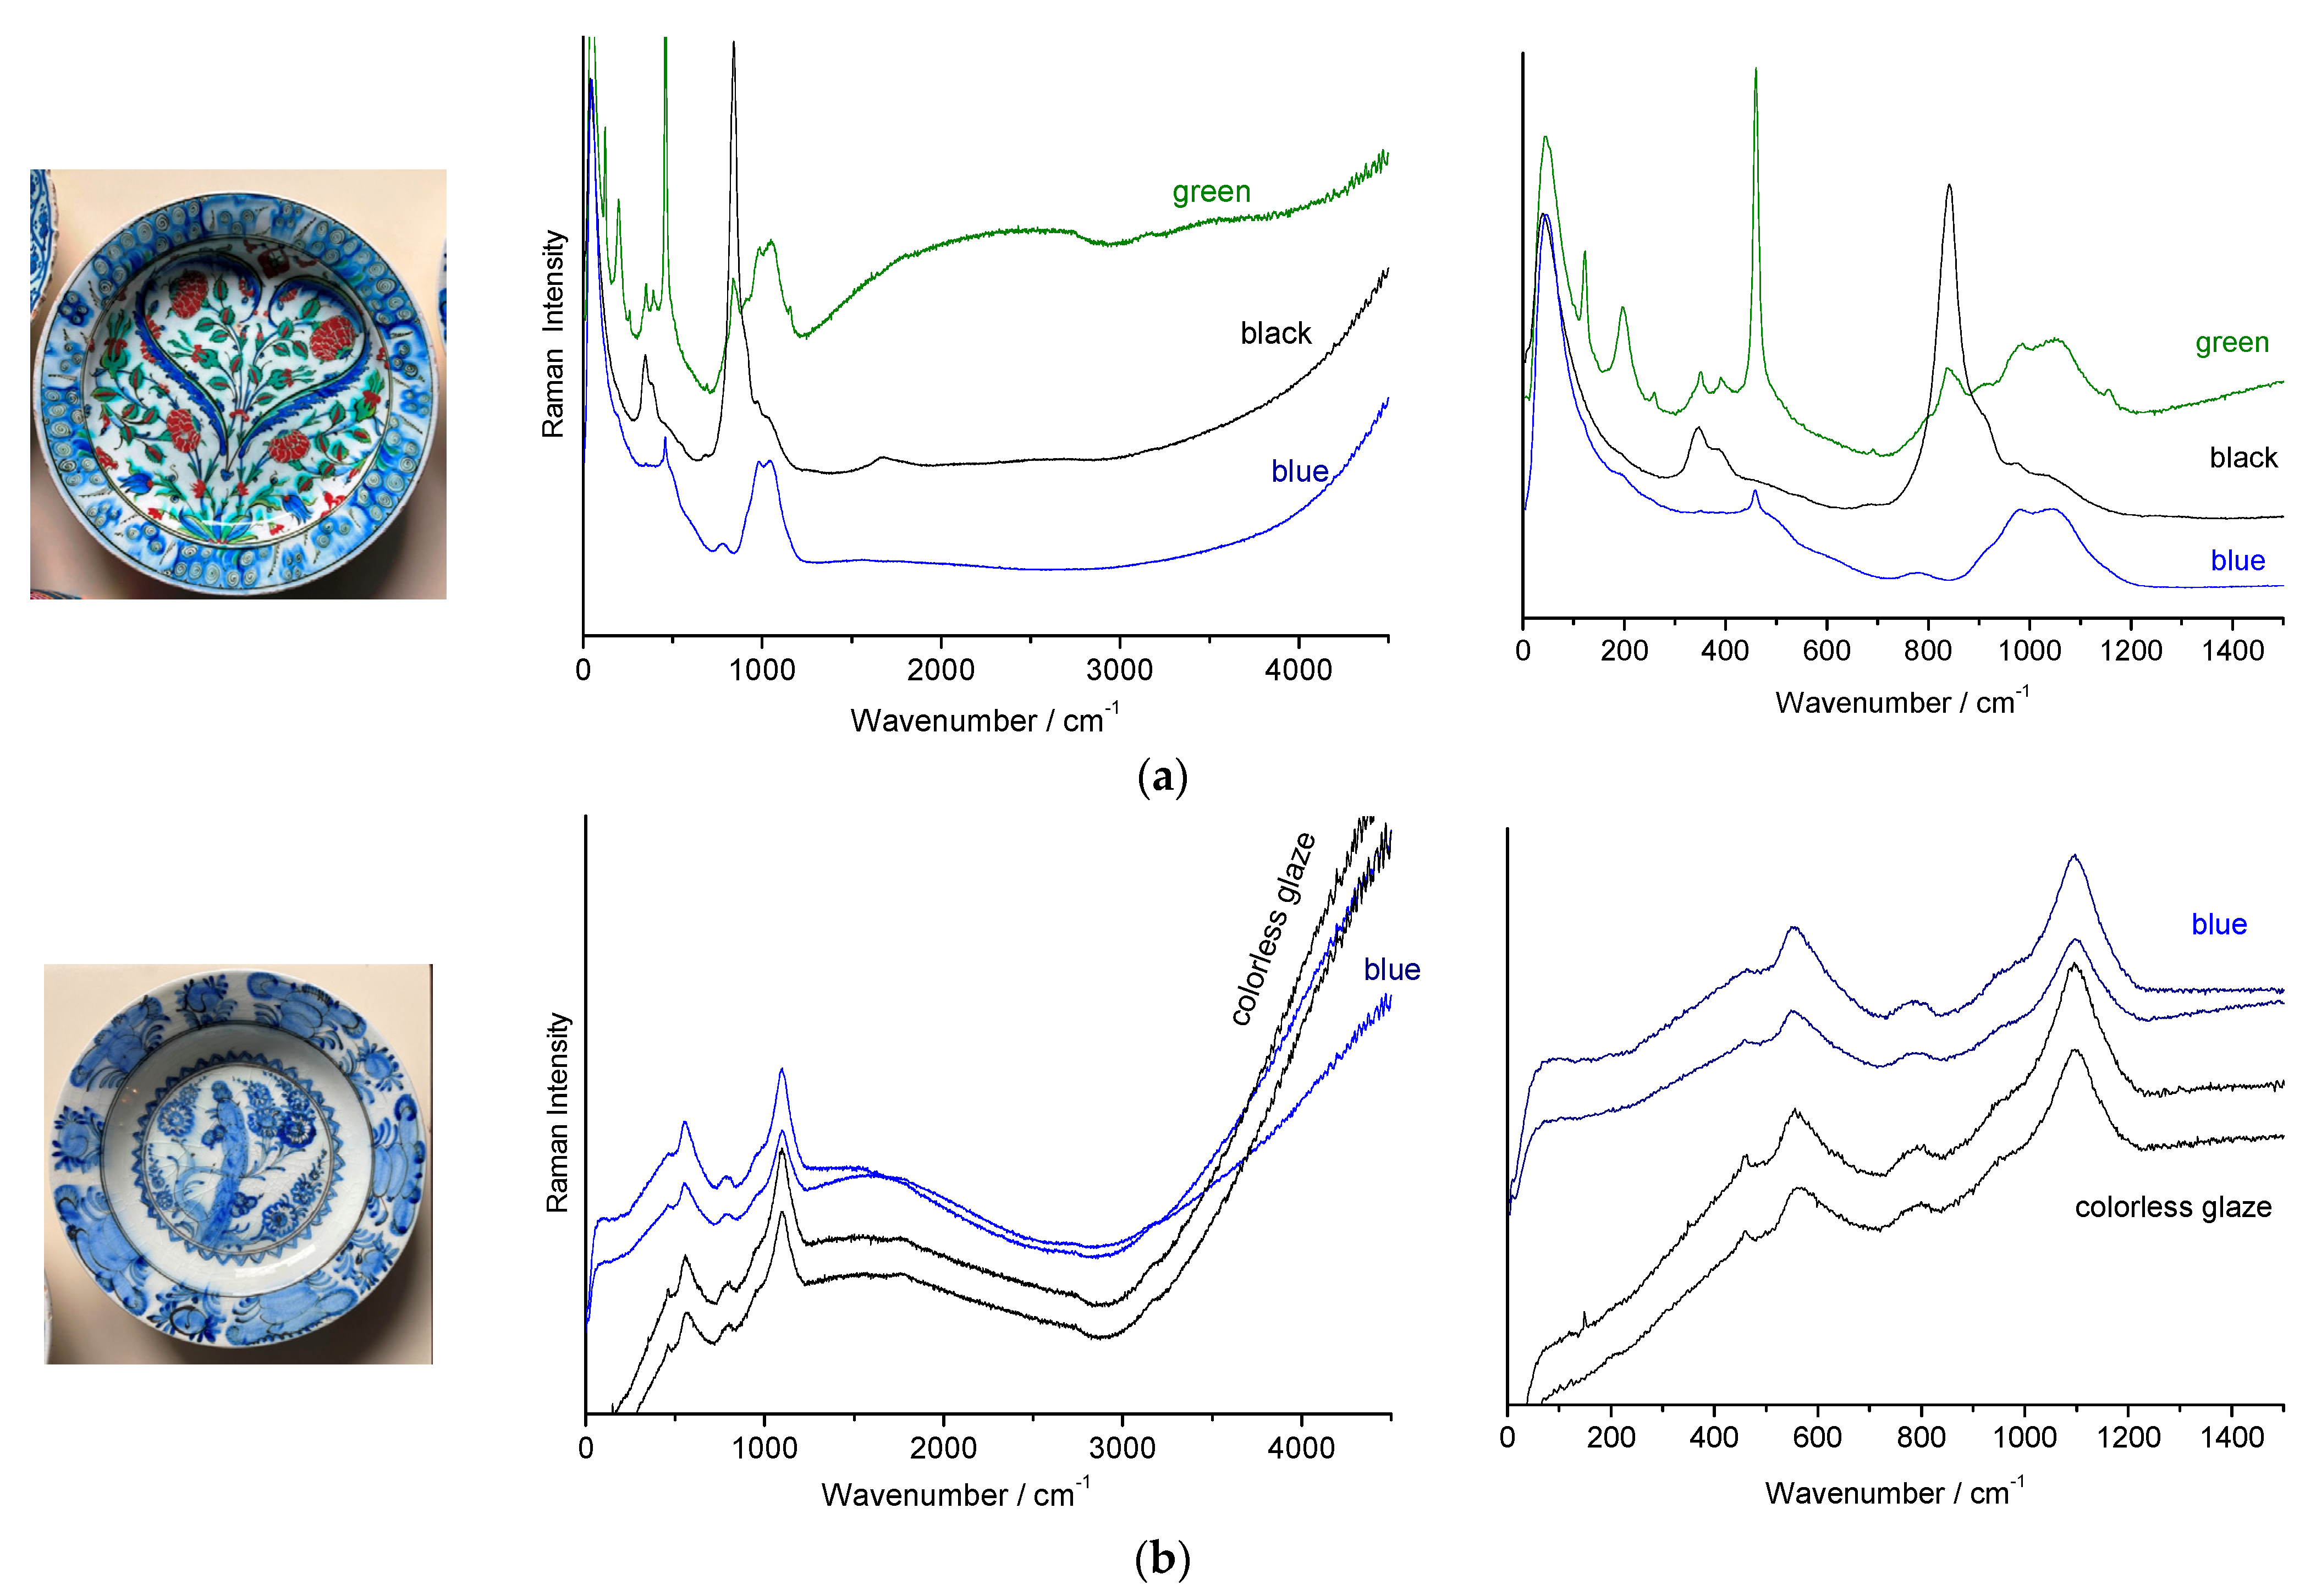


Table 1.
List of tile shards from Musée du Louvre collection (photographs: courtesy of *, L. Martinet; °, RMN) and their assumed dating and provenance (see [67] for more details). The information in brackets is offered as an improvement to the dating [65]. Date of entry in Louvre museum collection is given.
| Country, “Place” (Building) | View | Assumed Period /Century | Inventory Number [Dimensions/cm] | Previous Collection (Date of Entry) |
|---|---|---|---|---|
| al-Andalus (Spain) |  * * | 10th–11th Vessel shard | MAO 2083/39 | Sulzberger, David (2006) |
| Türkiye Bursa (Yeşil Külliyesi/Green Complex, Mausoleum) | 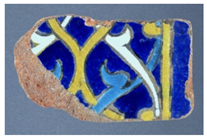 * * | 15th (1419–1424 1421–1425) (Ottoman) | MAO 936/821 [11.5 × 6.7 × 2.7] | Kiefer/Soustiel CK029/CK120 (1995) |
| Türkiye Bursa (Yeşil Külliyesi/Green Complex Mausoleum)? | 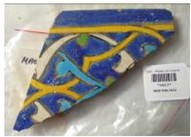 * * | 1864 [restoration] Kütahya | MAO 936/822 [12.3 × 12.4 × 1.5] | Kiefer/Soustiel CK0119 (1995) |
| Türkiye Bursa (Yeşil Külliyesi/Green complex, Mausoleum) | 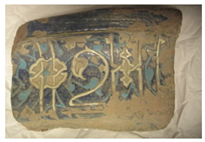 * * | 15th (1419–1424) ca. 142 1(Ottoman) | MAO 2070 [21.5 × 30.5 × 10] | Parvillée (1895) |
| Türkiye Bursa (Yeşil Külliyesi/Green complex, Mausoleum) | 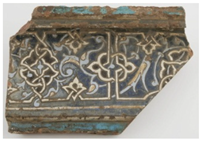 * * | 15th (1419–1424 1421) (Ottoman) | MAO 2069 [21 × 33 × 10] | Parvillée (1895) |
| Türkiye Edirne (Muradiye mosque)? | 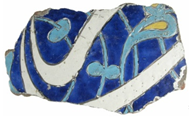 * * | 15th (1435,1436) 1400–1500 (Ottoman) | AD 956a [18 × 29.6 × 4.5] | Maciet (1885) |
| Türkiye, Istanbul (Topkapı palace) |  * * | 16th 1543–1548 (Ottoman) | OA 3919/1010 [13.2 × 26 × 1.8] | Sorlin Dorigny (1895) |
| Türkiye Istanbul? Edirne? | 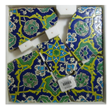 * * | 1514–1555 [ca. 1520] (Ottoman) | OA 3919/990 [26.8 × 27.2 × 2] | Sorlin Dorigny (1895) |
| Türkiye Edirne?, Istanbul? | 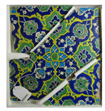 * * | 16th (ca. 1520) (Ottoman) | OA 3919/989 [26.3 × 27.5 × 1.9] | Sorlin Dorigny (1895) |
| Türkiye Istanbul? | 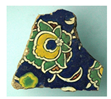 | 16th (Ottoman) | OA 3919/1006 | Sorlin Dorigny (1895) |
| Türkiye Istanbul? | 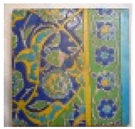 * * | 16th? (Ottoman) | OA 3919/1004 [24 × 26.5 × 2.3] | Sorlin Dorigny (1895) |
| Türkiye Istanbul (Topkapı palace) | 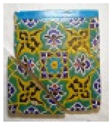 * * | [16th or17th]? Re-use? (Ottoman) | OA 3919/1003 [24 × 26.5 × 2.3] | Sorlin Dorigny (1895) |
| Uzbekistan, Samarkand (Shar-e Sabz, Aq-Saray) | 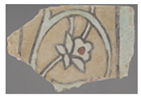 * * | Turn of 14th–15th (ca. 1380–1404) (Timurid) | MAO 936/921 [8.6 × 12.4 × 2.2] | Soustiel (1995) |
| Uzbekistan Samarkand (Bîbî Khânum) | 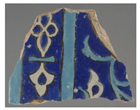 * * | ~15th (1399–1405) (Timurid) | MAO 936/923 [11.3 × 15.1 × 3] | Soustiel (1996) |
| Uzbekistan Samarkand (Ulugh Beg madrasa) | 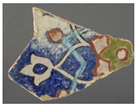 * * | 15th (1417–1420) 1370–1400 (Timurid) | MAO 936/922 [10.4 × 13.9 × 2.7] | Soustiel (1996) |
| Iran Transoxiana Khargerd, (El Ghiyâthiyya madrasa) |  * * | 15th (1438–1445) 1400–1600 (Timurid) | MAO 936/573 [4.9 × 16.2 × 3.5] | Kiefer/Soustiel (1995) CK0429 |
| Uzbekistan Samarkand (Bîbî Khânum) | 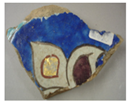 * * | ~15th (1399–1405) 1400–1600 (Timurid) | MAO 936/576 [11.5 × 16.6 × 3] | Kiefer/Soustiel (1995) CK0405 |
| Uzbekistan Samarkand (Bîbî Khânum) |  * * | ~15th (1399–1405) (Timurid) | AFI 698 [5.7 × 8.4 × 2.4] | 1996 |
| Armenia, Yerevan (Abbâs Mîrzâ mosque/Serdar Palace?) | 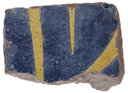 * * | (1807–1827) 1700–1900 (Qajar) | AD 9099/2 [9.5 × 12 × 4] | Krafft, (1899) |
| Armenia Yerevan (Abâs Mîrzâ mosque/Serdar Palace?) | 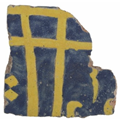 ° ° | 19th (1807–1827) (Qajar) | AD 9099/1 [18.7 × 18.7 × 3.8] | Krafft (1899) |
| Iran (mina’i) |  * * | Last quarter of 12th–13th | MAO 936/1127a | Kiefer/Soustiel (1995) |
| Iran (mina’i) |  * * | End of 12th–13th | MAO 936/319 | Kiefer/Soustiel (1995) |
| Iran (lajvardina) | Photograph not available | End of 12th–13th | MAO 936/277a | Kiefer/Soustiel (1995) |
| Iran Isfahan? (New Julfâ district?) |  * * | 17th–18th (Safavid) | AFI 2299 [22.2 × 22.8 × 2.5] | ? |
| Iran, Ispahan (Allahverdikan bridge, Pul-e Khwâjû) | 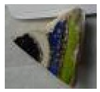 * * | 17th (1654,1655) (Safavid) | MAO 936/2002 [3.3 × 4.7 × 0.7] | Kiefer/Soustiel (1995) |
| Armenia Yerevan? (‘Abbâs Mîrzâ mosque/ Serdar Palace)? |  * * | [19th] 1600–1700 (Qajar) | MAO 936/593 [13.2 × 17.5 × 3.2] | Kiefer/Soustiel (1995) |
| Iran Isfahan (New Julfâ church)? | 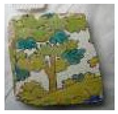 * * | (17th–19th) 1600–1700 Safavid/Zand/ Qajar? | MAO 936/594 [10.1 × 10.3 × 2.5] | Kiefer/Soustiel CK0150 |
| Iran Tehran/Qazwin? | 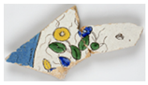 * * | 18th-19th Zand/Qajar? | MAO 2025d | Drouot Auction (2004) |
| Iran Isfahan (New Julfâ district)? | 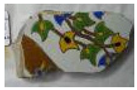 * * | (17th–19th) 1600–1800 (Safavid) | MAO 936/644b [7.9 × 15.6 × 2.1] | Kiefer/Soustiel (1995) |
| Iran Isfahan (New Julfâ district)? | 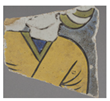 * * | (17th-19th) 1700–1800 Safavid-Qajar? | MAO 936/642 [8.2 × 9x2.2] | Kiefer/Soustiel (1995) |
| Iran |  * * | 19th Qajar | MAO 936/646b [9.9 × 12.9 × 2.1] | Kiefer/Soustiel (1995) |
| Iran Isfahan (New Julfâ district)? | 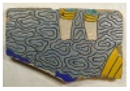 * * | 17th–19th Safavid-Qajar | AD 15117 [15.2 × 23.9 × 2.3] | Filippo (1908) |
| Israel/Palestine Jerusalem Dome of the Rock mosque Haram al-Sharif? |  * * | 16th 1545–1552 | OA 4047/199 [20 × 20.4 × 1.9] | Baudry (1898) |
| Israel/Palestine Jerusalem Dome of the Rock mosque Haram al-Sharif? | 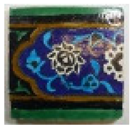 * * | 16th 1545–1552 | OA 4047/200 [20.3 × 20.8 × 2.5] | Baudry (1898) |
Table 2.
List of artefacts analyzed only from their glazed surface (Private Collection, photograph: P. Colomban).
Table 2.
List of artefacts analyzed only from their glazed surface (Private Collection, photograph: P. Colomban).
| View | Assignment Style | Period | Dimension /cm |
|---|---|---|---|
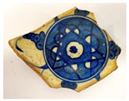 | Iznik dish baba Nakkas-style (blue-and-white shard) | 1510–1520 | 8.5 × 8 × 0.6 |
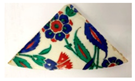 | Iznik tile (polychrome ware) | ca. 1575 | 13 × 13.6 × 1.35 |
 | Iznik dish (polychrome saz leaves decoration) | ca. 1580 | 34 × 6.5 |
 | Iran, Safavid (blue-and-white shard) | 17th c. | 8 × 8 × 1 |
 | Iran, Safavid tile (blue polychrome tile shard) | 17th c. | 9.5 × 10.4 × 2.8 |
 | Iran, Safavid tile (yellow polychrome with shard) | 17th c. | 10 × 14 × 2.5 |
 | Iran, (mina’i bowl) | middle 12th to early13th | 14 × 5.5 |
 | Iran, Safavid (blue-and-white dish with Chinese landscape decoration) | 17th c. | 32 × 6 |
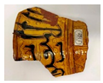 | Egypt Mamluk shard | 14th–15th c. | 11 × 11.5 × 0.8 |
Table 3.
Microstructure and Raman classification (beg: beginning of; mid: middle of; under-g: underglaze; sharp interface: SI; g: glaze; cass: cassiterite; woll: wollastonite). Dating according to Table 1. The phases are indicated when their signature has a significant intensity.
Table 3.
Microstructure and Raman classification (beg: beginning of; mid: middle of; under-g: underglaze; sharp interface: SI; g: glaze; cass: cassiterite; woll: wollastonite). Dating according to Table 1. The phases are indicated when their signature has a significant intensity.
| Inventory Number | Colour (Analysed Spot) | Origin (Period /Century) | Paste Colour | Quartz-Rich Layer (Firing) | White Under-Layer | Opacifier | Interfaces | νSi-O (cm−1) | Raman Finger-Print |
|---|---|---|---|---|---|---|---|---|---|
| MAO 2083/39 | cream yellow | al-Andalus 10th–11th? | light red | no | no | no | SI g-paste | 965 | Pb-G |
| MAO 936/573 | black | Transoxiana [1438–1445] 1400–1600 | 900 | ||||||
| MAO 936/1002 | yellow | Iran, Isfahan [beg 17th] 1654–1655 | 950 | ||||||
| MAO 936/593 | yellow green | Iran 19th | red | no | 960 960 | ||||
| MAO 936/645b | yellow | Iran [17th–beg 18th] 1600–1700 | 950 | ||||||
| MAO 936/642 | yellow black | Iran [17th–19th] 1700–1800 | yellow | no | yes | SI g-g | 900 950 | ||
| Priv. coll Table 2 | yellow | Iran | 900–950 | ||||||
| MAO 936/646b | yellow | Iran 19th | light red | yes traces cass | SI g-g | 900–950 | |||
| MAO 936/822 | yellow blue | Türkiye, Bursa 1864 | yellow | yes | Naples Sb yellow woll. | SI g-g yellow & blue | 990 | ||
| MAO 936/922 | yellow | Uzbekistan, Samarkand [1417–1420]/1370–1400 | red | no | SI g-g blue SI g-g red | 890–960 | |||
| AD 3919/1006 | yellow | Türkiye? 16th Ottoman | no | 990 | |||||
| OA 3919/1010 | yellow, green | Türkiye, Istanbul 1543–1548 | quartz | 965 | |||||
| AD 956a | turquoise | Türkiye, Istanbul 1435–1436]/1400–1500 | 920 | ||||||
| MAO 936/821 | turquoise | Türkiye, Bursa [1419–1424/1421–1425 | 960 | ||||||
| OA 3919/990 | yellow green | Türkiye, Istanbul [ca. 1520]/1514–1525 | 960 970 | ||||||
| AD 9099/2 | blue | Armenia, Yerevan 1807–1827/1700–1800 | 1000 | ||||||
| UCAD 9099/1 | yellow | Armenia, Yerevan 1807–1827 | 910 | ||||||
| AFI 2299 | yellow green | Iran, Isfahan 17th–18th | 965 920–970 | ||||||
| MAO 936/644b | yellow | Iran, Isfahan 17th–19th | yes | 940 | |||||
| MAO 936/642 | yellow black | Iran, Isfahan 17th–19th | no | 940 1000 | |||||
| MAO 936/1127a | white turquoise | Iran (mina’i) 12th–13th | yes cass. | 980 | |||||
| MAO 936/277a | turquoise | Iran (lajvardina) 12th–13th | 980 | ||||||
| AD 3919/1006 | glaze | Türkiye? 16th Ottoman | yes traces cass & woll. | 990–1095 | Pb-Na-G | ||||
| MAO 936/319 | blue white | Iran (mina’i) 12th–13th | |||||||
| MAO 936/821 | white turquoise | Türkiye, Bursa [1419–1424]/1421–1425 | yes | 1025 | |||||
| MAO 2070 | white | Türkiye, Bursa [1419–1424]/1421 | yes | 1015 | |||||
| MAO 2069 | white | Türkiye, Bursa [1419–1424]/1421 | yes | 980–1060 | |||||
| AD 956a | white | Türkiye, Istanbul [1435,1436]/1400–1500 | 990–1060 | ||||||
| MAO 936/319 | white | yes, cass. & woll. | 990–1070 | ||||||
| MAO 936/594 (AFI 698) | white blue | yes, cass. | SI g-paste | 990–1085 | |||||
| Pr. Coll | white blue | Türkiye, Iznik Baba Nakkas 1520–1530 | no yes, traces woll. & cass. | 990–1060 | |||||
| MAO 2025d | blue | Iran, Tehran 18th–19th | yellow | yes, cass. | 990–1060 | ||||
| Pr. Coll | blue glaze red turquoise | Türkiye, Iznik, Polychrome ca. 1575 | yes | no no trace cass. | 990–1060 | ||||
| MAO 936/2002 | blue white black | Iran 1654–1655 | yellow | yes | SI g-paste | 1090 | (Pb)Na-K-Ca-G | ||
| MAO 936/922 | white red | Uzbekistan, Samarkand 1417–1420 | yes, cass. | 1090 | |||||
| MAO 936/573 | red turquoise white | Iran 1438–1445 | red | yes | SI g-g yellow SI g-paste | 1090 | |||
| MAO 936/921 | white brown blue | Uzbekistan, Samarkand 1380–1404 | yes traces cass. arsenate? | 1090 1090 1090 | |||||
| AFI 698 | blue white glaze | Uzbekistan, Samarkand (15th) | 1090 | ||||||
| MAO 936/576 | blue white under-g | Uzbekistan, Samarkand 1399–1405 | yes, cass. & woll. idem | 1090 | |||||
| MAO 2025d | white | Iran, Tehran 18th–19th | dark yellow | yes, woll. | SI g-g yellow | ||||
| OA 3919/1010 | white turquoise | Türkiye, Istanbul 1543–1548 | 1078 | ||||||
| OA 3919/990 | white turquoise | Türkiye, Istanbul ca. 1520 | yes | 1070 1070 | |||||
| OA 3919/989 | white turquoise | Türkiye, Istanbul ca. 1520 | yes | 1060 1070 | |||||
| MAO 936/923 | white blue | Uzbekistan, Samarkand 1399–1405 | red | yes, cass. yes, cass. | g-g diff | 1100 1095 | |||
| MAO 936/922 | white red turquoise | Uzbekistan, Samarkand 1417–1420 | yes cass. | 1090 1095 1080 | |||||
| AFI 2299 | turquoise | Iran, Isfahan 17th–18th | yes | 1065 | |||||
| MAO 936/593 | white blue | Iran [19th?]/1600–1700 | yes, woll. | 1065 | |||||
| MAO 936/642 | white | Iran 1700–1800 | yes, cass. & woll. | 1000–1110 | |||||
| MAO 936/644b | white | Iran 1600–1800 | yes, cass. | 1000–1100 | |||||
| Pr. Coll. | white blue | Safavid 17th | no yes, woll. | 1090 | |||||
| MAO 936/2002 | white blue | Uzbekistan, Samarkand | yes, cass. no | g-g diff | 1000–1100 |
Disclaimer/Publisher’s Note: The statements, opinions and data contained in all publications are solely those of the individual author(s) and contributor(s) and not of MDPI and/or the editor(s). MDPI and/or the editor(s) disclaim responsibility for any injury to people or property resulting from any ideas, methods, instructions or products referred to in the content. |
© 2023 by the authors. Licensee MDPI, Basel, Switzerland. This article is an open access article distributed under the terms and conditions of the Creative Commons Attribution (CC BY) license (https://creativecommons.org/licenses/by/4.0/).
Share and Cite
MDPI and ACS Style
Colomban, P.; Simsek Franci, G. Timurid, Ottoman, Safavid and Qajar Ceramics: Raman and Composition Classification of the Different Types of Glaze and Pigments. Minerals 2023, 13, 977. https://doi.org/10.3390/min13070977
AMA Style
Colomban P, Simsek Franci G. Timurid, Ottoman, Safavid and Qajar Ceramics: Raman and Composition Classification of the Different Types of Glaze and Pigments. Minerals. 2023; 13(7):977. https://doi.org/10.3390/min13070977
Chicago/Turabian StyleColomban, Philippe, and Gulsu Simsek Franci. 2023. "Timurid, Ottoman, Safavid and Qajar Ceramics: Raman and Composition Classification of the Different Types of Glaze and Pigments" Minerals 13, no. 7: 977. https://doi.org/10.3390/min13070977
Note that from the first issue of 2016, this journal uses article numbers instead of page numbers. See further details here.