
Rheology, Setting, Heat of Reaction, and Compressive Strength of a Geopolymer Radioactive Waste Form

1
Vitreous State Laboratory, The Catholic University of America, Washington, DC 20064, USA
2
Physics Department, The Catholic University of America, Washington, DC 20064, USA
*
Author to whom correspondence should be addressed.
Minerals 2023, 13(8), 999; https://doi.org/10.3390/min13080999
Submission received: 16 June 2023
/
Revised: 12 July 2023
/
Accepted: 19 July 2023
/
Published: 28 July 2023
(This article belongs to the Special Issue Development in Geopolymer Materials and Applications)
Abstract
:This work contributes to our understanding of the properties of geopolymers as waste forms made of three pozzolans, to be used, e.g., to immobilize liquid low-activity radioactive waste. A binary blast furnace slag and metakaolin geopolymer composition was tailored to achieve flexible rheological properties and workability for in-can mixing or mixing/pumping applications by adding fly ash, a third pozzolan. We investigated quantitatively the early stages of geopolymerization (before and after setting) of alkali-activated slag–metakaolin–fly ash pozzolans. The effect of fly ash glass particle size on material properties was studied as well. Measurements include heat of reaction, compressive strength, yield stress, plastic viscosity, rheological setting, as well as initial and final setting following the Vicat method. A rheological time of initial setting is suggested for geopolymers, in analogy to Portland cement. The results of Vicat needle and rheological measurements are compared and quantitatively related to heat and set time data. Maximum heat flow and compressive strength are linearly correlated.

1. Introduction
Cementitious materials are the most frequently used waste forms worldwide to stabilize and solidify liquid wastes with hazardous elements and relatively low concentrations of radionuclides [1,2,3,4]. These materials all contain a certain amount of Portland cement. Alternative waste forms are being developed and tested, including geopolymers, which are free of Portland cement [1]. Geopolymers are made from alkali-activated pozzolanic raw materials, such as metakaolin, blast furnace slag, and fly ash. If renewable energies were used to produce the activating alkali (NaOH), the already low CO2 footprint of most geopolymers would become almost negligible. Alkali-activated metakaolin and low-calcium fly ash typically yield a quasi-amorphous zeolitic structure with absorption sites available for radionuclides. Alkali-activated blast furnace slag (BFS) yields alkali-substituted, cross-linked calcium aluminosilicate hydrate and secondary phases such as hydrotalcite or AFm phases, potential hosts for anionic radionuclides. Blast furnace slag can fixate 99Tc by reducing the pertechnetate (TcO4−) ion to insoluble TcO2 [5]. Geopolymers exhibit a significantly higher resistance to the attack of chemicals such as sulfuric acid, nitric acid, hydrochloric acid, and organic acids than ordinary Portland cement (OPC), making them attractive candidate waste forms for a range of radioactive and hazardous waste streams. Many studies on alkali-activated materials focus on measuring the properties of only one or mixtures of two pozzolanic raw materials [6,7,8,9,10,11]. Studies of ternary mixtures of three raw materials are less frequently conducted [12]. Rashad provided an overview of the influence of different additives on the properties of alkali-activated slag [13].
We have developed a geopolymer, named DuraLith [14,15], as part of a candidate waste form development and testing program to immobilize Hanford Secondary Waste (HSW), a stream of liquid low-level radioactive waste from the off-gas treatment systems during vitrification of radioactive wastes in the Waste Treatment and Immobilization Plant (WTP). The waste stream contains low concentrations of 99Tc, 129I, and non-radioactive constituents of concern. The geopolymer fixated the technetium and the hazard elements very well. Fixation of iodine requires further work [14,15]. The detailed compositions of these wastes can be found in reference [4]. Other candidate waste forms were Cast Stone and Ceramicrete [16]. The geopolymer waste form is made of blast furnace slag–metakaolin blends to which an amended waste solution is added. It exhibits superior mechanical strength and comparable chemical durability to those of the other waste form candidates [16]. However, the geopolymer paste showed rapid setting behavior with a relatively short workable time during industrial-scale testing, potentially limiting waste processability. A third pozzolan, less-reactive fly ash, was included to improve the binary formulations, yielding a satisfactory set time in the laboratory [17] and at the engineering scale [18].
In-can mixing [19] and mixing/pumping processes have been developed to produce cementitious waste forms with or without Portland cement. The successful placement of fresh waste form grouts depends on rheological properties such as yield stress, plastic viscosity, setting and stiffening, and their time dependencies (workability). Many studies have been published on rheological properties of Portland cement-based mortars [20,21,22,23,24,25,26] and on geopolymer materials [27,28,29,30,31]. Struble and Lei [24] reported that the rapid increase in yield stress indicates initial setting of a Portland cement mortar. Setting was indicated by a sharp rise in yield stress, at a time when the Vicat penetration measurements still showed nothing. Kashani et al. [32] used the creeping sphere method to measure the time-resolved yield stress of alkali-activated slag pastes up to 140 min. In this study, blast furnace slag was sequentially substituted with two Class F fly ashes with different particle sizes in the binary blast furnace slag–metakaolin geopolymer to further broaden the chemical domain for solidifying and stabilizing HSW with a focus on the time dependence of fresh and cured properties. Geopolymer waste forms were tailored for flexible rheological properties and workability that allow for the adequate mixing, casting, and placement of fresh waste forms via in-can mixing or mixing and pumping.
We conducted a quantitative investigation of properties of mixtures of three pozzolans before, during, and after setting, including rheological properties, heat of reaction, and compressive strength. We show and discuss quantitative relationships between several of these properties. These relationships allow for the prediction of long-term performance based on early properties of a waste form. To the best of our knowledge, these relationships have not yet been established quantitatively for geopolymer waste forms.
2. Materials and Methods
2.1. Materials
The raw materials were Ultrafine Micron 3 fly ash (UM3) and Rockdale fly ash (RFA), both Class F fly ashes (FAs), from Boral Material Technologies Inc. (Reidsville, NC, USA) as well as ground granulated blast furnace slag (GGBFS) grade 120 from Sparrow Point Plant, Baltimore, MD, USA (Lafarge-Holcim North America, Inc.), called slag in the following, metakaolin (MK) from Thiele Kaolin Company (Sandersville, GA, USA), silica fume (SF) from Norchem Inc. (Hauppauge, NY, USA), and river sand from Aggregate Industries (Severn, MD, USA). The RFA Fly ash UM3 is a more fine-grained portion of RFA.
Chemical analyses of all raw materials except river sand were conducted by X-ray fluorescence (XRF) using a PANalytical AXIOS-max advanced X-ray fluorescence instrument. Both fly ashes contained close to 90 wt.% glass, which contained almost the same amounts of Al2O3 and CaO. The SiO2 content was slightly higher in the Rockdale fly ash. The blast furnace slag contained about 95 wt.% glass, which consisted mainly of SiO2, Al2O3, CaO, and MgO. Metakaolin (Al2Si2O7) is the dehydroxylated clay mineral kaolin (Al2Si2O5(OH)4), and silica fume (micro silica) is a byproduct of silicon and ferrosilicon production. Silica fume is practically pure amorphous SiO2, but it contained ≤0.5 wt.% Si, which was not determined.
The particle size distributions of the fly ashes were measured with a Microtrac S3500 particle size analyzer. The particle size range of UM3 was 0.5 µm to 25 µm and that of RFA was 0.7 µm to 500 µm. The most frequent particle size of UM3 was ≈6 µm and that of RFA was ≈50 µm.
A simulated HSW with a total of six moles per liter of Na+ was employed to prepare geopolymer waste forms. The simulated HSW was essentially a sodium hydroxide (2.38 moles/L) and sodium nitrate (1.97 moles/L) solution containing 0.56 moles/L aluminum hydroxide (Supplementary Material, Table S1). The simulated solution was spiked with rhenium (replacing 99Tc) and non-radioactive iodide (replacing 129I).
2.2. Activator Solution
The activator for the pozzolans was made by amending a simulated HSW solution, which contained already 1 M NaOH. The waste solution was concentrated to 6 M Na+ for a higher waste loading. The composition of the original HSW waste solution is given in the Supplementary Material, Table S1. Table 1 shows the recipe for 1 kg of activator solution.
To adapt the composition of the activator solution to that of the pozzolans, several constraining parameters were applied to provide an optimal condition for geopolymerization. These parameters are the mass ratios for slag and fly ash. The water-to-slag and water-to-fly ash ratios were 0.35:1. The Na2O-to-slag, the Na2O-to-fly ash, the soluble silica-to-slag, and the soluble silica-to-fly ash ratios were 0.075:1. The molar ratios for metakaolin are 3.75:1 for SiO2:Al2O3, 9.8:1 for H2O:M2O, and 1.05:1 for M2O:Al2O3 (M2O = Na2O + K2O). Potassium hydroxide was dissolved in the amended HSW solution to achieve a molar MOH (M = K, Na) of 8.75. Finally, silica fume was dissolved in it to finish the activator solution. After having added the alkali hydroxides and the silica fume, the solution was stored for at least three days at room temperature to ensure complete dissolution of the silica fume.
2.3. Geopolymer Samples Preparation
Table 2 shows the geopolymer mortar recipes. The mass of fly ash (UM3 or RFA) increases from A to E, replacing the blast furnace slag (BFS) gram-for-gram.
Figure 1 illustrates the mixtures of raw materials that were used. Point A is the binary MK (25 wt.%) and BFS (75 wt.%) mixture. Points B to E show increasing amounts of FA substituting for slag in 15 wt.% steps, keeping the MK concentration at 25 wt.%. We worked with two fly ashes, UM3 and RFA. Therefore, there are two series of substitutions. In the following text, B4 to E4 refers to work with UM3, and B5 to E5 refers to work with RFA. Pure MK, BFS, UM3, and RFA were alkali-activated and studied as well.
Geopolymer samples were prepared at room temperature by a chemical reaction between the activator solution and the pozzolanic raw materials. The reaction products depend on the type of pozzolans. Typically, a gel forms and polymerizes into a three-dimensional network of aluminate and silicate tetrahedra which resembles that of zeolites. Water is a condensation product and is expelled. At the same time, calcium aluminum silicate hydrate may form, which retains water.
For the process of mixing, we used a 7 qt (6.6-L) planetary mixer at an intermediate speed for 5 min to obtain a homogeneous paste. The fresh paste was sampled for a set time and rheology tests as well as filled into 2 × 4 inch cylindrical plastic forms. The samples were placed on a vibrating table for a few minutes to remove bubbles. These samples were then sealed with a lid and cured at room temperature until compressive strength measurements were performed.
2.4. Rheology Measurements
We used a Viskomat NT Mortar Rheometer (Schleibinger, Germany). This type of rheometer has been employed frequently to study rheological properties of cementitious and geopolymer materials [33].
A cylindrical sample container rotates and causes the geopolymer paste to flow through the blades of an impeller. This exerts a torque (T), which is measured by a transducer. A series of data points of torque and rotational speed, i.e., the shear rate (N), are recorded. The maximum torque was 250 N·mm and measured every second. The rheological data acquisition was up to 130 min. The maximum speed of the container was 50 rpm. At the beginning of a measurement, a high-precision synchronous motor increased the cylinder’s speed linearly within 2.5 min from 0 to 50 rpm and then decelerated linearly to 0 rpm within another 2.5 min to complete an “up-curve” and “down-curve” cycle. After resting for 5 min, this cycle repeated itself automatically until the maximum torque was reached.
2.5. Vicat Needle Test
Initial and final times of setting were measured with a Vicatronic Model E044N Automatic Vicat needle penetration instrument (Matest, Italy) following ASTM C191.
2.6. Heat of Reaction
This property was measured at 25 °C with a TAM Air Model 3116 Isothermal Conduction Calorimeter (TA Instruments, New Castle, DE, USA). Dry ingredients and the activator were mixed with a hand-held mixer for 1 min. Typically, the paste weighed about 120 g. About 7.5 g of paste was put into a glass vial, capped, and placed into the calorimeter. The time between the contact of solids and the liquid and the beginning of the measurement was several minutes. Establishing thermal equilibrium between the sample and the calorimeter may have affected the data taken during the first few minutes. Most heat measurements were conducted for 21 days.
2.7. Compressive Strength
Compressive strength was measured with a calibrated Humboldt CM-4000-SD Test Mark instrument. The experimental conditions of ASTM C39 (2004) were as follows. The compression machine was calibrated against NIST Traceable load cell test standards. Samples were cylindrical, 2″ in diameter, and 4″ high. They were cured for 1, 3, 7, 14, 21, and 28 days at room temperature (about 21 °C) with a tight lid on each sample.
2.8. Scanning Electron Microscopy
A JEOL KSM-5910LV scanning electron microscope (SEM) with an Oxford INCA EDS acquisition system and a CCD camera was utilized to characterize geopolymer samples in terms of morphology, phases, and the measurement of gel compositions semi-quantitatively. All SEM studies were conducted with 28-day-old samples. Samples were prepared by embedding small geopolymer pieces in epoxy resin, polishing, and carbon coating.
3. Results
3.1. Rheology
The Bingham equation can be written as T = g + hp · n (T in N · mm, g in N · mm, hp in N · mm · s, and n in 1/s); g is proportional to yield stress and hp to plastic viscosity. The time that elapsed between the contact of the activator and the premixed raw materials and the beginning of a measurement in the rheometer was about 12 min. The slopes (hp) and the respective intercepts (g) are shown in Figure 2 and Figure 3 as a function of age and composition (A to E4 and A to E5), respectively. The boxed points A, B, and C will be discussed in Section 4.
3.2. Vicat Needle Test
Results are shown in Table 3. The time it took until the paste made with the coarse-grained RFA solidified was longer than that of the fine-grained fly ash UM3. This is in good agreement with Hu et al. [34], who reported that fly ashes with smaller particles show shorter Vicat set times than those with larger particles.
3.3. Heat of Reaction
Results are shown in Figure 4 and Figure 5. Figure 4a shows the cumulative heat release of each raw material for the first six hours. The heat increases with time, i.e., as the geopolymerization progresses. Slag produced the highest cumulative heat, followed by MK. The two fly ashes released considerably less heat during geopolymerization. As expected, the fine-grained fly ash UM3 reacted faster and released more heat than RFA. This agrees with Grzeszczyk and Lipowski [35] and Bentz et al. [21], who found qualitatively the same difference for fine- and coarse-grained fly ashes.
In Figure 4b, we have plotted the specific heat flow of the four materials for the first 24 h. Figure 4b shows a one- to two-hour incubation period for slag and MK after the decay of the dissolution peaks, followed by an acceleration/deceleration peak, which suggests precipitation of reaction products [35,36,37], i.e., the geopolymer gel.
We selected RFA (series B5 to E5, i.e., the successive replacement of slag by RFA) for a more detailed study on heat release. The respective reactions with UM3 were too fast to analyze the heat effects as reliably as with RFA. Figure 5a shows cumulative heat releases for the first six hours. As expected, the releases decreased with the decreasing concentration of slag in the mix. Two calorimetric events were recorded for all samples and are shown in Figure 5b: dissolution (only partially captured) and a peak related to geopolymerization. The different starting points of the curves relate to the time that elapsed between the start of mixing and placement of the sample in the calorimeter. Dissolution happened in less than 20 min but was incomplete for RFA, as was seen under the SEM in solidified samples (Section 3.5). Even the smaller glass particles in the fly ash were not fully dissolved after 28 days. Figure 5c shows the cumulative heat release over 21 days.
3.4. Compressive Strength
Compressive strength results are shown in Table 4.
The geopolymer ‘A’ (MK–slag paste) always showed the highest compressive strength. ‘A’ produced the highest amount of heat and therefore the highest mass of gel. Increasing the substitution of slag by fly ash decreases the compressive strengths because less and less gel forms.
3.5. Scanning Electron Microscopy
Figure 6 shows backscatter micrographs of samples B4 and E4 as well as backscatter micrographs of samples B5 and E5. All samples were cured for 28 days. The respective compressive strength data are shown in Table 4. The concentrations of the three pozzolans (slag, FA, MK) in B4 and B5 were 60/15/25 and in E4 and E5 were 15/60/25. The FA in B4 and E4 was UM3 and RFA in B5 and E5. The white particles are slag, the big gray particles are sand, and the circular particles are fly ash glass. The matrix phase is gel. The pores are black. The cracks are artifacts due to sample preparation. Glass particles are much larger in B5 and E5 (RFA) than in B4 and E4 (UM3). Gel compositions could not be correctly measured due to contamination from the elevated salt concentrations in the HSW.
4. Discussion
4.1. Rheological Time of Setting, Yield Stress, Plastic Viscosity
Amziane and Ferraris [38] were the first to quantify a rheological fluid-to-solid transition for Portland cement-based pastes. We have applied their findings to our geopolymer pastes.
We discuss the more slowly reacting Rockdale fly ash (RFA) first and then the ultrafine fly ash (UM3). The finer-grained fly ash reacts faster because it has a higher specific surface area. As more RFA replaces slag (Figure 2b and Figure 3b, curves B5 to E5), hp and g change less and less with the age of the paste. However, as time progresses, the dependence becomes significant again. We represent our data by two straight lines as shown for example for E5 in Figure 2b and Figure 3b. One line follows the data from point A to B, the other from B to C. Point A denotes the earliest measurable values of hp and g, respectively. Point C denotes the highest value measured without risking damage to the instrument. The two lines AB and BC intersect at point B. Amziane and Ferraris [38] identified point B as the fluid-to-solid state transition. This is the rheological time of initial setting. We do the same and suggest point B as the rheological point of initial setting of our geopolymer pastes. Struble and Leit [24] related a rapid increase in the yield stress of a Portland cement paste to the transition from liquid to solid. Recent work conducted by Arnoult et al. [31] showed that setting is related to a rapid increase in viscosity in geopolymer mixtures.
The fluid-to-solid transition reported by Amziane and Ferraris [38] was sharper than the ones in this study. The sharpness of the transition between AB and BC depends on the underlying chemical reactions and their rates, i.e., on the composition and particle size of the pozzolans. As expected, the transition occurred much earlier with the finer, i.e., faster-reacting, fly ash UM3 (Figure 2a and Figure 3a) than with RFA (Figure 2b and Figure 3b). An effect of particle size on the sharpness of the transition was not seen. The composition of the two fly ashes is very similar. The rate of geopolymerization is determined by the specific surface area of the glass particles in the fly ash. The increase in hp and g after the fluid-to-solid transition can be interpreted as the appearance of and rapid increase in contact points between growing gel islands.
The plastic viscosity hp was high initially (Figure 2) for the geopolymer paste of composition A because of the early start of geopolymerization and early setting. Small additions of one or the other fly ash did not affect the polymerization initially but slowed the process later, keeping hp below the respective values for paste A. Increasing the substitution of fly ash for slag lowers the polymerization rates and keeps the paste in a fluid state for longer.
The increase in g (yield stress) with time (Figure 3) reflects the increasing elasticity of the growing and aging geopolymer network. It is not surprising that the energy needed to destroy this network increases with time. Wallevik [22] has shown for Portland cement pastes that the time-dependent behavior of the paste can be modeled by its thixotropic behavior (coagulation, dispersion, re-coagulation) and its structural breakdown behavior.
4.2. Rheological and Vicat Times of Setting
We have averaged the intercepts B for hp and g from Figure 2 and Figure 3 and show them for the fly ash UM3 in Figure 7a and for the fly ash RFA in Figure 7b. These data have been marked ‘Rheol’. In both Figure 7a,b, we compare the rheological times of initial setting with those measured with the Vicat needle. Both methods show qualitatively the same results for both fly ashes. For UM3, there was a linear increase by a factor of two for the times of initial setting over the 60% range of materials exchange (Figure 7a). For RFA, there was a more than linear increase in the times of initial setting detected by both methods (Figure 7b). The increase from 0 to 60 wt.% materials exchange is only roughly a factor of three for the Vicat time of initial setting versus five in the rheological results. This is in qualitative agreement with work conducted on PC pastes [31,39]. The rheologically measured setting occurred earlier than that measured with the Vicat test. The falling 300 g Vicat needle would stop at a depth of 25 mm (indicating initial setting), if the shear stress of the paste reached 19 kPa [25], a value obviously higher than that reached at fluid-to-solid transitions measured rheologically. The depth of 25 mm and the mass of the needle are characteristics of a standardized test procedure, e.g., ASTM C191. Hence, only relative material properties can be measured. Rheometer measurements are absolute.
The more than linear increase in the times of initial setting detected by both methods (Figure 7b) suggests that the process of forming a continuous gel and thus reaching the fluid-to-solid transition may be increasingly delayed due to the slowing dissolution of the larger glass particles in RFA, a phenomenon less pronounced for the much smaller glass particles of UM3 fly ash (Figure 7a). The kinetics of fly ash glass dissolution have been studied in detail in [40].
For practical purposes, the simpler Vicat test is widely used to determine times of initial setting. Frequently, the initial slope of a Vicat curve is very steep, i.e., the paste stiffens almost suddenly and the time between pumpable and non-pumpable near initial setting can be unacceptably short. It is well known that rheological setting occurs faster that that measured by the Vicat test. Hence, knowledge of both rheological and Vicat setting in a given composition range as shown in Figure 7a,b provides sufficient information for how long a paste can be stirred, pumped, or poured. The range of time below and above the curve of rheological setting can be considered to be risk-free and risky, respectively, in terms of workability.
In terms of the practical significance of rheological data, naturally the absolute values depend on the process chosen, i.e., how the fresh paste is moved and poured into its final shape. Therefore, we discuss only the relative effects of composition changes and particle size. Because liquid low-level wastes usually occur in relatively high volumes or quantities compared with liquid high-level radioactive waste, the volume of the solidified waste is much larger than that of solidified high-level waste. To limit the materials cost of a geopolymer of a low-level radioactive waste form, we chose blast furnace slag as the primary ingredient with an admixture of only 25 wt.% of the more expensive metakaolin. Replacing fractions of the blast furnace slag with fly ash has little impact on cost. As we see, the impact of fly ash and its particle size on the rheological properties can be substantial. For example, the pressure needed to overcome the paste’s elasticity, i.e., the yield point if a batch is not constantly kept in motion, is strongly affected by the grain size of the fly ash. Figure 3b (RFA) shows that a freshly made paste with the coarser fly ash may stay at rest for an hour without a significant increase in the yield point. The effect of fine-grained fly ash is much less pronounced (Figure 3a). A similar effect of grain size can be seen on flowability (plastic viscosity) in Figure 2a,b.
4.3. Heat Flow, Cumulative Heat Release, and Times of Setting
Comparing Figure 4b and Figure 5b yields the following. The maximum specific heat flow and thus the maximum rate of geopolymerization in the system with two pozzolanic raw materials (Figure 5b, curve A) occurred after 40 min, 10 times earlier than for pure slag and about 20 times earlier than for pure MK (Figure 4b). These times are short for many practical applications because they indicate a short time of workability due to the early setting. The benefit of introducing a third component is obvious: the peak of the specific heat flow (Figure 5b) dropped as more RFA was introduced at the expense of slag (curves B5 to E5). The decreasing generation of heat indicates less formation of gel, and the increasing asymmetry of the decreasing heat peaks indicates slower formation of gel. The compressive strength decreases with increasing fly ash (Table 4). Since the compressive strength of the geopolymer with two pozzolans is high (120 MPa), the introduction of fly ash leaves sufficient flexibility to increase the set times and still produce geopolymers with relatively high compressive strengths (Table 4). After gelation, the polymer network continues to rearrange and reorganize as the connectivity of the network increases, which could explain the third heat flow peak at 23 h (Figure 4b) for MK.
Maximum heat flow data (Figure 5b) are compiled in Table 5. The decrease in the maxima in Column 2 shows that the heat flow generated with the binary pozzolans (A) is significantly reduced by adding RFA (B5 to E5). The cumulative heat release from the pozzolans up to initial setting (Vicat) is shown in Column 3. Times of initial setting (Vicat) are shown in Column 4. We found the values in Column 3 by reading the cumulative heat data for each initial set time from the respective curves in Figure 5a. As shown, the heat release is almost constant for all Vicat times of initial setting. If one accepts the premise that the cumulative heat release is a measure of the extent of the reaction, this result provides independent calorimetric confirmation that the observed setting time is a consequence of the reaction having produced a distinct amount of gel, independent of the composition of the mix of starting materials. This finding also suggests that the gel compositions cannot be too different from each other to produce the same amount of energy. We measured the heat release for 21 days (Figure 5c). Sample A in Figure 5c generated about 130 J/g after 21 days. We assume that this value is not too far away from the total heat release (the end of the geopolymerization). Taking 130 J/g and the value for A in Column 3, we estimate that setting occurs when about 10% of all chemical reactions (the extent of the reaction or the reaction progress) is complete. To find the total heat release (the completion of all reactions associated with the formation of a geopolymer), measurements must be continued beyond 21 days, which were not performed. Hence, the estimated 10% value above may be larger than the real value. It is clear from Figure 5c that the geopolymers containing RFA are farther away from the end of the reaction than geopolymer A with only two pozzolans.
The rheologically determined times of setting are shown in Column 6 of Table 5. The corresponding cumulative heat releases from Figure 5a are in Column 5. The times of setting are much shorter and the specific energies and thus the masses of gel needed to reach the liquid-to-solid transition are much smaller than the respective values for the Vicat test. The first rheological time of setting is only 21 min and is subject to some experimental uncertainty, which depends on how precisely the time of making the paste can be measured and how much time elapses between the end of mixing the paste and the beginning of heat measurements in the calorimeter. These uncertainties decrease with increasing times of setting. Therefore, we evaluate only the times of setting of samples B5 to E5 and suggest that these values can be considered constant with an average value of 6.6 J/g ± 10%. Hence, like with the Vicat time of setting, a certain composition-independent amount of gel is needed to reach the rheological initial time of setting. The maximum heat flow (Table 5, Column 2) is a measure of how fast the geopolymer gel is produced and should therefore be an indication, on a relative basis, of when to expect setting. Figure 8 shows the relationship between the maximum heat flow and initial setting determined by the Vicat needle test and for the rheologically measured time of setting. The reason that there are curves rather than straight lines may be the same as suggested in Section 4.2, i.e., the slowing dissolution of the glass particles in the RFA.
4.4. Heat of Reaction and Mechanical Strength
Benz et al. [41] analyzed material properties of over 200 PC mortars related to strength. They reported that predictions of mechanical strength can be made with an uncertainty of about ±10%. Attempts have been made as well to predict the strength of geopolymers [42]. Reports on the relationships between heat of reaction and compressive strength are still scarce. Frølich et al. [43] reported a strong correlation at 24 h between cement paste heat of hydration and compressive strength.
We found for our geopolymers that the maximum heat flow is linearly correlated with the cumulative heat release from 7 days to the longest measurement of 21 days. More importantly, the compressive strength after 14 to 28 days was linearly correlated with the maximum heat flow. The latter relationship is shown for RFA in Figure 9 for five geopolymers. The correlation factors of the trendlines range between 0.97 and >0.99. To support the linear relationship, we used Kumar et al.’s heat data [44] and obtained a linear correlation with r2 ≈ 0.98.
Though these correlations are not particularly surprising, the fact that the relationships are linear is of practical interest, e.g., when developing geopolymers with high strength [45]. Once the correlation has been established, a short-term heat flow measurement for a new recipe of similar composition would allow for an estimate of the 28-day compressive strength without measuring it.
The mechanical durability of the geopolymers depends on gel formation. We have shown the effect of the mass of a gel and its porosity in different fly ash glasses on mechanical durability [40]. A high yield of gel with a lot of porosity can yield a geopolymer with less compressive strength than a low yield of gel with low porosity. Here, we found that compressive strength decreases with decreasing slag concentration (Table 4). The formation of less gel from slag cannot be compensated for by the gel that forms from the dissolving fly ash glass. There is hardly any difference in compressive strength between the two fly ashes, even though more gel is formed by the smaller, faster-dissolving glass particles in UM3 than by the bigger ones in RFA. Since heat release is correlated with gel formation, we can look at Figure 4a. This figure shows that the highest amount of gel is formed from slag, and more is formed by UM3 than by RFA, comparing equal masses of the pozzolans. The micrographs in Figure 6 show that the porosity of the gel increases significantly when less gel is formed. This is obvious for both fly ashes when comparing B4 with E4 and B5 with E5. Hence, it is possible that the increasing porosity in the ‘4’ samples and in the ‘5’ samples suppressed a positive effect on compressive strength from UM3 versus RFA.
Calorimetric data are of practical interest for geopolymer waste forms because the hardening process, i.e., the evolution of the compressive strength, relies on the presence of water in the waste form in the early phases of geopolymerization, followed by slow and complete release later. High rates of heat generation, particularly in larger waste form units (blocks, etc.), increase the vaporization of water. The decomposition of organic constituents in the waste may occur due to an internal temperature rise. Limiting the centerline temperature may be a waste form acceptance criterion for a geopolymer as it is for glass as a medium for high-level radioactive waste. Additionally, as shown in Figure 9, heat flow measurements yield within hours information on the compressive strength to be expected in the long term, an advantage in the phase of waste form development.
4.5. Effects of Fly Ash Particle Size
The fly ash particle size affects all materials’ properties. The fly ash with the smaller average particle size (UM3) increased the plastic viscosity and the yield stress and decreased the rheological time of setting of the geopolymer paste, relative to the fly ash with the coarser particles (RFA). UM3 decreased the Vicat initial and final times of setting vis-à-vis RFA. The specific heat flow and the cumulative heat release were higher for UM3 at all times compared with those of RFA. As expected, UM3 produced the geopolymer with the higher compressive strength.
5. Conclusions
We prepared and investigated geopolymers primarily with three pozzolans as candidate waste forms for the immobilization of liquid low-activity radioactive waste, here Hanford secondary waste (HSW). The pozzolans were blast furnace slag, metakaolin, and fly ash. Two fly ashes with the same composition but different glass particle sizes were used. These are our findings:
- We showed quantitatively that using three instead of two pozzolans significantly widens the property space. This makes it easier to adapt the geopolymer’s composition, its workability (stirring, pumping, pouring), and the workable time to a given large-scale production process;
- Based on plastic viscosity measurements, we reported a rheological time of setting for geopolymers (initial time of setting);
- The rheological time of setting was always shorter than the Vicat initial times of setting;
- Knowledge of both rheological and Vicat setting for a given composition provides sufficient information for how long a paste can be stirred, pumped, or poured. The range of time below and above the rheological setting curve can be considered risk-free and risky, respectively, in terms of workability;
- The higher the maximum heat flow during geopolymerization, the shorter the Vicat- and rheological times of setting;
- The amounts of heat released at rheological and Vicat times of setting are different but independent of the chemical composition of the geopolymers, suggesting that the same mass of gel must always form to initiate setting;
- Cumulative heat release and compressive strength are linearly correlated with the maximum heat flow of the reaction. The confidence of these relationships is high (0.97 < R2 < 0.99). This finding was also seen when the respective literature data for geopolymers were correlated;
- Knowledge of heat generation during waste form development can help us avoid deleterious effects, e.g., excessive water loss during curing, particularly in larger geopolymer waste form units;
- Varying the fly ash particle size affects all materials’ properties significantly.
Supplementary Materials
The following supporting information can be downloaded at: https://www.mdpi.com/article/10.3390/min13080999/s1, Table S1: Composition of the Hanford Secondary Waste (HSW) simulant solution.
Author Contributions
Conceptualization, S.A., W.G. and W.L.; data curation, S.A.; formal analysis, S.A.; funding acquisition, I.L.P.; investigation, S.A.; project administration, I.L.P.; resources, W.G. and W.L.; supervision, W.L. and W.G.; validation, S.A.; visualization, S.A.; writing—original draft, S.A., W.G. and W.L.; writing—review & editing, S.A. and I.L.P. All authors have read and agreed to the published version of the manuscript.
Funding
This research was funded by the Vitreous State Laboratory (VSL) of the Catholic University of America (CUA).
Data Availability Statement
No data available.
Acknowledgments
The authors are grateful to Hui Xu for his help with the laboratory experiments, in particular with the operation of the rheometer. Financial support from the Vitreous State Laboratory (VSL) of the Catholic University of America (CUA) is gratefully acknowledged.
Conflicts of Interest
The authors declare no conflict of interest.
References
- Koťátková, J.; Zatloukal, J.; Reiterman, P.; Kolář, K. Concrete and cement composites used for radioactive waste. J. Environ. Radioact. 2017, 178–179, 147–155. [Google Scholar] [CrossRef] [PubMed]
- Abdel Rahman, R.O.; Ojovan, M.I. Toward Sustainable Cementitious Radioactive Waste Forms: Immobilization of Problematic Operational Wastes. Sustainability 2021, 13, 11992. [Google Scholar] [CrossRef]
- Staub, A.V.; Reigel, M.M. Development of a performance and processing property acceptance region for cementitious low-level waste forms at Savannah River Site. In Proceedings of the WM Conference, Phoenix, AZ, USA, 24–28 February 2013. [Google Scholar]
- Chung, C.W.; Chun, J.; Um, W.; Sundaram, S.K.; Westsik, J.H., Jr. Setting and stiffening of cementitious components in Cast Stone waste form for disposal of secondary wastes from Hanford waste treatment and immobilization plant. Cem. Conc. Res. 2013, 48, 14–22. [Google Scholar] [CrossRef]
- Lukens, W.W.; Bucher, J.J.; Shuh, D.K.; Edelstein, N.M. Evolution of Technetium Speciation in Reducing Grout. Environ. Sci. Technol. 2005, 39, 8064–8070. [Google Scholar] [CrossRef] [Green Version]
- Provis, J.L.; Van Deventer, J.S.J. Geopolymers: Structures, Processing, Properties and Industrial Applications; Woodhead Publishing series in Civil and Structural Engineering; Woodhead Publishing Limited: Oxford, UK; Cambridge, UK; New Delhi, India, 2009. [Google Scholar]
- Provis, J.L.; Van Deventer, J.S.J. Alkali Activated Materials; RILEM State-of-Art Reports, RILEM TC 224-AAM; Springer: Dordrecht, The Netherlands; Heidelberg, Germany; New York, NY, USA; London, UK, 2014. [Google Scholar]
- Rees, C.A.; Provis, J.L.; Lukey, G.C.; van Deventer, J.S.J. In Situ ATR-FTIR Study of the Early Stages Geopolymer Gel Formation. Langmuir 2007, 23, 9076–9082. [Google Scholar] [CrossRef]
- Duxson, P.; Fernández-Jiménez, A.; Provis, J.L.; Lukey, G.C.; Palomo, A.; van Deventer, J.S.J. Geopolymer technology: The current state of the art. J. Mater. Sci. 2007, 42, 2917–2933. [Google Scholar] [CrossRef]
- Provis, J.L. Geopolymers and other alkali activated materials: Why, how, and what? Mater. Struct. 2014, 47, 11–25. [Google Scholar] [CrossRef]
- Li, C.; Sun, H.; Li, L. A review: The comparison between alkali-activated slag (Si+Ca) and metakaolin (Si+Al) cements. J. Cem. Concr. Res. 2010, 40, 1341–1349. [Google Scholar] [CrossRef]
- Samson, G.; Cyr, M.; Gao, X.X. Formulation and characterization of blended alkali-activated materials based on flash-calcined metakaolin, fly ash and GGBS. J. Constr. Build. Mater. 2017, 144, 50–64. [Google Scholar] [CrossRef]
- Rashad, A.M. A comprehensive overview about the influence of different additives on the properties of alkali-activated slag—A guide for Civil Engineer. J. Constr. Build. Mater. 2013, 47, 29–55. [Google Scholar] [CrossRef]
- Gong, W.; Lutze, W.; Pegg, I.L. DuraLith Alkali-Aluminosilicate Geopolymer Waste Form Testing for Hanford Low Activity Waste and LAW Off-Gas Recycles; VSL-11R2360-1/PNNL-20565, PNL Report; Pacific Northwest National Laboratory: Richland, WA, USA, 2011. [Google Scholar]
- Lutze, W.; Gong, W.L.; Xu, H.; Pegg, I.L. A geopolymer waste form for technetium, iodine, and hazardous metals. ATW-Int. J. Nucl. Power 2020, 65, 8–9. [Google Scholar]
- Mattigod, S.V.; Westsik, J.H.; Chung, C.; Lindberg, M.J.; Parker, K.E. Waste Acceptance Testing of Secondary Waste Forms: Cast Stone, Ceramicrete and DuraLith; PNNL-20632; PNL Report; Pacific Northwest National Laboratory: Richland, WA, USA, 2011. [Google Scholar]
- Xu, H.; Gong, W.; Syltebo, L.; Lutze, W.; Pegg, I.L. Geopolymer waste form for Hanford secondary waste: Correlating setting behavior to hydration heat evolution. J. Hazard. Mater. 2014, 278, 34–39. [Google Scholar] [CrossRef] [PubMed]
- Josephson, G.B.; Westsik, J.H.; Pires, R.P.; Bickford, J.; Foote, M.W. Engineering-Scale Demonstration of DuraLith and Ceramicrete Waste Forms; PNNL-20751; PNL Report; Pacific Northwest National Laboratory: Richland, WA, USA, 2011. [Google Scholar]
- Crawford, G.; Martin, R. Portable and Modular Cementation Systems for Stabilization of Nuclear Wastes. In Proceedings of the WM2011 Conference, Phoenix, AZ, USA, 27 February–3 March 2011. [Google Scholar]
- Banfill, P.F.G. The Rheology of fresh cement and concrete: A review. In Proceedings of the 11th International Cement Chemistry Congress, Durban, South Africa, 11–16 May 2003; pp. 50–62. [Google Scholar]
- Bentz, D.P.; Ferraris, C.F.; Galler, M.A.; Hansen, A.S.; Guynn, J.M. Influence of particle size distributions on yield stress and viscosity of cement–fly ash pastes. J. Cem. Concr. Res. 2012, 42, 404–409. [Google Scholar] [CrossRef]
- Wallevik, J.E. Rheological properties of cement paste: Thixotropic behavior and structural breakdown. J. Cem. Concr. Res. 2009, 39, 14–29. [Google Scholar] [CrossRef]
- Bentz, D.P.; Ferraris, C.F. Rheology and setting of high volume fly ash mixtures. J. Cem. Concr. Compos. 2010, 32, 265–270. [Google Scholar] [CrossRef] [Green Version]
- Struble, J.L.; Lei, W.G. Rheological changes associated with setting of cement paste. J. Adv. Cem. Mater. 1995, 2, 224–230. [Google Scholar] [CrossRef]
- Sant, G.; Ferraris, C.F.; Weiss, J. Rheological properties of cement pastes: A discussion of structure formation and mechanical property development. J. Cem. Concr. Res. 2008, 38, 1286–1296. [Google Scholar] [CrossRef]
- Subramaniam, K.V.; Wang, X.J. An investigation of microstructure evolution in cement paste through setting using ultrasonic and rheological measurements. Cem. Concr. Res. 2010, 40, 33–44. [Google Scholar] [CrossRef]
- Criado, M.; Palomo, A.; Fernández-Jiménez, A.; Banfill, P.F.G. Alkali activated fly ash: Effect of admixtures on paste rheology. J. Rheol. Acta 2009, 48, 447–455. [Google Scholar] [CrossRef]
- Palacios, M.; Banfill, P.F.G.; Puertas, F. Rheology and setting of alkali-activated slag pastes and mortars: Effect of organic ad-mixture. J. ACI Mater. 2008, 105, 140–148. [Google Scholar]
- Kashani, A.; Provis, J.L.; Qiao, G.G.; van Deventer, J.S. The interrelationship between surface chemistry and rheology in alkali activated slag paste. J. Constr. Build. Mater. 2014, 65, 583–591. [Google Scholar] [CrossRef]
- Aboulayt, A.; Jaafri, R.; Samouh, H.; El Idrissi, A.C.; Roziere, E.; Moussa, R.; Loukili, A. Stability of a new geopolymer grout: Rheological and mechanical performances of metakaolin-fly ash binary mixtures. J. Constr. Build. Mater. 2018, 181, 420–436. [Google Scholar] [CrossRef]
- Arnoult, M.; Perronnet, M.; Autef, A.; Rossignol, S. How to control the geopolymer setting time with the alkaline silicate solution. J. Non-Cryst. Solids 2018, 495, 59–66. [Google Scholar] [CrossRef]
- Kashani, A.; Provis, J.L.; van Deventer, B.B.G.; Qiao, G.G.; van Deventer, J.S.J. Time-resolved yield stress measurement of evolving materials using a creeping sphere. J. Rheol. Acta 2015, 54, 365–376. [Google Scholar] [CrossRef] [Green Version]
- Esteves, L.P.; Cachim, P.; Ferreira, V.M. Effect of fine aggregate on the rheology properties of high performance cement-silica system. J. Constr. Build. Mater. 2010, 24, 640–649. [Google Scholar] [CrossRef]
- Hu, J.; Ge, Z.; Wang, K. Influence of cement fineness and water-to-cement ratio on mortar early-age heat of hydration and set times. J. Constr. Build. Mater. 2014, 50, 657–663. [Google Scholar] [CrossRef]
- Jimenez, A.M.F.; Puertas, F.; Arteaga, A. Determination of Kinetic Equations of Alkaline Activation of Blast Furnace Slag by Means of Calorimetric Data. J. Therm. Anal. Calorim. 1998, 52, 945–955. [Google Scholar] [CrossRef]
- Zhang, Z.H.; Provis, J.L.; Wang, H.; Bullen, F.; Reid, A. Quantitative kinetic and structural analysis of geopolymers. Part 2. Thermodynamics of sodium silicate activation of metakaolin. Thermochim. Acta 2013, 565, 163–171. [Google Scholar] [CrossRef]
- Grzeszczyk, S.; Lipowski, G. Effect of content and particle size distribution of high-calcium fly ash on the rheological properties of cement pastes. J. Cem. Concr. Res. 1997, 27, 907–916. [Google Scholar] [CrossRef]
- Amziane, S.; Ferraris, C.F. Cementation paste setting using rheological and pressure measurements. J. ACI Mater. 2007, 104, 137–145. [Google Scholar]
- Sant, G.; Dehadrai, M.; Bentz, D.; Lura, P.; Ferraris, C.F.; Bullard, J.W.; Weiss, W. Detecting the fluid-to-solid transition in cement pastes. Concr. Int. 2009, 31, 53–58. [Google Scholar]
- Gong, W.; Fauvin, M.; Lutze, W.; Akhbarifar, S.; Pegg, I.L. Dissolution and geopolymerization of synthetic fly ash glass. J. Mater. Sci. 2022, 57, 14848–14860. [Google Scholar] [CrossRef]
- Bentz, D.P.; Barrett, T.; De la Varga, I.; Weiss, W. Relating Compressive Strength to Heat Release in Mortars. Adv. Civ. Eng. Mater. 2012, 1, 14. [Google Scholar] [CrossRef] [Green Version]
- Aughenbaugh, K.L.; Williamson, T.; Juenger, M.C.G. Critical evaluation of strength prediction methods for alkali-activated fly ash. J. Mater. Struct. 2015, 48, 607–620. [Google Scholar] [CrossRef] [Green Version]
- Frølich, L.; Wadsö, L.; Sandberg, P. Using isothermal calorimetry to predict one day mortar strengths. J. Cem. Concr. Res. 2016, 88, 108–113. [Google Scholar] [CrossRef]
- Kumar, S.; Kumar, R.; Mehrotra, S.P. Influence of granulated blast furnace slag on the reaction, structure and properties of fly ash based geopolymer. J. Mater. Sci. 2010, 45, 607–615. [Google Scholar] [CrossRef]
- Gong, W.L.; Lutze, W.; Pegg, I.L. Geopolymer Composite for Ultra-High-Performance Concrete Applications. U.S. Patent 909050, 28 July 2015. [Google Scholar]
Figure 1.
Mixtures of pozzolanic starting materials. Letters A–E indicate geopolymer compoisitions and the arrow points to the direction with increasing slag replacement by fly ash.
Figure 1.
Mixtures of pozzolanic starting materials. Letters A–E indicate geopolymer compoisitions and the arrow points to the direction with increasing slag replacement by fly ash.
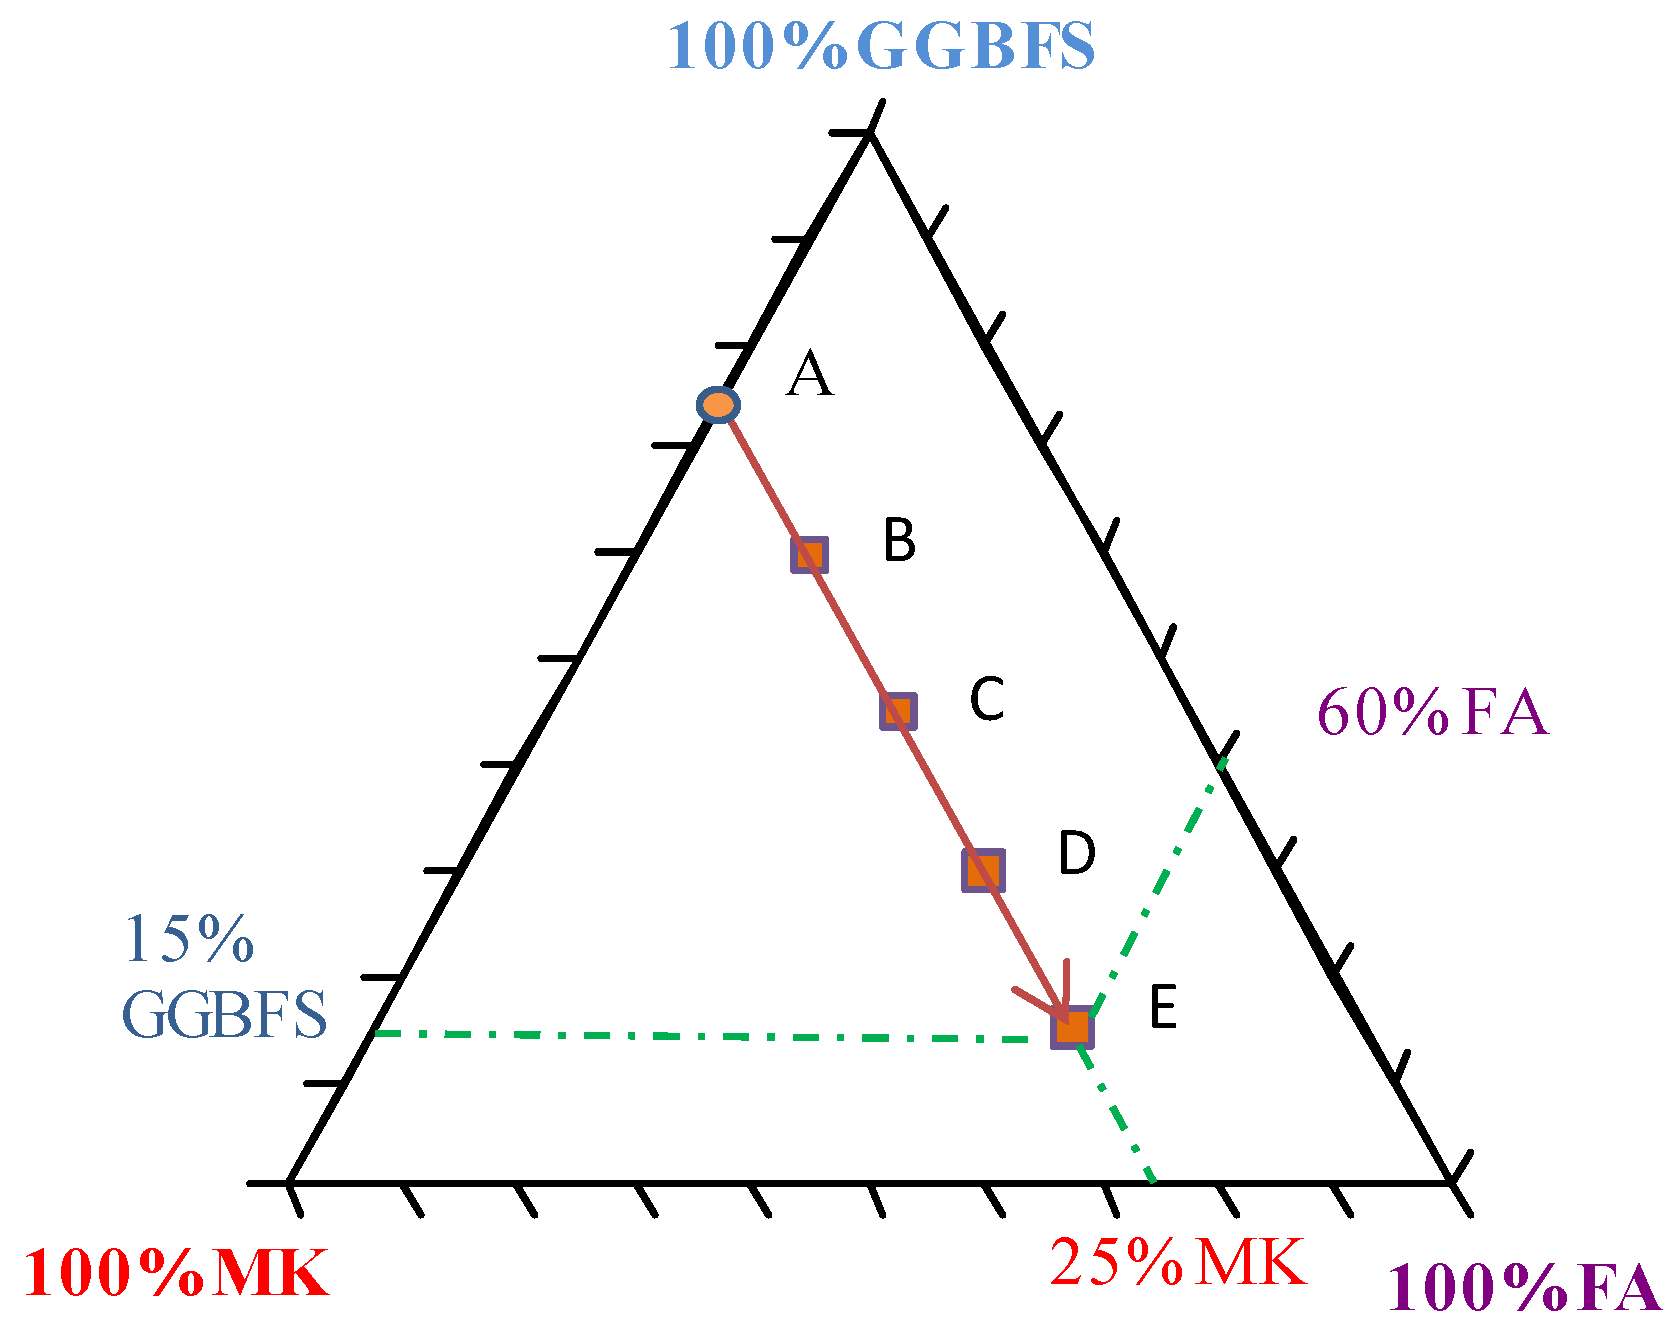
Figure 2.
Change in ‘hp’ with the age of pastes and percentages (0–60 wt.%) of (a) UM3 and (b) RFA. Two rheological processes indicated by striangth line control the fresh grout sequentially. The crossing point is the rheological set time (Point B) (See Section 4.1).
Figure 2.
Change in ‘hp’ with the age of pastes and percentages (0–60 wt.%) of (a) UM3 and (b) RFA. Two rheological processes indicated by striangth line control the fresh grout sequentially. The crossing point is the rheological set time (Point B) (See Section 4.1).
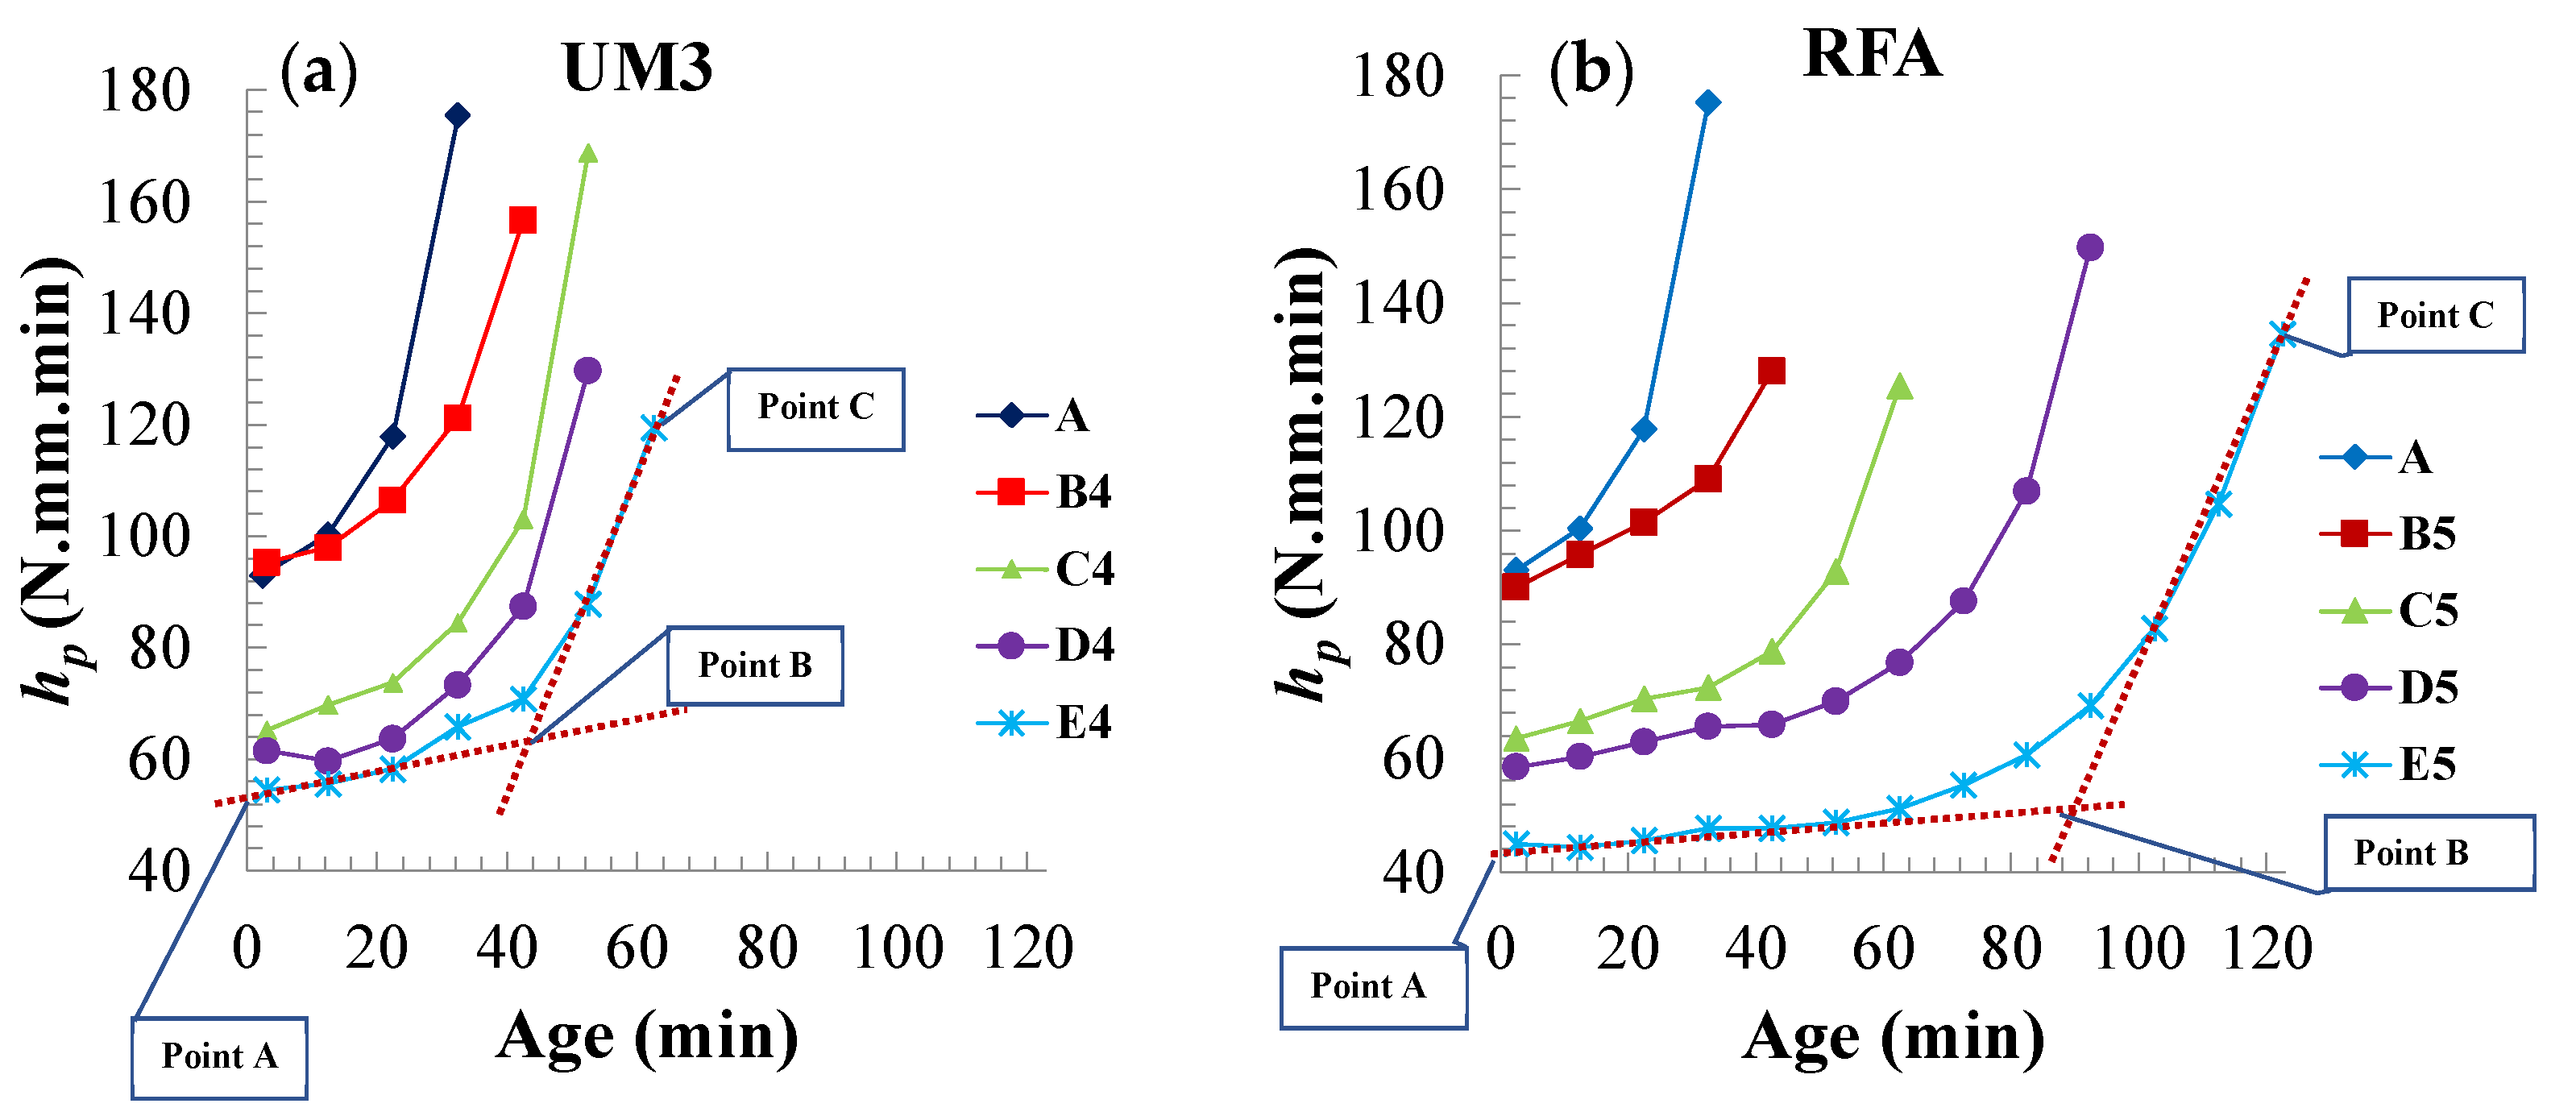
Figure 3.
Change in ‘g’ with the age of pastes and percentages (0–60 wt.%) of (a) UM3 and (b) RFA. Two rheological processes indicated by striangth line control the fresh grout sequentially. The crossing point is the rheological set time (Point B) (See Section 4.1).
Figure 3.
Change in ‘g’ with the age of pastes and percentages (0–60 wt.%) of (a) UM3 and (b) RFA. Two rheological processes indicated by striangth line control the fresh grout sequentially. The crossing point is the rheological set time (Point B) (See Section 4.1).
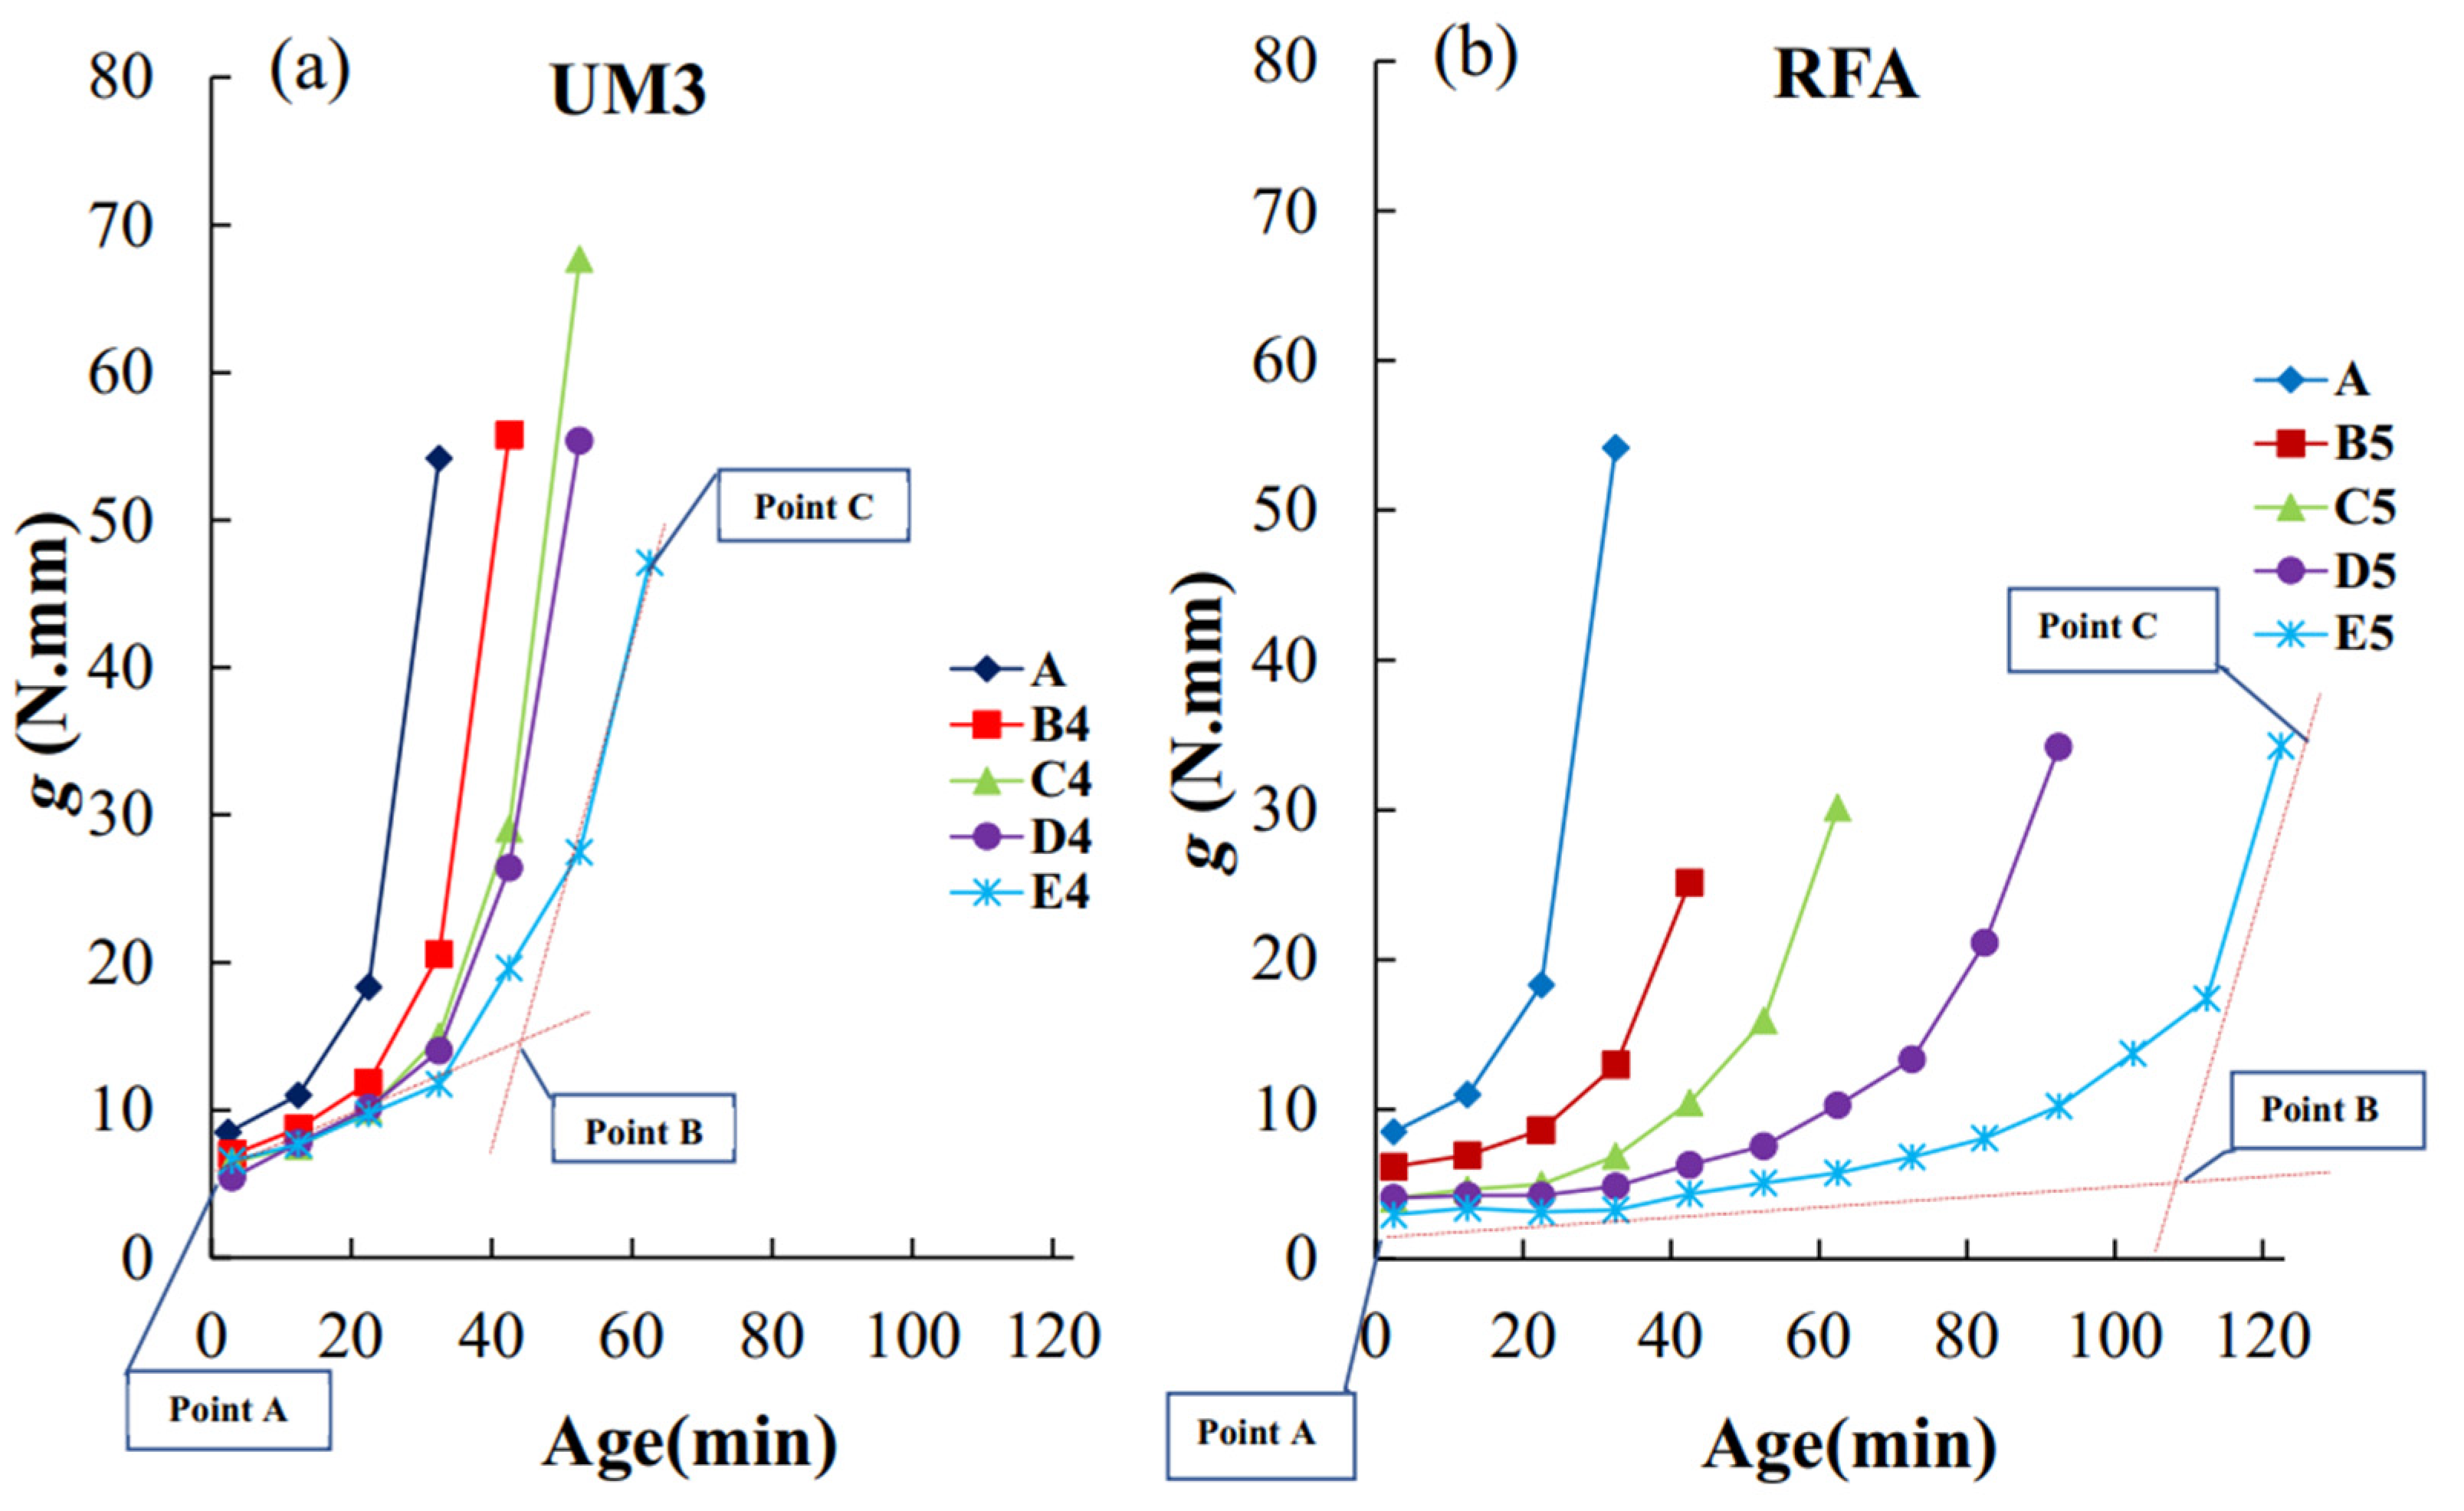
Figure 4.
Cumulative heat release (a) and specific heat flow (b) during the formation of geopolymers made with only one pozzolan.
Figure 4.
Cumulative heat release (a) and specific heat flow (b) during the formation of geopolymers made with only one pozzolan.
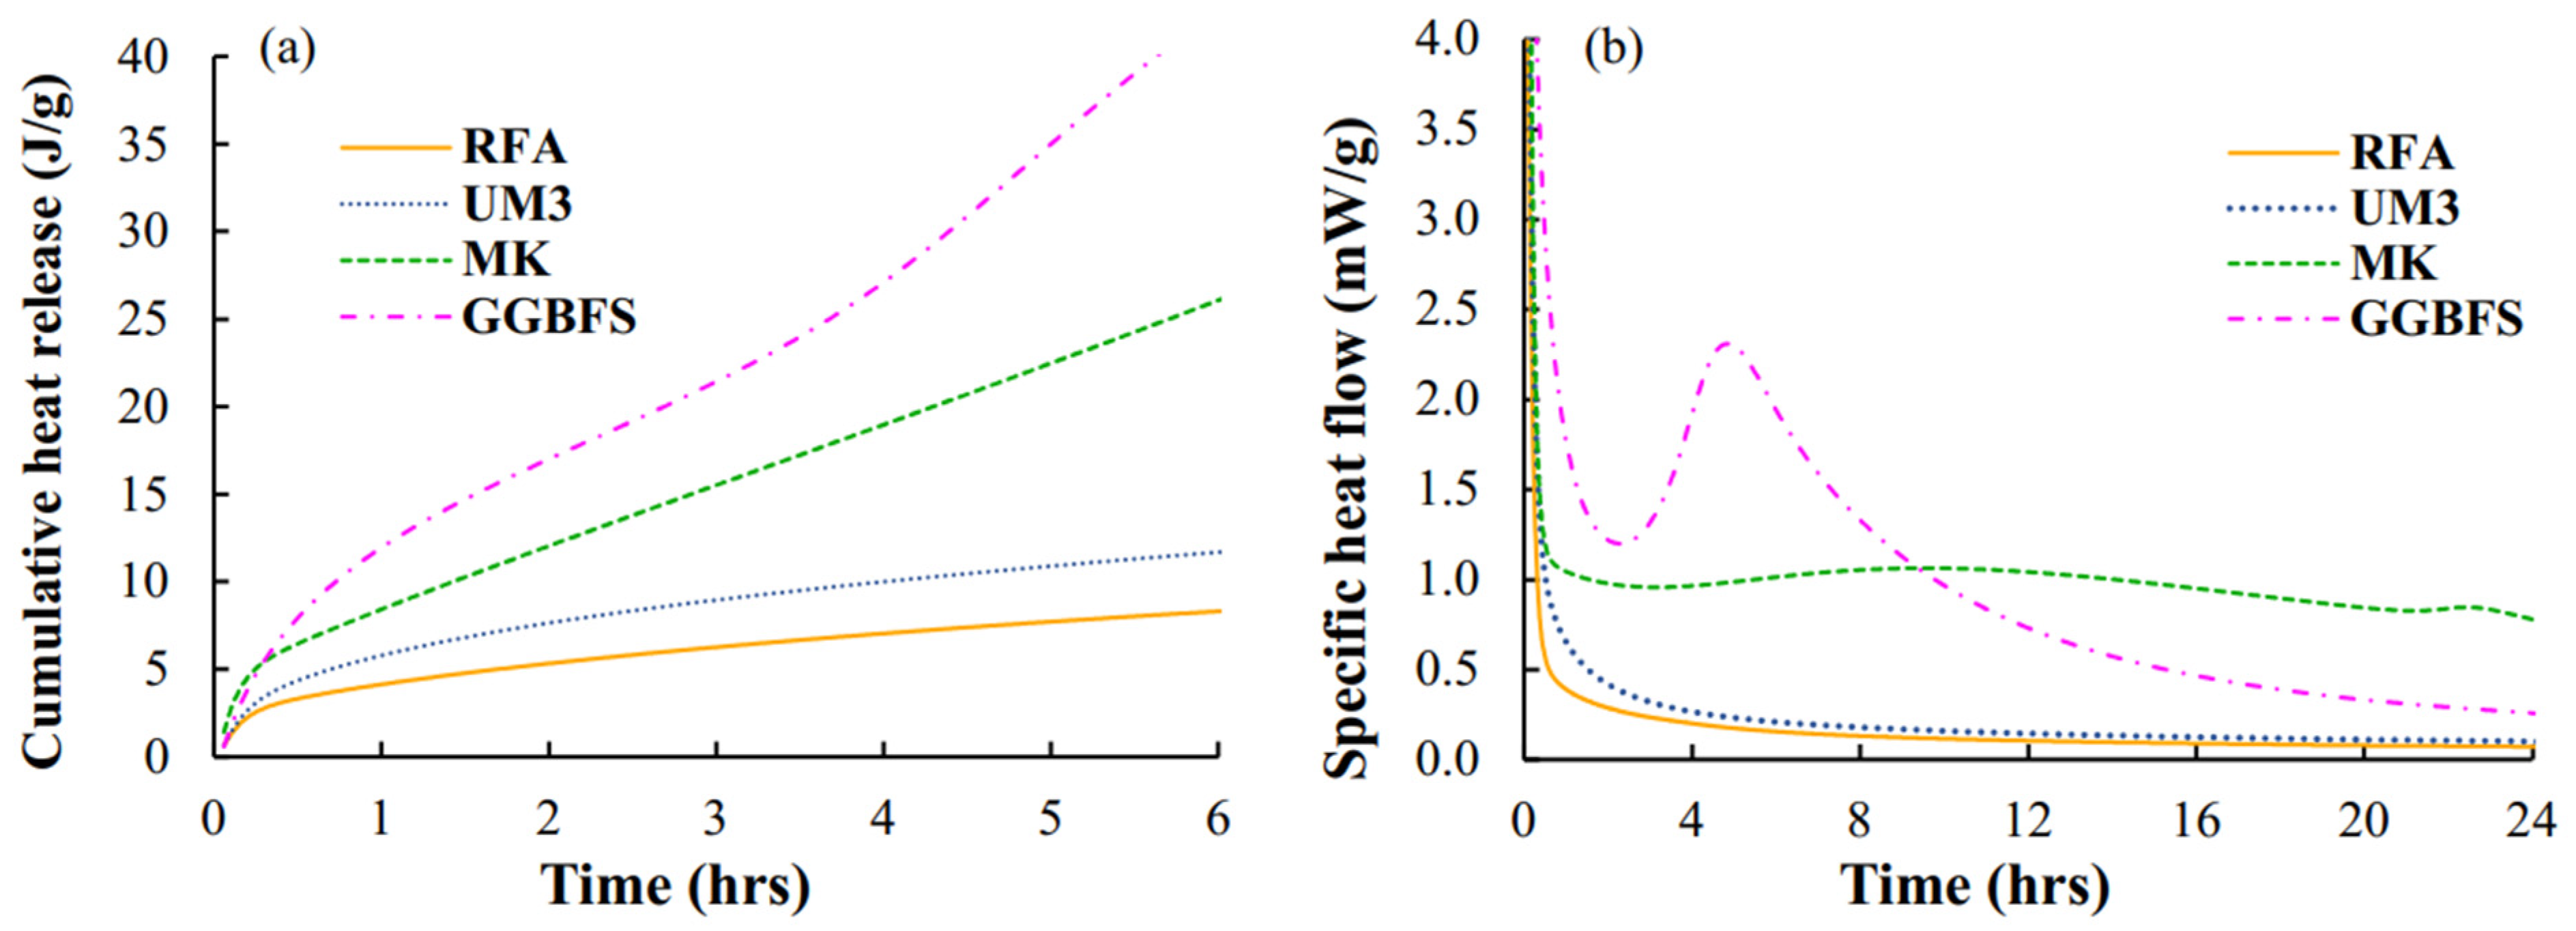
Figure 5.
(a) Cumulative heat release, (b) specific heat flow (0–60 wt.% GGBFS replaced by RFA), (c) cumulative heat release over 21 days.
Figure 5.
(a) Cumulative heat release, (b) specific heat flow (0–60 wt.% GGBFS replaced by RFA), (c) cumulative heat release over 21 days.
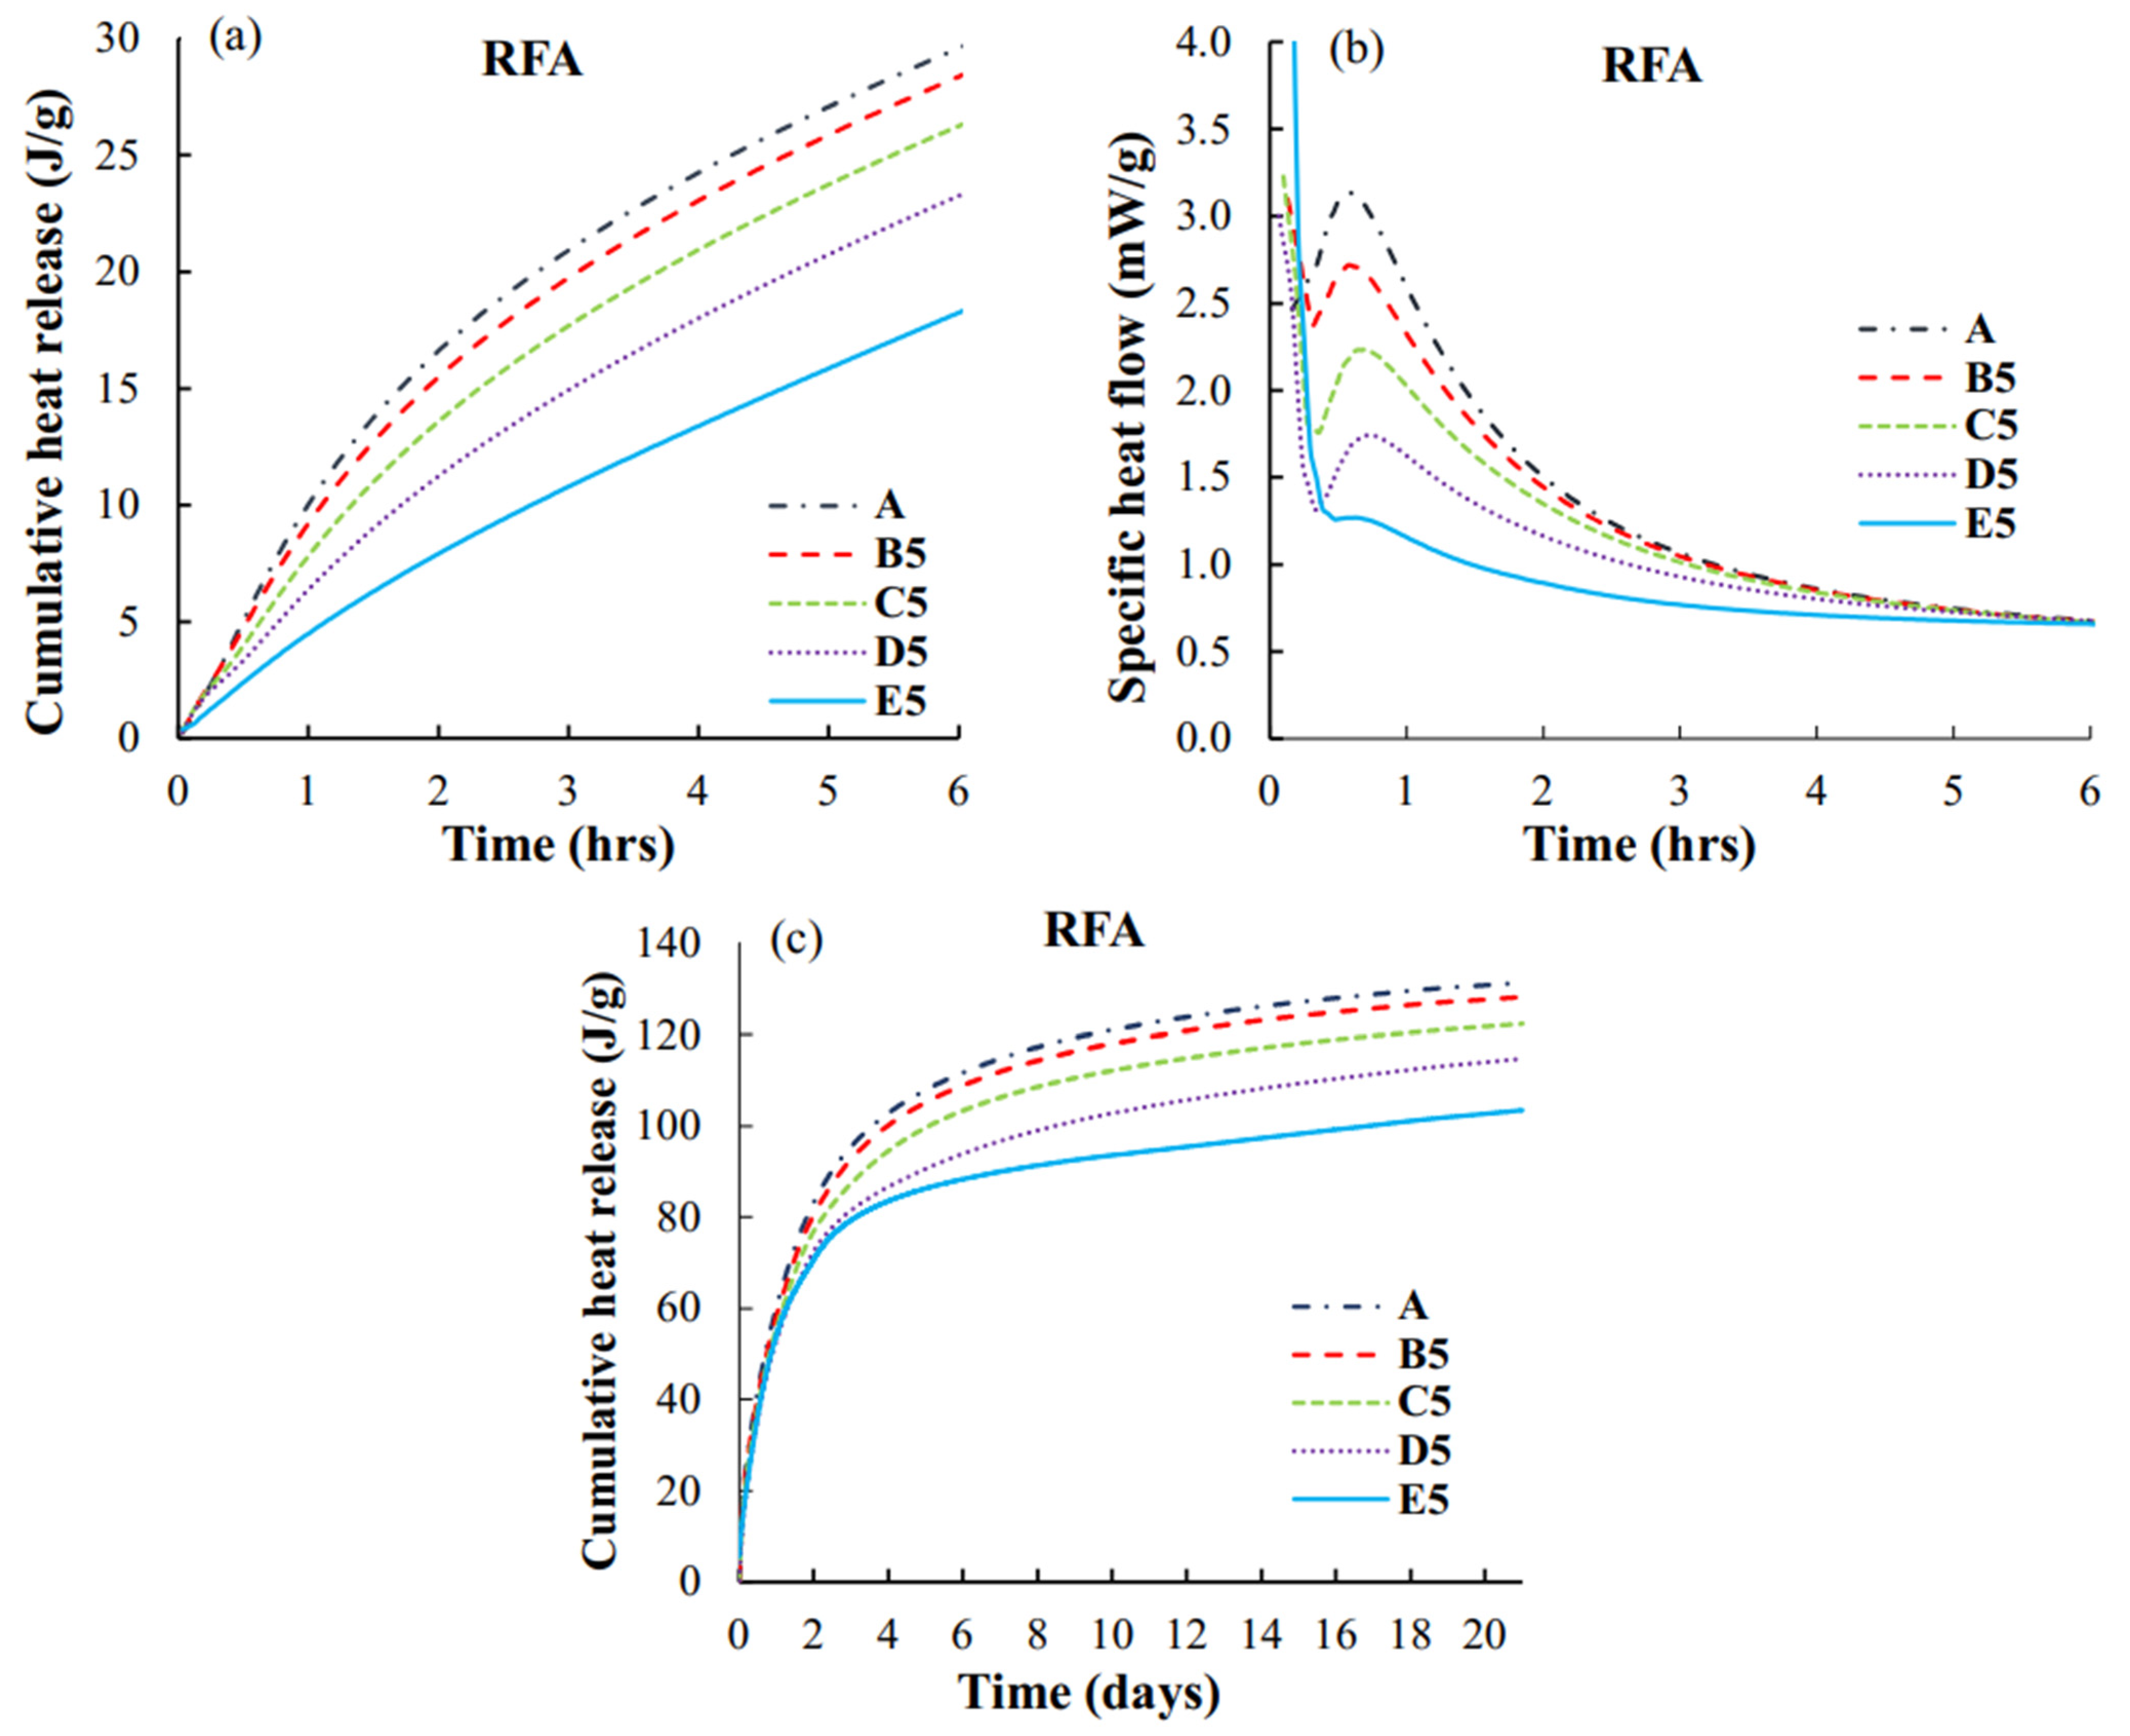
Figure 6.
Backscatter images of four geopolymers made from three pozzolans (samples B4, E4, B5, and E5, cured for 28 days, scale bar is 100 µm).
Figure 6.
Backscatter images of four geopolymers made from three pozzolans (samples B4, E4, B5, and E5, cured for 28 days, scale bar is 100 µm).
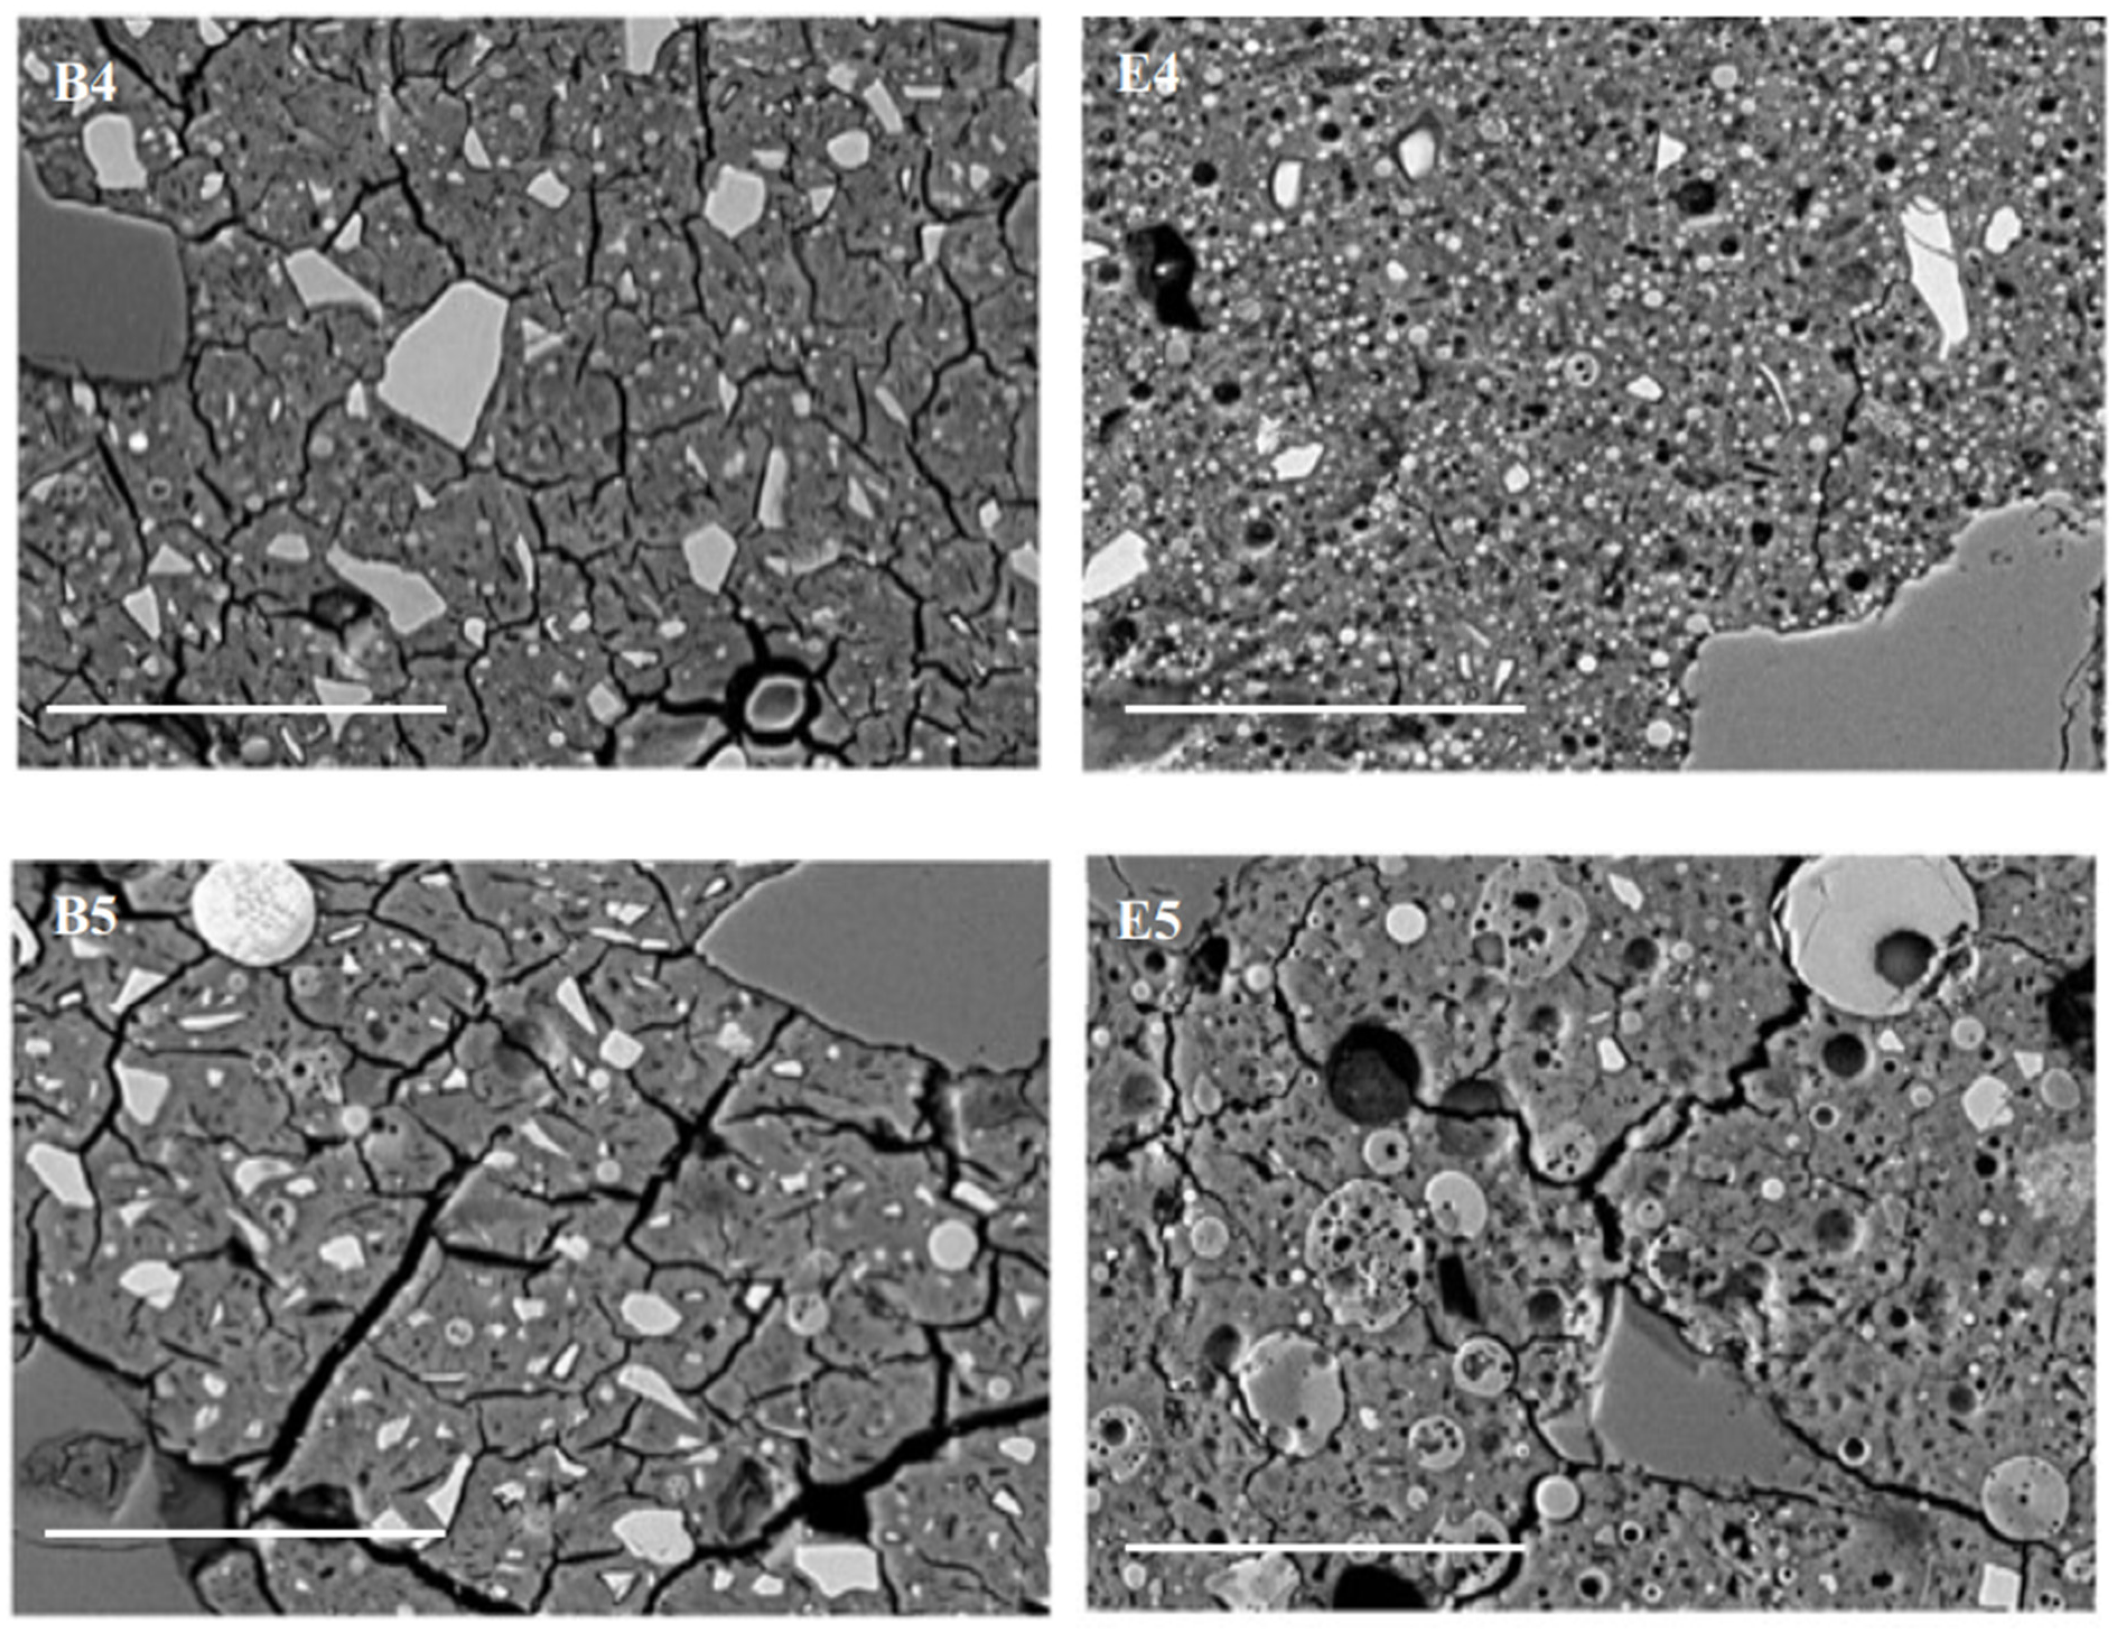
Figure 7.
Rheological and Vicat times of setting for geopolymers with three pozzolans. (a) GGBFS-MK-UM3, (b) GGBFS-MK-RFA.
Figure 7.
Rheological and Vicat times of setting for geopolymers with three pozzolans. (a) GGBFS-MK-UM3, (b) GGBFS-MK-RFA.
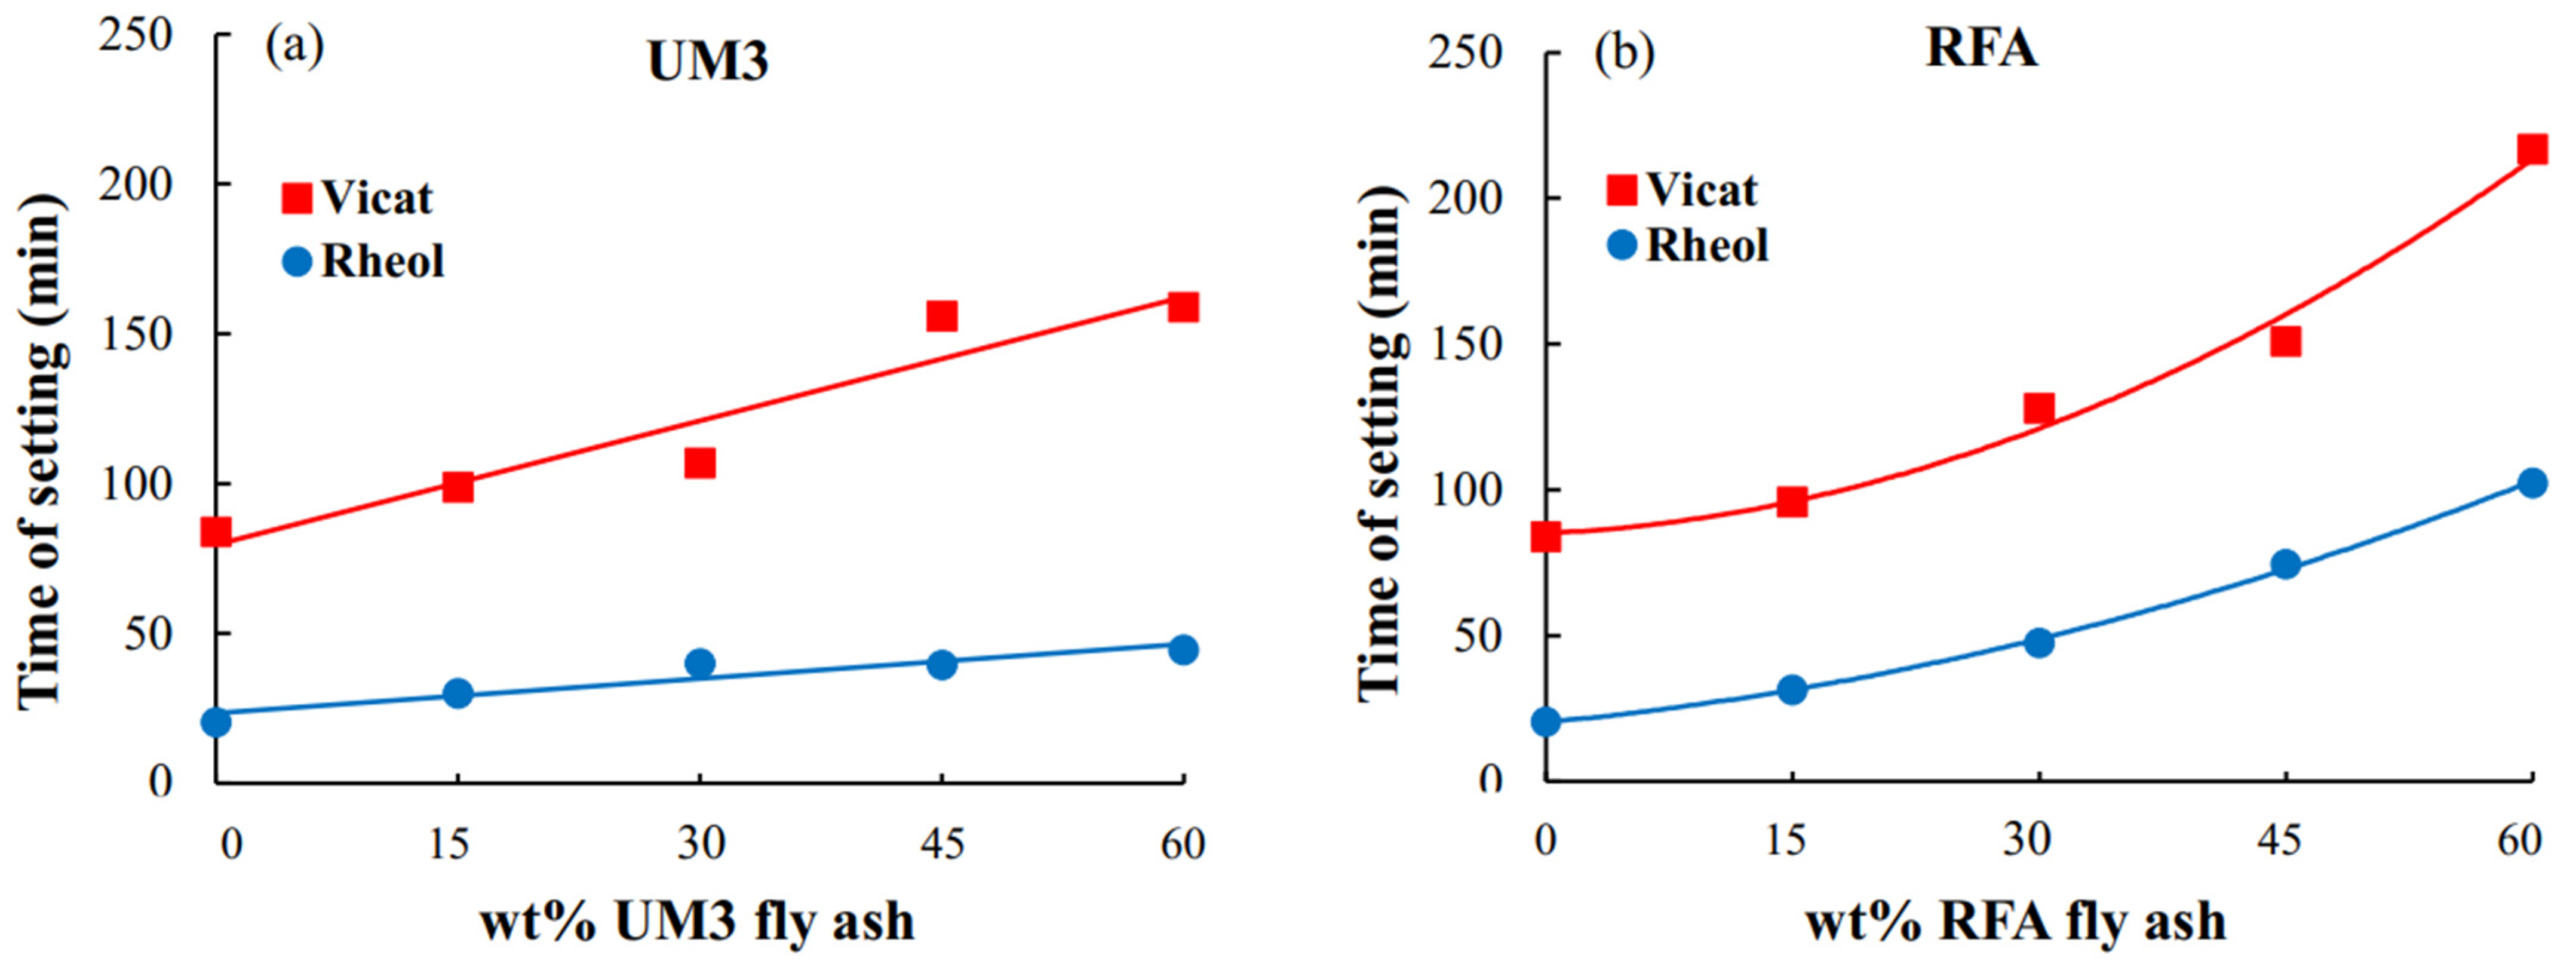
Figure 8.
Rheological and Vicat times of setting for RFA vs. maximum heat flow.
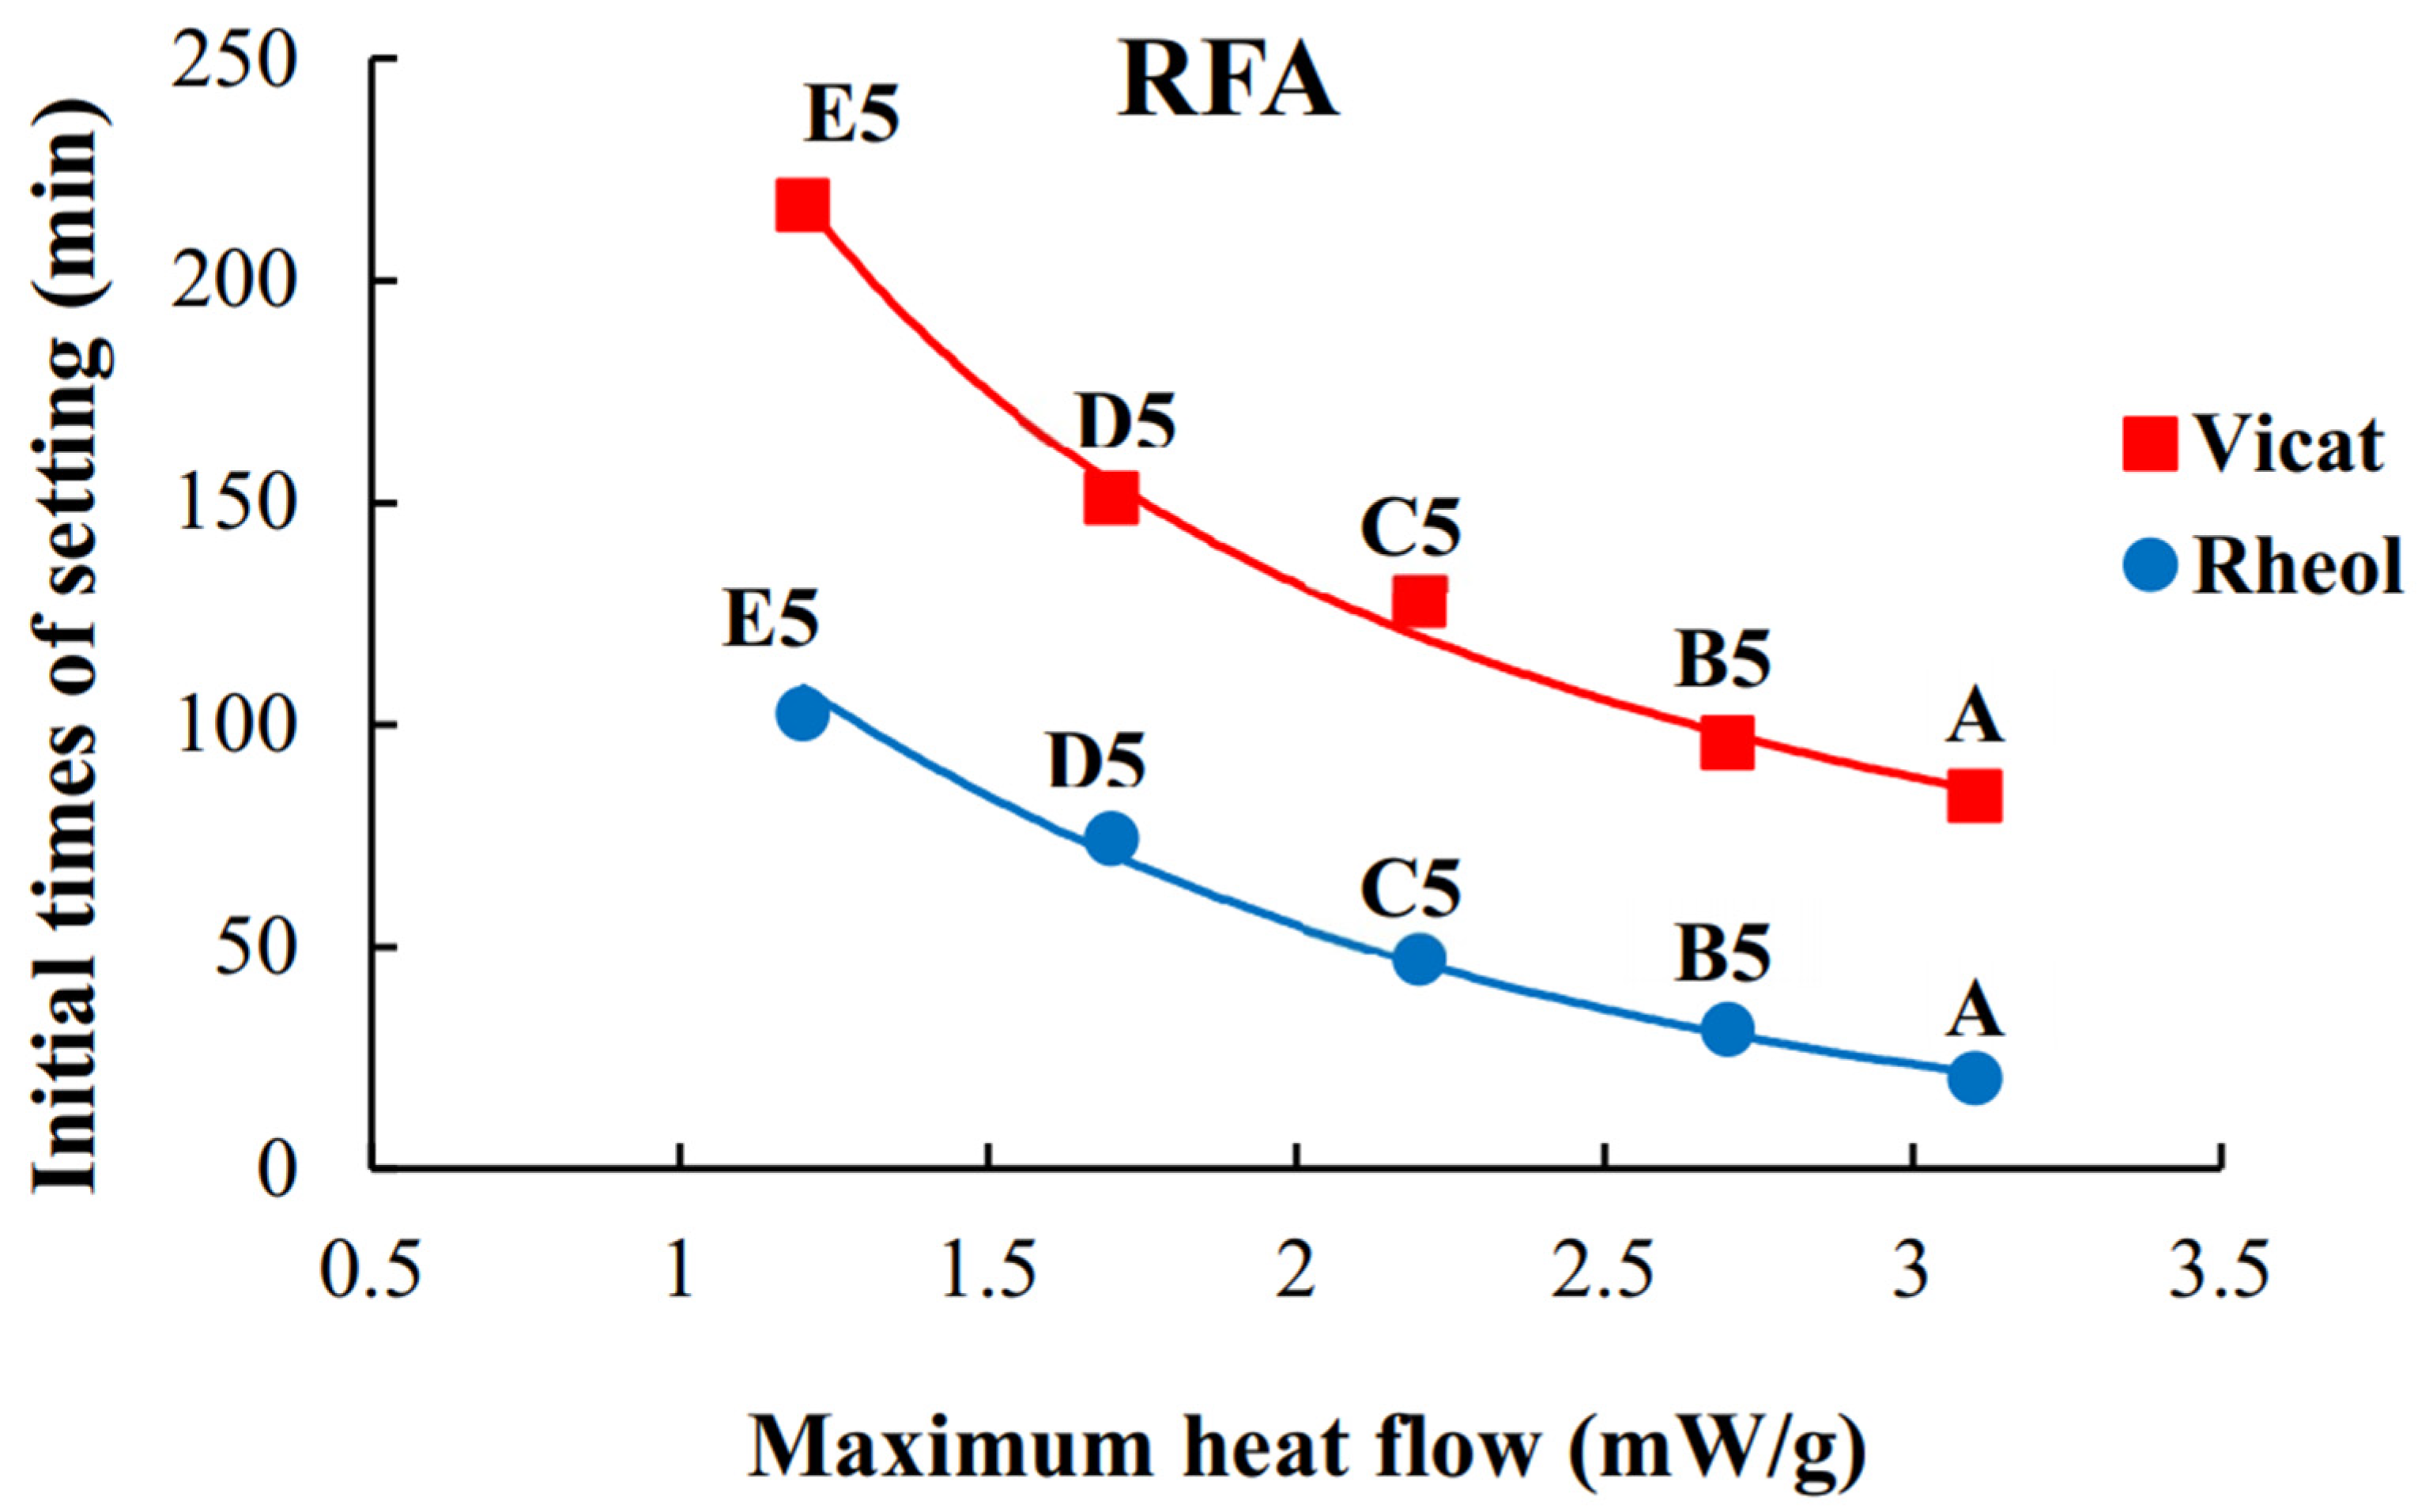
Figure 9.
Dependence of compressive strength on maximum heat flow (five geopolymers).


Table 1.
Recipe for 1000 g of activator solution.
| Chemicals | Mass (g) |
|---|---|
| HSW simulant 6 M Na | 666 |
| Solid KOH (91%) | 143 |
| Solid NaOH (99%) | 12 |
| Silica fume (96%) | 179 |
Table 2.
Recipe for 1 kg of geopolymer sample (masses in grams).
| %FA | FA | Slag | MK | Sand | SF | Activator | Total | |
|---|---|---|---|---|---|---|---|---|
| A | 0 | 0 | 296 | 103 | 189 | 10 | 402 | 1000 |
| B | 15 | 59 | 237 | 103 | 189 | 10 | 402 | 1000 |
| C | 30 | 118 | 178 | 103 | 189 | 10 | 402 | 1000 |
| D | 45 | 178 | 118 | 103 | 189 | 10 | 402 | 1000 |
| E | 60 | 237 | 59 | 103 | 189 | 10 | 402 | 1000 |
Table 3.
Vicat times of setting of geopolymers with one, two, and three pozzolans.
| Raw Materials | Sample ID | Initial Setting (min) | Final Setting (min) |
|---|---|---|---|
| One | GGBFS | 151 | 186 |
| MK | 513 | 780 | |
| UM3 | 207 | 318 | |
| RFA | 1645 | >1980 | |
| Two (GGBFS + MK) | A * | 84 | 177 |
| Three (GGBFS + MK + UM3) | B4 * | 99 | 180 |
| C4 | 107 | 186 | |
| D4 | 156 | 219 | |
| E4 | 159 | 240 | |
| Three (GGBFS + MK + RFA) | B5 * | 96 | 187 |
| C5 | 128 | 211 | |
| D5 | 151 | 240 | |
| E5 | 217 | 285 |
* Note: Letters are explained in Figure 1. (4) is UM3 and (5) is RFA.
Table 4.
Compressive strength results for geopolymers with two and three pozzolans.
| Time (Days) | Compressive Strength (MPa) | ||||||||
|---|---|---|---|---|---|---|---|---|---|
| A * | UM3 | RFA | |||||||
| B4 | C4 | D4 | E4 | B5 | C5 | D5 | E5 | ||
| 1 | 33 | 23 | 18 | 16 | 14 | 30 | 20 | 14 | 14 |
| 3 | 65 | 49 | 39 | 33 | 25 | 43 | 37 | 29 | 27 |
| 7 | 78 | 76 | 57 | 38 | 35 | 75 | 60 | 43 | 33 |
| 14 | 100 | 93 | 79 | 52 | 43 | 93 | 72 | 55 | 37 |
| 21 | 111 | 105 | 82 | 60 | 53 | 103 | 80 | 64 | 40 |
| 28 | 120 | 107 | 88 | 64 | 56 | 112 | 103 | 72 | 43 |
* 75% GGBFS + 25% MK.
Table 5.
Heat and set time data of geopolymer pastes with two and three pozzolans (fly ash is RFA).
| Sample ID | Maximum Heat Flow (mW/g) | Cumulative Heat at Vicat Initial Setting (J/g) | Vicat Initial Time of Setting (min) | Cumulative Heat at Rheological Time of Setting (J/g) | Rheological Time of Setting (min) |
|---|---|---|---|---|---|
| A | 3.1 | 12.1 | 84 | 4.7 | 21 |
| B5 | 2.7 | 12.7 | 96 | 6.0 | 32 |
| C5 | 2.2 | 13.0 | 128 | 6.0 | 48 |
| D5 | 1.7 | 12.0 | 151 | 7.1 | 75 |
| E5 | 1.2 | 12.6 | 217 | 7.2 | 103 |
Disclaimer/Publisher’s Note: The statements, opinions and data contained in all publications are solely those of the individual author(s) and contributor(s) and not of MDPI and/or the editor(s). MDPI and/or the editor(s) disclaim responsibility for any injury to people or property resulting from any ideas, methods, instructions or products referred to in the content. |
© 2023 by the authors. Licensee MDPI, Basel, Switzerland. This article is an open access article distributed under the terms and conditions of the Creative Commons Attribution (CC BY) license (https://creativecommons.org/licenses/by/4.0/).
Share and Cite
MDPI and ACS Style
Akhbarifar, S.; Gong, W.; Lutze, W.; Pegg, I.L. Rheology, Setting, Heat of Reaction, and Compressive Strength of a Geopolymer Radioactive Waste Form. Minerals 2023, 13, 999. https://doi.org/10.3390/min13080999
AMA Style
Akhbarifar S, Gong W, Lutze W, Pegg IL. Rheology, Setting, Heat of Reaction, and Compressive Strength of a Geopolymer Radioactive Waste Form. Minerals. 2023; 13(8):999. https://doi.org/10.3390/min13080999
Chicago/Turabian StyleAkhbarifar, Sepideh, Weiliang Gong, Werner Lutze, and Ian L. Pegg. 2023. "Rheology, Setting, Heat of Reaction, and Compressive Strength of a Geopolymer Radioactive Waste Form" Minerals 13, no. 8: 999. https://doi.org/10.3390/min13080999
Note that from the first issue of 2016, this journal uses article numbers instead of page numbers. See further details here.