
Metallogenic Prediction of the Zaozigou Gold Deposit Using 3D Geological and Geochemical Modeling
by
Cheng Li
1,2,
Bingli Liu
2,3,*,
Keyan Xiao
1,
Yunhui Kong
2,
Lu Wang
2,
Rui Tang
2,
Miao Xie
2 and
Yixiao Wu
2 1
SinoProbe Laboratory, Institute of Mineral Resources, Chinese Academy of Geological Sciences, Beijing 100037, China
2
Geomathematics Key Laboratory of Sichuan Province, Chengdu University of Technology, Chengdu 610059, China
3
UNESCO International Center on Global-Scale Geochemistry, Langfang 065000, China
*
Author to whom correspondence should be addressed.
Minerals 2023, 13(9), 1205; https://doi.org/10.3390/min13091205
Submission received: 17 August 2023
/
Revised: 8 September 2023
/
Accepted: 11 September 2023
/
Published: 13 September 2023
(This article belongs to the Special Issue Advances in 3D Geological Modeling and Metallogenic Prediction)
Abstract
:Deep-seated mineralization prediction is an important scientific problem in the area of mineral resources exploration. The 3D metallogenic information extraction of geology and geochemistry can be of great help. This study uses 3D modeling technology to intuitively depict the spatial distribution of orebodies, fractures, and intrusive rocks. In particular, the geochemical models of 12 elements are established for geochemical metallogenic information extraction. Subsequently, the front halo element association of As-Sb-Hg, the near-ore halo element association of Au-Ag-Cu-Pb-Zn, and the tail halo element association of W-Mo-Bi are identified. Upon this foundation, the 3D convolutional neural network model is built and used for deep-seated mineralization prediction, which expresses a high performance (AUC = 0.99). Associated with the metallogenic regularity, two mineral exploration targets are delineated, which might be able to serve as beneficial achievements for deep exploration in the Zaozigou gold deposit.
1. Introduction
Deep exploration is an important research direction of mineral resource prediction, which requires continuous innovation in theoretical and methodological approaches, elaborate 3D modeling of the complicated geological and geochemical mass, and the technological support of modern statistical methods, such as artificial intelligence, to extract deeper information and inference.
The current the mainstream method for deep-earth resource prediction is 3D-modeling-based quantitative mineral prediction at depth, and its key technologies are: (i) the 3D visual representation of metallogenic geological mass, metallogenic structural zone of contact, and geochemistry [1,2,3,4]; (ii) 3D mineralization information extraction based on spatial analysis technology [5,6,7,8,9,10]; and (iii) studies on the distribution and prediction of mineralization based on data analysis methods [11,12,13,14,15,16,17,18,19,20,21]. Three-dimensional quantitative mineral resource prediction is gaining growing significance in the exploration of deep mineral resources. As 3D models become more refined and methods for extracting mineralization information continue to evolve and deepen, the scientific rigor and practical utility of mineral resource prediction are poised for significant enhancement.
The basis of 3D Mineral Prospectivity Mapping is driven by a 3D geological model, and, therefore, 3D geological modeling has become an important part of 3D metallogenic prediction. The relevant approach is to integrate geological information, such as topography, geological mapping, drill core logging, geological section, and geophysical inversion results, to improve the characterization of a complex geological mass in 3D space. Simon W. Houlding first proposed 3D geological modeling [1] and raised the theory of 3D geological modeling in conjunction with geological modeling systems, including the establishment of spatial databases, spatial data models and data structures, and the 3D representation of geological mass. The 3D geological modeling approach is mostly built based on the modeling of drill data, the exploration profiles and tunnels, etc. It is mainly applied to the high-precision geometric modeling of rock masses, faults, and orebodies at the ore deposit scale, and the key is controlling the modeling accuracy for meeting the elaborate requirement of 3D visualization of complicated geological masses and structures [6,22,23,24,25,26,27,28].
Primary geochemical halo identification is a common geochemical approach for detecting orebodies near or below the ground surface [29]. A primary geochemical halo is an area of rocks surrounding orebodies enriched in ore-forming elements [30]. Primary geochemical characteristics of mineral deposits provide important information for predicting deep mineral resources, as they reflect the geochemical processes of metal precipitation and mineral formation. Many methods have been used to identify the primary halo characteristics of mineral deposits, including vertical element zonation [31,32,33], element ratios vectoring toward ore zones [34,35,36], Pearce element ratios [29,37,38,39,40], and alteration indices [41,42,43,44,45,46,47,48,49]. A major aspect of these methods is the determination of the spatial distributions of single elements and/or element associations.
The practice of geochemical surveys has shown that primary halo or geochemical rock surveys are one of the most effective methods for inferring the depth of erosion of ore deposits, determining the occurrence of orebodies, searching for hidden orebodies, and making predictions for mineralization [50,51,52,53,54]. Geochemical anomalies in the primary halo are an important indicator of the presence of potential orebodies at depth, and many case studies have shown the presence of primary haloes dominated by ore-forming elements around orebodies of gold, silver, copper, lead, and zinc, especially hydrothermal deposits, where a wide range of primary geochemical anomalies are developed [53,55].
Convolutional Neural Network (CNN), as the most successful neural network model applied in deep learning, has been successfully applied in the field of geology, such as in lithology recognition [56], geological mapping [57], and three-dimensional geological structure inversion [58]. In recent years, many scholars have also achieved good results in applying convolutional neural networks to mineral exploration and prediction research [59,60,61,62].
Based on the above analysis, this study addresses the scientific problem of “3D elaborate modeling of mineralization space”, takes the Zaozigou gold deposit in the West Qinling Mountains as the study area, builds geological and geochemical models using the deep learning algorithms of 3D convolutional neural network, and predicts two exploration targets at depth.
2. Geological Setting
2.1. Regional Geological Background
The West Qinling region is situated in the western part of the Qinling orogenic belt. It is bordered by the Qilian orogenic belt to the north, the Qaidam massif to the west, and the Songpan-Garze terrane to the south (Figure 1a). Its geological evolution is closely intertwined with the history of the Tethys tectonic domain and the convergence of the Yangtze Massif and the North China Plate [63,64,65,66,67].
The geotectonic position of the Xiahe-Hezuo area is in the northwestern part of the West Qinling orogenic belt and represents the western extension of the Qinling-Qilian-Kunlun central orogenic belt (Figure 1a). The intricate geological structure in this region creates a favorable environment for mineralization [68].
Figure 1.
(a) Geological sketch of the demonstration area. NQL—North Qinling Tectonic Belt; SDS—Shangdan ancient suture zone; CBS—North Qaidam ancient suture zone; AMS—A’nyemaqen ancient suture zone; MLS—Mianlue suture zone. (b) The distribution map of main minerals in Xiahe-Hezuo area (modified from reference [69]).

The outcropping strata in the Xiahe-Hezuo area are primarily of Mesozoic and Late Paleozoic formations, and they are generally distributed along fracture lines trending northwestward. North and south of the Xiahe-Hezuo fracture, Mesozoic and Late Paleo-zoic strata are, respectively, developed, with the northern region dominated by Carboniferous and Permian formations and the southern region primarily comprising Triassic formations, sporadically exposing Neogene and Quaternary units (Figure 1b). The geological structure within the area is primarily composed of folds and fractures. Folds, in conjunction with fractures, jointly control the distribution of gold deposits. The fractures predominantly trend in the north-west direction, and these fractures serve as the primary conduits for magma-hydrothermal fluid migration. It is evident from the figure that gold deposits are primarily located near fractures, and their distribution trend aligns with the orientation of the fractures. Additionally, the presence of fractures also influences the distribution pattern of Yanshanian intermediate-acidic rocks. With the Xiahe-Hezuo fracture as the demarcation, larger-scale batholiths are developed in the northern region. In contrast, the southern region primarily features vein-like formations, resulting in an overall “northwest belt, southeast cluster” distribution pattern. Specifically, the Zaozigou gold deposit is a typical shallow-seated low-temperature hydrothermal gold deposit in the Xiahe-Hezuo area. The exact location is indicated by a black box in Figure 1b.
2.2. Mineral Deposit Features
The Zaozigou Gold deposit is a typical representative of gold deposit associated with intermediate-acid dike rocks in the south of the Xiahe-Hezuo fracture. It is located at approximately 9km southwest of the Hezuo city, Gansu Province, with convenient access to the mine site. The main ore-bearing position is between Gully 1 and Gully 4, with a total area of approximately 2.6 km2 (Figure 2).
The geological formations exposed in the Zaozigou are relatively homogeneous, primarily consisting of Triassic and Quaternary strata. The Quaternary deposits are predominantly located in the southern and eastern parts of the study area. At the same time, the Triassic formations belong mainly to the lower section of the Middle Triassic Gulangdi Group (T2g1). The formation comprises a large sedimentary cycle from bottom to top consisting of siltstone → argillaceous slate → calcareous slate [19,71]. The region exhibits well-developed fractures, broadly categorized into two sets: those trending in an east–west (EW) direction and those trending in a northeast (NE) direction. There are also a few fractures oriented in a north–south (NS) and northwest (NW) direction, although these are localized. As depicted in Figure 1, the NW-oriented fractures will likely represent major regional fractures, primarily serving as conduits for ore-forming hydrothermal fluid migration. In contrast, fractures trending in other directions, such as NE, NS, and EW, are considered secondary fractures and constitute the primary sites for ore deposition. The study area is influenced by the NE-oriented fractures resulting from tectonic movements during the Yanshan period, which control the orientation of rock bodies. It is evident from the figure that Quartz diorite porphyrite, Granodiorite-porphyry, and Plagioclase granite porphyry are all predominantly distributed along the NE trend, including the distribution pattern of gold orebodies.
The fractures exhibit a robust development and intricate morphology, displaying an intersecting pattern that suggests multiple episodes of geological activity in the region. These fractures exert precise control over the distribution of orebodies and vein formations within the deposit. They can be categorized into four principal orientations: NW (blue), NE (red), E–W (green), and NNE (orange) [72,73,74].
① The E–W (green) orientation fracture group is likely the earliest to appear, as nearly all other fractures intersect. Among this group, the longest fracture is F20, located in the study area’s central part, traversing the entire mining site and intersecting with most of the gold deposits within the area.
② The NW (blue) orientation fracture group emerged after the E–W fractures and is relatively rare within the study area, intersecting with NNE (orange) fractures and being intersected by E–W (green) fractures, suggesting a chronological placement between these two orientations. Referring to Figure 1b, it is apparent that this fracture belongs to the NW regional trend and likely served as a conduit for hydrothermal fluid migration rather than as a site for mineral enrichment. Consequently, Figure 2 indicates that gold deposits are generally located away from this fracture.
③ The NNE (orange) orientation fractures are predominantly distributed in the northwestern part of the study area. The illustration shows that F37 intersects the NW (blue) orientation fractures, and F40 intersects the NE (red) fracture F19, indicating its later formation. Despite three fractures within this group, only F40 is relatively close to a gold deposit. However, the orientation of this gold deposit aligns more closely with NE (red) fracture F19, indicating a less direct relationship with F40.
④ The NE (red) orientation fractures are the most extensively distributed within the study area, with several gold deposits exhibiting orientations consistent with this group of fractures. These fractures, characterized by their later formation, intersect with fractures of other orientations.
Despite the broad classification of fractures into the four groups mentioned above, there are also localized NS (north–south) orientation fractures. While some fractures may exhibit a closer spatial relationship with the distribution of mineral deposits, such as the NE (red) orientation fractures, the formation of mineral deposits is a complex and protracted process. Single fractures, on their own, are insufficient to account for mineralization. Instead, the complex interplay of overlapping fractures enhances the potential for mineralization.
The geological context encompasses an intermediate-acid dike featuring fine crystalline diorite, diorite porphyrite, biotite dioritic porphyrite, and quartz diorite porphyrite, notable for its densely developed porphyritic structure. This dike exhibits a predominant trend in the NNE direction, which gradually transitions to an approximately N–S orientation within the western section of the deposit, with additional occurrences trending in a few NW directions. The complex mineralization within the deposit has been significantly influenced by regional multi-period deep fracture activity, resulting in the overlapping of successive phases of magmatism across multiple mineralization stages [75].
There are 147 gold orebodies that have been found in the Zaozigou gold deposit, of which 17 orebodies are main orebodies with gold reserves greater than 1 ton, with the total gold reserve being more than 100 tons [76]. According to the spatial distribution and combination of the mineralization, the Zaozigou deposit can be divided into eastern and western ore blocks (Table 1).
The eastern ore block is primarily situated between Gully 1 and Gully 3, oriented in a northeast direction. It encompasses Au1, which is controlled by F24, Au9 controlled by F21, and Au15 controlled by F25. These orebodies extend over 1000 m long and 300 m wide, with a NW direction tendency and a steep dip near the ground surface, locally nearly upright. In the depths, these orebodies have been staggered by a gently dipping fracture, causing the tendency to change to a SE orientation (Figure 2). In addition, orebodies M4 and M6 lie underground, with a strike of NWW orientation, a tendency of SW orientation, and a dip of 8°~26°. These orebodies cross the NE-striking orebodies obliquely, staggering them, and their own mineralization behavior occurs simultaneously [67].
The western ore block is primarily distributed between Gully 3 and Gully 4, extending in a nearly north–south direction. The main orebodies in this area are Au29 to Au31. The orebodies extend over 1000 m long and wider than 500 m, with a strike of 350°~10°, varying tendency, and dips greater than 75°, which are locally subvertical. These orebodies extend stably, and the mineralization is weaker in the steeper parts and stronger in the slower parts.
The alteration of the surrounding rocks is mainly controlled by different tectonic and vein intrusion activities. From the fractures, veins, and the center of the orebody to both sides of the surrounding rocks, the alteration of the surrounding rocks weakens gradually. This can be generally divided into silicification (stibnite mineralization, pyritization, and arsenopyritization) → sericitization (chloritization and epidotization) → hematitization and carbonation.
According to previous studies in the Zaozigou gold deposit, the metallogenic process can be divided into two parts: the hydrothermal mineralization and the supergene mineralization period. The hydrothermal period is further divided into four phases: (i) early silicification–hematitization phase; (ii) quartz–pyrite–arsenopyrite phase, where the mineral assemblage and production sequence are quartz → pyrite → arsenopyrite → native gold. It is the main gold-forming phase of the deposit; (iii) quartz–stibnite–orpiment–calcite (ankerite) phase, where the mineral assemblage and production sequence are quartz → pyrite → arsenopyrite → stibnite→ native gold; and (iv) quartz–calcite phase, where the mineral assemblage and production sequence are quartz → calcite → kaolin. During the supergene mineralization period, which belongs to the Yanshanian–Himalayan stage, the primary ores near the ground surface were oxidized under the supergene geological process, forming limonite and reddening associated with regional collisional orogenesis and plateau uplift, and the rocks are of allotriomorphic texture, metasomatic relict texture, and alveolate texture [67,76,77].
3. Methods
3.1. Convolutional Neural Network
Convolutional Neural Networks (CNN) [78], as widely used algorithms in deep learning, effectively learn feature patterns from sample data. Leveraging multi-layer convolution operations, they automatically extract feature information from input data, revealing intricate patterns within the data. In a convolutional neural network, apart from the input and output layers, the hidden layers include convolutional layers, activation function layers, pooling layers, and fully connected layers.
The convolutional layer is the core, reflecting the local connectivity and weight-sharing characteristics of convolutional neural networks. It uses filters to extract local features from the overall data, and then, by shifting with a certain stride, extracts data features from different positions, resulting in a feature map [79].
where is an element of the output feature map, I is the input image, K is the convolution kernel, and u and v are the spatial indices of the convolution kernel.
After the convolution operation, a non-linear activation function is introduced. This article employs the ReLU function [80], which not only ensures training effectiveness but also accelerates the training speed. The calculation formula is as shown in Equation (2).
The pooling layer serves to gradually reduce spatial dimensions, thereby reducing the number of parameters and computational demands while simultaneously increasing the receptive field [81]. The most common polling operation is maximum pooling [82].
Within the fully connected layer, each neuron maintains connections to all preceding layer neurons. These layers are responsible for tasks such as classification or regression, making use of universally extracted features [83].
where W is the weight matrix, I is the input, b is the bias vector, and σ is an activation function such as Softmax.
In this study, the Lenet-5 CNN consisting of seven network structure layers was utilized [84]. The input layer is followed by two combinations of convolutional and pooling layers, which then pass through the transposed convolutional layers. Finally, the Softmax function is used to normalize the output layer. Within this model, the ReLU function is employed as the excitation function of the convolution layer in this model.
3.2. The 3D-CNN Model Architecture
Three-dimensional convolutional neural networks have the unique advantage of learning spatial positional relationships among data [85,86,87]. In the context of three-dimensional ore deposit prediction tasks, the three-dimensional spatial information inherently contains mineralization location relationships, making three-dimensional convolutional neural networks particularly advantageous for such tasks.
The network architecture designed in this study comprises five main components (Figure 3), the input layer, three-dimensional convolutional layers (Conv), pooling layers, three-dimensional transposed convolutional layers (TConv), and the output layer. Among these, Conv, pooling layers, and TConv collectively constitute the hidden layers of a multi-layer perceptron. To address the goal of ore deposit prediction, the network output layer is modified to output the posterior probabilities of mineralization in a binary classification form.
4. Dataset and 3D Modeling
4.1. Dataset
Before the establishment of the 3D geological model of the Zaozigou gold deposit, the collection of historical geological and geochemical data was completed, including geological reports, geological exploration maps, drills geochemical data, etc. (Table 2).
4.2. The 3D Geological Modeling
The commencement of three-dimensional geological modeling is initiated by the critical step of standardizing the coordinates of the collected data. The subsequent phase involves the importation of the standardized data into the Micromine software platform, marking the beginning of the modeling process.
Drillhole data represent the most direct and accurate source of deep-seated geological information. In this study, a total of 157 drillhole datasets were collected. By importing drillhole location data, drillhole deviational survey data, sampling records, and lithological data, a comprehensive drillhole model is constructed, as illustrated in Figure 4.
Subsequently, the prospecting line section underwent coordinate transformation to ensure the alignment of drillholes on the exploration cross-sections with the drillhole model. This process involved connecting the geological boundary lines corresponding to adjacent cross-sections, enabling the construction of orebody models, magmatic rock models, and fracture models.
The orebody model accurately depicts the shape and attitude of the orebody. At the Zaozigou gold deposit, the orebody trends northeast, with a steep inclination ranging from 50° to 70°, and in some localized areas, it is even vertical. Certain segments of the steeply dipping orebody are intersected and displaced by ore-controlling faults associated with gently dipping orebodies (Figure 5). This information provides a valuable range for selecting positive samples in subsequent ore prediction.
During the formation process of mineral deposits, fractures typically play a pivotal role as they provide pathways for magmatic hydrothermal fluids, contributing to the enrichment of valuable minerals. At the Zaozigou gold deposit, these fracture structures can be broadly categorized into five main groups: northwest-trending, north–south-trending, northeast-trending, nearly east–west-trending, and north–northeast-trending. Through an analysis of the relationship between the orebody and these structural features, we have determined that fractures have their most significant impact on mineralization within an approximate radius of 30 m [77]. Therefore, we have delineated a 30 m buffer zone around these fracture structures as one of the elements for subsequent mineralization prediction (Figure 6).
The Zaozigou gold deposit area features the development of various rock veins, primarily composed of diorite porphyrite, granite diorite porphyrite, and quartz diorite porphyrite. Diorite porphyrite veins are relatively less abundant and are predominantly exposed in the northwest, extending deeper towards the southeast with significant variations in dip angles. In the central part of the granite diorite porphyrite vein zone, the orientation is northeastward, dipping towards the southwest at angles ranging from approximately 30° to 60°. Quartz diorite porphyrite veins are concentrated and extend along a northeast direction with orientations between 40° and 60°. Mineralization is closely associated with intermediate rock veins, particularly quartz diorite porphyrite, establishing it as a significant geological feature related to mineralization in the mining area (Figure 7).
4.3. The 3D Geochemical Modeling
The primary geochemical halo data from the drilling core are collected from the “Zaozigou gold successive resources exploration project in Hezuo city, Gansu Province”, with a total of 72 drillings and 5028 samples. The 12 elements of Ag, As, Au, Cu, Hg, Pb, Zn, Sb, W, Bi, Co, and Mo were analyzed. The analytical methods were plasma mass spectrometry, atomic absorption, emission spectrometry, atomic fluorescence, and X-ray fluorescence spectrometry [70].
4.3.1. Descriptive Statistical Analysis
Descriptive statistical analysis was carried out on the primary geochemical halo data from drilling the core of the Zaozigou gold deposit (Table 3). In terms of elemental enrichment (K) (Figure 8a), the enrichment coefficients for the Au, As, and Sb elements were greater than 100 and standard deviations were greater than 1000, reflecting the high degree of enrichment of these elements in the area. In terms of the coefficient of variation (CV) (Figure 8b), elements with coefficients of variation greater than 5 are Au, Hg, Sb, and Bi, indicating that the distribution in the mine area is extremely heterogeneous with large fluctuations and is more prone to aggregation and mineralization potential. Elements with strong coefficients of variation (greater than 1 and less than 5) are Ag, As, Cu, Mo, and W, indicating that they are unevenly distributed in space and have some potential for enrichment.
In summary, the standard deviations, enrichment coefficients, and coefficients of variation for Au and Sb elements are characterized by large dispersions and strong enrichment coefficients and degrees of variation.
4.3.2. Defining the Modeling Range of 3D Data Volume
The geochemistry-based prediction method is usually constricted by the controlled width and depth of prospecting engineering, such as drillings. Because the deep orebodies of the Zaozigou gold deposit are obviously controlled by fractures, this study constructs the 3D primary geochemical halo data volume model within a fracture buffer of 30 m so that isolated drilling at large depths has reliable prediction space.
Therefore, based on the geological background, prospecting engineering, and sampling intervals, the cube size was determined as 10 m × 10 m × 10 m for length × width × height. A total of 314,788 cubes were filled in the modeling range (Figure 9). The spatially interpolated cubes will carry geological and geochemical data, as well as inferred metallogenic information, providing a 3D visualization carrier for further 3D mineral prospectivity mapping.
4.3.3. Spatial Interpolation Method of Primary Geochemical Halo Data
This study adopts the ordinary kriging interpolation method to construct a 3D primary geochemical halo data volume model.
The steps of the spatial interpolation of the elemental content mainly include: (i) data pre-processing, including statistical analysis and the normalization of data; (ii) variogram calculation and fitting, including calculating the parameters of the variogram and using a spherical model to fit the variogram; and (iii) 3D kriging interpolation, including establishing a 3D spatial search ellipsoid, calculating the coefficient matrix and distance vector, and employing the ordinary kriging method to gain the spatial interpolation results [89]. Finally, a 3D primary geochemical halo data volume model was obtained to provide geochemical evidence for deep mineral prediction.
Practically, the spatial distribution of the elements in the depths of the Zaozigou gold deposit is anisotropic, with a clear enrichment pattern along with the fracture. The orebody occurrences are nearly consistent with the fracture occurrences. Therefore, the interpolated ellipsoid specification was determined by combining the distribution of fractures and orebodies. Firstly, data pre-processing is necessary for primary geochemical halo data analysis, because extreme values can greatly influence the element distribution regularity extraction. Taking three times the mean value as a threshold value, the extreme values are replaced by the threshold. Secondly, the determination of the main and secondary range orientations is critical for the accuracy of the kriging interpolation results. The direction of the Main orientation is aligned with the orientation of the orebody, while the direction of the Secondary orientation corresponds to the dip angle of the orebody. The Vertical orientation is perpendicular to the plane formed by the Main orientation and the Secondary orientation (Table 4; Figure 10).
4.3.4. The 3D Geochemical Data Volume Model and Element Spatial Distribution Patterns
The results of the 3D spatial interpolation of 12 elements provide an intuitional presentation of the element distribution pattern (Figure 11). The variation of elemental content values in the data volume model is represented by 9-level colors according to the cumulative frequency of the natural logarithm of the element content data (Table 5).
The analysis indicates that the indices of the elements Au, As, and Sb increase progressively from the surface to the depth, and their change patterns are similar. This suggests that these elements are associated with gold mineralization, and their enrichment capacity increases with depth. Hg has two strong anomalies at elevations 1700 m and 3200 m. As a low-temperature element that is easy to diffuse, Hg usually appears on the head of the orebody. The enrichment at 3100 m reflects the orebody below, while enrichment at 1700 m may indicate potential orebodies at deeper locations. Co and Mo anomalies are found at 2300 m, indicating the tail of orebodies. W and Bi have similar anomaly distribution, and have negative correlation with Au, As, and Sb (Figure 11).
Based on the above analysis, and comparing the spatial distribution of the elements with the spatial position of the orebodies, it can be seen that the front halo element association of the Zaozigou gold deposit is As-Sb-Hg; the near-ore halo element association is Au-Ag-Cu-Pb-Zn; and the tail halo element association is W-Mo-Bi.
5. Results and Discussion
Building upon the geological entity model and the geochemical orebody model mentioned above, this prediction primarily focuses on deep-seated forecasting within the mining area, covering an approximate area of 2.16 km2. The predicted depth is determined by referencing the maximum depth borehole (SDZK8314) within the mining area, reaching a depth of 2001.15 m. The predicted depth is set at 3000 m below the surface. The three-dimensional prediction scope is illustrated in Figure 12.
5.1. Geological Geochemical Prospecting Model
Mineral prospecting models are comprehensive representations in mineralization prediction practices that encompass features reflecting potential indicators of orebodies, deposits, mining districts, and even mineralization belts. These models are typically summarized using forms such as text, illustrations, and tables. Establishing mineral prospecting models is not only a fundamental aspect of scientific mineral exploration, but also an effective approach to discovering latent ore deposits. They hold significant guiding significance in ore prediction [90].
In the Zaozigou gold mining region, orebodies are primarily influenced by faulting and vein intrusions. Consequently, three-dimensional fracture models and three-dimensional rock body models can serve as indicators for mineral prospecting. The distribution, zoning, and combinations of geochemical elements serve as favorable indicators for mineralization. They can reveal the sources of materials during ore deposit formation, the mineralization process, and the mineralization environment, thereby aiding in the identification of prospective mineralization areas.
Three-dimensional mineralization prediction involves establishing quantitative indicators for favorable ore-controlling factors (mineralization conditions) under the guidance of mineral prospecting models. This process, coupled with solid and block models, facilitates the extraction of three-dimensional cubic representations for various favorable mineralization conditions. This study employs a rock body model, a structural buffer zone model, and a combination of the geochemical elements, Au, As, and Sb, along with elements from the proximal halo, as well as the geochemical parameters (ratio of front halo to distal halo) as the predictive factors for mineralization. In total, seven variables (the three-dimensional model of Quartz diorite porphyrite, the 30 m structural buffer zone model, Au, As, and Sb, the combination of Au-Ag-Cu-Pb-Zn in the near-ore halo, the ratio of front halo elements to tail halo elements (As-Sb-Hg)/(W-Bi-Co-Mo)) are utilized for the mineralization prediction (Table 6).
5.2. Convolutional-Neural-Network-Based Ore Deposit Prediction
Prior to the incorporation of the 3D-CNN model, these seven variables underwent a transformation into cubic representations, with each small cube measuring 10 m × 10 m × 10 m. Binary coding was independently applied to the rock body model and the structural buffer zone model. Specifically, if a small cube fell within the mineralized rock body or fracture buffer zone, it received a binary value of 1; conversely, if it lay outside these areas, it received a binary value of 0. The geochemical parameters were seamlessly integrated by attributing their content values directly to the corresponding small cubes. In essence, each small cube encapsulates these seven attributes, facilitating a comprehensive mineralization prediction.
Next, regarding the selection of positive and negative samples, positive samples were chosen from the small cubes within the scope of the orebody model as described in Section 4.2. Negative samples, on the other hand, were randomly selected in positions within the drilling model where no orebody was present, matching the quantity of positive samples. Together, these positive and negative samples formed the training dataset.
The convolutional neural network employs a binary cross-entropy loss function [91] for binary classification, aimed at balancing the loss between positive and negative samples while smoothly adjusting network parameters. The optimizer chosen is Adam [92] with a learning rate of 0.1 and trained over 100 epochs. The resulting binary classification loss and accuracy are depicted in Figure 13a.
The parameter configuration is presented in Table 7, where the number of channels in the “Input” signifies the count of input attributes, and the number of channels in the “Output” represents the final prediction outcome denoting the confidence of mineral presence. The Sigmoid activation function is employed to constrain the output values within the range of (0, 1), wherein values closer to 1 indicate higher confidence in the presence of minerals, while lower values imply reduced confidence.
The ROC curves depicted in Figure 13b for the trained convolutional neural network model on both the training and validation datasets reveal a notably robust fit, surpassing the performance of Gaussian mixture models and maximum entropy predictive models [93,94]
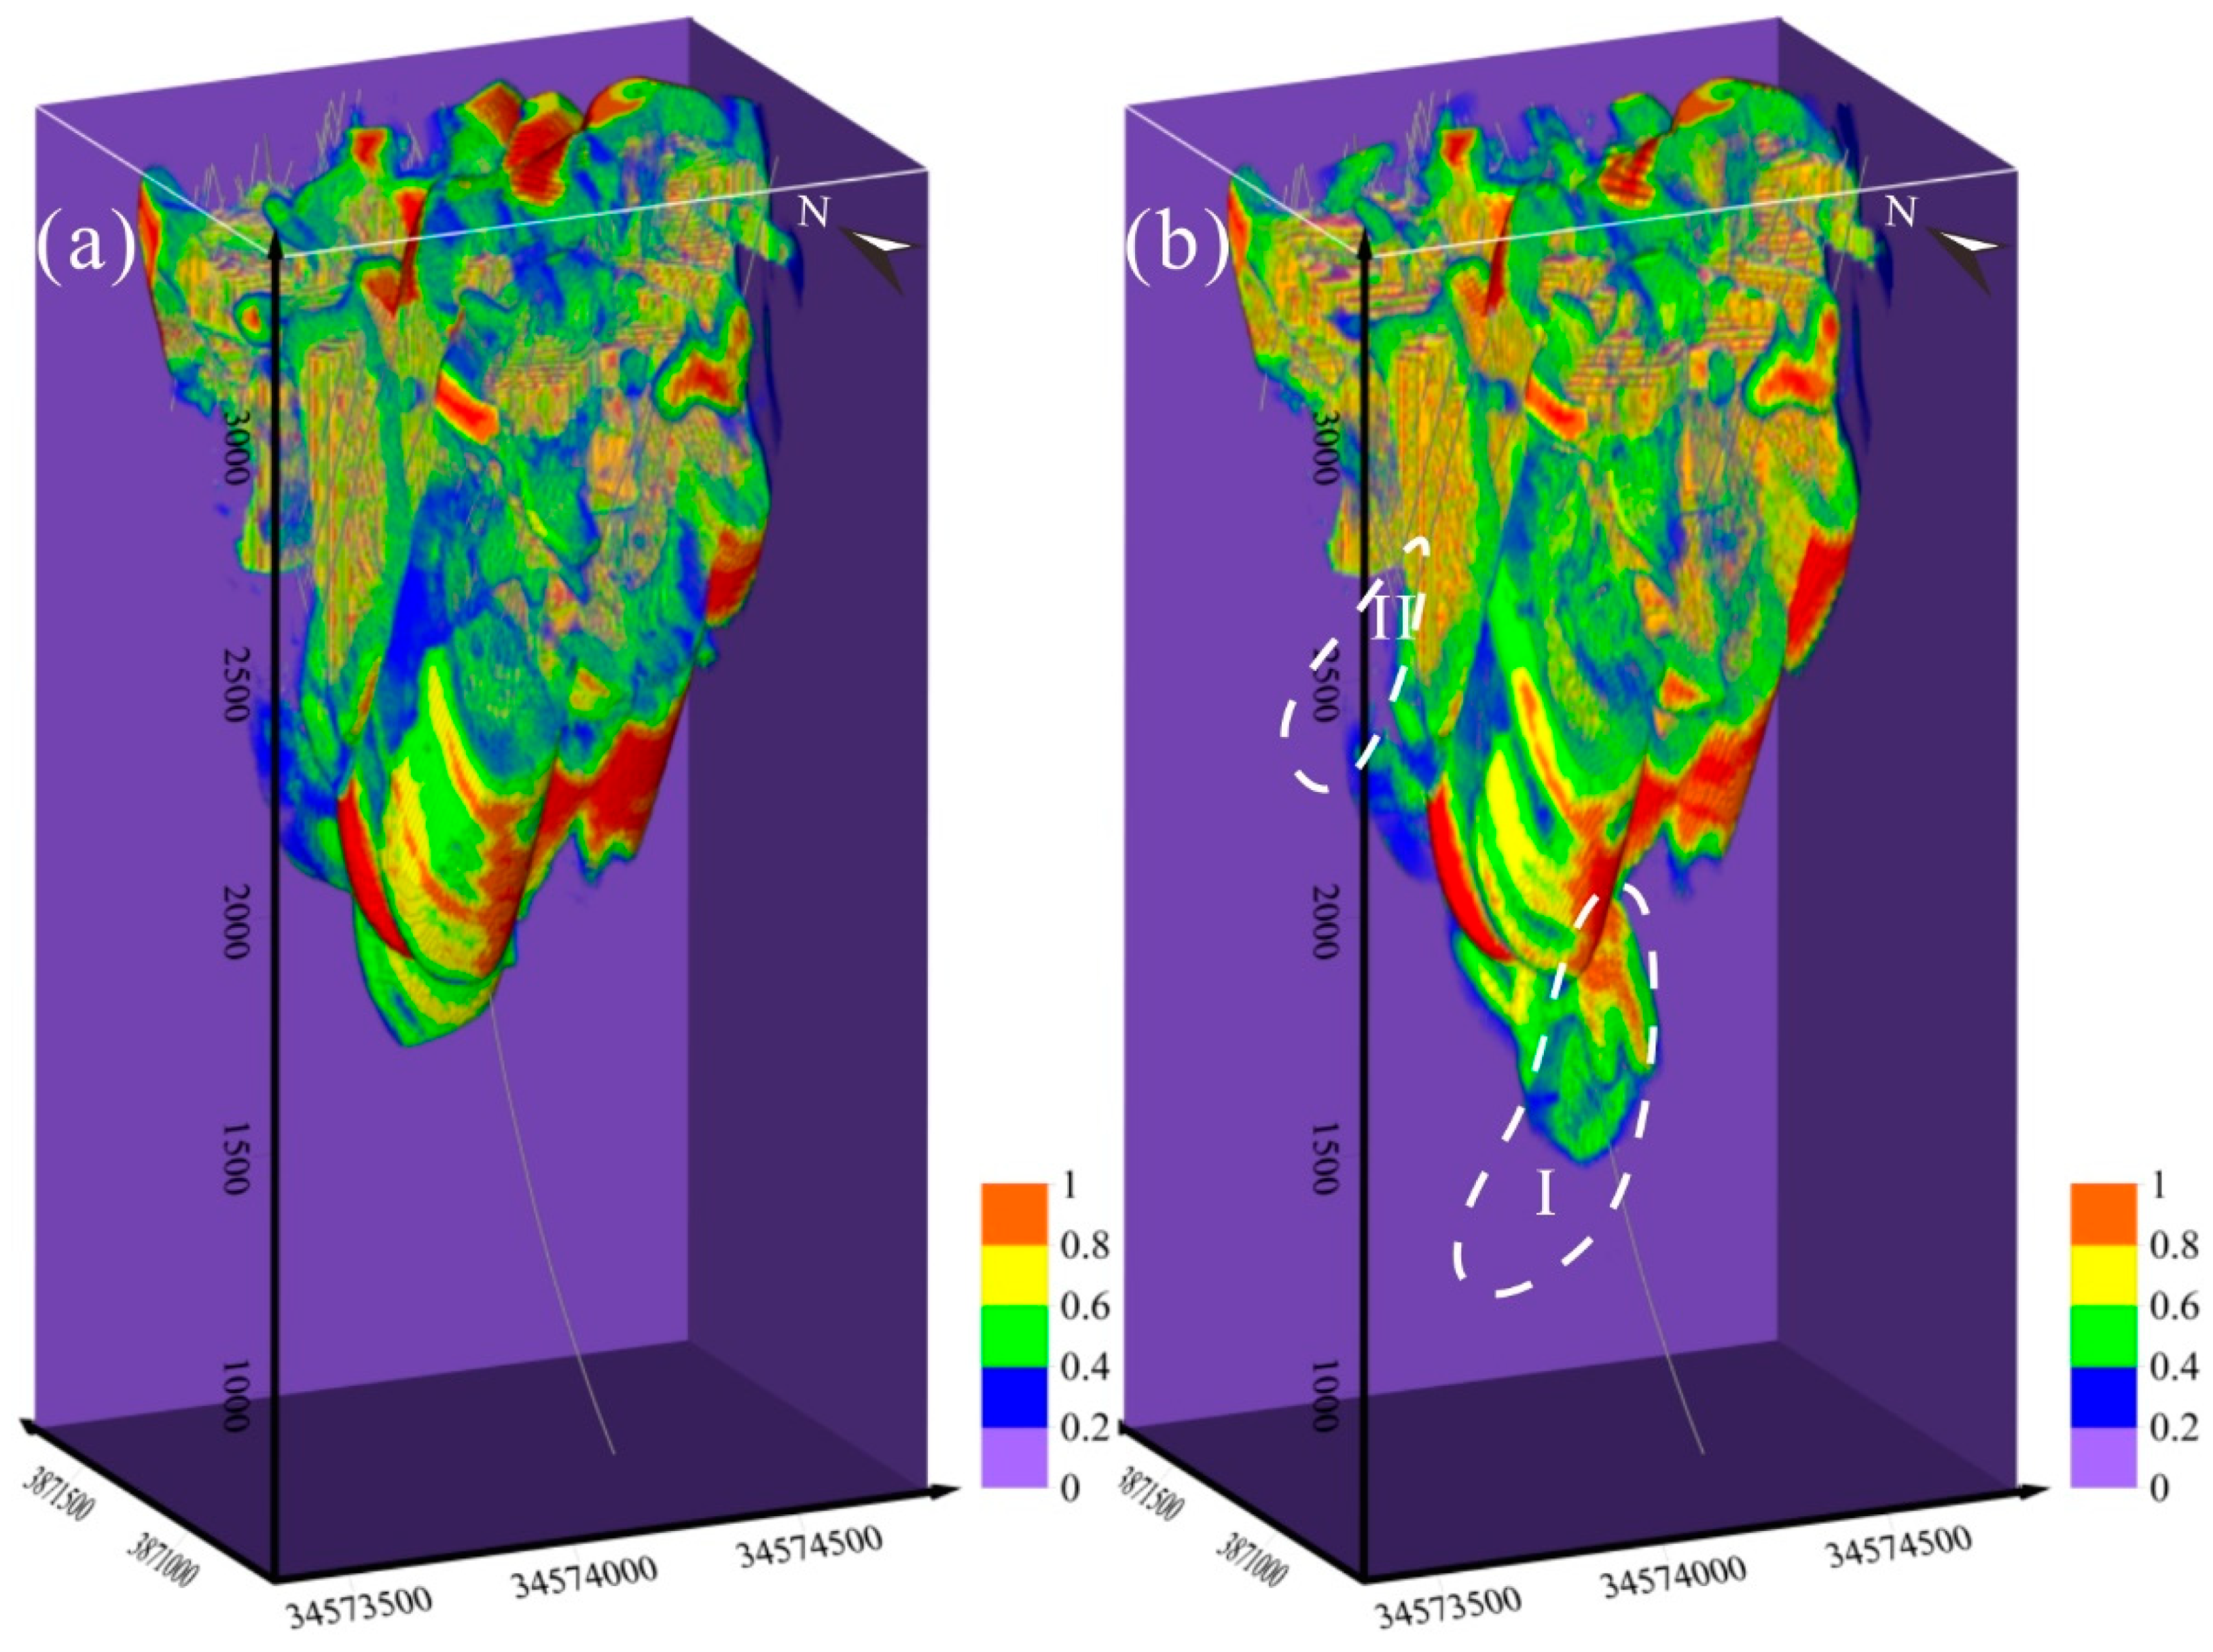
The construction of the convolutional neural network model, precision assessment through training, and the ROC curves of the training and testing sets collectively underscore the accuracy and reliability of the model. The visual representation of three-dimensional ore deposit prediction, as illustrated in Figure 14, notably exhibits a high likelihood of deep-seated mineralization, thereby suggesting an extension of mineral bodies into the deeper strata and delineating two prospective target areas.
Comparing the distribution of orebodies and fractures (Figure 5 and Figure 6), a close relationship can be found between them and the high probability area in Figure 14. As for delineating the most likely metallogenic position at depth, the mineral exploration targets are delineated by considering the factors of the extension of orebodies, fractures, and the result of CNN. Finally, two target areas are identified. Target Ⅰ lies in the southeast direction at an elevation of 1700–2000 m. This position represents the extension end of the Au1 orebody. Notably, the Au and Sb elements show significantly strong anomalies at this location. The ratio of elements between the front and distal halos has been consistently rising. Convolutional neural network modeling has computed a relatively high probability of mineralization in this region. Therefore, it is predicted that the Au1 orebody will extend to depths beyond 1800 m or even give rise to new mineral bodies. Target Ⅱ is situated in the northwest direction within an elevation range of 2350–2650 m. This region exhibits a higher level of structural complexity. There is a notable vertical overlap of the distal halo element Co with the front halo elements Sb and As. Compared to the orebodies in the southeast direction, the control over orebodies on the northwestern side is slightly less profound in terms of depth. However, the deeper extension of the orebody has not been constrained, particularly concerning stable and thick orebodies like Au9 and Au126. The geochemical parameters starting from an elevation of 2600 m and deeper suggest the potential presence of further extensions or even new blind orebodies at greater depths.
6. Conclusions
The integration of 3D geological and geochemical modeling, coupled with the in-novation of the convolutional neural network algorithm, marks a significant stride in deep-seated mineralization prediction.
During this process, a fracture buffer of 30 m serves as the 3D modeling range because of the metallogenic process controlled by the fracture in the Zaozigou deposit. Simultaneously, the development of 3D geochemical models has illuminated the subsurface distribution of critical mineralizing elements. The element distribution and element association distribution of front halo, near-ore halo, and tail halo are extracted as important prediction indicators appropriate for the gold metallogenic regularity. In particular, the use of convolutional neural network helps us gain a new insight into deep-seated mineralization, and the exploration targets proposed by this method deserve more attention.
In summary, these advancements contribute not only to the scientific understanding of mineralization processes but also to the practical exploration strategies employed in unlocking hidden mineral riches.
Author Contributions
Methodology, C.L., K.X. and B.L.; software, M.X. and C.L.; writing—original draft preparation, C.L., B.L. and L.W.; writing—review and editing, C.L. and B.L.; visualization, Y.K., M.X., Y.W. and R.T.; supervision, B.L.; funding acquisition, B.L. All authors have read and agreed to the published version of the manuscript.
Funding
This research was funded by the National Key Research and Development Program of China (Grants 2017YFC0601505) and the National Natural Science Foundation of China (Grants 41602334; 42072322).
Data Availability Statement
Data is not available.
Acknowledgments
The authors thank the anonymous reviewers and the editors for their hard work on this paper. We are grateful to the Development Research Center of China Geological Survey and No.3 Geological and Mineral Exploration team, Gansu Provincial Bureau of Geology and Mineral Exploration and Development for their data support.
Conflicts of Interest
The authors declare no conflict of interest.
References
- Houlding, S.W. 3D Geoscience Modeling: Computer Techniques for Geological Characterization; Springer: London, UK, 1994. [Google Scholar]
- Hou, W.S.; Wu, X.C.; Liu, X.G.; Chen, G.N. A complex fault modeling method based on geological plane map. Rock Soil Mech. 2007, 28, 169–172, (In Chinese with English Abstract). [Google Scholar]
- Guo, J.T.; Wu, L.X.; Zhou, W.H. Automatic ore body implicit 3D modeling based on radial basis function surface. J. China Coal Soc. 2016, 41, 2130–2135, (In Chinese with English Abstract). [Google Scholar]
- Mao, X.C.; Zhang, M.M.; Deng, H.; Zou, Y.H.; Chen, J. 3D Visualization Prediction Method for Concealed Ore Bodies in the Deep Mining Area. J. Geol. 2016, 40, 363–371, (In Chinese with English Abstract). [Google Scholar]
- Xiao, K.Y.; Li, N.; Alok, P.; Holden, E.J.; Leon, B. GIS-based 3D prospectivity mapping: A case study of Jiama copper-polymetallic deposit in Tibet, China. Ore Geol. Rev. 2015, 71, 611–632. [Google Scholar] [CrossRef]
- Li, N.; Xiao, K.Y.; Yin, J.N.; Fan, J.F.; Wang, K. A Method of 3D Buffer Analysis of Boundary Representation. J. Comput.-Aided Des. Comput. Graph. 2015, 27, 1625–1636. [Google Scholar]
- Nielsen, S.H.H.; Partigton, G.A.; Franey, D.; Dwight, T. 3D mineral potential modelling of gold distribution at the Tampia gold deposit. Ore Geol. Rev. 2019, 109, 276–289. [Google Scholar] [CrossRef]
- Farahbakhsh, E.; Hezarkhani, A.; Eslamkish, T.; Bahroudi, A.; Chandra, R. Three-dimensional weights of evidence modelling of a deep-seated porphyry Cu deposit. Geochem. Explor. Environ. Anal. 2020, 20, 480–495. [Google Scholar] [CrossRef]
- Mao, X.C.; Deng, H.; Chen, J. Research Progress on Three-Dimensional Analysis and Modeling Prediction of Deep Metallogenic Structure. In Proceedings of the Annual Meeting of Chinese Geoscience Union, Beijing, China, 21 October 2018. [Google Scholar]
- Mao, X.C.; Wang, Q.; Chen, J.; Deng, H.; Liu, Z.K.; Wang, J.L.; Chen, J.P.; Xiao, K.Y. Three-dimensional Modeling of Deep Metallogenic Structure in Northwestern Jiaodong Peninsula and Its Gold Prospecting Significance. Acta Geol. Sin. 2020, 41, 166–178. [Google Scholar]
- Agterberg, F.P. Automatic contouring of geological maps to detect target areas for mineral exploration. J. Int. Assoc. Math. Geol. 1974, 6, 373–375. [Google Scholar] [CrossRef]
- Zhao, P.D.; Meng, X.G. Geological Anomaly and Mineral Prediction. Earth Sci. 1993, 18, 682–684, (In Chinese with English Abstract). [Google Scholar]
- Cheng, Q.M. Singularity-Generalized Self-Similarity-Fractal Spectrum (3S) Models. Earth Sci. 2006, 31, 337–348, (In Chinese with English Abstract). [Google Scholar]
- Chen, J.P.; Lv, P.; Wu, W.; Zhao, J.; Hu, Q. A 3D method for predicting blind orebodies, based on a 3D visualization model and its application. Earth Sci. Front. 2007, 14, 54–62, (In Chinese with English Abstract). [Google Scholar] [CrossRef]
- Song, M.; Li, S.; Zheng, J.; Wang, B.; Fan, J.; Yang, Z.; Wen, G.; Liu, H.; He, C.; Zhang, L.; et al. A 3D Predictive Method for Deep-Seated Gold Deposits in the Northwest Jiaodong Peninsula and Predicted Results of Main Metallogenic Belts. Minerals 2022, 12, 935. [Google Scholar] [CrossRef]
- Xiao, K.; Xiang, J.; Fan, M.; Xu, Y. 3D mineral prospectivity mapping based on deep metallogenic prediction theory: A case study of the Lala Copper Mine, Sichuan, China. J. Earth Sci. 2021, 32, 348–357. [Google Scholar] [CrossRef]
- Mao, X.C.; Zhou, Y.H.; Chen, J.; Lai, J.Q.; Peng, S.L.; Shao, Y.J.; Shu, Z.M.; Lv, J.W.; Lv, Z.Y. Three-Dimension Visual Prediction Of Concealed Ore Bodies in the Deep and Marginal Parts of crisis Mines: A case Study of the Fenghuangshan Ore Field in Tongling, Anhui, China. Geol. Bull. China 2010, 29, 401–413, (In Chinese with English Abstract). [Google Scholar]
- Liu, Y.; Zhou, K.F. Gold Anomaly Identification and Its Uncertainty Analysis in the West Junggar Belt, Xinjiang. Earth Sci. 2018, 43, 3186–3199, (In Chinese with English Abstract). [Google Scholar]
- Zhang, Q.; Chen, J.; Xu, H.; Jia, Y.; Chen, X.; Jia, Z.; Liu, H. Three-dimensional mineral prospectivity mapping by XGBoost modeling: A case study of the Lannigou gold deposit, China. Nat. Resour. Res. 2022, 31, 1135–1156. [Google Scholar] [CrossRef]
- Mao, X.C.; Ren, J.; Liu, Z.K.; Chen, J.; Tang, L.; Deng, H.; Bayless, R.C.; Yang, B.; Wang, M.J.; Liu, C.M. Three-dimensional prospectivity modeling of the Jiaojia-type gold deposit, Jiaodong Peninsula, Eastern China: A case study of the Dayingezhuang deposit. J. Geochem. Explor. 2019, 203, 27–44, (In Chinese with English Abstract). [Google Scholar] [CrossRef]
- Yousefi, M.; Kreuzer, O.P.; Nykanen, V.; Hronsky, J.M.A. Exploration information systems-A proposal for the future use of GIS in mineral exploration targeting. Ore Geol. Rev. 2019, 111, 103005. [Google Scholar] [CrossRef]
- Liu, G.; Wu, C.L.; He, Z.W.; Wong, Z.P.; Zhu, Q.; Zhang, Y.T.; Li, X.M. Design and Application of 3D Spatial Database Model for Integrated Management of Aboveground and Underground Features. Earth. Sci. 2011, 36, 367–374, (In Chinese with English Abstract). [Google Scholar]
- Sun, L.; Xiao, K.Y.; Tang, J.X.; Zou, W.; Li, N.; Sun, Y. 3D Geologic Modeling of Jiama Cu Deposit Based on Minexplorer System. J. Chengdu Univ. Technol. Sci. Technol. Ed. 2011, 38, 291–297, (In Chinese with English Abstract). [Google Scholar]
- Xiao, K.Y.; Li, N.; Sun, L.; Zou, W.; Li, Y. Large scale 3D mineral prediction methods and channels based on 3D information technology. J. Geol. 2012, 36, 229–236, (In Chinese with English Abstract). [Google Scholar]
- Chen, J.P.; Yu, M.; Yu, P.P.; Shang, B.C.; Zheng, X.; Wang, L.M. Method and Practice of 3D Geological Modeling at Key Metallogenic Belt with Large and Medium Scale. Acta Geol. Sin. 2014, 88, 1187–1195, (In Chinese with English Abstract). [Google Scholar]
- Wang, K.; Xiao, K.Y.; Yan, Y.Y. Application of 3 D modeling technology in Lead-zinc prospecting in Huayuan, Hunan Province. J. Geol. 2014, 38, 441–444, (In Chinese with English Abstract). [Google Scholar]
- Zhang, M.M.; Li, X.H.; Yuan, F.; Hu, X.Y.; Wang, X.H. Comparative Study Between Three-Dimensional Straya Modeling and Surface model Interpolation. Anhui Geol. 2015, 25, 182–186, (In Chinese with English Abstract). [Google Scholar]
- Gao, L.; Liu, Q.Y.; Xv, S.T.; Yang, T.; Yv, P.P.; Zhou, Y.Z. Three-dimensional geological modeling of deposits and reserve estimation: A case study of the Jingkou ore block of the Fengcun Pb-Zn deposit. Geol. Explor. 2016, 52, 956–965, (In Chinese with English Abstract). [Google Scholar]
- Carranza, E.J.M.; Sadeghi, M. Primary geochemical characteristics of mineral deposits—Implications for exploration. Ore Geol. Rev. 2012, 45, 1–4. [Google Scholar] [CrossRef]
- Safronov, N.I. Dispersion haloes of ore deposits and their use in exploration. Probl. Sov. Geol. 1936, 4, 41–53. [Google Scholar]
- Distler, V.V.; Yudovskaya, M.A.; Mitrofanov, G.L.; Prokof’Ev, V.Y.; Lishnevskii, E.N. Geology, composition, and genesis of the Sukhoi Log noble metals deposit, Russia. Ore Geol. Rev. 2004, 24, 7–44. [Google Scholar] [CrossRef]
- Gundobin, G.M. Peculiarities in the zoning of primary halos. J. Geochem. Explor. 1984, 21, 193–200. [Google Scholar] [CrossRef]
- Ziaii, M.; Carranza, E.J.M.; Ziaei, M. Application of geochemical zonality coefficients in mineral prospectivity mapping. Comput. Geosci. 2011, 37, 1935–1945. [Google Scholar] [CrossRef]
- Goodell, P.C.; Petersen, U. Julcani mining district, Peru: A study of metal ratios. Econ. Geol. 1974, 69, 347–361. [Google Scholar] [CrossRef]
- Jones, B.K. Application of metal zoning to gold exploration in porphyry copper systems. J. Geochem. Explor. 1992, 43, 127–155. [Google Scholar] [CrossRef]
- Pirajno, F.; Smithies, R.H. The FeO/(FeO+MgO) ratio of tourmaline: A useful indicator of spatial variations in granite-related hydrothermal mineral deposits. J. Geochem. Explor. 1992, 42, 371–381. [Google Scholar] [CrossRef]
- Kreĭn, M.G.; Melik-Adamjan, F.È. An integrated lithogeochemical approach to detecting and interpreting cryptic alteration around the Elura Zn-Pb-Ag deposit, New South Wales, Australia. Geochem. Explor. Environ. Anal. 2011, 11, 233–246. [Google Scholar]
- Pearce, T.H. A contribution to the theory of variation diagrams. Contrib. Mineral. Petrol. 1968, 19, 142–157. [Google Scholar] [CrossRef]
- Stanley, C.R.; Madeisky, H.E. Lithogeochemical exploration for hydrothermal ore deposits using molar element ratio analysis. In Alteration and Alteration Processes Associated with Oreforming Systems. Geological Association of Canada, Short Course Handbook; Lentz, D.R., Ed.; Geological Association of Canada: Labrador, NL, Canada, 1994; Volume 11, pp. 193–211. [Google Scholar]
- Urqueta, E.; Kyser, T.K.; Clark, A.H.; Stanley, C.R.; Oates, C.J. Lithogeochemistry of the Collahuasi porphyry Cu-Mo and epithermal Cu-Ag (−Au) cluster, northern Chile: Pearce element ratio vectors to ore. Geochem. Explor. Environ. Anal. 2009, 9, 9–17. [Google Scholar] [CrossRef]
- Barrie, C.T. Petrochemistry of shoshonitic rocks associated with porphyry copper-gold deposits of central Quesnellia, British Columbia, Canada. J. Geochem. Explor. 1993, 48, 225–258. [Google Scholar] [CrossRef]
- Date, J.; Watanabe, T.; Saeki, Y. Zonal alteration around the Fukazawa kuroko deposits, Akita prefecture, northern Japan. Econ. Geol. 1983, 5, 365–386. [Google Scholar]
- Ishikawa, Y.; Sawaguchi, T.; Iwaya, S.; Horiuchi, M. Delineation of prospecting targets for Kuroko deposits based on modes of volcanism of underlying dacite and alteration haloes. Min. Geol. 1976, 26, 105–117. [Google Scholar]
- Kishida, A.; Kerrich, R. Hydrothermal alteration zoning and gold concentration at the Kerr–Addison Archean lode gold deposit, Kirkland Lake, Ontario. Econ. Geol. 1987, 82, 649–690. [Google Scholar] [CrossRef]
- Large, R.R.; Mcgoldrick, P.J. Lithogeochemical halos and geochemical vectors to stratiform sediment hosted Zn–Pb–Ag deposits, 1. Lady Loretta Deposit, Queensland. J. Geochem. Explor. 2000, 68, 105–126. [Google Scholar] [CrossRef]
- Large, R.R.; McPhie, J.; Gemmell, J.B.; Herrmann, W.; Davidson, G.J. The spectrum of ore deposit types, volcanic environments, alteration halos, and related exploration vectors in submarine volcanic successions: Some examples from Australia. Econ. Geol. 2001, 96, 913–938. [Google Scholar] [CrossRef]
- Piché, M.; Jébrak, M. Normative minerals and alteration indices developed for mineral exploration. J. Geochem. Explor. 2004, 82, 59–77. [Google Scholar] [CrossRef]
- Prendergast, K. Application of lithogeochemistry to gold exploration in the St Ives Goldfield, Western Australia. Geochem. Explor. Environ. Anal. 2007, 7, 99–108. [Google Scholar] [CrossRef]
- Wang, L.; Percival, J.; Hedenquist, J.W.; Hattori, K.; Qin, K.Z. Alteration mineralogy of the Zhengguang Au-Zn deposit, Northeast China: Interpretation of shortwave infrared analyses during mineral exploration and assessment. Econ. Geol. 2021, 116, 389–406. [Google Scholar] [CrossRef]
- Xie, X.J.; Chen, H.C. The role of the native halo method in the geological survey and exploration. Acta Geol. Sin. 1961, 41, 273–284. (In Chinese) [Google Scholar]
- Shao, Y. Several problems with the native halo approach. Geol. Explor. 1964, 03, 21–24. (In Chinese) [Google Scholar]
- Beus, A.A.; Grigorian, S.V. Geochemical Exploration Methods for Mineral Deposits; Applied Publishing Ltd.: Wilmette, IL, USA, 1977. [Google Scholar]
- Li, H. An I deal Pattern of Primary Superimposed Halo of Hydrothermal Gold Deposits. Geol. Explor. 1993, 03, 46–51, (In Chinese with English Abstract). [Google Scholar]
- Qing, C.S.; Peng, X.H.; Xu, B.; Yang, H.; Zhang, J.S.; Hu, Y.; Zhong, Y.L.; Mu, X.H.; Wang, T. Research progress of native halo prospecting method. Acta Miner. Sin. 2011, 31, 828–829. (In Chinese) [Google Scholar]
- Li, H.; Yu, B.; Wei, J.; Li, Y.C.; Wang, J.; Wei, Z.X.; Zhang, H.R.; Ren, L.L.; Wang, X.; Sun, F.Z.; et al. A new practical ideal model of structural superimposed halos for prediction of deep blind hydrothermal deposits and its significance. Geol. Explor. 2020, 56, 889–897, (In Chinese with English Abstract). [Google Scholar]
- Ran, X.; Xue, L.; Zhang, Y.; Liu, Z.; Sang, X.; He, J. Rock Classification from Field Image Patches Analyzed Using a Deep Convolutional Neural Network. Mathematics 2019, 7, 755. [Google Scholar] [CrossRef]
- Sang, X.; Xue, L.; Ran, X.; Li, X.; Liu, J.; Liu, Z. Intelligent High-Resolution Geological Mapping Based on SLIC-CNN. ISPRS Int. J. Geo-Inf. 2020, 9, 99. [Google Scholar] [CrossRef]
- Guo, J.; Li, Y.; Jessell, M.W.; Giraud, J.; Li, C.; Wu, L.; Li, F.; Liu, S. 3D geological structure inversion from Noddy-generated magnetic data using deep learning methods. Comput. Geosci. 2021, 149, 104701. [Google Scholar] [CrossRef]
- Li, T.; Zuo, R.; Xiong, Y.; Peng, Y. Random-drop data augmentation of deep convolutional neural network for mineral prospectivity mapping. Nat. Resour. Res. 2021, 30, 27–38. [Google Scholar] [CrossRef]
- Sun, T.; Li, H.; Wu, K.; Chen, F.; Zhu, Z.; Hu, Z. Data-driven predictive modelling of mineral prospectivity using machine learning and deep learning methods: A case study from southern Jiangxi Province, China. Minerals 2020, 10, 102. [Google Scholar] [CrossRef]
- Li, S.; Chen, J.; Liu, C.; Wang, Y. Mineral prospectivity prediction via convolutional neural networks based on geological big data. J. Earth Sci. 2021, 32, 327–347. [Google Scholar] [CrossRef]
- Zhang, S.; Carranza, E.J.; Wei, H.; Xiao, K.; Yang, F.; Xiang, J.; Zhang, S.; Xu, Y. Data-driven mineral prospectivity mapping by joint application of unsupervised convolutional auto-encoder network and supervised convolutional neural network. Nat. Resour. Res. 2021, 30, 1011–1031. [Google Scholar] [CrossRef]
- Feng, Y.M.; Cao, X.Z.; Zhang, E.P.; Hu, Y.X.; Pan, X.P.; Yang, J.L.; Jia, Q.Z.; Li, W.M. Tectonic Evolution Framework and Nature of The West Qinling Orogenic Belt. Northwest. Geol. 2003, 36, 1–10, (In Chinese with English Abstract). [Google Scholar]
- Wei, L.X. Tectonic Evolution and Mineralization of Zaozigou Gold Deposit, Gansu Province. Master’s Thesis, China University of Geosciences, Beijing, China, 2015. (In Chinese with English Abstract). [Google Scholar]
- Zeng, J.J.; Li, K.N.; Yan, K.; Wei, L.L.; Huo, X.D.; Zhang, J.P. Tectonic Setting and Provenance characteristics of the Lower Triassic Jiangligou Formation in West Qinling—Constraints from Geochemistry of Clastic Rock and zircon U-Pb Geochronology of Detrital Zircon. Geol. Rev. 2021, 67, 1–15, (In Chinese with English Abstract). [Google Scholar]
- Li, Z.B.; Liu, Z.Y.; Li, R. Geochemical Characteristics and metallogenic Potential Analysis of Daheba Formation in Ta-Ga Area of Gansu Province. Contrib. Geol. Miner. Resour. Res. 2021, 36, 187–194, (In Chinese with English Abstract). [Google Scholar]
- Li, K.N. Geochemical prospecting perspective of Wengcheng area, Guangdong province. Geol. Miner. Resour. 2014, 30, 138–145. [Google Scholar]
- Chen, Y.; Wang, K.J. Geological Features and Ore Prospecting Indicators of Sishangou Silver Deposit. Gansu. Metal. 2015, 37, 108–111, (In Chinese with English Abstract). [Google Scholar]
- Di, P.F. Geochemistry and Ore-Forming Mechanism on Zaozigou Gold Deposit in Xiahe-Hezuo, West Qinling, China. Doctor’s Thesis, Lanzhou University, Lanzhou, China, 2018. (In Chinese with English Abstract). [Google Scholar]
- Tang, L.; Lin, C.G.; Cheng, Z.Z.; Jia, R.Y.; Li, H.R.; Li, K.N. 3D Characteristics of Primary Halo and Deep Prospecting Prediction in The Zaozigou Gold Deposit, Hezuo City, Gansu Province. Geol. Bull. China 2020, 39, 1173–1181, (In Chinese with English Abstract). [Google Scholar]
- Chen, G.Z.; Wang, J.L.; Liang, Z.L.; Li, P.B.; Ma, H.S.; Zhang, Y.N. Analysis of Geological Structures in Zaozigou Gold Deposit of Gansu Province. Gansu Geol. 2013, 22, 50–57, (In Chinese with English Abstract). [Google Scholar]
- Chen, G.Z.; Liang, M.L.; Wang, J.L.; Zhang, Y.N.; Li, P.B. Characteristics and Deep Prediction of Primary Superimposed Halos in The Zaozigou Gold Deposit of Hezuo, Gansu Province. Geophys. Geochem. Explor. 2014, 38, 268–277, (In Chinese with English Abstract). [Google Scholar]
- Jin, D.G.; Liu, B.C.; Chen, Y.Y.; Liang, Z.L. Spatial Distribution of Gold Bodies in Zaozigou Mine of Gansu Province. Gansu Geol. 2015, 24, 25–30+41, (In Chinese with English Abstract). [Google Scholar]
- Zhu, F.; Wang, G.W. Study on Grade Model of Gansu Zaozigou Gold Mine Based on Geological Statistics. Acta Mineral. Sin. 2015, 35, 1065–1066. (In Chinese) [Google Scholar]
- Chen, G.Z.; Li, L.N.; Zhang, Y.N.; Ma, H.S.; Liang, Z.L.; Wu, X.M. Characteristics of fluid inclusions and deposit formation in Zaozigou gold mine. J. Jilin Univ. (Earth Sci. Ed.) 2015, 45, 1–2. (In Chinese) [Google Scholar]
- Liu, Y.; Liu, Y.H.; Dong, F.C.; Li, Z.H.; Yv, J.K. Accurate Determination and geological significance of Zaozigou gold deposit in Gansu province. Adv. Earth Sci. 2012, 33, 10–15. [Google Scholar]
- Li, W.; Chen, J.P.; Jia, Y.L.; Zhou, G.Y.; Mao, X.C.; Xiao, K.Y. Three-dimensional Modeling and Comprehensive Metallogenic Prediction of the Zaozigou Gold Deposit, Gansu Province. Area. J. Geol. 2020, 41, 144–156, (In Chinese with English Abstract). [Google Scholar]
- LeCun, Y.; Bengio, Y. Convolutional networks for images, speech, and time series. In The Handbook of Brain Theory and Neural Network; Arbib, M.A., Ed.; MIT Press: Cambridge, MA, USA, 1995; p. 3361. [Google Scholar]
- Zeiler, M.D.; Fergus, R. Visualizing and understanding convolutional networks. In Proceedings of the Computer Vision–ECCV 2014: 13th European Conference, Zurich, Switzerland, 6–12 September 2014; Proceedings, Part I 13. Springer International Publishing: Berlin/Heidelberg, Germany, 2014; pp. 818–833. [Google Scholar]
- Nair, V.; Hinton, G.E. Rectified linear units improve restricted boltzmann machines. In Proceedings of the 27th International Conference on Machine Learning (ICML-10), Haifa, Israel, 21–24 June 2010; pp. 807–814. [Google Scholar]
- Sermanet, P.; Eigen, D.; Zhang, X.; Mathieu, M.; Fergus, R.; LeCun, Y. Overfeat: Integrated recognition, localization and detection using convolutional networks. arXiv 2013, arXiv:1312.6229. [Google Scholar]
- Boureau, Y.L.; Ponce, J.; LeCun, Y. A theoretical analysis of feature pooling in visual recognition. In Proceedings of the 27th International Conference on Machine Learning (ICML-10), Haifa, Israel, 21–24 June 2010; pp. 111–118. [Google Scholar]
- Simonyan, K.; Zisserman, A. Very deep convolutional networks for large-scale image recognition. arXiv 2014, arXiv:1409.1556. [Google Scholar]
- Lecun, Y.; Bottou, L.; Bengio, Y.; Haffner, P. Gradient-based learning applied to document recognition. Proc. IEEE 1998, 86, 2278–2324. [Google Scholar] [CrossRef]
- Maturana, D.; Scherer, S. Voxnet: A 3d convolutional neural network for real-time object recognition. In Proceedings of the 2015 IEEE/RSJ International Conference on Intelligent Robots and Systems (IROS), Hamburg, Germany, 28 September–3 October 2015; IEEE: Piscataway, NJ, USA, 2015; pp. 922–928. [Google Scholar]
- Abdoli, S.; Cardinal, P.; Koerich, A.L. End-to-end environmental sound classification using a 1D convolutional neural network. Expert Syst. Appl. 2019, 136, 252–263. [Google Scholar] [CrossRef]
- Ieracitano, C.; Mammone, N.; Bramanti, A.; Hussain, A.; Morabito, F.C. A convolutional neural network approach for classification of dementia stages based on 2D-spectral representation of EEG recordings. Neurocomputing 2019, 323, 96–107. [Google Scholar] [CrossRef]
- Li, X.; Xue, C.; Chen, Y.; Yuan, F.; Li, Y.; Zheng, C.; Zhang, M.; Ge, C.; Guo, D.; Lan, X.; et al. 3D Convolutional Neural Network-based 3D mineral prospectivity modeling for targeting concealed mineralization within Chating area, middle-lower Yangtze River metallogenic Belt, China. Ore Geol. Rev. 2023, 157, 105444. [Google Scholar] [CrossRef]
- Jia, L.J. Research on 3D Geological Modeling Interpolation Algorithm Based on Drilling Data. Master’s Thesis, China University of Geosciences, Beijing, China, 2018. (In Chinese with English Abstract). [Google Scholar]
- Ye, T.Z.; Xiao Ky Yan, G.S. Methodology of deposit modeling and mineral resource potential assessment using integrated geological information. Earth Sci. Front. 2007, 14, 11–19, (In Chinese with English Abstract). [Google Scholar]
- Lin, T.Y.; Goyal, P.; Girshick, R.; He, K.; Dollár, P. Focal Loss for Dense Object Detection. In Proceedings of the IEEE International Conference on Computer Vision, Venice, Italy, 22–29 October 2017; pp. 2999–3007. [Google Scholar]
- Kingma, D.; Ba, J. Adam: A Method for Stochastic Optimization. arXiv 2014, arXiv:1412.6980. [Google Scholar]
- Kong, Y.; Chen, G.; Liu, B.; Xie, M.; Yu, Z.; Li, C.; Wu, Y.; Gao, Y.; Zha, S.; Zhang, H.; et al. 3D Mineral Prospectivity Mapping of Zaozigou Gold Deposit, West Qinling, China: Machine Learning-Based Mineral Prediction. Minerals 2022, 12, 1361. [Google Scholar] [CrossRef]
- Yu, Z.; Liu, B.; Xie, M.; Wu, Y.; Kong, Y.; Li, C.; Chen, G.; Gao, Y.; Zha, S.; Zhang, H.; et al. 3D Mineral Prospectivity Mapping of Zaozigou Gold Deposit, West Qinling, China: Deep Learning-Based Mineral Prediction. Minerals 2022, 12, 1382. [Google Scholar] [CrossRef]
Figure 2.
Geological map of Zaozigou gold deposit (modified from reference [70]).
Figure 2.
Geological map of Zaozigou gold deposit (modified from reference [70]).
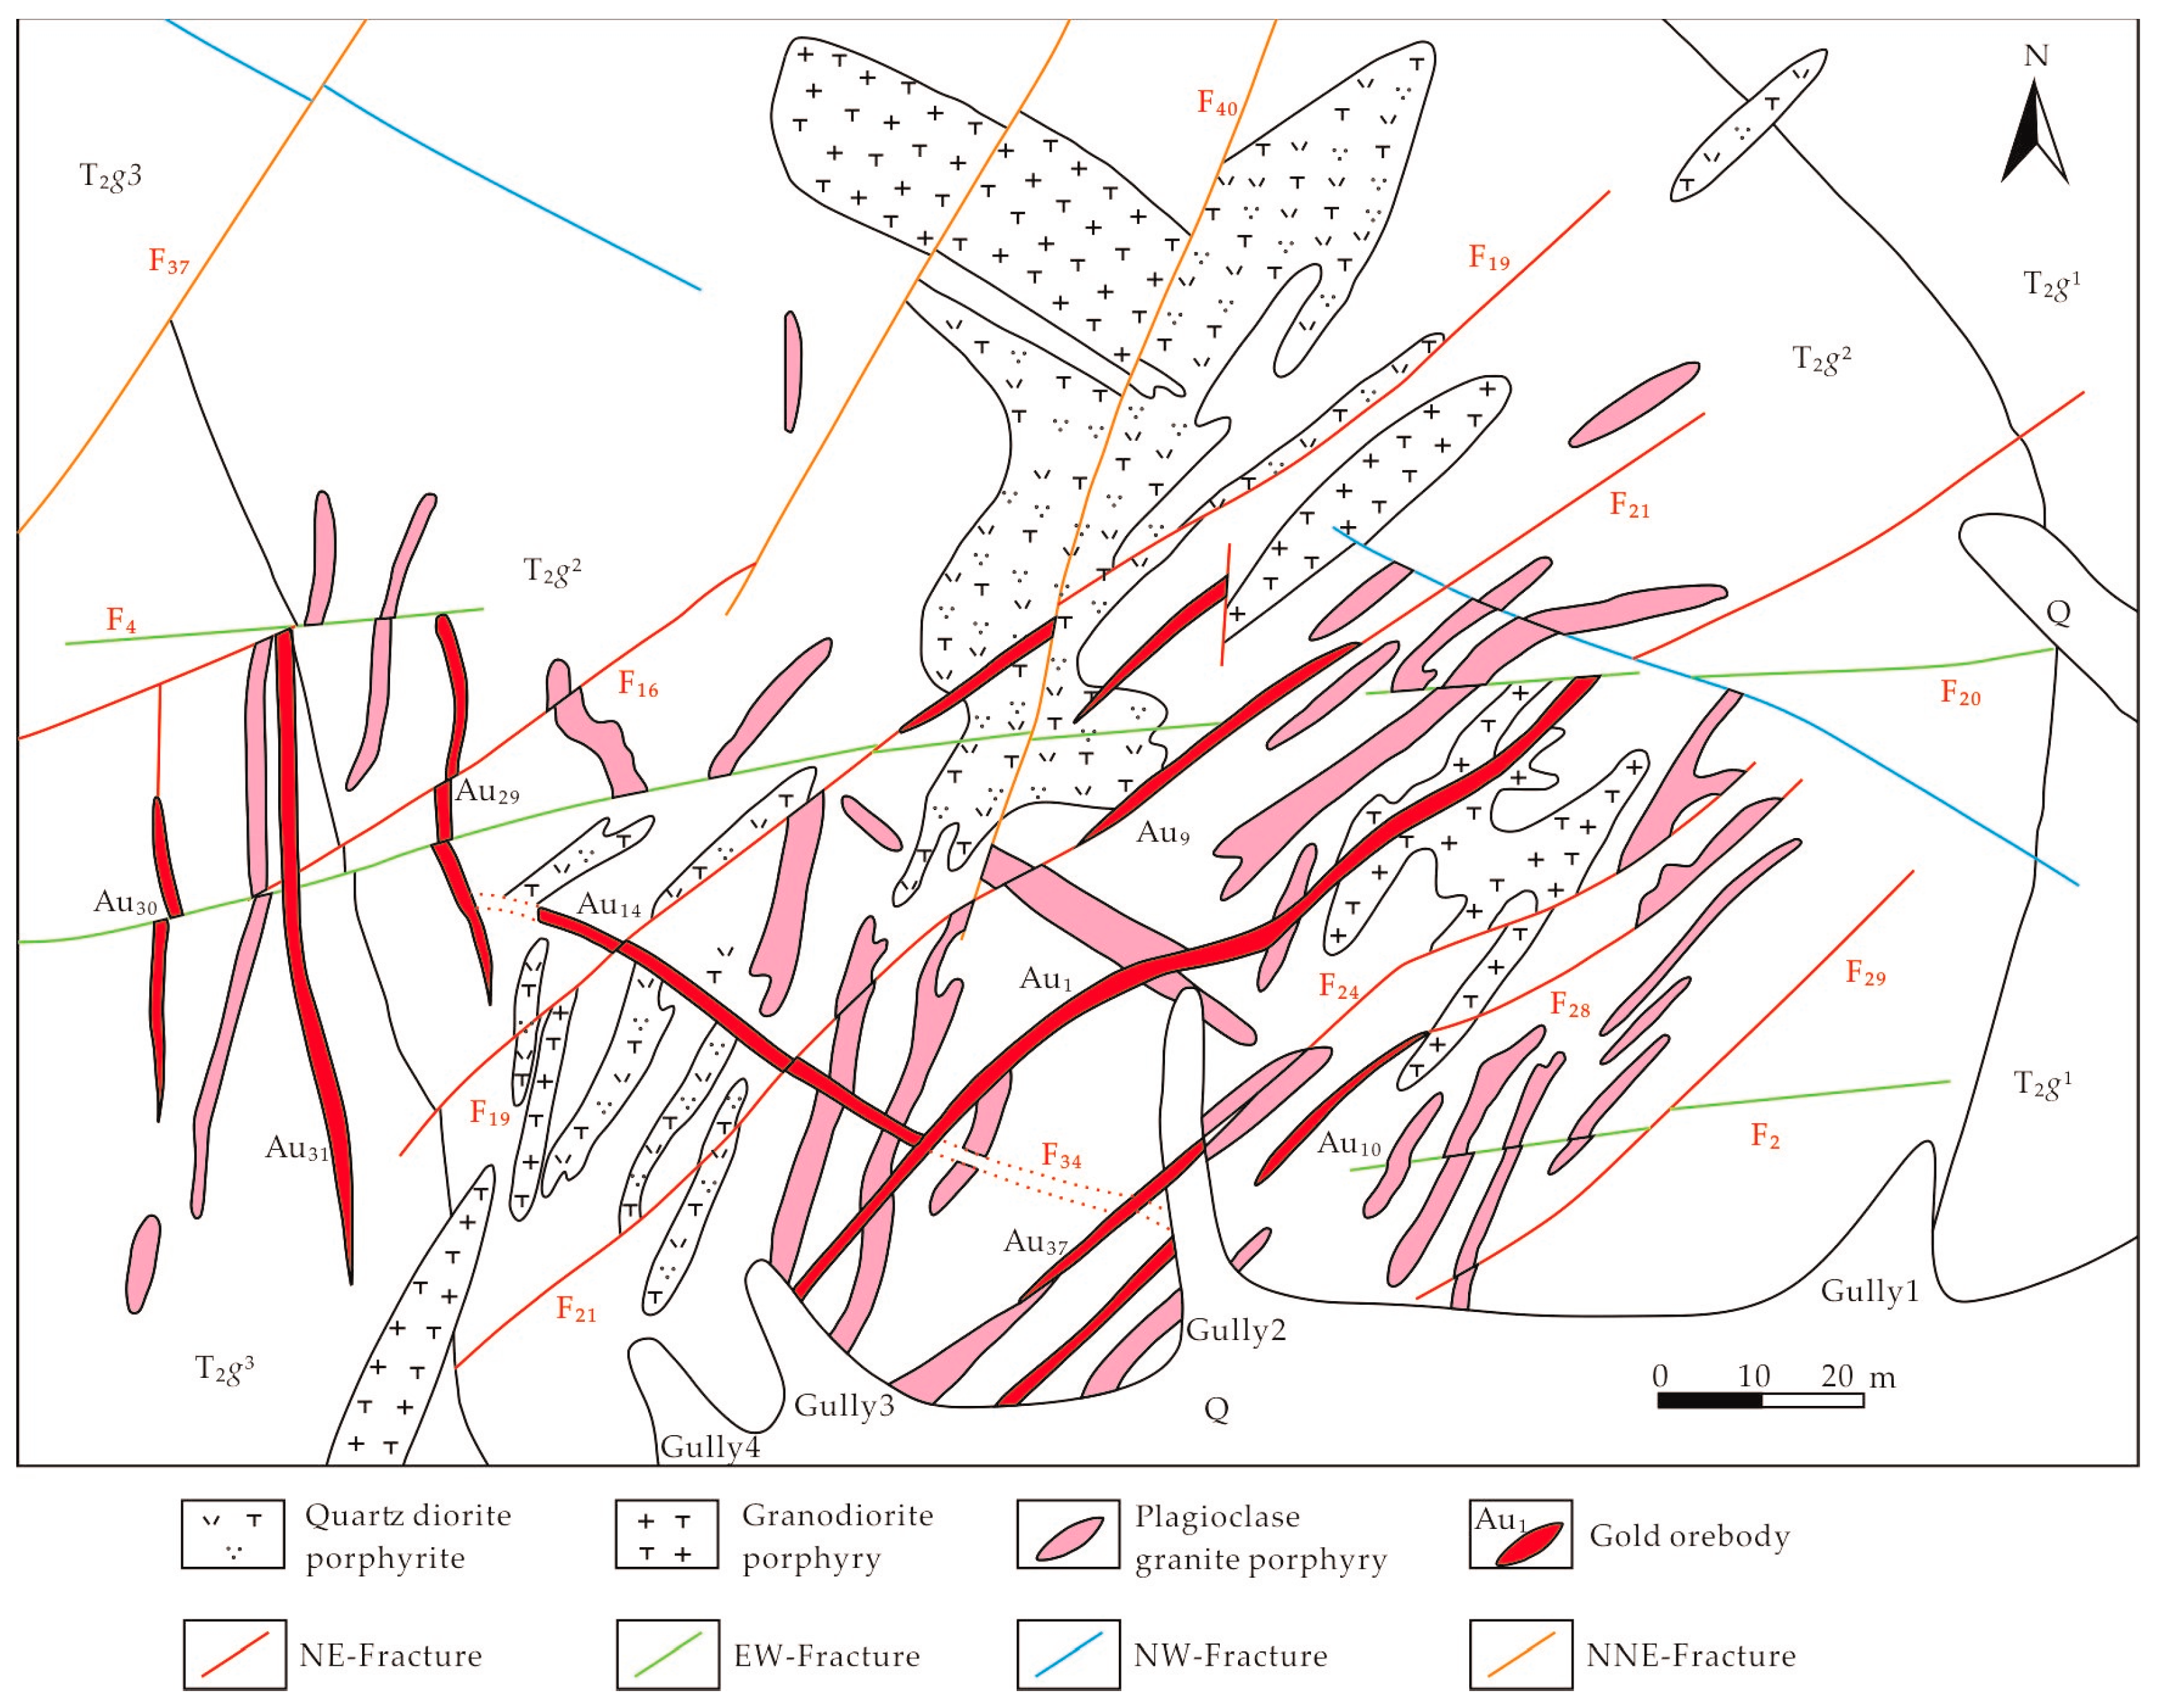
Figure 3.
Designing the 3D convolutional neural network (modified from reference [88]).
Figure 3.
Designing the 3D convolutional neural network (modified from reference [88]).
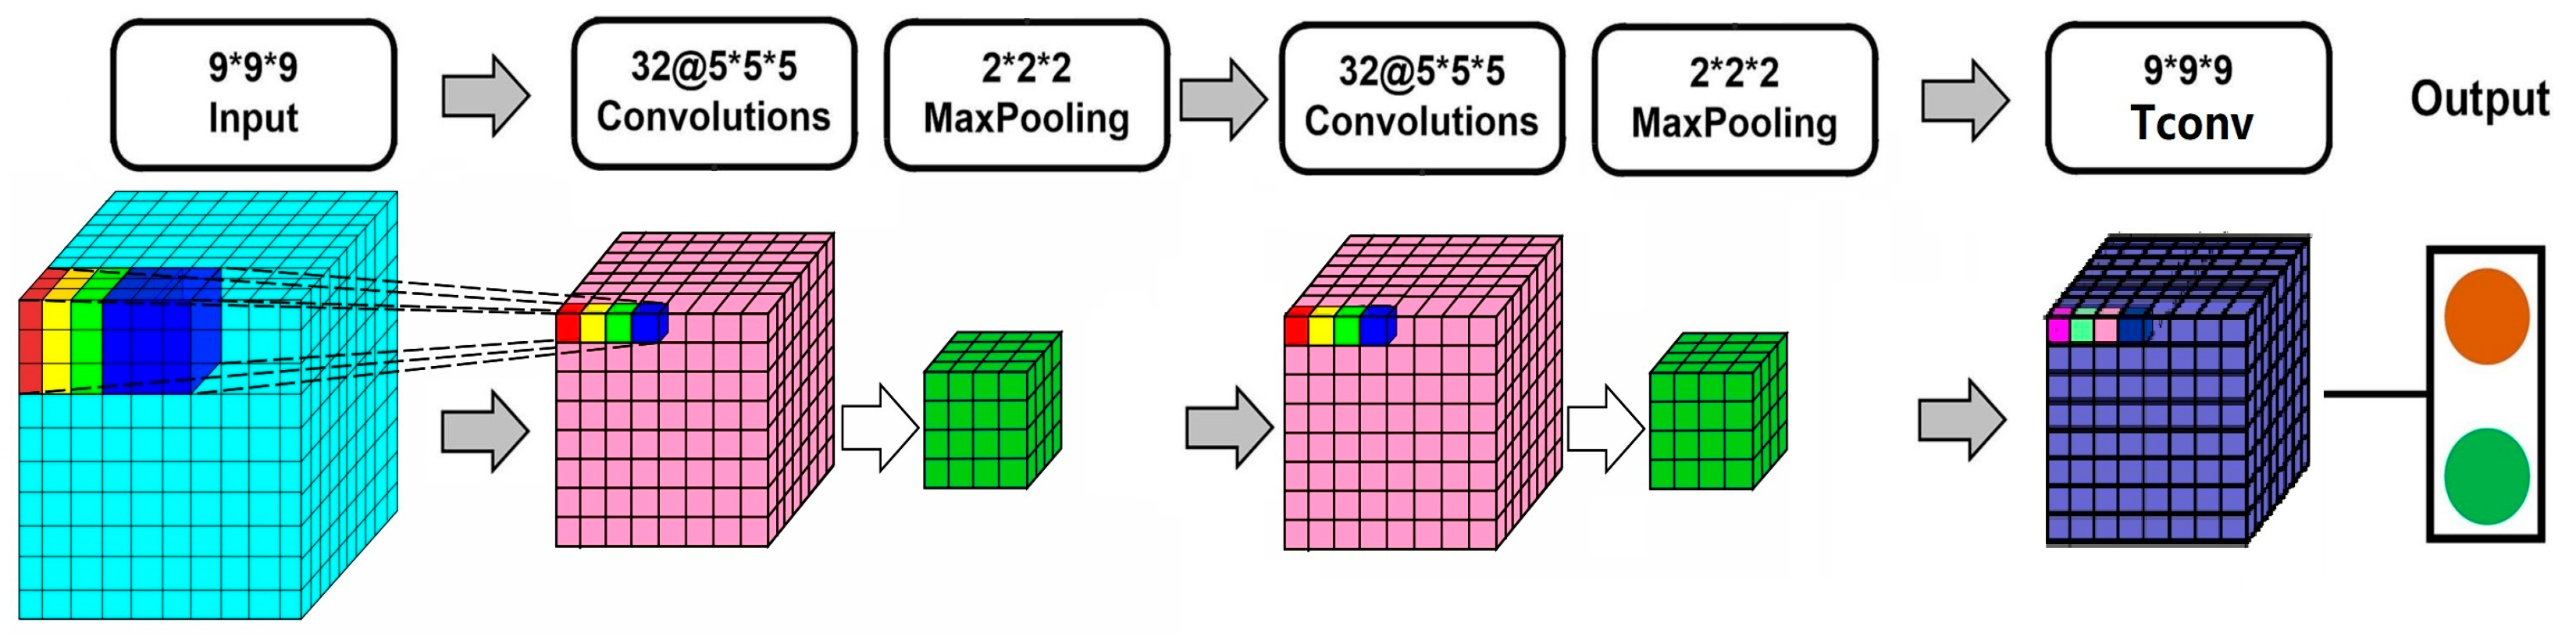
Figure 4.
The 3D model of drillings in Zaozigou gold deposit. (a) Plan view of drillings distribution. (b) Side view of drillings distribution. (c) Sample grade distribution of drillings.
Figure 4.
The 3D model of drillings in Zaozigou gold deposit. (a) Plan view of drillings distribution. (b) Side view of drillings distribution. (c) Sample grade distribution of drillings.
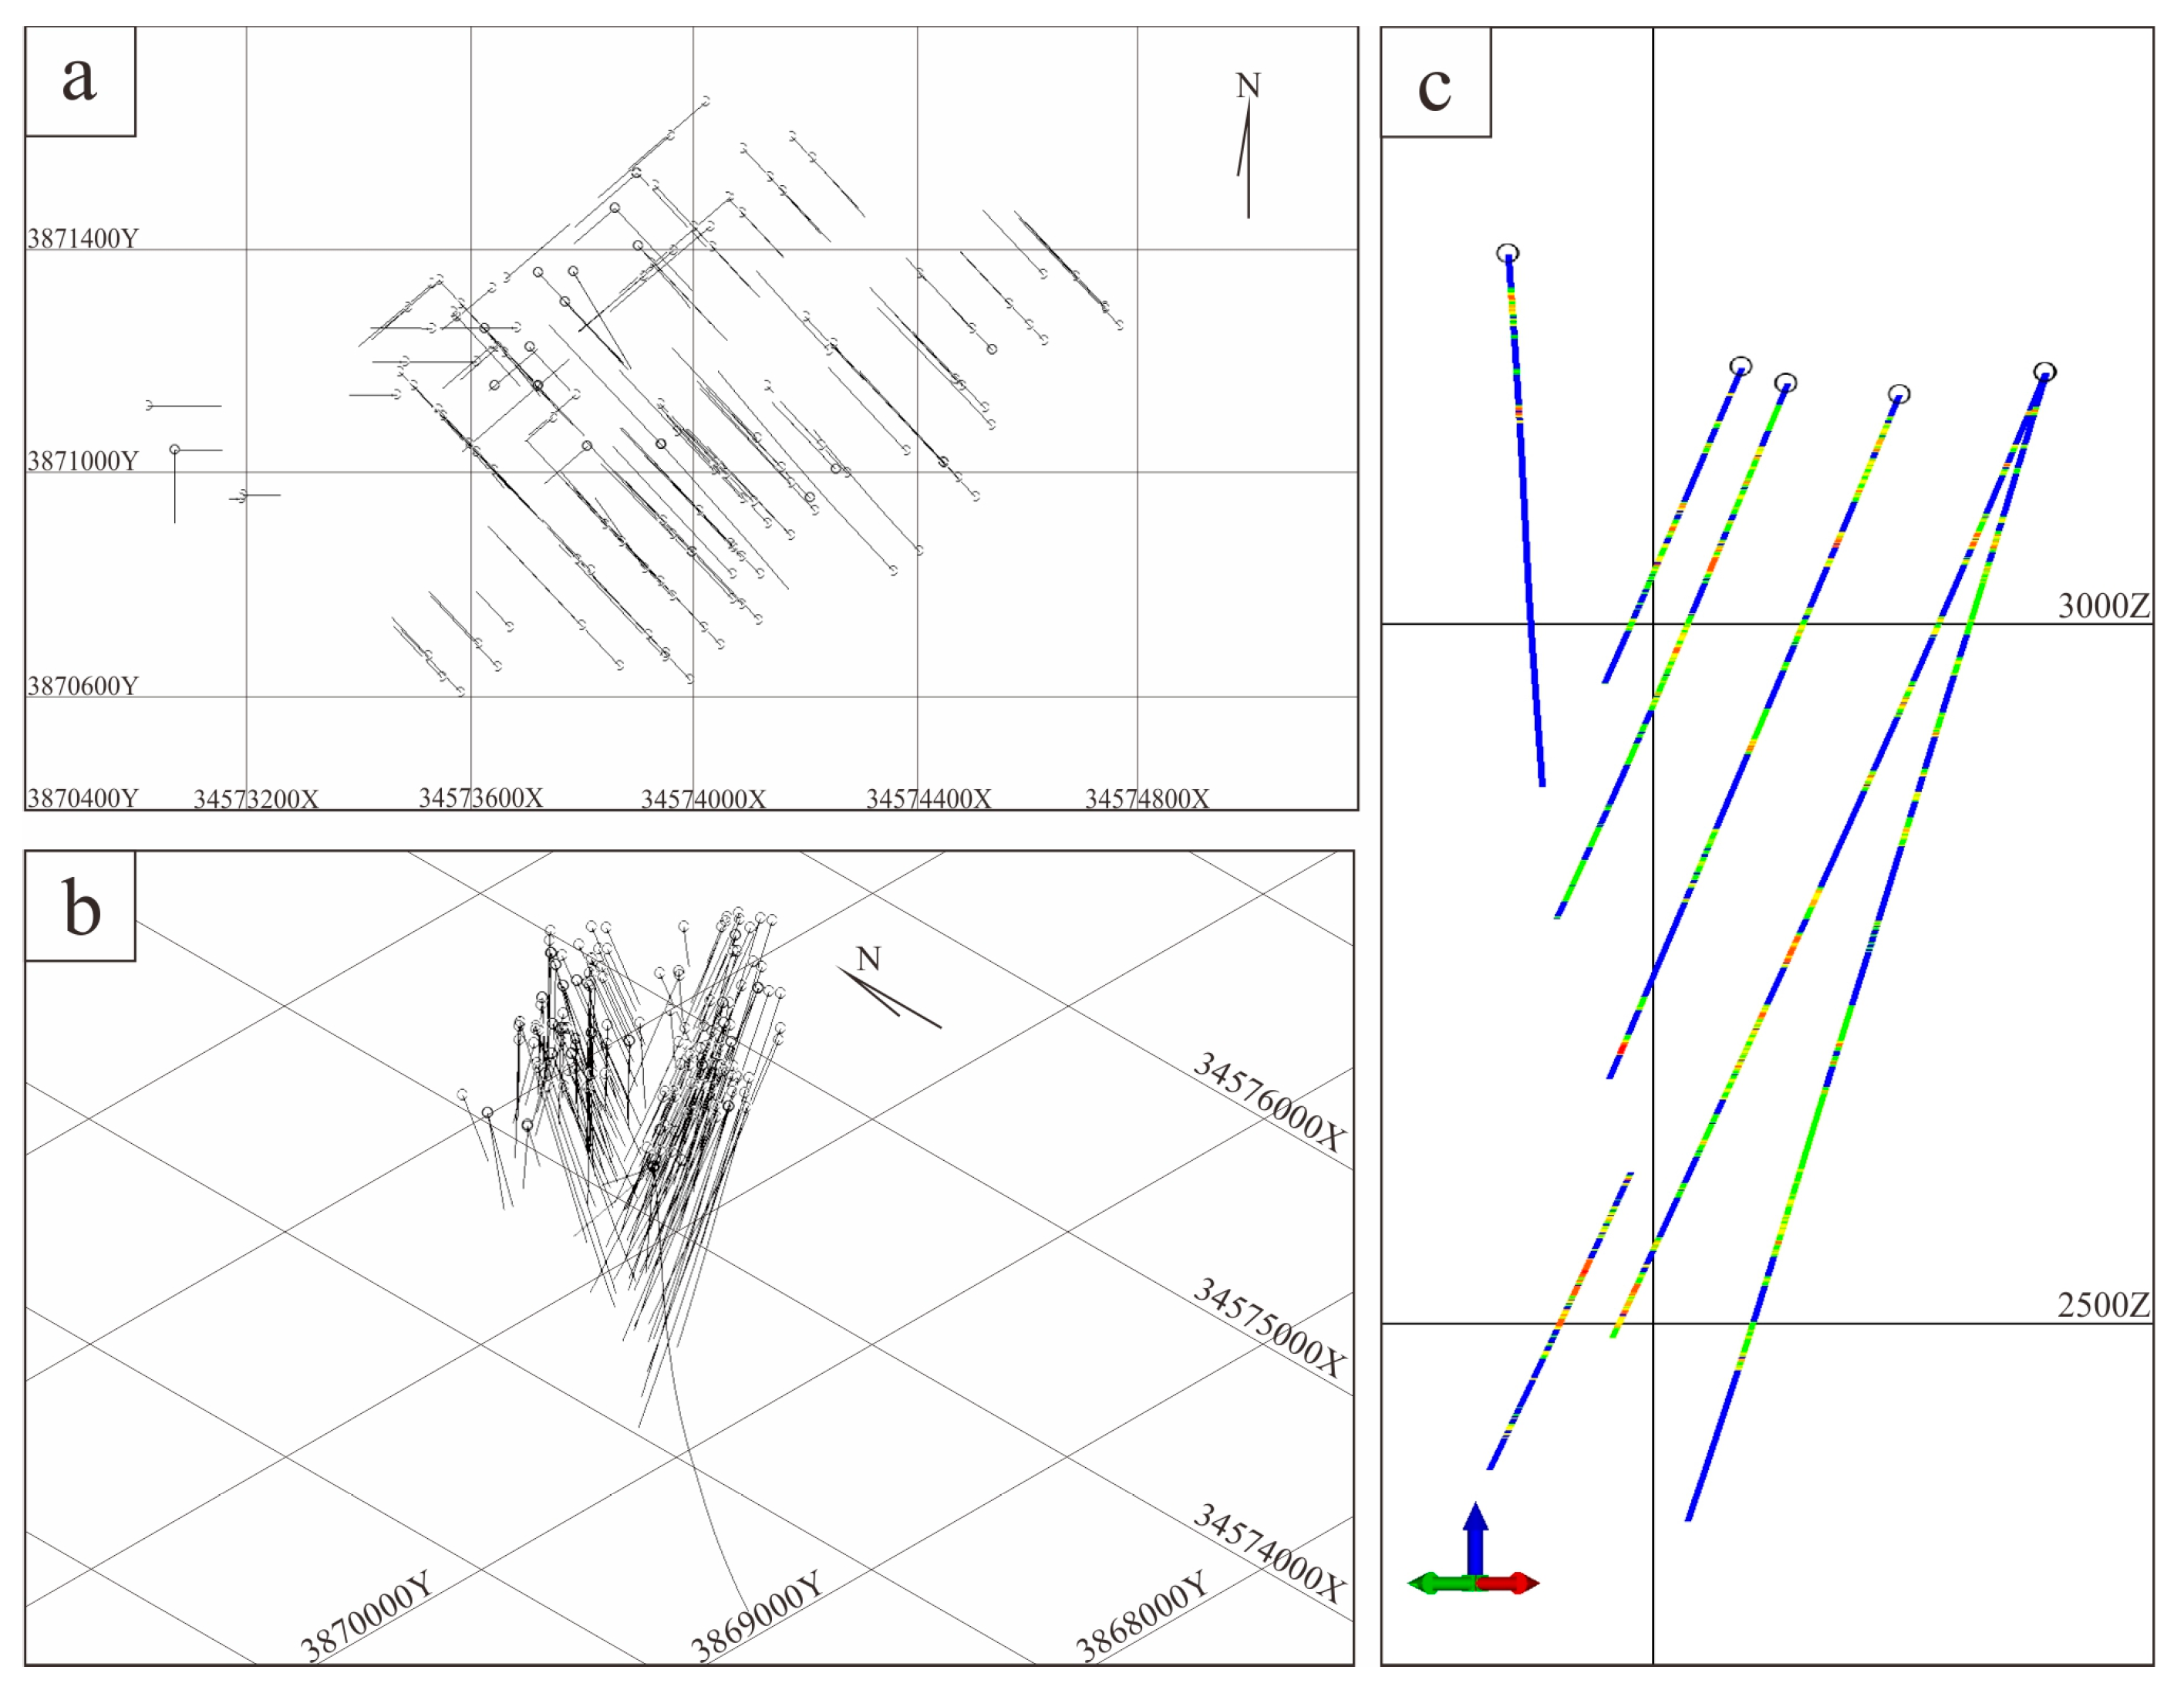
Figure 5.
Zaozigou orebody model. (a) Plan view. (b,c) Side view.
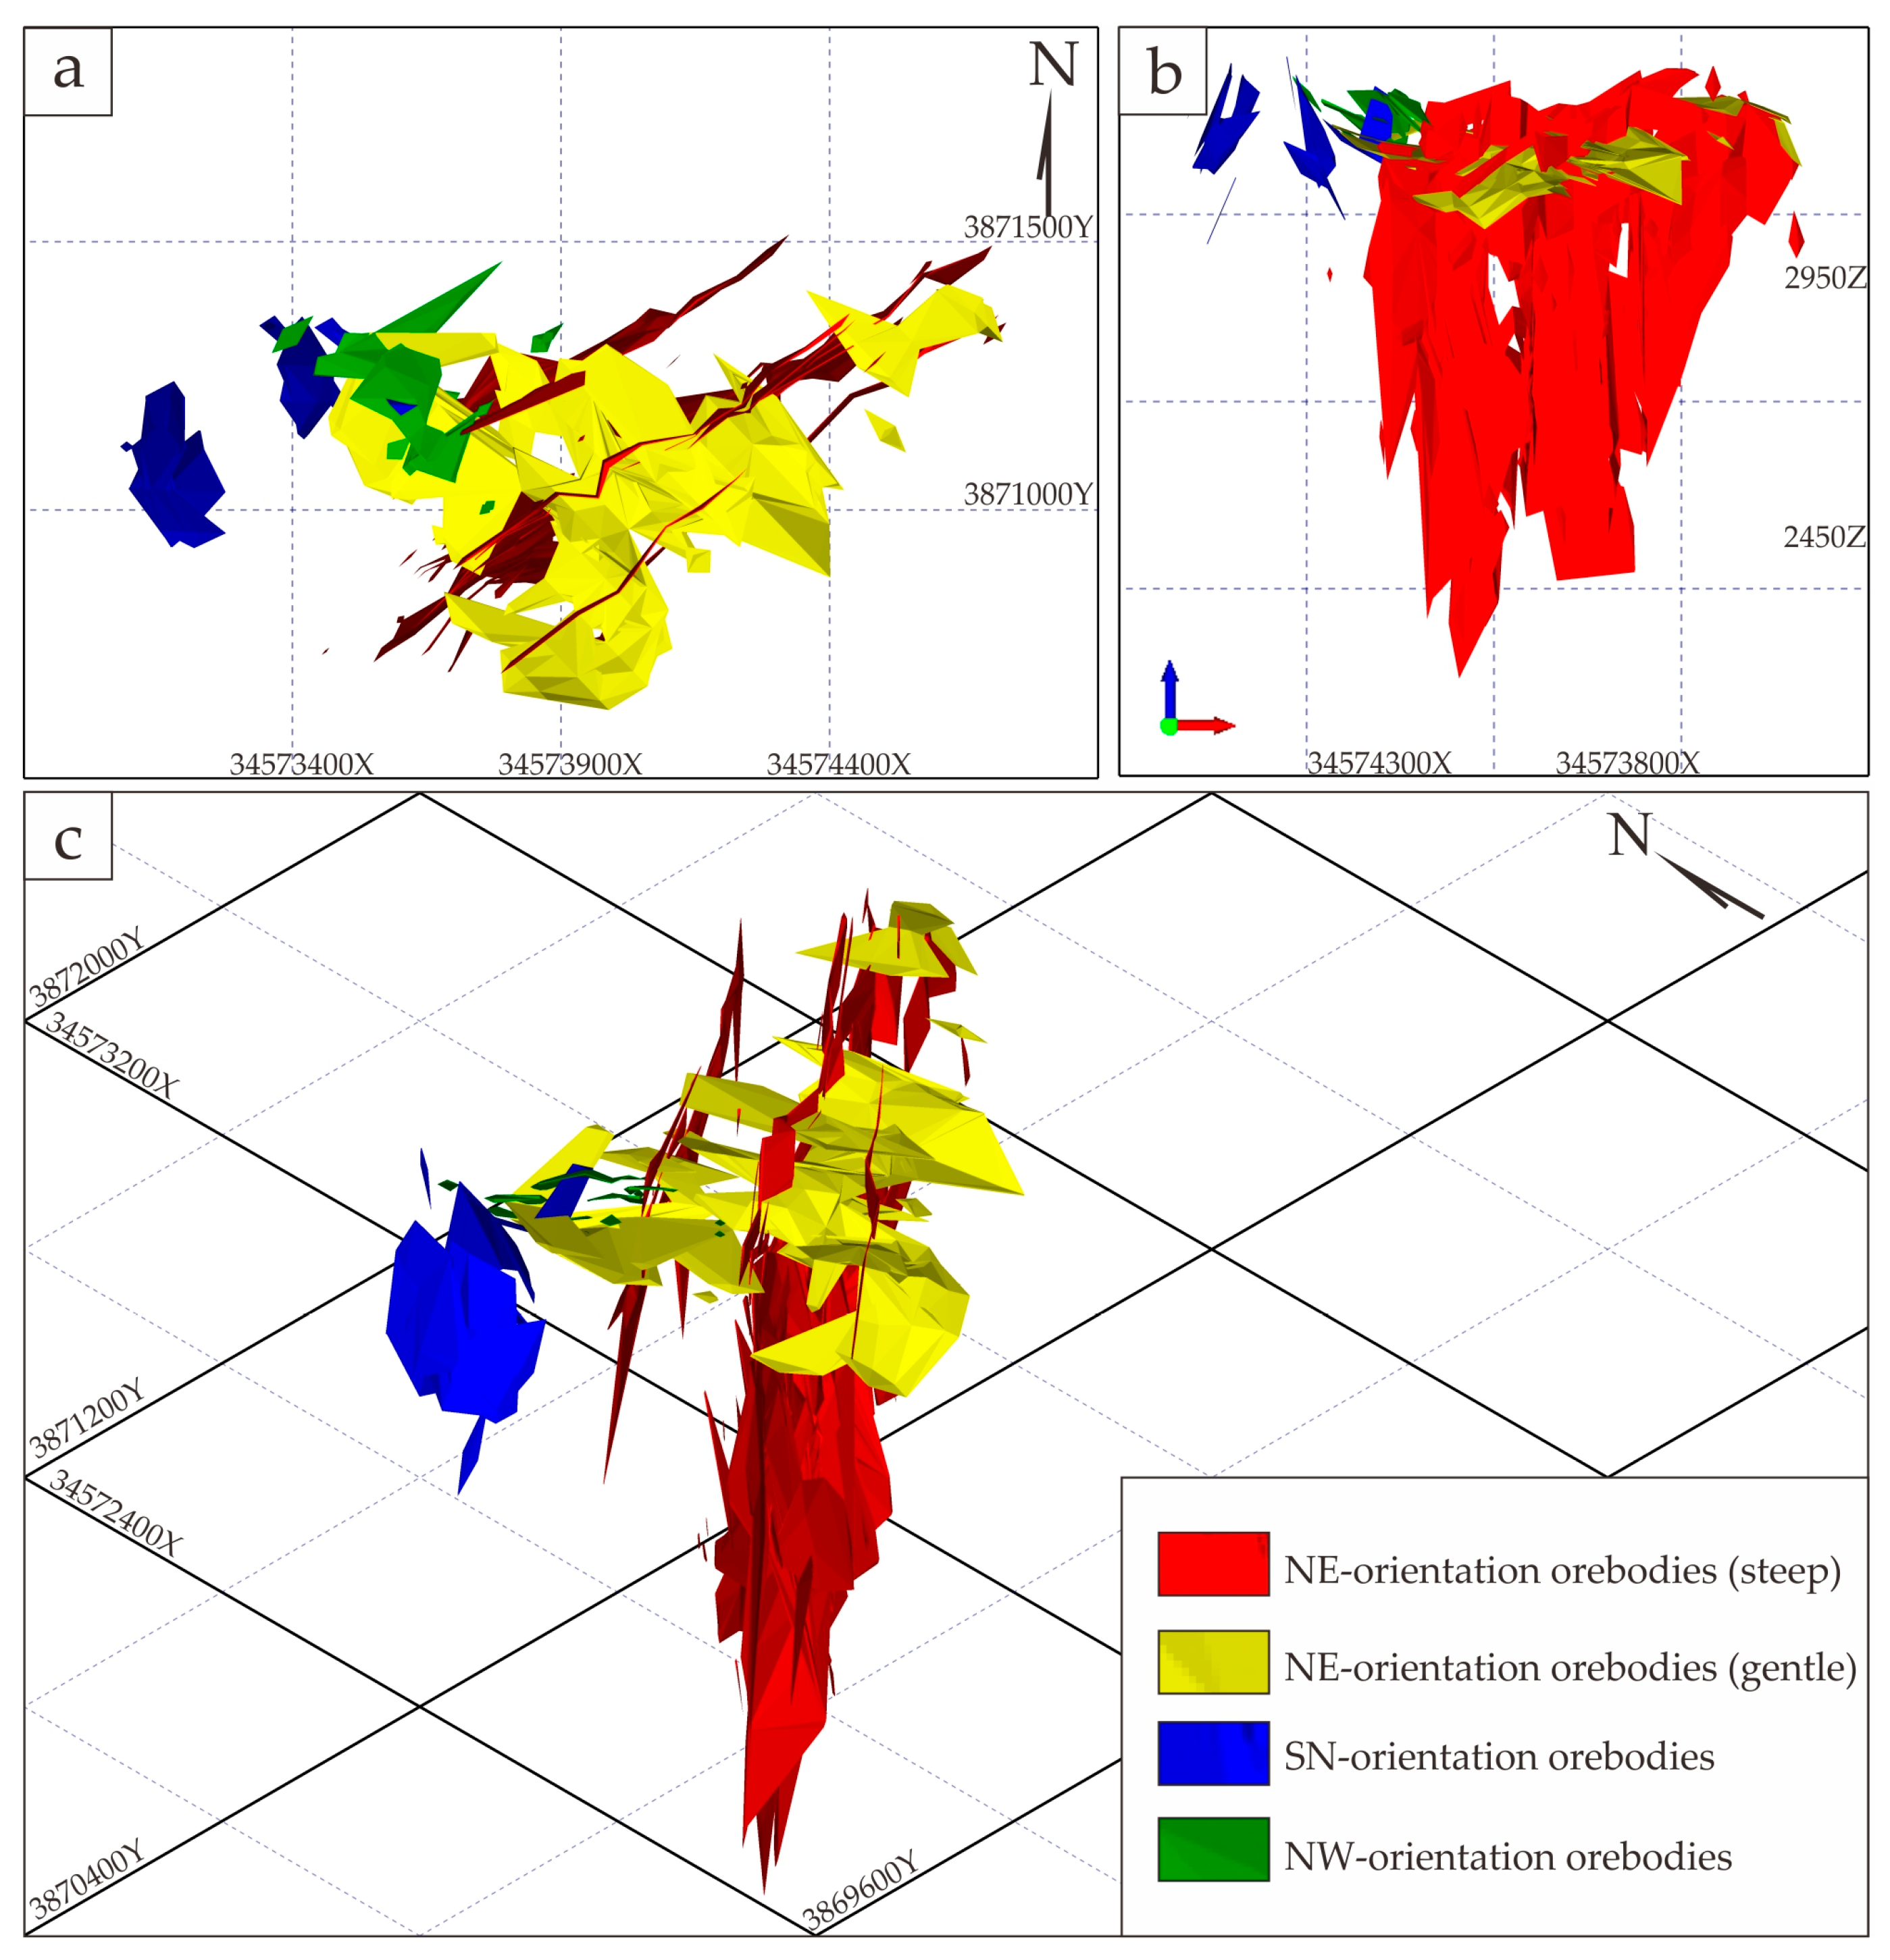
Figure 6.
The 3D fracture surface and 3D fracture model. (a) Plan view. (b,c) Side view.
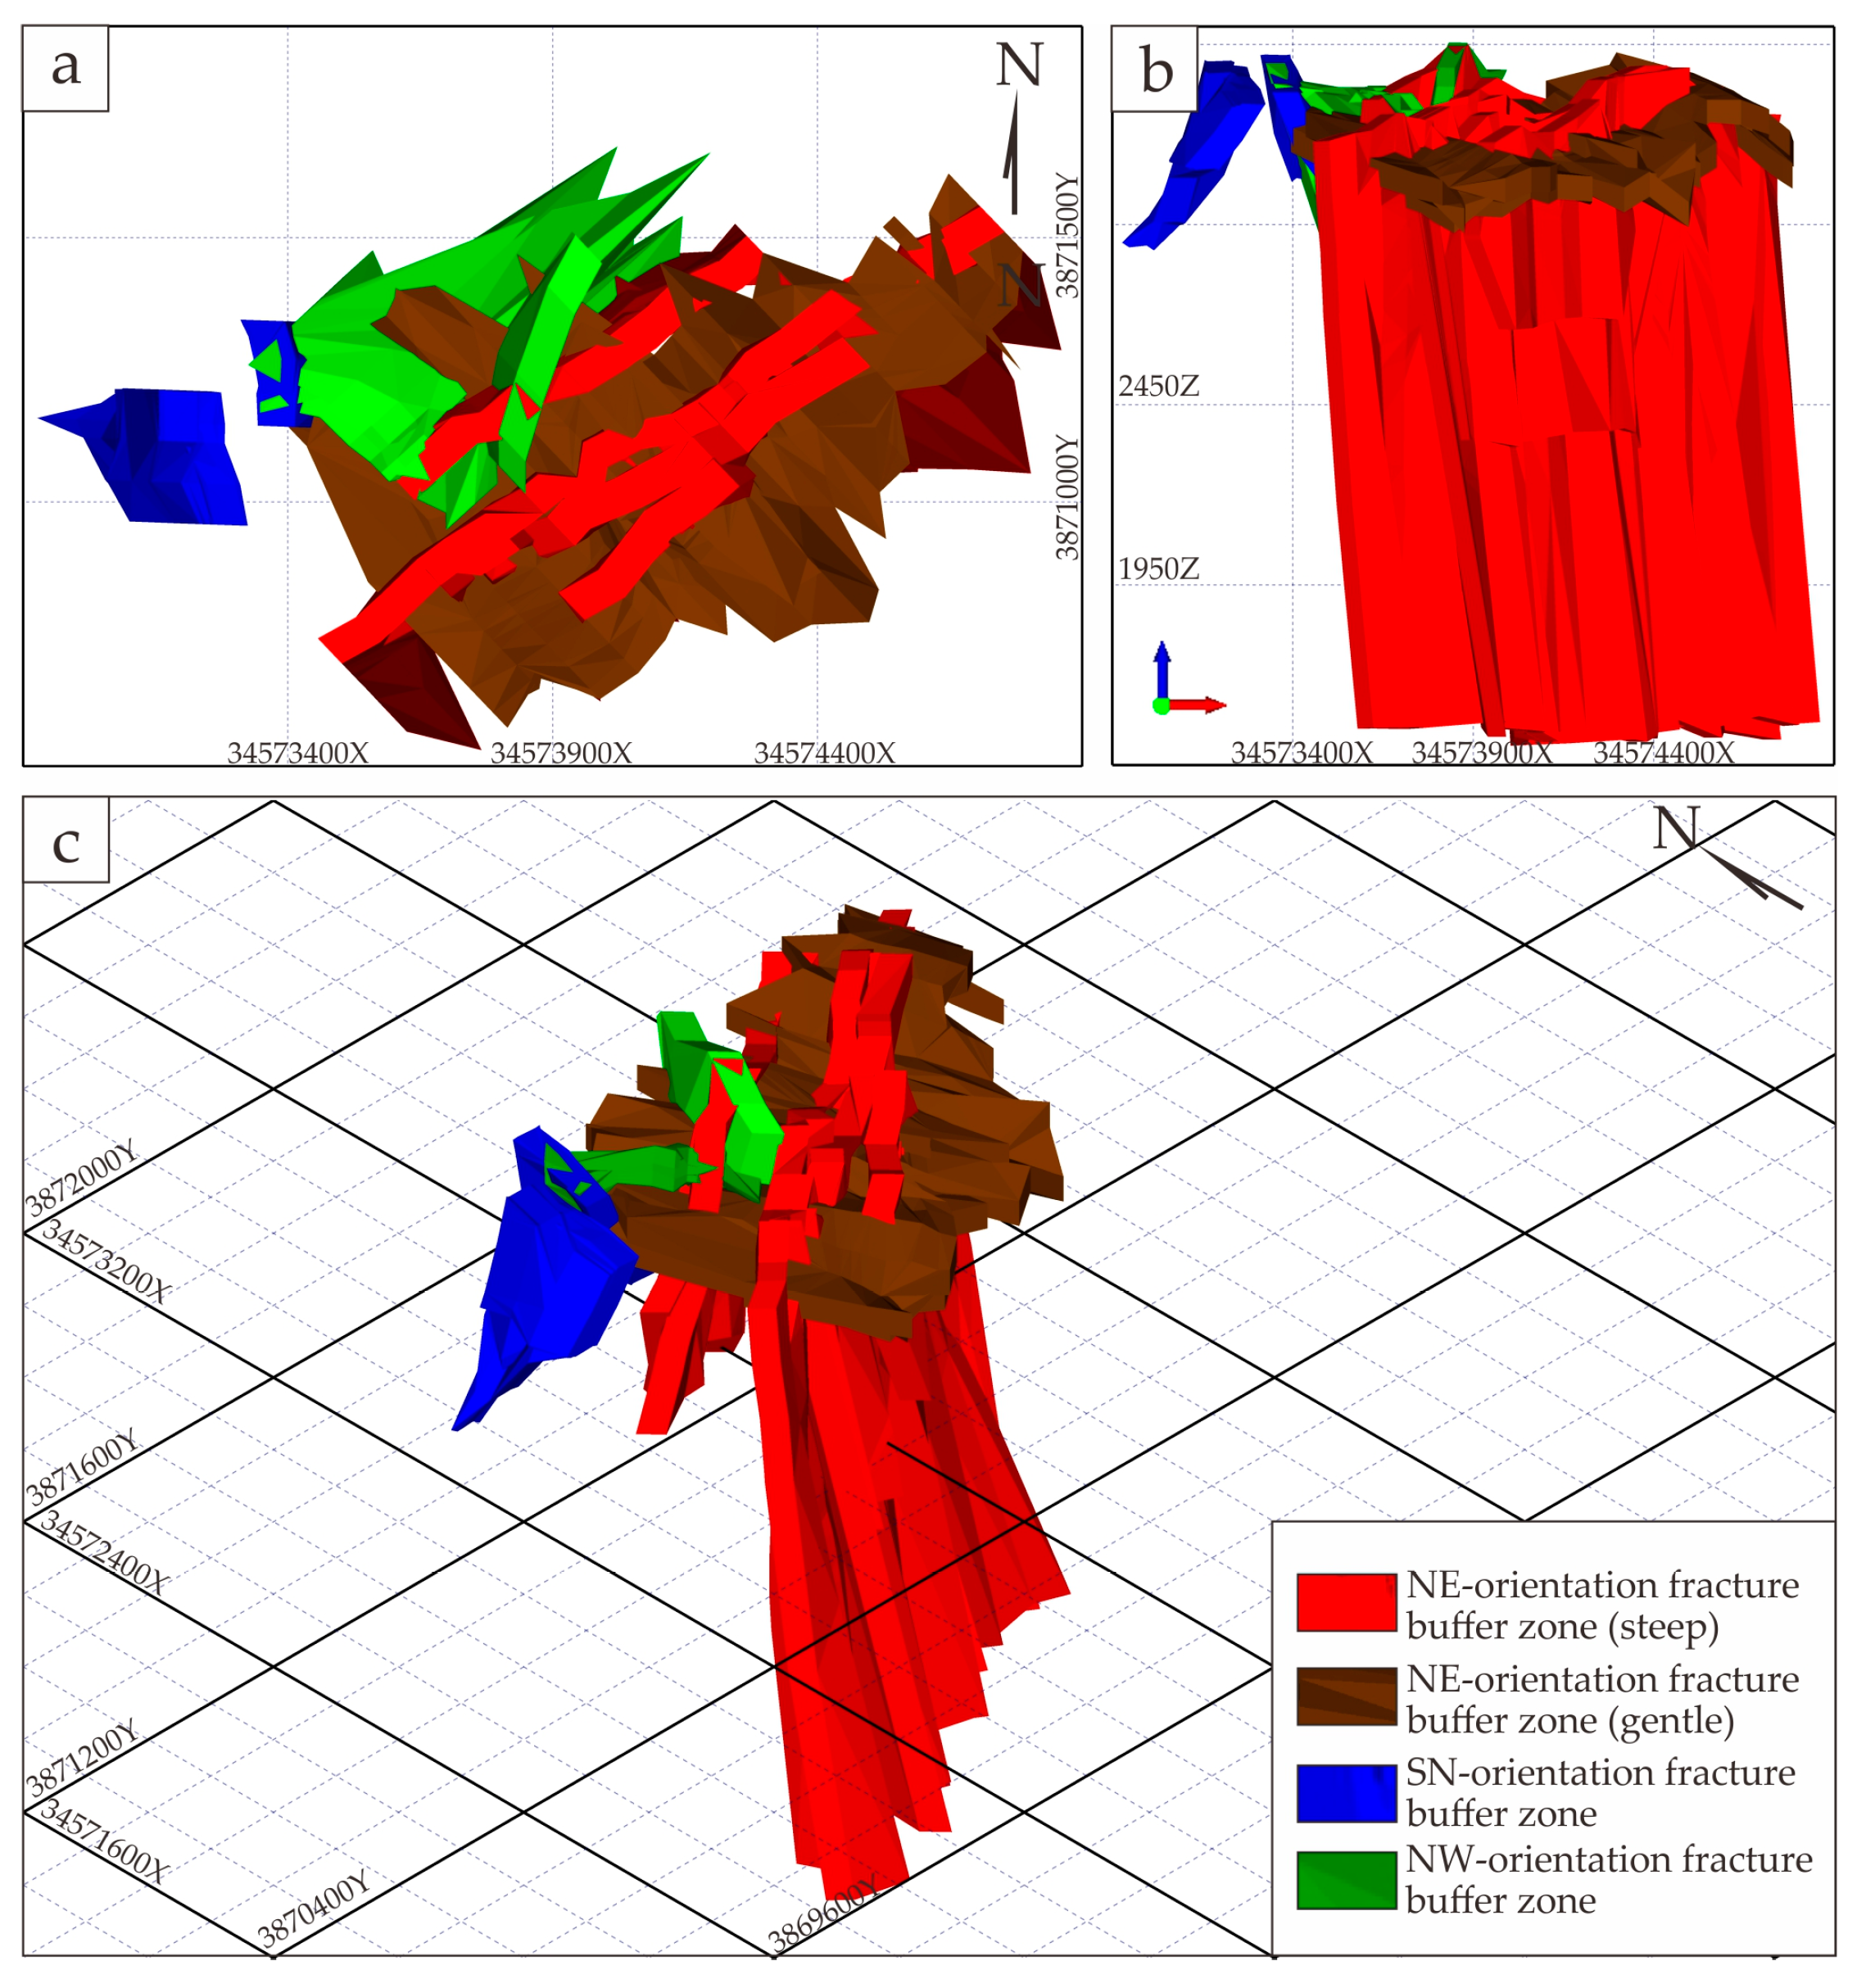
Figure 7.
Intrusive model of Zaozigou gold deposit. (a) Plan view. (b,c) Side view.

Figure 8.
Enrichment coefficient and variation coefficient diagram of Zaozigou gold deposit.
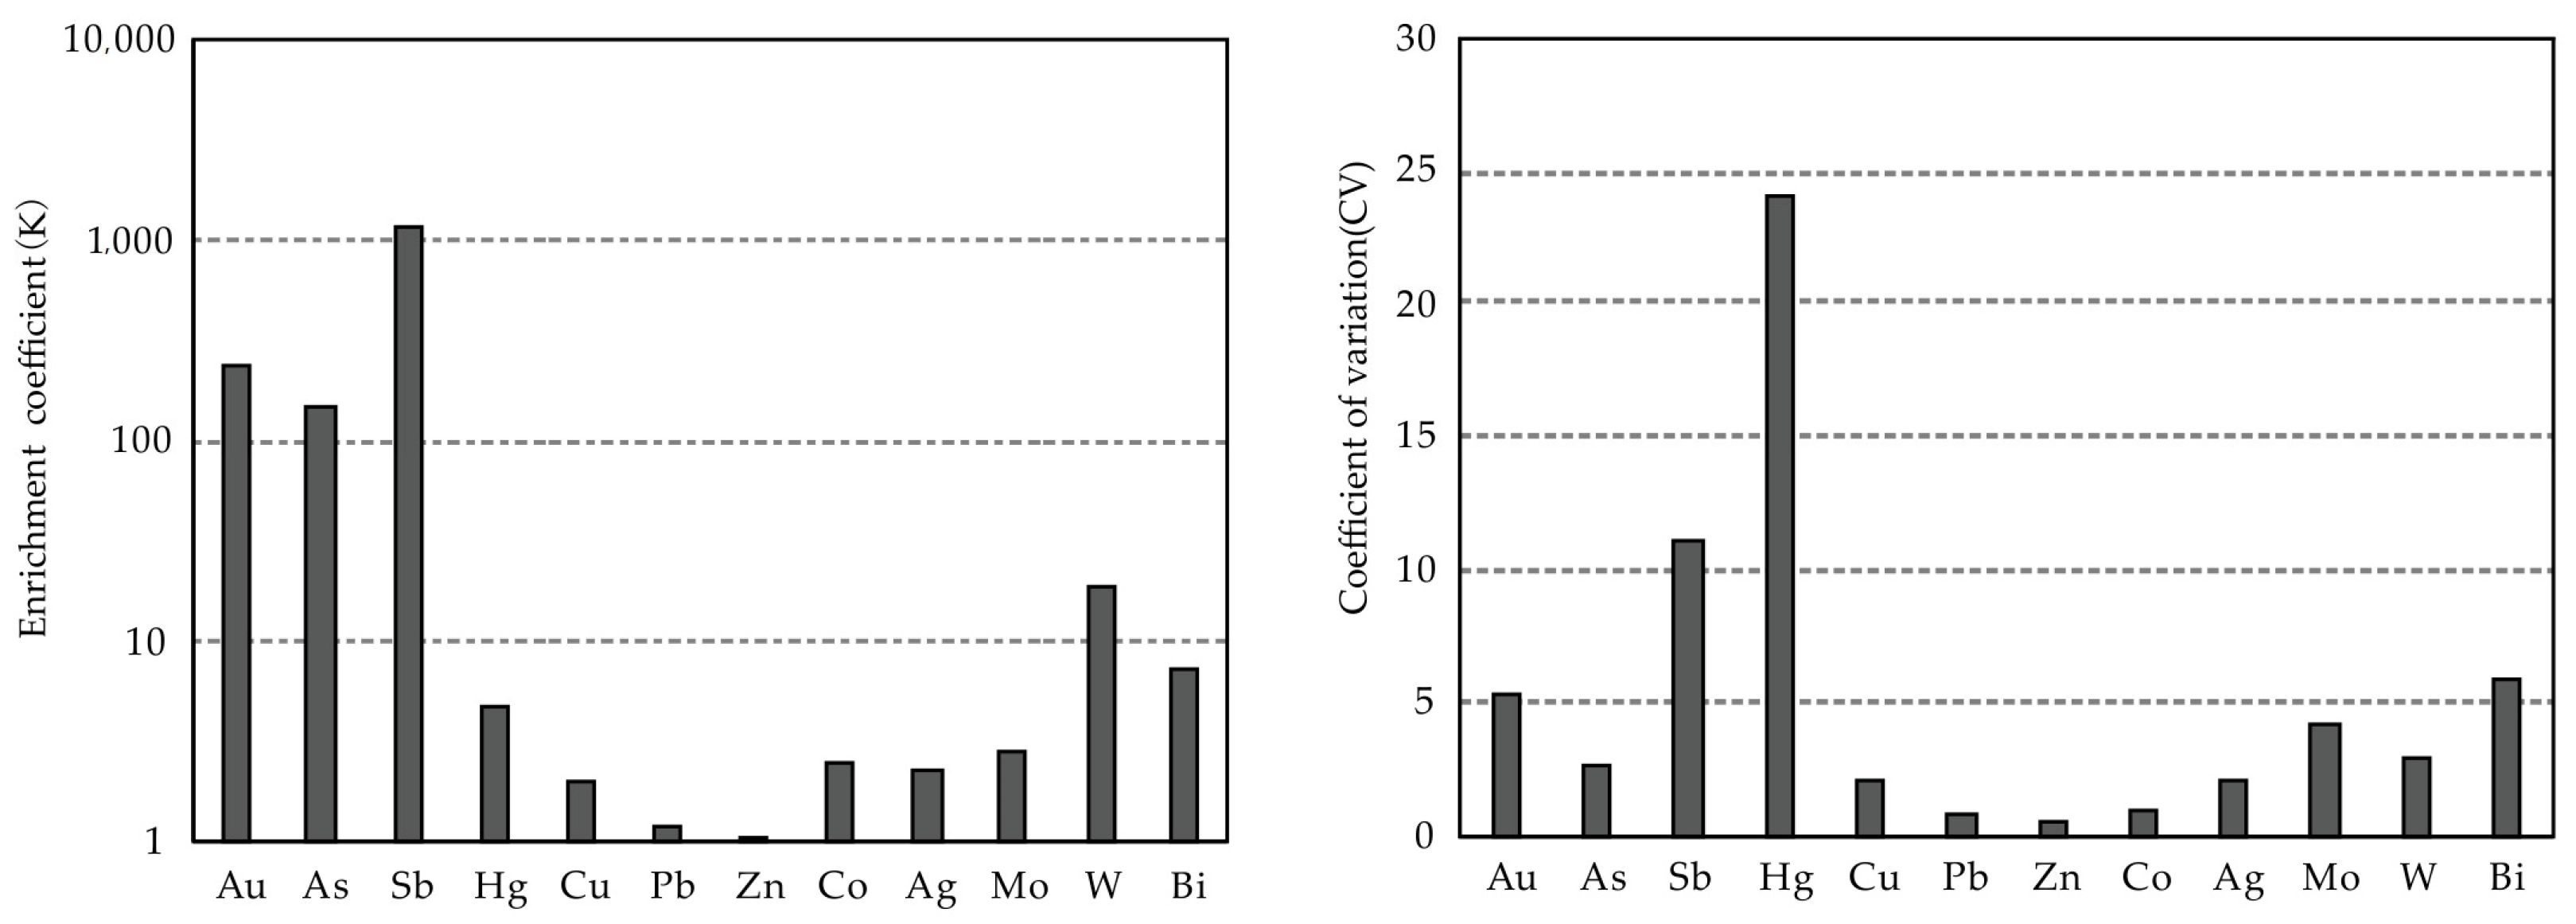
Figure 9.
Buffer zone of 30 m distance from fracture of Zaozigou gold deposit. (a) Buffer zone. (b) Buffer zone superimposed by orebodies.
Figure 9.
Buffer zone of 30 m distance from fracture of Zaozigou gold deposit. (a) Buffer zone. (b) Buffer zone superimposed by orebodies.
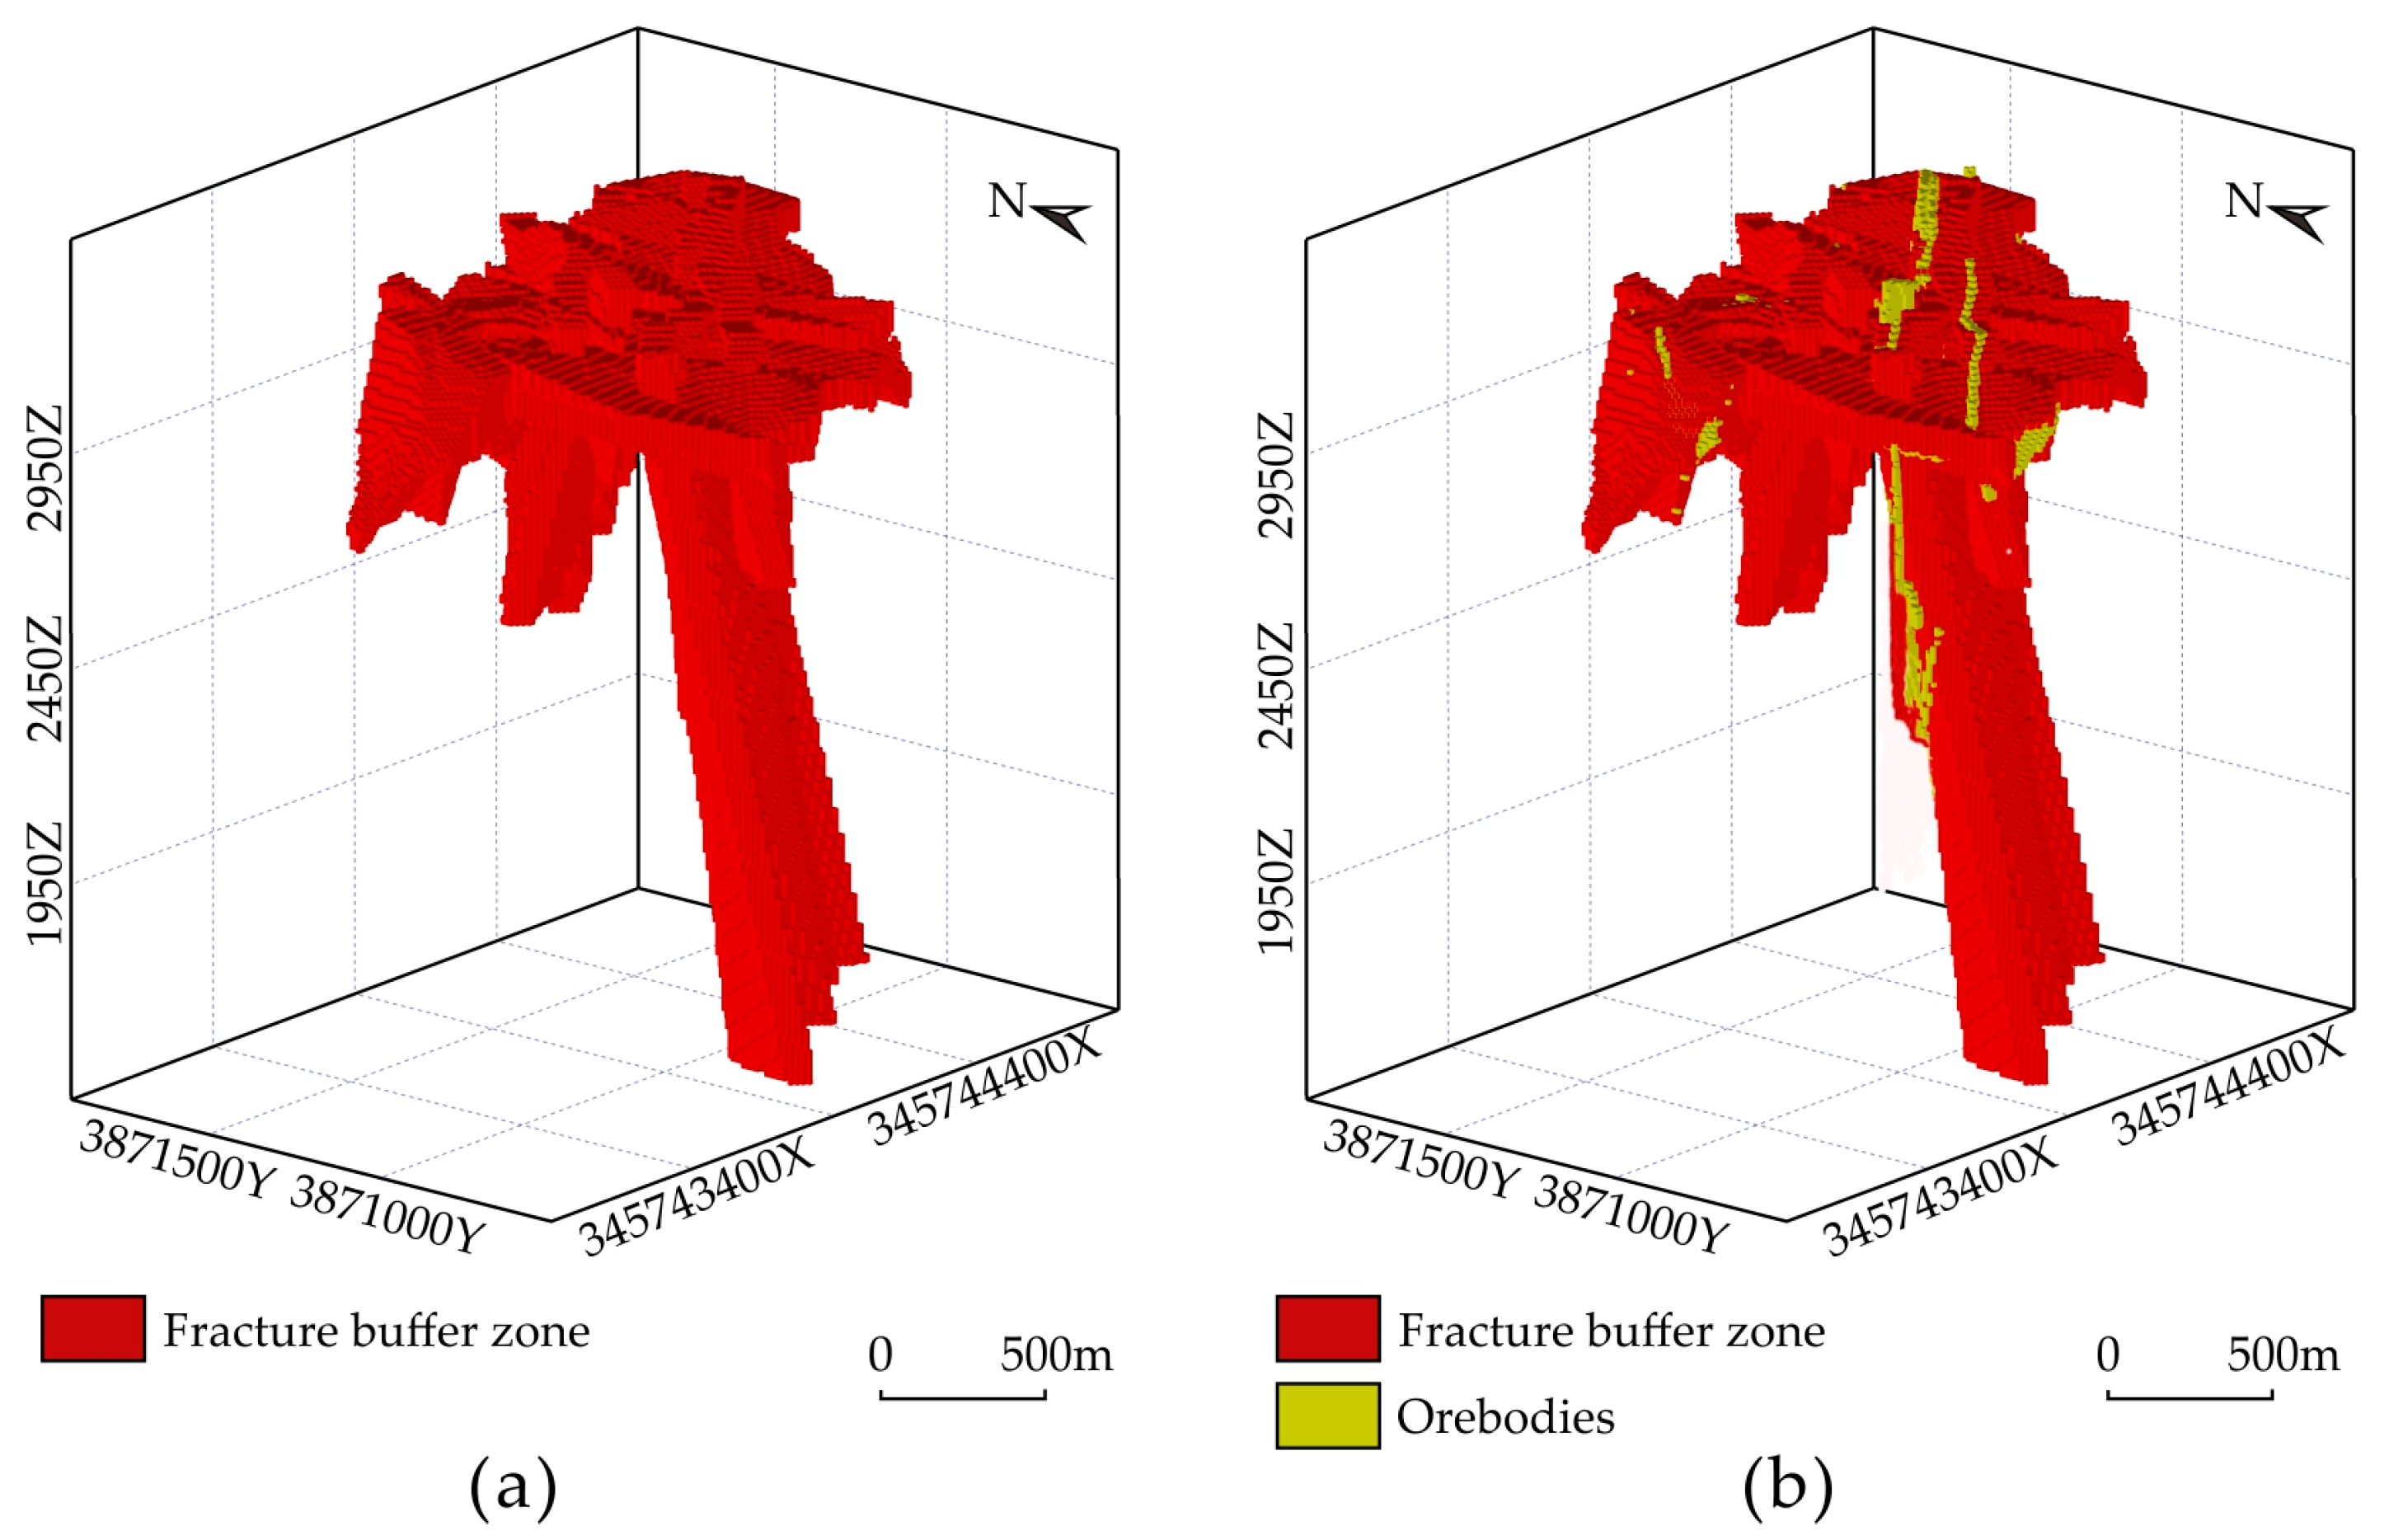
Figure 10.
Variogram fitting and search ellipsoid designing. (a) Main range orientation fitting. (b) Secondary range orientation fitting. (c) Vertical range orientation fitting; (d) Search ellipsoid.
Figure 10.
Variogram fitting and search ellipsoid designing. (a) Main range orientation fitting. (b) Secondary range orientation fitting. (c) Vertical range orientation fitting; (d) Search ellipsoid.
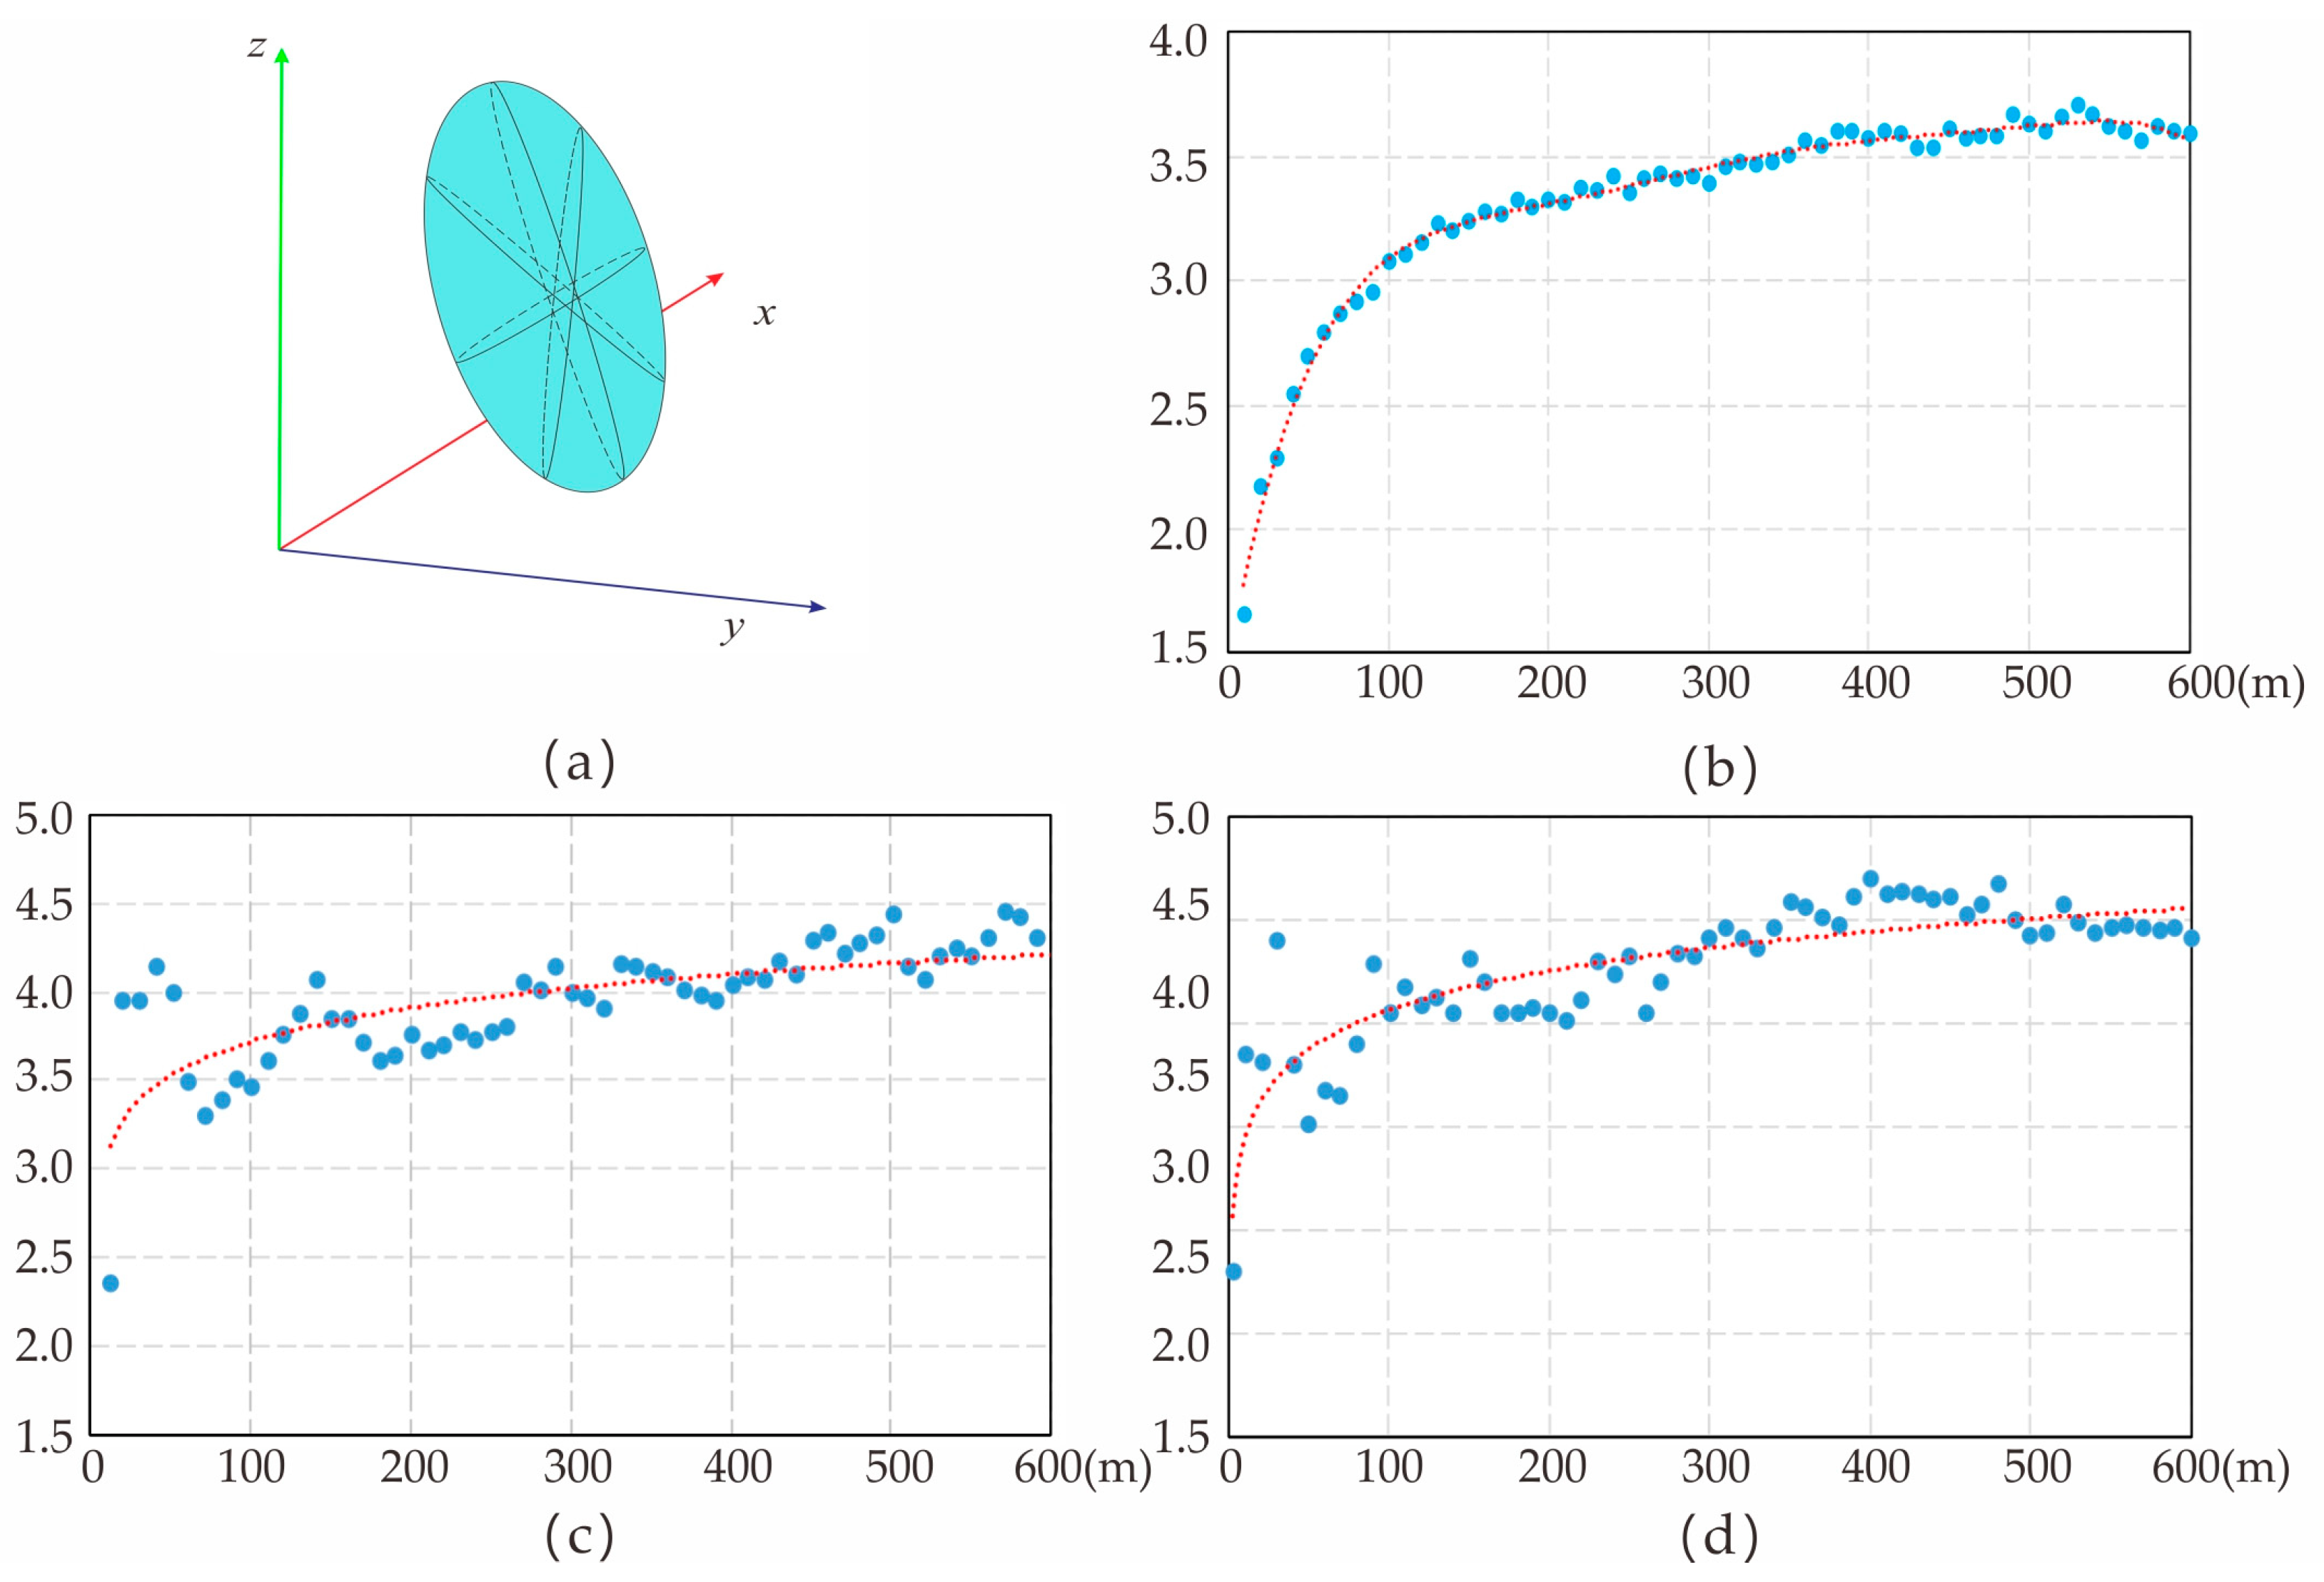
Figure 11.
The 3D geochemical model of elements.

Figure 12.
Three-dimensional prediction scope.

Figure 13.
(a) Training process binary classification loss and accuracy; (b) ROC curve graph.

Figure 14.
Deep mineral prediction map based on CNN. (a) Results without deepest drilling data of SDZK8314; (b) Results with the data of SDZK8314).
Figure 14.
Deep mineral prediction map based on CNN. (a) Results without deepest drilling data of SDZK8314; (b) Results with the data of SDZK8314).

Table 1.
Orebodies and ore-bearing fracture.
| Ore Block | Orientation | Fracture | Orebody |
|---|---|---|---|
| Eastern ore block | NE | F19~F27 | Au1, Au9, Au10, Au15, Au45, Au46, Au16, Au17, Au21, Au37, Au52, Au55 |
| NWW | F3 | M6, M4 | |
| Western ore block | NW | F42, F41, F34 | Au14 |
| N–S | F13~F11, F9~F8 | Au29, Au31 |
Table 2.
Dataset of Zaozigou gold deposit.
| Category | Description |
|---|---|
| Geological map | Topographic-geological map with the scale of 1:2000 |
| Horizontal section map | Horizontal section maps of elevations of 2450 m, 2530 m, 3610 m, 2850 m, 3010 m, 3050 m, 3090 m, and 3170 m |
| Geological profile | NE-orientation geological profiles of exploration lines of 54#, 58#, 62#, 66#, 70#, 74#, 78#, 81#, 89#, 93#, 96#, 98#, 100#, 102#, 106#, 110#, 114#, 118#, 120#, 128# |
| NW-orientation geological profiles of exploration lines of 192#, 196#, 199#, 200#, 202#, 204#, 208#, 212#, 216# | |
| N–S-orientation geological profiles of exploration lines of 283#, 287#, 291#, 292#, 295#, 298#, 302# | |
| Drilling log | 72 drillings |
| Geochemical data | 5028 samples; 12 elements of Ag, As, Au, Cu, Hg, Pb, Zn, Sb, W, Bi, Co, and Mo |
Table 3.
Descriptive statistical analysis of drilling core data of Zaozigou Gold Mine.
| Element | Minimum | Mean | Median | Maximum | Standard Deviation | Anomaly Threshold | K | CV |
|---|---|---|---|---|---|---|---|---|
| Au | 0.15 | 202.53 | 11 | 35,300 | 1064.67 | 2331.87 | 238.27 | 5.26 |
| As | 0.5 | 639.1 | 95.6 | 25,140 | 1677.3 | 3993.6 | 145.25 | 2.62 |
| Sb | 0.05 | 391.12 | 21.4 | 130,300 | 4329.22 | 9049.57 | 1150.35 | 11.07 |
| Hg | 0 | 58 | 23 | 94,931 | 1397 | 2852 | 4.86 | 23.96 |
| Cu | 0.5 | 34.1 | 28.6 | 3418 | 67.4 | 168.8 | 2 | 1.98 |
| Pb | 0.8 | 22.8 | 20.3 | 381.8 | 16.6 | 56.1 | 1.2 | 0.73 |
| Zn | 1.9 | 71.3 | 74.1 | 317 | 34.8 | 140.8 | 1.05 | 0.49 |
| Co | 0.1 | 24.5 | 17.5 | 142.6 | 22.5 | 69.5 | 2.45 | 0.92 |
| Ag | 0.007 | 0.136 | 0.088 | 9.795 | 0.272 | 0.68 | 2.27 | 2 |
| Mo | 0.01 | 1.75 | 0.44 | 304.05 | 7.3 | 16.34 | 2.82 | 4.18 |
| W | 0.05 | 17.75 | 7.5 | 1639.75 | 51.48 | 120.71 | 18.3 | 2.9 |
| Bi | 0 | 1.29 | 0.46 | 337.5 | 7.49 | 16.27 | 7.14 | 5.83 |
Note: The units of Ag, Au, and Hg is 10−9; the rest of the elements are in units of 10−6.
Table 4.
Parameters of experimental variogram in different range orientations.
| Orientation | Lag (m) | Angular Tolerance | Number of Point Pairs | Nugget | Cumulative Sill | Range (m) |
|---|---|---|---|---|---|---|
| Main orientation | 10 | 22.5° | 60 | 1.65 | 1.89 | 230 |
| Secondary orientation | 10 | 22.5° | 60 | 2.26 | 1.87 | 220 |
| Vertical orientation | 10 | 22.5° | 60 | 2.12 | 1.88 | 110 |
Table 5.
Cumulative frequency of the natural logarithm of element content data.
| Element | Cumulative Frequency | ||||||||
|---|---|---|---|---|---|---|---|---|---|
| 5% | 15% | 25% | 40% | 60% | 75% | 85% | 95% | 100% | |
| ln(Au) | −0.11 | 0.69 | 1.19 | 1.93 | 3.00 | 4.22 | 5.27 | 6.89 | 11.24 |
| ln(As) | 2.23 | 2.91 | 3.38 | 4.04 | 5.14 | 6.07 | 6.91 | 8.09 | 10.13 |
| ln(Sb) | 0.26 | 1.17 | 1.80 | 2.57 | 3.43 | 4.07 | 4.66 | 6.02 | 11.78 |
| ln(Hg) | 2.18 | 2.53 | 2.73 | 2.97 | 3.29 | 3.61 | 3.94 | 4.63 | 11.46 |
| ln(Cu) | 2.08 | 2.54 | 2.86 | 3.21 | 3.49 | 3.67 | 3.86 | 4.28 | 8.14 |
| ln(Pb) | 2.01 | 2.51 | 2.73 | 2.91 | 3.10 | 3.25 | 3.38 | 3.74 | 5.94 |
| ln(Zn) | 2.69 | 3.33 | 3.94 | 4.20 | 4.45 | 4.57 | 4.65 | 4.77 | 5.76 |
| ln(Co) | 2.07 | 2.32 | 2.53 | 2.75 | 2.91 | 3.03 | 3.35 | 4.42 | 4.96 |
| ln(Ag) | −2.92 | −2.76 | −2.66 | −2.54 | −2.33 | −2.12 | −1.97 | −1.05 | 2.28 |
| ln(Mo) | −1.61 | −1.61 | −1.61 | −1.11 | −0.56 | 0.00 | 0.69 | 1.89 | 5.72 |
| ln(W) | 0.41 | 0.83 | 1.12 | 1.59 | 2.29 | 2.83 | 3.26 | 4.03 | 7.40 |
| ln(Bi) | −2.18 | −1.54 | −1.22 | −0.92 | −0.63 | −0.26 | 0.19 | 1.20 | 5.82 |
Table 6.
Prospecting prediction elements.
| Predictive Factors | Description of Variables | Variables | |
|---|---|---|---|
| Geology | Magmatic rocks | Concealed intermediate acidic intrusion, quartz diorite (porphyrite), high potassium calcium alkaline series | The three-dimensional model of quartz diorite porphyrite |
| Structures | Fault surface and fracture surface; lithologic interface | The 30 m structural buffer zone model | |
| Geochemistry | Element Combinations | Au, As, and Sb combination; Au content is above 15 × 10−9, Sb content is above 30 × 10−6, which are direct geochemical indicators for gold exploration | Au, As, and Sb |
| Primary Halo | As-Sb-Hg (front halo) → Au-Ag-Cu-Pb-Zn (near-ore halo) → W-Bi-Co-Mo (tail halo) | Au-Ag-Cu-Pb-Zn (As-Sb-Hg)/(W-Bi-Co-Mo) |
Table 7.
Cumulative frequency of the natural logarithm of element content data.
| Architecture | Feature Maps | Kernel Size | Strides | Padding | Channels |
|---|---|---|---|---|---|
| Input | 9, 9, 9 | 7 | |||
| Conv_1 | 5, 5, 5 | 3, 3, 3 | 2, 2, 2 | same | 14 |
| Conv_2 | 5, 5, 5 | 3, 3, 3 | 2, 2, 2 | same | 21 |
| TConv_1 | 5, 5, 5 | 3, 3, 3 | 1, 1, 1 | valid | 14 |
| TConv_2 | 9, 9, 9 | 3, 3, 3 | 2, 2, 2 | same | 7 |
| Output | 9, 9, 9 | 3, 3, 3 | 1, 1, 1 | same | 1 |
Disclaimer/Publisher’s Note: The statements, opinions and data contained in all publications are solely those of the individual author(s) and contributor(s) and not of MDPI and/or the editor(s). MDPI and/or the editor(s) disclaim responsibility for any injury to people or property resulting from any ideas, methods, instructions or products referred to in the content. |
© 2023 by the authors. Licensee MDPI, Basel, Switzerland. This article is an open access article distributed under the terms and conditions of the Creative Commons Attribution (CC BY) license (https://creativecommons.org/licenses/by/4.0/).
Share and Cite
MDPI and ACS Style
Li, C.; Liu, B.; Xiao, K.; Kong, Y.; Wang, L.; Tang, R.; Xie, M.; Wu, Y. Metallogenic Prediction of the Zaozigou Gold Deposit Using 3D Geological and Geochemical Modeling. Minerals 2023, 13, 1205. https://doi.org/10.3390/min13091205
AMA Style
Li C, Liu B, Xiao K, Kong Y, Wang L, Tang R, Xie M, Wu Y. Metallogenic Prediction of the Zaozigou Gold Deposit Using 3D Geological and Geochemical Modeling. Minerals. 2023; 13(9):1205. https://doi.org/10.3390/min13091205
Chicago/Turabian StyleLi, Cheng, Bingli Liu, Keyan Xiao, Yunhui Kong, Lu Wang, Rui Tang, Miao Xie, and Yixiao Wu. 2023. "Metallogenic Prediction of the Zaozigou Gold Deposit Using 3D Geological and Geochemical Modeling" Minerals 13, no. 9: 1205. https://doi.org/10.3390/min13091205
Note that from the first issue of 2016, this journal uses article numbers instead of page numbers. See further details here.