
Experimental Study of Lithium Extraction in the Solid-Liquid Conversion of Low-Grade Solid Potash Ore
by
 ,
,
Zihao Cui
1,2, 
Yanjun Zhao
1,
Yumeng Zhang
1,3,*,
Jingjing Liu
2,
Yufei Hu
1,
Shengzhong Hu
4 and
Qiang Wang
4 1
MNR Key Laboratory of Metallogeny and Mineral Assessment, Institute of Mineral Resources, Chinese Academy of Geological Sciences, Beijing 100037, China
2
Hebei Key Laboratory of Strategic Critical Mineral Resources, College of Earth Sciences, Hebei GEO University, Shijiazhuang 050031, China
3
School of Earth Sciences and Resources, China University of Geosciences, Beijing 100083, China
4
Qinghai Zhonghang Resources Co., Ltd., Delingha 817000, China
*
Author to whom correspondence should be addressed.
Minerals 2024, 14(1), 116; https://doi.org/10.3390/min14010116
Submission received: 24 November 2023
/
Revised: 18 January 2024
/
Accepted: 19 January 2024
/
Published: 22 January 2024
(This article belongs to the Section Mineral Processing and Extractive Metallurgy)
Abstract
:There are considerable reserves of low-grade solid potash resources in the shallow part of Mahai Salt Lake in the Qaidam Basin, and the lithium brine resources resulting from solid–liquid conversion and mining are quite abundant. The comprehensive utilization of these resources is an important and urgent problem. In this study, to fully utilize these resources, the shallow low-grade solid potash ore in Mahai Salt Lake was used for systematic simulated ore dissolution experiments, combined with geochemical and X-ray diffraction analyses. The following key results were obtained: (1) Most Li+ in the Mahai mining area was deposited on the soluble salt minerals in silt or clay, and the appropriate concentration of solvent can help to dissolve more Li+ and K+; (2) the saturation time of Li+ was longer than that of K+. Therefore, the dissolution time for the mine can be appropriately extended during the production process to dissolve more Li+; (3) the solid–liquid conversion aqueous solution mining method can separate the lithium part of clay deposits and is associated with salt rock in the brine, which is a potential lithium resource. These experimental results provide a theoretical basis for salt pan production.
1. Introduction
Lithium is the lightest metal in nature, with high melting and boiling points, a low density and hardness, and substantial strategic value. With the rapid development of the new energy industry and the wide application of lithium batteries [1,2,3,4,5], the global demand for lithium resources is increasing rapidly. Demand for lithium resources in China is expected to exceed one million tons in the next 10 years [6]. Scholars have recovered lithium from waste lithium-ion batteries with promising results [7]. Lithium has become a new and strategic energy storage metal [8,9,10]; accordingly, it is called “white oil”, “energy metal”, or “high-energy metal” [11,12,13]. At present, lithium resources mainly exist in the form of solid lithium ore and liquid lithium resources in salt lake brine. Lithium extracted from salt lake brine accounts for 75% of the world’s lithium production [14,15,16] and involves lower energy consumption and costs than those of ore lithium. With the increasing demand for lithium resources, the exploration of lithium in deep underground brines in petroliferous basins has attracted increasing attention [17,18,19,20]. However, compared with modern shallow salt lake brine mines, the exploration and exploitation of deep salt lake brine faces many challenges, and improving the utilization efficiency of shallow salt lake resources is still a topic worthy of further study.
We have found that in the solid–liquid separation process for mining low-grade solid potassium ore in the shallow part of Mahai Salt Lake in Qaidam Basin, Qinghai province, the content of dissolved lithium in brine can reach 20 mg/L. If this associated resource is used efficiently, it can produce significant economic benefits. In particular, in the case of continuous large-scale water-soluble mining, the decline in lithium is not as pronounced as that of potassium; therefore, this source of lithium is worth investigating. In this study, we collected samples of low-grade solid potassium ore from the Mahai mining area and performed laboratory solid–liquid separation experiments to address this issue and provide a basis for the better utilization of the associated lithium resources in potassium ore.
2. Geological Setting
Qaidam Basin is located in the northeast of the Qinghai-Tibet Plateau, in the “high mountains and deep basin” tectonic landform [21,22,23]. It has experienced many tectonic movements and magmatic activity, with a complex geological structure and rich sedimentary rocks [24,25], as a multi-stage sedimentary basin. There are more than 30 salt lakes of different sizes distributed in the basin [26,27]. The Mahai Salt Lake is located in the Saishiteng Depression of the fault block on the northern margin of the Qaidam Basin [28,29] (Figure 1) [30,31]. It is a closed basin in the NW–SE direction that has gradually separated from the unified Qaidam Basin under the background of regional uplift tectonic dynamics on the Tibetan Plateau [32,33,34]. It includes approximately 300 m-thick Quaternary lacustrine clastic deposits and chemic deposits. Relatively thick impact clastic deposits were formed in the peripheral areas in front of Saishiteng Mountain, representing a typical continental salt lake [31,35,36]. The Mahai mining area is a quaternary salt lake deposit with the coexistence of solid and liquid ores, rich and poor ores, potassium, magnesium, sodium, and other components [37,38]. The underground intercrystalline brine of chemical rocks is distributed in the area, and its hydrochemical composition is mainly K+, Na+, Ca2+, Mg2+, Cl−, SO42− [39], with a salinity of 231.10~367.20 g/L. After nearly 10 years of liquefaction mining, the regional content (KCl content) of the Holocene solid potassium ore in the northern part of Mahai Salt Lake has been reduced to 2%, resulting in a typical low-grade solid potassium ore [40].
3. Sample Handling and Experimental Methods
3.1. Sample Handling
The experimental samples were selected from low-grade solid potassium ore in the shallow part of the Mahai mining area. The Li+ content in the sample was 6 μg/g. Before the experiment, the samples were transported back to the laboratory and were fully mixed to avoid an uneven distribution of halite and clay, which would affect the experimental results. Part of the sample was divided into clean halite and clay (mixed samples of clay and fine-grained halite) with an 80-mesh sieve, thus yielding three groups of samples: clay + halite, clay, and relatively clean halite (Figure 2). The above three samples are referred to as samples 1, 2, and 3.
3.2. Experimental Methods
3.2.1. Solvent Configuration
Three types of solvents were prepared for this experiment: deionized water, 10 degrees baumé, and 20 degrees baumé. The solvent density for 10 degrees baumé was 1.08 g/L, the solvent was composed of Na+, Mg2+, Cl− and SO42− at 4.50 × 10⁴ μg/L, 0.054 × 10⁴ μg/L, 6.87 × 10⁴ μg/L, and 0.271 × 10⁴ μg/L, respectively. For 20 degrees baumé, the density was 1.16 g/mL, and the solvent was composed of K+, Na+, Mg2+, Cl−, and SO42− at concentrations of 0.105 × 10⁴ μg/ mL, 8.71 × 10⁴ μg/ mL, 0.401 × 10⁴ μg/mL, 14.1 × 10⁴ μg/ mL, and 0.812 × 10⁴ μg/mL, respectively. The solvent configurations for 10 and 20 degrees baumé were primarily based on the actual brine composition in the mining area.
3.2.2. Experimental Process
To dry clean 500 mL beakers, approximately 200 mL of solid sample 1 was added, and then deionized water or a solution with 10 or 20 degrees baumé was added to 400 mL. The container was sealed with plastic wrap to prevent the evaporation loss of the dissolved liquid from affecting the experimental results. Finally, the beaker containing the solid sample and solvent was placed in a constant temperature and humidity chamber (15 °C and 20% relative humidity). The methods for samples 2 and 3 were consistent with those for sample 1. At reaction times of 6, 30, 54, 78, 102, 126, 150, 174, 246, 534, 558, 630, 726, 894, and 1158 h, samples from each experimental device were analyzed.
The ore dissolution experiments were conducted at the Key Laboratory of Mineralization and Resource Evaluation of the Ministry of Natural Resources, Institute of Mineral Resources, Chinese Academy of Geological Sciences, China. The experimental instrument was a constant temperature and humidity chamber (model CTHI-250, Stauke Instrument & Equipment Co., Ltd., Shanghai, China). A chemical composition analysis of the samples was performed at the Atomic Absorption Laboratory of the Institute of Mineral Resources, Chinese Academy of Geological Sciences. Inductively coupled plasma-optical emission spectrometry (ICP-OES) was used for analyses with a SPECTRO ARCOS SOP (Kleve, Germany). The plasma power was 1400 W, the cooling gas flow was 14 L/min, the auxiliary gas flow was 0.8 L/min, the atomizing gas flow was 0.8 L/min, and the pump speed was 30 r/min.
A powder X-ray crystal diffraction analysis was performed at the Institute of Mineral Resources, Chinese Academy of Geological Sciences, using a Bruker D8 Discover instrument (Billerica, MA, USA). Solid ore samples crushed to 200 mesh were placed in a sample tank at a depth of 2 mm and scanned using an X-ray diffraction analyzer after compaction. The X-ray light source was a copper target operated at 40 kV and 40 mA, the detector was continuous, each scanning time was 0.3 s, and the scanning step length was 0.02°.
4. Experimental Results
(1) Before the ore dissolution experiment, samples 1, 2, and 3 were analyzed by X-ray diffraction. The X-ray diffraction results for halite, halogenite, gypsum, chlorite, albite, quartz, kaolinite, and illite are listed in Table 1.
(2) Prior to the ore dissolution experiment, samples 1, 2, and 3 were dissolved in water and the total solution. The water-soluble solvent was deionized water, and the total soluble solvents were prepared using nitric and hydrofluoric acids. The composition of the dissolved liquid was analyzed, and the results are listed in Table 2.
(3) A total of 135 leaching fluids collected during the ore dissolution experiment were tested, and the experimental results are listed in Table 3 and Figure 3:
① In the three beakers with deionized water as a solvent (Figure 3a,d), in the solution with sample 1 as the solid ore sample, the lowest concentrations of Li+ and K+ were 0.12 mg/L and 227.76 mg/L and the highest concentrations were 1.12 mg/L and 1090.76 mg/L, respectively. In the solution with solid ore sample 2, the lowest concentrations of Li+ and K+ were 0.08 mg/L and 135.60 mg/L, and the highest concentrations were 2.08 mg/L and 1764.84 mg/L, respectively. In the solution with solid ore sample 3, the lowest concentrations of Li+ and K+ were 0 mg/L and 32.80 mg/L, and the highest concentrations were 0.28 mg/L and 229.96 mg/L, respectively.
② In the three beakers with 10 degrees baumé as a solvent (Figure 3b,e), in the solution with sample 1 as the solid ore sample, the lowest concentrations of Li+ and K+ were 0.08 mg/L and 107.84 mg/L and the highest concentrations were 0.60 mg/L and 461.00 mg/L, respectively. In the solution with solid ore sample 2, the lowest concentrations of Li+ and K+ were 0.16 mg/L and 208.00 mg/L, and the highest concentrations were 2.68 mg/L and 2413.04 mg/L, respectively. In the solution with solid ore sample 3, the lowest concentrations of Li+ and K+ were 0 mg/L and 73.60 mg/L, and the highest concentrations were 0.36 mg/L and 296.32 mg/L, respectively.
③ In the three beakers with 20 degrees baumé as a solvent (Figure 3c,f), in the solution with sample 1 as the solid ore sample, the lowest concentrations of Li+ and K+ were 0 mg/L and 645.92 mg/L and the highest concentrations were 0.76 mg/L and 1217.24 mg/L, respectively. In the solution with solid ore sample 2, the lowest concentrations of Li+ and K+ were 0.12 mg/L and 792.08 mg/L, and the highest concentrations were 2.12 mg/L and 2593.60 mg/L, respectively. In the solution with solid ore sample 3, the lowest concentrations of Li+ and K+ were 0.08 mg/L and 721.64 mg/L, and the highest concentrations were 0.44 mg/L and 1117.00 mg/L, respectively.
(4) After the ore dissolution experiment, the remaining solid samples from the nine beakers were analyzed using X-ray diffraction. The X-ray diffraction results for halite, halogenite, gypsum, hemihydrate gypsum, chlorite, albite, quartz, kaolinite, and illite are listed in Table 4.
(5) After the ore-dissolution experiment, the remaining solid samples from the nine beakers were dissolved in water and the total solution. The water-soluble solvent was deionized water, the total soluble solvent was concentrated in nitric and hydrofluoric acids, and the composition of the dissolved liquid was analyzed. The results are summarized in Table 5.
5. Discussion
5.1. Comparison of Sample Properties before and after Dissolution
5.1.1. Chemical Analysis
Results of chemical analyses before and after ore dissolution were compared. The Li+ content in sample 3 was extremely low after the complete ore dissolution experiment and, therefore, could not be measured. Moreover, in the salt pan, none of the minerals in the mineral layer dissolved; therefore, we roughly calculated the dissolution rate of Li+ in different solvents for each sample based on the actual situation and in water.
Let us compare the results obtained before and after ore dissolution for sample 1. In deionized water, the concentration of Li+ decreased from 1.40 μg/g to 0.70 μg/g. It can be inferred that the dissolution rate of Li+ was approximately 50% during the entire ore dissolution process. K+ decreased from 1516.60 μg/g to 361.20 μg/g, indicating that the dissolution rate of K+ was approximately 76%. Li+ decreased from 1.40 μg/g to 0.70 μg/g under 10 degrees baumé, indicating a dissolution rate of approximately 50% throughout the ore dissolution process. K+ decreased from 1516.60 μg/g to 247.50 μg/g, for a dissolution rate of approximately 84%. Li+ decreased from 1.40 μg/g to 0.70 μg/g under 20 degrees baumé. These results suggest that the dissolution rate of Li+ was approximately 50% throughout the ore dissolution process. K+ decreased from 1516.60 μg/g to 342.10 μg/g, indicating that the dissolution rate of K+ was approximately 77%.
For sample 2 in deionized water, the concentration of Li+ decreased from 3.20 μg/g to 2.00 μg/g, indicating that the dissolution rate of Li+ was approximately 38%. K+ decreased from 2080.10 μg/g to 809.10 μg/g, and the dissolution rate of K+ was approximately 61%. Li+ decreased from 3.20 μg/g to 2.10 μg/g under 10 degrees baumé, suggesting that the dissolution rate of Li+ was approximately 34% during the entire ore dissolution process. The concentration of K+ decreased from 2080.10 μg/g to 999.00 μg/g, consistent with a dissolution rate of K+ of approximately 52%. Li+ decreased from 3.20 μg/g to 2.20 μg/g under 20 degrees baumé. It can be inferred that the dissolution rate of Li+ was approximately 31% during the entire ore dissolution process. K+ decreased from 2080.10 μg/g to 1237.90 μg/g, indicating that the dissolution rate was approximately 40%.
For sample 3 in deionized water, the concentration of Li+ decreased from 0.40 μg/g to 0.10 μg/g, indicating that the dissolution rate was approximately 75%. K+ decreased from 371.20 μg/g to 107.10 μg/g, indicating that the dissolution rate was approximately 71%. Li+ decreased from 0.40 μg/g to 0.10 μg/g under 10 degrees baumé, suggesting that the dissolution rate of Li+ was approximately 75% throughout the ore dissolution process. The K+ concentration decreased from 371.20 μg/g to 96.30 μg/g, indicating that the dissolution rate was approximately 74%. Li+ decreased from 0.40 μg/g to 0.10 μg/g under 20 degrees baumé, indicating that the dissolution rate of Li+ was approximately 75% throughout the ore dissolution process. The K+ concentration decreased from 371.20 μg/g to 167.60 μg/g, indicating that the dissolution rate was approximately 55%.
5.1.2. Comparison of X-ray Diffraction Patterns
After soaking each solid sample in a different solution, the mineral composition of the remaining solid samples changed slightly.
In sample 1, after soaking in deionized water, the halite content was reduced by approximately 20%, polyhalite disappeared, gypsum was reduced by approximately 5%, the quartz content increased by approximately 4%, and new minerals, such as hemihydrate gypsum, albite, and illite, were generated, whereas the kaolinite content did not change. Under 10 degrees baumé, the halite content was reduced by approximately 11%, polyhalite and kaolinite disappeared, the gypsum content was reduced by approximately 5%, the quartz content increased by approximately 2%, and illite was newly detected. Under 20 degrees baumé 20, the content of halite decreased by approximately 16%, polyhalite and kaolinite disappeared, gypsum decreased by approximately 5%, albite and illite were newly detected, the quartz content decreased by approximately 2%, and the kaolinite content decreased by approximately 2%.
In sample 2, after soaking in deionized water, the halite content was reduced by approximately 5%, polyhalite and gypsum disappeared, hemihydrous gypsum was newly detected, chlorite increased by approximately 2%, albite increased by approximately 9%, quartz increased by approximately 17%, kaolinite increased by approximately 5%, and illite increased by approximately 11%. Under 10 degrees baumé, the halite content was reduced by approximately 5%, polyhalite and gypsum disappeared, hemihydrous gypsum formed, chlorite rose by approximately 2%, albite rose by approximately 21%, quartz decreased by approximately 1%, kaolinite rose by approximately 6%, and illite increased by approximately 14%. Under 20 degrees baumé, the halite content increased by approximately 2%, polyhalite and gypsum disappeared, hemihydrous gypsum formed, chlorite increased by approximately 2%, albitite increased by approximately 10%, quartz increased by approximately 9%, kaolinite increased by approximately 5%, and illite increased by approximately 13%.
In sample 3, after soaking in deionized water, the halite content was reduced by approximately 3%, gypsum did not change, and quartz was formed. Under 10 degrees baumé, the halite content decreased by approximately 3%, gypsum increased by approximately 1%, and quartz formed. Under 20 degrees baumé, the contents of various minerals in the sample did not change.
After the ore dissolution experiment, the remaining solid samples in the nine beakers were dried in an oven at 100 °C and ground into a powder with a particle size of 200 mesh. This process may have resulted in hydrous gypsum formation [41,42], explaining the formation of hemihydrous gypsum in samples 1 and 2.
5.2. Comparison of the Effects of Different Solvents
Three different solvents were evaluated, deionized water, 10 degrees baumé, and 20 degrees baumé, and their effects on ore dissolution were different.
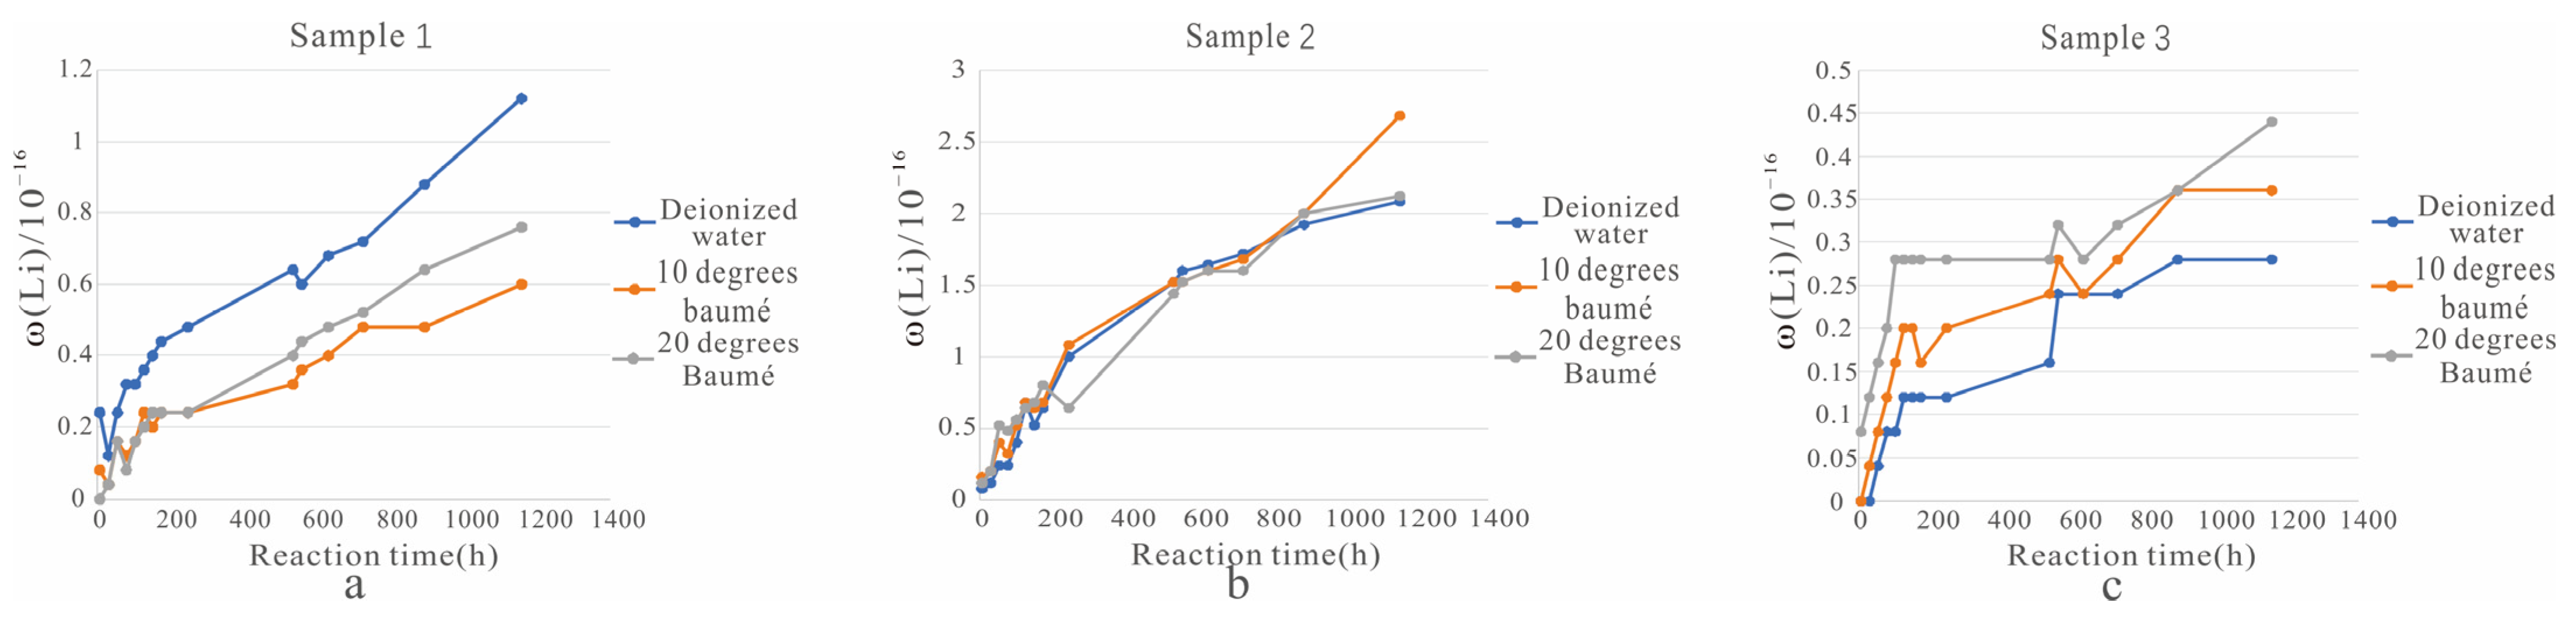
(1) For sample 1 (Figure 4a), water was clearly the most effective solvent better because water can destroy the structure of the ore layer and allow the lithium in the solid sample to quickly transfer to the solution. Therefore, water had advantages with respect to ore dissolution.
(2) For sample 2 (Figure 4b), ore dissolution was highly similar under the three different solvents. However, after 894 h, the Li+ concentration under 10 degrees baumé was significantly higher than those of the other two solutions.
(3) When the solid ore sample was sample 3 (Figure 4c), the dissolution of Li+ decreased in the following order: 20 degrees baumé, 10 degrees baumé, and water. Improving the salinity of the solvent and configuring the sodium salt solvent not only better protects the structure of the mineral layer but also helps to obtain better original brine ore and provides higher quality brine for salt pan production.
5.3. Comparison of Dissolution Properties of Different Ore Samples
Dissolution patterns clearly differed among solid ore samples (i.e., samples 1, 2, and 3) in the same solvent.
(1) When the solvent was deionized water (Figure 3a), ore dissolution decreased in this order: sample 2, 1, and 3. However, before 78 h, the ore dissolution effect of sample 2 was worse than that of sample 1, which may be explained by the finer particle size of sample 2 in the early stage and the longer reaction time required for full contact with deionized water. After 78 h, the minerals in sample 2 were in full contact with the deionized water and provided an increasing amount of Li+ (Table 3).
(2) Using 10 degrees baumé (Figure 3b), the ore dissolution effect, from good to bad, was as follows: sample 2, 1, and 3.
(3) Using 20 degrees baumé (Figure 3c), the ore dissolution effect, from good to bad, was as follows: sample 2, 1, and 3. However, before 54 h, the ore dissolution effect of sample 3 was generally better than that of sample 1. When the experiment was conducted for 630 h, the dissolved Li+ concentration in sample 2 under 20 degrees baumé reached saturation (Table 3).
5.4. Comparison Comparative Analysis
According to a comprehensive analysis of the above experimental results, it can be concluded that fresh water can destroy the structure of the ore layer; therefore, it has some advantages as an ore-dissolving solvent. During the formation of most clay-type lithium deposits, independent lithium minerals are not formed because the concentration of Li+ in the solution is low. Li+ exists mostly in the form of fluid inclusions in easily soluble salt minerals (such as carnallite and halite), whereas the remaining Li+ exists in the form of adsorption or isomorphism in relatively insoluble minerals. These include carbonates, sulfate minerals, and silicate minerals [43,44]. According to the results of water dissolution, total solution decomposition, and X-ray diffraction analyses, sample 2 contained a large amount of potassium salt minerals, and sample 3 had a lower potassium salt mineral content than sample 2; therefore, sample 2 had the best ore dissolution effect. However, in practice, the porosity and water supply in the pure clay layer are very low, the lack of water permeability makes it an effective water barrier, and it is difficult for solvents to enter the clay layer, resulting in poor ore dissolution. The silty sand and clay in the halite intercrystalline and interlayer in the halite potassium mine are in contact with the solvent, and a large amount of adsorbed Li+ can be transformed into brine to a certain extent. Therefore, the actual ore-dissolving effect may be attributed to halite potassium ore containing silt and clay.
The results for the three different solvents showed that the concentration of Li+ in the dissolution solution of sample 2 was significantly higher than those of the other two samples (Figure 4). This is because sample 2 is actually a salt-bearing clay, and its potassium salt mineral content (mainly polyhalite as a result of powder diffraction) was significantly higher than those of samples 1 and 3; therefore, the dissolution and conversion efficiency may be slightly lower, but the potassium and lithium contents in the dissolution solution are the highest.
We found that a certain concentration of solvent was conducive to the dissolution of Li+ and K+, and sample 2 had the best ore dissolution effect. As shown in Figure 3, the time required for the Li+ concentration to reach saturation was longer than that for K+ because the lithium in the clay requires a longer reaction time to replace the solid-to-liquid phase. Therefore, in actual scenarios, the production plan can be adjusted according to the relationship between potassium and lithium during the dissolution time so that the lithium in the original brine can be enriched, thereby improving production efficiency and productivity.
6. Conclusions
(1) In the Mahai mining area, Li+ mainly exists in easily soluble salt minerals, and the clay layer contains a large amount of potassium salt minerals, and an appropriate solvent concentration promotes the dissolution of Li+ and K+.
(2) The time required for Li+ saturation is longer than that required for K+ saturation; therefore, the dissolution time can be appropriately extended in the production process of the mining area to dissolve more Li+.
(3) The solid–liquid conversion aqueous solution mining method can partially replace the clay lithium associated with salt rock with brine, which is a potential lithium resource.
Author Contributions
Z.C. performed the data analyses and wrote the manuscript; Y.Z. (Yanjun Zhao) helped perform the analysis with constructive discussions. Y.Z. (Yumeng Zhang), J.L. and Y.H. helped with the experiments; S.H. and Q.W. were helpful with sample collection. All authors have read and agreed to the published version of the manuscript.
Funding
The study was supported by Major Projects of occurrence law of low-grade solid potash in Qarhan salt lake in Qinghai Province and driving dissolution ore Liquefaction technology (2023YFC2906502), the State Key Research and Development Project (2018YFC0604801).
Data Availability Statement
The experimental data used to support the findings of this study are included in the manuscript.
Acknowledgments
We appreciate the reviewers for their constructive comments and suggestions.
Conflicts of Interest
S.H. and Q.W. are employees of Qinghai Zhonghang Resources Co., Ltd. and do not pose any conflict of interest.
References
- Gruber, P.W.; Medina, P.A.; Keoleian, G.A. Global Lithium Availability: A Constraint for Electric Vehicles? J. Ind. Ecol. 2011, 15, 760–775. [Google Scholar] [CrossRef]
- Xu, X.; Chen, Y.M.; Wan, P.Y.; Gasem, K.; Wang, K.Y. Extraction of lithium with functionalized lithium ion-sieves. Prog. Mater. Sci. 2016, 84, 276–313. [Google Scholar] [CrossRef]
- Su, T.; Guo, M.; Liu, Z.; Li, Q. Comprehensive Riview od Global Lithium Resources. J. Salt Lake Res. 2019, 27, 104–111. [Google Scholar] [CrossRef]
- Florencia, H.; Martinez, A.L.; Valentina, U.S. The importance of lithium for achieving a low-carbon future: Overview of the lithium extraction in the ‘Lithium Triangle’. J. Energy Nat. Resour. Law 2020, 38, 213–236. [Google Scholar] [CrossRef]
- Baltazar, C.T.; Jessica, D.; Sophia, C.; Timothy, P.; Ghislain, B.; Serkan, S.; Ismet, C. Towards a low-carbon society: A review of lithium resource availability, challenges and innovations in mining, extraction and recycling, and future perspectives. Miner. Eng. 2021, 163, 106743. [Google Scholar] [CrossRef]
- Han, C.M.; Fan, Q.S.; Han, G.; Wei, H.C.; Li, Q.K.; Chen, Y.J.; Chen, T.Y.; Yang, H.T. Source-sink Process of Brine-type Litium Deposits in the Salt Lakes in the Qaidam Basin and Its Spatial Mineralization Association with Hydrogeomorphic Evolution of Nalinggele River. J. Salt Lake Res. 2023, 31, 9–18+102. [Google Scholar] [CrossRef]
- Chen, L.L.; Chao, Y.H.; Li, X.W.; Zhou, G.L.; Lu, Q.Q.; Hua, M.Q.; Li, H.P.; Ni, X.G.; Wu, P.W.; Zhu, W.S. Engineering a tandem leaching system for the highly selective recycling of valuable metals from spent Li-ion batteries. Green Chem. 2021, 23, 2177–2184. [Google Scholar] [CrossRef]
- Zhang, Z.N.; Zhang, Z.Z.; Wu, Q.; Pan, Z.S.; Xu, H.Y. Chinese Lithium Mineral Resource Demand Forecast. China Min. Mag. 2020, 29, 9–15. [Google Scholar]
- Han, J.H.; Nie, Z.; Fang, C.H.; Wu, Q.; Cao, Q.; Wang, Y.S.; Bo, L.Z.; Yu, J.J. Analysis of existing circumstance of supply and demand on China’s lithium resources. Inorg. Chem. Ind. 2021, 53, 61–66. [Google Scholar] [CrossRef]
- Xue, Y.Y.; Liu, H.Y.; Sun, W.D. The Geochemical Properties and Enrichment Mechanism of Lithium. Geotecton. Metallog. 2021, 45, 1202–1215. [Google Scholar] [CrossRef]
- Fan, J.J.; Tang, G.J.; Wei, G.J.; Wang, H.; Xu, Y.G.; Wang, Q.; Zhou, J.S.; Zhang, Z.Y.; Huang, T.Y.; Wang, Z.L. Lithium isotope fractionation during fluid exsolution: Implications for Li mineralization of the Bailongshan pegmatites in the West Kunlun, NW Tibet. Lithos 2020, 352, 105236. [Google Scholar] [CrossRef]
- Bibienne, T.; Magnan, F.J.; Rupp, A.; Laroche, N. From Mine to Mind and Mobiles: Society’s Increasing Dependence on Lithium. Elements 2020, 16, 265–270. [Google Scholar] [CrossRef]
- Bowell, J.R.; Lagos, L.; Hoyos, L.D.R.C.; Declercq, J. Classification and Characteristics of Natural Lithium Resources. Elements 2020, 16, 259–264. [Google Scholar] [CrossRef]
- Munk, L.A.; Hynek, S.A.; Bradley, D.C.; Boutt, D.; Labay, K.; Jochens, H. Lithium brines: A global perspective. Rev. Econ. Geol. 2016, 18, 339–365. [Google Scholar] [CrossRef]
- Weng, D.; Duan, H.Y.; Hou, Y.C.; Huo, J.; Chen, L.; Zhang, F.; Wang, J.D. Introduction of manganses based lithium-ion Sieve-A review. Prog. Nat. Sci. Mater. Int. 2020, 30, 139–152. [Google Scholar] [CrossRef]
- Sun, J.; Li, X.W.; Huang, Y.H.; Luo, G.L.; Tao, D.J.; Yu, J.T.; Chen, L.L.; Chao, Y.H.; Zhu, W.S. Preparation od high hydrophilic H2TiO3 ion sieve for lithium recovery from liquid lithium resources. Chem. Eng. J. 2023, 453, 139485. [Google Scholar] [CrossRef]
- Li, H.P.; Zheng, M.P.; Hou, X.H.; Yan, L.J. Control Factors and Water Chemical Characteristics of Potassium-rich Deep Brine in Nanyishan Structure of Western Qaidam Basin. Acta Geosci. Sin. 2015, 36, 41–50. [Google Scholar] [CrossRef]
- Liu, C.L.; Yu, X.C.; Zhao, Y.J.; Wang, J.Y.; Wang, L.C.; Xu, H.M.; Li, J.; Wang, C.L. A tentative discussion on regional metallogenic background and mineralization mechanism of subterranean brines rich in potassium and lithium in South China Block. Miner. Depos. 2016, 35, 1119–1143. [Google Scholar] [CrossRef]
- Liu, C.L.; Yu, X.C.; Yuan, X.Y.; Li, R.Q.; Yao, F.J.; Shen, L.J.; Li, Q.; Zhao, Y.Y. Characteristics, distribution regularity and formation model of brine-type Li deposits in salt lakes in the world. Acta Geol. Sin. 2021, 95, 2009–2029. [Google Scholar] [CrossRef]
- Yu, X.C.; Liu, C.L.; Wang, C.L.; Xu, H.M.; Zhao, Y.J.; Huang, H.; LI, R.Q. Genesis of lithium brine deposits in the Jianghan Basin and progress in resource exploration: A review. Earth Sci. Front. 2022, 29, 107–123. [Google Scholar] [CrossRef]
- Yuan, J.Q.; Hao, C.Y.; Cai, K.Q. The High Mountain-deep Basin Saline Environment—A New Genetic Model of Salt Deposits. Geol. Rev. 1983, 29, 159–165. [Google Scholar] [CrossRef]
- Wang, Y.X.; Xu, S.; Hao, F.; Poulton, S.W.; Zhang, Y.Y.; Guo, T.X.; Lu, Y.B.; Bai, N. Arid climate disturbance and the development of salinized lacustrine oil shale in the Middle Jurassic Dameigou Formation, Qaidam Basin, northwestern China. Palaeogeogr. Palaeoclimatol. Palaeoecol. 2021, 577, 110533. [Google Scholar] [CrossRef]
- Wu, Y.P.; Liu, C.L.; Liu, Y.J.; Gong, H.W.; Sarwar, A.R.; Li, G.X.; Zhang, Q.B. Geochemical characteristics and the organic atter enrichment of the Upper Ordovician Tanjianshan Group, Qaidam Basin, China. J. Pet. Sci. Eng. 2022, 208, 109383. [Google Scholar] [CrossRef]
- Tang, W.Q.; Zhang, D.W.; Zhou, Y.X.; Liu, Y.Y.; Wu, K.Y.; Zhang, P.C.; Han, Q.C.; Li, F.J.; Ma, C. Astronomical forcing in the coal-bearing Middle Jurassic Dameigou Formation, Qaidam Basin, northwestern China. Ore Geol. Rev. 2023, 161, 105663. [Google Scholar] [CrossRef]
- Pan, T.; Chen, J.Z.; Ding, C.W.; Ma, Y.L.; Liang, H.; Zhang, T.; Du, X.C. Occurrence Characteristics of Lithium Rare Light Metal Clay-type Deposits in Balunmahai Basin of Qaidam Basin. Gold Sci. Technol. 2023, 31, 359–377. [Google Scholar]
- Yuan, J.Q. Types of salt lakes in the Qaidam Basin. Acta Geol. Sin. 1959, 03, 318–323. [Google Scholar] [CrossRef]
- Chen, K.Z.; Yang, S.X.; Zheng, X.Y. The Salt Lakes on The Qinghai-Xizang Plateau. Acta Geogr. Sin. 1981, 1, 13–21. [Google Scholar]
- Hu, S.Y.; Zhao, Q.S.; Wang, G.C.; Zhang, J.W.; Feng, J. Hydrochemical Dynamic Characteristics and Evolution of Underground Brine in the Mahai Salt Lake of the Qaidam Basin Qinghai-Tibet Plateau. Acta Geol. Sin. 2018, 92, 1981–1990. [Google Scholar] [CrossRef]
- Yao, F.J.; Jiao, P.C.; Zhao, Y.J.; Zhao, X.F.; Zhang, H.; Liu, C.L. Research of remote sensing recognition of concealed brine-controlling structures in dry salt lake area: A case study of Mahai salt lake. Acta Geol. Sin. 2021, 95, 2225–2237. [Google Scholar] [CrossRef]
- Yang, Q. The Salt Mineral Resources and Their Spatial Distribution in Chaidamu Basin, Qinghai. Earth Sci. 1988, 13, 49–58. [Google Scholar]
- Wang, M.L.; Liu, C.L.; Yang, Z.C.; Jiao, P.C.; Fan, W.D. Preliminary study on the characteristics and genesis of extra-large potash deposits in the North Sag of Lop Poro. Geol. Rev. 1997, 43, 249. [Google Scholar] [CrossRef]
- Wan, T.F. The Tectonics of China: Data, Maps and Evolution; Springer Science & Business Media. M.: Berlin/Heidelberg, Germany, 2020. [Google Scholar]
- Sun, G.Q.; Zhang, S.C.; Wang, Y.T.; Li, Y.L.; Guo, H.; Bo, S.S. Eocene Sedimentary–Diagenetic Environment Analysis of the Pingtai Area of the Qaidam Basin. Appl. Sci. 2022, 12, 6850. [Google Scholar] [CrossRef]
- Lu, J.; Zhou, K.; Yang, M.F.; Shao, L.Y. Jurassic continental coal accumulation linked to changes in palaeoclimate and tectonics in a fault-depression superimposed basin, Qaidam Basin, NW China. Geol. J. 2020, 55, 7998–8016. [Google Scholar] [CrossRef]
- Wei, X.J.; Jiang, J.X.; Wang, M.L. Sedimentary Characteristics of Quaternary and Evolution of Saline Lake of Mahai Potash Deposit. J. Manag. Strategy Qinghai Land Resour. 1992, 1, 40–52. [Google Scholar]
- Hu, S.Y.; Ren, J.; Li, J.Q.; Zhao, Q.S. Permeability and Brine Enrichment Mechanism of Brine Reservoir in the Mahai Salt Lake, Qaidam Basin. Sci. Geogr. Sin. 2022, 42, 2039–2046. [Google Scholar] [CrossRef]
- Ma, J.Y. Outline Evaluation and Exploitation of Resources in Northern Segment of Mahai Potassium Deposit. Eng. Sci. 2005, 7, 296–300. [Google Scholar]
- Li, J.G.; Guan, Y.S.; Dai, J.; Yu, M.X.; Cheng, F.Q. Phase diagram analysis and computation for the process of brine evaporation of dissolution mining of low grade solid potassium deposit in Mahai salt lake. Inorg. Chem. Ind. 2013, 45, 17–20. [Google Scholar]
- Zhao, Q.S.; Kong, Z.H.; Hu, S.Y.; Zhang, J.W. Geophysical Exploration and Application of Underground Brine of Mahai Salt Lake in Qaidam Basin. J. Jilin Univ. (Earth Sci. Ed.) 2023, 53, 1560–1572. [Google Scholar] [CrossRef]
- Wang, Z.X.; Zhao, Y.J.; Zhao, X.F.; Wang, Q.C.; He, J.H.; Hu, Y.F.; Long, P.Y. Influence of sedimentary characteristics on water solution mining of low-grade potassium ore: A case study of Holocene in the northern ore section of Mahai Salt Lake, Qaidam Basin. Acta Petrol. Mineral. 2022, 41, 929–940. [Google Scholar]
- Qu, J.Y.; Chen, G.X.; Liu, R.C.; Zhou, Y.; Luo, J.H. Study and Discussion on Preparation of Hemihydrate Gypsum by SaltSolution Method. Multipurp. Util. Miner. Resour. 2023, 1–2. [Google Scholar] [CrossRef]
- Yang, F.L.; Qiao, G.X.; Yang, P.; Ren, L.; Wang, Q.; Wu, H.B.; Cheng, F.Q. Research progress and application of α-hemihydrate gypsum preparation from desulfurization gypsum. Inorg. Chem. Ind. 2023, 1–14. [Google Scholar] [CrossRef]
- Pan, T.; Chen, J.Z.; He, M.Y.; Ding, C.W.; Ma, Y.L.; Liang, H.; Zhang, T.; Du, X.C. Characterization and Resource Potential of Li in the Clay Minerals of Mahai Salt Lake in the Qaidam Basin, China. Sustainability 2023, 15, 14067. [Google Scholar] [CrossRef]
- Wang, H.; Zhang, F.Q.; Zhang, D.G.; Zhou, L.J.; Zhao, G.H.; Liao, J.L.; Yan, X.M.; Xu, H.H.; Hou, W.W.; Zhang, J.J.; et al. The bottleneck problem and some thoughts on the process of exploration and development pf clay-type lithium deposit. Geol. Rev. 2023, 69, 1298–1312. [Google Scholar] [CrossRef]

Figure 2.
Three different solid ore samples before the experiment. ((a). clay + halite (sample 1); (b). clay (sample 2); (c). relatively clean halite (sample 3)).
Figure 2.
Three different solid ore samples before the experiment. ((a). clay + halite (sample 1); (b). clay (sample 2); (c). relatively clean halite (sample 3)).
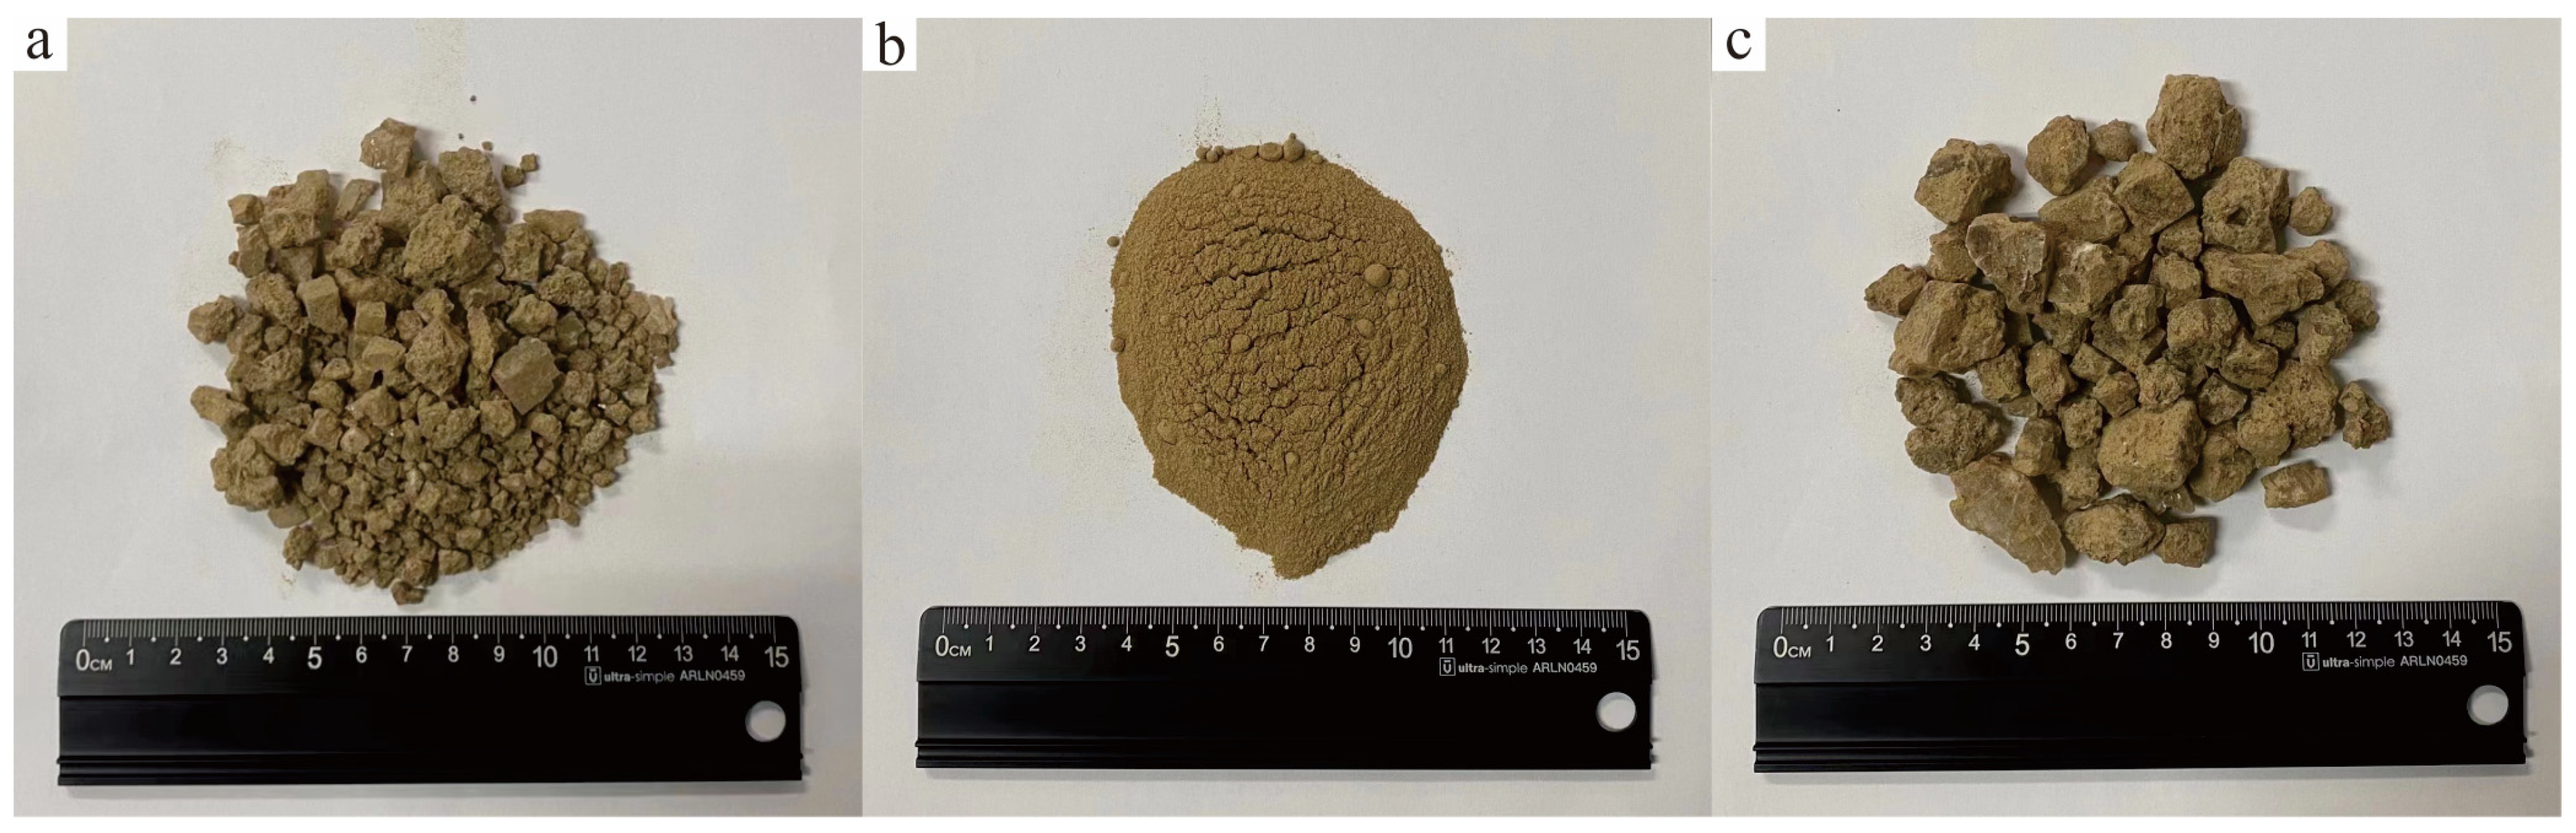
Figure 3.
Line plot of Li+ and K+ concentrations in the leachate. ((a). Change of Li+ concentration in the solution of three solid samples soaked in deionized water; (b). The change of Li+ concentration in the solution of three solid samples soaked in a solution of 10 degrees baumé; (c). The change of Li+ concentration in the solution of three solid samples soaked in a solution of 20 degrees baumé; (d). Change of K+ concentration in the solution of three solid samples soaked in deionized water; (e). The change of K+ concentration in the solution of three solid samples soaked in a solution of 10 degrees baumé; (f). The change of K+ concentration in the solution of three solid samples soaked in a solution of 20 degrees baumé).
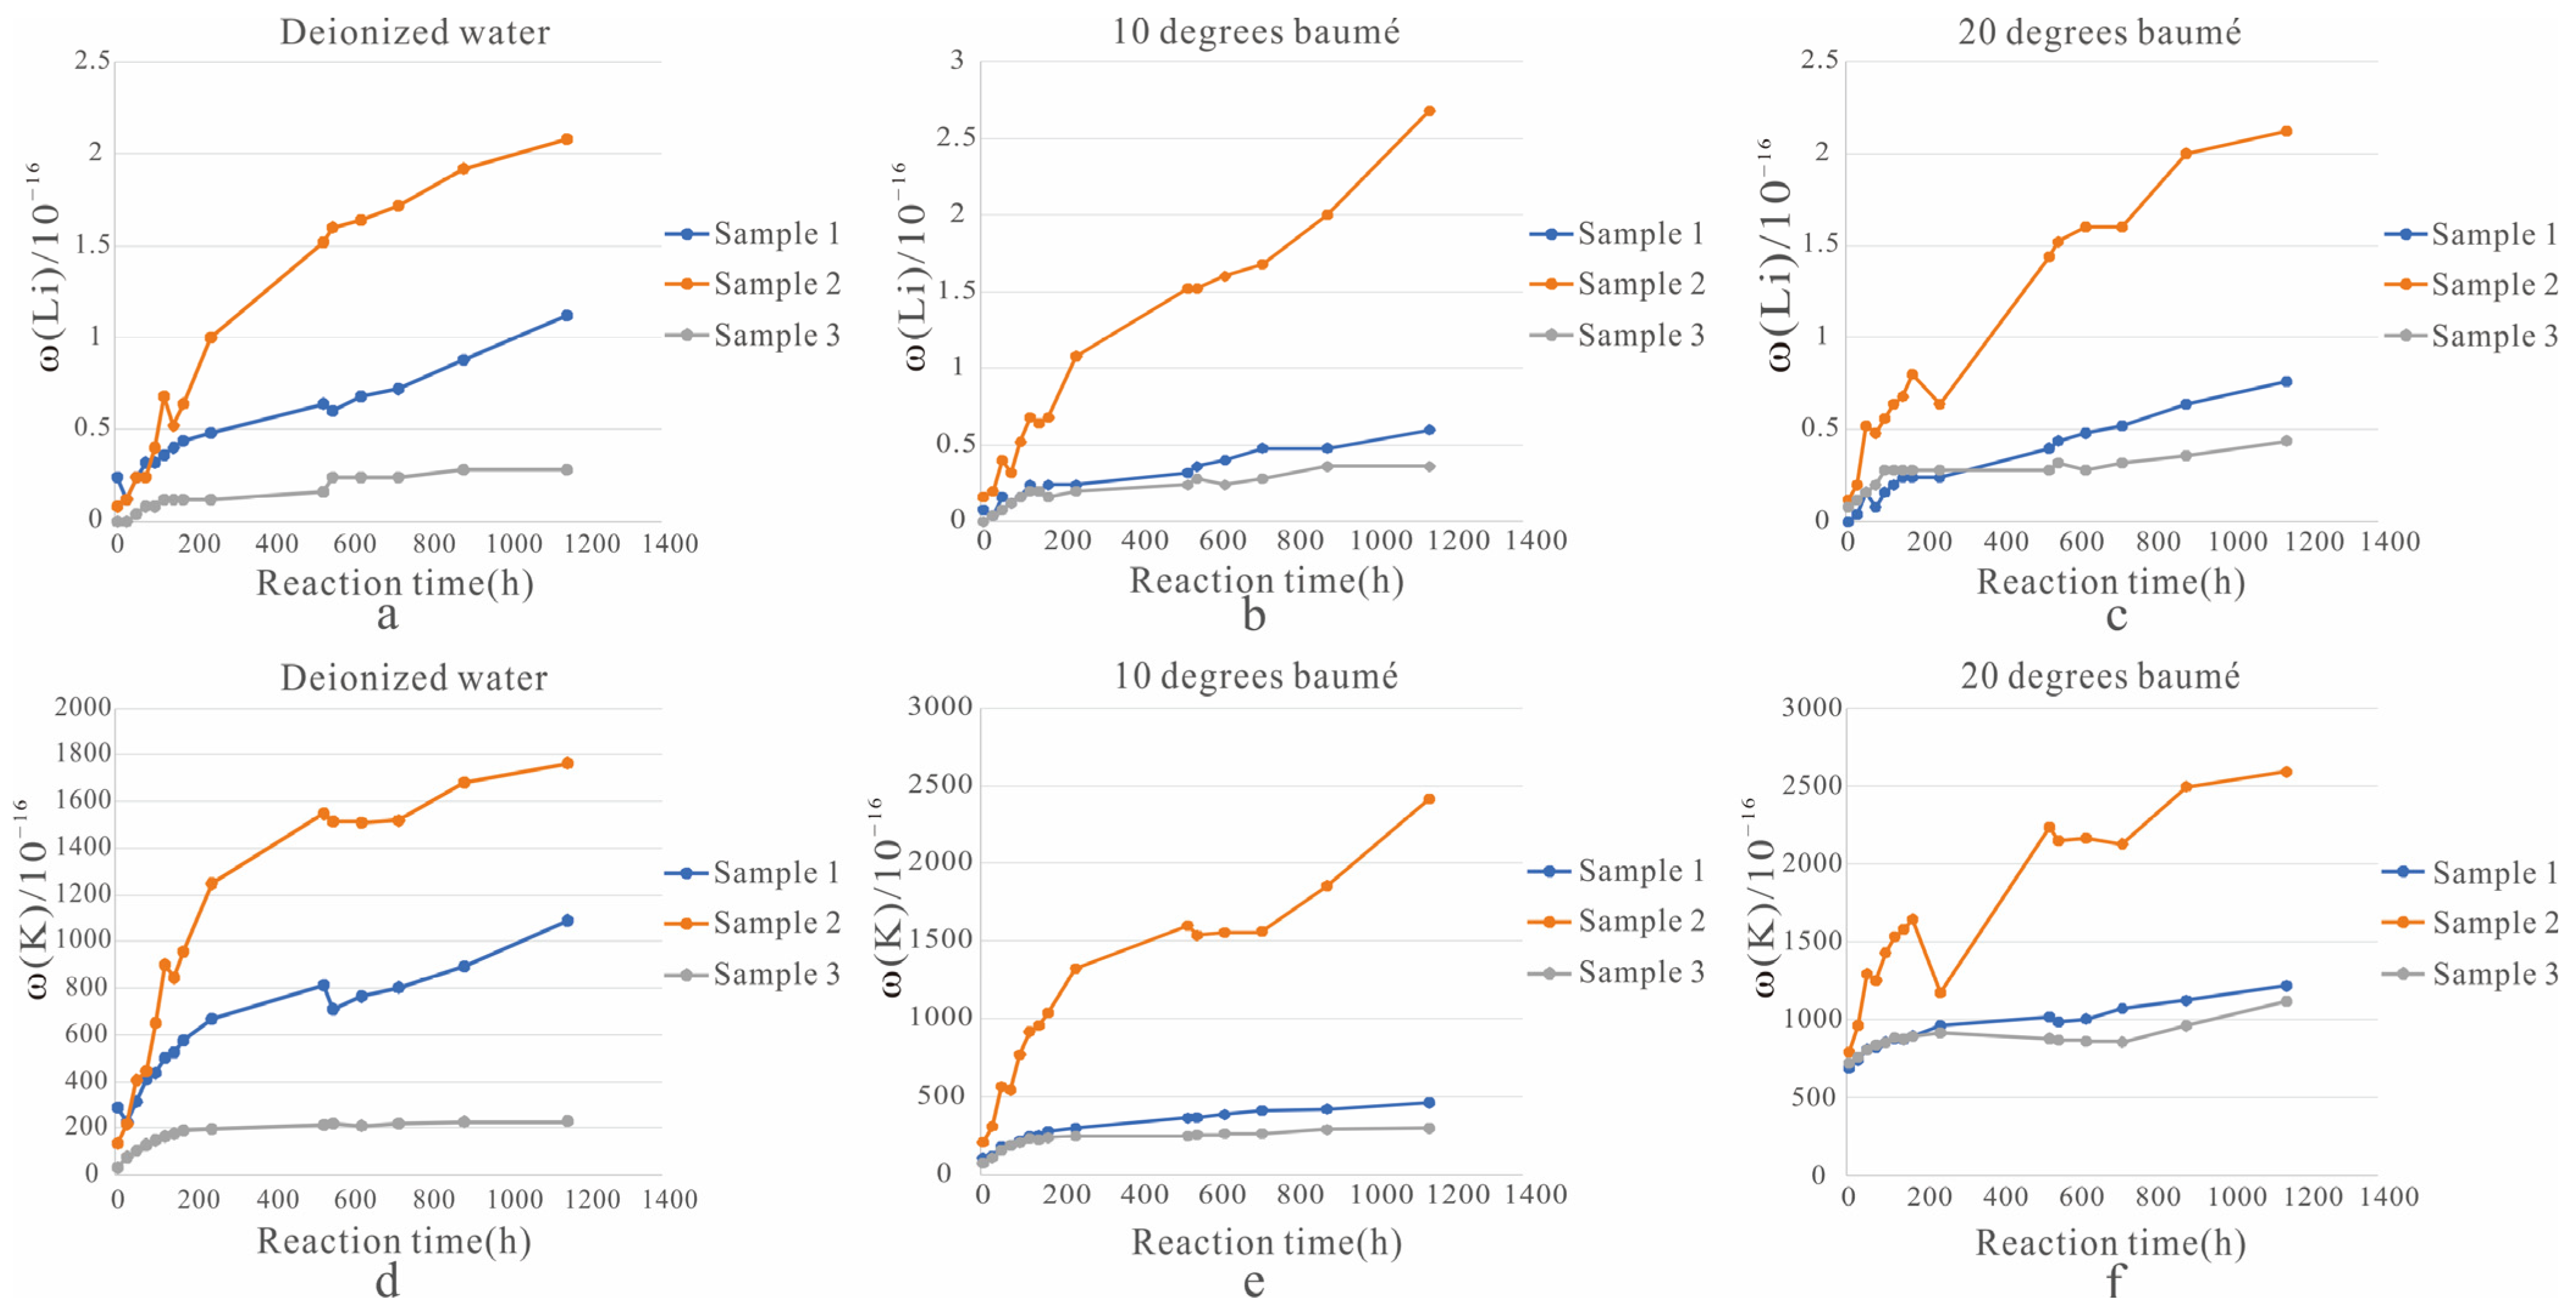
Figure 4.
Comparison of the dissolving effect of different solvents. ((a). Change of Li+ concentration in the solution of sample 1 soaked in three different solvents; (b). Change of Li+ concentration in the solution of sample 2 soaked in three different solvents; (c). Change of Li+ concentration in the solution of sample 3 soaked in three different solvents).

Table 1.
X-ray powder diffraction results of three solid ore samples before dissolution /%.
| The Name of The Sample ID | Halite | Polyhalite | Gypsum | Chlorite | Albite | Quartz | Kaolinite | Illite |
|---|---|---|---|---|---|---|---|---|
| sample 1 | 77% | 2% | 11% | 2% | 8% | |||
| sample 2 | 9% | 8% | 40% | 2% | 14% | 6% | 5% | 16% |
| sample 3 | 94% | 6% |
Table 2.
The results of water solubility and total solution of three solid ore samples.
| Sample | Water-Soluble | Total Solution | |||||
|---|---|---|---|---|---|---|---|
| Element (μg/g) | Sample 1 | Sample 2 | Sample 3 | Sample 1 | Sample 2 | Sample 3 | |
| Li+ | 1.40 | 3.20 | 0.40 | 6.00 | 26.00 | 2.00 | |
| K+ | 1516.60 | 2080.10 | 371.20 | 3353.00 | 11445.00 | 1202.00 | |
Table 3.
Li+ and K+ concentrations of the dissolved solution in nine beakers during the ore dissolution experiment.
Table 3.
Li+ and K+ concentrations of the dissolved solution in nine beakers during the ore dissolution experiment.
| Reaction Time (h) | 6 | 30 | 54 | 78 | 102 | 126 | 150 | 174 | 246 | 534 | 558 | 630 | 726 | 894 | 1158 | |
|---|---|---|---|---|---|---|---|---|---|---|---|---|---|---|---|---|
| Element (μg/g) | ||||||||||||||||
| (Sample 1 + deionized water) Li+ | 0.24 | 0.12 | 0.24 | 0.32 | 0.32 | 0.36 | 0.40 | 0.44 | 0.48 | 0.64 | 0.60 | 0.68 | 0.72 | 0.88 | 1.12 | |
| (Sample 1 + deionized water) K+ | 288.52 | 227.76 | 313.80 | 410.52 | 435.60 | 500.24 | 525.72 | 575.20 | 667.96 | 813.68 | 710.84 | 764.28 | 803.28 | 891.76 | 1090.76 | |
| (Sample 1 + 10 degrees baumé) Li+ | 0.08 | 0.04 | 0.16 | 0.12 | 0.16 | 0.24 | 0.20 | 0.24 | 0.24 | 0.32 | 0.36 | 0.40 | 0.48 | 0.48 | 0.60 | |
| (Sample 1 + 10 degrees baumé) K+ | 107.84 | 119.52 | 178.60 | 186.36 | 214.16 | 248.32 | 251.08 | 277.96 | 296.24 | 362.96 | 364.68 | 385.20 | 413.16 | 421.88 | 461.00 | |
| (Sample 1 + 20 degrees baumé) Li+ | 0.04 | 0.08 | 0.20 | 0.12 | 0.20 | 0.24 | 0.28 | 0.28 | 0.28 | 0.44 | 0.48 | 0.52 | 0.56 | 0.64 | 0.76 | |
| (Sample 1 + 20 degrees baumé) K+ | 688.36 | 739.52 | 809.16 | 823.60 | 856.92 | 878.76 | 571.52 | 895.52 | 960.04 | 1017.48 | 983.16 | 1004.48 | 1069.96 | 1123.28 | 1217.24 | |
| (Sample 2 + deionized water) Li+ | 0.08 | 0.12 | 0.24 | 0.24 | 0.40 | 0.68 | 0.52 | 0.64 | 1.00 | 1.52 | 1.60 | 1.64 | 1.72 | 1.92 | 2.08 | |
| (Sample 2 + deionized water) K+ | 135.60 | 216.92 | 405.44 | 445.12 | 650.40 | 900.68 | 844.48 | 957.36 | 1248.20 | 1547.68 | 1515.36 | 1510.04 | 1518.32 | 1682.52 | 1764.84 | |
| (Sample 2 + 10 degrees baumé) Li+ | 0.16 | 0.20 | 0.40 | 0.32 | 0.52 | 0.68 | 0.64 | 0.68 | 1.08 | 1.52 | 1.52 | 1.60 | 1.68 | 2.00 | 2.68 | |
| (Sample 2 + 10 degrees baumé) K+ | 208.00 | 310.04 | 565.16 | 543.24 | 771.56 | 916.84 | 957.60 | 1039.84 | 1324.76 | 1601.92 | 1537.20 | 1557.28 | 1564.48 | 1856.76 | 2413.04 | |
| (Sample 2 + 20 degrees baumé) Li+ | 0.16 | 0.24 | 0.56 | 0.52 | 0.60 | 0.68 | 0.72 | 0.84 | 0.68 | 1.48 | 1.56 | 1.64 | 1.64 | 2.00 | 2.12 | |
| (Sample 2 + 20 degrees baumé) K+ | 792.08 | 961.08 | 1294.32 | 1251.56 | 1429.88 | 1534.20 | 1582.00 | 1646.44 | 1173.44 | 2236.44 | 2151.96 | 2166.64 | 2130.48 | 2498.96 | 2593.60 | |
| (Sample 3 + deionized water) Li+ | 0 | 0 | 0.04 | 0.08 | 0.08 | 0.12 | 0.12 | 0.12 | 0.12 | 0.16 | 0.24 | 0.24 | 0.24 | 0.28 | 0.28 | |
| (Sample 3 + deionized water) K+ | 32.80 | 77.44 | 105.16 | 129.04 | 148.04 | 164.48 | 175.68 | 189.36 | 196.88 | 212.12 | 218.96 | 210.32 | 219.52 | 227.56 | 229.96 | |
| (Sample 3 + 10 degrees baumé) Li+ | 0 | 0.04 | 0.08 | 0.12 | 0.16 | 0.20 | 0.20 | 0.16 | 0.20 | 0.24 | 0.28 | 0.24 | 0.28 | 0.36 | 0.36 | |
| (Sample 3 + 10 degrees baumé) K+ | 73.60 | 108.36 | 158.52 | 187.16 | 204.52 | 230.20 | 222.68 | 235.80 | 244.16 | 248.32 | 255.96 | 263.00 | 262.88 | 288.44 | 296.32 | |
| (Sample 3 + 20 degrees baumé) Li+ | 0.08 | 0.12 | 0.16 | 0.20 | 0.28 | 0.28 | 0.28 | 0.28 | 0.28 | 0.28 | 0.32 | 0.28 | 0.32 | 0.36 | 0.44 | |
| (Sample 2 + 10 degrees baumé) K+ | 721.64 | 756.68 | 803.84 | 835.88 | 854.36 | 881.80 | 873.36 | 894.00 | 915.76 | 878.76 | 765.76 | 859.20 | 856.36 | 859.56 | 1117.00 | |
Table 4.
X-ray powder crystal diffraction results of the remaining solid samples in nine beakers after the dissolution experiment /%.
Table 4.
X-ray powder crystal diffraction results of the remaining solid samples in nine beakers after the dissolution experiment /%.
| The Name of The Sample ID | Halite | Polyhalite | Gypsum | Hemihydrate Gypsum | Chlorite | Albite | Quartz | Kaolinite | Illite |
|---|---|---|---|---|---|---|---|---|---|
| Sample 1 + deionized water | 57% | 6% | 5% | 8% | 6% | 8% | 10% | ||
| Sample 1 + 10 degrees baumé | 66% | 5% | 12% | 4% | 13% | ||||
| Sample 1 + 20 degrees baumé | 61% | 6% | 8% | 4% | 10% | 12% | |||
| Sample 2 + deionized water | 4% | 10% | 4% | 23% | 22% | 10% | 27% | ||
| Sample 2 + 10 degrees baumé | 4% | 10% | 4% | 35% | 5% | 11% | 30% | ||
| Sample 2 + 20 degrees baumé | 11% | 8% | 4% | 24% | 15% | 10% | 29% | ||
| Sample 3 + deionized water | 91% | 6% | 3% | ||||||
| Sample 3 + 10 degrees baumé | 91% | 7% | 2% | ||||||
| Sample 3 + 20 degrees baumé | 94% | 6% |
Table 5.
Li+ and K+ contents of the remaining solid ore samples in aqueous solution and total karst lysis in nine beakers after ore dissolution experiment.
Table 5.
Li+ and K+ contents of the remaining solid ore samples in aqueous solution and total karst lysis in nine beakers after ore dissolution experiment.
| Element (μg/g) | Water-Soluble | Total Solution | |||
|---|---|---|---|---|---|
| The Name of The Sample ID | Li+ | K+ | Li+ | K+ | |
| Sample 1 + deionized water | 0.70 | 361.20 | 5.00 | 2928.00 | |
| Sample 1 + 10 degrees baumé | 0.70 | 247.50 | 5.00 | 2965.00 | |
| Sample 1 + 20 degrees baumé | 0.70 | 342.10 | 3.00 | 2529.00 | |
| Sample 2 + deionized water | 2.00 | 809.10 | 21.00 | 15,100.00 | |
| Sample 2 + 10 degrees baumé | 2.10 | 999.00 | 19.00 | 14,477.00 | |
| Sample 2 + 20 degrees baumé | 2.20 | 1237.90 | 14.00 | 12,666.00 | |
| Sample 3 + deionized water | 0.10 | 107.10 | *** | 364.00 | |
| Sample 3 + 10 degrees baumé | 0.10 | 96.30 | *** | 401.00 | |
| Sample 3 + 20 degrees baumé | 0.10 | 167.60 | *** | 453.00 | |
(Note: “***” indicates that the ion concentration is too low, resulting in ICP-OES cannot measure accurate data).
Disclaimer/Publisher’s Note: The statements, opinions and data contained in all publications are solely those of the individual author(s) and contributor(s) and not of MDPI and/or the editor(s). MDPI and/or the editor(s) disclaim responsibility for any injury to people or property resulting from any ideas, methods, instructions or products referred to in the content. |
© 2024 by the authors. Licensee MDPI, Basel, Switzerland. This article is an open access article distributed under the terms and conditions of the Creative Commons Attribution (CC BY) license (https://creativecommons.org/licenses/by/4.0/).
Share and Cite
MDPI and ACS Style
Cui, Z.; Zhao, Y.; Zhang, Y.; Liu, J.; Hu, Y.; Hu, S.; Wang, Q. Experimental Study of Lithium Extraction in the Solid-Liquid Conversion of Low-Grade Solid Potash Ore. Minerals 2024, 14, 116. https://doi.org/10.3390/min14010116
AMA Style
Cui Z, Zhao Y, Zhang Y, Liu J, Hu Y, Hu S, Wang Q. Experimental Study of Lithium Extraction in the Solid-Liquid Conversion of Low-Grade Solid Potash Ore. Minerals. 2024; 14(1):116. https://doi.org/10.3390/min14010116
Chicago/Turabian StyleCui, Zihao, Yanjun Zhao, Yumeng Zhang, Jingjing Liu, Yufei Hu, Shengzhong Hu, and Qiang Wang. 2024. "Experimental Study of Lithium Extraction in the Solid-Liquid Conversion of Low-Grade Solid Potash Ore" Minerals 14, no. 1: 116. https://doi.org/10.3390/min14010116
Note that from the first issue of 2016, this journal uses article numbers instead of page numbers. See further details here.