
Secondary Deposits as a Potential REEs Source in South-Eastern Europe

1
Geological Survey of Slovenia, 1000 Ljubljana, Slovenia
2
Faculty of Mining and Geology, University of Belgrade, 11000 Belgrade, Serbia
*
Authors to whom correspondence should be addressed.
Minerals 2024, 14(2), 120; https://doi.org/10.3390/min14020120
Submission received: 13 December 2023
/
Revised: 2 January 2024
/
Accepted: 18 January 2024
/
Published: 23 January 2024
(This article belongs to the Special Issue Selected Papers from the 8th and 9th International Conference on Mining and Environmental Protection)
Abstract
:The main objective of this manuscript is to collect, classify, and compile all available data about secondary mineral sources of REEs in the South-Eastern Europe (SEE). The material is generated from the extracting and processing sector, that might be possibly transformed in the business process becoming an important raw material for another industry. The management inventory guide will strengthen communication and dissemination efforts and simultaneously contribute to Europe’s self-sufficiency and support transitioning to green and digital technology. Identification of the knowledge gaps associated with secondary sources of REEs in SEE will contribute to connections between all partners being involved at the beginning, during the lifetime of products and at the end of the life cycle, represented with deposit owners, technology developers and potential processors, producers, and potential users. At the investigated area it was found 1835 individual landfills, most of them belonging to waste rocks. The total quantity of all material in SRM is about 3.2 billion tons on an area of about 100 km2. The largest 95 individual landfills were selected as potential prospective landfills, containing about 1600 million tons of material. The estimated total potential of REEs (ΣREE) is more than 200 Kt. The largest quantities are found in landfills for coal fly ash and Cu flotation, which correspond to more than 80% of the ΣREE. Most of the promising sites are located in Serbia and North Macedonia. It has been calculated that the valorisation potential and perspectivity of REE2O3 is about 32.5 billion USD (prices from December 2022). According to the average concentrations of REEs, the most prospective are the red mud dams but their total volume is limited compared to massive amounts of coal fly ash landfills. The REEs content in all type of investigated materials, especially in coal fly ash in North Macedonia is twice as high as in other countries.
1. Introduction
Rare Earth Elements (REEs) are a group of chemical elements that include seventeen chemical elements with atomic numbers from 57 to 71 (La to Lu), along with scandium (Sc), and yttrium (Y). They can be divided into Light Rare Earth Elements (LREEs) (La-Eu), and Heavy Rare Earth Elements (HREEs) (Gd-Lu, including Y) endowed with unique chemical, physical, magnetic, catalytic, and spectroscopic properties. LREEs have in common increasing unpaired electrons while HREEs have paired electrons. However, the main difference between REEs is in their ionic size, which decreases with increasing atomic number [1]. After an explosion in the industrial applications of these elements in different high-technology devices, green energy, military, medicine, and aerospace industries these elements are currently considered as strategic metals [2]. The REEs are not so rare but completely opposite they are relatively common in the Earth’s crust. The name is related to the difficulty in separation and hence identification. In nature, REEs do not occur as single native metals since they are easily oxidized due to their similar physical and chemical properties. The most abundant REEs are cerium (Ce), yttrium (Y), lanthanum (La), and neodymium (Nd) [3], which have average crustal abundances that are similar to commonly used industrial metals such as chromium, nickel, zinc, molybdenum, tin, tungsten, and lead [4].
Throughout the world, the REEs are present in many primary ore deposits but their availability is limited since their concentration in most ores is relatively low and thus economically less viable [5]. Enrichment of the REEs may occur through primary processes such as magmatic processes and hydrothermal fluid mobilization and precipitation, or through secondary processes that move REEs minerals from where they originally formed, such as sedimentary concentration and weathering. Rare Earth Element deposits and occurrences may be divided into primary (high-temperature) and secondary (low-temperature) deposit types. The most important high-temperature deposits are typically associated with alkaline to peralkaline igneous rocks and carbonatites. Sometimes, they are associated with granites and pegmatites and quite rarely associated with metamorphic settings [6,7,8]. Many important REEs deposits are associated with extremely peralkaline igneous rocks containing complex Na–K–Ca (Fe, Zr, Ti) silicates [9]. The main environments of formation of alkaline igneous rocks and carbonatites, major hosts of many REE deposits are described by Goodenough et al. [10].
Rare-earth ore deposits are found all over the world, but the major exploited ores are in China, the United States, Australia, and Russia, while other viable ore bodies are found in Canada, India, South Africa, and south-eastern Asia [11]. According to estimates, the total worldwide mine reserves amount to about 120,000,000 tones (120 Mt), most of which are in China (44 Mt), Vietnam (22 Mt) and Russia and Brazil with 21 Mt each [3]. The production of REEs has been rising continuously from 2011 till today, particularly in the period between 2017 and 2021 when it increased by more than 2-times (from 130 to 280 Kt) [3,12]. China (168 Kt), United States (43 Kt), Myanmar (26 Kt) and Australia (26 Kt) are currently the leading producers of REEs mined from primary sources [3].
The mining and processing of REEs are complex and expensive [13] because of the extraction of individual metals required by the market, due to the wide variety of REE-bearing ore minerals that each require a different beneficiation process [14]. In general, the extraction and beneficiation processes of REEs are related to significant negative impacts on the environment, which could be reduced by sourcing REEs from secondary resources [15,16]. Currently, the efficient extraction of REE includes many approaches including physical, chemical, and biological procedures, such as pyrometallurgy, solvent extraction, and membrane separation [17]. The major secondary REE sources are represented by (a) coal combustion products, such as fly ash, bottom ash and incinerator ash, and (b) industrial residues, such as metallurgical slags, dross, phosphogypsum, wastewater, mine tailings and red mud from bauxite processing [18].
The annual demand for REEs in 2021 was 125 Kt tons and is projected to rise to 315 Kt by 2030 [19]. Particularly, forecasted extreme growth in electric vehicle and wind turbine production is expected to cause increased demand for neodymium-iron-boron magnets with the addition of praseodymium and dysprosium [20]. Overall, the demand for REE is forecasted to increase by 4 to 5% per year between 2016 and 2026, particularly neodymium, praseodymium, and dysprosium [21]. A recently published report on the global rare earth elements market by Fairfield Market Research suggests that the market will flourish in line with mounting demand from emerging economies, as well as rising reliance on the sustainable resource pool. Up from around 3.5 billion USD in 2021, the rare earth elements market is projected to reach 7.3 billion USD by the end of 2026 [22].
A continuous increase in the demand for modern technological products and limited natural resources is causing a demand and supply gap. To decrease the gap between the rising demand and the risk for sustainable supply, the recovery of REEs from secondary resources also could provide a future supply stream [13,17,23]. The gap between demand and supply is rising and causing an increase in REE prices [19]. In addition, supplies of REEs are controlled by a limited number of sources or producers (countries) [24]. Due to the growing demand for REEs, most REEs have been recently listed as critical raw materials (CRMs) by many countries, including the European Union [25]. The European Commission proposed the Critical Raw Materials Act (CRMA), with the intent to reduce the EU’s dependence on critical raw materials (CRMs) and foster a sustainable level playing field for the EU’s CRM value chains [26].
The main goal of the manuscript is to collect, classify, and establish all available data on potential secondary sources of REEs generated from the extracting and processing sector in eight SEE countries. In the study area, all secondary raw material (SRM) deposits have been classified into four types: waste rocks, processing waste, metallurgical waste, and coal ash.
2. Materials and Methods
2.1. Description of Study Area
The study covers the following eight countries of the Balkan Peninsula: Albania, Bosnia and Herzegovina, Croatia, Kosovo, Montenegro, North Macedonia, Slovenia, and Serbia and. The area studied (approx. 285,000 km2) is relatively small, but complex and diverse in all aspects of geographical, climatic, demographic, religious, linguistic, and economic indicators.
Agricultural areas and heterogeneous agricultural areas mainly comprise the Pannonian Basin, river valleys and individual basins in the foothills. In total, they cover slightly less than 30% of the area [27]. The weather conditions are changeable and are strongly influenced by the sea on one side and the mountains on the other. The northern and central parts of the Balkans are characterized by a Central European climate, while the southern and coastal areas are characterized by a Mediterranean climate [28].
According to estimates [29], there are nominally around 23 million inhabitants in the studied area, who are very unevenly distributed. The Pannonian basin, the river valleys and individual basins in the foothills are predominantly inhabited. The hilly central parts are so to speak, uninhabited. The ethnic composition of the population is, like everything else, extremely complex: Serbs (31%), Albanians (19%), Croats (18%), Bosniaks (8%), Slovenes (8%), Macedonians (5%), Montenegrins (1%), Hungarians (1%). The remaining 9% are represented by numerous minorities or unspecified persons [30]. Three main religions are present and rooted in the region: Orthodox (38%), Islam (26%) and Catholicism (11%). However, about 11% are religiously undefined [31]. The study region is facing severe depopulation, and the population is declining in all countries except Slovenia. A study of demographic databases and population forecasts shows that the highest number of inhabitants was reached in 1990, before the civil war in Former Yugoslav countries (approx. 27 million). According to the results of the demographic development forecasts, the population is expected to fall below 20 million by 2050 [32].
Due to its location and complexity, the area has also had a very turbulent history. The last civil war (1991–2001), which accompanied the break-up of Yugoslavia, had serious consequences and the region has never fully recovered. The total GDP of the region is 270 billion USD [33] and, like everything else, is very diversely distributed The GDP per capita (PPP) is highest in Slovenia (approx. 50,000 USD) and Croatia (approx. 40,400 USD) and lowest in Albania (approx. 17,600 USD) and Kosovo (14,700 USD) [33].
2.2. Geology Settings
The SEE region is divided into the Alpine-Balkan-Carpathian-Dinaride region and the smaller area of the Variscan belt north of the Alps and the Carpathians. Most of the studied region is underlain by rocks of the Alpine-Balkan-Carpathian-Dinaride Chain, a mountain belt formed during the Alpine orogeny that started in the Cretaceous and resulted from the collision of the European plate with various terranes and microplates at the northern margin of Africa (Figure 1) [34,35,36,37].
The system is characterized by inherited metallogenic structures (mainly from the Variscan metallogenic event) in the Inner zones (Eastern Alps, Carpathians), by metamorphogenic deposits (mineral deposits formed during metamorphism and deformation) and by ore deposits related to magmatic activity during subduction processes in the Cretaceous (Banat, Panagyurishte) and Paleogene (Carpathians, Rhodopes) subduction processes. Abducted ophiolitic mélange zones represent suture zones where former oceans have disappeared; these zones form ophiolite belts with chromite, magnesite, and Cyprus-type massive sulphide deposits. Carbonate-bearing Pb-Zn-Ba deposits are developed in the Triassic shelf carbonates affected by extensional tectonics. During the subduction stage, acid to intermediate magmatic rocks intruded in the Carpathians, forming world-class porphyry deposits (Cu, Au, Mo, Bi) associated with Au-rich epithermal veins systems (the Bananitic magmatic and metallogenic belt—BMMB). The BMMB is a complex calc-alkaline magmatic arc of Late Cretaceous age that extend over Bulgaria, Serbia, and Romania It hosts a variety of magmatic-hydrothermal Cu, Au, Mo, Zn, Pb and Fe deposits [35,39,40,41].
The main mineralizing system in the Carpatho–Balkan region is characterized by porphyric and epithermal forms of mineralization where, during the late stages of continental collision and orogenic collapse, asthenospheric melts generated by slab break-off may have played an important role in generating an additional heat source and chemical components essential for mineralization [34]. Later, the andesitic-rhyolitic volcanism of Paleogene age was accompanied by Au and base metal ores in the Carpathians, the Inner Dinarides, and the Rhodopes. Magmatism continues until today with the formation of sulfide ores, barite, bentonite, and perlite ores [42].
Bauxite formations in South-eastern Europe have significant and varying average REE contents but are only the source of primary REE in the region. The most significant bauxite-bearing regions belong to the Dinaric metallogenetic province and are predominantly of Mesozoic age. The bauxite deposits and occurrences belong to the typical karst bauxites, they differ in their stratigraphic position, sizes, and variable mineralogical and chemical compositions suitable for the aluminum industry to low-grade bauxites, and clays. Primary bauxite deposits are regularly significantly enriched in REE, especially in the lowermost parts of the deposit. The karst bauxite ore bodies are relatively numerous and have an irregular shape with relatively small dimensions [43,44,45,46,47].
2.3. SRM Deposits in the Study Area
There is no general definition of secondary raw materials, but they typically include waste materials (e.g., mine tailings), side streams (e.g., slag and ashes), processing residues, the material that is removed during the product life cycle, and the products and their materials that have reached the end of their life cycle. In a circular economy context, SRMs can be traded and shipped in the same way as primary raw materials from traditional extractive resources, which increases the security of supply. However, a pragmatic definition can be derived from the extractive industry legislation (published in the Extractive Waste Directive [48] and the legal definitions of waste and waste management hierarchy regulated by the Waste Framework Directive [49]. In this context, SRMs are materials and products that can be used as raw materials through simple re-use, or recycling and recovery [26].
The countries of the SEE have the potential to extract raw materials from primary and secondary raw material deposits and can increase their self-sufficiency in raw materials by using appropriate, modern, and eco-efficient technology. The data presented in this study (Table A1) were partly obtained during the period of European projects funded by EIT Raw Materials, such as RESEERVE [50], RIS-CuRE [51], RIS-RECOVER [52], RECO2MAG [53] and FutuRaM [54] in which some authors were also involved, partly from the author’s archive documents, which are presented to the public for the first time, as well as from the reports [55,56].
The importance of reusing, recovering, and recycling SRM [18] from the extracting and processing sectors and transformation to the circular economy and environmentally preferred approaches lies in the fact that those enormously huge volumes are already on the surface of the earth, fine-grained and almost ready for further innovative extraction methods [1,57,58,59]. This means that the very demanding and expensive mining activities and all associated logistics for deep underground mining are no longer necessary.
There are different classifications of mining waste deposits but based on the way the mine waste is generated, all SRM deposits in the study area can be categorized into four types (Figure 2) according to Šajn et al., 2022 [55].
- Waste rock (non-mineralized and low mineralized waste). Waste rocks is a heterogeneous material that must be removed to access the ore and is usually deposited near the mine from which it originated. The quantity of waste rocks depends on the geometry and location of the ore body, the mining technique, and the stability of the bedrock [60].
- Processing waste is waste generated during the extraction and processing of ores and minerals. This waste can be subdivided into flotation tailings (Figure 3A) and red mud dams (Figure 4A). Froth flotation is a commonly used technique in which metal is extracted in its pure state. Flotation is a separation technique, where hydrophobic materials isolate from the hydrophilic part [61], while red mud is an alkaline solid waste residue produced from the Bayer process [62,63].
- Metallurgical waste includes smelter (Figure 3B) and ferrous slags. Blast furnace slag formed as a by-product of ironmaking [64] while steel slags are formed as a by-product of steel production produced during the electric arc furnace process in steelmaking, converter steel-making and secondary refining of steel.
2.4. Sampling and Chemical Analysis
The standardized sampling technique could not be selected and implemented at all sites. Combination of following sampling techniques: surface sampling (Figure 5), trench excavation, hand and machine drilling, and hand drilling, etc. had been performed based on the landfills shape, size, type of sampled material and grain size [55].
In surface sampling, a composite sample (samples formed from several subsamples) is taken at a central point and at 4 points 50–100 m away from the central point in the N, W, S and E directions. A soil profile of about 1 m was excavated at the defined points, from which the unaltered material was sampled (Figure 5). The collected composite material was mixed and packed in a plastic bag. Using this method, 82 samples were collected between 2019 and 2023 from 39 sites: 8 from Cu flotation tailings, 35 from Pb-Zn-Sb flotation tailings, 9 from smelter slags, 4 from red mud and 26 from coal ash (Table A2).
The next sampling method is hand drilling that was carried out to a depth of about 4 m. Usually, the composite sample of 1 m was sampled. This sampling method has been performed mainly in Macedonia: Cu flotation tailing (Bučim), and Pb-Zn flotation tailings (Probištip, Sasa, and Toranica). Total number of collected samples using the hand drilling is 27 (Table A2).
In those cases where conditions allowed, the samples were collected from a narrow trench. This means that the surfaced weathered material along the entire length of the trenches was removed and sampled composite samples at various length intervals. The samples we collected using this method were from flotation tailing (Sb-Cr) Lojane and coal ash Bitola and Oslomej. Total number of collected samples is 11 (Table A2).
The machine drilling was performed at 4 locations (Bor, Gradac, Bučim and Veles). Three boreholes were drilled in the Cu flotation tailings Bor and Bučim, seven boreholes in the Pb-Zn smelter slags Veles, and only one borehole in the Pb-Zn flotation tailing Gradac. The composite samples obtained from the machine drilling are collected from the various length intervals from the top to the bottom of the tailings. One sample represents the composite material from every two meters of the borehole. The total number of samples collected using this method is 207 (Table A2).
Selected 289 collected samples (2018–2022) have been taken to the laboratory, where a pre-analytical sample preparation was carried out. The samples had been dried at 40 °C, then may be crushed, ground, and then sieved (typically 125 μm) and homogenized before analysis. The elemental contents of 65 elements were determined by ICP-MS and ICP-AES at Bureau Veritas Commodities Canada Ltd., in Vancouver, Canada [68] (accredited under ISO 9001:2015 [69] after aqua regia digestion (at 95 °C, using the 1DX method) and total 4-acid digestion following international standards (ISO 14869-1:2001 [70]). However, only REEs are presented this study: Ce, Dy, Er, Eu, Gd, Ho, La, Lu, Nd, Pr, Sc, Sm, Tb, Tm, Y, Yb (Table A3).
The analytical set includes samples, duplicates, and certified reference material (DS8, OREAS 24, and OREAS45) in order to assure quality control. The set of samples, standard materials and replicants has been coded and then packed in a random order and sent to the laboratory. This procedure ensures unbiased treatment of samples as well as random distribution of analytical errors during analytical treatment.
3. Results and Discussion
3.1. Potentially Perspective SRM Deposits
In general, the waste rocks are unpromising poor ore for the possible sources of REEs and further extractions methods. Compared to the other considered SRM, this material is coarse-grained, mainly in the form stony masses. Due to the roughness of the material, sampling a representative sample is very difficult and impossible without very demanding equipment. Based on the preliminary chemical analyses, metallurgical waste has extraordinarily low concentrations of REEs. Thus, we decided to exclude them from further consideration.
All other SRM deposits (flotation tailings, smelter slags red mud dam in coal ash) are considered as promising due to their enrichment with REEs. More than 1600 Mt of material was selected from 95 individual landfills in 66 locations (Table 1 and Table A1, Figure 6).
All basic data about every individual perspective location is described with the following information: Country, Type of SRM deposit, Number of Landfill, X coordinate, Y coordinate, Area of deposit and Quantity of material (Table A1). The largest amounts of the waste material have been found in three Cu flotation tailings: Bor-Krivelj (420 Mt) and Majdanpek (350 Mt) in Serbia, and Bučim (130 Mt) in North Macedonia. This is followed by coal ash landfills in the vicinity of the thermal power plants: Nikola Tesla (150 Mt) and Kostolac (68 Mt) in Serbia and Kosovo (73 Mt) in Kosovo. The Red Mud landfills, which are otherwise the most promising, contain only limited amounts of material from 8 Mt—Podgorica in Montenegro to 1 Mt—Dobro Selo, in Bosnia and Herzegovina (Table 1, Figure 6).
The third group is flotation waste which is generated during the production of lead, zinc or antimony, which amounts to more than 140 Mt or about 25%. They are followed by smelter slags with an estimated amount of (34 Mt) and red mud dam (20 Mt). The last two groups comprise only about 3 percent of the total amount of perspective material (Table 1).
The largest quantities have been found in Serbia, more than 1000 Mt, almost two-thirds of the total material. This is followed by North Macedonia with approximately 250 Mt or 16% and Kosovo with 140 Mt or 8% of the total material. All other five countries (Albania, Bosnia and Herzegovina, Croatia, Montenegro, and Slovenia) possess approximately 180 Mt or 12% of the total amount (Table 1).
3.2. Contents of REEs in SRM
For selected elements, the accuracy and precision have been calculated in order to test QA-QC. For the selected elements, it was found that precision for Ce (5.7%), Dy (7.0%), Er (5.8%), Eu (5.5%), Gd (6.2%), Ho (3.9%), La (8.0%), Lu (3.7%), Nd (12.6%), Pr (6.2%), Sc (5.4%), Sm (4.8%), Tb (3.8%), Tm (3.3%), Y (4.4%) and Yb (10.9%) and accuracy for Ce (7.5%), Dy (6.2%), Er (8.4%), Eu (8.4%), Gd (7.8%), Ho (7.9%), La (9.3%), Lu (8.8%), Nd (6.7%), Pr (7.0%), Sc (6.6%), Sm (6.5%), Tb (15.4%), Tm (11.8%), Y (8.0%), Yb (6.9%).
Univariate (ANOVA) and multivariate statistical methods (correlation coefficients) were used to assess the REE distribution.
Using the analysis of variance (ANOVA), we mainly tested whether there were statistically significant differences in the REE concentration in the samples within a single landfill, between landfills in the area of a single site (location) and whether there were differences in relation to the depth of sampling. In addition, the differences between the materials in the landfills (Cu flotation tailing, Pb-Zn-Sb flotation tailings, smelter slags, red mud and coal fly ash), between sites of the same material, and the differences by sampling area were tested. In particular, the hypothesis that there are differences in REE concentration between North Macedonia and the rest of the study area was also tested. The F-test was applied to test the above differences.
It was found that there are no statistically significant differences in REE concentrations within individual landfills and between individual landfills at the same site. The same was found that there are no statistically significant differences in terms of sampling depth. The proportions of the variances are extremely low and not statistically significant.
The situation was quite different when the differences between defined materials, between sites and between the materials was examined. As expected, the largest proportion of variance is accounted for by the differences between the sampled materials (Cu flotation tailings, Pb-Zn-Sb flotation tailings, smelter slags, red mud and coal fly ash), followed by very characteristic differences in the REE concentrations in North Macedonia and the other investigated areas. Much lower, but the differences between the sites are statistically significant.
The bivariate analysis shows that all rare earths (Ce, Dy, Er, Eu, Gd, Ho, La, Lu, Nd, Pr, Sc, Sm, Tb, Tm, Y, Yb) have high characteristic correlation coefficients (r > 0.9). This is somehow expected due to similarities in their common natural occurrence, chemical properties, behavior, and natural enrichment (Table A4).
The proportions are uniform for all types of REEs materials, only Sc has slightly higher concentration variability. Five REEs account for more than 5% of the total suspected REEs. The largest percentage is Ce (38% of the total ΣREE), followed by La (16%), Nd (15%), Y (13%) and Sc (8% of the total ΣREE). Other rare earths have relatively low concentrations and consequently their percentages in ΣREE. Therefore, in further discussion, they will be grouped in two subgroups and used in the description. The first group comprises as a sum of all other LREEs (Eu, Gd, Pr and Sm) and second group HREEs (Dy, Er, Ho, Lu, Tb, Tm, Y).
The relatively high proportion of Nd (approximately 15% in average) is quite promising information, since it is most desirable element in the production of magnets. The proportions of Sm (3.2%) and Dy (2.5%) are very low, so their possible extraction is questionable.
The REEs enrichments are very variable across the study area except of North Macedonia (Table 2). Their average values of REEs in red mud is around 1100 ppm which in general is an interesting value. But at the same time, we must be aware that those resources are very limited on 20 Mt in the study area. The quantities of other studied materials are incomparably higher but the levels of REEs are much lower. Quite attractive levels of REEs are found in the coal ashes, approximately 170 ppm. There is no significant difference between Cu and Pb-Zn-Sb flotation landfills. The lowest levels have been measured in the smelter slugs, less than 60 ppm (Table 2).
After reviewing the analytical data, surprisingly high levels of REEs have been found in North Macedonia in all types of deposits. Surprisingly, their levels are 3–4 times higher than in other studied countries in flotation landfills and smelter slag. The average content of ΣREEs in coal ash is three times higher (510/170 ppm) than in other SEE countries (Table 2). This might be explained with geological background rock in North Macedonia. Paleozoic and Proterozoic granites and gneisses are belonging to the old geotectonic structures of Rhodopes, the Serbian/Macedonian massif and the Pelagonides [37,38]. The rock composition is like Scandinavian, where identified REEs ore bodies are bound to carbonatites or alkaline magmatism. Considering the fact that REEs enrichment is present in all materials, it could be possibly consequences of erosion of primary deposits. In the future, it would make sense to start with prospection of primary REEs deposits in North Macedonia.
3.3. REEs Quantities in Potential Perspective SRM Deposits
After obtaining two important parameters, the total content in secondary deposits and the results of chemical analysis, the valorization and quantification of perspective deposits can begin. According to the results of the ANOVA (statistically significant differences between sites), the calculation of the amount of REEs was performed only for the landfills at the sampled sites. Considering that we mainly sampled large, important landfills, we captured about 60% of the individual landfills but 95% of the total perspective material. So, for most of the material (95%), the REE quantities were actually calculated based on the REE concentration, for only 5% the amounts were estimated.
It is important to mention that the chemical analyses were not performed at some sites, but the concentration has been estimated based on the concentrations in material of the same origin. These SRM landfills represent a very small number compared to the analyzed landfills.
Depending on the type of material, the largest quantities are determined in coal ash (94 Kt), which represents 46% of total amount. It is followed by Cu flotation landfills with 75 Kt REEs (37%). On the third place are red mud dams with 20 Kt or 10%. The last places are sharing these two types of landfills, Pb-Zn-Sb flotation tailings and smelter slugs with 16 Kt or 8% (Table 3, Figure 7).
The largest amount of REEs is identified in coal ash landfill: Nikola Tesla (38 Kt) and Kostolac (13 Mt) in Serbia and Bitola (18 Kt) and Oslomej (8.0 Kt) in North Macedonia, followed by Cu flotation tailing: Bučim (28 Kt) in North Macedonia, Majdanpek (23 Kt) and Krivelj (19 Kt) in Serbia, Podgorica red mud dam (12 Kt) in Montenegro. These eight locations represent around ¾ of the total estimated potential in the study area.
Reviewing the countries, the largest volumes are found in Serbia, approximately 100 Kt, what is about half of the total potential volume of all REEs. Around one-third of total potential or 63 Kt is found in North Macedonia, 17 Kt in Bosnia and Herzegovina and 15 Kt in Montenegro. The lowest volumes about 8 Kt are determined in the remaining countries: Kosovo and Slovenia) or less than 10% of the total amount (Table 3, Figure 7).
For the remaining landfills that were not covered by samples, their REE concentrations were estimated analogous to the formation of ores and were concluded to contain about 10 Kt of REEs, which is less than 5% of the calculated amount supported by accurate analytical data. The Obrovac red mud landfill stands out the most, estimated to contain about 1.3 Kt of REEs.
3.4. REEs Values of Potentially Perspective SRM Deposits
The worth of REEs in oxidic or metal form can be easily calculated from the estimated potential volumes of REE, Metal/Oxide Price (Institute for rare earths and metals AG, Shanghai Metals Market (SMM)—December 2022 [72,73,74]), and Metal/Oxide Ratio. The calculated potential worth of REEs have been performed based on the oxide REE2O3 prices, since the technological processes for extraction and separation of the REEs are very demanding. Thus, we assumed such processes for recovering and extraction won’t be applied in the study area. However, the estimated values based on oxides are much lower compering to metal-based estimations [72,73,74].
When calculating values based on REEs oxides, the Metal/Oxide Ratio must also be considered. The estimated amount of oxide (248 Kt) is approximately 20% higher than the estimated amount of REEs metal (205 Kt). Otherwise, we must be very careful when displaying REEs or referencing a data from the literature, since one time is shown a value for metal, other time a value for oxide with or without Sc.
It was mentioned before that only 5 REEs (Ce, La, Nd, Sc and Y) have a share greater than 5% of the total REEs. Other rare earths have relatively low concentrations and consequently also shares in ΣREE.
Therefore, they will be considered as two separate groups, one with the remaining light rare earth LREEs (Eu, Gd, Pr, Sm) and the entire group of heavy rare earth HREEs (Dy, Er, Ho, Lu, Tb, Tm, Y). The total valorized potential of REE2O3 (250 Kt) is estimated at almost 32.5 billion USD in the study area. For the remaining landfills that we did not sample, we estimated the REE2O3 value at USD 1.8 billion, which is about 5% of the calculated value.
Comparison between identified potential quantities, REEs oxide prices and potential values are presented in Table A5. So, the most abundant REEs have a low price. Prices for oxides La, Ce, Sm and Y are below 10 USD per kilogram. Prices of oxides Yb, Eu, Er, Gd and Pr range from 10–100 USD per kilogram. Nd, Ho, Tm and Dy oxides have higher prices, in the range of 100–500 USD. Oxides of Lu (840 USD/kg), Sc (900 USD/kg) and Tb (2000 USD/kg) have the highest prices (Table A5) [72,73]
Considering the mentioned facts, such as the relative share of REEs and the prices of REEs, it can be concluded that the most profitable exploitation of Sc, Nd and Dy. The potential values of the listed REE2O3 are Sc2O3 (22,700 million USD), Nd2O3 (3700 million USD) and Dy2O3 (1900 million USD).
According to the type of the deposited material, the highest values of REE2O3 are determined in the coal ash landfills (14,300 mil. USD), which represents more than 45% of the total REE2O3 value. It is followed by Cu flotation landfills (13,200 million USD), with a share of about 40%. Only in third place are the REE2O3 values in red mud (2800 million USD), which represents less than 10% share. Pb-Zn-Sb flotation landfills and smelter slags are of minor importance and together represent only 10% of the total amount of REEs (Table 4).
In the review made per SEE countries, the highest REE2O3 values have been found in Serbia (18,700 mil. USD), which is more than half of the total potential value of REE2O3. Next interesting values are found in North Macedonia around 7600 million USD or ¼ of the total value of REE2O3. Following four countries: Slovenia, Montenegro, Bosnia and Herzegovina, and Kosovo are having about 20% of the total calculated amount of money (Table 4).
All SRM deposits have been ranked according to the determined concentrations into 4 concentration classes: (<100 ppm, 100–200 ppm, 200–500 ppm and >500 ppm). The first class has the lowest perspective, and 4th the highest. The lowest class has the most landfills, a total of 59 with an estimated amount of material of 990 Mt., the second 14 landfills (150 Mt), the third 9 (370 Mt) and the highest 5 (Birač, Dobro Selo, Kidričevo, Podgorica and Oslomej) with an estimated amount of material of 31 Mt (Table 5).
The first and second class consist mainly of flotation tailings and smelter slags, the third class include coal ashes and fourth class represents the red mud dams. The more perspective classes, 2 and 3 have a value around 16,000 million USD or approximately half of the total potential value. Because the red Mud dam landfills have limited volumes, represent only 9% of the total potentially estimated value.
It seems, that future promising sources of REEs could be the coal ash landfills even though concentrations of REEs are not so high but on other hand their reserves are almost unlimited.
It is a fact that relatively high concentrations of REEs in all considered secondary deposits is particularly promising. For Coal Ash landfill TE Bitola it is 350 ppm REEs, and for TE Oslomej 670 ppm REEs. In particular, the last value is already at the level of concentrations in the red of mud dams. In addition to this, the Northern Macedonia the geotectonic structures of the Rhodope Mountains, the Serbian-Macedonian massif and the Pelagonids continue into Greece and Bulgaria [36].
In the Greek side of the Pelagonia, there are coal ash landfills of the Agios Dimitrios, Amyntaio, Florina/Meliti, Kardia and Ptolemaida thermal power plants (230 Mt). It makes sense to expect similar concentrations in coal ashes as in Oslomej and Bitola, because it belongs to the same coal layer.
In this case, we can expect similar concentrations in the ash as in the landfills of the Oslomej and Bitola thermal power plants since it is the same coal layer origin. There are also numerous ash landfills in Bulgaria (Bobov Dol, Maritsa, Maritsa Iztok and Republika) with 165 Mt, most probably with similar concentrations of REEs, but this has not yet been proved by chemical analysis.
On a global scale, the potential values of REEs represent approximately ¾ of the world’s annual production [3], which is not negligible, especially if we consider the fact of their general inaccessibility or the fact that most of the production is concentrated in China. Regarding the material, we should also mention that the materials of the secondary deposits are fine-grained and lie on the surface, which means that mining and all accompanying procedures are not needed for their extraction. All these very expensive procedures that must be done in primary ore deposits can in the other side make identified SRM more interesting for extraction and consequently more profitable in the future.
3.5. Recovery Methods for REEs from SRM
A continuous increase in the demand for modern technological products and limited natural resources is causing a demand and supply gap. To decrease the gap between the rising demand and the risk for sustainable supply, the recovery of REEs from secondary resources also could provide a future supply stream. In recent years, there are developed different existing recovery methods from secondary resources that sometimes require a series of processes that are not yet well-accepted [23]. Recycling is one of the pillars of the secondary supply chain. In general, the knowledge of recovery methods is mainly based on laboratory tests, and very rarely on recovery methods in semi-industrial and industrial plants. Intensive development of innovative metal recovery techniques from mineral and processing waste has become important in recent years.
Slags from the metal-processing industry are crucial to the extraction and refinement of metals created when a charge of flux material, either added to or included in the charge, reacts with unwanted minerals during extraction or smelting, or with byproducts of the oxidation of unwanted solute elements during refining [75]. Abhilash et al. [76] tested the extraction of REEs from granulated blast furnace slag (GGBFS) using a chemo-organotrophic bacteria Gluconobacter oxydans. The recovery of REEs was 42% La, 56% Ce, 65% Nd, and 34% Er in 12 days. Similarly, Mikoda et al. [77] in their research showed the efficiency of another biotechnological application using Acidithiobacillus thiooxidans of Copper and Lead slag. The experiments showed that under optimal conditions as much as 55% of REES can be recovered from Lead slag and up to 99% of REEs from Granulated Copper Slag. Before the bioleaching tests, Abhilash et al. [78] tested extraction of REEs from blast furnace slag using sulfuric acid leaching, optimizing the extraction parameters of acid concentration, temperature, and pulp density. The experiments showed that at 1 to 5 weight/volume percent pulp density using particles smaller than 250 µm with 1 M sulfuric acid for one hour at room temperature recovery rates of approximately 92, 36, 35 and 52 percent for La, Ce, Nd and Er, respectively (Table 6).
A highly alkaline polymetallic waste product of the Bayer process used to produce alumina is known as red mud. It contains metals that are essential to the long-term growth of modern society. Due to a global shortage of resources for many metals, the efficient large-scale processing of red mud has become very interesting recently for both the industry and researchers [88]. The bauxite residue is probably the most studied secondary resource [89,90,91,92,93]. REEs can be recovered from bauxite residue by direct leaching. The main disadvantages of direct acid leaching are the consumption of large amounts of acid for neutralization, the operation of large volumes of effluents, and the difficulty in using the bauxite residue after leaching. Direct acid leaching dissolves large amounts of major metals such Al, Fe, etc. [79]. Alkali roasting of bauxite residue at 950 °C with sodium carbonate followed by water leaching at 80 °C can remove about 75 wt% of alumina. More than 98% of the iron can be recovered by smelting. Acid leaching at 90 °C can leach about 80% of scandium. However, the recovery yields of the other REEs and titanium are very low, especially for the light REEs (<5%) Borra et al. [80]. In their research, Borra et al. [83] show selective extraction of REEs from red mud based on sulfation and roasting before leaching of red mud. About 60% Sc and more than 90% of the other rare earths can be recovered with a low amount of Fe (<1%) in the solution. Qu et al. [81] tested the bioleaching performance of chemoheterotrophic bacterium Acetobacter sp. They show the ability to extract Al, Lu, Y, Sc, and Th (55%, 53%, 61%, 52%, and 53%) under a one-step process at 2% pulp density. The study by Zhang et al. [82] showed a high extraction rate of REES from red mud via aerobic and anaerobic bi-stage bioleaching of red mud by Acidianus Manzaensis with the addition of pyrite (Table 6).
The mining industry generates a large number of waste material stored on the earth’s surface but can be a good secondary source of minerals and elements. Reprocessing REEs from already-stockpiled mine waste is more environmentally friendly than mining non-renewable virgin ore from the Earth’s crust. Recovering secondary resources will prevent the depletion of limited primary resources, promote biodiversity, reduce the production of radioactive elements and dust, reduce energy use, lower CO2 emissions, and decrease disposal area [94]. Echeverry-Vargas & Ocampo-Carmona [58] propose a process of acid leaching of mine tailings that are rich with monazite which is a potential source of LREEs. The leaching process carried out with HCl indicated the recovery of approximately 90% of Lanthanum and Neodymium and approximately 60% of Cerium. Fleming et al. [84] experimented on the recovery of REEs from copper ore processing. The leaching had been performed by hydrochloric and nitric acid separately. The best leaching agent for those elements was hydrochloric solution, obtaining a maximum recovery efficiency of 64%. Sarker et al. [85] have reviewed different hydrometallurgical and bio-hydrometallurgical processes for recovering REEs from mining tailings. Traditional hydrometallurgical methods, such as solvent extraction and acid leaching can be resource-intensive, but quite often could lead to adverse environmental impacts. The authors believe in the development of methods for selectively recovering and/or removing valuable and valueless material, including potentially toxic minerals from tailings. The bio-hydrometallurgical methods such as bioleaching are most probably the cheapest and most environmentally friendly methods for metal recovery from low-grade resources, but a slow recovery rate and excessive heat generation are the main downsides of this method [95] (Table 6).
Coal combustion produces a large volume of solid wastes including bottom ash, fly ash, and gypsum from limestone-based flue gas desulphurization [96]. The impact of coal utilization on economics and the environment can be reduced by using Coal Combustion Products (CCPs) as a potential deposit of secondary REEs. Huang et al. [86] in their study successfully recovered REEs from CCPs using ionic liquids and leaching. The recovery rate of REEs was 37% and La, Ce, Nd, Gd, Y, Er, Tm, Yb and Lu could be detected from the recovered samples. Coal Fly Ash (CFA) is one of the most promising secondary sources of rare earth elements. Pan et al. [66] in their research studied the recovery of REEs and yttrium from CFA that was sampled from a power plant which utilizes feedstock with an elevated content of REEs and yttrium. For the recovery process, they utilized acid leaching on a preconcentrate product obtained from the physical separation processes. The achieved leaching efficiency of REEs was almost 80%, compared to only 43% for raw CFA. Tang et al., [67] made comparison between direct leaching and alkali fusion-leashing. The total extraction efficiency using direct leaching was much lower (only 23%) compared with the alkali fusion-leaching where the leaching rate reaches 58%. In their study, Park & Liang [65] tested three microbial strains, Candida bombicola, Phanerochaete chrysosporium and Cryptococcus curvatus on their performance of leaching REEs from fly ash. The highest leaching efficiency was by C Candida bombicola around 60%. These results are promising and can indicate a good method for the recovery of REEs from CFA as it is relatively cheap and has a low environmental impact (Table 6).
4. Conclusions
The main aim of the study is systematization and presentation of all available secondary deposits of Rare Earth Elements in the following eight countries of the Balkan peninsula: Slovenia, Croatia, Bosnia and Herzegovina, Serbia, Macedonia, Montenegro, Kosovo, and Albania. The fragmented data have been collected, systematized, and presented in a form that can improve our knowledge about the availability REEs but at the same time it will fill the gaps and improve access to necessary data.
At the investigated area it was found 1835 individual landfills, most of them belong to the waste rocks. The total quantity of all material in SRM is about 3.2 billion tons covering about 100 km2. The biggest 95 individual landfills have been selected as potentially perspective landfills containing around 1600 Mt. The highest quantities are found in Cu flotation tailings with 920 Mt, followed by coal fly ash with 490 Mt, and Pb-Zn-Sb flotation tailings with 160 Mt. The lowest quantities are found in smelter sludge (35 Mt) and red mud (20 Mt).
Using of combination of different sampling techniques (surface sampling, trenching, machine drilling, and hand drilling), a total of 327 samples have been collected: 134 from Cu flotation and 68 from Pb-Zn-Sb flotation landfills, 91 from smelter slags, 4 from red mud dam and 30 from coal ash landfills.
Throughout the study area (accept North Macedonia), REEs enrichment is highly variable, but the highest levels have been identified in the red mud dams, where the average value of REEs is about 1100 ppm while the levels in the smelter slugs are c. 60 ppm. However, the most promising red mud dams are quite limited to 20 Mt respectively the REEs contents are much higher in all types of deposits in North Macedonia compared to all other countries, especially in flotation landfills and smelter slugs. This could possibly be a consequence of the weathering and erosion process of the primary deposits. Therefore, it would be reasonable to consider some prospection activities of primary REEs deposits in North Macedonia, in the future.
The total estimated potential of REEs (ΣREE) is more than 200 Kt. The largest quantities are found in coal ash (97 Kt) and Cu flotation landfills (75 Kt), which corresponds more than 80% of the ΣREE. The most perspective deposits are in Serbia with 100 Kt and North Macedonia with 63 Kt.
It was calculated that the valorization potential and perspectivity of REE2O3 is about 250 Kt or almost 32.5 billion USD. The most abundant REEs are Ce, La, Nd, Y, and Sc, followed by the group comprising other LREEs (Eu, Gd, Pr, and Sm) and HREEs (Dy, Er, Ho, Lu, Tb, Tm, and Y). But their prices show an opposite trend, with the most abundant REEs having the lowest prices. The most profitable rare earths are Sc (USD 22,700 million), Nd (USD 3700 million) and Dy (USD 1900 million) in the study area. The highest values of REE2O3 are found in the coal ash landfills (USD 14,300 million), which is more than 40% of the total REE2O3 value, followed by Cu flotation landfills (USD 13,200 million), also with a share of about 40%. In third place are red mud dams (USD 2700 million) or 10% of the total REE2O3 value.
The highest REE2O3 values have been found in Serbia (USD 18,600 million), which corresponds to more than half of the total potential. The next most interesting values are found in North Macedonia with around USD 7600 million or 1/4 of the total value of REE2O3, followed by Bosnia & Herzegovina (USD 2900 million) and Montenegro (USD 2200 million). The last two with a share of less than 10%. For the territories of the remaining countries, we found less than 10% of the total amount of REE2O3.
The REEs content in all type of materials, especially in coal ash in North Macedonia is twice as high as in other countries. It is reasonable to expect further similar concentrations in coal ash landfills in Greece and Bulgaria as the geotectonic structures of the Rhodope Mountains, the Serbian-Macedonian Massif and the Pelagonides continue into Greece and Bulgaria. However, this must be proven in future by chemical analyses.
Author Contributions
Conceptualization, R.Š.; methodology, R.Š.; software, R.Š.; validation, R.Š. and J.A.; formal analysis, R.Š.; investigation, R.Š. and I.R.; resources, R.Š. and I.R.; data curation, R.Š.; writing—original draft preparation, R.Š., J.A. and I.R.; writing—review and editing, R.Š. and J.A.; visualization, R.Š.; supervision, R.Š. All authors have read and agreed to the published version of the manuscript.
Funding
This research was partially funded by EIT RM projects: RESEERVE proposal number 17029, RIS-CuRE proposal number 18248, RIS-RECOVER proposal number 17128, RECO2MAG proposal number 21043 and EU project FutuRaM proposal number 101058522.
Data Availability Statement
The datasets used and/or analyzed during the current study are available from the corresponding author upon reasonable request.
Conflicts of Interest
The authors declare no conflict of interest.
Appendix A

Table A1.
SRM—Basic information.
| Location | Country | Type | Landfills | Longitude (WGS84) | Latitude (WGS84) | Area (ha) | Quantity (Mt) |
|---|---|---|---|---|---|---|---|
| Fushë Arrëz | Albania | FT (Cu) | 1 | 20.03452 | 42.07908 | 18.1 | 3.1 |
| Golaj | Albania | FT (Cu) | 1 | 20.38663 | 42.23310 | 3.8 | 1.0 |
| Kurbnesh | Albania | FT (Cu) | 1 | 20.08078 | 41.77692 | 12.6 | 3.5 |
| Mjedë | Albania | FT (Cu) | 1 | 19.64859 | 42.01219 | 0.8 | 0.2 |
| Pukë | Albania | FT (Cu) | 1 | 19.89385 | 42.03827 | 13.3 | 3.8 |
| Rehovë | Albania | FT (Cu) | 1 | 20.62253 | 40.48963 | 4.3 | 0.6 |
| Reps | Albania | FT (Cu) | 1 | 20.02438 | 41.86733 | 12.4 | 3.7 |
| Rreshën | Albania | FT (Cu) | 1 | 19.86302 | 41.77247 | 3.2 | 0.5 |
| Spaç | Albania | FT (Cu) | 1 | 20.04841 | 41.90473 | 2.0 | 0.5 |
| Kukës | Albania | SS (Cu) | 1 | 20.45926 | 42.06782 | 12.7 | 3.0 |
| Laç | Albania | SS (Cu) | 2 | 19.70469 | 41.65031 | 5.6 | 1.5 |
| Rubik | Albania | SS (Cu) | 2 | 19.78215 | 41.77979 | 5.3 | 1.4 |
| Sase-Srebrenica | B & H | FT (Pb-Zn) | 3 | 19.35978 | 44.13586 | 23.5 | 2.0 |
| Veovača | B & H | FT (Pb-Zn) | 1 | 18.35428 | 44.13725 | 5.4 | 2.0 |
| Birač | B & H | RM | 1 | 19.07092 | 44.46442 | 93.9 | 8.0 |
| Dobro Selo | B & H | RM | 1 | 17.77209 | 43.26029 | 70.0 | 1.0 |
| Gacko | B & H | CA | 1 | 18.50173 | 43.17441 | 25.6 | 15.6 |
| Kakanj | B & H | CA | 1 | 18.12355 | 44.08501 | 29.5 | 12.0 |
| Stanari | B & H | CA | 1 | 17.79338 | 44.75961 | 20.5 | 0.7 |
| Tuzla | B & H | CA | 2 | 18.60380 | 44.53586 | 185.5 | 25.7 |
| Ugljevik | B & H | CA | 1 | 18.97579 | 44.66983 | 44.4 | 12.4 |
| Zenica | B & H | CA | 1 | 17.87721 | 44.23208 | 7.0 | 2.0 |
| Obrovac | Croatia | RM | 1 | 15.65613 | 44.22300 | 30.9 | 1.3 |
| Plomin | Croatia | CA | 1 | 14.15970 | 45.13034 | 21.6 | 1.0 |
| Badovac | Kosovo | FT (Pb-Zn) | 2 | 21.21735 | 42.60436 | 57.4 | 10.0 |
| Leposavić | Kosovo | FT(Pb-Zn) | 2 | 20.78674 | 43.10876 | 33.4 | 6.4 |
| Novo Brdo | Kosovo | FT (Pb-Zn) | 1 | 21.43332 | 42.63736 | 5.5 | 0.5 |
| Zvečan | Kosovo | FT (Pb-Zn) | 3 | 20.85641 | 42.91068 | 109.8 | 42.0 |
| Zvečan-Mitrovica | Kosovo | SS (Pb-Zn) | 2 | 20.87150 | 42.88992 | 45.0 | 5.5 |
| Kosovo | Kosovo | CA | 2 | 21.06899 | 42.67144 | 422.7 | 73.2 |
| Gradac | Montenegro | FT (Pb-Zn) | 1 | 19.15053 | 43.39931 | 12.6 | 3.0 |
| Mojkovac | Montenegro | FT (Pb-Zn) | 1 | 19.57599 | 42.96140 | 19.4 | 5.7 |
| Šuplja Stijena | Montenegro | FT (Pb-Zn) | 2 | 19.05946 | 43.37857 | 18.2 | 3.0 |
| Podgorica | Montenegro | RM | 1 | 19.21822 | 42.38316 | 52.5 | 8.0 |
| Pljevlja | Montenegro | CA | 1 | 19.31434 | 43.32904 | 73.0 | 10.0 |
| Bučim | N. Macedonia | FT (Cu) | 1 | 22.37727 | 41.67626 | 250.2 | 131.0 |
| Lojane | N. Macedonia | FT (Sb-Cr) | 2 | 21.68045 | 42.22107 | 3.2 | 0.5 |
| Probištip | N. Macedonia | FT (Pb-Zn) | 3 | 22.17902 | 41.98516 | 97.7 | 30.0 |
| Sasa | N. Macedonia | FT (Pb-Zn) | 3 | 22.52713 | 42.10669 | 48.1 | 20.0 |
| Toranica | N. Macedonia | FT (Pb-Zn) | 1 | 22.44870 | 42.20034 | 12.4 | 10.0 |
| Veles | N. Macedonia | SS | 1 | 21.75548 | 41.73595 | 3.8 | 1.8 |
| Bitola | N. Macedonia | CA | 1 | 21.49268 | 41.04638 | 189.8 | 52.4 |
| Oslomej | N. Macedonia | CA | 1 | 21.00093 | 41.57527 | 32.0 | 12.0 |
| Bor | Serbia | FT (Cu) | 3 | 22.11328 | 44.06941 | 129.8 | 80.0 |
| Cerovac | Serbia | FT (Cu) | 1 | 22.02619 | 44.16596 | 2.5 | 0.6 |
| Krivelj | Serbia | FT (Cu) | 3 | 22.13842 | 44.09517 | 481.5 | 340.0 |
| Majdanpek | Serbia | FT (Cu) | 1 | 21.94451 | 44.38787 | 446.9 | 350.0 |
| Grot | Serbia | FT (Pb-Zn) | 1 | 22.16732 | 42.56455 | 25.6 | 5.5 |
| Lece | Serbia | FT (Pb-Zn) | 1 | 21.58800 | 42.88517 | 23.1 | 2.7 |
| Rudnica | Serbia | FT (Pb-Zn) | 2 | 20.68676 | 43.23871 | 20.2 | 5.5 |
| Rudnik | Serbia | FT (Pb-Zn) | 1 | 20.48978 | 44.10877 | 40.8 | 8.7 |
| Stolice | Serbia | FT (Pb-Sb) | 1 | 19.32423 | 44.40741 | 4.9 | 1.3 |
| Veliki Majdan | Serbia | FT (Pb-Sb) | 2 | 19.30238 | 44.28135 | 5.7 | 1.9 |
| Bor | Serbia | SS (Cu) | 2 | 22.10790 | 44.08148 | 39.7 | 17.0 |
| Zajača | Serbia | SS (Pb-Sb) | 1 | 19.24480 | 44.44804 | 6.6 | 0.6 |
| Kolubara | Serbia | CA | 1 | 20.31216 | 44.48237 | 93.4 | 10.7 |
| Kostolac | Serbia | CA | 2 | 21.18699 | 44.71628 | 355.2 | 68.0 |
| Morava | Serbia | CA | 1 | 21.16366 | 44.21965 | 51.3 | 4.6 |
| TENT | Serbia | CA | 2 | 20.10208 | 44.66020 | 937.4 | 151.8 |
| Žerjav | Slovenia | FT (Pb-Zn) | 1 | 14.87606 | 46.47970 | 12.6 | 3.5 |
| Cinkarna Celje | Slovenia | SS (Pb-Zn) | 1 | 15.27414 | 46.23272 | 7.1 | 1.9 |
| Litija | Slovenia | SS (Pb-Zn) | 1 | 14.82078 | 46.05690 | 4.4 | 1.1 |
| Žerjav | Slovenia | SS (Pb-Zn) | 1 | 14.86731 | 46.47689 | 1.6 | 0.4 |
| Kidričevo | Slovenia | RM | 1 | 15.77349 | 46.39568 | 65.1 | 1.6 |
| Šoštanj | Slovenia | CA | 1 | 15.07687 | 46.37640 | 45.6 | 12.0 |
| TE-TO | Slovenia | CA | 4 | 14.91054 | 46.13655 | 64.9 | 12.5 |
| Trbovlje | Slovenia | CA | 2 | 15.06676 | 46.13390 | 39.5 | 12.0 |
B & H—Bosnia and Herzegovina; N. Macedonia—North Macedonia; FT—Flotation Tailings; SS—Smelter Slag; RM—Red Mud Dam; CA—Coal Ash.
Table A2.
Collected samples and analyses (2018–2023).
| Location | Material | Sampling Year | Surface Sampling | Hand Drilling/ Trenching | Machine Drilling | Analyses |
|---|---|---|---|---|---|---|
| Bor | FT (Cu) | 2019, 2020 | 2 | – | 51 | 53 |
| Bučim | FT (Cu) | 2018, 2019 | 2 | 6 | 69 | 78 |
| Krivelj | FT (Cu) | 2019 | 2 | – | – | 2 |
| Majdanpek | FT (Cu) | 2022 | 2 | – | – | 2 |
| Badovac | FT (Pb-Zn-Sb) | 2019, 2023 | 4 | – | – | 2 |
| Gradac | FT (Pb-Zn-Sb) | 2019 | 1 | – | 5 | 6 |
| Grot | FT (Pb-Zn-Sb) | 2019 | 1 | – | – | 1 |
| Lece | FT (Pb-Zn-Sb) | 2019 | 1 | – | – | 1 |
| Leposavić | FT (Pb-Zn-Sb) | 2019 | 1 | – | – | 1 |
| Lojane | FT (Pb-Zn-Sb) | 2018 | 3 | 7 | – | 10 |
| Probištip | FT (Pb-Zn-Sb) | 2018 | 2 | 9 | – | 11 |
| Rudnica | FT (Pb-Zn-Sb) | 2019 | 1 | – | – | 1 |
| Rudnik | FT (Pb-Zn-Sb) | 2019 | 2 | – | – | 2 |
| Sasa | FT (Pb-Zn-Sb) | 2018 | 3 | 9 | – | 12 |
| Sase-Srebrenica | FT (Pb-Zn-Sb) | 2019 | 3 | – | – | 3 |
| Šuplja Stijena | FT (Pb-Zn-Sb) | 2019 | 1 | – | – | 1 |
| Toranica | FT (Pb-Zn-Sb) | 2018 | 3 | 3 | – | 6 |
| Veovača | FT (Pb-Zn-Sb) | 2019 | 2 | – | – | 2 |
| Zvečan | FT (Pb-Zn-Sb) | 2019, 2023 | 7 | – | – | 3 |
| Bor | SS | 2019 | 2 | – | – | 2 |
| Veles | SS | 2019, 2022 | 1 | – | 82 | 52 |
| Zajača | SS | 2019 | 2 | – | – | 2 |
| Zvečan-Mitrovica | SS | 2019, 2023 | 4 | – | – | 2 |
| Birač | RM | 2019 | 1 | – | – | 1 |
| Dobro Selo | RM | 2019 | 1 | – | – | 1 |
| Podgorica | RM | 2019 | 2 | – | – | 2 |
| Bitola | CA | 2019, 2022 | 2 | 2 | – | 4 |
| Gacko | CA | 2019 | 1 | – | – | 1 |
| Kakanj | CA | 2019, 2022 | 4 | – | – | 4 |
| Kolubara | CA | 2019 | 1 | – | – | 1 |
| Kosovo A | CA | 2019 | 1 | – | – | 1 |
| Kostolac | CA | 2019 | 4 | – | – | 4 |
| Oslomej | CA | 2019, 2022 | 1 | 2 | – | 3 |
| Pljevlja | CA | 2019, 2022 | 2 | – | – | 2 |
| TENT A | CA | 2019, 2022 | 3 | – | – | 3 |
| Tuzla | CA | 2019 | 4 | – | – | 4 |
| Ugljevik | CA | 2019 | 1 | – | – | 1 |
| Zenica | CA | 2019 | 2 | – | – | 2 |
| SEE | 2018–2023 | 82 | 38 | 207 | 289 |
FT—Flotation Tailings; SS—Smelter Slag; RM—Red Mud Dam; CA—Coal Ash
Table A3.
Average content of REEs in SRM materials.
| Location | Ce | Dy | Er | Eu | Gd | Ho | La | Lu | Nd | Pr | Sc | Sm | Tb | Tm | Y | Yb | ΣREE |
|---|---|---|---|---|---|---|---|---|---|---|---|---|---|---|---|---|---|
| Bor | 22.7 | 1.4 | 0.8 | 0.5 | 1.6 | 0.3 | 12.0 | 0.2 | 9.4 | 2.5 | 5.7 | 1.8 | 0.2 | 0.2 | 7.4 | 0.8 | 68 |
| Bučim | 74.6 | 4.2 | 2.3 | 1.2 | 5.0 | 0.8 | 41.9 | 0.3 | 30.5 | 8.7 | 12.5 | 5.9 | 0.8 | 0.3 | 21.2 | 2.1 | 212 |
| Krivelj | 16.3 | 1.4 | 0.9 | 0.5 | 1.4 | 0.3 | 7.4 | 0.1 | 8.1 | 2.0 | 8.1 | 1.7 | 0.2 | 0.1 | 7.0 | 0.9 | 56 |
| Majdanpek | 19.9 | 1.7 | 1.1 | 0.6 | 1.8 | 0.4 | 10.1 | 0.2 | 9.6 | 2.4 | 6.0 | 2.0 | 0.2 | 0.2 | 9.1 | 1.0 | 66 |
| Badovac | 36.6 | 1.6 | 0.7 | 0.8 | 2.2 | 0.2 | 18.4 | 0.1 | 15.4 | 4.2 | 6.4 | 3.5 | 0.2 | 0.1 | 6.1 | 0.6 | 97 |
| Gradac | 10.7 | 1.8 | 1.0 | 0.6 | 2.2 | 0.4 | 3.0 | 0.1 | 9.4 | 1.9 | 11.5 | 2.5 | 0.2 | 0.1 | 8.5 | 0.8 | 55 |
| Grot | 64.4 | 3.9 | 2.1 | 1.7 | 5.5 | 0.7 | 30.3 | 0.2 | 27.7 | 7.6 | 8.5 | 5.9 | 0.6 | 0.3 | 18.8 | 1.6 | 180 |
| Lece | 15.2 | 0.8 | 0.4 | 0.3 | 0.9 | 0.2 | 9.4 | 0.1 | 5.6 | 1.5 | 4.1 | 1.1 | 0.1 | 0.1 | 3.9 | 0.5 | 44 |
| Leposavić | 15.1 | 0.8 | 0.4 | 0.5 | 0.9 | 0.1 | 8.1 | 0.1 | 6.2 | 1.6 | 5.2 | 1.3 | 0.1 | 0.1 | 3.7 | 0.3 | 44 |
| Lojane | 23.1 | 1.8 | 1.2 | 0.4 | 1.9 | 0.4 | 10.2 | 0.1 | 10.5 | 2.7 | 7.8 | 2.5 | 0.3 | 0.2 | 10.4 | 0.9 | 74 |
| Probištip | 30.3 | 2.5 | 1.4 | 0.9 | 2.8 | 0.5 | 13.6 | 0.3 | 15.3 | 3.9 | 9.1 | 3.6 | 0.3 | 0.2 | 13.3 | 1.6 | 100 |
| Rudnica | 47.4 | 6.8 | 3.8 | 2.2 | 8.1 | 1.4 | 34.1 | 0.4 | 35.1 | 9.0 | 6.6 | 7.2 | 1.1 | 0.6 | 45.1 | 3.3 | 212 |
| Rudnik | 43.2 | 2.9 | 1.5 | 0.9 | 3.4 | 0.6 | 23.1 | 0.2 | 18.8 | 4.9 | 9.3 | 4.0 | 0.4 | 0.2 | 15.0 | 1.4 | 130 |
| Sasa | 53.2 | 3.0 | 1.7 | 1.1 | 3.8 | 0.7 | 27.7 | 0.2 | 25.4 | 6.6 | 8.1 | 4.7 | 0.5 | 0.2 | 17.2 | 1.5 | 156 |
| Sase-Srebrenica | 63.4 | 2.2 | 1.0 | 1.5 | 3.7 | 0.4 | 32.8 | 0.1 | 27.0 | 7.1 | 8.3 | 4.6 | 0.4 | 0.1 | 9.5 | 0.9 | 163 |
| Šuplja Stijena | 9.6 | 1.9 | 1.0 | 0.6 | 2.1 | 0.4 | 2.6 | 0.1 | 8.9 | 1.8 | 11.2 | 1.9 | 0.3 | 0.1 | 9.0 | 0.8 | 52 |
| Toranica | 61.0 | 4.6 | 2.5 | 1.5 | 5.2 | 0.9 | 32.3 | 0.3 | 28.7 | 7.7 | 10.2 | 5.6 | 0.7 | 0.3 | 24.9 | 2.1 | 189 |
| Veovača | 3.5 | 2.3 | 1.2 | 0.7 | 2.9 | 0.5 | 0.9 | 0.2 | 7.2 | 0.9 | 6.2 | 3.0 | 0.3 | 0.2 | 9.5 | 1.1 | 40 |
| Zvečan | 8.0 | 0.4 | 0.2 | 0.4 | 0.5 | 0.1 | 4.2 | 0.1 | 3.2 | 0.8 | 1.0 | 0.7 | 0.1 | 0.1 | 2.0 | 0.2 | 22 |
| Bor | 9.9 | 0.9 | 0.5 | 0.3 | 1.1 | 0.2 | 4.8 | 0.1 | 4.7 | 1.2 | 3.9 | 1.0 | 0.1 | 0.1 | 4.7 | 0.5 | 34 |
| Veles | 62.9 | 6.0 | 3.3 | 1.4 | 5.7 | 1.2 | 32.1 | 0.5 | 29.5 | 7.3 | 9.6 | 5.9 | 1.0 | 0.5 | 34.6 | 3.1 | 205 |
| Zajača | 30.2 | 2.3 | 1.3 | 0.6 | 2.8 | 0.5 | 13.1 | 0.2 | 15.0 | 3.8 | 4.9 | 3.0 | 0.3 | 0.2 | 13.1 | 1.2 | 92 |
| Zvečan-Mitrovica | 12.9 | 1.1 | 0.7 | 0.5 | 1.2 | 0.3 | 7.1 | 0.2 | 5.8 | 1.4 | 1.8 | 1.4 | 0.2 | 0.2 | 6.3 | 0.7 | 41 |
| Birač | 156.8 | 19.4 | 13.1 | 4.2 | 15.1 | 4.0 | 66.2 | 1.9 | 77.2 | 20.6 | 33.1 | 18.8 | 2.9 | 1.9 | 96.8 | 12.6 | 545 |
| Dobro Selo | 526.0 | 30.1 | 17.6 | 7.9 | 32.3 | 5.8 | 181.9 | 2.7 | 164.6 | 43.4 | 96.6 | 35.6 | 5.4 | 2.7 | 142.9 | 17.8 | 1313 |
| Kidricevo * | 363.3 | 22.0 | 15.2 | 4.5 | 19.1 | 4.9 | 181.8 | 2.4 | 116.1 | 33.0 | 85.0 | 20.8 | 3.4 | 2.3 | 130.8 | 15.5 | 1020 |
| Podgorica * | 539.4 | 31.6 | 19.2 | 8.0 | 34.7 | 6.5 | 292.4 | 2.9 | 207.5 | 56.1 | 102.0 | 39.0 | 5.4 | 2.9 | 173.5 | 19.1 | 1540 |
| Bitola | 129.8 | 6.9 | 3.9 | 1.8 | 8.0 | 1.4 | 65.8 | 0.6 | 50.0 | 13.9 | 16.2 | 9.1 | 1.2 | 0.6 | 37.2 | 3.8 | 350 |
| Gacko | 31.7 | 2.5 | 1.5 | 0.6 | 2.3 | 0.5 | 17.2 | 0.2 | 12.7 | 3.7 | 7.7 | 2.7 | 0.3 | 0.2 | 13.8 | 1.3 | 99 |
| Kakanj | 68.8 | 5.8 | 3.5 | 1.4 | 6.1 | 1.2 | 39.0 | 0.5 | 31.8 | 8.4 | 22.3 | 6.3 | 1.0 | 0.5 | 34.5 | 3.3 | 234 |
| Kolubara | 15.3 | 0.9 | 0.5 | 0.2 | 1.0 | 0.1 | 8.0 | 0.1 | 7.1 | 1.7 | 3.4 | 1.4 | 0.1 | 0.1 | 4.7 | 0.6 | 45 |
| Kosovo A | 15.3 | 0.9 | 0.5 | 0.2 | 1.0 | 0.1 | 8.0 | 0.1 | 7.1 | 1.7 | 3.4 | 1.4 | 0.1 | 0.1 | 4.7 | 0.6 | 45 |
| Kostolac | 57.1 | 4.5 | 2.9 | 1.2 | 4.8 | 0.9 | 27.3 | 0.4 | 24.7 | 6.5 | 23.3 | 5.0 | 0.8 | 0.4 | 26.2 | 2.7 | 189 |
| Oslomej | 225.4 | 17.6 | 9.9 | 3.7 | 19.9 | 3.5 | 103.2 | 1.3 | 100.4 | 26.0 | 27.3 | 21.2 | 3.1 | 1.4 | 93.7 | 8.9 | 666 |
| Pljevlja | 77.8 | 6.0 | 3.5 | 1.6 | 7.2 | 1.3 | 41.0 | 0.4 | 36.2 | 9.8 | 20.6 | 7.5 | 1.0 | 0.5 | 35.6 | 3.2 | 253 |
| TENT A | 80.3 | 5.5 | 3.3 | 1.5 | 6.4 | 1.1 | 44.0 | 0.5 | 34.9 | 9.4 | 18.1 | 6.8 | 1.0 | 0.5 | 32.6 | 3.0 | 249 |
| Tuzla | 53.3 | 3.9 | 2.2 | 1.1 | 4.1 | 0.8 | 27.1 | 0.3 | 22.8 | 6.4 | 21.0 | 4.8 | 0.6 | 0.4 | 21.3 | 2.2 | 172 |
| Ugljevik | 42.4 | 3.5 | 2.0 | 1.0 | 3.9 | 0.7 | 20.4 | 0.3 | 18.1 | 4.5 | 11.8 | 3.8 | 0.6 | 0.3 | 19.2 | 2.0 | 135 |
| Zenica | 57.3 | 9.9 | 4.8 | 2.4 | 11.2 | 1.8 | 28.9 | 0.7 | 29.8 | 7.5 | 13.3 | 8.0 | 1.9 | 0.8 | 45.1 | 4.5 | 227 |
*—Data taken from Mladenovič [63].
Table A4.
Correlation matrix of REEs.
| Ce | Dy | Er | Eu | Gd | Ho | La | Lu | Nd | Pr | Sc | Sm | Tb | Tm | Y | Yb | |
|---|---|---|---|---|---|---|---|---|---|---|---|---|---|---|---|---|
| Ce | 1 | |||||||||||||||
| Dy | 0.96 | 1 | ||||||||||||||
| Er | 0.94 | 0.99 | 1 | |||||||||||||
| Eu | 0.96 | 0.99 | 0.97 | 1 | ||||||||||||
| Gd | 0.97 | 0.99 | 0.97 | 0.99 | 1 | |||||||||||
| Ho | 0.95 | 1.00 | 1.00 | 0.98 | 0.98 | 1 | ||||||||||
| La | 0.99 | 0.93 | 0.92 | 0.95 | 0.96 | 0.93 | 1 | |||||||||
| Lu | 0.93 | 0.97 | 0.98 | 0.94 | 0.93 | 0.98 | 0.91 | 1 | ||||||||
| Nd | 0.99 | 0.97 | 0.96 | 0.98 | 0.99 | 0.97 | 0.98 | 0.93 | 1 | |||||||
| Pr | 0.99 | 0.97 | 0.95 | 0.98 | 0.99 | 0.96 | 0.99 | 0.93 | 1.00 | 1 | ||||||
| Sc | 0.91 | 0.91 | 0.91 | 0.91 | 0.91 | 0.92 | 0.89 | 0.90 | 0.91 | 0.90 | 1 | |||||
| Sm | 0.97 | 0.98 | 0.97 | 0.99 | 1.00 | 0.98 | 0.96 | 0.93 | 0.99 | 0.99 | 0.90 | 1 | ||||
| Tb | 0.97 | 0.99 | 0.98 | 0.99 | 0.99 | 0.99 | 0.95 | 0.96 | 0.98 | 0.98 | 0.90 | 0.99 | 1 | |||
| Tm | 0.94 | 0.99 | 0.99 | 0.97 | 0.96 | 0.99 | 0.92 | 0.98 | 0.95 | 0.95 | 0.90 | 0.96 | 0.97 | 1 | ||
| Y | 0.96 | 1.00 | 0.99 | 0.98 | 0.98 | 1.00 | 0.94 | 0.97 | 0.97 | 0.97 | 0.91 | 0.98 | 0.99 | 0.99 | 1 | |
| Yb | 0.94 | 0.99 | 1.00 | 0.96 | 0.95 | 0.99 | 0.91 | 0.99 | 0.94 | 0.94 | 0.92 | 0.95 | 0.97 | 0.99 | 0.99 | 1 |
Table A5.
Basic data for value calculation of REE2O3 value.
| REE | Metal/Oxide Ratio | Oxide Price (USD/kg) | REE (Kt) | Value * (Mil. USD) |
|---|---|---|---|---|
| Sc | 1.53 | 904 | 18 | 24,548 |
| Y | 1.27 | 7.6 | 23 | 220 |
| La | 1.17 | 1.0 | 31 | 34 |
| Ce | 1.17 | 1.0 | 62 | 71 |
| Pr | 1.17 | 100 | 7.3 | 850 |
| Nd | 1.17 | 110 | 28 | 3586 |
| Sm | 1.16 | 2.2 | 5.7 | 14 |
| Eu | 1.16 | 28 | 1.4 | 44 |
| Gd | 1.15 | 62 | 4.9 | 348 |
| Tb | 1.15 | 1987 | 0.7 | 1544 |
| Dy | 1.15 | 356 | 4.5 | 1822 |
| Ho | 1.15 | 131 | 0.9 | 136 |
| Er | 1.14 | 42 | 2.6 | 125 |
| Tm | 1.14 | 150 | 0.4 | 63 |
| Yb | 1.14 | 14 | 2.5 | 38 |
| Lu | 1.14 | 839 | 0.4 | 342 |
| SEE | – | – | 192 | 33,785 |
References
- Edahbi, M.; Plante, B.; Benzaazoua, M. Environmental Challenges and Identification of the Knowledge Gaps Associated with REE Mine Wastes Management. J. Clean. Prod. 2019, 212, 1232–1241. [Google Scholar] [CrossRef]
- Ilankoon, I.M.S.K.; Dushyantha, N.P.; Mancheri, N.; Edirisinghe, P.M.; Neethling, S.J.; Ratnayake, N.P.; Rohitha, L.P.S.; Dissanayake, D.M.D.O.K.; Premasiri, H.M.R.; Abeysinghe, A.M.K.B.; et al. Constraints to Rare Earth Elements Supply Diversification: Evidence from an Industry Survey. J. Clean. Prod. 2022, 331, 129932. [Google Scholar] [CrossRef]
- Cordier, D.J. Rare Earths—Mineral Commodity Summaries; 2022. Available online: https://pubs.usgs.gov/periodicals/mcs2022/mcs2022.pdf (accessed on 4 December 2023).
- Haxel, G.B.; Hedrick, J.B.; Orris, G.J. Rare Earth Elements—Critical Resources for High Technology. Fact Sheet 087-02; 2002. Available online: https://pubs.usgs.gov/fs/2002/fs087-02/ (accessed on 4 December 2023).
- Pecharsky, V.K.; Gschneidner, K.A., Jr. Rare-Earth Element. Encyclopaedia Britannica. Encycl. Br. 2023. [Google Scholar]
- McCreath, J.A.; Finch, A.A.; Simonsen, S.L.; Donaldson, C.H.; Armour-Brown, A. Independent Ages of Magmatic and Hydrothermal Activity in Alkaline Igneous Rocks: The Motzfeldt Centre, Gardar Province, South Greenland. Contrib. Mineral. Petrol. 2012, 163, 967–982. [Google Scholar] [CrossRef]
- Sheard, E.R.; Williams-Jones, A.E.; Heiligmann, M.; Pederson, C.; Trueman, D.L. Controls on the Concentration of Zirconium, Niobium, and the Rare Earth Elements in the Thor Lake Rare Metal Deposit, Northwest Territories, Canada. Econ. Geol. 2012, 107, 81–104. [Google Scholar] [CrossRef]
- Wall, F. Rare Earth Elements. In Critical Metals Handbook; Gunn, A.G., Ed.; Wiley: Hoboken, NJ, USA, 2014; pp. 312–339. [Google Scholar]
- Marks, M.A.W.; Hettmann, K.; Schilling, J.; Frost, B.R.; Markl, G. The Mineralogical Diversity of Alkaline Igneous Rocks: Critical Factors for the Transition from Miaskitic to Agpaitic Phase Assemblages. J. Petrol. 2011, 52, 439–455. [Google Scholar] [CrossRef]
- Goodenough, K.M.; Schilling, J.; Jonsson, E.; Kalvig, P.; Charles, N.; Tuduri, J.; Deady, E.A.; Sadeghi, M.; Schiellerup, H.; Müller, A.; et al. Europe’s Rare Earth Element Resource Potential: An Overview of REE Metallogenetic Provinces and Their Geodynamic Setting. Ore. Geol. Rev. 2016, 72, 838–856. [Google Scholar] [CrossRef]
- Barakos, G.; Mischo, H.; Gutzmer, J. Status Quo and Future Evaluations of Global Rare Earth Mining (with Respect to Special Rare Earth Element-Industry Criteria). In Proceedings of the 3rd Future Mining Confrence, Sydney, Australia, 1 November 2015; pp. 21–30. [Google Scholar]
- Ober, J.A. Mineral Commodity Summaries 2018; US Geological Survey: Reston, VA, USA, 2018. [Google Scholar]
- Balaram, V. Rare Earth Elements: A Review of Applications, Occurrence, Exploration, Analysis, Recycling, and Environmental Impact. Geosci. Front. 2019, 10, 1285–1303. [Google Scholar] [CrossRef]
- Jordens, A.; Cheng, Y.P.; Waters, K.E. A Review of the Beneficiation of Rare Earth Element Bearing Minerals. Miner. Eng. 2013, 41, 97–114. [Google Scholar] [CrossRef]
- Koltun, P.; Tharumarajah, A. Life Cycle Impact of Rare Earth Elements. ISRN Metall. 2014, 2014, 1–10. [Google Scholar] [CrossRef]
- Weber, R.J.; Reisman, D.J. Rare Earth Elements: A Review of Production, Processing, Recycling, and Associated Environmental Issues; US EPA Region: Washington, DC, USA, 2012. [Google Scholar]
- Balaram, V. Potential Future Alternative Resources for Rare Earth Elements: Opportunities and Challenges. Minerals 2023, 13, 425. [Google Scholar] [CrossRef]
- Gaustad, G.; Williams, E.; Leader, A. Rare Earth Metals from Secondary Sources: Review of Potential Supply from Waste and Byproducts. Resour. Conserv. Recycl. 2021, 167, 105213. [Google Scholar] [CrossRef]
- Mitchell, J. Net zero could drive up the global demand for timber, putting at risk the world’s forests. Invest. Monitor. 2022. Available online: https://www.investmentmonitor.ai/analysis/net-zero-drive-up-global-demand-timber-forests (accessed on 4 December 2023).
- Goodenough, K.M.; Wall, F.; Merriman, D. The Rare Earth Elements: Demand, Global Resources, and Challenges for Resourcing Future Generations. Nat. Resour. Res. 2018, 27, 201–216. [Google Scholar] [CrossRef]
- Roskill information services Rare Earths: Global Industry, Markets and Outlook to 2026; Roskill Information Services. 2016. Available online: https://d9-wret.s3-us-west-2.amazonaws.com/assets/palladium/production/atoms/files/myb1-2016-raree.pdf (accessed on 4 December 2023).
- FAIRFILD—Rare Earth Elements Market Set to Reach $7.3 Bn by 2026. Available online: https://www.globenewswire.com/en/news-release/2022/12/14/2573838/0/en/Rare-Earth-Elements-Market-All-Set-to-Reach-US-7-3-Bn-by-2026-Fairfield-Market-Research-Finds-Application-Concentrated-in-Magnets.html (accessed on 4 December 2023).
- Yuksekdag, A.; Kose-Mutlu, B.; Siddiqui, A.F.; Wiesner, M.R.; Koyuncu, I. A Holistic Approach for the Recovery of Rare Earth Elements and Scandium from Secondary Sources under a Circular Economy Framework—A Review. Chemosphere 2022, 293, 133620. [Google Scholar] [CrossRef] [PubMed]
- Wu, L.; Ma, L.; Huang, G.; Li, J.; Xu, H. Distribution and Speciation of Rare Earth Elements in Coal Fly Ash from the Qianxi Power Plant, Guizhou Province, Southwest China. Minerals 2022, 12, 1089. [Google Scholar] [CrossRef]
- Mudd, G.M.; Werner, T.T.; Weng, Z.-H.; Yellishetty, M.; Yuan, Y.; McAlpine, S.R.B.; Skirrow, R.; Czarnota, K. Critical Minerals in Australia: A Review of Opportunities and Research Needs; Geoscience Australia: Canberra, Australian, 2018. [Google Scholar]
- European Commission’s (EC) Raw Materials Information System (RMIS)—Critical, Strategic and Advanced Materials. Available online: https://rmis.jrc.ec.europa.eu/eu-critical-raw-materials (accessed on 12 December 2023).
- Copernicus—Land Monitoring Service (CLMS). Available online: https://land.copernicus.eu/ (accessed on 28 November 2023).
- Vuković, A.; Mandić, M.V. Study on Climate Change in the Western Balkans Region; Regional Cooperation Council Secretariat: Sarajevo, Bosnia and Herzegovina, 2018. [Google Scholar]
- World Bank Open Data—World Population (1960–2022). Available online: https://data.worldbank.org/ (accessed on 12 December 2023).
- Central Intelligence Agency (CIA), The World Factbook—Ethnic Groups. Available online: https://www.cia.gov/the-world-factbook/field/ethnic-groups/ (accessed on 12 December 2023).
- Central Intelligence Agency (CIA), The World Factbook—Religions. Available online: https://www.cia.gov/the-world-factbook/field/religions/ (accessed on 12 December 2023).
- United Nations (UN), Department of Economic and Social Affairs—Population 2022–2100. Available online: https://population.un.org/wpp/Download/UN_PPP2022_Output_PopTot.xlsx (accessed on 12 December 2023).
- World Bank Open Data—Nominal GDP. Available online: https://data.worldbank.org/indicator/NY.GDP.MKTP.CD (accessed on 12 December 2023).
- Blundell, D.; Arndt, N.; Cobbold, P.R.; Heinrich, C. Geodynamics and Ore Deposit Evolution in Europe: Introduction. Ore Geol. Rev. 2005, 27, 5–11. [Google Scholar] [CrossRef]
- Richards, J.P. Tectonic, Magmatic, and Metallogenic Evolution of the Tethyan Orogen: From Subduction to Collision. Ore Geol. Rev. 2015, 70, 323–345. [Google Scholar] [CrossRef]
- Schmid, S.M.; Fügenschuh, B.; Kounov, A.; Maţenco, L.; Nievergelt, P.; Oberhänsli, R.; Pleuger, J.; Schefer, S.; Schuster, R.; Tomljenović, B.; et al. Tectonic Units of the Alpine Collision Zone between Eastern Alps and Western Turkey. Gondwana Res. 2020, 78, 308–374. [Google Scholar] [CrossRef]
- Zagorchev, I.S. Geology of the Balkan Peninsula. In Encyclopedia of Geology: Volume 1–6, Second Edition; Elsevier: Amsterdam, The Netherlands, 2020; Volume 4, pp. 382–407. ISBN 9780081029091. [Google Scholar]
- Consortium for Spatial Information (CGIAR-CSI)—SRTM Digital Elevation Data. Available online: https://srtm.csi.cgiar.org/srtmdata/ (accessed on 28 November 2023).
- Janković, S. Metalogenetske Provincije Jugoslavije u Prostoru i Vremenu (Opšti Pregled). In Proceedings of the Metalogenija i Koncepcija Geotektonskog Razvoja Jugoslavije; Rudarsko-Geološki Fakultet: Belgrade, Serbia, 1974; pp. 31–52. [Google Scholar]
- Ciobanu, C.L.; Cook, N.J.; Stein, H. Regional Setting and Geochronology of the Late Cretaceous Banatitic Magmatic and Metallogenetic Belt. Miner Depos. 2002, 37, 541–567. [Google Scholar] [CrossRef]
- Heinrich, C.A.; Neubauer, F. Cu—Au—Pb—Zn—Ag Metallogeny of the Alpine—Balkan—Carpathian—Dinaride Geodynamic Province. Min. Depos. 2002, 37, 533–540. [Google Scholar] [CrossRef]
- Melcher, F.; Reichl, C. Economic Geology of the Eastern and South-Eastern European (ESEE) Region. BHM Berg Und Hüttenmännische Monatshefte 2017, 162, 238–244. [Google Scholar] [CrossRef]
- Bogatyrev, B.A.; Zhukov, V.V. Bauxite Provinces of the World. Geol. Ore Depos. 2009, 51, 339–355. [Google Scholar] [CrossRef]
- Grubić, A. Geologija Jugoslovenskih Boksita; Srpska akademija nauka i umetnosti (SANU): Belgrade, Serbia, 1975. [Google Scholar]
- Maksimovic, Z.; Pantó, G. Contribution to the Geochemistry of the Rare Earth Elements in the Karst-Bauxite Deposits of Yugoslavia and Greece. Geoderma 1991, 51, 93–109. [Google Scholar] [CrossRef]
- Maksimović, Z.; Pantó, G. Authigenic Rare Earth Minerals in Karst-Bauxites and Karstic Nickel Deposits. In Rare Earth Minerals, Chemistry, Origin and Ore Deposits; Jones, A.P., Wall, F., Williams, C.T., Eds.; Mineralogical Society Series; Chapman & Hall: London, UK, 1996; pp. 199–220. [Google Scholar]
- Radusinović, S.; Papadopoulos, A. The Potential for REE and Associated Critical Metals in Karstic Bauxites and Bauxite Residue of Montenegro. Minerals 2021, 11, 975. [Google Scholar] [CrossRef]
- The European Parliament and the Council of the European Union. Directive 2006/21/EC of the European Parliament and of the Council of 15 March 2006 on the Management of Waste from Extractive Industries and Amending Directive 2004/35/EC (Document 32006L0021). 2006. Available online: https://eur-lex.europa.eu/legal-content/EN/TXT/?uri=celex%3A32006L0021 (accessed on 12 March 2022).
- The European Parliament and the Council of the European Union. Directive 2008/98/EC of the European Parliament and of the Council of 19 November 2008 on Waste and Repealing Certain Directives (Document 32008L0098). 2008. Available online: https://eur-lex.europa.eu/legal-content/EN/TXT/?uri=celex%3A32008L0098 (accessed on 12 March 2022).
- RESEERVE: Mineral Potential of the ESEE Region (Project Web Site). Available online: https://reseerve.eu/ (accessed on 12 March 2022).
- RIS-CuRE: Zero Waste Recovery of Copper Tailings in the ESEE Region (Project Web Site). Available online: http://ris-cure.zag.si/ (accessed on 12 March 2022).
- RIS-RECOVER: Regional Innovation Scheme for Zero Waste Extraction on Critical Raw Materials (Project Web Site). Available online: http://ris-recover.zag.si/ (accessed on 12 March 2022).
- RECO2MAG: Grain Boundaries Engineered Nd-Fe-B Permanent Magnets (Project Web Site). Available online: https://reco2mag.rgf.bg.ac.rs/ (accessed on 25 November 2023).
- FutuRaM: The Future Availability of Secondary Raw Materials (Project Web Site). Available online: https://futuram.eu/ (accessed on 25 November 2023).
- Šajn, R.; Ristović, I.; Čeplak, B. Mining and Metallurgical Waste as Potential Secondary Sources of Metals—A Case Study for the West Balkan Region. Minerals 2022, 12, 547. [Google Scholar] [CrossRef]
- Steiner, T.M.C.; Bertrandsson Erlandsson, V.; Šajn, R.; Melcher, F. Preliminary Chemical and Mineralogical Characterization of Tailings from Base Metal Sulfide Deposits in Serbia and North Macedonia. Geologia Croatica 2022, 75, 291–302. [Google Scholar] [CrossRef]
- Matinde, E.; Simate, G.S.; Ndlovu, S. Mining and Metallurgical Wastes: A Review of Recycling and Re-Use Practices. J. S. Afr. Inst. Min. Metall 2018, 118, 825–844. [Google Scholar] [CrossRef]
- Echeverry-Vargas, L.; Ocampo-Carmona, L.M. Recovery of Rare Earth Elements from Mining Tailings: A Case Study for Generating Wealth from Waste. Minerals 2022, 12, 948. [Google Scholar] [CrossRef]
- Deng, B.; Wang, X.; Luong, D.X.; Carter, R.A.; Wang, Z.; Tomson, M.B.; Tour, J.M. Rare Earth Elements from Waste. Sci. Adv. 2022, 8. [Google Scholar] [CrossRef]
- Hallberg, A.; Reginiussen, H. Critical Raw Materials in Ores, Waste Rock and Tailings in Bergslagen; Geological Survey of Sweden: Uppsala, Sweden, 2020. [Google Scholar]
- Mondal, S.; Acharjee, A.; Mandal, U.; Saha, B. Froth Flotation Process and Its Application. Vietnam J. Chem. 2021, 59, 417–425. [Google Scholar]
- Samal, S.; Ray, A.K.; Bandopadhyay, A. Proposal for Resources, Utilization and Processes of Red Mud in India—A Review. Int. J. Min. Process 2013, 118. [Google Scholar] [CrossRef]
- Mladenovič, A. Red Mud Landfills—A Monument to Regional Aluminum Industry and a Valuable REE Source for Future. In Bauxite and Bauxite Residue as a Potential Resource of REE in the ESEE Region; Tomašić, N., Ed.; University of Zagreb Faculty of Science: Zagreb, Croatia, 2020; pp. 32–51. ISBN 978-953-6076-89-5. [Google Scholar]
- Zhang, Y. Recovery and Utilization of Metallurgical Solid Waste; IntechOpen: London, UK, 2019. [Google Scholar]
- Park, S.; Liang, Y. Bioleaching of Trace Elements and Rare Earth Elements from Coal Fly Ash. Int. J. Coal. Sci. Technol. 2019, 6, 74–83. [Google Scholar] [CrossRef]
- Pan, J.; Nie, T.; Hassas, B.V.; Rezaee, M.; Wen, Z.; Zhou, C. Recovery of Rare Earth Elements from Coal Fly Ash by Integrated Physical Separation and Acid Leaching. Chemosphere 2020, 248, 126112. [Google Scholar] [CrossRef] [PubMed]
- Tang, M.; Zhou, C.; Pan, J.; Zhang, N.; Liu, C.; Cao, S.; Hu, T.; Ji, W. Study on Extraction of Rare Earth Elements from Coal Fly Ash through Alkali Fusion—Acid Leaching. Min. Eng. 2019, 136, 36–42. [Google Scholar] [CrossRef]
- Bureau Veritas North America (Former ACME)—Mining Laboratory Services—Geochemistry. Available online: https://www.bvna.com/other-markets/mining-laboratory-services/geochemistry (accessed on 21 November 2023).
- ISO 9001:2015; Quality Management Systems. International Organization for Standardization (ISO): Geneva, Switzerland, 2019.
- ISO 14869-1:2001; Soil Quality—Dissolution for the Determination of Total Element Content—Part 1: Dissolution with Hydrofluoric and Perchloric Acids. International Organization for Standardization (ISO): Geneva, Switzerland, 2001.
- Alphabet Inc.—Google Earth Ver. 7.3.6.9345 (Balkan Peninsula). Available online: https://earth.google.com/web/@43.75415613,16.61277349,1099.6459116a,1698898.11442763d,35y,-0h,0t,0r/data=OgMKATA (accessed on 20 February 2023).
- Metalary—Metal Prices. Available online: https://www.metalary.com/ (accessed on 28 March 2022).
- Shanghai Metals Market (SMM)—Rare Earth Oxides Prices. Available online: https://www.metal.com/price/Rare%20Earth/Rare-Earth-Oxides (accessed on 22 December 2022).
- Shanghai Metals Market (SMM)—Rare Earth Metals Prices. Available online: https://www.metal.com/price/Rare%20Earth/Rare-Earth-Metals (accessed on 22 December 2022).
- Gaskell, D.R. The determination of phase diagrams for slag systems. Methods Phase Diagr. Determ. 2007, 442–458. [Google Scholar] [CrossRef]
- Abhilash; Hedrich, S.; Meshram, P.; Schippers, A.; Gupta, A.; Sen, S. Extraction of REEs from Blast Furnace Slag by Gluconobacter Oxydans. Minerals 2022, 12, 701. [Google Scholar] [CrossRef]
- Mikoda, B.; Potysz, A.; Kmiecik, E. Bacterial Leaching of Critical Metal Values from Polish Copper Metallurgical Slags Using Acidithiobacillus Thiooxidans. J. Environ. Manag. 2019, 236, 436–445. [Google Scholar] [CrossRef]
- Abhilash; Meshram, P.; Sarkar, S.; Venugopalan, T. Exploring Blast Furnace Slag as a Secondary Resource for Extraction of Rare Earth Elements. Miner. Metall. Process. 2017, 34, 178–182. [Google Scholar] [CrossRef]
- Borra, C.R.; Pontikes, Y.; Binnemans, K.; Van Gerven, T. Leaching of Rare Earths from Bauxite Residue (Red Mud). Miner Eng. 2015, 76, 20–27. [Google Scholar] [CrossRef]
- Borra, C.R.; Blanpain, B.; Pontikes, Y.; Binnemans, K.; Van Gerven, T. Recovery of Rare Earths and Major Metals from Bauxite Residue (Red Mud) by Alkali Roasting, Smelting, and Leaching. J. Sustain. Metall. 2017, 3, 393–404. [Google Scholar] [CrossRef]
- Qu, Y.; Li, H.; Wang, X.; Tian, W.; Shi, B.; Yao, M.; Zhang, Y. Bioleaching of Major, Rare Earth, and Radioactive Elements from Red Mud by Using Indigenous Chemoheterotrophic Bacterium Acetobacter Sp. Minerals 2019, 9, 67. [Google Scholar] [CrossRef]
- Zhang, D.R.; Chen, H.R.; Nie, Z.Y.; Xia, J.L.; Li, E.P.; Fan, X.L.; Zheng, L. Extraction of Al and Rare Earths (Ce, Gd, Sc, Y) from Red Mud by Aerobic and Anaerobic Bi-Stage Bioleaching. Chem. Eng. J. 2020, 401, 125914. [Google Scholar] [CrossRef]
- Borra, C.R.; Mermans, J.; Blanpain, B.; Pontikes, Y.; Binnemans, K.; Van Gerven, T. Selective Recovery of Rare Earths from Bauxite Residue by Combination of Sulfation, Roasting and Leaching. Min. Eng. 2016, 92, 151–159. [Google Scholar] [CrossRef]
- Fleming, P.; Orrego, P.; Pinilla, F.; Fleming, P.; Orrego, P.; Pinilla, F. Recovery of Rare Earth Elements Present in Mining Tails, by Leaching with Nitric and Hydrochloric Solutions. World J. Nucl. Sci. Technol. 2021, 11, 1–16. [Google Scholar] [CrossRef]
- Sarker, S.K.; Haque, N.; Bhuiyan, M.; Bruckard, W.; Pramanik, B.K. Recovery of Strategically Important Critical Minerals from Mine Tailings. J. Environ. Chem. Eng. 2022, 10, 107622. [Google Scholar] [CrossRef]
- Huang, C.; Wang, Y.; Huang, B.; Dong, Y.; Sun, X. The Recovery of Rare Earth Elements from Coal Combustion Products by Ionic Liquids. Miner Eng. 2019, 130, 142–147. [Google Scholar] [CrossRef]
- Ma, Z.; Zhang, S.; Zhang, H.; Cheng, F. Novel Extraction of Valuable Metals from Circulating Fluidized Bed-Derived High-Alumina Fly Ash by Acid–Alkali–Based Alternate Method. J. Clean. Prod. 2019, 230, 302–313. [Google Scholar] [CrossRef]
- Zhang, D.R.; Chen, H.R.; Xia, J.L.; Nie, Z.Y.; Zhang, R.Y.; Pakostova, E. Efficient Dealkalization of Red Mud and Recovery of Valuable Metals by a Sulfur-Oxidizing Bacterium. Front. Microbiol. 2022, 13. [Google Scholar] [CrossRef]
- Li, W.; Li, Z.; Wang, N.; Gu, H. Selective Extraction of Rare Earth Elements from Red Mud Using Oxalic and Sulfuric Acids. J. Environ. Chem. Eng. 2022, 10, 108650. [Google Scholar] [CrossRef]
- Chaikin, L.; Shoppert, A.; Valeev, D.; Loginova, I.; Napol’skikh, J. Concentration of Rare Earth Elements (Sc, Y, La, Ce, Nd, Sm) in Bauxite Residue (Red Mud) Obtained by Water and Alkali Leaching of Bauxite Sintering Dust. Minerals 2020, 10, 500. [Google Scholar] [CrossRef]
- Zinoveev, D.; Pasechnik, L.; Fedotov, M.; Dyubanov, V.; Grudinsky, P.; Alpatov, A. Extraction of Valuable Elements from Red Mud with a Focus on Using Liquid Media—A Review. Recycling 2021, 6, 38. [Google Scholar] [CrossRef]
- Shoppert, A.; Loginova, I.; Napol’skikh, J.; Kyrchikov, A.; Chaikin, L.; Rogozhnikov, D.; Valeev, D. Selective Scandium (Sc) Extraction from Bauxite Residue (Red Mud) Obtained by Alkali Fusion-Leaching Method. Materials 2022, 15, 433. [Google Scholar] [CrossRef] [PubMed]
- Archambo, M.S.; Kawatra, S.K. Extraction of Rare Earths from Red Mud Iron Nugget Slags with Oxalic Acid Precipitation. Miner. Process. Extr. Metall. Rev. 2022, 43, 656–663. [Google Scholar] [CrossRef]
- Omodara, L.; Pitkäaho, S.; Turpeinen, E.-M.; Saavalainen, P.; Oravisjärvi, K.; Keiski, R.L. Recycling and Substitution of Light Rare Earth Elements, Cerium, Lanthanum, Neodymium, and Praseodymium from End-of-Life Applications—A Review. J. Clean. Prod. 2019, 236, 117573. [Google Scholar] [CrossRef]
- Watling, H. Review of Biohydrometallurgical Metals Extraction from Polymetallic Mineral Resources. Minerals 2014, 5, 1–60. [Google Scholar] [CrossRef]
- Pudasainee, D.; Kurian, V.; Gupta, R. Coal: Past, Present, and Future Sustainable Use. Future Energy Improv. Sustain. Clean Options Our Planet 2020, 21–48. [Google Scholar] [CrossRef]
- Institute for Rare Earths and Metals (AG–ISE)—Metal Prices. Available online: https://ise-metal-quotes.com/ (accessed on 22 December 2022).
Figure 1.
Study area—SEE region (DEM taken from CGIAR-CSI [38]).
Figure 1.
Study area—SEE region (DEM taken from CGIAR-CSI [38]).
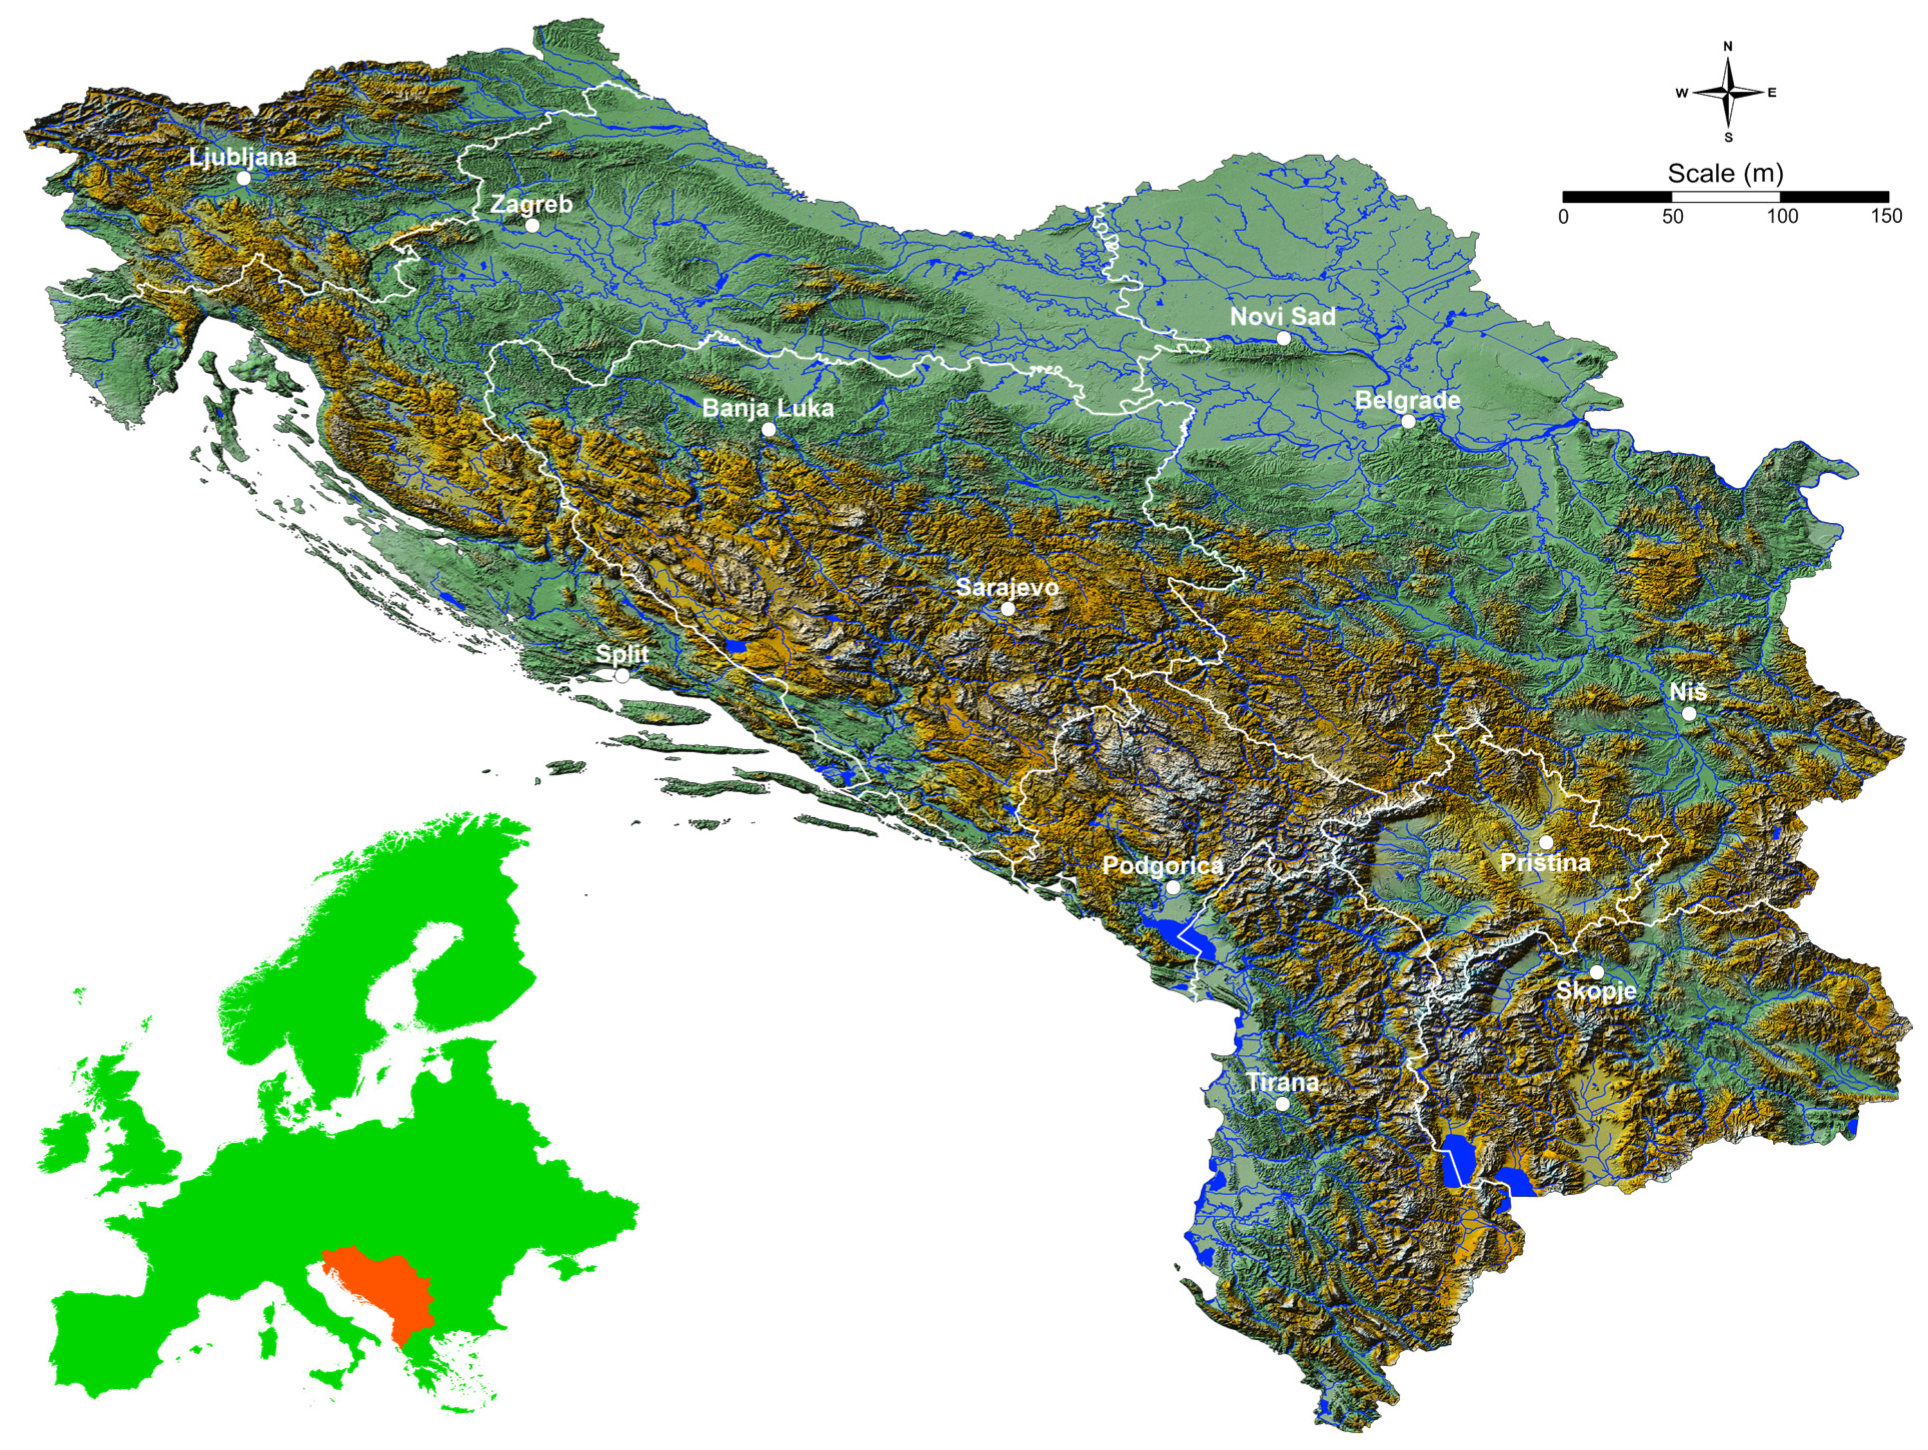
Figure 2.
Classification dendrogram of secondary raw materials—SRM (according to Šajn et al., 2022 [55]).
Figure 2.
Classification dendrogram of secondary raw materials—SRM (according to Šajn et al., 2022 [55]).

Figure 3.
(A) Flotation tailings Zletovo, and (B) smelter slag landfill Veles, North Macedonia (Photo Šajn, R.).
Figure 3.
(A) Flotation tailings Zletovo, and (B) smelter slag landfill Veles, North Macedonia (Photo Šajn, R.).

Figure 4.
(A) Red mud dam Podgorica, Montenegro and (B) Coal ash landfill Kostolac, Serbia (Photo Šajn, R.).
Figure 4.
(A) Red mud dam Podgorica, Montenegro and (B) Coal ash landfill Kostolac, Serbia (Photo Šajn, R.).

Figure 5.
(A) Surface sampling, (B) coal ash profile, and (C) coal ash profile with slag layers (Photo Šajn, R.).
Figure 5.
(A) Surface sampling, (B) coal ash profile, and (C) coal ash profile with slag layers (Photo Šajn, R.).

Figure 6.
Areal distribution of quantities in potentially perspective SRM deposits (Mt) according to type (the size of the circle in the map represents the size of the deposit; the topographic base is taken from Google Earth [71]).
Figure 6.
Areal distribution of quantities in potentially perspective SRM deposits (Mt) according to type (the size of the circle in the map represents the size of the deposit; the topographic base is taken from Google Earth [71]).
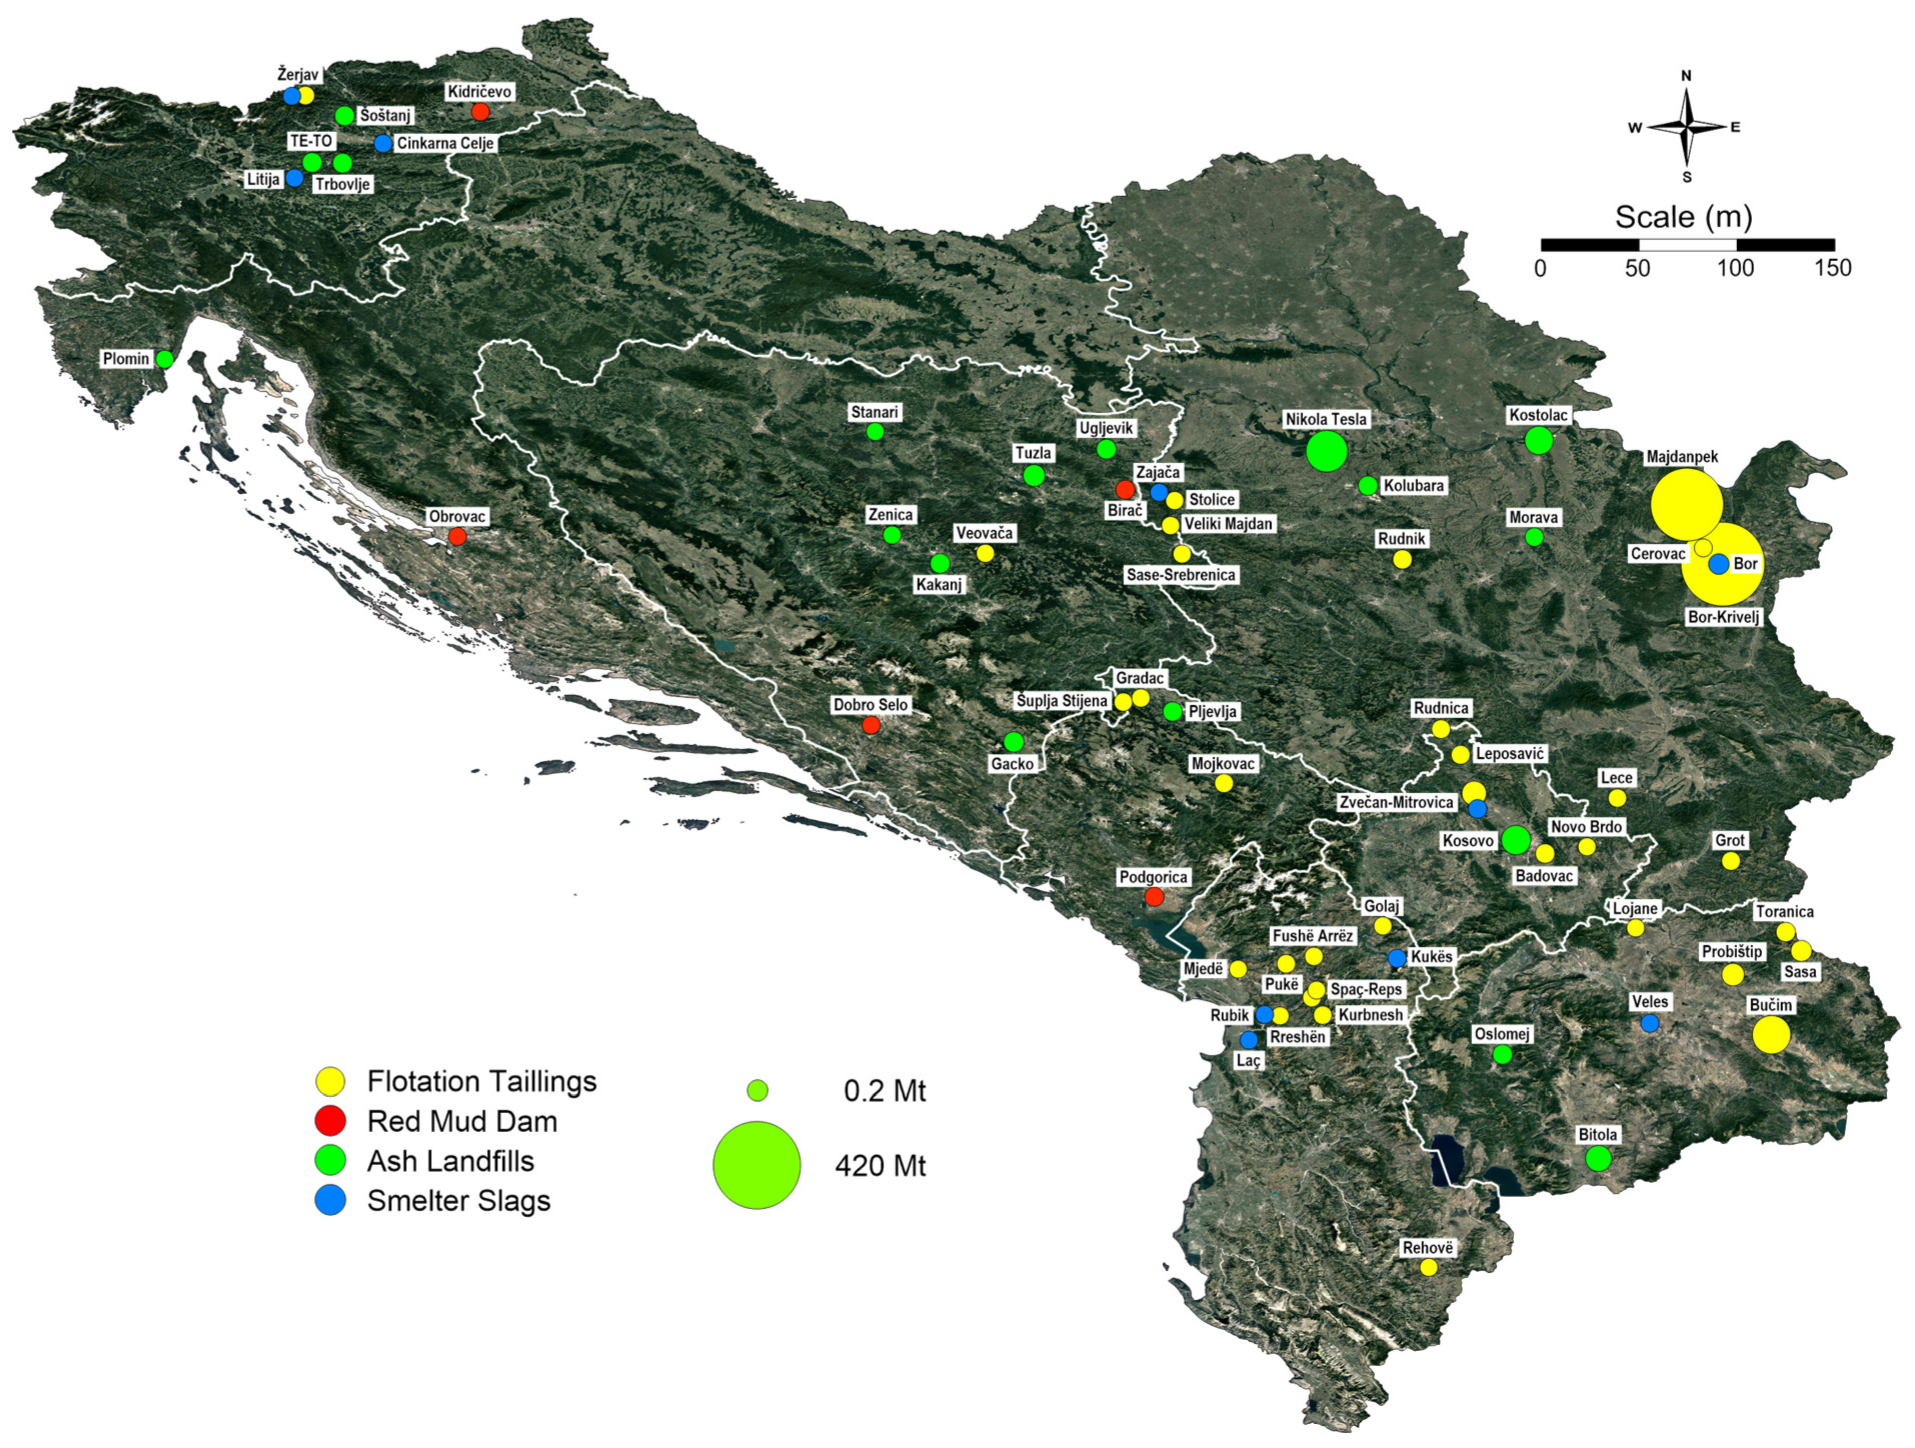
Figure 7.
Areal distribution of REEs quantities (Kt) according to type of deposit. (the size of the circle in the map represents the size of the deposit; the topographic base is taken from Google Earth [71]).
Figure 7.
Areal distribution of REEs quantities (Kt) according to type of deposit. (the size of the circle in the map represents the size of the deposit; the topographic base is taken from Google Earth [71]).
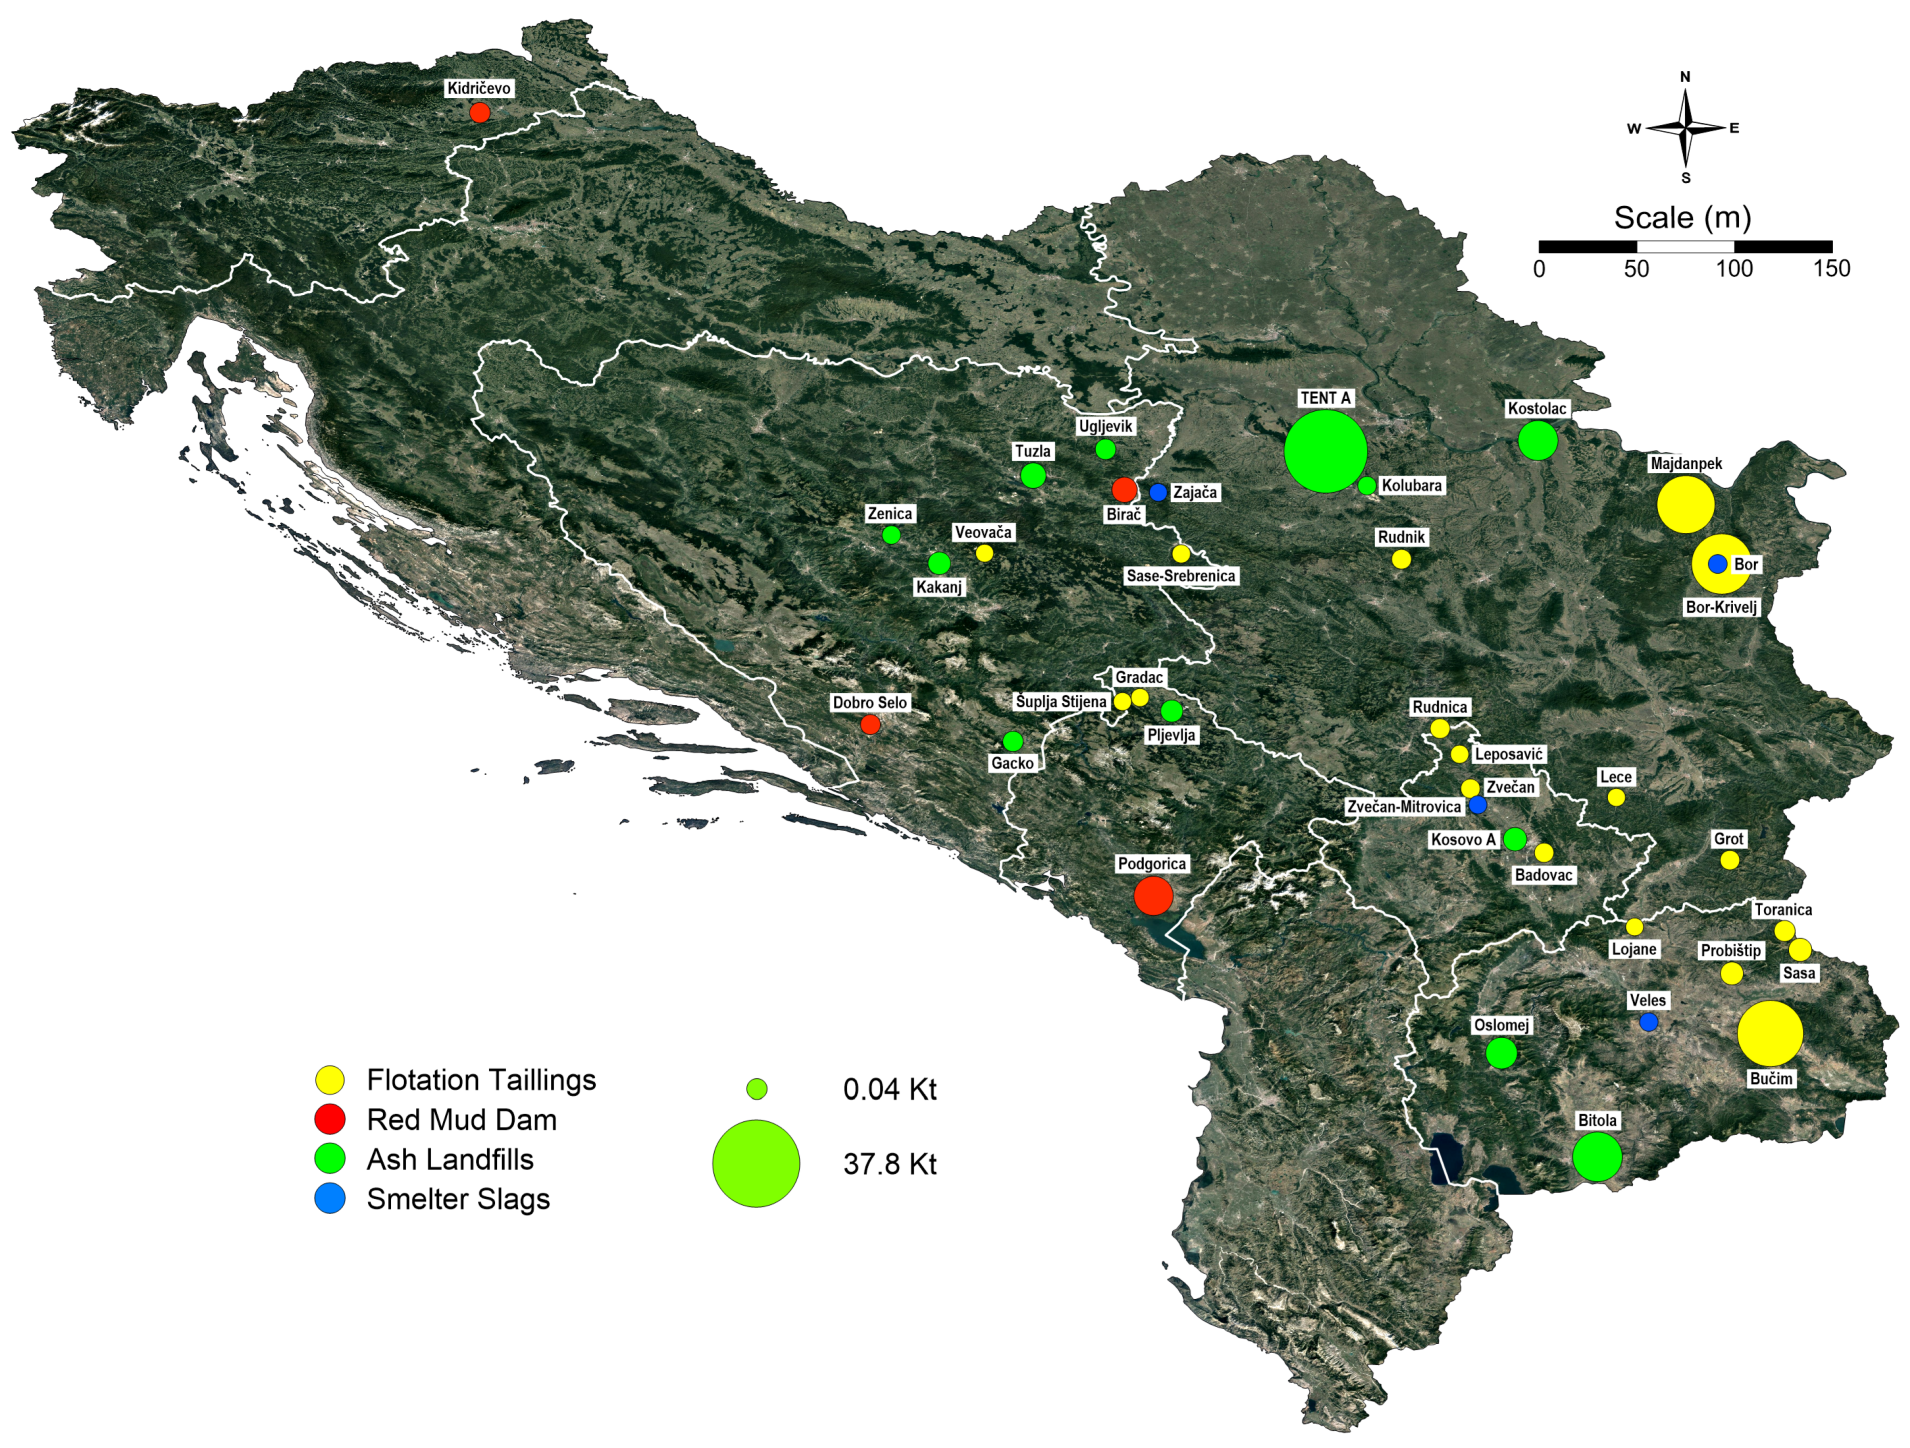
Table 1.
Distribution of potentially perspective SRM deposits (Mt) according to the type of deposits and countries.
Table 1.
Distribution of potentially perspective SRM deposits (Mt) according to the type of deposits and countries.
| Type of Deposit Country | Location | Landfills | Area (ha) | Quantity (Mt) |
|---|---|---|---|---|
| Flotation Tailing (Cu) | 13 | 18 | 1382 | 919 |
| Flotation Tailings (Pb-Zn-Sb) | 20 | 33 | 579 | 164 |
| Smelter Slag | 5 | 15 | 312 | 34 |
| Red Mud | 10 | 5 | 132 | 20 |
| Coal Ash | 18 | 24 | 2639 | 489 |
| Albania | 12 | 15 | 94 | 23 |
| B&H | 10 | 13 | 505 | 81 |
| Croatia | 2 | 2 | 53 | 2 |
| Kosovo | 6 | 11 | 674 | 138 |
| Montenegro | 5 | 5 | 176 | 30 |
| N. Macedonia | 8 | 13 | 637 | 258 |
| Serbia | 15 | 24 | 2665 | 1049 |
| Slovenia | 8 | 12 | 241 | 45 |
| SEE | 66 | 95 | 5044 | 1625 |
Table 2.
Weighted average concentration of REEs according to type of deposit and defined areas.
| Countries | Type of Deposit | Ce (ppm) | La (ppm) | Nd (ppm) | Sc (ppm) | Y (ppm) | LREE (ppm) | HREE (ppm) | ΣREE (ppm) |
|---|---|---|---|---|---|---|---|---|---|
| REST | Flotation Tailings (Cu) | 19.6 | 9.8 | 9.0 | 6.6 | 7.8 | 6.3 | 4.0 | 63 |
| REST | Flotation Tailings (Pb-Zn-Sb) | 28.8 | 15.2 | 14.9 | 7.1 | 11.9 | 10.8 | 5.7 | 94 |
| REST | Smelter Slag | 17.6 | 8.3 | 8.5 | 3.5 | 8.0 | 6.0 | 3.8 | 56 |
| REST | Red Mud Dam | 396.4 | 180.6 | 141.4 | 79.2 | 136.0 | 98.2 | 72.8 | 1104 |
| REST | Coal Ash | 49.9 | 26.1 | 22.5 | 14.5 | 23.8 | 16.6 | 11.4 | 165 |
| N. Macedonia | Flotation Tailings (Cu) | 74.6 | 41.9 | 30.5 | 12.5 | 21.2 | 20.9 | 10.8 | 212 |
| N. Macedonia | Flotation Tailings (Pb-Zn-Sb) | 41.9 | 20.9 | 20.0 | 8.8 | 16.4 | 13.7 | 7.7 | 130 |
| N. Macedonia | Smelter Slag | 62.9 | 32.1 | 29.5 | 9.6 | 34.6 | 20.3 | 15.6 | 205 |
| N. Macedonia | Coal Ash | 177.6 | 84.5 | 75.2 | 21.7 | 65.4 | 51.8 | 31.9 | 508 |
Table 3.
Distribution of REEs quantities (Mt) according to type of deposit and countries.
| Type of Deposit Country | Ce (Kt) | La (Kt) | Nd (Kt) | Sc (Kt) | Y (Kt) | LREE (Kt) | HREE (Kt) | REE (Kt) |
|---|---|---|---|---|---|---|---|---|
| Flotation Tailings (Cu) | 24.1 | 12.5 | 10.8 | 6.9 | 8.9 | 7.5 | 4.6 | 75.4 |
| Flotation Tailings (Pb-Zn-Sb) | 4.6 | 2.4 | 2.2 | 1.0 | 1.7 | 1.6 | 0.8 | 14.3 |
| Smelter Slag | 0.4 | 0.2 | 0.2 | 0.1 | 0.2 | 0.1 | 0.1 | 1.2 |
| Red Mud Dam | 6.7 | 3.3 | 2.6 | 1.3 | 2.5 | 1.8 | 1.3 | 19.6 |
| Coal Ash | 31.0 | 16.0 | 13.2 | 7.1 | 12.1 | 9.1 | 5.7 | 94.2 |
| Bosnia & Herzegovina | 5.2 | 2.5 | 2.3 | 1.5 | 2.5 | 1.7 | 1.3 | 17.0 |
| Kosovo | 2.0 | 1.0 | 0.9 | 0.4 | 0.5 | 0.6 | 0.3 | 5.7 |
| Montenegro | 5.2 | 2.8 | 2.1 | 1.1 | 1.8 | 1.4 | 0.9 | 15.2 |
| North Macedonia | 22.0 | 11.5 | 9.1 | 3.4 | 6.9 | 6.2 | 3.4 | 62.5 |
| Serbia | 31.8 | 16.3 | 14.5 | 9.9 | 13.5 | 10.1 | 6.6 | 102.7 |
| Slovenia | 0.6 | 0.3 | 0.2 | 0.1 | 0.2 | 0.1 | 0.1 | 1.6 |
| SEE | 66.7 | 34.4 | 29.1 | 16.4 | 25.4 | 20.1 | 12.6 | 204.7 |
Table 4.
REE2O3 values according to deposit type and country (December 2022).
| Type of Deposit | Ce2O3 (Mil. $) | La2O3 (Mil. $) | Nd2O3 (Mil. $) | Sc2O3 (Mil. $) | Y2O3 Mil. $) | HREE2O3 (Mil. $) | LREE2O3 (Mil. $) | REE2O3 (Mil. $) |
|---|---|---|---|---|---|---|---|---|
| Flotation Tailings (Cu) | 28 | 14 | 1398 | 9628 | 86 | 489 | 1527 | 13,169 |
| Flotation Tailings (Pb-Zn-Sb) | 5 | 3 | 288 | 1318 | 17 | 101 | 299 | 2030 |
| Red Mud Dam | 8 | 4 | 339 | 1821 | 24 | 121 | 454 | 2770 |
| Coal Ash | 35 | 18 | 1701 | 9827 | 116 | 606 | 2030 | 14,334 |
| Smelter Slag | <1 | <1 | 22 | 134 | 2 | 8 | 31 | 197 |
| B&H | 6 | 3 | 296 | 2064 | 24 | 109 | 436 | 2937 |
| Kosovo | 2 | 1 | 113 | 549 | 5 | 36 | 102 | 809 |
| Montenegro | 6 | 3 | 268 | 1510 | 17 | 95 | 313 | 2211 |
| North Macedonia | 25 | 13 | 1177 | 4667 | 67 | 420 | 1268 | 7636 |
| Serbia | 36 | 18 | 1869 | 13,748 | 130 | 657 | 2190 | 18,649 |
| Slovenia | 1 | 0 | 24 | 189 | 2 | 9 | 34 | 258 |
| SEE | 76 | 39 | 3747 | 22,727 | 245 | 1325 | 4342 | 32,501 |
Table 5.
SRM classes according to the determined concentrations.
| Classes (ppm) | Landfill | Quantity (Mt) | Ce2O3 (Mil. $) | La2O3 (Mil. $) | Nd2O3 (Mil. $) | Sc2O3 (Mil. $) | Y2O3 Mil. $) | HREE2O3 (Mil. $) | LREE2O3 (Mil. $) | REE2O3 (Mil. $) |
|---|---|---|---|---|---|---|---|---|---|---|
| <100 | 31 | 992 | 21 | 10 | 1113 | 8735 | 72 | 1227 | 380 | 11,559 |
| 100–200 | 14 | 152 | 9 | 5 | 471 | 3707 | 33 | 572 | 168 | 4966 |
| 200–500 | 9 | 367 | 35 | 19 | 1670 | 8011 | 105 | 1887 | 600 | 12,326 |
| >500 | 5 | 31 | 11 | 5 | 494 | 2274 | 35 | 656 | 176 | 3650 |
| SEE | 59 | 1542 | 76 | 39 | 3747 | 22,727 | 245 | 4342 | 1325 | 32,501 |
Table 6.
Recovery methods for REEs.
| Source of REE | Methods | REEs | Results | Ref. |
|---|---|---|---|---|
| Blast Furnace Slag | Bioleaching | La, Ce, Nd, Er | 34–65% | [76] |
| Acid leaching | La, Ce, Nd Er | 35–92% | [78] | |
| Copper metallurgical slags | Bioleaching | REEs | 83% | [77] |
| Red Mud | Acid leaching | Sc, La, Ce, Y, Nd, Dy | 70–80% | [79] |
| Alkali Roasting, Smelting, and Leaching | Sc, Y, Dy, La, Ce, Nd | 5–80% | [80] | |
| Bioleaching | Lu, Y, Sc, | 52–61% | [81] | |
| Aerobic and anaerobic bi-stage bioleaching | Ce, Gd, Y, Sc | 79–87% | [82] | |
| Sulfation, roasting and leaching | Sc, Y, La, Ce, Nd, Dy | 60–80% | [83] | |
| Mine tailings | Leaching | La, Ce, Nd | 60–94% | [58] |
| La, Ce, Sc, Y | 65–76% | [84] | ||
| Hydrometallurgical and bio-hydrometallurgical processes | – | – | [85] | |
| Coal combustion products | Ionic liquid-type extractants | La, Ce, Nd, Gd, Y, Er, Tm, Yb, Lu | 37% | [86] |
| Coal fly ashes | Physical separation and acid leaching | REEs | 78% | [66] |
| Alkali fusion–Acid leaching | Y, La, Ce, Pr, Nd | 73% | [67] | |
| Acid-alkali-based alternate extraction | REEs | 55% | [87] | |
| Bioleaching | Sc, Y, La, Ce, Pr, Nd, Sm, Eu, Gd, Dy, Er, Yb | 27–68% | [65] |
Disclaimer/Publisher’s Note: The statements, opinions and data contained in all publications are solely those of the individual author(s) and contributor(s) and not of MDPI and/or the editor(s). MDPI and/or the editor(s) disclaim responsibility for any injury to people or property resulting from any ideas, methods, instructions or products referred to in the content. |
© 2024 by the authors. Licensee MDPI, Basel, Switzerland. This article is an open access article distributed under the terms and conditions of the Creative Commons Attribution (CC BY) license (https://creativecommons.org/licenses/by/4.0/).
Share and Cite
MDPI and ACS Style
Šajn, R.; Alijagić, J.; Ristović, I. Secondary Deposits as a Potential REEs Source in South-Eastern Europe. Minerals 2024, 14, 120. https://doi.org/10.3390/min14020120
AMA Style
Šajn R, Alijagić J, Ristović I. Secondary Deposits as a Potential REEs Source in South-Eastern Europe. Minerals. 2024; 14(2):120. https://doi.org/10.3390/min14020120
Chicago/Turabian StyleŠajn, Robert, Jasminka Alijagić, and Ivica Ristović. 2024. "Secondary Deposits as a Potential REEs Source in South-Eastern Europe" Minerals 14, no. 2: 120. https://doi.org/10.3390/min14020120
Note that from the first issue of 2016, this journal uses article numbers instead of page numbers. See further details here.