
Sedimentological and Geochemical Characterization of the Early Cambrian Eastern Yunnan, Southwestern China


1
State Key Laboratory of Continental Dynamics, Northwest University, Xi’an 710069, China
2
Department of Geology, Northwest University, Xi’an 710069, China
*
Authors to whom correspondence should be addressed.
Minerals 2024, 14(5), 445; https://doi.org/10.3390/min14050445
Submission received: 26 January 2024
/
Revised: 18 April 2024
/
Accepted: 18 April 2024
/
Published: 24 April 2024
(This article belongs to the Section Mineral Geochemistry and Geochronology)
Abstract
:The accurate reconstruction of the early Cambrian paleoclimate and paleoceanographic conditions on the Yangtze Plate is crucial for understanding the ancient environment during the Cambrian Explosion. It is also a key factor in understanding the ecological habits of organisms during the Cambrian Explosion. The study utilized field outcrops, thin section analysis, and major and trace elements to investigate the sedimentary environment, provenance, paleoweathering, and paleoclimate of the Lower Cambrian Hongjingshao (HJS) Formation (Cambrian Stage 3, ~515 Ma) in the Yangtze Basin, eastern Yunnan, SW China. The HJS sandstones are composed of 10 lithofacies, including massive and weakly bedded gravel supported by coarse sandstone (Gm), trough cross-bedded sandstone (St), planar cross-bedded sandstone (Sp), ripple cross-laminated sandstone (Sr), horizontal bedded sandstone (Sh), scour-fill sandstone (Se), massive sandstone (Sm), fine to medium sandstone with thin bed muddy siltstone (Fl), muddy siltstone (Fsc), and mudstone (Fm). On the basis of these lithofacies, channel fill and over-bank deposits in delta and shallow shelf depositional environments are suggested for HJS Formation. The major elements-based provenance discriminant function and mineral composition indicate that felsic rocks from the recycled orogen and continental block are the main sediment source terrane for the HJS sandstones of the study area. CIA, PIA, and CIW values range from 71.29 to 93.72, indicating an intermediate to intense chemical weathering and semiarid to humid climate conditions in Cambrian Stage 3. The research findings have clarified the paleoclimate and paleoceanographic environment of the Early Cambrian in the Yangtze region, which is of significant importance for understanding the early biological and ecological marine environment in the study area.
1. Introduction
Chemical compositions of sedimentary rocks provide important information for reconstructing depositional environments, paleoclimate, and provenance of sedimentary basins [1,2,3,4,5,6,7,8,9]. The acquisition of the geochemical properties of sedimentary rocks is of great interest. Geochemical methods in reconstructing paleoenvironments have been increasingly emphasized in sedimentology research [10,11]. Recent studies have demonstrated the discriminative potential and sensitiveness of geochemical data against many factors, such as the source-area lithology, weathering, redox conditions, and tectonic regime of the basin [3,5,12,13]. Trace elements (e.g., V, Ni, and Co) of clastic sediments are used as effective tracers of provenance and depositional environments [6,14,15]. Lithofacies, classified based on lithological details, sedimentary structures, composition, and various physical characteristics, are significantly useful for understanding sedimentary facies [6,8].
Several studies have been published in the past describing the sedimentary environments and facies, paleogeography, and source rock potential of the HJS Formation in the southwestern Yangtze Basin [16,17]. However, sedimentological, petrographic, and geochemical studies focusing on the characterization and reconstruction of the depositional environments, source rock composition, and paleoweathering conditions are still scarce. Therefore, we are conducting a petrological characterization to constrain the depositional settings using sedimentological observations, at the core scale to the micron scale, in six complete outcrop profiles, to allow for a more complete sedimentological, petrographical, and geochemical study. This study introduces a unique dataset on lithology and major/trace elements from the HJS Formation in eastern Yunnan, a renowned area associated with the “Cambrian Explosion of life”. The depositional environment, source rock composition, and paleoweathering conditions were discussed. The findings from this study are of great significance for reconstructing the paleoenvironment in the western Yangtze Basin on a regional scale and for providing the characteristics of ancient structures and marine environments during Cambrian Stage 3 on the western edge of the Yangtze Basin, SW China.
2. Geological Setting
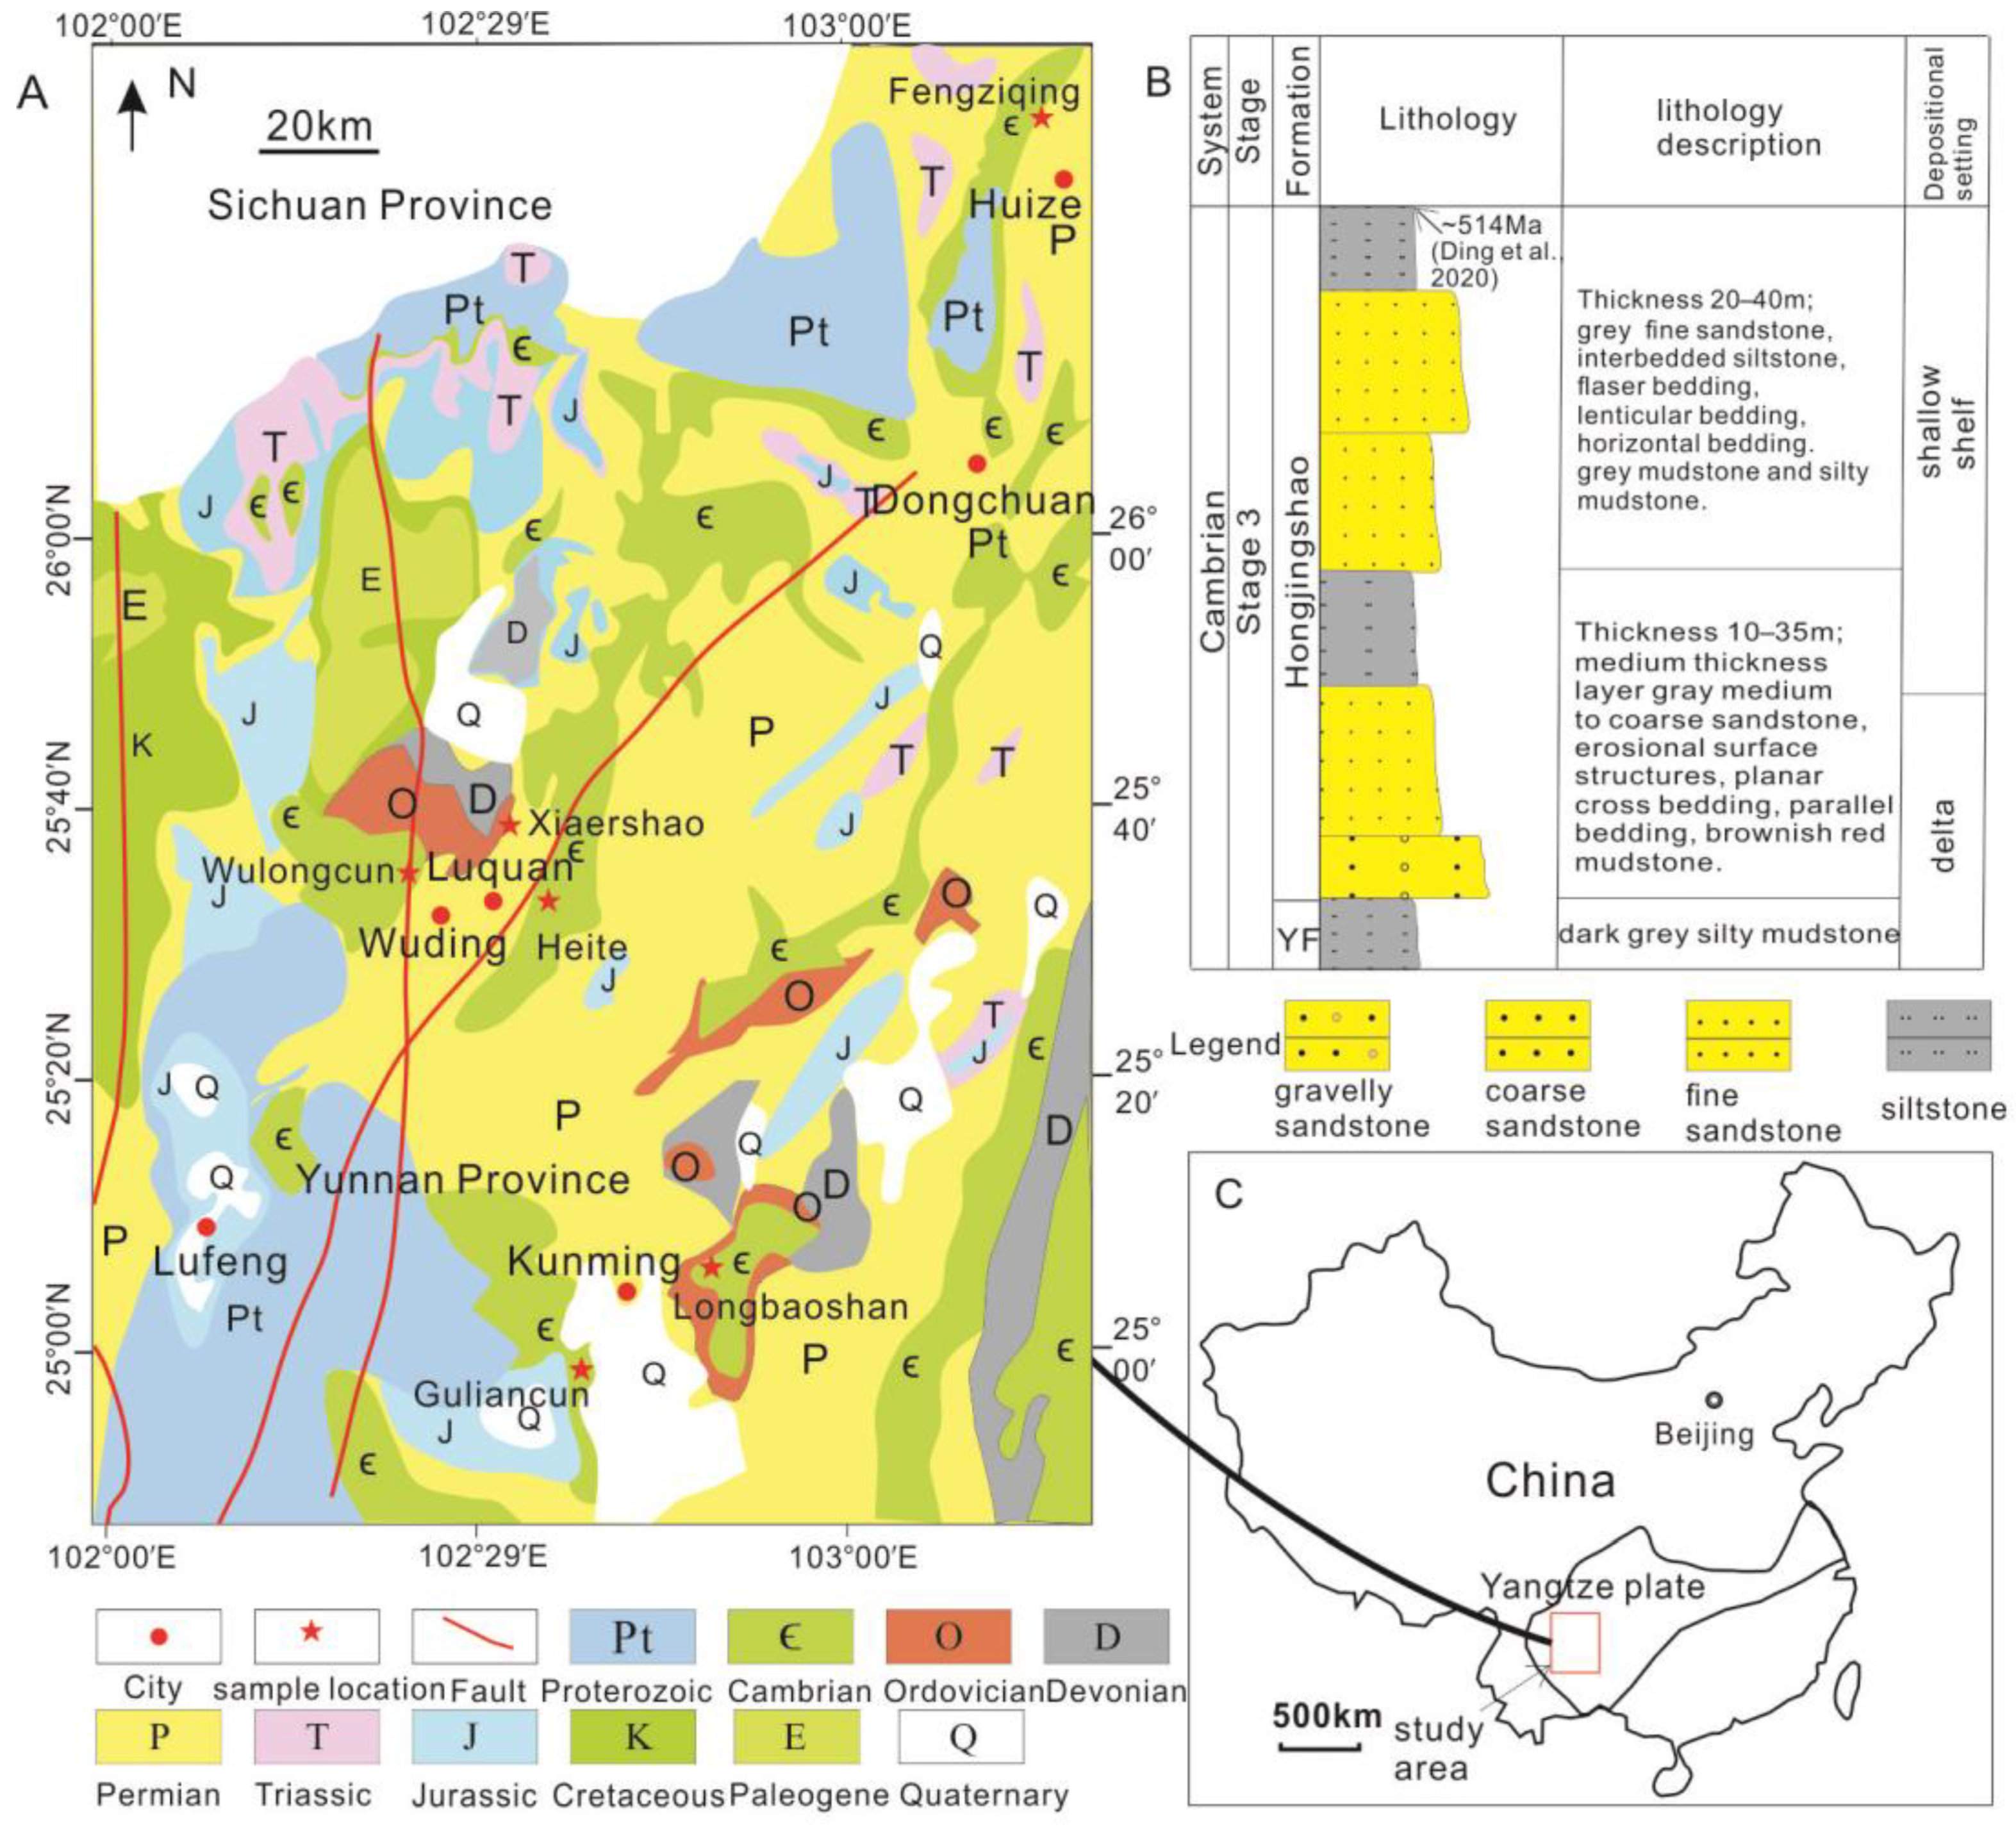
The Cambrian strata is widely distributed in eastern Yunnan (Figure 1A) and forms part of the Yangtze Basin, located in the South China Block (Figure 1C). The Cambrian Stage 3 Hongjingshao (HJS) Formation is well exposed in Kunming, Wuding, Luquan, and Huize (Figure 1A) and mainly consists of coarse sandstone, medium sandstone, fine sandstone, and siltstone (Figure 1B). In the Wuding–Kunming area, the HJS Formation is predominately composed of reddish-purple, grayish-green, thick to very thick-bedded sandstone, along with rare thin-bedded reddish–brown shale [16,18]. In the Huize area, the HJS Formation typically consists of gray sandstone, interbedded with thin-bedded dark gray siltstone [19].
The sedimentation of the Cambrian Stage 3 HJS Formation began around 515 million years ago [20]. Ding et al. (2022) suggested that the HJS Formation in the Malong county, nearby Kunming, was deposited in an intertidal environment [16]. Sedimentary and lithofacies evolution at the Wulongcun (Wuding) section indicates that early Cambrian HJS successions in East Yunnan were deposited in a delta environment within the Yangtze Basin [20]. The samples were collected from Kunming, Wuding, Luquan, and Huize (Figure 1A).
3. Materials and Methods
The HJS Formation in eastern Yunnan is well exposed, with clear boundaries (Figure 2A,C). A total of 52 sandstone and shale samples were collected for petrological analysis. Seventeen sandstone and shale samples were collected for elemental analysis. The lithology and the locations of the 17 HJS samples are listed in Table 1. All samples were stored in plastic bags to ensure as little oxidation as possible.
The samples for geochemical analysis were crushed to a size of less than 200 mesh. Major element data were collected using scanning X-ray fluorescence (XRF), using an RIX2100 (RiGAKU) spectrometer (Akishima-shi, Tokyo, Japan) in the Key Laboratory of Continental Dynamics, Northwest University, China. The analytical uncertainty is usually <5%.
The concentrations of trace elements and REEs (rare earth elements) were determined using an Agilent 7900 Inductively Coupled Plasma Mass Spectrometer (ICP-MS) (Agilent Technologies Inc., Santa Clara, CA, USA) in the State Key Laboratory of Continental Dynamics, Northwest University, China. The analytical precision is generally within 5%.
The identification of the mineral composition in sandstone is mainly based on thin sections. The composition of source rocks is primarily based on the elemental composition of trace elements and discriminate diagrams, such as Cr/V vs. Y/Ni provenance discrimination diagrams, La/Yb vs. ∑REEs provenance discrimination diagrams [21], La/Th vs. Hf discrimination diagrams [22], and F1 vs. F2 discrimination diagrams [23].
4. Results
4.1. Lithofacies and Facies Associations
Lithofacies and facies association in this paper are based on color, lithology, erosional (scour, etc.), and depositional structures (bedding, cross stratification, etc.). A modified version of Miall’s lithofacies analysis was employed (1985) and the lithofacies’ classification utilizes a letter-coding system [24]. The lithofacies codes consist of the following two parts: a capital letter indicating the modal grain size (G for gravel, S for sand, and F for fine-grained particles) and a lowercase letter or letters chosen to represent a distinctive texture or structure of each lithofacies [24]. Ten lithofacies (LFs) were recognized according to outcrops and hand-sample observations (Table 2). These lithofacies were identified and delineated into three principal facies associations (FAs) in the HJS Formation, combining lithofacies of similar depositional environments.
4.1.1. FA 1: Fluvial-Dominated Channel Facies Association
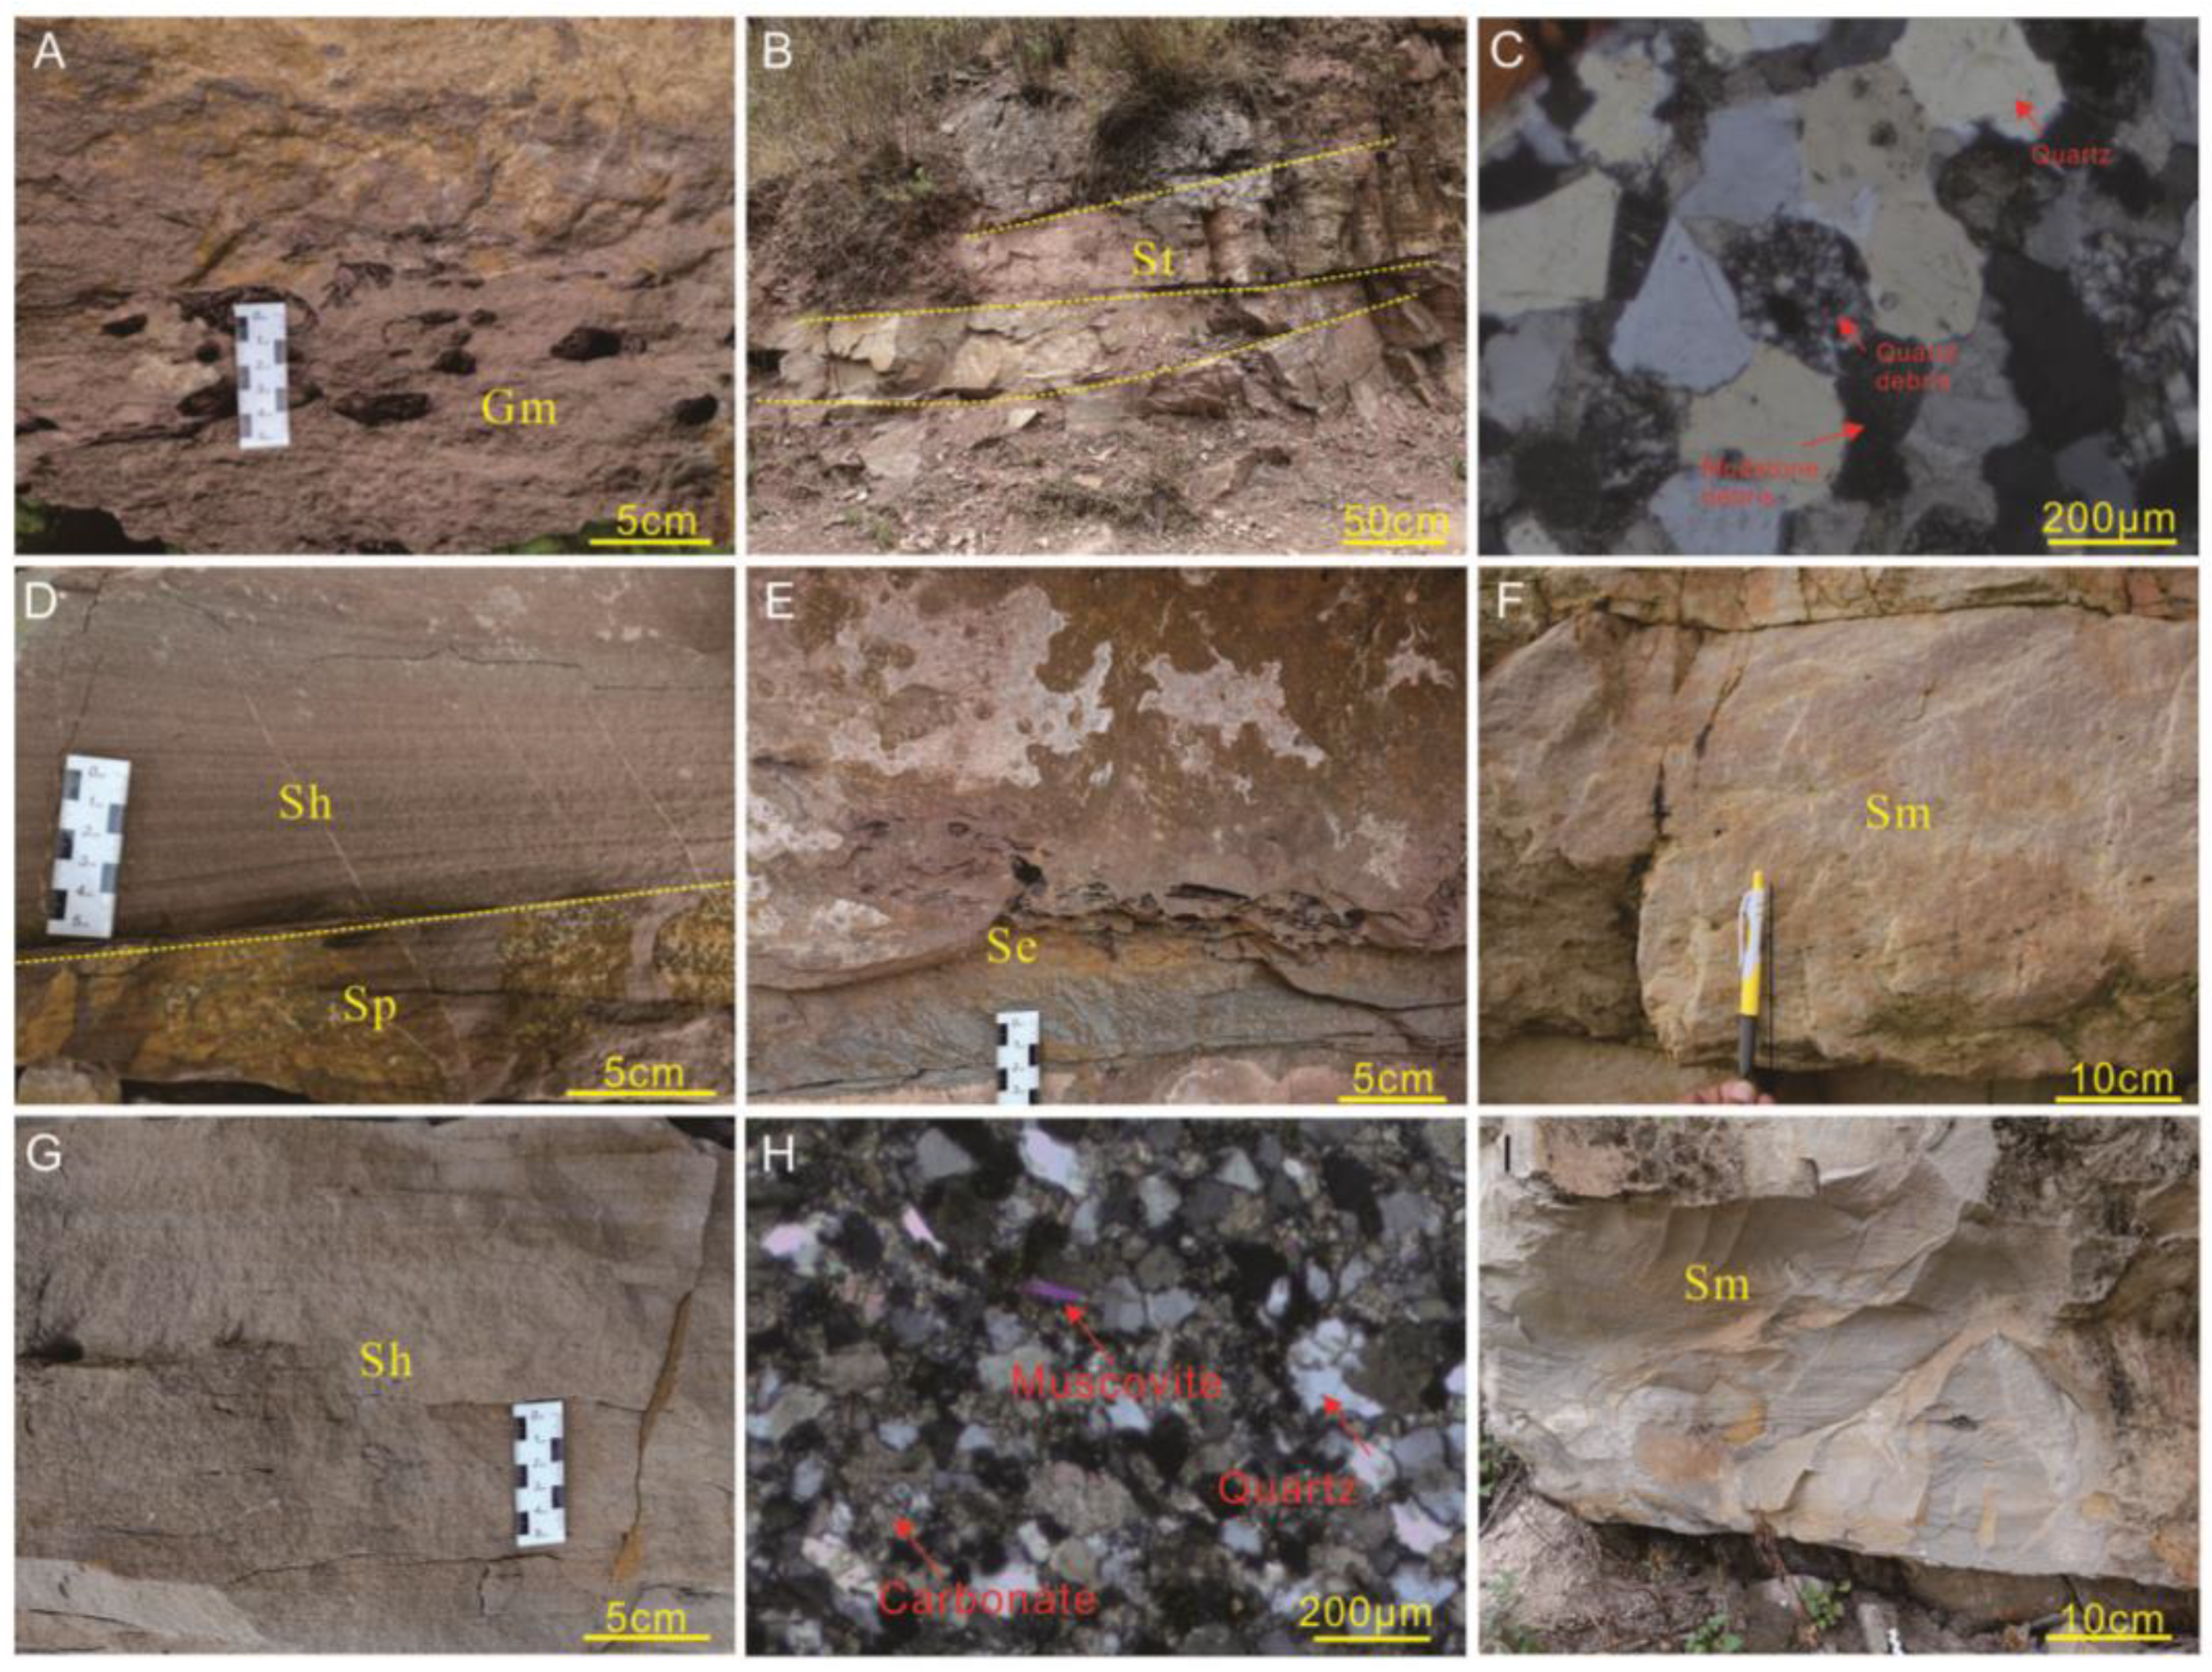
Gravel lithofacies, denoted as Gm, comprise massive and crudely bedded gravel, supported by coarse sandstone and they occurred commonly at the base of FA1. The gravels exhibit a sub-rounded-to-rounded shape and are primarily composed of clasts of reddish-brown mudstone. They are poorly sorted within a matrix of fine-to-coarse sands (Figure 3A). Typically, these beds have a lenticular shape with a thickness ranging from 20 to 50 cm. They display sharp and erosional contacts with the underlying medium-to-coarse sandstone beds and are overlain by sandstone, which exhibits trough cross-bedding (St) (Figure 3B). Imbrication is commonly observed, with tabular gravel displaying approximately horizontal orientations.
The sandstone lithofacies of FA1 in the HJS Formation include six main sand lithofacies, primarily distinguished by their dominant primary sedimentary structure. These include trough cross-bedded sand (lithofacies St), planar cross-bedded sandstone (lithofacies Sp), ripple cross-laminated sandstone (lithofacies Sr), horizontally bedded sandstone (lithofacies Sh), scour-fill sandstone (lithofacies Se), and massive sandstone (lithofacies Sm) (Table 2).
Lithofacies St comprises approximately 30% of the sandstone lithofacies. The sandstone beds, ranging from 30 cm to 50 cm thick, exhibit a broad lenticular-to-wedge-shaped geometry and extend laterally for tens of meters (Figure 3B). Lithofacies St is primarily composed of quartz and feldspar, along with lithic fragments including both quartz and mudstone fragments (Figure 3C). The abundance of lithic fragments indicates a proximal sedimentary environment. They consistently display erosional contacts with underlying fine-grained stratification and are frequently overlain by massive sandstone (Figure 3B). These beds predominantly consist of medium-to-coarse-grained sandstone and are characterized by trough cross-bedding. Thin lag deposits of small mudstone intraclasts are observed within the sandstone beds.
Lithofacies Sh occurred throughout this FA and is characterized by horizontal thin-laminated sandstones, often interbedded with planar cross-bedded sandstones (Lithofacies Sp) (see Figure 3D). It consists of fine-to-coarse-grained sandstone, occasionally containing fine conglomerate and plant debris (Figure 3G), with a thickness ranging from 5 to 20 cm. It is primarily composed of lithic fragments, quartz, and feldspar (Figure 3H). Individual laminae within this lithofacies vary in thickness from 5 to 10 cm. Lower contacts with subjacent sandstones are typically sharp.
Lithofacies Se is composed of medium-to-coarse sandstone, occasionally with some muddy conglomerate (Figure 3E), and is characterized by erosional scours. The sandstone beds have a thickness ranging from 10 cm to 50 cm and exhibit a broadly lenticular-to-wedge-shaped geometry, extending laterally for tens of meters. Lithofacies Sm occur in FA 1 and exhibit no obvious lamination in their outcrop (Figure 3F,I). These sandstone beds have a broadly sheet-like geometry and display sharp and erosional contacts with the underlying medium-to-coarse sandstone beds (Figure 3I). They range in thickness from 20 to 80 cm and are composed of durable light grey to brown, fine-to-coarse-grained sandstone in sheet-like beds.
4.1.2. FA 2: Tide-Influenced Shallow Shelf Facies Association
This FA is predominantly composed of fine-to-medium-grained sandstone, muddy siltstone, and a thin layer of mudstone. FA 2 contains mainly five lithofacies types. Lithofacies Sr is composed of fine-to-medium-grained sandstone and is distinguished by the presence of ripple trains (Figure 4A). Lithofacies Sr is primarily composed of quartz, with minor amounts of siliceous matrix (Figure 4B,C). The sandstone grains are well sorted, rounded-to-sub-rounded, reflecting an intense reworking by waves or tidal action. The sandstone beds typically range from 10 to 20 cm in thickness and exhibit a lenticular shape, extending laterally for tens of meters. The ripples within this lithofacies measure 1 to 3 cm in height, with a ripple length of approximately 6 cm (Figure 4A). Lithofacies Fm is primarily interbedded with thin-bedded lithofacies Sm (Figure 4D).
Lithofacies Fsc varies in thickness from 30 to 150 cm and comprises dark grey mudstone and sandstone, arranged in lenticular beds. Its predominant lithology is mudstone and muddy siltstone (Figure 4E,F).
Lithofacies Fl commonly consists of light grey sandstone with a thin layer of mudstone. This flaser-bedded sandstone has discontinuous and irregular mudstone beds, as well as a few scour surfaces with mud lining (Figure 4G). Thin layers of irregular grey mudstone are usually distributed in a banded or lenticular manner within medium-to-thick sandstone sequences. The thickness of lithofacies Fl ranges from 20 cm to 1 m. The bed exhibits an erosional relationship with the underlying fine-grained stratification (Figure 4G).
4.1.3. FA 3: Floodplain Facies Association
FA 3 is mainly composed of lithofacies Fm and St (Figure 4H,I). Lithofacies Fm is primarily composed of mudstone, characterized by its reddish-brown and grey color (Figure 4H,I). Thin-bedded sandstone is primarily interbedded with reddish and grey mudstones. Mudstones are predominantly found in the upper portion of the field sections. The thickness of lithofacies Fm ranges from a few meters to 10 m.
4.2. Major Element Geochemistry
Table 3 displays the major element concentrations of the HJS Formation, where SiO2 emerges as the predominant oxide across all analyzed samples (57.54 wt.%–96.39 wt.%, average 76.52 wt.%). Other major elements vary in a narrow range. The HJS Formation consists of 1.08–18.99 wt.% Al2O3, 0.34–7.03 wt.% Fe2O3, 0.32–5.72 wt.% K2O, 0.11–6.13 wt.% MgO, 0.02–6.83 wt.% CaO, 0.05–0.89 wt.% TiO2, 0.02–1.77 wt.% Na2O, 0.02–0.31 wt.% P2O5, and 0.01–0.16 wt.% MnO. The average SiO2 content in the samples from the HJS Formation is 76.52 wt.%, exceeding that of the upper continental crust (UCC: 66.62 wt.% [25]) and the late Archean Australian shale (PAAS: 62.80 wt.% [25]).
The abundance of major elements (TiO2, P2O5, TFe2O3, MgO, K2O, and Al2O3) exhibits strong correlations with SiO2 (Figure 5). Negative linear relationships between TiO2, P2O5, TFe2O3, MgO, K2O, and Al2O3 in the HJS Formation (Figure 5) are likely due to the majority of Si being present in quartz, rather than as a clay component [26].
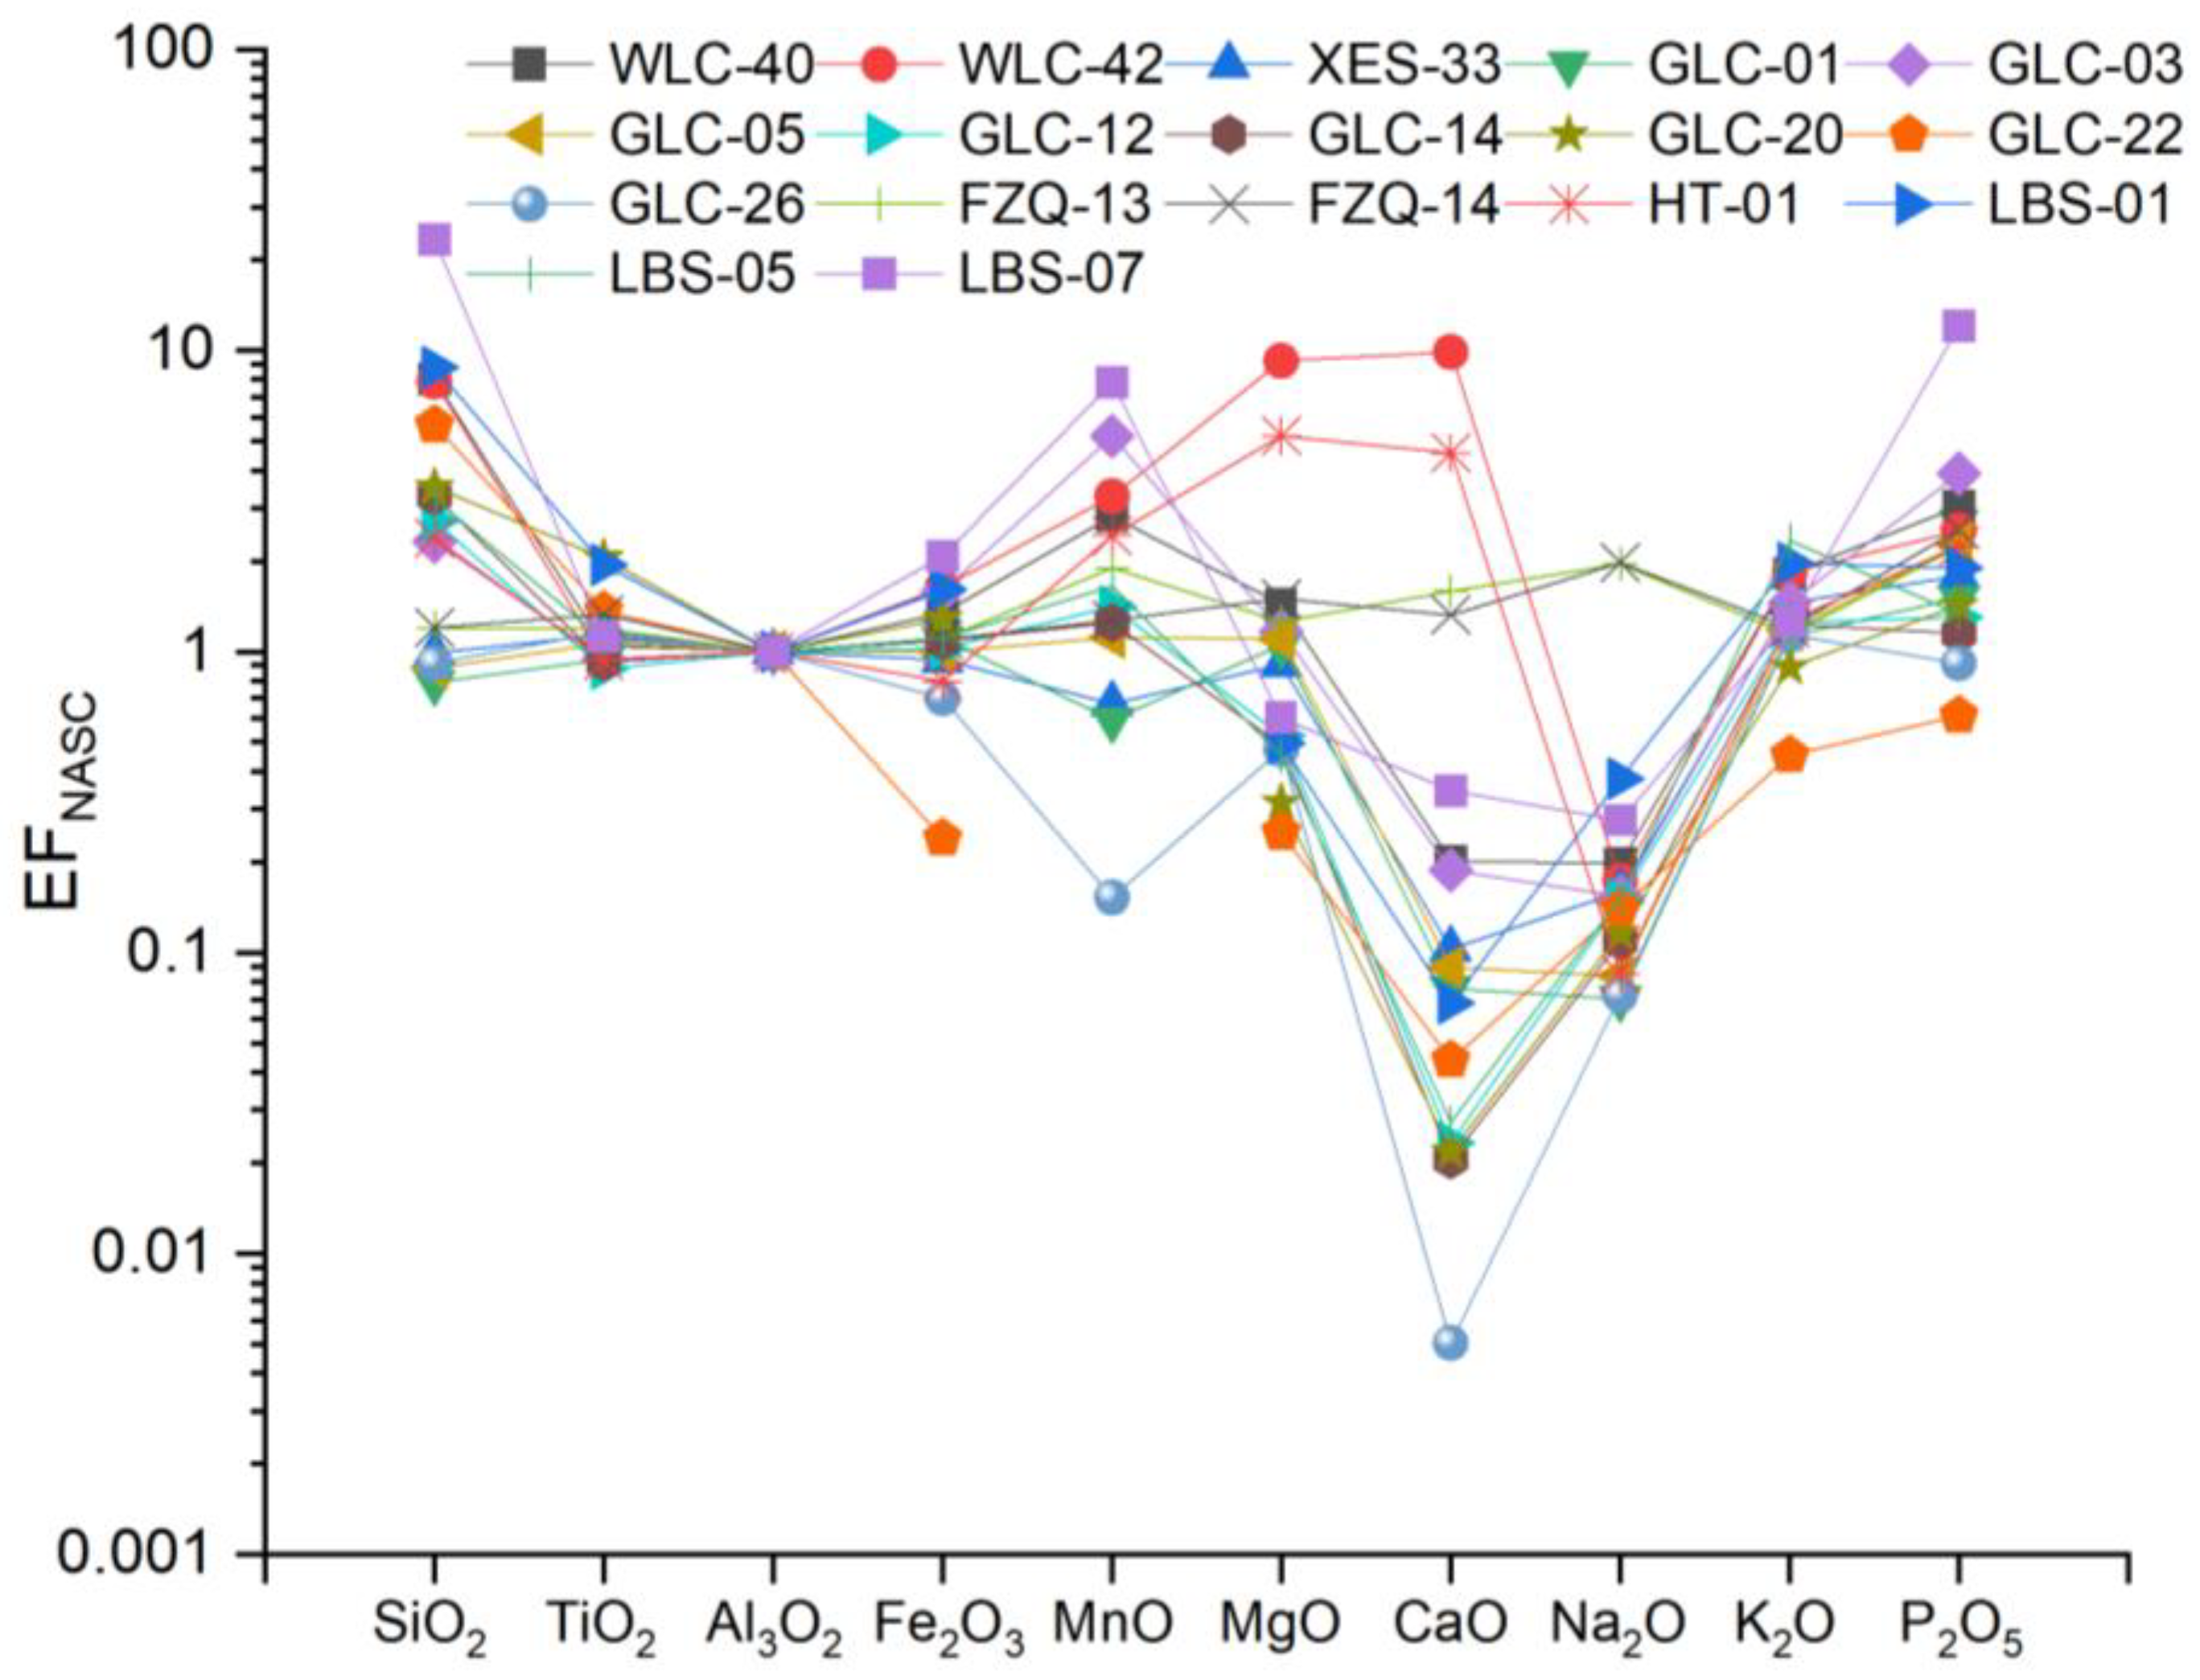
To assess the relative enrichments of elements within the HJS Formation, major metal concentrations are presented as “enrichment factors” (EFs), calculated using the formula EF = (X/Al)sample/(X/Al)NASC, where X and Al represent the weight concentrations of element X and Al, respectively [27]. Samples were normalized using the North American shale composite (NASC) [28]. The EF results for elements indicate that, in the HJS Formation, Fe2O3 and MgO are relatively enriched, compared to North American shale. SiO2, TiO2, MnO, CaO, and P2O5 show both enrichment and depletion tendencies, whereas K2O and Na2O are mainly depleted (Figure 6).

Table 3.
Major element concentrations in weight % of samples from the HJS Formation, eastern Yunnan.
Table 3.
Major element concentrations in weight % of samples from the HJS Formation, eastern Yunnan.
| Sample No. | Location | SiO2 | TiO2 | Al2O3 | TFe2O3 | MnO | MgO | CaO | Na2O | K2O | P2O5 | CIA | PIA | CIW |
|---|---|---|---|---|---|---|---|---|---|---|---|---|---|---|
| WLC-40 | Wulong, Wuding | 92.2 | 0.13 | 3 | 1.35 | 0.03 | 0.73 | 0.13 | 0.04 | 1.28 | 0.07 | 66.41 | 92.46 | 95.80 |
| WLC-42 | Wulong, Wuding | 78.17 | 0.1 | 2.58 | 1.41 | 0.03 | 4.03 | 5.48 | 0.03 | 1.11 | 0.05 | 66.49 | 93.32 | 96.32 |
| XES-33 | Xiaershao, Luquan | 63.61 | 0.79 | 16.78 | 5.28 | 0.04 | 2.57 | 0.37 | 0.18 | 5.72 | 0.23 | 71.21 | 94.70 | 96.59 |
| GLC-01 | Guliancun, Kunming | 57.54 | 0.74 | 18.99 | 7.03 | 0.04 | 3.38 | 0.31 | 0.09 | 5.03 | 0.22 | 76.79 | 97.86 | 98.46 |
| GLC-03 | Guliancun, Kunming | 77.21 | 0.34 | 8.67 | 4.61 | 0.16 | 1.72 | 0.35 | 0.09 | 2.96 | 0.26 | 71.24 | 94.86 | 96.70 |
| GLC-05 | Guliancun, Kunming | 60.84 | 0.78 | 17.69 | 5.92 | 0.07 | 3.3 | 0.34 | 0.1 | 4.89 | 0.31 | 75.88 | 97.41 | 98.17 |
| GLC-12 | Guliancun, Kunming | 83.13 | 0.29 | 7.99 | 2.74 | 0.04 | 0.71 | 0.04 | 0.08 | 2.35 | 0.08 | 74.11 | 95.65 | 96.99 |
| GLC-14 | Guliancun, Kunming | 85.54 | 0.26 | 6.79 | 2.47 | 0.03 | 0.56 | 0.03 | 0.05 | 1.97 | 0.06 | 74.82 | 96.82 | 97.80 |
| GLC-20 | Guliancun, Kunming | 86.1 | 0.54 | 6.38 | 2.74 | <0.01 | 0.34 | 0.03 | 0.05 | 1.33 | 0.07 | 79.95 | 96.86 | 97.55 |
| GLC-22 | Guliancun, Kunming | 92.27 | 0.24 | 4.24 | 0.34 | <0.01 | 0.18 | 0.04 | 0.04 | 0.45 | 0.02 | 88.33 | 98.09 | 98.30 |
| GLC-26 | Guliancun, Kunming | 64.64 | 0.89 | 18.46 | 4.33 | 0.01 | 1.48 | 0.02 | 0.09 | 4.93 | 0.13 | 76.44 | 97.38 | 98.12 |
| FZQ-13 | Fengziqing, Huize | 61.48 | 0.66 | 13.37 | 4.91 | 0.09 | 2.85 | 4.55 | 1.76 | 3.57 | 0.23 | 58.07 | 62.14 | 69.78 |
| FZQ-14 | Fengziqing, Huize | 61.32 | 0.73 | 13.29 | 4.89 | 0.06 | 3.37 | 3.77 | 1.77 | 3.75 | 0.26 | 57.35 | 61.32 | 69.53 |
| HT-01 | Heite, Luquan | 63.6 | 0.27 | 6.96 | 1.86 | 0.06 | 6.13 | 6.83 | 0.04 | 2.07 | 0.12 | 74.58 | 97.29 | 98.14 |
| LBS-01 | Longbaoshan, Kunming | 92.6 | 0.22 | 2.74 | 1.48 | <0.01 | 0.23 | 0.04 | 0.07 | 1.27 | 0.04 | 63.71 | 88.00 | 93.64 |
| LBS-05 | Longbaoshan, Kunming | 84.21 | 0.31 | 6.82 | 2.53 | 0.04 | 0.52 | 0.04 | 0.07 | 3.74 | 0.07 | 61.57 | 93.03 | 97.04 |
| LBS-07 | Longbaoshan, Kunming | 96.39 | 0.05 | 1.08 | 0.75 | 0.03 | 0.11 | 0.08 | 0.02 | 0.32 | 0.1 | 72.38 | 91.77 | 94.26 |
| NASC | 64.80 | 0.70 | 16.90 | 5.66 | 0.06 | 2.86 | 3.63 | 1.14 | 3.97 | 0.13 | 67.81 | 77.18 | 81.93 |
NASC—North American shale composite, from [28].
4.3. Trace Elements Geochemistry
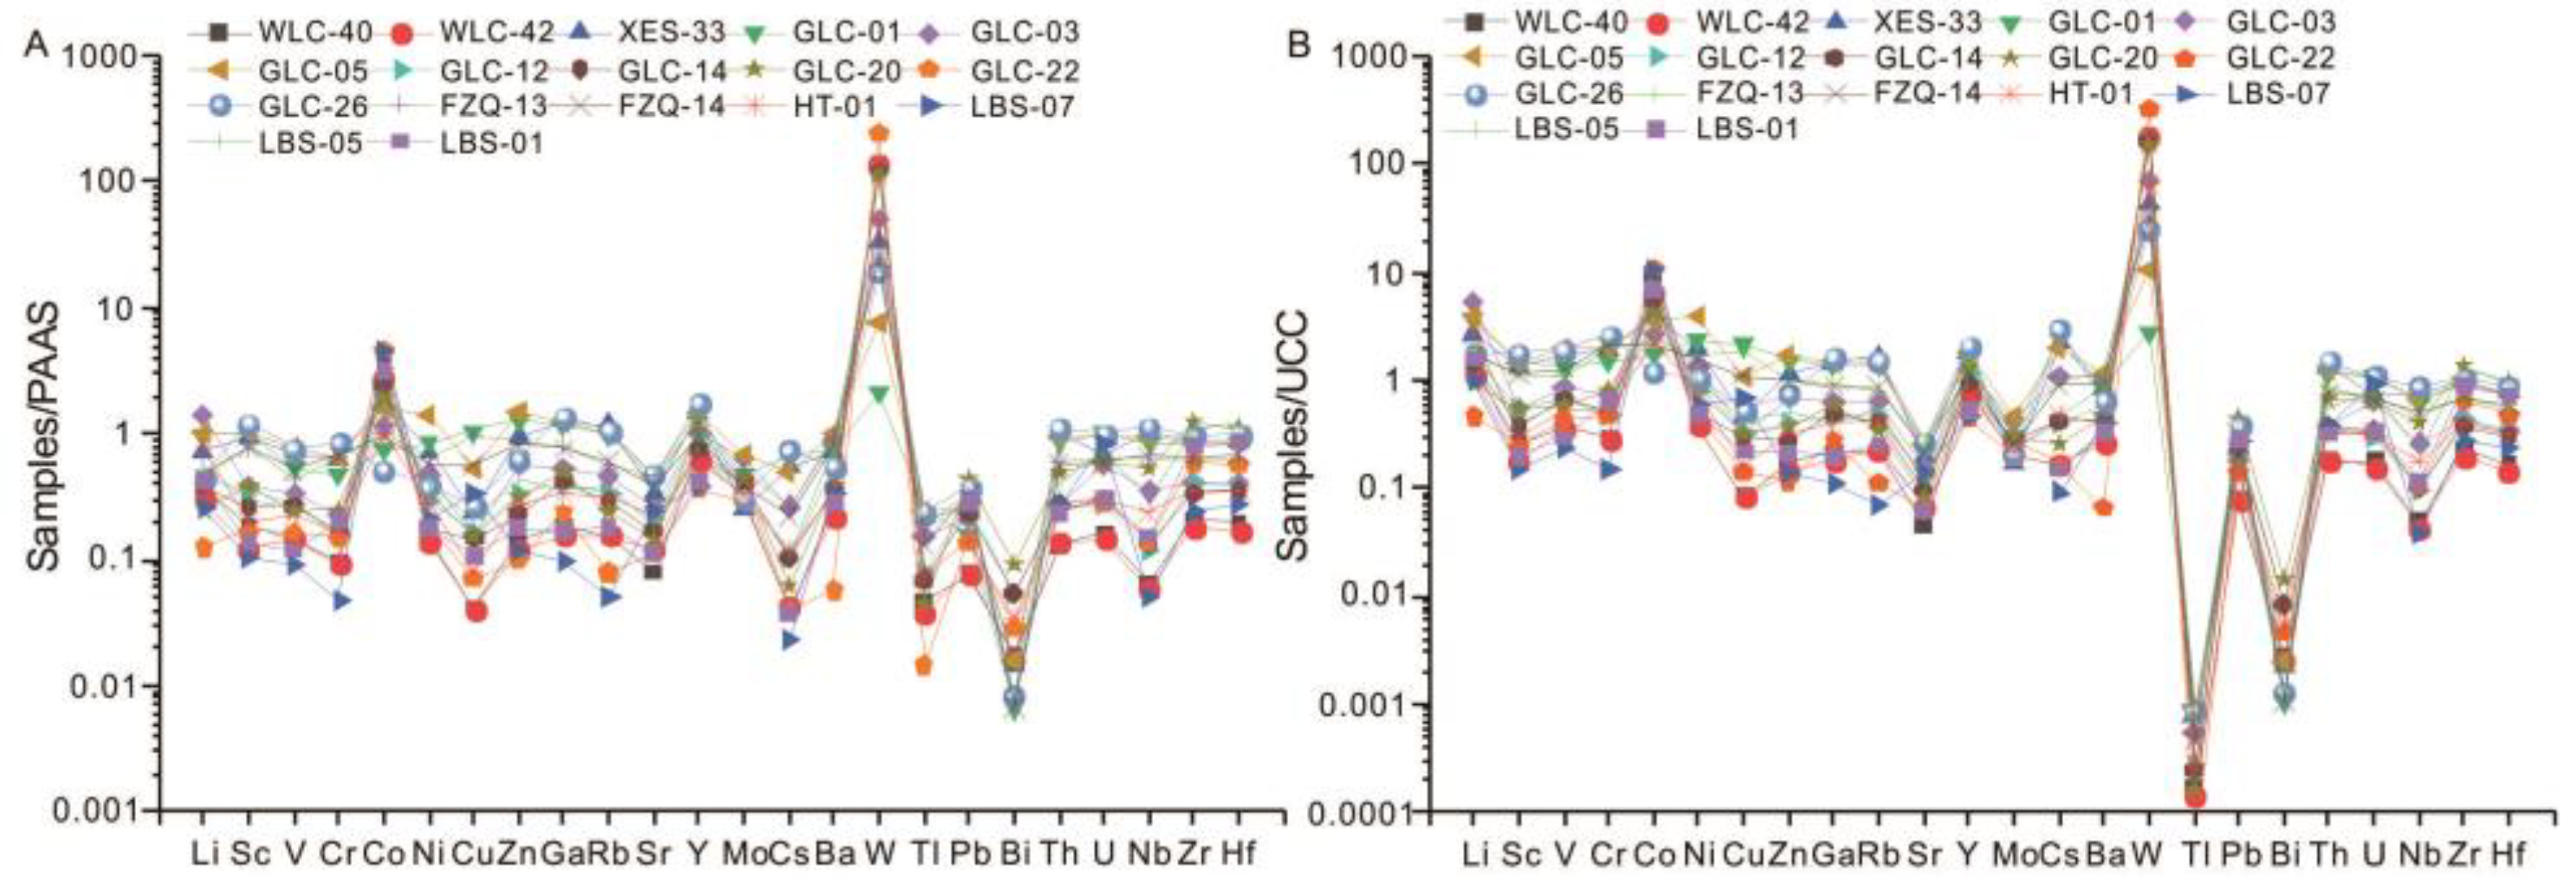
The trace element concentrations of the examined samples are presented in Table 4. Overall, the trace element contents of the analyzed samples exhibit a broad spectrum. Most trace element concentrations are below those of the Post-Archaean average Australian sedimentary rock (PAAS, [29]). However, some elements, e.g., Co, Y, and W show variable contents with average values of 50.2 × 10⁻⁶, 25.2 × 10⁻⁶, and 209 × 10−6, respectively. These values are mostly lower than the average values of PAAS (Figure 7A). The PAAS-normalized abundance [28] for the samples from the HJS Formation is shown in Figure 7A. The UCC-normalized abundance [29] for the samples from the HJS Formation is shown in Figure 7B. The samples show enrichment in Co and W, compared to UCC. This discrepancy can be attributed to the reduction in acidic fragments and the increased prevalence of mafic fragments throughout sedimentary processes [6,30].
4.4. Rare Earth Elements Geochemistry
The concentration of REEs of 17 samples from the HJS Formation is presented in Table 5. The total rare earth elements (ΣREEs) in the HJS sandstone samples exhibit significant variation, with concentrations ranging from 54.2 to 260.8 μg/g (Table 5). The weighted mean value is 128.1 μg/g, close to those of the NASC (136.3 μg/g, the North American shale composite [28]), but lower than those of Post-Archaen average Australian sedimentary rock (PAAS, 184.8 μg/g [29]) and the upper continental crust (UCC, 146.4 μg/g [29]).
The concentration of light rare earth elements (LREEs) surpasses that of heavy rare earth elements (HREEs), consistent with the typical distribution pattern of REEs in shales [28,31]. The LREE/HREE ratios of the HJS sandstone samples from eastern Yunnan vary greatly, ranging from 4.6 to 10.8 (Table 5). The HJS sandstone samples display a negative Eu anomaly (Table 5), with an average δEu value of 0.69. The δCe values of all samples vary from 0.81 to 1.26, with a mean δCe value of 0.97.
All the HJS sandstone samples exhibit similar chondrite-normalized REE patterns, with clearly fractionated LREEs, relative to HREEs, as well as a distinct negative Eu anomaly (Figure 8A). When normalized to UCC, these sandstone samples generally show no or slightly LREE-rich patterns (Figure 8B), suggesting that the REEs in these lithological samples may have originated from a similar terrigenous source [32].
Table 5.
Rare earth element contents (in μg/g) in samples and associated geochemical parameters.
| Sample No. | Location | La | Ce | Pr | Nd | Sm | Eu | Gd | Tb | Dy | Ho | Er | Tm | Yb | Lu | ΣREE | LREE | HREE | L/H | (La/Yb)N | Ce/Ce * | Eu/Eu * |
|---|---|---|---|---|---|---|---|---|---|---|---|---|---|---|---|---|---|---|---|---|---|---|
| WLC-40 | WW | 11.60 | 21.70 | 2.82 | 10.80 | 2.20 | 0.59 | 2.23 | 0.46 | 2.36 | 0.54 | 1.41 | 0.22 | 1.29 | 0.18 | 58.41 | 49.71 | 8.70 | 5.72 | 6.06 | 0.91 | 0.82 |
| WLC-42 | WW | 10.70 | 19.10 | 2.51 | 9.64 | 2.51 | 0.50 | 2.40 | 0.49 | 2.47 | 0.57 | 1.56 | 0.23 | 1.36 | 0.18 | 54.21 | 44.96 | 9.25 | 4.86 | 5.30 | 0.89 | 0.62 |
| XES-33 | XL | 55.10 | 103.00 | 12.60 | 48.40 | 7.59 | 1.28 | 6.23 | 1.12 | 5.47 | 1.15 | 3.27 | 0.55 | 3.34 | 0.51 | 249.61 | 227.97 | 21.64 | 10.54 | 11.11 | 0.94 | 0.57 |
| GLC-01 | GK | 50.50 | 88.90 | 10.50 | 39.00 | 6.03 | 1.21 | 6.06 | 1.05 | 5.32 | 1.12 | 3.08 | 0.50 | 4.00 | 0.56 | 217.83 | 196.14 | 21.69 | 9.04 | 8.50 | 0.93 | 0.61 |
| GLC-03 | GK | 14.60 | 32.80 | 3.94 | 15.50 | 3.96 | 1.33 | 4.88 | 0.90 | 4.41 | 0.84 | 2.08 | 0.33 | 2.06 | 0.29 | 87.93 | 72.13 | 15.80 | 4.57 | 4.77 | 1.04 | 0.92 |
| GLC-05 | GK | 50.90 | 101.00 | 13.70 | 50.60 | 9.76 | 1.82 | 8.84 | 1.47 | 7.44 | 1.56 | 4.16 | 0.57 | 4.16 | 0.56 | 256.54 | 227.78 | 28.76 | 7.92 | 8.24 | 0.92 | 0.60 |
| GLC-12 | GK | 17.00 | 30.90 | 3.78 | 13.60 | 3.01 | 0.87 | 3.23 | 0.58 | 3.12 | 0.74 | 1.86 | 0.26 | 2.06 | 0.27 | 81.29 | 69.16 | 12.12 | 5.71 | 5.56 | 0.93 | 0.86 |
| GLC-14 | GK | 15.80 | 29.50 | 3.70 | 13.80 | 2.59 | 0.66 | 2.94 | 0.54 | 3.01 | 0.68 | 1.85 | 0.30 | 1.91 | 0.27 | 77.54 | 66.05 | 11.49 | 5.75 | 5.57 | 0.93 | 0.73 |
| GLC-20 | GK | 31.60 | 51.00 | 6.46 | 25.20 | 5.28 | 1.07 | 5.14 | 0.97 | 4.99 | 1.00 | 2.71 | 0.41 | 2.58 | 0.41 | 138.81 | 120.61 | 18.20 | 6.63 | 8.25 | 0.86 | 0.63 |
| GLC-22 | GK | 14.40 | 31.50 | 3.25 | 12.00 | 1.75 | 0.28 | 1.52 | 0.25 | 1.48 | 0.31 | 0.85 | 0.18 | 1.09 | 0.15 | 69.02 | 63.18 | 5.84 | 10.83 | 8.90 | 1.11 | 0.53 |
| GLC-26 | GK | 57.00 | 107.00 | 12.40 | 47.70 | 8.07 | 1.38 | 7.68 | 1.42 | 6.72 | 1.50 | 4.38 | 0.64 | 4.29 | 0.62 | 260.80 | 233.55 | 27.25 | 8.57 | 8.95 | 0.97 | 0.54 |
| FZQ-13 | FH | 31.10 | 52.10 | 7.71 | 32.10 | 5.90 | 1.26 | 5.04 | 0.98 | 4.68 | 1.06 | 2.69 | 0.41 | 2.95 | 0.41 | 148.40 | 130.17 | 18.23 | 7.14 | 7.10 | 0.81 | 0.71 |
| FZQ-14 | FH | 32.40 | 56.30 | 7.21 | 26.10 | 4.46 | 1.10 | 4.42 | 0.75 | 3.81 | 0.83 | 2.24 | 0.36 | 2.53 | 0.43 | 142.94 | 127.57 | 15.37 | 8.30 | 8.62 | 0.89 | 0.76 |
| HT-01 | HL | 12.50 | 26.00 | 3.05 | 11.80 | 2.73 | 0.60 | 2.61 | 0.52 | 2.73 | 0.58 | 1.55 | 0.22 | 1.49 | 0.22 | 66.60 | 56.68 | 9.92 | 5.71 | 5.65 | 1.01 | 0.69 |
| LBS-07 | LK | 10.72 | 43.08 | 6.33 | 35.36 | 11.55 | 2.42 | 8.94 | 1.00 | 3.99 | 0.51 | 1.06 | 0.13 | 0.77 | 0.11 | 125.97 | 109.47 | 16.50 | 6.64 | 9.39 | 1.26 | 0.73 |
| LBS-05 | LK | 14.96 | 32.68 | 3.75 | 14.89 | 2.98 | 0.68 | 3.17 | 0.54 | 3.44 | 0.72 | 2.14 | 0.32 | 2.06 | 0.32 | 82.66 | 69.94 | 12.71 | 5.50 | 4.89 | 1.05 | 0.68 |
| LBS-01 | LK | 11.16 | 23.20 | 2.92 | 11.45 | 2.13 | 0.49 | 2.09 | 0.33 | 2.02 | 0.41 | 1.20 | 0.18 | 1.16 | 0.18 | 58.91 | 51.35 | 7.56 | 6.79 | 6.46 | 0.98 | 0.71 |
| UCC | 30.00 | 64.00 | 7.10 | 26.00 | 4.50 | 0.88 | 3.80 | 0.64 | 3.50 | 0.80 | 2.30 | 0.33 | 2.20 | 0.32 | 146.37 | 132.48 | 13.89 | 9.54 | 0.97 | |||
| NASC | 31.10 | 66.70 | / | 27.40 | 5.59 | 1.18 | / | 0.85 | / | / | / | / | 3.06 | 0.46 | 136.34 | 131.97 | 4.37 | 30.23 | 1.26 | |||
| PAAS | 38.20 | 79.60 | 8.83 | 33.90 | 5.55 | 1.08 | 4.66 | 0.77 | 4.68 | 0.99 | 2.85 | 0.41 | 2.82 | 0.43 | 184.77 | 167.16 | 17.61 | 9.49 | 0.81 | |||
| Chondrite | 0.24 | 0.61 | 0.10 | 0.47 | 0.15 | 0.06 | 0.21 | 0.04 | 0.25 | 0.06 | 0.17 | 0.03 | 0.17 | 0.03 | 2.56 | 1.62 | 0.94 | 1.73 |
UCC—upper continental crust values are from [29]. NASC—North American shale composite values are from [28]. PAAS—Post-Archaen average Australian sedimentary rock values are from [33]. Chondrite values are from [34]. L/H = LREE/HREE; (La/Yb)N, subscript N stands for CI-chondrite-normalized value; Ce/Ce * = CeN/(LaN × PrN)0.5; Eu/Eu * = EuN/(SmN × GdN)0.5, subscript N stands for CI-chondrite-normalized value. WW—Wulong, Wuding. XL—Xiaershao, Wu Luquan. GK—Guliancun, Kunming. FH—Fengziqing, Huize. HL—Heite, Luquan. LK—Longbaoshan, Kunming.
5. Discussion
5.1. Sedimentary Facies of Each Facies Association
The correlation and mapping of these facies across the different field sections rely on identifying surfaces marked by variations in lithology, texture, rock color, and strata terminations. Strata are divided by surfaces characterized by changes in structures, lithology, strata architecture, and terminations. In this study, different lithofacies associations represent the distinct sedimentary facies associated with individual sedimentary mechanisms. These lithofacies can be grouped into “sedimentary facies”, characterized by their lithofacies assemblage. Recognizing sedimentary facies enables the interpretation of the local and regional fluvial evolution processes in the basin [24]. The 10 lithofacies identified in the HJS Formation in eastern Yunnan are classified into three sedimentary facies, as follows: channel fill deposits in delta, over-bank deposits, and shallow shelf.
5.1.1. FA 1
FA 1 is mainly fluvial-dominated channel fill deposits; they are mainly composed of sandstone with some reddish-brown muddy gravel and mudstone and are characterized by erosion surfaces and parallel bedding. Lithofacies developed in this facies include Gm, St, Sh, Sr, Se, and Sm.
Lithofacies Gm is characterized by clasts of reddish-brown mudstone within coarse sandstones (Figure 3A,B). The lithofacies Gm type is formed by hyper-concentrated stream flows, followed by rapid sediment deposition, suggesting that these deposits represent channel lag deposits [6,35]. Lithofacies St represents bedform “lag” deposits, indicating that the structure was not in equilibrium with flow conditions during its formation [36]. Low-angle cross-beds may have been deposited under high-energy conditions, particularly at the base of channel intersections [6,37]. Lithofacies Sh is often interbedded with planar cross-bedded sandstones (Figure 3D), representing channel fill or channel bar deposits. Their structure suggests a strong hydrodynamic condition of the upper plane bed, likely transitioning from a subcritical to a supercritical flow [38]. Lithofacies Sp often exhibit sharp contacts with the overlying sandstone (Figure 3D). These sandstone bodies were deposited during the initial stage of channel development, characterized by high water levels and sediment loads [6]. The thin sheet-like geometry and relatively fine-grained lithology suggest deposition as bar-top sandstone or as in-channel deposits during stages of seasonal flood events [37]. Lithofacies Se are commonly interbedded with lithofacies Gm and are characterized by scour and erosion surfaces (Figure 3E). They are representative channel fill deposits. The structure’s form indicates a strong hydrodynamic condition of the upper plane bed, likely occurring during the transition from a subcritical to a supercritical flow [38]. Lithofacies Sm primarily comprises durable light grey to reddish-brown coarse-grained sandstone in sheet-like beds. The beds exhibit an erosional relationship with the underlying fine-grained stratification (Figure 3F). The formation of lithofacies Sm appears to result from rapid sediment deposition, indicating they are channel lag deposits [6,35].
5.1.2. FA 2
FA 2 is mainly tide-influenced shallow shelf deposits, which are mainly composed of sandstone and mudstone. FA 2 are characterized by lenticular bedding and flaser bedding. Lithofacies developed in FA 2 include Sr, Fm, Sm, Fsc, and Fl.
These ripple structures in lithofacies Sr indicate relatively strong flow conditions [6]. Lithofacies Fl is characterized by tidal bedding (mainly flaser and wavy bedding). Thin layers of grey mudstone are usually distributed in a banded or lenticular manner within light grey sandstone sequences (Figure 4G). These structures are commonly associated with environments influenced by tides [39]. The formation of tidal bedding is attributed to the interplay between currents or wave action and periods of slack water [40,41]. Currents or wave action create sand formations like current or oscillation ripples, while mud is deposited during periods of slack water. Reineck and Wunderlich (1968) proposed that tidal bedding originates from the tidal rhythm, specifically tidal currents and slack water periods [40]. Lithofacies Fsc is also characterized by lenticular bedding. Lenticular bedding is characterized by isolated lenses and ripples of sandstone embedded within a mud matrix (Figure 4E,F). These structures are typically associated with environments influenced by tides [39].
5.1.3. FA 3
FA 3 is mainly floodplain deposits and consists of of reddish-brown mudstone with thin-bedded sandstone. Lithofacies associated with this environment include Fm and St. Sediment bodies in the floodplain typically exhibit a sheet-like geometry, but vary considerably in thickness. The lower boundaries of these facies suites display sharp or gradational transitions with channel fill facies (Figure 4H). Lenticular sandstone, approximately 0.2 m thick, appearing within grey and reddish-brown mudstone, likely represents minor over-bank flood channel deposits (Figure 4I). The close association between reddish-brown to grey mudstones and sheet sandstone bodies suggests a floodplain environment.
5.2. Provenance
Previous research has established that the chemical composition of siliciclastic sedimentary rocks reflects their source regions and can help to characterize the rocks from which the sediments originated (e.g., [22]). Discriminant function analysis of major elements suggests that the sediments are predominantly quartzose and originate from a mature continental provenance (Figure 9A). There is no significant difference observed in the provenance between the sedimentary units of the HJS Formation, indicating a consistent detrital input of siliciclastic material during the Cambrian Stage 3 period and no significant changes in the source area(s).
Trace elements such as La, Sc, Cr, V, Co, Ni, Nb, Hf, Y, Th, Zr, and REEs play a crucial role in interpreting provenance and source area composition, due to their low mobility during post-depositional processes [12,42]. Bivariate plot diagrams of Cr/V vs. Y/Ni [43], La/Yb vs. ∑REEs [21], and La/Th vs. Hf [22] indicate a felsic source rock for the studied sandstones [43] (Figure 9). The distribution pattern of rare earth elements and the presence of Eu anomalies in sediments provides further insights into the characteristics of the source area [15]. Felsic source rocks exhibit higher LREE/HREE ratios and negative Eu anomalies, whereas mafic source rocks typically have lower LREE/HREE ratios and lack Eu anomalies [15,44].
Figure 9.
Source rock discrimination diagram for the HJS sandstones. (A) Provenance discriminant function diagram using major elements (after [23]), F1 = (−1.773 × TiO2) + (0.607 × Al2O3) + (0.760 × TFe2O3) + (−1.500 × MgO) + (0.616 × CaO) + (0.509 × Na2O) + (−1.224 × K2O) − 9.090; F2 = (0.445 × TiO2) + (0.070 × Al2O3) + (−0.250 × TFe2O3) + (−1.142 × MgO) + (0.438 × CaO) + (1.475 × Na2O) + (1.426 × K2O) − 6.861. (B) Cr/V versus Y/Ni bivariate diagram (after [43]). (C) La/Yb versus ΣREEs bivariate diagram (after [45,46]). (D) La/Th versus Hf (after [22]). Average compositions of basalt, andesite, dacite, rhyodacite, rhyolite, and granite, respectively, from [47].


5.3. Source Area Paleoweathering and Paleoclimate
Chemical weathering is predominant in humid climates and significantly influences the major element geochemistry and mineralogy of siliciclastic sediments (e.g., references [15,49]). Quantitative indices, such as the chemical index of alteration (CIA [1]), Plagioclase Index of Alteration (PIA [49]), and Chemical Index of Weathering (CIW [50]), are, hence, valuable tools for assessing the degree of chemical weathering. The CIA of sandstones is commonly used to assess the degree of weathering in rocks, where higher values indicate stronger weathering. While the CIA can provide information about the degree of weathering, relying solely on the CIA for paleoweathering reconstruction may have some limitations. This is because the CIA is influenced by various factors, including rock composition, climatic conditions, sedimentary environment, etc., and, therefore, it may not provide detailed information about paleoweathering processes. The samples studied in this research are mainly sandstones with similar rock mineral compositions. The HJS Formation is primarily deposited in a deltaic environment, with sediment derived mainly from felsic source rocks. Therefore, the Chemical Index of Alteration (CIA) can be used to reconstruct paleoweathering processes.
Fedo et al. (1995) proposed a systematic progression in alteration minerals, indicating incipient (CIA = 50–60), intermediate (CIA = 60–80), and extreme (CIA > 80) stages of chemical weathering. A high degree of chemical weathering (CIA > 80) reflects the removal of labile cations (e.g., Ca2+, Na+, and K+) relative to stable residual constituents (Al3+ and Ti4+) during weathering [1] and is suggestive of weathering in humid, possibly tropical, conditions [15,49]. A moderate degree of chemical weathering (CIA = 60–80) indicates a semi-humid climate [15].
A low degree of chemical weathering (CIA = 50–60) suggests minimal chemical alteration, possibly indicating cool and/or arid conditions, such as in a glacial environment [49]. Similarly, PIA values near 50 for fresh rocks and close to 100 for clay minerals, like kaolinite, illite, and gibbsite, align with values derived from the CIA equation. Low PIA values also imply minimal chemical alteration, suggesting cool and/or arid conditions [49]. The equations for the indices mentioned above are as follows:
In the above equations, CaO* represents the content of CaO incorporated in the silicate fraction, and all major oxides are expressed in molar proportions.
There is no direct method available to distinguish and quantify the contents of CaO belonging to the silicate fraction from those in the non-silicate fraction (carbonates and apatite) [51]. An indirect method was proposed to quantify the CaO content of the silicate fraction, by assuming reasonable values for the Ca/Na ratios of silicate materials [43]. The procedure involves subtracting the molar proportion of P2O5 from the molar proportion of the total amount of CaO. If the resulting “remaining number of moles” is less than the molar proportion of Na2O, then this value is considered as the molar proportion of CaO in the silicate fraction. However, if the “remaining number of moles” is greater than the molar proportion of Na2O, then the molar proportion of Na2O is taken as the molar proportion of CaO in the silicate fraction. Since Ca is typically lost more rapidly than Na during weathering, this calculation method for CIA values is likely to yield minimum CIA values, possibly underestimating them by up to about 3 units [52].
Following the procedure of [43], the CIA, PIA, and CIW values were calculated; the results are presented in Table 3. The CIA values range from 57.35 to 88.33 (average = 71.14), indicating variability in the degree of source weathering. The PIA values indicate that the intensity of the alteration of source material varies from 61.32 to 98.09 (average = 91.12). The CIW values suggest a range in the degree of source weathering from 69.53 to 98.46 (average = 93.72). The average PIA and CIW values (91.12 and 93.72, respectively) indicate a higher degree of weathering than the degree of weathering inferred from CIA values (71.14). Based on the CIA, PIA, and CIW values, which range from 71.29 to 93.72, it can be argued that the litho-components of the HJS sandstones underwent intermediate-to-intense chemical weathering.
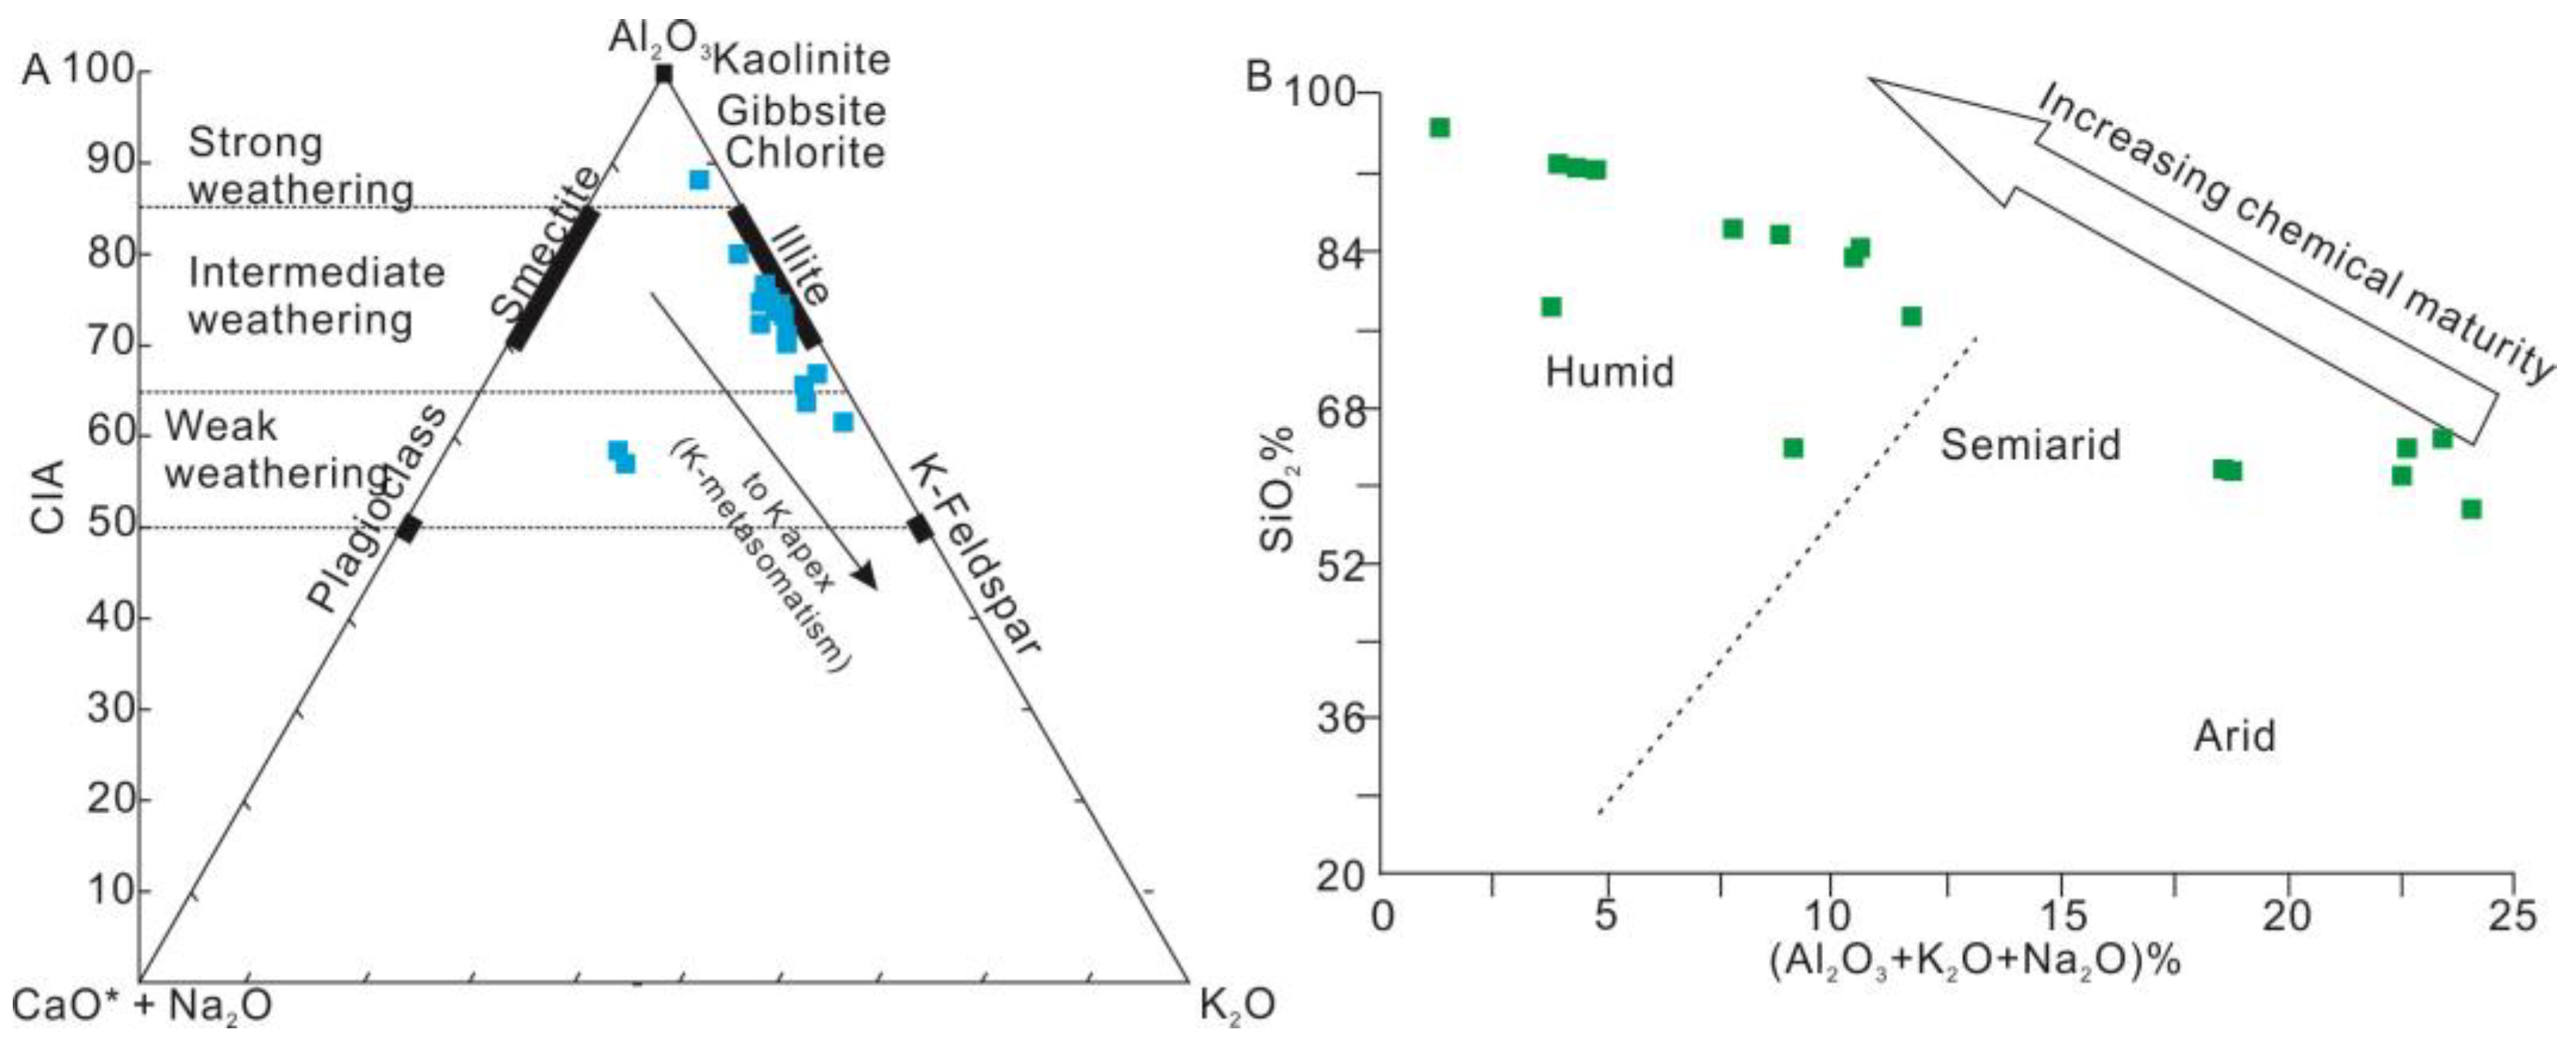
The A-CN-K ternary diagram, which plots the molar proportions of Al2O3, Na2O, and CaO* (CaO in silicate fraction), allows for the evaluation of element mobility during the chemical weathering of source material and post-depositional modifications of the sandstones [49,53]. In the A-CN-K diagram (A = Al2O3; CN = CaO* + Na2O; K = K2O, molar proportions), the HJS sandstones primarily define a narrow linear trend, with the trend line running slightly angled to A-K, trending towards the K apex (Figure 11A), and exhibit an inclination towards the K apex, indicating that the sandstones were probably subjected to potash metasomatism during diagenesis. The K metasomatism of sandstones can take two different paths, representing (1) conversion of aluminous clay minerals (e.g., kaolinite as matrix) to illite, and/or (2) conversion of plagioclase to K-feldspar [49]. Both of these processes result in the sample being enriched in K2O. The conversion of secondary aluminous clay minerals, such as kaolinite to illite, via K addition results in a CIA value lower than the premetasomatized one, while in the conversion of plagioclase to K-feldspar, the CIA value does not change, because the process involves the mole-for-mole substitution of K2 for Ca or Na [49]. The straight-line pattern of weathering indicates a state of equilibrium where the removal of material balances with the production of weathered material [54].
The weathering indices of sedimentary rocks offer valuable insights into the climatic conditions prevailing in the source area [51]. An increase in the degree of chemical weathering may signify a decrease in tectonic activity and/or a change in climate towards warm and humid conditions (e.g., [51,55]). A binary SiO2 wt.% versus (Al2O3 + K2O + Na2O) wt.% diagram was proposed to constrain the climatic condition during the sedimentation of siliciclastic rocks [56]. In this diagram, the HJS sandstones are situated within the semiarid to humid climate zone (Figure 11B), suggesting that the sandstones studied here were deposited under conditions ranging from semiarid to humid.
Figure 11.
Diagrams illustrating the impact of weathering and climatic conditions on the HJS sandstones. (A) Al2O3–(CaO* + Na2O)–K2O ternary diagram (after [53]). The black arrow indicates a diagenetic K-metasomatism trend [49]. (B) Al2O3 + K2O + Na2O% versus SiO2% bivariate diagram, for distinguishing the climatic conditions of the HJS sandstones (after [56]).

6. Conclusions
The lithofacies identified in the Hongjingshao Formation include massive and crudely bedded gravel, supported by coarse sandstone (Gm), trough cross-bedded sandstone (St), planar cross-bedded sandstone (Sp), ripple cross-laminated sandstone (Sr), horizontal bedded sandstone (Sh), scour-fill sandstone (Se), massive sandstone (Sm), fine-to-medium sandstone with thin bed muddy siltstone (Fl), muddy siltstone (Fsc), and mudstone (Fm). These lithofacies suggest the deposition of channel fill and over-bank deposits in a deltaic and shallow shelf depositional environment for the Hongjingshao Formation.
Provenance analysis based on major elements discriminant function diagram, Cr/V versus Y/Ni bivariate diagram, La/Yb versus ΣREEs bivariate diagram, and La/Th versus Hf indicates that the sandstones in the study area originate from felsic rocks. Additionally, the ternary diagram of the Q-F-L and Qm-F-Lt plots suggests a provenance characterized by recycled orogen and continental block sources.
The CIA, PIA, and CIW values, ranging from 71.29 to 93.72, suggest intermediate-to-intense chemical weathering of the litho-components of the sandstones during source weathering, fluvial transport, sedimentation, and diagenesis. The SiO2 wt.% versus (Al2O3 + K2O + Na2O) wt.% binary diagram indicates semiarid to humid climate conditions, consistent with the observed intermediate-to-intense chemical weathering.
Author Contributions
Conceptualization, X.P.; methodology, X.P. and Z.F.; software, X.P. and Z.F.; validation, X.P. and X.C.; resources, X.P.; writing—original draft preparation, X.P.; writing—review and editing, X.C. and L.G.; visualization, X.P.; supervision, X.C., J.L., and L.G.; funding acquisition, L.G. and J.L. All authors have read and agreed to the published version of the manuscript.
Funding
The author(s) note receipt of the following financial support for the research, authorship, and publication of this article: this research was supported by the NSFC (Nos. 42130206, 41302076) and MOST Special Fund, awarded by the State Key Laboratory of Continental Dynamics, Northwest University (201210128).
Data Availability Statement
The authors declare that all analytical data supporting the findings of this study are available within the paper or cited in peer-review references.
Acknowledgments
We are deeply grateful to the Editor-in-chief and anonymous reviewers for their very constructive comments, which improved the manuscript considerably.
Conflicts of Interest
The authors declare no conflicts of interest.
References
- Nesbitt, H.W.; Young, G.M. Early Proterozoic Climates and Plate Motions Inferred from Major Element Chemistry of Lutites. Nature 1982, 299, 715–717. [Google Scholar] [CrossRef]
- Dickinson, W.R.; Beard, L.S.; Brakenridge, G.R.; Erjavec, J.L.; Ferguson, R.C.; Inman, K.F.; Knepp, R.A.; Lindberg, F.A.; Ryberg, P.T. Provenance of North American Phanerozoic Sandstones in Relation to Tectonic Setting. Geol. Soc. Am. Bull. 1983, 94, 222–235. [Google Scholar] [CrossRef]
- Tabor, N.J.; MontaEz, I.P.; Zierenberg, R.; Currie, B.S. Mineralogical and Geochemical Evolution of a Basalt-Hosted Fossil Soil (Late Triassic, Ischigualasto Formation, Northwest Argentina): Potential for Paleoenvironmental Reconstruction. Geol. Soc. Am. Bull. 2004, 116, 1280. [Google Scholar] [CrossRef]
- Guo, L.; Jia, C.-C.; Du, W. Geochemistry of Lower Silurian Shale of Longmaxi Formation, Southeastern Sichuan Basin, China: Implications for Provenance and Source Weathering. J. Cent. South Univ. 2016, 23, 669–676. [Google Scholar] [CrossRef]
- Peng, X.-X.; Feng, C.-C.; Guo, L. Sedimentary Geochemistry of the Weihe River Sediments, Central China: Implications for Provenance and Weathering. Arab. J. Geosci. 2021, 14, 604. [Google Scholar] [CrossRef]
- Guo, L.; Zhang, H.-M.; Peng, X.-X. Geochemistry and Sedimentology of Sediments in a Short Fluvial System, NW China: Implications to the Provenance and Tectonic Setting. J. Oceanol. Limnol. 2023, 41, 1706–1728. [Google Scholar] [CrossRef]
- Qu, X.-J.; Wang, Q.; Wang, D.-F.; Lei, T.; Chen, H.; Wang, J.; Jiang, W.; Zhang, W.; Luo, L.; Liu, J.-P.; et al. Provenance of Volcanogenic Deposits from the Shanxi Formation of the Daniudi Gas Field, Ordos Basin, and Its Tectonic Implications. Minerals 2023, 13, 1546. [Google Scholar] [CrossRef]
- Jamil, M.; Siddiqui, N.; Usman, M.; Wahid, A.; Umar, M.; Ahmed, N.; Haq, I.; Ei-Ghali, M.; Imra, Q.; Rahaman, A.; et al. Facies analysis and distribution of Late Palaeogene deep-water massive sandstone in submarine-fan lobes, NW Borneo. Geol. J. 2022, 57, 4489–4507. [Google Scholar] [CrossRef]
- Zhang, T.; Chen, R.; Wang, F.; Hu, J.-L.; Zhang, M.; Li, Q.; Wu, J.-Y.; Liu, L. Provenance of the Upper Carboniferous Yanghugou Formation in the Western Margin of the Ordos Basin, China: Constraints on Paleogeography and Basin Development. Minerals 2024, 14, 78. [Google Scholar] [CrossRef]
- Nesbitt, H.W.; Young, G.M.; Mclennan, S.M.; Keays, R.R. Effects of Chemical Weathering and Sorting on the Petrogenesis of Siliciclastic Sediments, with Implications for Provenance Studies. J. Geol. 1996, 104, 525–542. [Google Scholar] [CrossRef]
- Ohta, T. Measuring and Adjusting the Weathering and Hydraulic Sorting Effects for Rigorous Provenance Analysis of Sedimentary Rocks: A Case Study from the Jurassic Ashikita Group, South-West Japan. Sedimentology 2008, 55, 1687–1701. [Google Scholar] [CrossRef]
- Roser, B.P.; Korsch, R.J. Determination of Tectonic Setting of Sandstone-Mudstone Suites Using SiO2 Content and K2O/Na2O Ratio. J. Geol. 1986, 94, 635–650. [Google Scholar] [CrossRef]
- Guo, L.; Jiang, Z.-X.; Zhang, J.-C.; Li, Y.-X. Paleoenvironment of Lower Silurian Black Shale and Its Significance to the Potential of Shale Gas, Southeast of Chongqing, China. Energy Explor. Exploit. 2011, 29, 597–616. [Google Scholar] [CrossRef]
- Xie, G.-L.; Shen, Y.-L.; Liu, S.-G.; Hao, W.-D. Trace and Rare Earth Element (REE) Characteristics of Mudstones from Eocene Pinghu Formation and Oligocene Huagang Formation in Xihu Sag, East China Sea Basin: Implications for Provenance, Depositional Conditions and Paleoclimate. Mar. Pet. Geol. 2018, 92, 20–36. [Google Scholar] [CrossRef]
- Wanas, H.A.; Assal, E.M. Provenance, Tectonic Setting and Source Area-Paleoweathering of Sandstones of the Bahariya Formation in the Bahariya Oasis, Egypt: An Implication to Paleoclimate and Paleogeography of the Southern Neo-Tethys Region during Early Cenomanian. Sediment. Geol. 2021, 413, 105822. [Google Scholar] [CrossRef]
- Ding, Y.; Liu, J.-N.; Liu, Y.; Chen, F.-F. Trace Fossils from Lower Cambrian Hongjingshao Formation, Yunnan, China: Taxonomy, Palaeoecology, Palaeoenvironment. Palaeoworld 2020, 29, 649–661. [Google Scholar] [CrossRef]
- Zhang, M.-D.; Cheng, X.; Wei, B.-T.; Xin, L.-Y.; Liu, F.-F.; Peng, X.-X.; Deng, X.-H.; Bian, Z.-W.; Li, T.; Lan, S.-Q.; et al. Magnetic fabric study of the Cambrian Stage 3 sedimentary rock in Eastern Yunnan and its implications for paleocurrent direction. J. Northwest Univ. 2023, 53, 655–670. [Google Scholar]
- Wang, D.-Z.; Zhao, F.-C.; Zeng, H.; Li, G.-X.; Zhu, M.-Y. A New Rhynchonelliform Brachiopod Longtancunella with Soft-Part Preservation from the Hongjingshao Formation (Cambrian Stage 3) in Yunnan, South China. Palaeoworld 2022, 31, 570–581. [Google Scholar] [CrossRef]
- Peng, X.-X. Sedimentary Geochemistry and Paleoenvironment Reconstruction of Cambrian Canglangpu Formation in Southwest Margin of Upper Yangtze Area. Master’s Thesis, Northwest University, Xi’an, China, 2022. [Google Scholar]
- Zhang, T.; Li, Y.-F.; Fan, T.-L.; Da Silva, A.-C.; Shi, J.-Y.; Gao, Q.; Kuang, M.-Z.; Liu, W.-W.; Gao, Z.-Q.; Li, M.-S. Orbitally-Paced Climate Change in the Early Cambrian and Its Implications for the History of the Solar System. Earth Planet. Sci. Lett. 2022, 583, 117420. [Google Scholar] [CrossRef]
- Allègre, C.J.; Minster, J.F. Quantitative Models of Trace Element Behavior in Magmatic Processes. Earth Planet. Sci. Lett. 1978, 38, 1–25. [Google Scholar] [CrossRef]
- Floyd, P.A.; Leveridge, B.E. Tectonic Environment of the Devonian Gramscatho Basin, South Cornwall: Framework Mode and Geochemical Evidence from Turbiditic Sandstones. J. Geol. Soc. Lond. 1987, 144, 531–542. [Google Scholar] [CrossRef]
- Roser, B.P.; Korsch, R.J. Provenance Signatures of Sandstone-Mudstone Suites Determined Using Discriminant Function Analysis of Major-Element Data. Chem. Geol. 1988, 67, 119–139. [Google Scholar] [CrossRef]
- Miall, A.D. Architectural-Element Analysis: A New Method of Facies Analysis Applied to Fluvial Deposits. Earth Sci. Rev. 1985, 22, 261–308. [Google Scholar] [CrossRef]
- Taylor, S.R.; Mclennan, S.M. The Continental Crust: Its Composition and Evolution. J. Geol. 1985, 94, 57–72. [Google Scholar]
- Rahman, M.; Suzuki, S. Geochemistry of Sandstone from the Miocene Surma Group, Bengal Basin, Bangladesh: Implications for Provenance, Tectonic Setting and Weathering. Geochem. J. 2007, 41, 415–428. [Google Scholar] [CrossRef]
- Algeo, T.J.; Tribovillard, N. Environmental Analysis of Paleoceanographic Systems Based on Molybdenum–Uranium Covariation. Chem. Geol. 2009, 268, 211–225. [Google Scholar] [CrossRef]
- Gromet, L.P.; Haskin, L.A.; Korotev, R.L.; Dymek, R.F. The “North American Shale Composite”: Its Compilation, Major and Trace Element Characteristics. Geochim. Cosmochim. Acta 1984, 48, 2469–2482. [Google Scholar] [CrossRef]
- Taylor, S.R.; Mclennan, S.M. The Geochemical Evolution of the Continental Crust. Rev. Geophys. 1995, 33, 241–265. [Google Scholar] [CrossRef]
- Eker, Ç.; Korkmaz, S. Mineralogy and Whole Rock Geochemistry of Late Cretaceous Sandstones from the Eastern Pontides (NE Turkey). Neues Jahrb. Für Mineral. Abh. 2011, 188, 235–256. [Google Scholar] [CrossRef]
- Condie, K.C. Another Look at Rare Earth Elements in Shales. Geochim. Cosmochim. Acta 1991, 55, 2527–2531. [Google Scholar] [CrossRef]
- Eskenazy, G.M. Rare Earth Elements in a Sampled Coal from the Pirin Deposit, Bulgaria. Int. J. Coal Geol. 1987, 7, 301–314. [Google Scholar] [CrossRef]
- Mclennan, S.M.; Taylor, S.R. Geology, Geochemistry and Natural Abundances of the Rare Earth Elements. In Encyclopedia of Inorganic and Bioinorganic Chemistry; John Wiley & Sons. Ltd.: Hoboken, NJ, USA, 2012. [Google Scholar]
- Sun, S.-S.; McDonough, W.F. Chemical and Isotopic Systematics of Oceanic Basalts: Implications for Mantle Composition and Processes. Geol. Soc. Lond. Spec. Publ. 1989, 42, 313–345. [Google Scholar] [CrossRef]
- Galloway, S.M.; Hobday, D.K. Terrigenous Clastic Depositional Systems: Applications to Petroleum, Coal, and Uranium Exploration; Springer Science & Business Media: Berlin/Heidelberg, Germany, 2012. [Google Scholar]
- Allen, J.R.L. Sedimentary Structures: Their Character and Physical Basis; Elsevier: Amsterdam, The Netherlands, 1984. [Google Scholar]
- Khalifa, M.A.; Catuneanu, O. Sedimentology of the Fluvial and Fluvio-Marine Facies of the Bahariya Formation (Early Cenomanian), Bahariya Oasis, Western Desert, Egypt. J. Afr. Earth Sci. 2008, 51, 89–103. [Google Scholar] [CrossRef]
- Ashley, S.C.G.M. Classification of Large-Scale Subaqueous Bedforms: A New Look at an Old Problem-SEPM Bedforms and Bedding Structures. J. Sediment. Res. 1990, 60, 160–172. [Google Scholar]
- Martin, A.J. Flaser and Wavy Bedding in Ephemeral Streams: A Modern and an Ancient Example. Sediment. Geol. 2000, 136, 1–5. [Google Scholar] [CrossRef]
- Reineck, H.-E.; Wunderlich, F. Classification and Origin of Flaser and Lenticular Bedding. Sedimentology 1968, 11, 99–104. [Google Scholar] [CrossRef]
- Fan, D.-D.; Wang, Y.; Liu, M. Classifications, Sedimentary Features and Facies Associations of Tidal Flats. J. Palaeogeogr. 2013, 2, 66–80. [Google Scholar]
- Shi, Z. Tidal Bedding and Tidal Cyclicities within the Intertidal Sediments of a Microtidal Estuary, Dyfi River Estuary, West Wales, U.K. Sediment. Geol. 1991, 73, 43–58. [Google Scholar] [CrossRef]
- Mclennan, S.M.; Hemming, S.R.; Mcdaniel, D.K.; Hanson, G.N. Geochemical Approaches to Sedimentation, Provenance, and Tectonics. In Processes Controlling the Composition of Clastic Sediments; Geological Society of America: Boulder, CO, USA, 1993. [Google Scholar]
- Cullers, R.L. The Controls on the major and trace element variation of shales, siltstones, and sandstones of Pennsylvanian-Permian Age from Uplifted Continental Blocks in Colorado to Platform sediment in Kansas, USA. Geochim. Cosmochim. Acta 1994, 58, 4955–4972. [Google Scholar] [CrossRef]
- Allegre, C.J.; Michard, G. Introduction to Geochemistry; D. Reidel Publishing Company: Dordrecht, The Netherlands, 1979. [Google Scholar]
- Liu, J.; Yao, Y.-B.; Elsworth, D.; Pan, Z.-J.; Sun, X.-X.; Ao, W.-H. Sedimentary Characteristics of the Lower Cambrian Niutitang Shale in the Southeast Margin of Sichuan Basin, China. J. Nat. Gas Sci. Eng. 2016, 36, 1140–1150. [Google Scholar] [CrossRef]
- Maitre, L. The Chemical Variability of Some Common Igneous Rocks. J. Petrol. 1976, 17, 589–598. [Google Scholar] [CrossRef]
- Dickinson, W.R.; Suczek, C.A. Plate Tectonics and Sandstone Composition. AAPG Bull. 1979, 63, 2164–2182. [Google Scholar]
- Fedo, C.M.; Nesbitt, W.H. Unraveling the Effects of Potassium Metasomatism in Sedimentary Rocks and Paleosols, with Implications for Paleoweathering Conditions and Provenance. Geology 1995, 23, 921–924. [Google Scholar] [CrossRef]
- Harnois, L. The CIW Index: A New Chemical Index of Weathering. Sediment. Geol. 1988, 55, 319–322. [Google Scholar] [CrossRef]
- Moosavirad, S.M.; Janardhana, M.R.; Sethumadhav, M.S.; Moghadam, M.R.; Shankara, M. Geochemistry of Lower Jurassic Shales of the Shemshak Formation, Kerman Province, Central Iran: Provenance, Source Weathering and Tectonic Setting. Geochemistry 2011, 71, 279–288. [Google Scholar] [CrossRef]
- McLennan, S.M. Weathering and Global Denudation. J. Geol. 1993, 101, 295–303. [Google Scholar] [CrossRef]
- Nesbitt, H.W.; Young, G.M. Prediction of Some Weathering Trends of Plutonic and Volcanic Rocks Based on Thermodynamic and Kinetic Considerations. Geochim. Cosmochim. Acta 1984, 48, 1523–1534. [Google Scholar] [CrossRef]
- Nesbitt, W.H.; Fedo, C.M. Quartz and Feldspar Stability, Steady and Non-Steady-State Weathering, and Petrogenesis. J. Geol. 1997, 105, 173. [Google Scholar] [CrossRef]
- Jacobson, A.D.; Blum, J.D.; Chamberlain, C.P.; Craw, D.; Koons, P.O. Climatic and Tectonic Controls on Chemical Weathering in the New Zealand Southern Alps. Geochim. Cosmochim. Acta 2003, 67, 29–46. [Google Scholar] [CrossRef]
- Suttner, L.J.; Dutta, P.K. Alluvial Sandstone Composition and Paleoclimate; I, Framework Mineralogy. J. Sediment. Res. 1986, 56, 329–345. [Google Scholar]
Figure 1.
Geological map of eastern Yunnan (A), stratigraphic column of Eastern Yunnan (B), modified from [16,19,20], and location of study area (C). YF—Yuanshan Formation.

Figure 2.
Outcrops of Hongjingshao Formation in eastern Yunnan, showing lithology and sedimentary characteristics. Sample positions were marked in the outcrop sections. (A) Thick layer of medium-to-coarse, light brown to light grey sandstone (WLC-40) located near the boundary between the Lower Cambrian Yuanshan Formation and Hongjingshao Formaiton. Wulongcun, Wuding County. (B) Thick layer of medium-to-coarse, light grey sandstone (WLC-42). Parallel bedding and cross bedding. Wulongcun, Wuding County. (C) Light gray, medium-thin-bedded coarse sandstone (XES-33) located near the boundary between the Lower Cambrian Hongjingshao Formation and Wulongqing Formation. Xiershao, Luquan County. (D) Greyish-green sandy mudstone (GLC-01) located near the boundary between the Lower Cambrian Yuanshan Formation and Hongjingshao Formation. Guliancun, Kunming. (E) Light brown siltstone and sandstone interbedded with grey silty mudstone (GLC-03). Brownish-red muddy siltstone (GLC-05) interbedded with light grey to brownish fine sandstone. Guliancun, Kunming. (F) Brownish-red siltstone and fine sandstone (GLC-12). Guliancun, Kunming. (G) Brownish-red muddy siltstone (GLC-14). Guliancun, Kunming. (H) Brownish-red muddy siltstone (GLC-20). Guliancun, Kunming. (I) Brownish-red to light grey siltstone, fine sandstone (GLC-22). Light grey mudstone and silty mudstone (GLC-26). Guliancun, Kunming. (J) Grey muddy sandstone, siltstone (FZQ-13 and FZQ-14). Fengziqing, Huize County. (K) Medium-coarse sandstone with muddy gravel (HT-01). Heite, Luquan County. (L) Outcrop of the Hongjingshao Formation composed of medium-bedded coarse sandstone (LBS-1 and LBS-07) and a thin layer of sandy mudstone (LBS-05).

Figure 3.
Overview and examples of key features for FA 1. (A) Lithofacies Gm, massive and crudely bedded gravel, supported by coarse sandstone. Wulong village, Wuding; (B) lithofacies St, medium-to-coarse sandstone and the sandstone bodies are lenticularly stacked with each other, showing erosional surface structures. Wulong village, Wuding; (C) under crossed polarized light (XPL). The clastic grains are primarily composed of quartz and feldspar, along with lithic fragments including both quartz and mudstone fragments. Wulong village, Wuding; (D) lithofacies Sp and Sh, medium-to-coarse sandstone with planar cross-bedding and parallel bedding. Wulong village, Wuding; (E) lithofacies Se, sandstone ranging from fine to coarse texture, potentially containing pebbles, along with erosional scours interspersed with muddy gravel. Wulong village, Wuding; (F) lithofacies Sm, fine-to-coarse sandstone with little gravel. Gulian village, Kunming; (G) lithofacies Sh, fine-to-coarse-grained sandstone, occasionally containing fine conglomerate and plant debris. Heite village, Luquan; (H) under XPL from sandstone (Lithofacies Sh). The clastic grains are primarily composed of lithic fragments, quartz, and feldspar. Heite village, Luquan; and (I) lithofacies Sm, fine-to-coarse sandstone, with little muddy gravel. Heite village, Luquan.

Figure 4.
Overview and examples of key features for FA 2 and FA 3. (A) Lithofacies Sr, fine-to-medium sandstone with ripples. Longbaoshan, Kunming; (B) under crossed polarized light (XPL). The clastic grains are primarily composed of quartz, with minor amounts of siliceous matrix. Longbaoshan, Kunming; (C) under plane-polarized light (PPL). The clastic grains are primarily composed of quartz. The sandstone grains are well sorted and are rounded-to-sub-rounded. Guliancun village, Kunming; (D) Thin bed sandstone interbedded with silty mudstone. Longbaoshan, Kunming; (E,F) lithofacies Fsc, muddy siltstone with thin bed fine sandstone, lenticular bedding. Longbaoshan, Kuning; (G) lithofacies Fl, fine-to-medium sandstone with thin bed grey muddy siltstone, flaser bedding, Zhuajiaqing, Huize; and (H,I) lithofacies Fm and St, reddish mudstone with massive bedding, interbedded with a thin layer of sandstone. Shangershao, Luquan.

Figure 5.
Harker variation diagrams illustrate the compositional characteristics of samples from the HJS Formation.
Figure 5.
Harker variation diagrams illustrate the compositional characteristics of samples from the HJS Formation.

Figure 6.
Enrichment factors (EFs) of major elements from the HJS Formation (NASC from reference [28]).
Figure 6.
Enrichment factors (EFs) of major elements from the HJS Formation (NASC from reference [28]).

Figure 7.
The PAAS-normalized and UCC-normalized patterns for the samples from the HJS Formation, eastern Yunnan. (A) The PAAS-normalized pattern (PAAS values are from [29]); (B) UCC-normalized abundances pattern (UCC values are from [29]).

Figure 8.
Distribution patterns of rare earth elements in sandstone samples from eastern Yunnan. (A) Chondrite-normalized REE patterns (Chondrite data from [33]); (B) UCC-normalized REE patterns (UCC data from [29]).

Figure 10.
Source rock discrimination diagram for the HJS sandstones. (A) Triangular Q-F-L plot for provenance discrimination (after [48]). (B) Triangular Qm-F-Lt plot for provenance discrimination (after [48]). Q represents the total of quartzose grains, comprising both monocrystalline Qm and polycrystalline Qp varieties. F denotes the total feldspar grains, all of which are monocrystalline. L stands for the total amount of unstable lithic fragments, all of which are polycrystalline. Qm specifically refers to monocrystalline quartz grains. Lt encompasses the total amount of polycrystalline lithic fragments, incorporating stable quartzose, Qp, as well as unstable L varieties.

Table 1.
Lithology, lithofacies, and locations of HJS samples collected for elemental analysis.
| Sample No. | Location | GPS | Lithology | Lithofacies |
|---|---|---|---|---|
| WLC-40 | Wulongcun, Wuding | 25°34′55″ N 102°22′49″ E | Light brown to light grey medium-to-coarse sandstone | St |
| WLC-42 | Wulongcun, Wuding | 25°34′55″ N 102°22′49″ E | Light grey medium-to-coarse sandstone | St, Sh |
| XES-33 | Xiaershao, Luquan | 25°39′31″ N 102°35′5″ E | Light gray, thin-bedded medium to coarse sandstone | Sm |
| GLC-01 | Guliancun, Kunming | 24°52′51″ N 102°38′58″ E | Greyish-green sandy mudstone | Fm |
| GLC-03 | Guliancun, Kunming | 24°52′51″ N 102°38′58″ E | Light brown thin-bedded siltstone and sandstone | Sm |
| GLC-05 | Guliancun, Kunming | 24°52′51″ N 102°38′58″ E | Brownish-red muddy siltstone | Fsc |
| GLC-12 | Guliancun, Kunming | 24°52′51″ N 102°38′58″ E | Brownish-red siltstone and fine sandstone | Sh |
| GLC-14 | Guliancun, Kunming | 24°52′51″ N 102°38′58″ E | Brownish-red muddy siltstone | Fl |
| GLC-20 | Guliancun, Kunming | 24°52′51″ N 102°38′58″ E | Brownish-red muddy siltstone | Fl |
| GLC-22 | Guliancun, Kunming | 24°52′51″ N 102°38′58″ E | Brownish-red to light grey siltstone, fine sandstone | Fsc |
| GLC-26 | Guliancun, Kunming | 24°52′51″ N 102°38′58″ E | Light grey mudstone and silty mudstone | Fm |
| FZQ-13 | Fengziqing, Huize | 26°30′52″ N 103°16′26″ E | Grey muddy sandstone, siltstone | Fm |
| FZQ-14 | Fengziqing, Huize | 26°30′52″ N 103°16′26″ E | Grey muddy sandstone, siltstone | Fm |
| HT-01 | Heite, Luquan | 25°42′41″ N 102°40′59″ E | Medium-coarse sandstone with muddy gravel | Sp |
| LBS-01 | Longbaoshan, Kunming | 24°57′20″ N 102°48′41″ E | Medium-to-coarse sandstone | Sm |
| LBS-05 | Longbaoshan, Kunming | 24°57′20″ N 102°48′41″ E | Sandy mudstone | Fsc |
| LBS-07 | Longbaoshan, Kunming | 24°57′20″ N 102°48′41″ E | Medium-to-coarse sandstone | St |
Table 2.
Description and interpretation of 10 lithofacies of the HJS Formation in eastern Yunnan. Lithofacies were mainly divided by color, sedimentary structure, and grain size characteristics.
Table 2.
Description and interpretation of 10 lithofacies of the HJS Formation in eastern Yunnan. Lithofacies were mainly divided by color, sedimentary structure, and grain size characteristics.
| Facies Code * | Lithology | Facies Association | Descriptions | Interpretation |
|---|---|---|---|---|
| Gm | Bedded gravel | FA1 | Massive bedding. Poorly stratified conglomerate with sub-rounded-to-rounded clasts | Longitudinal bars Lag deposits |
| St | Medium-to-coarse sandstone, maybe pebbly | FA1 | Trough cross-beds. Medium-to-coarse grain size, occasionally pebbly. Beds average 30 to 50 cm thick | 3D dune migration, lower flow regime, scour fills |
| Sp | Sandstone, medium-to-coarse, maybe pebbly | FA1 | Solitary or grouped planar cross-beds. Fine-to-coarse grain size, occasionally pebbly. Commonly overlap mud/mudstone | Scour fills or lateral accretion of bars |
| Sr | Sandstone, current ripple sandstone | FA1 | Ripple marks. Fine-to-medium grain size. Ripple height and length are 2 cm and 6 cm, respectively | Ripples (lower flow regime) |
| Sh | Sandstone, fine-to-coarse | FA1 | Horizontal lamination. Fine-to-coarse-grained, occasionally containing pebbles. Beds typically range from 5 to 20 cm in thickness. | Planar bed flow |
| Se | Erosional scours with intraclasts | FA1 | Cross-bedding. Medium-to-coarse-grained sandstone, occasionally with pebbles. Scour surface | Scour fills |
| Sm | Sandstone, maybe pebbly | FA1 | Massive bedding. Sandstone ranges in grain size from fine to coarse, with a pebbly texture and poor to moderate sorting, lacking distinct structures. | Rapid deposition of debris flow. |
| Fl | Sand, silt, mud | FA2 | Fine lamination with very small ripples. Fine-to-medium sandstone with thin bed grey muddy siltstone, flaser bedding | Waning flood deposits, tidal deposits |
| Fsc | Silt, mud | FA2 | Laminated to massive bedding. Muddy siltstone with thin bed fine sandstone, lenticular bedding | Backswamp deposits, tidal deposits |
| Fm | Mudstone | FA3 | Massive bedding. Mudstone, muddy siltstone, structureless, occasionally with desiccation cracks | Suspension deposits during the standing pool of water, over-bank deposits |
* The uppercase letter in the facies code denotes the predominant grain size (G for gravel, S for sand, and F for fine-grained facies, encompassing very fine sand, silt, and mud). The lowercase letter functions as a mnemonic for the distinctive texture or structure of lithofacies.
Table 4.
Trace element concentrations (in μg/g) of samples from the HJS Formation, eastern Yunnan.
| Sample No. | Location | Li | Be | Sc | V | Cr | Co | Ni | Cu | Zn | Ga | Rb | Sr | Y | Mo | Cd |
|---|---|---|---|---|---|---|---|---|---|---|---|---|---|---|---|---|
| WLC-40 | WW | 27.70 | 0.58 | 2.89 | 21.90 | 10.50 | 94.40 | 7.67 | 2.10 | 12.20 | 3.61 | 25.10 | 15.90 | 18.60 | 0.31 | 0.02 |
| WLC-42 | WW | 22.70 | 0.21 | 1.99 | 21.80 | 10.20 | 65.50 | 7.52 | 2.06 | 10.10 | 3.14 | 24.70 | 23.80 | 17.20 | 0.41 | 0.02 |
| XES-33 | XL | 54.40 | 4.87 | 15.20 | 106.00 | 70.60 | 40.60 | 39.90 | 11.70 | 81.00 | 25.30 | 188.00 | 67.30 | 39.00 | 0.26 | 0.09 |
| GLC-01 | GK | 73.40 | 3.36 | 16.60 | 79.20 | 52.60 | 17.10 | 46.60 | 53.20 | 109.00 | 23.60 | 159.00 | 81.30 | 35.60 | 0.47 | 0.06 |
| GLC-03 | GK | 107.00 | 1.97 | 5.92 | 51.00 | 25.40 | 26.90 | 26.20 | 7.87 | 48.50 | 10.50 | 72.10 | 52.20 | 27.20 | 0.63 | 0.08 |
| GLC-05 | GK | 77.60 | 4.66 | 15.80 | 115.00 | 69.00 | 35.90 | 78.00 | 26.20 | 125.00 | 24.90 | 157.00 | 91.70 | 41.30 | 0.69 | 0.11 |
| GLC-12 | GK | 33.10 | 1.35 | 5.88 | 42.50 | 16.50 | 73.00 | 15.80 | 7.93 | 28.30 | 8.20 | 53.70 | 43.80 | 25.40 | 0.35 | 0.04 |
| GLC-14 | GK | 29.20 | 1.30 | 4.17 | 40.10 | 18.10 | 56.30 | 9.86 | 7.33 | 19.70 | 8.38 | 46.70 | 33.30 | 20.30 | 0.41 | 0.04 |
| GLC-20 | GK | 18.90 | 1.18 | 5.97 | 36.10 | 27.50 | 43.60 | 18.60 | 7.86 | 26.70 | 10.20 | 38.10 | 29.50 | 29.40 | 0.45 | 0.08 |
| GLC-22 | GK | 9.24 | 0.56 | 2.71 | 25.30 | 16.40 | 108.00 | 10.50 | 3.51 | 8.30 | 4.70 | 12.60 | 22.40 | 9.74 | 0.30 | 0.04 |
| GLC-26 | GK | 34.60 | 6.78 | 19.60 | 115.00 | 92.40 | 12.00 | 21.00 | 13.60 | 53.50 | 27.70 | 171.00 | 95.50 | 46.90 | 0.31 | 0.13 |
| FZQ-13 | FH | 37.70 | 2.38 | 12.10 | 66.40 | 70.50 | 23.50 | 35.40 | 47.10 | 73.70 | 16.00 | 91.50 | 90.30 | 32.80 | 0.52 | 0.21 |
| FZQ-14 | FH | 34.20 | 2.66 | 12.40 | 77.20 | 73.70 | 21.30 | 32.00 | 28.10 | 69.30 | 15.20 | 95.30 | 74.20 | 25.90 | 0.39 | 0.23 |
| HT-01 | HL | 58.80 | 0.88 | 3.19 | 33.80 | 17.70 | 23.30 | 15.40 | 3.99 | 23.60 | 6.74 | 50.10 | 44.90 | 16.50 | 0.32 | 0.03 |
| LBS-07 | LK | 19.77 | 0.64 | 1.64 | 14.04 | 5.36 | 103.44 | 11.54 | 16.85 | 10.17 | 1.90 | 7.88 | 48.20 | 10.01 | / | / |
| LBS-05 | LK | 42.87 | 1.38 | 4.56 | 38.34 | 19.47 | 37.91 | 20.43 | 10.86 | 36.78 | 6.95 | 62.04 | 38.10 | 21.62 | / | / |
| LBS-01 | LK | 31.59 | 0.76 | 2.19 | 17.79 | 22.54 | 71.13 | 9.90 | 5.47 | 15.13 | 3.37 | 28.86 | 22.49 | 11.32 | / | / |
| UCC | 20.00 | 3.00 | 11.00 | 60.00 | 35.00 | 10.00 | 20.00 | 25.00 | 71.00 | 17.00 | 112.00 | 350.00 | 22.00 | 1.50 | 98.00 | |
| PAAS | 75.00 | 16.00 | 150.00 | 110.00 | 23.00 | 55.00 | 50.00 | 85.00 | 20.00 | 160.00 | 200.00 | 27.00 | 1.00 | |||
| Sample No. | Location | In | Sb | Cs | Ba | W | Re | Tl | Pb | Bi | Th | U | Nb | Ta | Zr | Hf |
| WLC-40 | WW | 0.02 | 0.30 | 0.60 | 164.00 | 384.00 | 0.00 | 0.12 | 1.54 | 0.35 | 1.92 | 0.50 | 1.22 | 0.23 | 44.20 | 0.97 |
| WLC-42 | WW | 0.03 | 0.33 | 0.63 | 141.00 | 363.00 | <0.002 | 0.10 | 1.58 | 0.33 | 1.97 | 0.45 | 1.11 | 0.11 | 38.50 | 0.82 |
| XES-33 | XL | 0.07 | 0.57 | 8.08 | 461.00 | 89.00 | <0.002 | 0.59 | 5.06 | 0.29 | 14.40 | 2.10 | 18.70 | 1.19 | 190.00 | 4.44 |
| GLC-01 | GK | 0.07 | 0.25 | 9.95 | 488.00 | 5.70 | <0.002 | 0.64 | 3.20 | 0.13 | 12.30 | 3.11 | 15.80 | 1.08 | 175.00 | 4.30 |
| GLC-03 | GK | 0.12 | 0.52 | 3.98 | 584.00 | 139.00 | <0.002 | 0.41 | 4.21 | 0.16 | 4.00 | 1.75 | 6.60 | 0.53 | 85.40 | 2.06 |
| GLC-05 | GK | 0.07 | 0.87 | 7.38 | 654.00 | 20.80 | <0.002 | 0.67 | 5.00 | 0.32 | 13.40 | 3.01 | 17.50 | 1.15 | 177.00 | 4.29 |
| GLC-12 | GK | 0.02 | 0.59 | 1.53 | 334.00 | 325.00 | 0.00 | 0.21 | 5.40 | 1.09 | 3.86 | 0.84 | 2.30 | 0.33 | 84.60 | 1.90 |
| GLC-14 | GK | 0.02 | 0.47 | 1.56 | 235.00 | 325.00 | 0.00 | 0.19 | 4.71 | 1.07 | 4.00 | 0.95 | 2.55 | 0.30 | 70.80 | 1.76 |
| GLC-20 | GK | 0.02 | 0.61 | 0.95 | 252.00 | 309.00 | 0.00 | 0.12 | 8.84 | 1.85 | 7.21 | 1.84 | 10.00 | 0.90 | 262.00 | 5.31 |
| GLC-22 | GK | 0.01 | 0.25 | 0.60 | 36.50 | 645.00 | 0.00 | 0.04 | 2.78 | 0.58 | 3.55 | 0.89 | 2.64 | 0.28 | 123.00 | 2.84 |
| GLC-26 | GK | 0.07 | 0.47 | 11.00 | 358.00 | 51.60 | <0.002 | 0.65 | 7.47 | 0.17 | 16.20 | 3.09 | 21.80 | 1.26 | 201.00 | 5.05 |
| FZQ-13 | FH | 0.06 | 0.41 | 3.82 | 630.00 | 66.20 | <0.002 | 0.52 | 6.66 | 0.16 | 9.06 | 1.94 | 12.10 | 0.78 | 126.00 | 3.27 |
| FZQ-14 | FH | 0.05 | 0.32 | 3.32 | 521.00 | 66.60 | <0.002 | 0.36 | 6.66 | 0.13 | 8.26 | 1.87 | 12.60 | 0.89 | 135.00 | 3.42 |
| HT-01 | HL | 0.03 | 0.33 | 1.80 | 215.00 | 133.00 | 0.00 | 0.21 | 2.95 | 0.70 | 3.67 | 0.92 | 4.45 | 0.45 | 74.80 | 1.80 |
| LBS-07 | LK | / | / | 0.34 | 217.24 | / | / | / | 5.70 | / | 3.98 | 2.51 | 0.96 | 0.27 | 50.87 | 1.34 |
| LBS-05 | LK | / | / | 1.70 | 473.16 | / | / | / | 5.14 | / | 5.87 | 2.30 | 5.66 | 0.54 | 233.68 | 5.97 |
| LBS-01 | LK | / | / | 0.56 | 184.72 | / | / | / | 5.70 | / | 3.43 | 0.95 | 2.92 | 0.37 | 167.04 | 4.25 |
| UCC | 50.00 | 0.20 | 3.70 | 550.00 | 2.00 | 0.40 | 750.00 | 20.00 | 127.00 | 10.70 | 2.80 | 25.00 | 2.20 | 190.00 | 5.80 | |
| PAAS | 15.00 | 650.00 | 2.70 | 2.70 | 20.00 | 20.00 | 14.60 | 3.10 | 19.00 | 210.00 | 5.00 |
Disclaimer/Publisher’s Note: The statements, opinions and data contained in all publications are solely those of the individual author(s) and contributor(s) and not of MDPI and/or the editor(s). MDPI and/or the editor(s) disclaim responsibility for any injury to people or property resulting from any ideas, methods, instructions or products referred to in the content. |
© 2024 by the authors. Licensee MDPI, Basel, Switzerland. This article is an open access article distributed under the terms and conditions of the Creative Commons Attribution (CC BY) license (https://creativecommons.org/licenses/by/4.0/).
Share and Cite
MDPI and ACS Style
Peng, X.; Fang, Z.; Cheng, X.; Guo, L.; Liu, J. Sedimentological and Geochemical Characterization of the Early Cambrian Eastern Yunnan, Southwestern China. Minerals 2024, 14, 445. https://doi.org/10.3390/min14050445
AMA Style
Peng X, Fang Z, Cheng X, Guo L, Liu J. Sedimentological and Geochemical Characterization of the Early Cambrian Eastern Yunnan, Southwestern China. Minerals. 2024; 14(5):445. https://doi.org/10.3390/min14050445
Chicago/Turabian StylePeng, Xiaoxia, Zexin Fang, Xin Cheng, Ling Guo, and Jianni Liu. 2024. "Sedimentological and Geochemical Characterization of the Early Cambrian Eastern Yunnan, Southwestern China" Minerals 14, no. 5: 445. https://doi.org/10.3390/min14050445
Note that from the first issue of 2016, this journal uses article numbers instead of page numbers. See further details here.