
Minerals of the Au-Cu-Ag System in Grains from the Placers of the Olkhovaya-1 River (Eastern Kamchatka, Russia)


1
Sobolev Institute of Geology and Mineralogy, Siberian Branch of Russian Academy of Sciences, Koptyuga Ave., 3, Novosibirsk 630090, Russia
2
Institute of Volcanology and Seismology, Far East Branch of Russian Academy of Sciences, Piipa Blvd., 9, Petropavlovsk-Kamchatsky 683006, Russia
*
Author to whom correspondence should be addressed.
Minerals 2024, 14(5), 448; https://doi.org/10.3390/min14050448
Submission received: 6 March 2024
/
Revised: 17 April 2024
/
Accepted: 22 April 2024
/
Published: 24 April 2024
(This article belongs to the Special Issue Native Gold as a Specific Indicator Mineral for Gold Deposits, 2nd Edition)
Abstract
:Heterogeneous grains in the heavy fractions of the placers of the Olkhovaya-1 river (Kamchatka Cape Peninsula, Eastern Kamchatka, Russia) containing Au-Ag, Au-Cu, and Au-Ag-Cu particles were analyzed using scanning electron microscopy, electron-probe microanalysis, and X-ray powder diffractometry. The analyses showed that auricupride dominates in some grains, whereas in others, the main phases are tetra-auricupride or Ag-rich and (or) Au-rich alloys. It was revealed that in the central parts of some grains of exsolution structures, auricupride Cu3.04–2.74Au0.96–1.26 (Ag < 1 wt.%) occurs in intergrowths with low-fineness Ag0.86–0.67Au0.09–0.33Cu<0.05 solid solutions (160‰–480‰), and tetra-auricupride Cu1.12–0.87Au0.88–1.11Ag<0.02 (Ag < 2 wt.%) occurs with higher-fineness Au0.73–0.62Ag0.2–0.38Cu<0.07 solid solutions (520‰–850‰). We also observed, mainly in the peripheral parts of the grains, insignificant amounts of secondary phases that were compositionally similar to Cu2Au, Cu3Au2, Au3Cu2, Au2Cu, Au3Cu, high-fineness gold with impurities of Cu and occasionally Ag (>850‰), and pure gold. In intergrowths with auricupride and tetra-auricupride, we also observed earlier-formed silicates (garnet, pyroxene, chlorite, epidote, titanite), syngenetic sulfides (pyrrhotite, bornite, galena), and later minerals (chalcocite, covellite, anilite, cuprite, goethite, etc.). The XRD analysis of the peripheral parts of some grains showed the presence of auricupride (Cu3Au), tetra-auricupride CuAu (I) and Cu(Au0.92Ag0.08) (II), and gold. The profiles show the absence of peaks of the Au3Cu phase and other Au-Ag-Cu phases identified by the EMPA, which is likely due to their low concentrations in the samples or their structural similarity to gold. It is assumed that the probable source of Au-Ag-Cu mineralization in the Olkhovaya-1 river placers is located in the upper reaches of watercourses that erode the ultrabasic massif of Mounts Soldatskaya and Golaya (Kamchatka Cape Peninsula).
1. Introduction
Copper ranks second after silver as the most abundantly occurring element among impurities in native gold [1,2]. Cuprian gold, in addition to copper, frequently contains silver. According to the databases (https://www.ima-mineralogy.org/Minlist.htm or https://rruff.info/ima/, accessed on 30 January 2024), the following minerals are known in the Au-Cu-Ag system: native gold (Au); native silver (Ag); native copper (Cu); tetra-auricupride CuAu (Taur); and auricupride Cu3Au (Auc) (abbreviations for minerals here and further are given in accordance with [3]). Studies of natural Au-Cu phases suggest the existence of particles of Au3Cu, Au4Cu, Cu3Au2, etc. [4,5,6,7,8,9,10,11,12]. Pandey et al. (2019) [13] theoretically predicted the stability of Cu3Au, Cu2Au, CuAu, Au3Cu2, Au2Cu, Au3Cu, and other intermetallides.
Detailed analyses of the chemical compositions of minerals of the Ag-Au-Cu system from deposits of different types are reviewed elsewhere [1,2,8,9,10,14,15,16,17,18,19,20]. Table 1 shows data for a few objects with Cu,Ag-bearing gold from deposits of different types. For many epithermal Au-Ag, Au-Cu-porphyry, and Au-Cu-skarn deposits, the Cu content in native gold is no higher than 1–3 wt.%. Native gold with high copper contents occurs in ores associated with basic–ultrabasic rocks or in serpentine, rodingite, and other altered rocks [8,9,19,21,22,23,24,25,26]. Cuprian gold and auricupride were found in magmatic Cu-Ni-PGE ores from the Norilsk, Talnakh, and Oktyabrskoe deposits (Russia) [5,19].
Typically, Au-Ag-Cu alloys occur in the form of monomineral segregations or polymineral intergrowths in association with palladium and platinum minerals and copper–iron sulfides. Accessory Ag-Au-Cu alloys are widespread in basic–ultrabasic complexes [10,30,31,32]. Cuprian gold (up to 10.2 wt.% Cu and up to 24.6 wt.% Ag) was identified in noble-metal mineralization in basic–ultrabasic rocks from the Khurai–Zhalga massif and in carbonatized ultrabasic rocks from the Ospin–Kitoi massif (Eastern Sayany, Russia) [30]. Au5Cu, Au3Cu, and Au2Cu phases, CuAu-Au2Cu solid solutions, and native silver Ag0.78Au0.13Cu0.09 were found in amphibole–pyroxene rocks from the Mokrushin area of the Olginsk region and manganese rocks of the Dalnegorsky district in Sikhote Alin (Russia) [10]. In the hydrothermal Ni-Co-arsenite Bousera massif (Morocco), native gold in chromitites among serpentinized peridotites was found to contain 11 wt.% Cu [31], which corresponds to the Au2.6Cu compound. Au-Cu-Ag microparticles from 500 nm to 3 µm in size and with high copper contents were found at the Beresovoe zeolite occurrence located within the Vanchiskaya depression (Primorsky Krai, Russia) [29] (Table 1).
The objects of this research are grains containing Au-Cu-Ag particles from the Olkhovaya-1 river placers (Kamchatka Cape Peninsula, Eastern Kamchatka, Russia). The aim of this work is to study the specific features of the chemical compositions and relationships of minerals of the Au-Cu-Ag system with each other and with other minerals in intergrowths to understand the paragenesis of the particles and to examine the conditions that might be responsible for the observed compositions and textures. The results obtained in this work can be of interest and used for a more accurate determination of the compositions of Au-Cu-Ag phases formed in endogenous and exogenous processes and the sources of detrital Au,Cu,Ag-bearing particles. The study of placer gold grains is an important part of gold exploration [16,18,33,34].
The first results of studies of the composition of cuprian gold from the Olkhovaya-1 river placers (Kamchatka Cape Peninsula, Eastern Kamchatka) were obtained by Sidorov and coauthors (2013) [35]. They determined that the copper content in gold grains varies from 23.9 to 52.9 wt.%, and its mineral phases are represented by Cu3Au, CuAu, and rarely Au3Cu. According to their data, heavy concentrates consist of 70% (by weight) magnetite, chrome spinellid, and cinnabar. They also contain platinum-group minerals, among which minerals of the Os-Ir-Ru system are predominant [36], with subordinate amounts of olivine, pyroxene, serpentine, garnet, zircon, native copper, and hematite and single grains of pyrite, chalcopyrite, and cassiterite. Sidorov and coauthors [35] suggested that clinopyroxene–garnet rodingites may be the source of cuprian gold.
In this study, we obtained data on the compositions of Au-Cu-Ag particles formed during magmatic–hydrothermal processes and their further hypergenic transformation in the Olkhovaya-1 river placers. The textures of ore minerals commonly reflect the history of ore deposition (types of geological processes—magmatic, metamorphic, hydrothermal, sedimentary, etc.) and subsequent changes (deposition, dissolution, recrystallization, redeposition, replacement, etc.) that may have occurred in response to changing physical and chemical conditions during and after deposition (temperature, pressure, chemical changes in fluid compositions, etc.) [37]. In addition, the mineralogical characteristics of gold grains can be used in conjunction with alloy chemistry to generate a “microchemical signature”, which can indicate the likely type of the source of mineralization [18,38].
2. Geological Background
The gold-bearing placers of the Olkhovaya-1 river, from which heterogeneous grains with Au-Cu-Ag mineralization were the subject of our study, are associated with a large ultrabasic massif in the central part of Kamchatka Cape Peninsula (Eastern Kamchatka, Russia) (Figure 1). Stratified deposits in this territory date to the Cretaceous, Neogene, and Quaternary systems and are represented by various terrigenous and volcanogenic–sedimentary rocks [39].
Magmatic rocks are represented by ultrabasic rocks and gabbroids combined into an ophiolite association. The placer gold deposit was discovered in 1966–1967 during a 1:200,000-scale geological survey in the middle reaches of the Olkhovaya-1 river (Figure 1). The Olkhovaya-1 ore occurrence is formed by six contiguous placers. The placers are of the flood-plain, bench alluvial, and fluvioglacial types. The lengths of the placers range from 400 to 2000 m, with an average width from 20 to 74 m. The bedrock is composed of pebbles and sands of the Olkhovskaya formation and Quaternary marine and fluvioglacial deposits [39].
3. Materials for Research and Analytical Techniques
3.1. Materials for Research
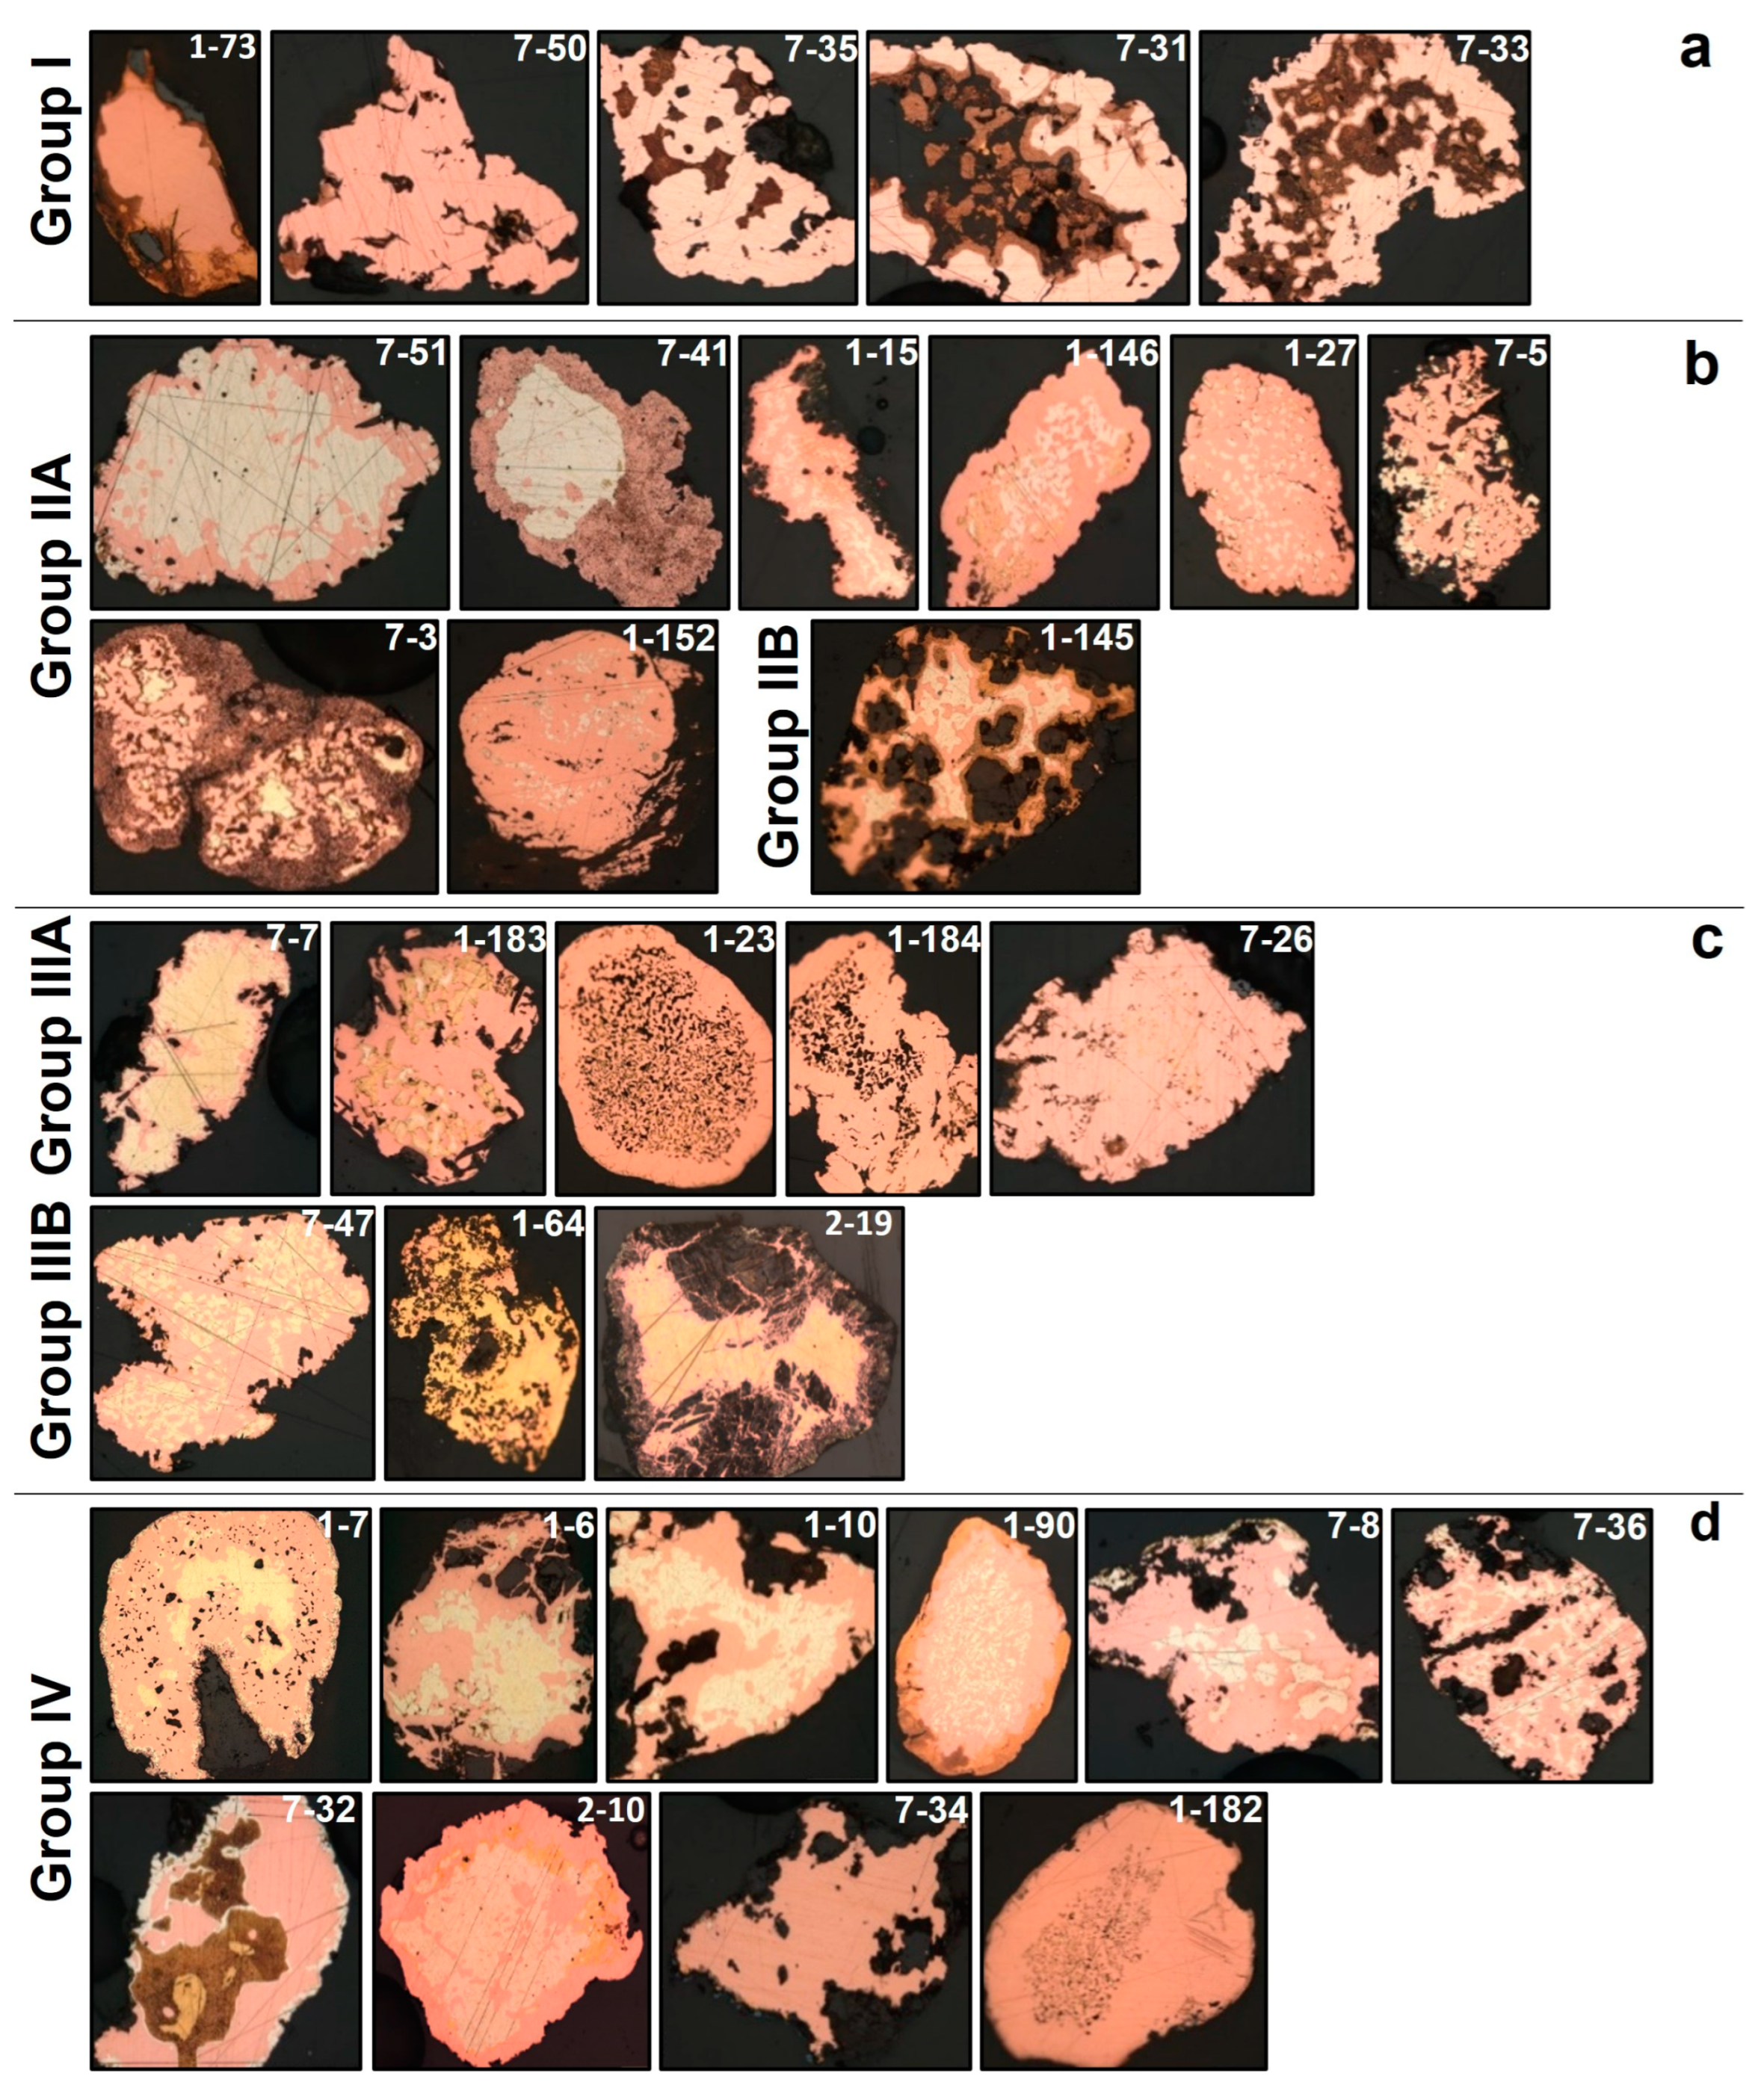
We had three blocks (KM-1, 2, and 7) with embedded and polished grains from the heavy fractions of the Olkhovaya-1 river placers (Kamchatka Cape, Eastern Kamchatka). These blocks were kindly provided to us by E. Sidorov (Institute of Volcanology and Seismology, Far East Branch of Russian Academy of Sciences). The number of grains in these blocks was 190, 20, and 51. Thirty-two heterogeneous grains with a cuprian color were studied in detail (Figure 2).
The sizes of the grains are 0.2–0.9 mm. According to the native gold grain size classification by Petrovskaya (1973) [1], they belong to the fine-size class. The most widespread morphology of grains is round or oval. Some grains, which are framed by preserved silicate minerals, are hypidiomorphic (Figure 2, grains 1-10, 1-145, 1-181, 2-19, 7-34, etc.).
Macro- and microscopic studies of the gold grains were carried out using an optical microscope (Olympus BX51). The polished grains examined with a reflected-light microscope show heterogeneity, with different colors, different textures, and inclusions of other minerals.
3.2. Analytical Techniques
Chemical analyses of the minerals in the grains were conducted at the Analytical Center for Multi-elemental and Isotope Research in the Sobolev Institute of Geology and Mineralogy (Novosibirsk, Russia) by electron-probe microanalysis (EPMA) using a MIRA 3 LMU scanning electron microscope (Tescan Orsay Holding, Brno, Czech Republic) equipped with an energy-dispersive X-ray spectrometer (EDS) (AZtec Energy XMax-50; Oxford Instruments Nanoanalysis, Oxford, UK) (analysts were Dr. N. Karmanov and M. Khlestov). The composition of native gold was studied using the following parameters: the accelerating voltage was 20 kV, and the spectrum recording time was 60 s (total area of spectra ~106 counts). The following X-ray lines were selected: Kα for Fe, Cu, S, and O; Lα for Pd, Ag, and Sb; and Mα for Au and Hg. The following standards were used: pure metals (Fe, Cu, Pd, Ag, Au) and InAs for As and HgTe for Hg. The lower limits of the determined contents were 0.1% Fe, 0.15% Cu, 0.25% Ag, 0.6% Au, and 0.8% Hg. The error in determining the main components, with contents higher than 10 wt.%, did not exceed 1 rel.%, and when the content of a component ranged from 2% to 10%, the error was no higher than 6–8 rel.%. Close to the lower limit of detection, the error was 15–20 rel.%. In some cases, the live time of spectrum acquisition increased to 120 sec, and the lower limits of the determined contents and the random error of the analysis decreased by about 1.4 times. The compositions of small gold platelets (<10 µm) and some exsolution lamellar structures were determined with a 10 nm point probe, but the size of the generation region of X-ray emission from gold with an electron beam energy of 20 k was 1 µm. Therefore, the data from the analysis cannot be considered quantitative if the minimum size of the studied object is less than 2 µm.
Microchemical X-ray maps of gold grains were made to show chemical variations within grains to detect and identify micro-inclusions and minerals in intergrowths. It is worth noting that Au-Cu-Ag phases are soft and have different hardnesses, which can result in cross-contamination during the polishing process. These two factors impose restrictions on the interpretation of analytical data.
The mineral compositions of substances from the edge fragments of three grains were analyzed by X-ray diffractometry. An X-ray powder diffraction study of selected samples was performed on a Stoe IPDS-2T diffractometer (MoKα radiation, graphite monochromator) using Gandolfi mode. Two-dimensional X-ray patterns were radially integrated using the XArea software package. The results were processed in the Stoe WinXPOW 2.21 and Match 3.5.3.109 program packages. A phase analysis was carried out using the PDF-4+ database (The Powder Diffraction File PDF-4+, 2006).
In this paper, the “fineness” of alloys was calculated as cAu*1000/(cAu + cAg + cCu (+ cHg), where cMe is the amount of metal in grams. The terms used to characterize the amounts of gold in solid solutions (alloys)—very high-fineness (999‰–951‰), high-fineness (950‰–900‰), medium-fineness (899‰–800‰), relatively low-fineness (799‰–700‰), and low-fineness (699‰–400‰) gold; kustelite (399‰–100‰); native silver (< 100‰)—were proposed by Petrovskaya (1973) [1]. We used the same terms to characterize native gold.
4. Results
4.1. Colors and Internal Textures of Grains
The optical photographs of polished grain sections in reflected light demonstrate a wide range of colors and their heterogeneous textures (Figure 2). They show that the content of phases of copper color varies in a wide range of 30%–90% of the total area of the grain section. Considerable quantities (90%–70%) of these phases are present in grains 1-73, 7-35, and 7-50 (Figure 2a). Phases of yellow color (Au-Ag alloys of medium fineness) are typical of the inner zones (20%–60% of area) of some grains (Figure 2b–d). Phases of bright-yellow color (high-fineness gold or Au-rich alloys) are common to the peripheral parts of nearly all grains, where they form thin continuous or discontinuous rims, veins, and hypidiomorphic inclusions. The widest rims, 40–50 microns in thickness, are found in grains 1-145 and 1-90 (Figure 2b,d). White phases (low-fineness Ag-Au alloys or Ag-rich alloys) are present in many grains and are especially abundant in 7-51 and 2-10 (Figure 2b,d), where they occupy 70%–80% of the section area and occur in the core. Grain 7-32 (Figure 2d) differs from these grains in that the white phase is situated in the periphery, forming a continuous rim of 5–20 microns in thickness, whereas in the core, it is present in the form of bands between the phases of copper and yellow-brownish colors. It is worth noting that some grains contain rare micro-inclusions of white color in the core and periphery (7-26, 1-182) (Figure 2b,c). In some grains, phases of yellow-brownish and brown colors are present (Figure 2).
Many grains have exsolution structures (lamellar, lattice, and emulsion) and zonal, corona, granulation, and interstitial structures (Figure 2). The samples differ in their dominant color: copper-color phases predominate (Figure 2a); mainly white phases are present (Figure 2b,d); grains contain mostly yellow phases (Figure 2c,d); or grains have phases of yellow-brownish and brown colors (Figure 2a,b,d). According to the diagram of the colors and compositions of alloys of the Au-Ag-Cu system [42], phases of copper color have elevated contents of copper, gold-rich alloys are of yellow or bright-yellow color, and with increasing silver concentration, they change in color from light yellow to white. The colors of the phases are yellow-brownish and brown, most likely due to the presence of other minerals in intergrowths with Au-Cu-Ag phases. Some grains lack secondary high-fineness rims.
4.2. The Compositions of Minerals of the Au-Cu-Ag System
We identified two to seven mineral phases of the Au-Cu-Ag system in the studied grains. Each grain was thoroughly analyzed. As an example, Table A1 and Table A2 illustrate the results of electron-probe microanalysis (EPMA) for two grains of simple and complex compositions (2-19 and 1-7). According to the compositions of the predominant phases, the 32 studied grains can be divided into four groups: I—grains (copper color) with auricupride, Cu3Au (Figure 2a); II—grains with auricupride (A) or tetra-auricupride (B) and Ag-rich alloys (white color) (Figure 2b); III—grains with auricupride (A) or tetra-auricupride (B) and Au-rich alloys (yellow color) (Figure 2c); and IV—grains with auricupride and tetra-auricupride and Au-Ag-Cu alloys (white and yellow colors) (Figure 2d). In addition to the major phases, some grains contain minor amounts of phases, the compositions of which fall in the intervals between Cu3Au and CuAu, between CuAu and Au3Cu, and between Au3Cu and Au.
Group I. This group (with predominant Cu3Au phase) includes five grains (Figure 2a, Table A3). Figure 3a,b,d,e illustrate, as an example, optical photos and BSE images of fragments of grains 1-73 and 7-50. The amount of auricupride Cu3Au in grain 1-73 is ≈70%. In the peripheral parts of this sample, we identified porous zones similar in composition to Au3Cu or Au3-xCu (fineness ≈ 880‰), micro-inclusions, and veinlets of Au3+xCu phases (fineness 930–960‰) (Figure 3a–c). Grain 7-50 is composed of ≈90% auricupride Cu3–2.98Au1–1.02. In the cracks of the central part of the grain, Au-Cu phases are observed, in which the gold content increases and corresponds to Cu2.86Au2.14 (≈Cu3Au2 or Cu1+xAu) and Au2.99Cu2.01 (≈Au3Cu2 or Au1+xCu) (Figure 3d–f).
Figure 3.
Optical photos in reflected light (a,d) and BSE images (b,e) of fragments (colored boxes in a,d) of grains (group I) 1–73 (a,b) and 7–50 (d,e) and compositions of phases in Au-Ag-Cu diagrams (in at.%) (c,f). Here and further in Figure 4, Figure 5, Figure 6, Figure 7, Figure 8, Figure 9, Figure 10, Figure 11 and Figure 12, the lines join phases in intergrowths; the solid lines with arrows point to non-equilibrium phases, and the dotted lines show equilibrium phases. Goethite (Gt) is in an intergrowth with high-fineness gold.

The data represented in the ternary diagrams (Figure 3c,f) reflect the compositions and relationships of Au-Cu phases in the grains of group 1. Gold-rich Au-Cu phases were most likely formed owing to the dissolution of auricupride, the removal of copper, and the recrystallization and redeposition of this mineral.
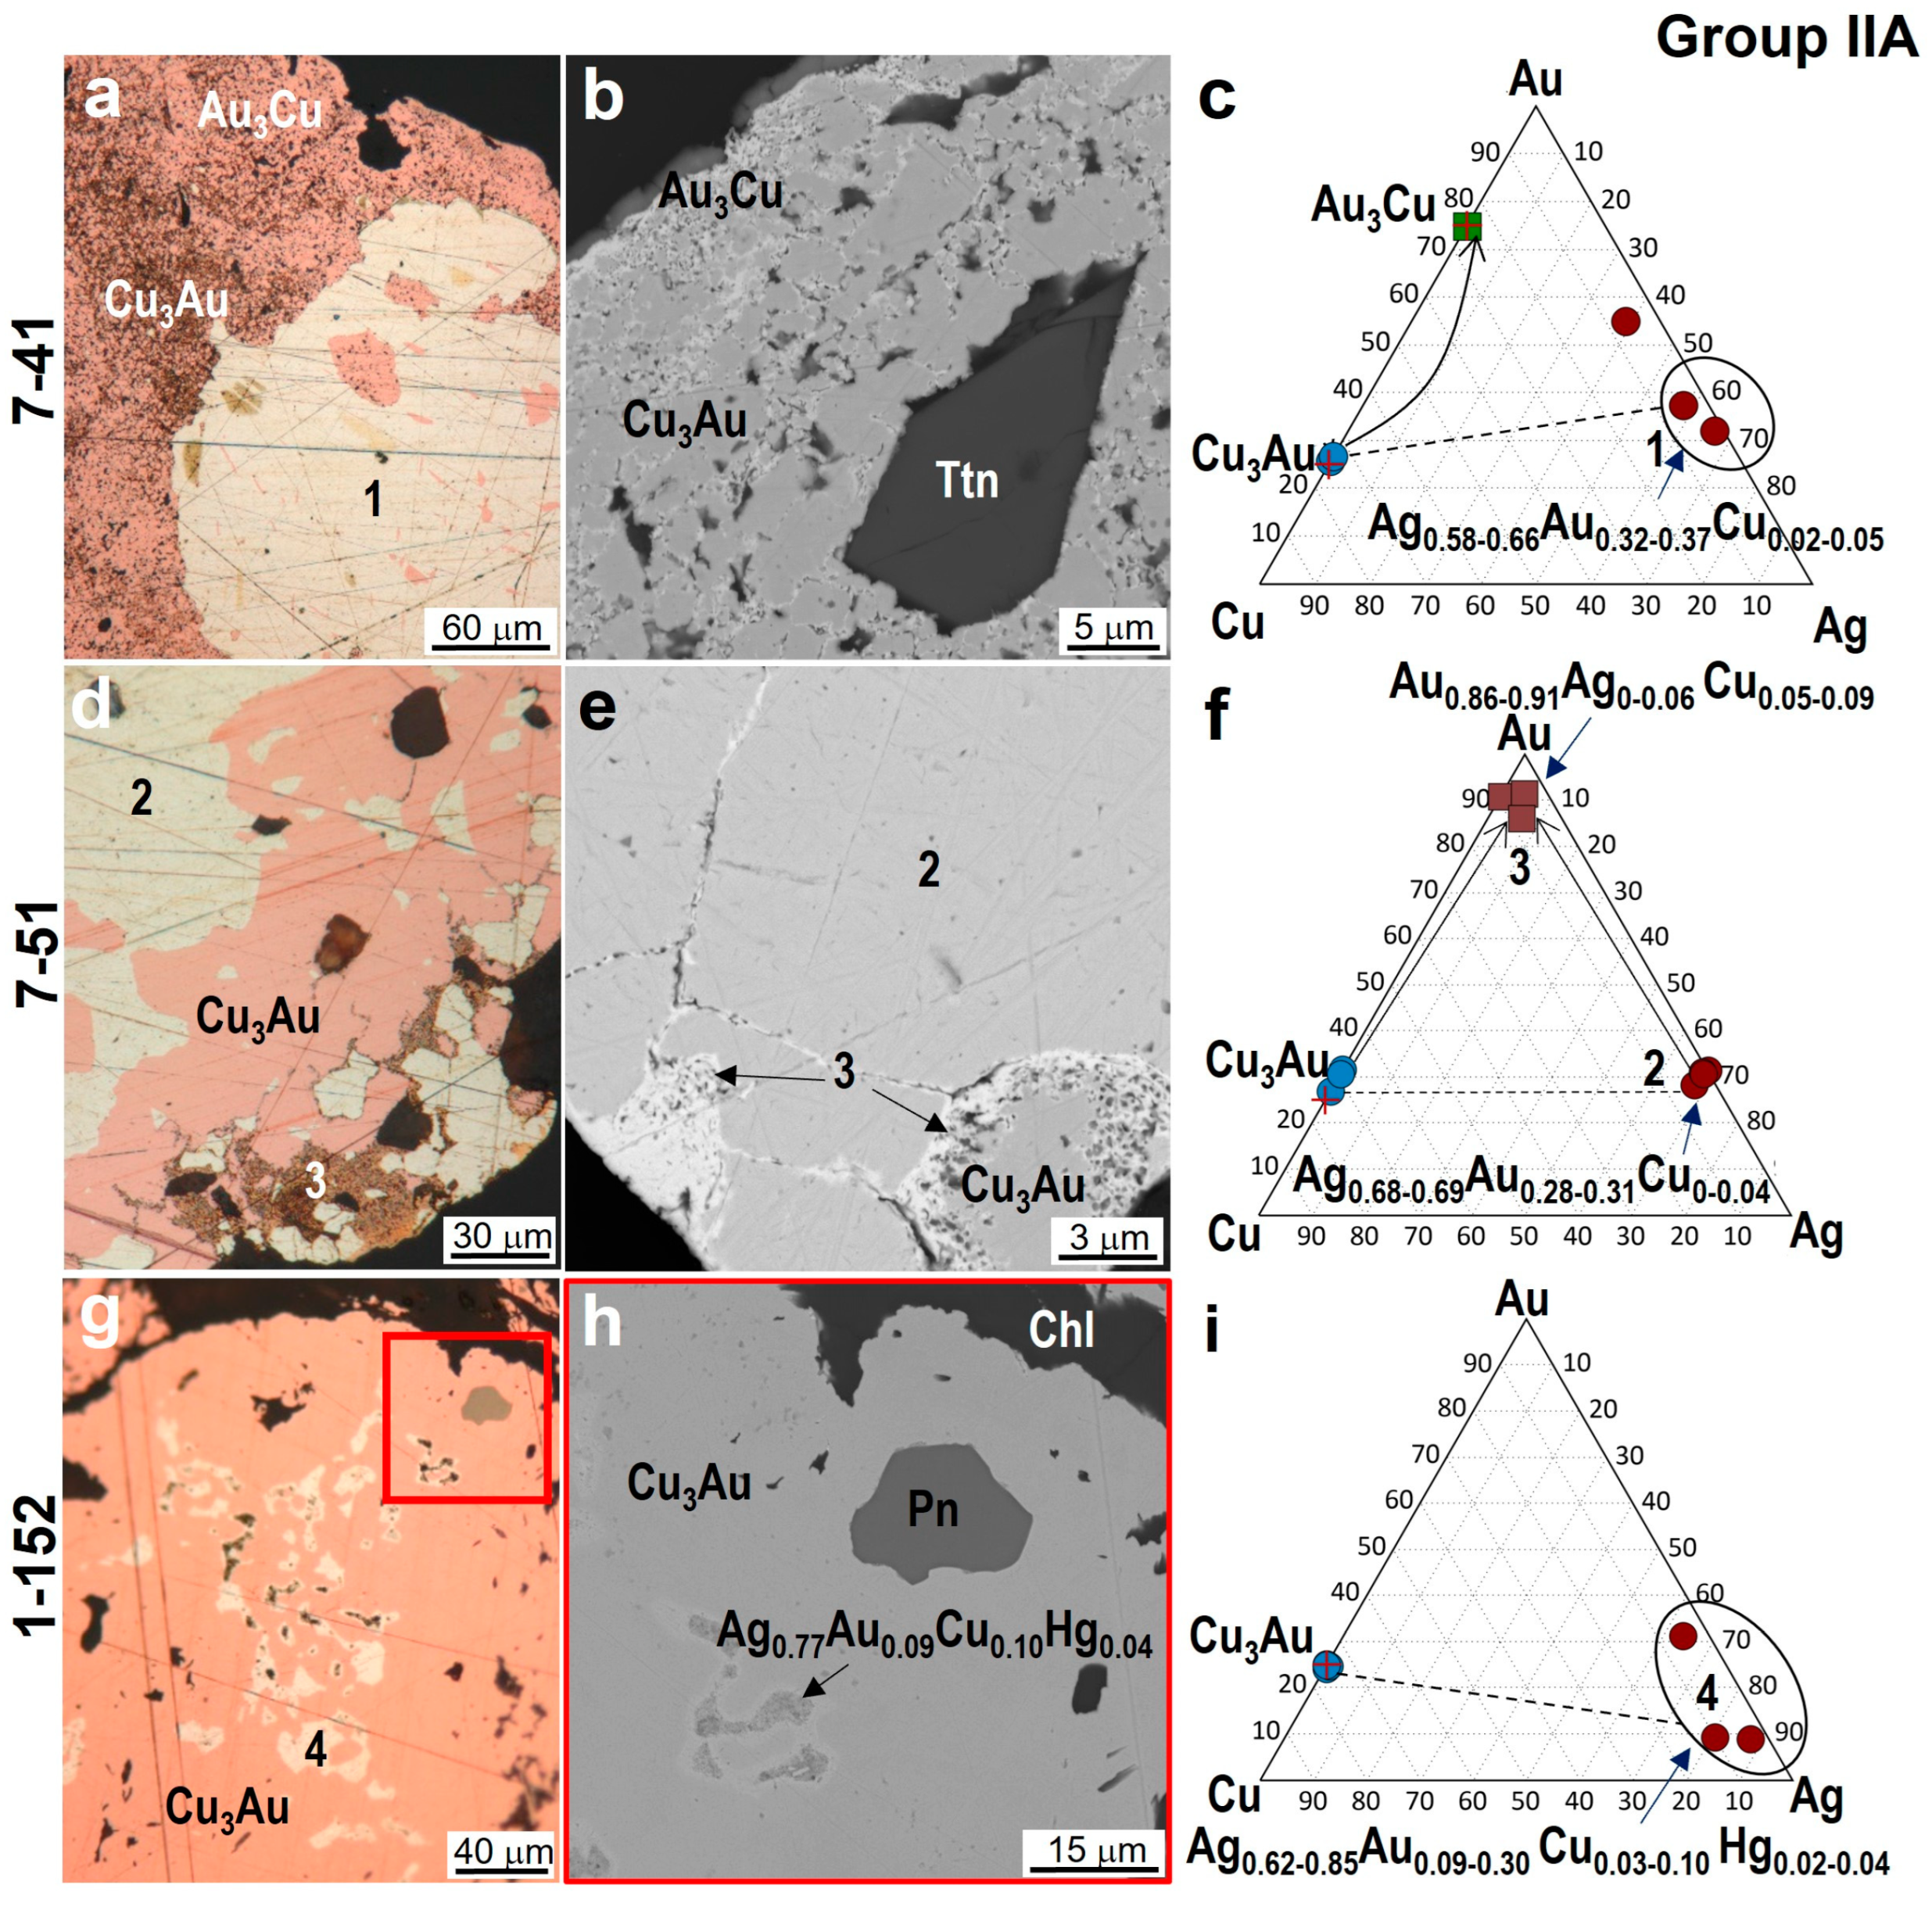
Group II. Nine grains were classified as group II (Figure 2b, Table A4). The main phases in eight grains are auricupride Cu3Au and Ag-rich alloys (subgroup IIA), and only one grain (1-145) is dominated by tetra-auricupride CuAu and Ag-rich alloys (subgroup IIB). In most grains, Ag-rich alloys occur in the core, ruling out grain 7-5, in which they occur in the periphery in an intergrowth with chlorite. White phases sometimes have an inconsistent composition. For example, in grain 7-41, the composition of the Ag-rich alloy is Ag0.58–0.66Au0.37–0.32Cu0.02–0.05 (fineness from 460 to 570‰) (Figure 4a–c), and in grain 7-51, it is Ag0.68–0.69Au0.28–0.31Cu0.01–0.04 (fineness 450‰) (Figure 4d–f). The presence of copper in the composition of Au-Ag solid solutions is probably related to the occurrence of Cu3Au micro-inclusions in the beam field. In the periphery of grains, phases containing higher gold concentrations and those of higher fineness (>700‰) are developed on auricupride and Au-Ag(-Cu) solid solutions. Phases similar in composition to Au3Cu were identified in grain 7-41 (Table A4). In grain 1-152, auricupride Cu3Au contains micro-inclusions of a low-fineness solid solution with mercury impurities: Ag0.62–0.77Au0.3–0.09Cu0.03–0.10Hg0.02–0.04 (fineness 350‰–520‰) (Figure 4g–i).
The ternary diagrams (Figure 4c,f,i) show the compositions and relationships of the Au-Cu-Ag phases in three grains of subgroup IIA. These grains exhibit the paragenesis of auricupride with low-fineness Au-Ag alloys. The subsequent enrichment of auricupride with gold was observed in almost all samples (except 1-152, Figure 4g–i). Au-Ag alloys acquire higher fineness owing to the removal of silver. Newly formed alloys with the highest fineness (up to 950‰) were found in grain 7-51 (Figure 4d–f).
Figure 4.
Optical photos in reflected light (a,d,g) and BSE images (b,e,h) of fragments of grains (group IIA)—7-41 (a,b), 7-51 (d,e), 1-152 (g,h)—and compositions of phases in Au-Ag-Cu diagrams (in at.%) (c,f,i). Symbols of minerals: Ttn—titanite (CaTiSiO5); Pn—pentlandite ((Ni,Fe)9S8); Chl—chlorite. h—colored box in g.
In grain 1-145 (subgroup IIB) (Figure 2b and Figure 5a), tetra-auricupride and Ag-rich alloy Ag0.64Au0.34Cu0.02 (white phase, fineness 510‰) are decomposition products of a Au-Ag-Cu solid solution.
Figure 5.
Optical photo in reflected light (a) and BSE image (b) of fragment of grain 1-145, compositions of phases in ternary diagram of Au-Ag-Cu (in at.%) (c) (Figure 2b, group IIB), and maps of element (Au, Cu, Ag) distributions in characteristic rays (d–f,g–i) for two grain fragments (red and blue box rectangles in a). Symbols of minerals in intergrowth: Grt—garnet; Px—pyroxene; Cu—native copper.
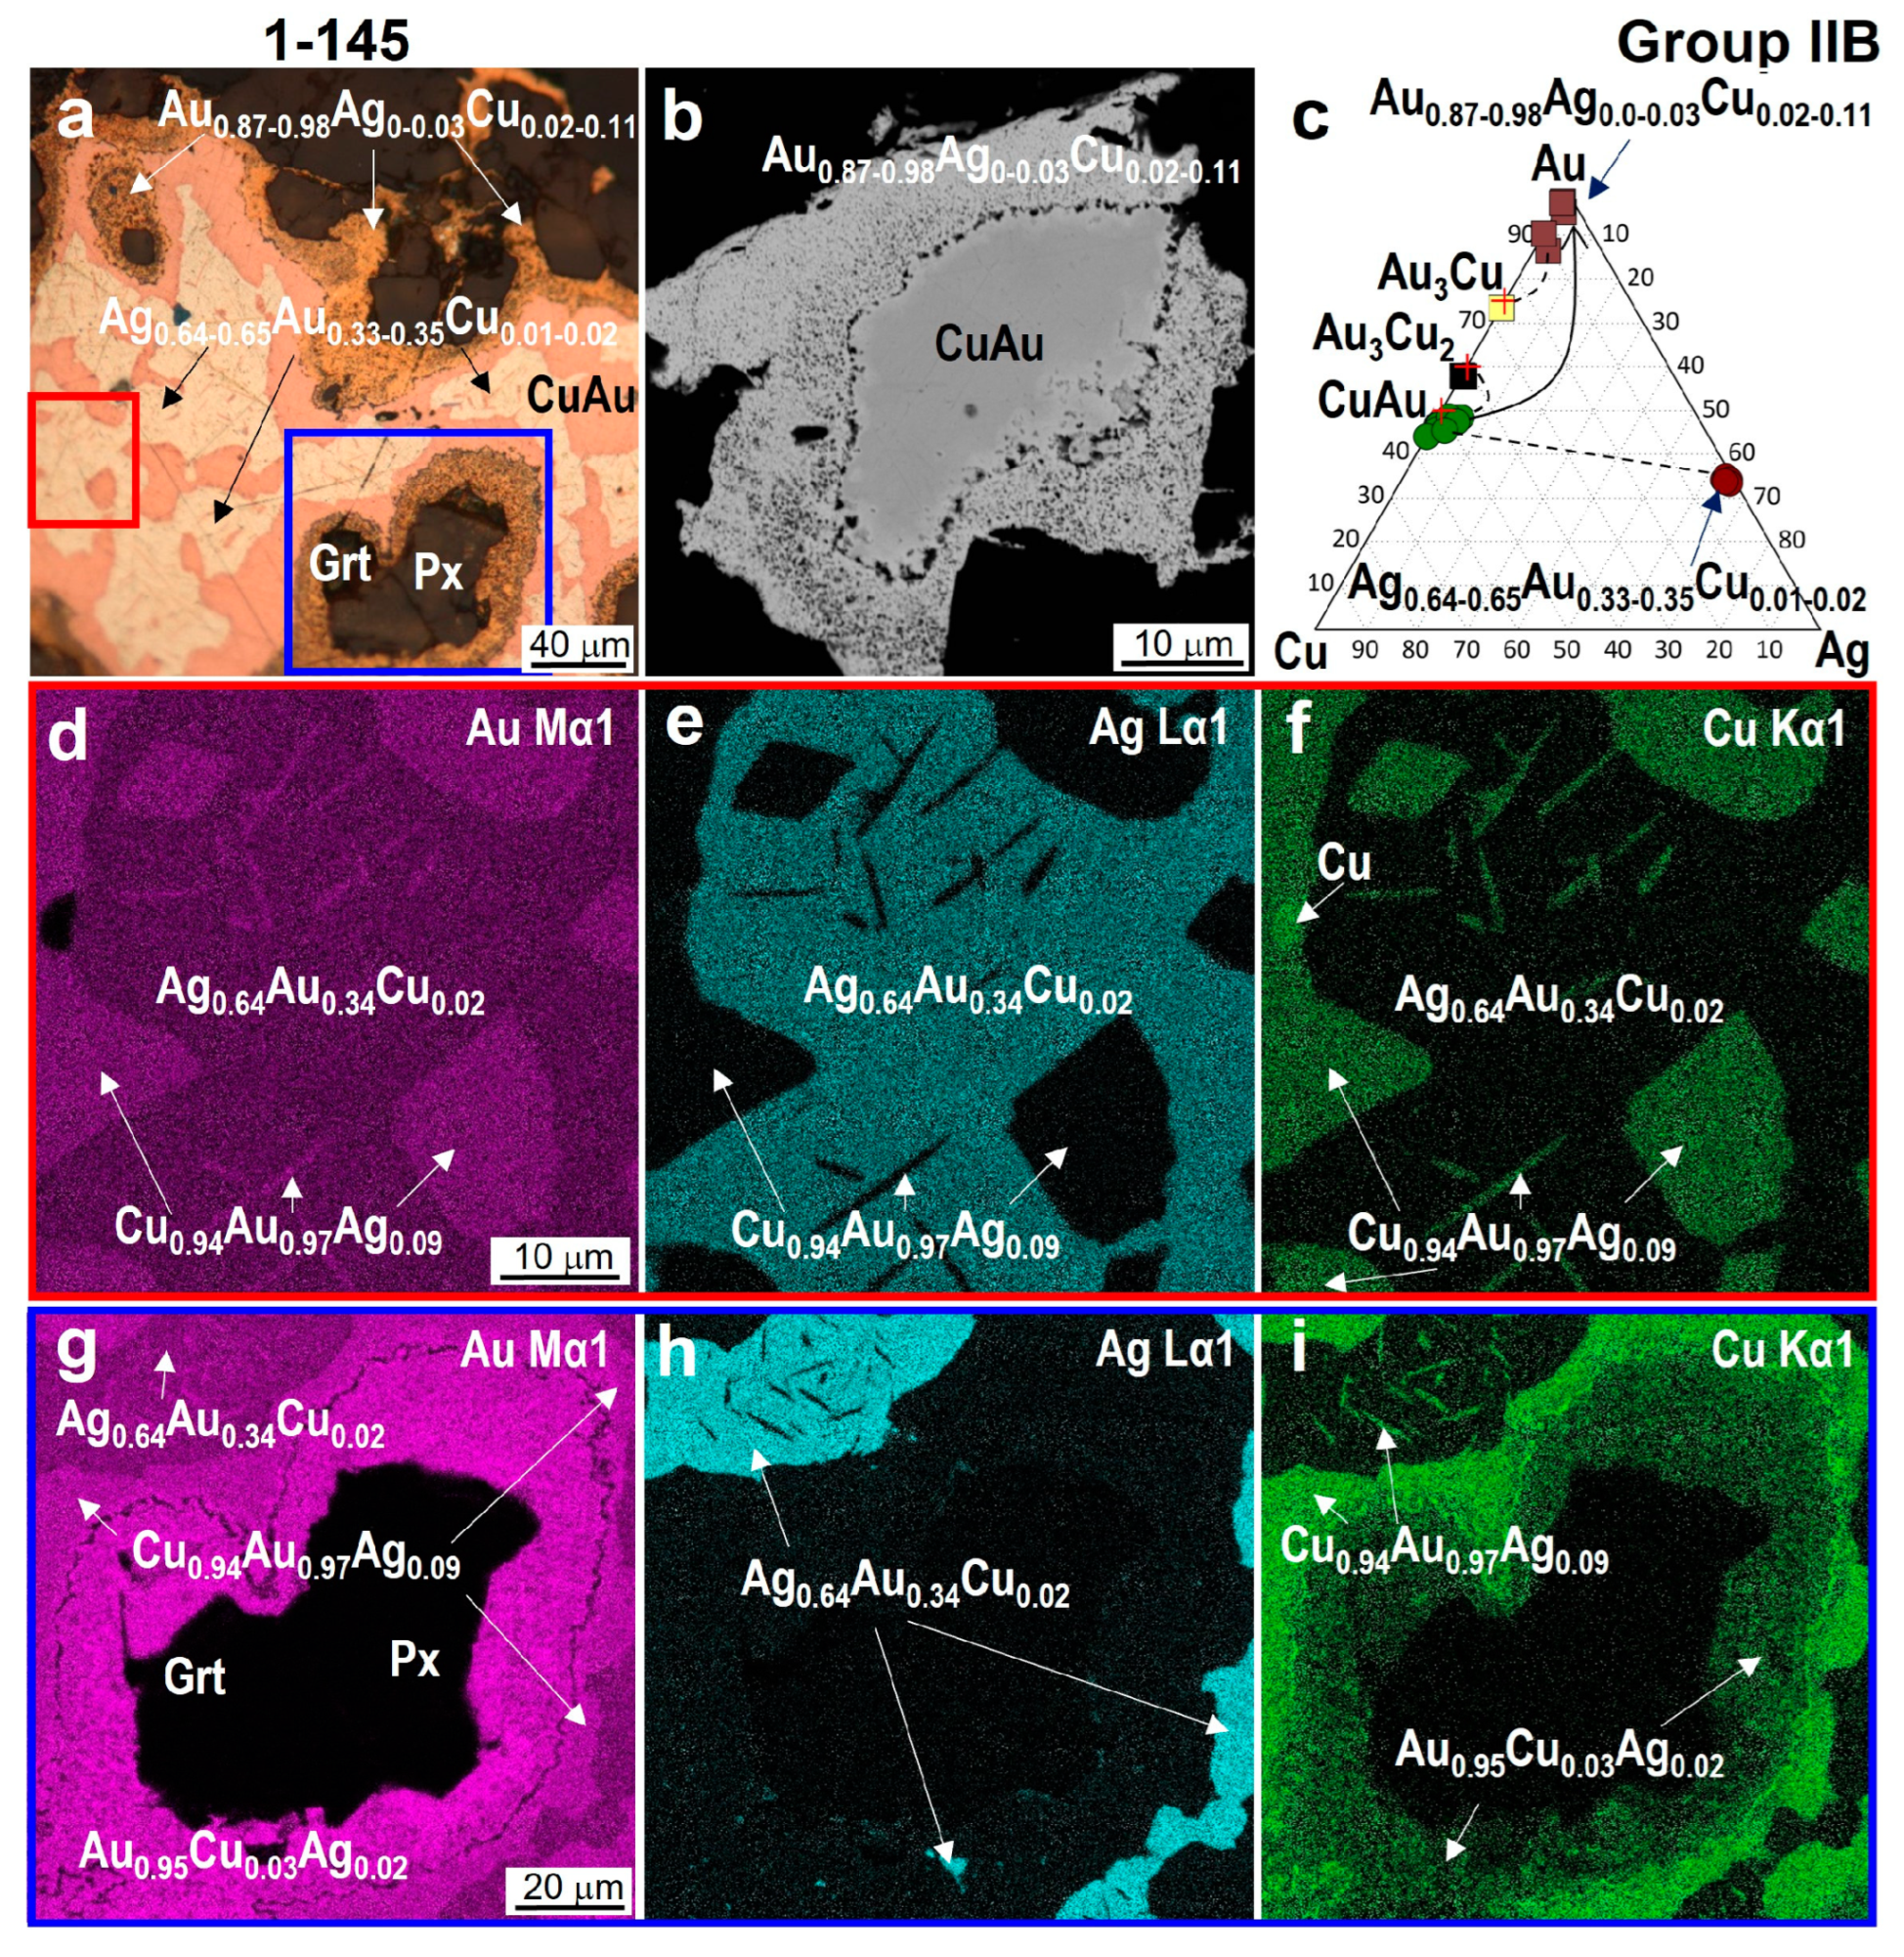
Inclusions of CuAu in the core of the sample are represented by microcrystals with an elongated shape (1 × 10 microns in size) or large crystals with a diamond shape in the section (12 × 17 microns in size) (Figure 5d–f). The maps of element (Au, Cu, Ag) distributions in characteristic rays (Figure 5g–i) show that the alloy with the composition Ag0.64Au0.34Cu0.02 is replaced by a zone with CuAu and further by high-fineness gold Au0.95Cu0.03Ag0.02 (980‰) in an intergrowth with garnet and pyroxene. High-fineness gold contains inclusions of Au3Cu2 and Au3Cu. Similar high-fineness rims are also typical of the periphery of this grain. The ternary diagram (Figure 5c) demonstrates the compositions and relationships of Au-Ag-Cu phases in this grain.
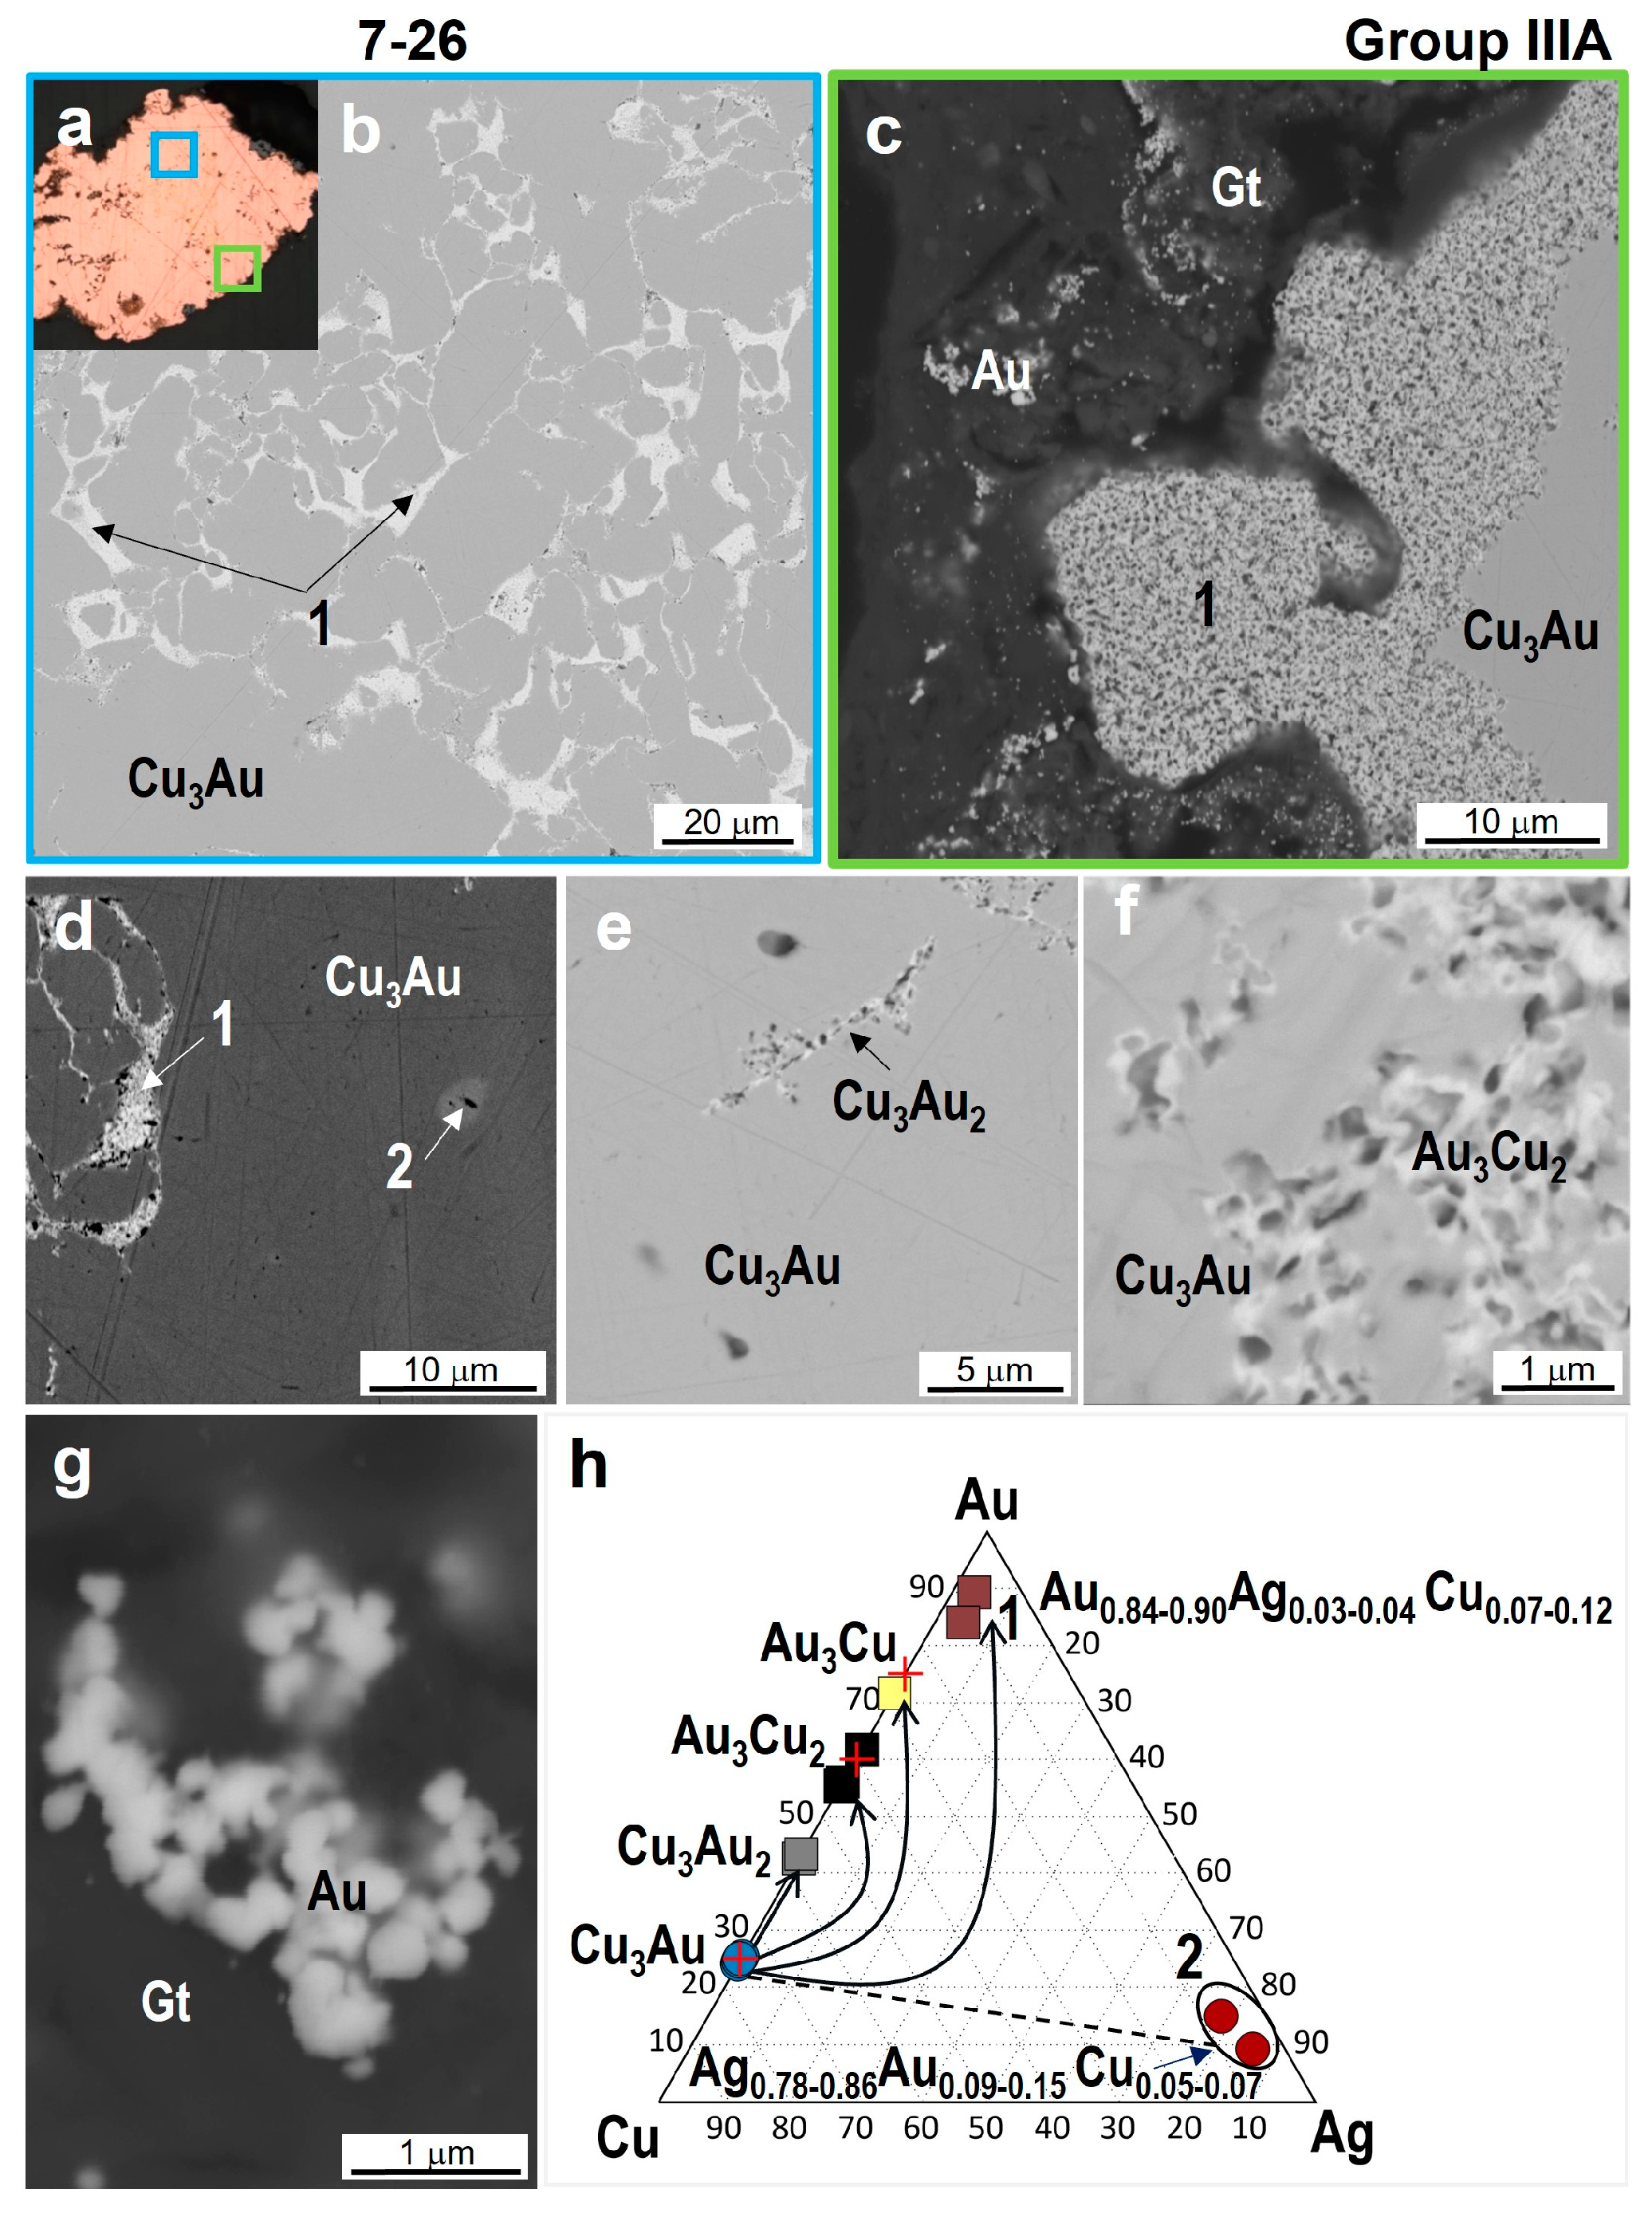
Group III. This group includes five grains with auricupride and Au-rich alloys (subgroup IIIA) and three grains with tetra-auricupride and Au-rich alloys (subgroup IIIB) (Figure 2c, Table A1 and Table A5). Grain 7-26 (subgroup IIIA) is characterized by the presence of high-fineness gold (910–940‰) in the intergranular space of auricupride in the core; micrograins and microveinlets of Au3Cu2, CuAu, and Au3Cu compositions (Figure 6a–f); and microcrystals of pure gold in the peripheral part (Figure 6g). This grain also contains rare micro-inclusions (2–20 µm) of white color (Ag-rich alloys, 230‰–340‰). Most likely, these are relics of Ag-rich alloys, indicating that the replacement of auricupride and low-fineness gold proceeded with the removal of silver and the formation of Au-Cu phases of various compositions up to the formation of very-high-fineness cuprian gold and pure gold. The ternary diagram (Figure 6h) clearly demonstrates the evolution of the phases of this grain.
Figure 6.
Optical photo in reflected light (a) and BSE images (b,c) of fragments in grain 7–26 (group IIIA) (green and blue boxes): (b)—veinlets of Au-Ag alloys (‰) in auricupride; (c)—grain edge zone composed of Au-Ag alloy 1 (‰); (d)—inclusion of Ag-Au alloy 2 (‰) in auricupride; (e)—veinlets of Cu3Au2 phase in auricupride; (f)—veinlets of Au3Cu2 phase; (g)—gold microcrystallites in goethite (peripheral zone); (h)—compositions of phases in ternary diagram of Au-Ag-Cu (in at.%).
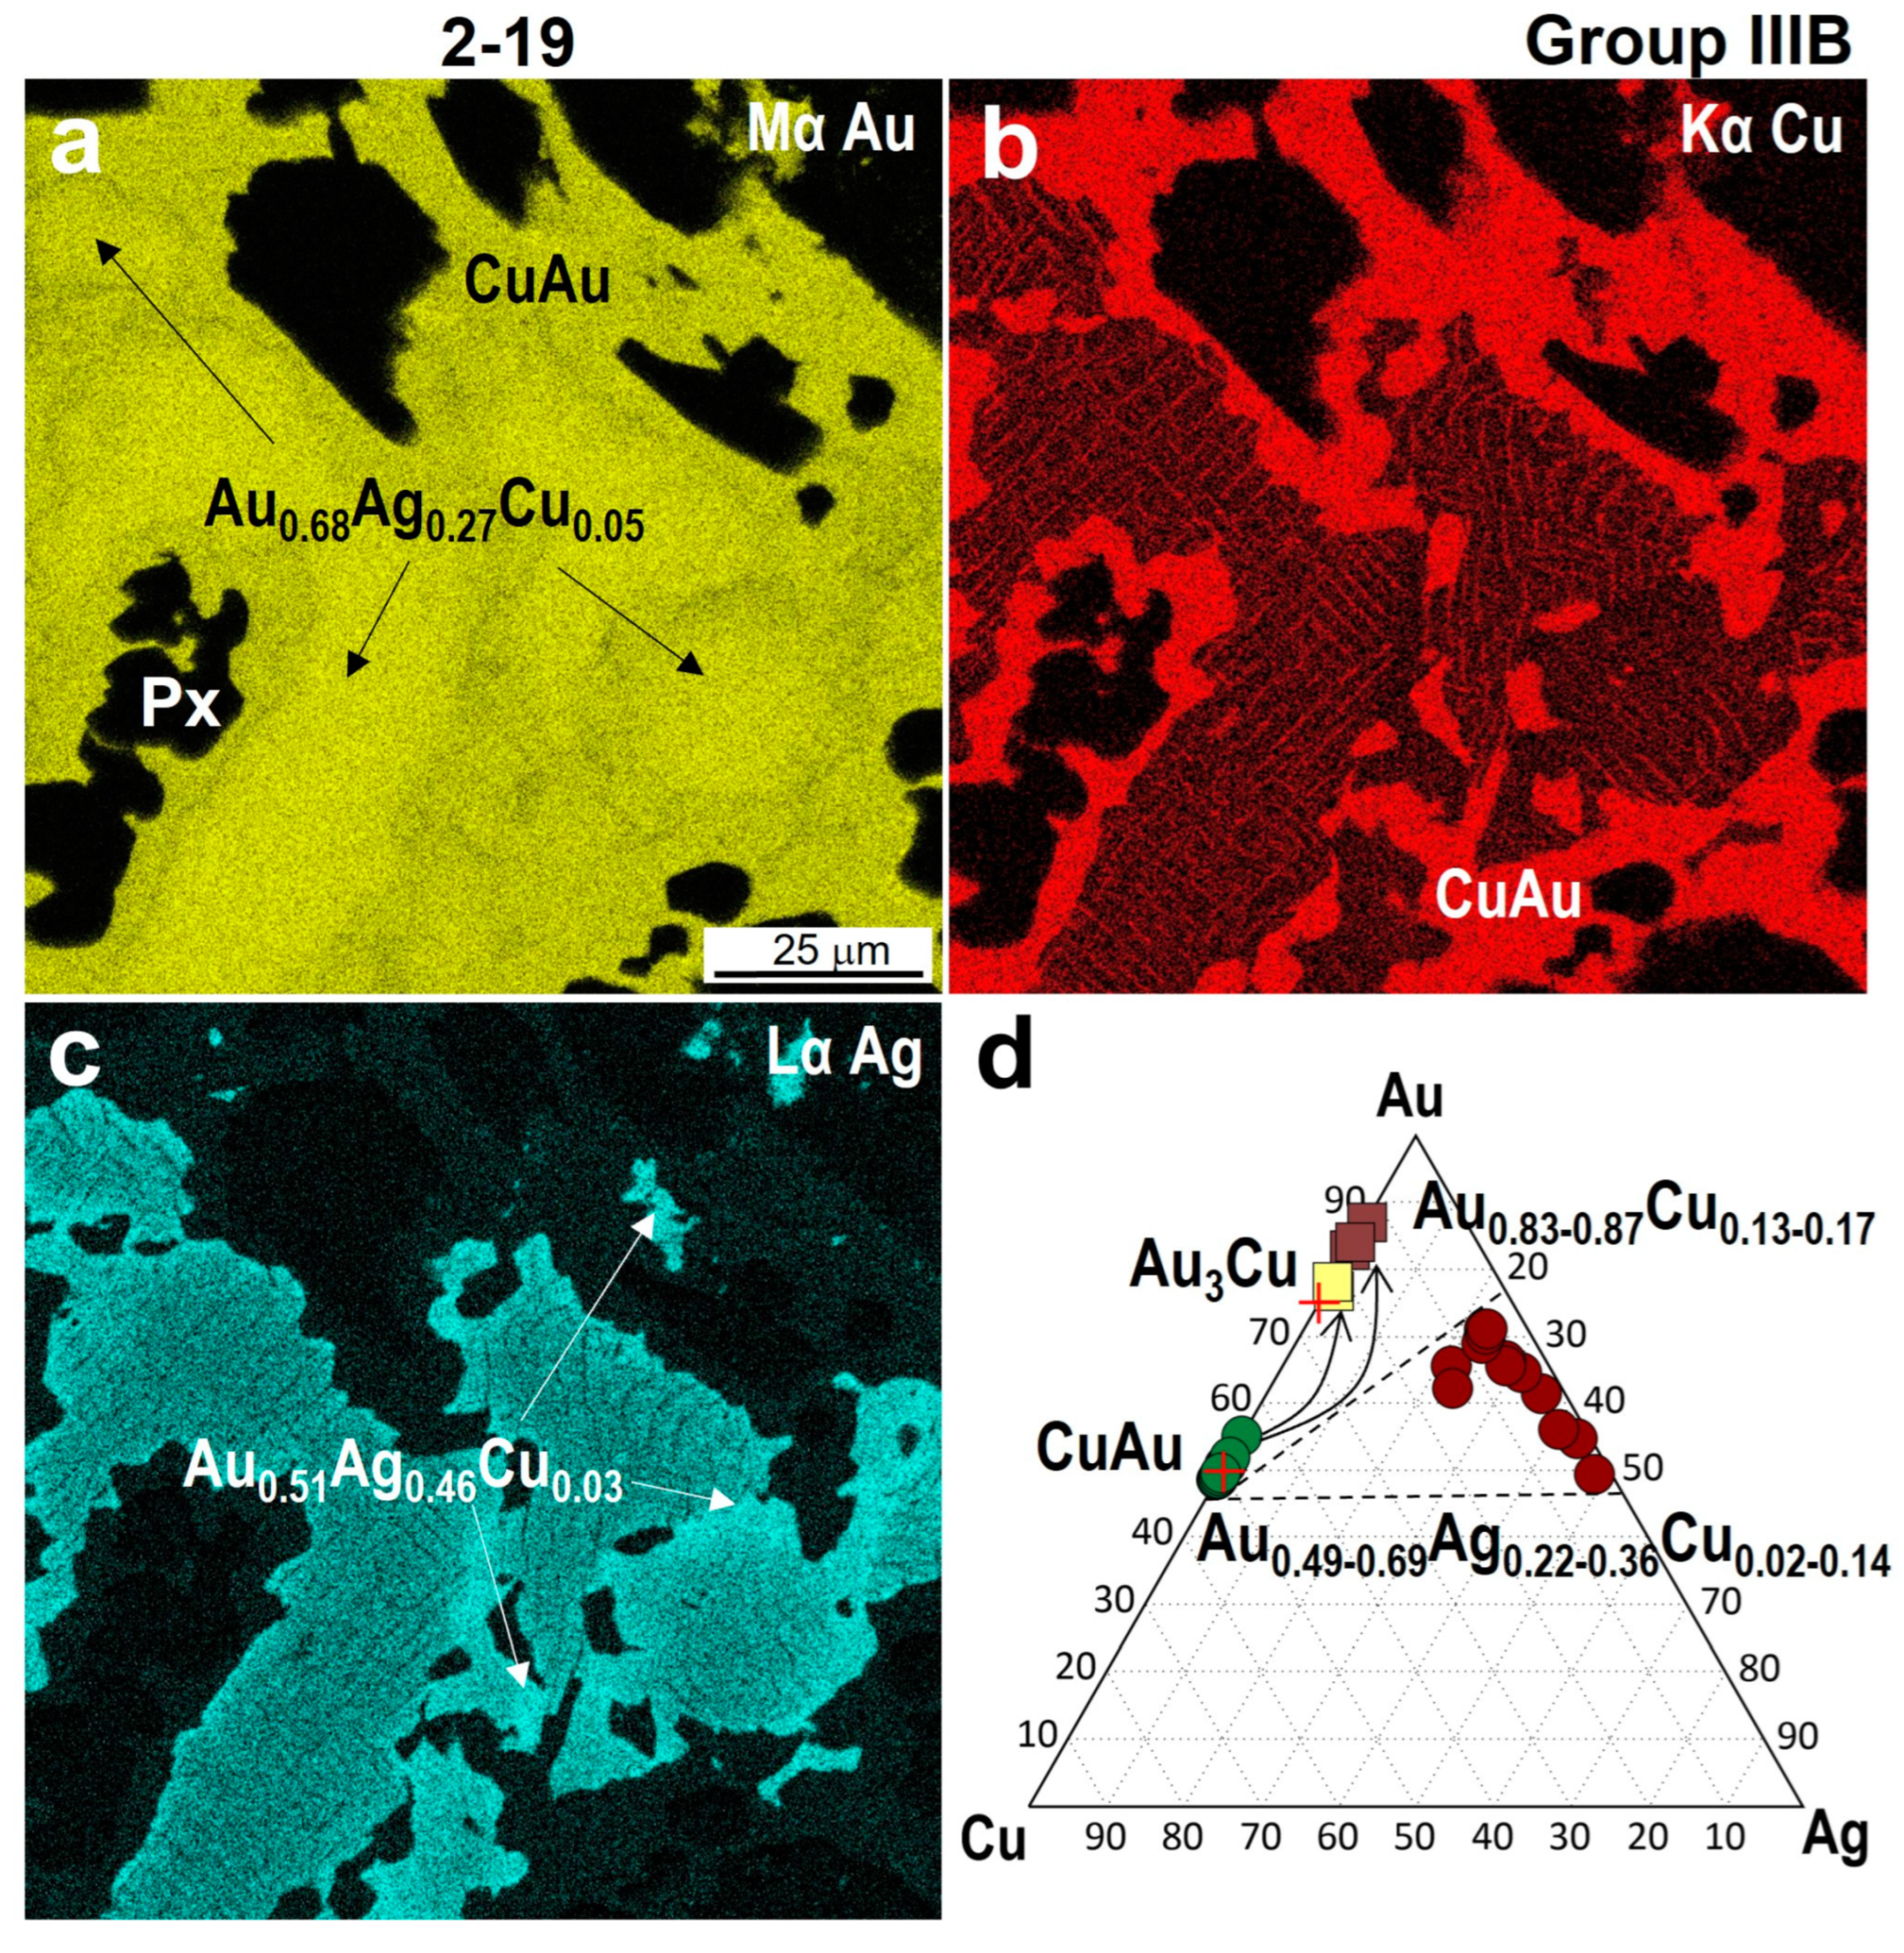
In grain 2-19 (subgroup IIIB), tetra-auricupride AuCu is mainly located in the peripheral part and is intergrown with pyroxene (diopside CaMgSi2O6, containing insignificant amounts of Fe, Al, Cr, and Mn), forming veinlets in the intergranular space of this mineral (Figure 2c). Tetra-auricupride is also present in the core of the grain in the form of parallel-oriented plates in the Au0.55Ag0.42Cu0.03 solid solution (fineness 698‰) (Figure 7a–c), which is replaced by an alloy with higher gold concentrations (Au0.68Ag0.27Cu0.05) (fineness 805‰) (Table A1). In the peripheral part of grain 2-19, tetra-auricupride is replaced by the Au-rich phase Au0.83–0.87Cu0.17–0.13 (Au3+xCu) (fineness 940‰–950‰).
Figure 7.
The heterogeneous structure of grain 2-19 (group IIIB) containing tetra-auricupride (AuCu) and Au-Ag alloys differing in fineness; the fineness decreases from the center to the edge parts: (a–c)—maps of the distributions of elements (Au, Ag, Cu) in characteristic rays; (d)—the compositions of phases in Au-Ag-Cu diagram (in at.%).
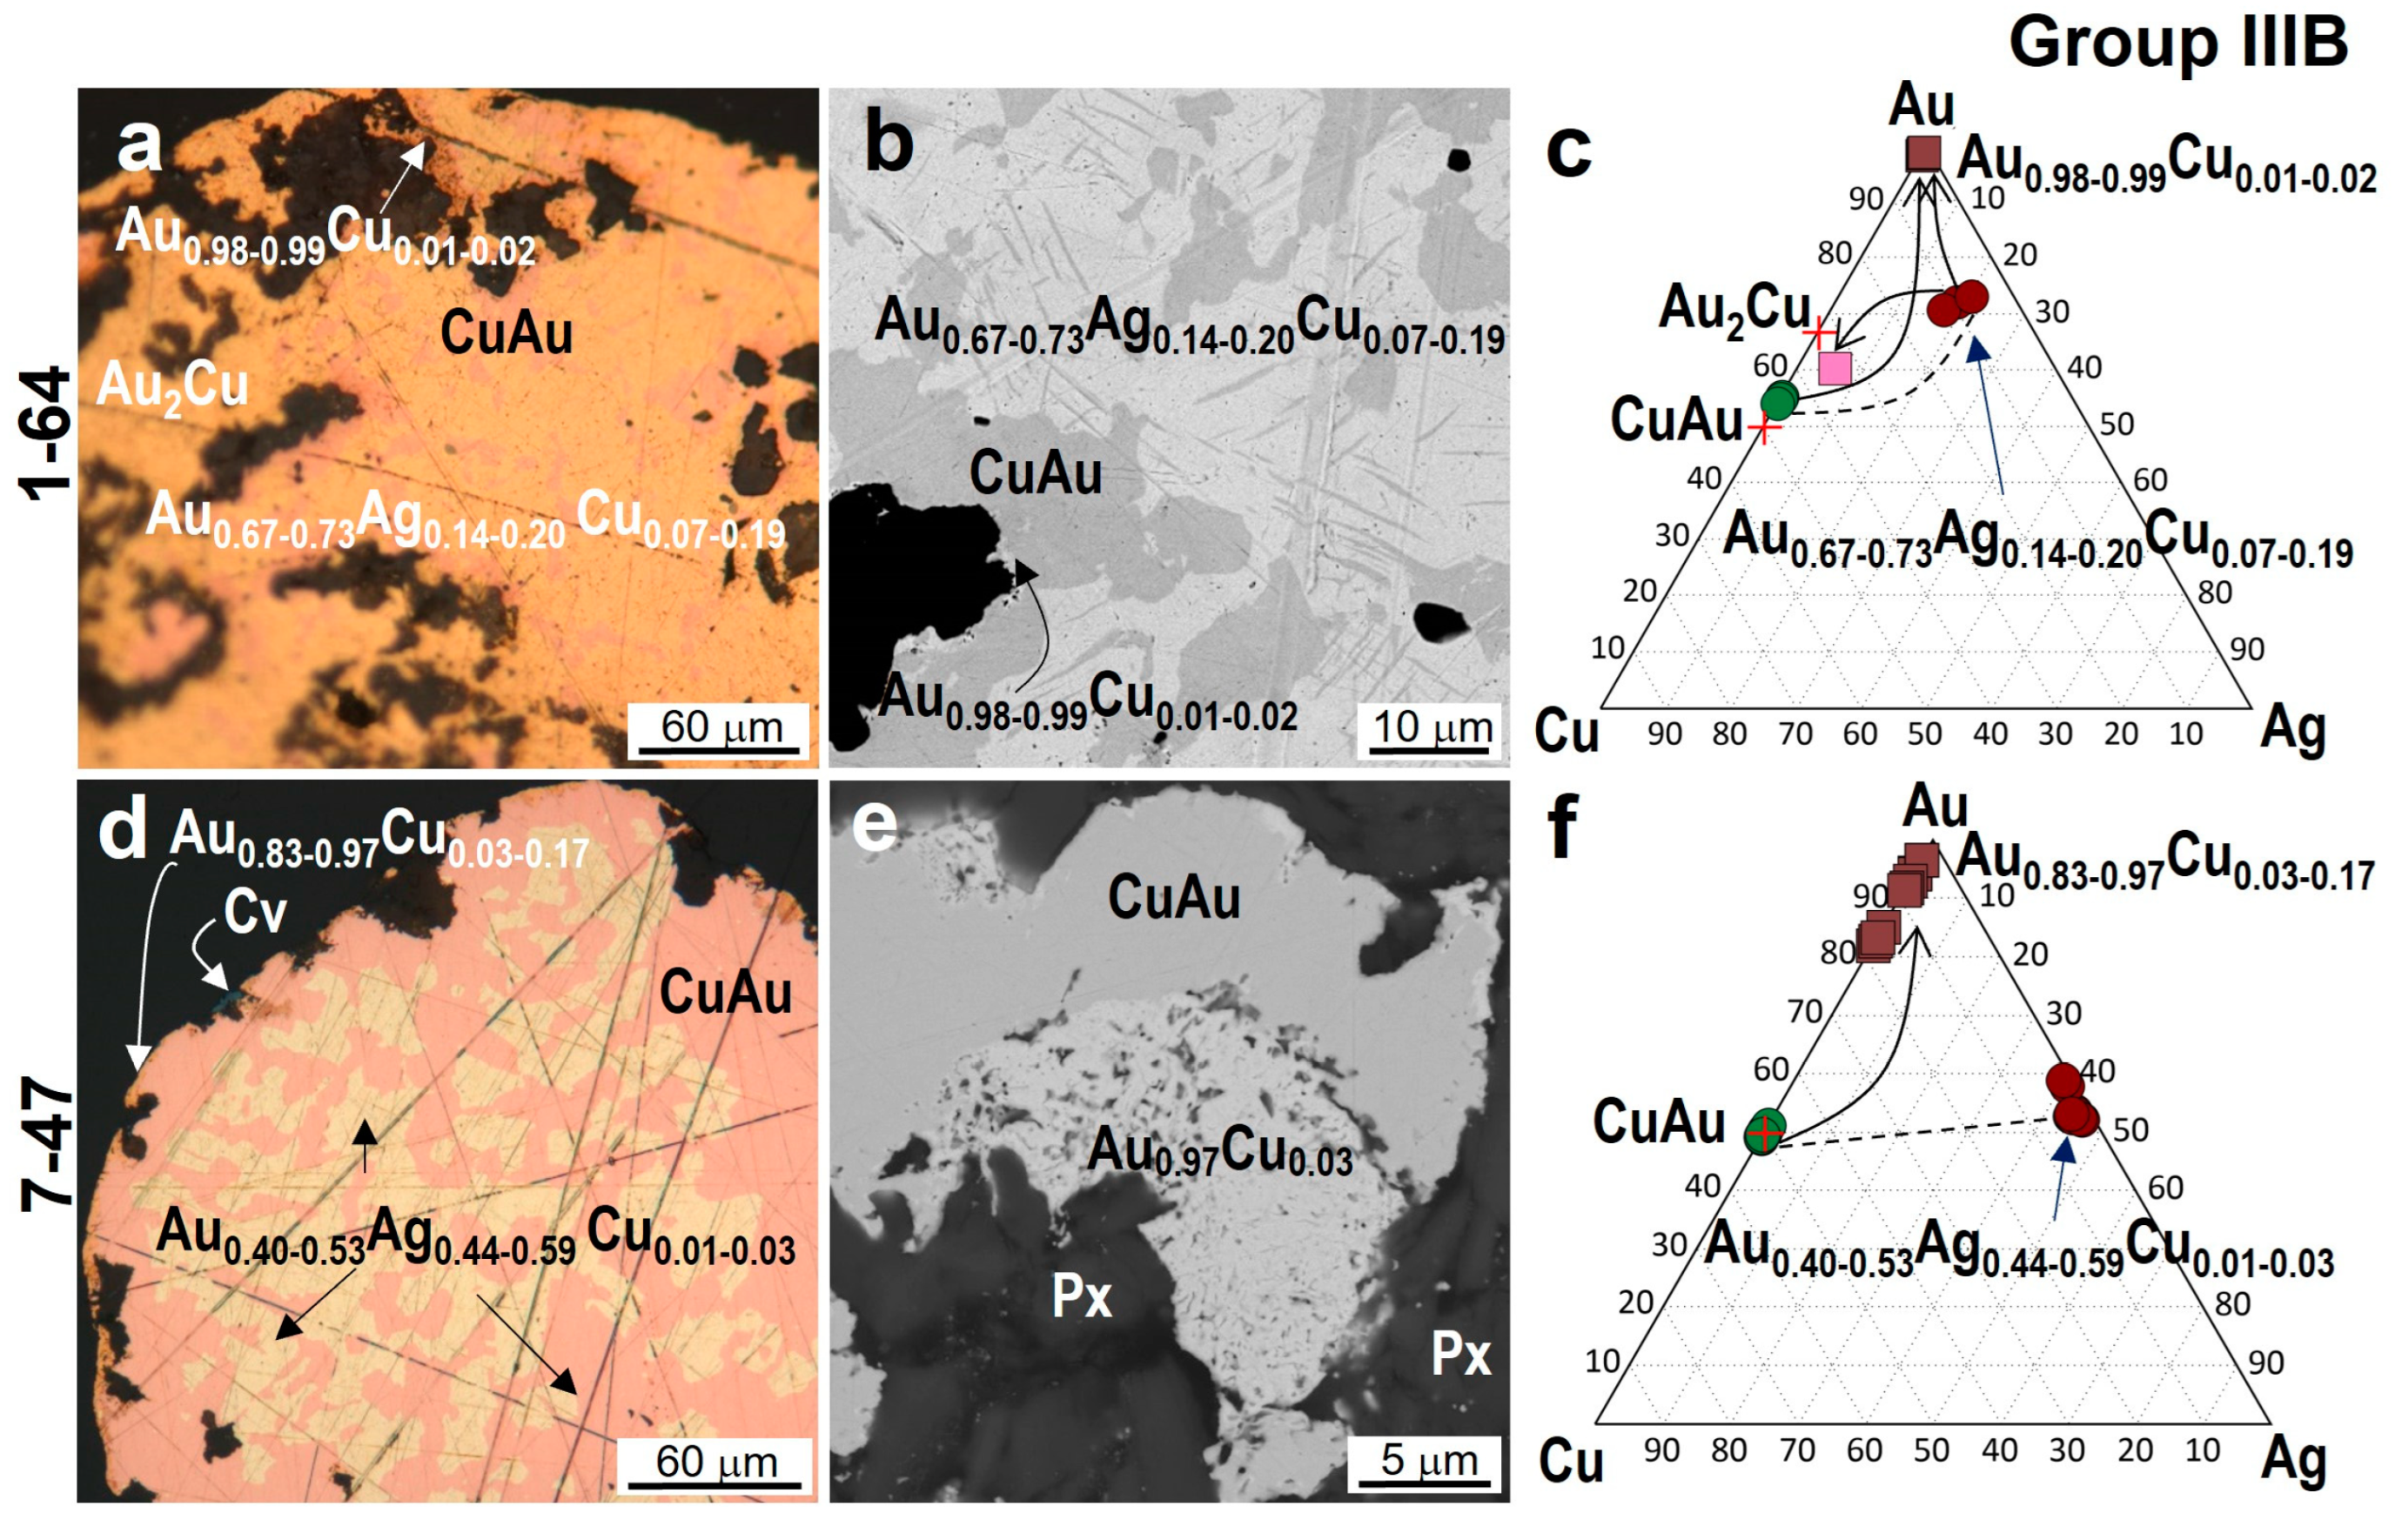
The core of grain 1–64 (Figure 2c and Figure 8a,b) contains exsolution structures formed by two phases—Cu0.90Au1.10 and a Au0.71Ag0.17Cu0.12 solid solution (830‰) (Table A5). Figure 8d,e show a fragment of grain 7-47 dominated by a Cu0.99Au1.01 phase and low-fineness alloys (550‰–660‰). The core of the sample is an intergrowth of these minerals, and in the peripheral part, a thin rim of porous cuprian gold Au0.83–0.97Cu0.17–0.03 (900‰–990‰) and covellite is observed. High-fineness gold frequently occurs at the boundary between tetra-auricupride and pyroxene (Figure 8e). Data presented in the ternary diagram (Figure 8f) show the compositions of and the relationships between the Au-Cu and Au-Ag-Cu phases: CuAu and low-fineness alloys are replaced by high-fineness cuprian gold. Phases that, according to our assumptions, were formed synchronously are connected by thick lines, and phases that formed as a result of substitution or recrystallization are shown by lines with arrows directed from primary to secondary phases.
Figure 8.
Optical photos in reflected light (a,d) and BSE images (b,e) of fragments of grains 1-64 (a,b) and 7-47 (d,e) (group IIIB) and compositions of phases in ternary diagrams of Au-Ag-Cu (in at.%) (c,f). The lines join phases in intergrowths.
Figure 8.
Optical photos in reflected light (a,d) and BSE images (b,e) of fragments of grains 1-64 (a,b) and 7-47 (d,e) (group IIIB) and compositions of phases in ternary diagrams of Au-Ag-Cu (in at.%) (c,f). The lines join phases in intergrowths.
Group IV. This group includes nine grains with auricupride, tetra-auricupride, and Au-Ag alloys (Figure 2d, Table A2 and Table A6). The samples in this group have an intricate structure, a significant number of phases, and variations in their compositions. Sample 2-10 contains Au-Ag alloys with a zonal structure (Figure 9).
Figure 9.
Optical photos in reflected light (a) and the heterogeneous structure of grain 2-10 (group IV), containing auricupride (Cu3Au), tetra-auricupride (CuAu), and Au-Ag alloys of different compositions. (b–d)—BSE images of fragments (green, red, and blow boxes in a): (b) inclusions of auricupride (black) and tetra-auricupride (white plates) in a low-fineness alloy (gray); (c) rims of high-fineness gold (white) around low-fineness gold (light gray) in contact with auricupride (dark gray); (d) a porous rim along auricupride, consisting of a mixture of phases; (e) compositions of mineral phases in Au-Ag-Cu diagram.
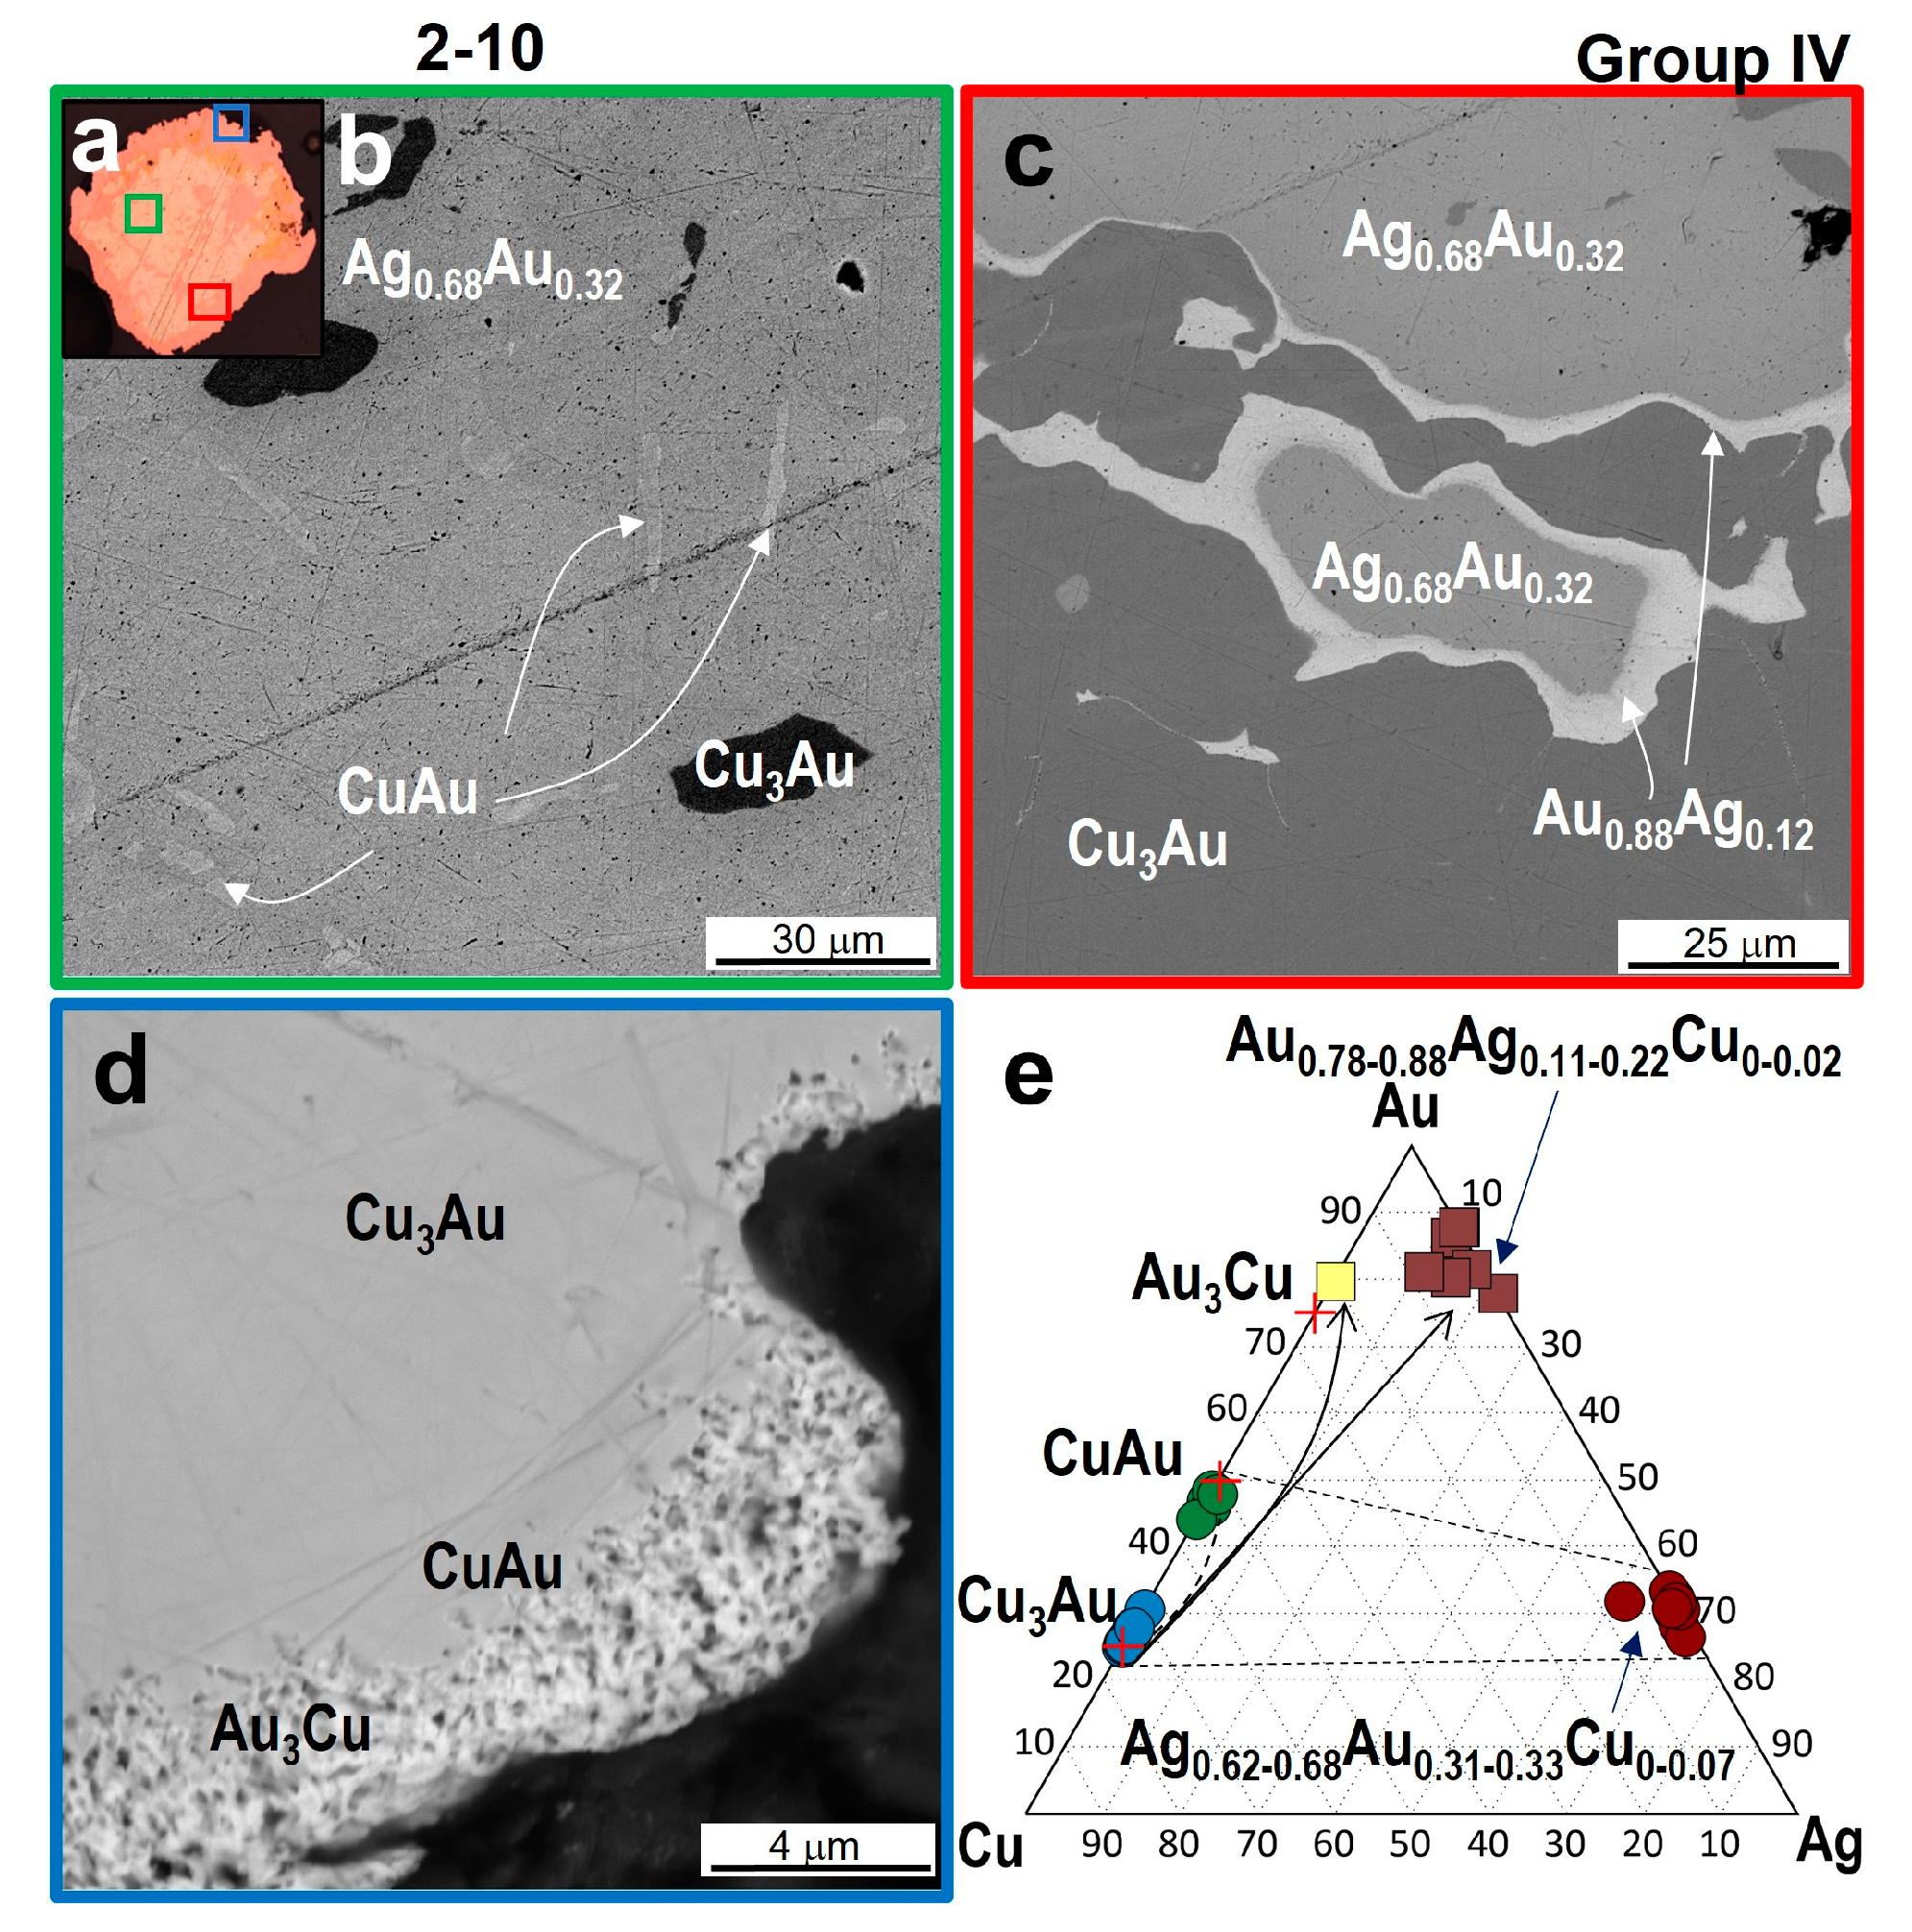
The core of grain 2-10 is composed of a white Ag-rich alloy, Ag0.69Au0.31 (446‰) (Table A6), containing lamellae of auricupride (Cu3Au) and thin plates of CuAu (Figure 9a–c). In the right part of the grain, closer to the peripheral part between auricupride with the composition Cu2.78–3.01Au0.99–1.11 and the Ag0.69Au0.31 solid solution, there is a zone of a Au-rich alloy with a yellow color, with variations in composition from Au0.79Ag0.21 to Au0.88Ag0.12 (fineness from 870 to 930‰) (Table A6). The peripheral parts of the grains contain thin porous films composed of a mixture of Au3Cu and AuCu phases without Ag impurities. The ternary diagram (Figure 9d) shows the compositions of phases of the Au-Ag-Cu system, which are present in this grain and in contact with each other.
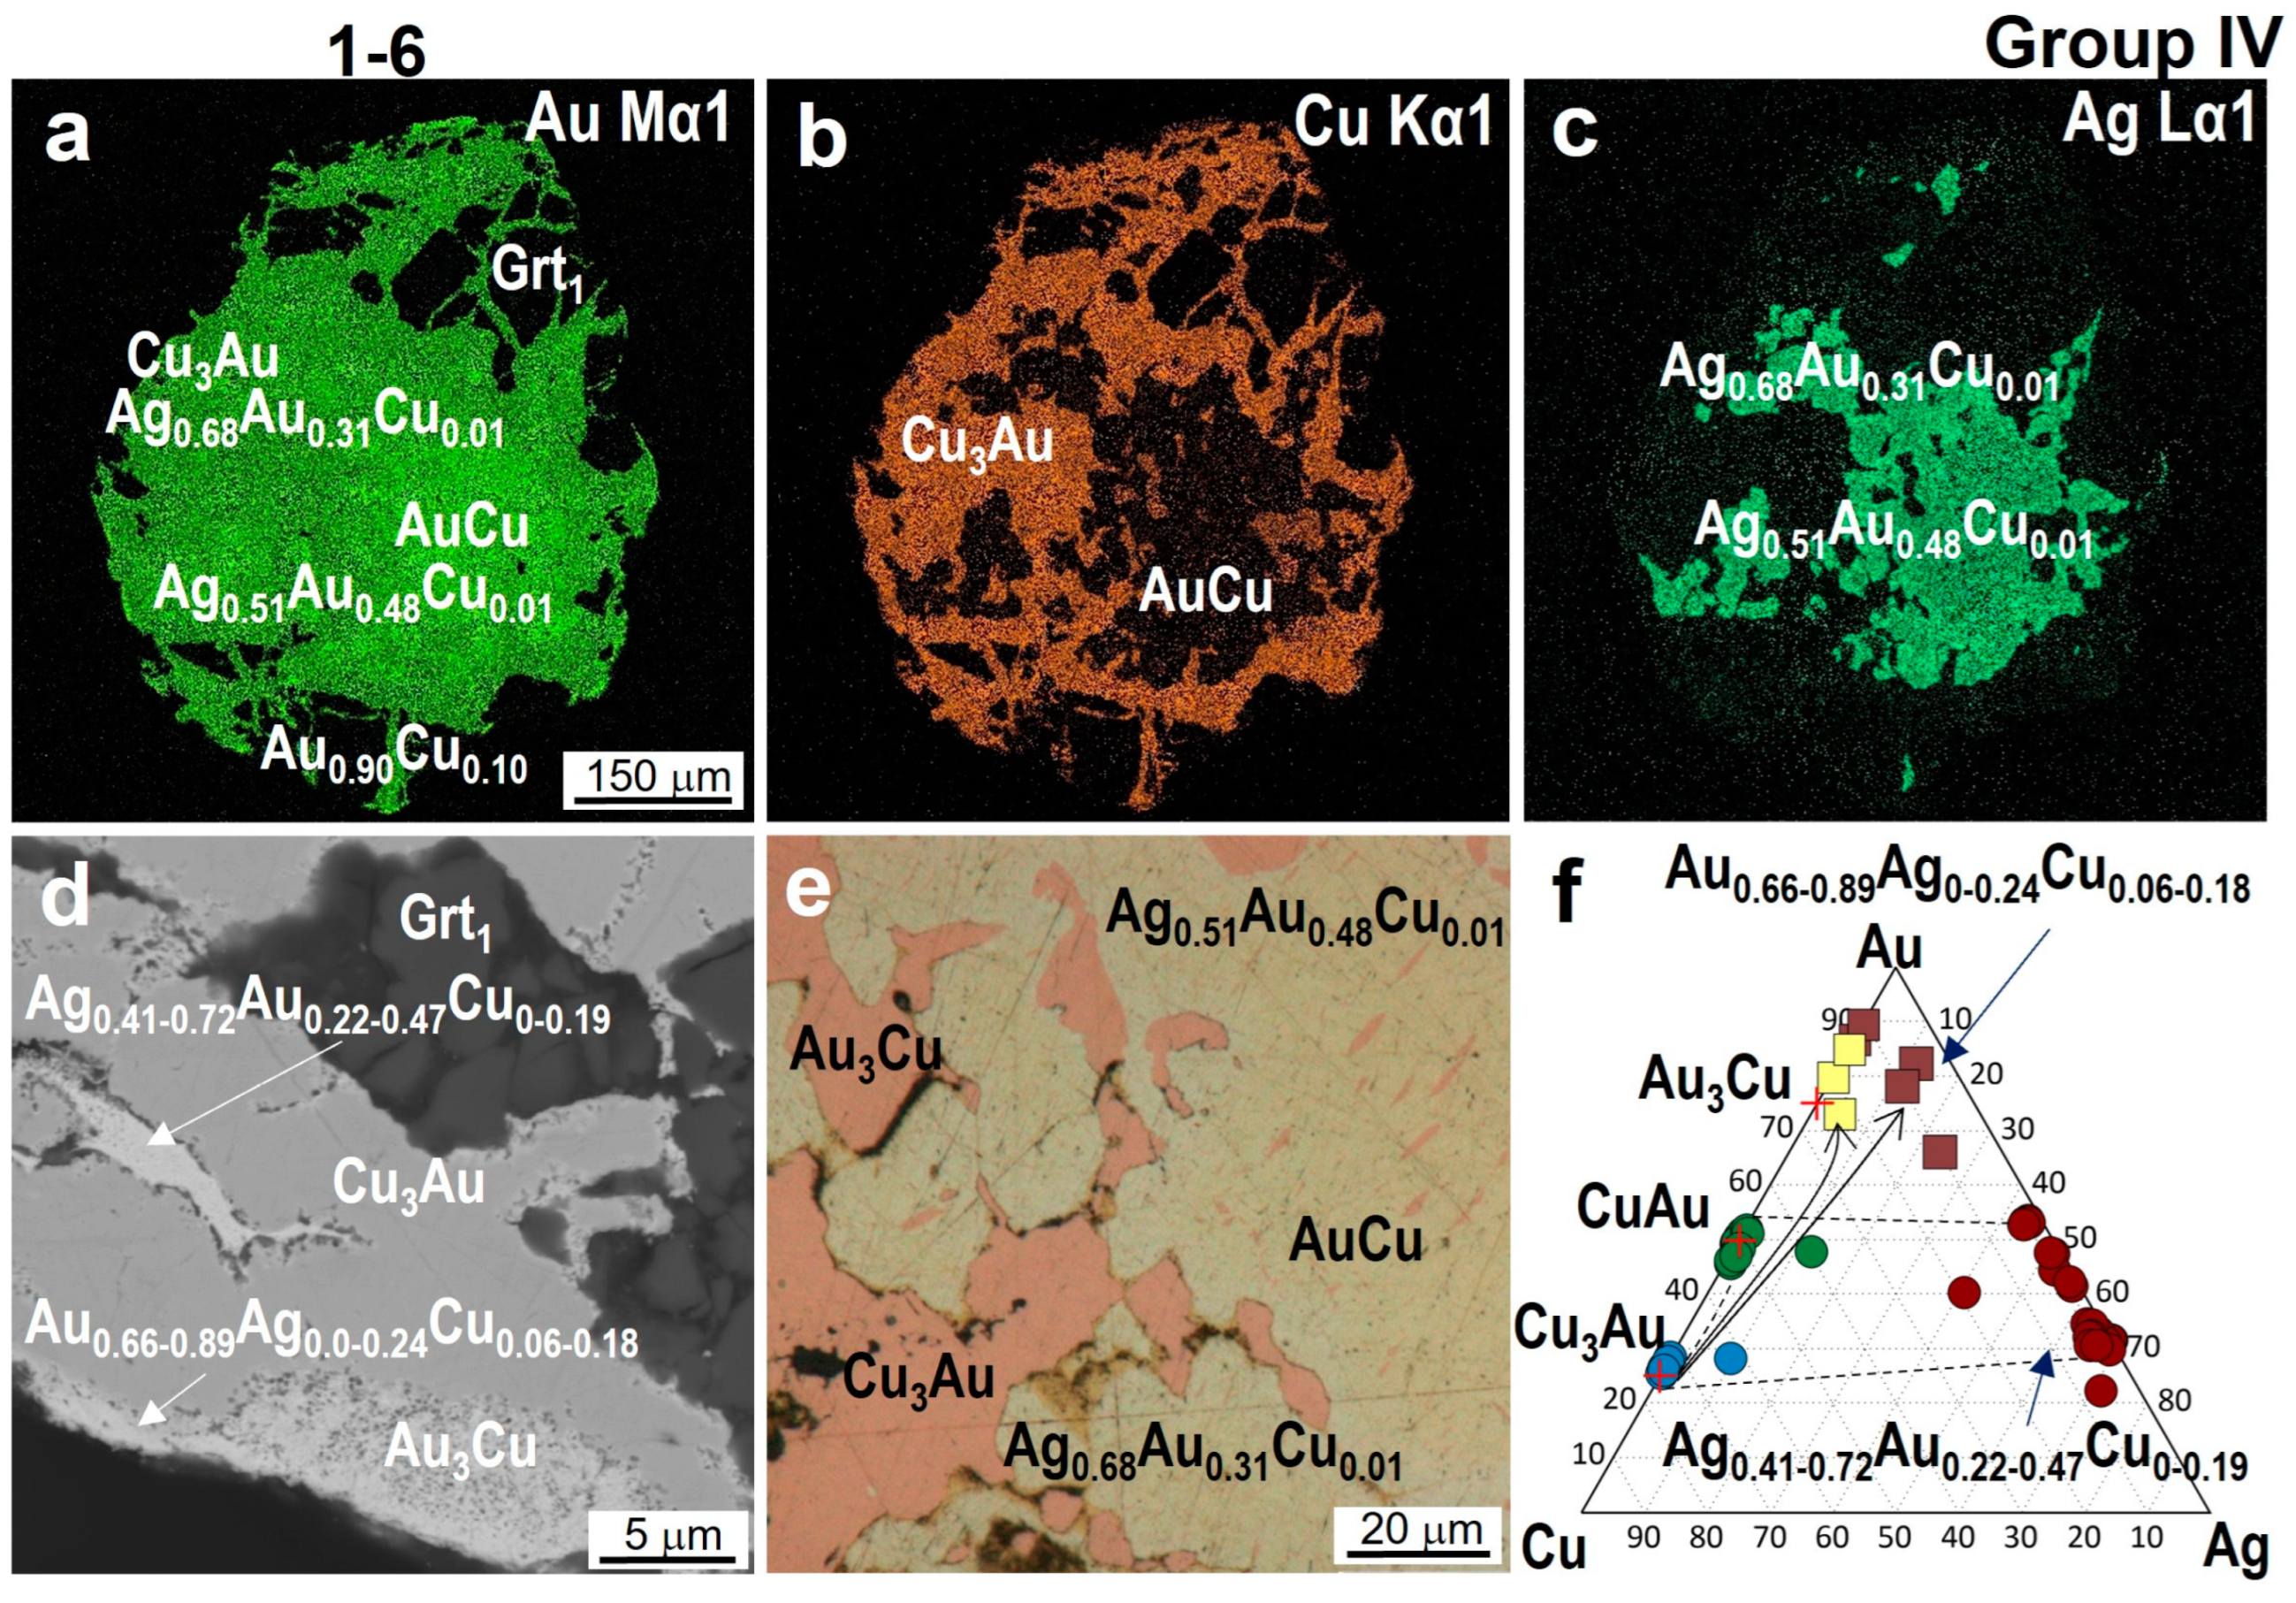
Grain 1-6 (Figure 2d and Figure 10a–c,e) has a reverse zonality in Au-Ag-Cu alloys: the central part consists of a yellow Au0.48Ag0.51Cu0.01 phase (630‰) (Table A6) containing thin lamellae of AuCu. The following white zone consists of Ag0.69Au0.31Cu0.01 alloy (fineness 440‰) with lamellae of Cu3Au. In the intermediate zone, close to the peripheral part, the Au3Cu phase is present in the form of bright-yellow micro-inclusions at the boundary with Cu3Au and the Ag-rich alloy Ag0.41–0.72Au0.22–0.47Cu<0.19 (Figure 10e). In the peripheral part, auricupride is replaced by Au3Cu and high-fineness gold, Au0.66–0.89Ag<0.24Cu0.06–0.18 (730–940‰) (Figure 13d,f). Figure 10a–c demonstrate the maps of distributions of Au, Ag, and Cu elements in grain 1–6: the core contains increased contents of Au, the intermediate part has more Ag, and in the peripheral part, Cu- and Au-rich phases without Ag are concentrated. Similar zonal structures of Au-rich and Ag-rich alloys were also observed in other grains (1-10, 7-8, 7-36).
Figure 10.
Heterogeneous structure of grain 1-6 (group IV), containing Cu3Au, AuCu, and Au-Ag-Cu alloys of different compositions: (a–c) maps of element (Au, Cu, Ag) distributions in characteristic rays; (d) BSE image of fragment; (e) optical photo of fragment; (f) compositions of mineral phases in Au-Ag-Cu diagram.
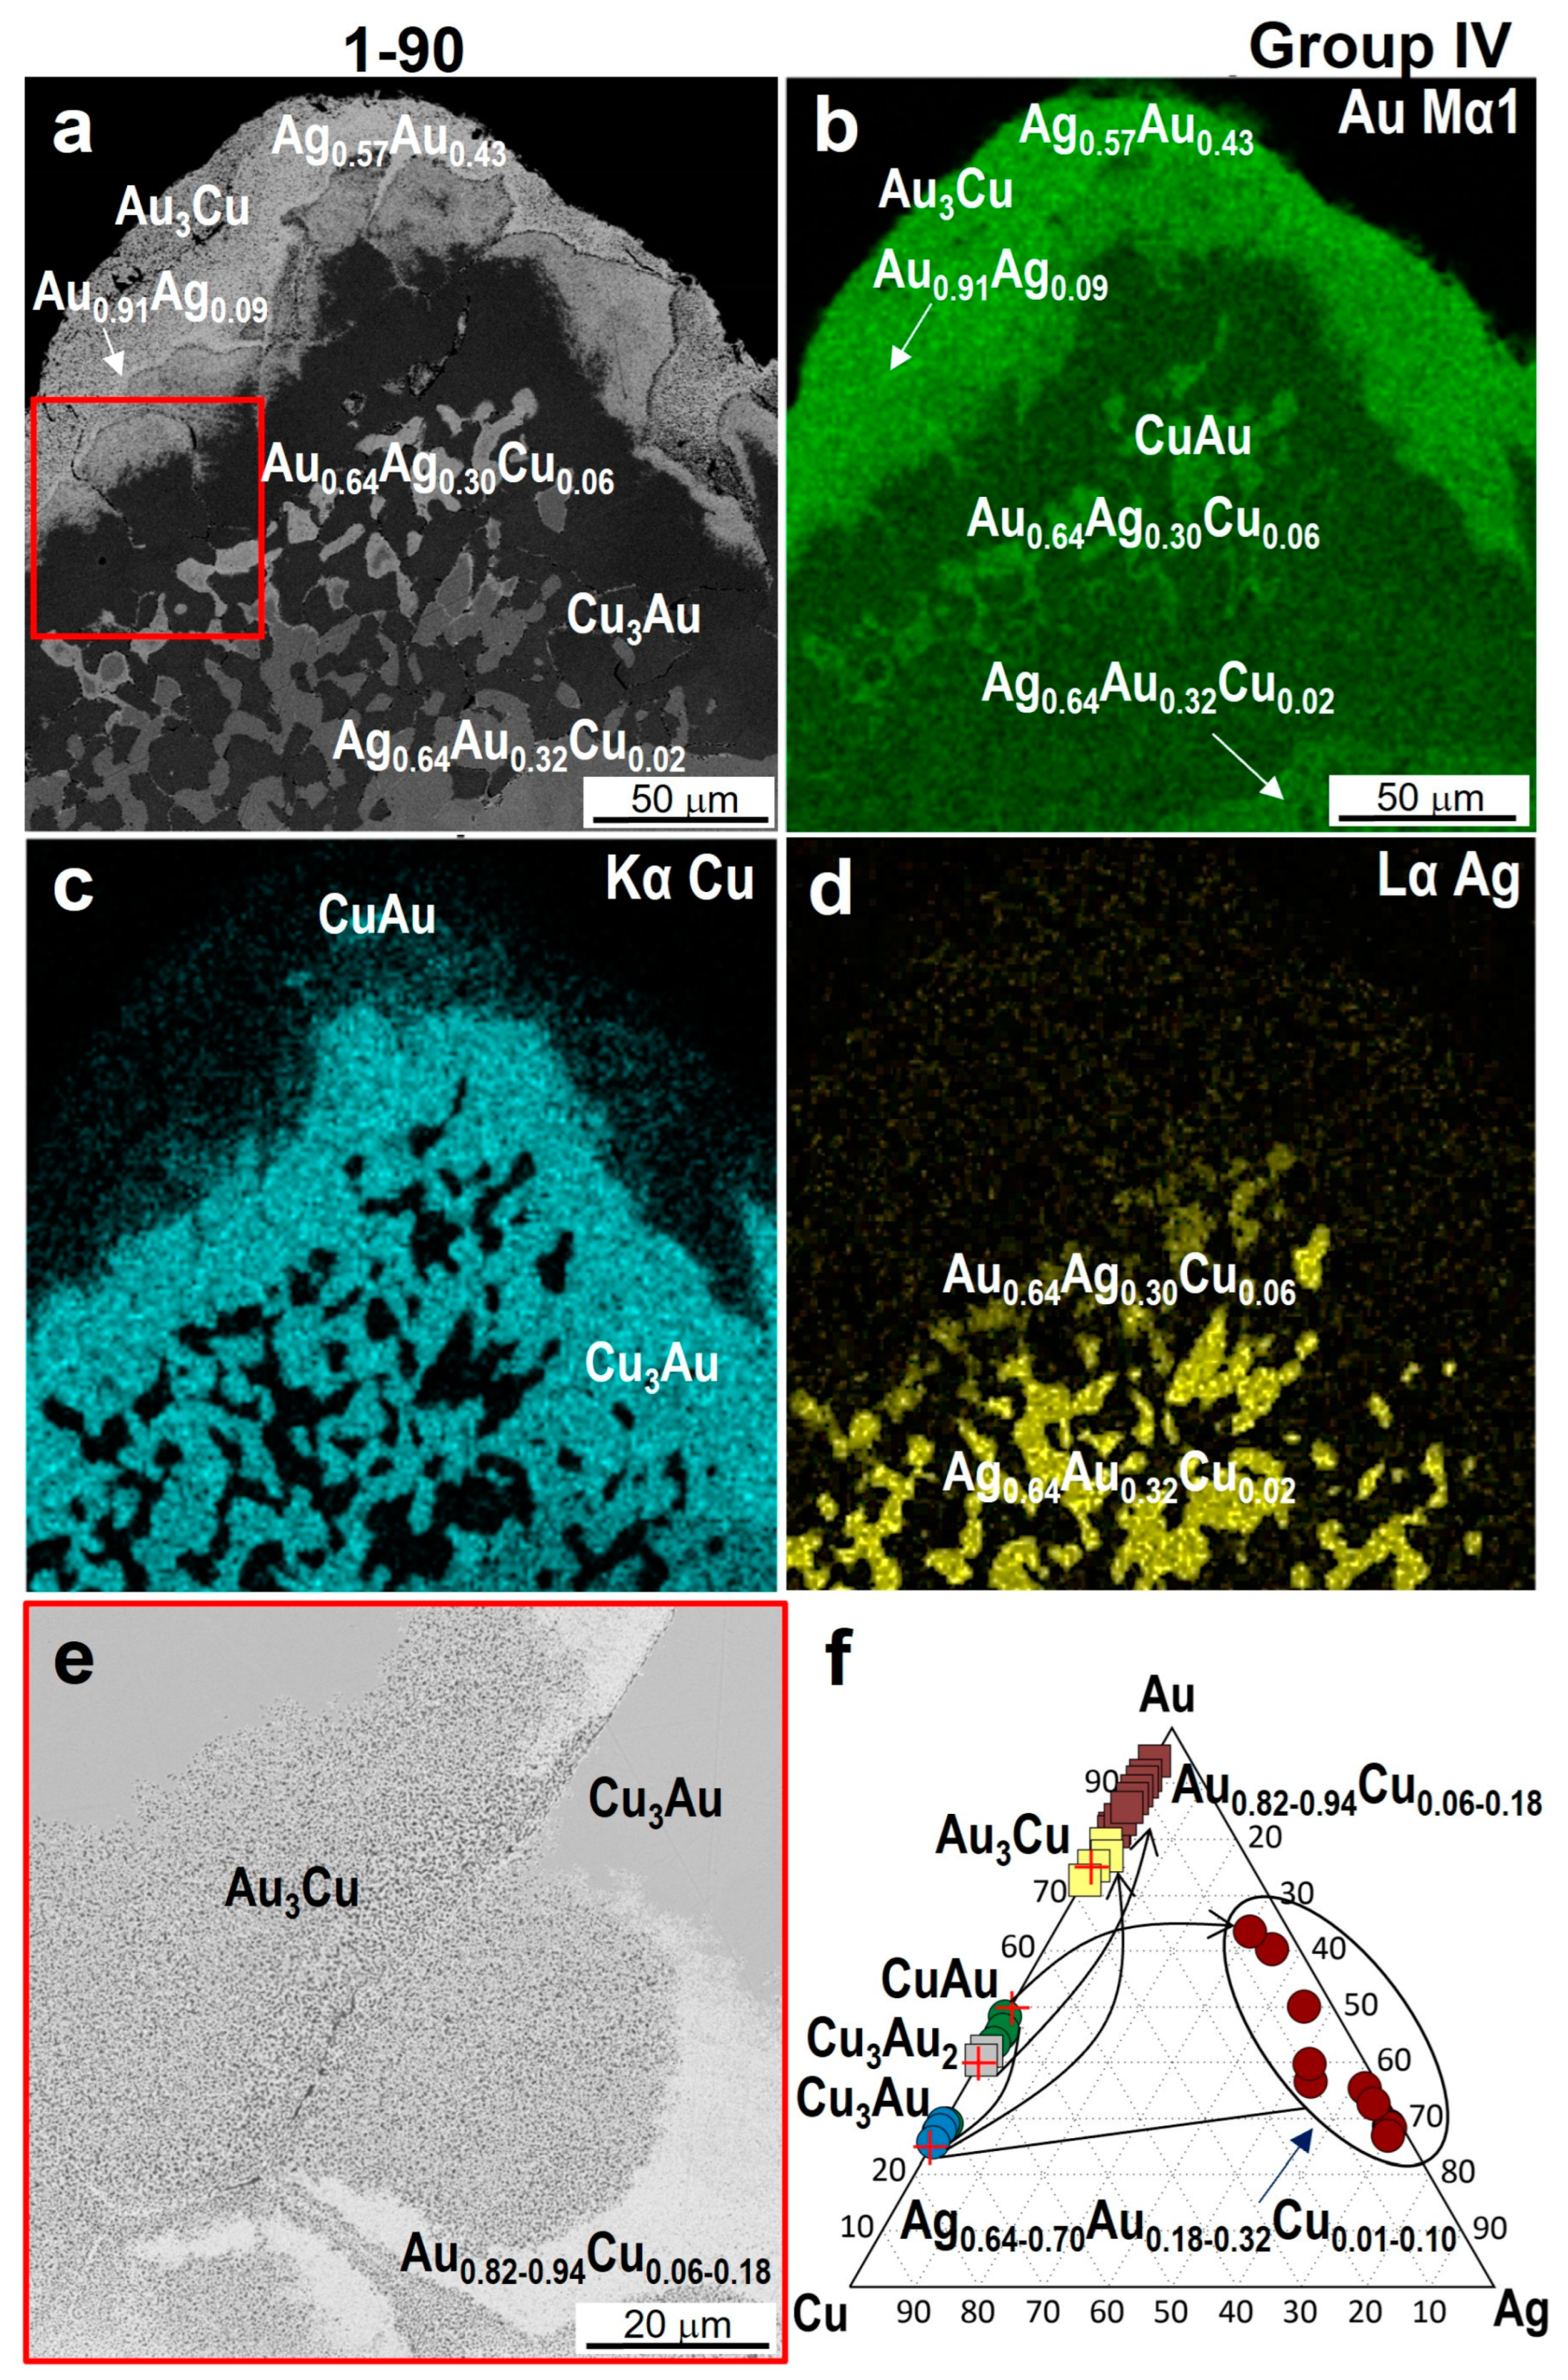
It is worth noting that the thickness of high-fineness gold rims for most of the studied grains is mainly 10–20 microns. The widest high-fineness rim of 40–50 microns is typical of 1-90 (Figure 2d and Figure 11a,b). The optical photo in reflected light (Figure 2d) shows phases that are easily distinguishable in color and composition (Table A6): copper (Cu3Au, CuAu), white (Ag0.64Au0.32Cu0.02, fineness 320‰), light yellow (Au0.64Ag0.30Cu0.06, fineness 640‰), and bright yellow (high-fineness gold Au0.91Ag0.09, fineness 905‰–990‰). Ag0.64Au0.32Cu0.02 alloy forms exsolution structures with Cu3Au in the core and is replaced by Au0.64Ag0.30Cu0.06 alloy with inclusions of CuAu. The rim is heterogeneous in composition and, in addition to high-fineness gold with the composition Au0.82–0.94Cu0.06–0.18, contains micro-inclusions of Au3Cu and borders Cu3Au (Figure 11a). Figure 11b–d show the distribution of metals over the area of this grain fragment. The largest amount of Ag is concentrated in the core, with Cu in the middle and Au in the peripheral part. Such a distribution of these metals can be related to the removal of silver and copper from the grain, which is initially represented by the products of the double decomposition of a Au-Ag-Cu solid solution: Cu3Au and Ag0.64Au0.32Cu0.02 → Au0.64Ag0.30Cu0.06 with inclusions of CuAu → Au0.82–0.94Cu0.06–0.18 + Au3Cu. The Au-Ag-Cu solid solution evidently evolved from a Ag- and Cu-rich to a Au-rich solution.
Figure 11.
BSE image of fragment of grain 1-90 (Figure 2d, IV group) with high-fineness core (a) and maps of element (Au, Cu, Ag) distributions in characteristic rays (b–d); (e)—BSE micrograph of edge fragment (red box in a); (f)—compositions of mineral phases in Au-Ag-Cu diagram (in at.%).
Figure 11.
BSE image of fragment of grain 1-90 (Figure 2d, IV group) with high-fineness core (a) and maps of element (Au, Cu, Ag) distributions in characteristic rays (b–d); (e)—BSE micrograph of edge fragment (red box in a); (f)—compositions of mineral phases in Au-Ag-Cu diagram (in at.%).
Grain 7-32 (Figure 2d and Figure 12a,b) from Group IV has an unusual structure. The Ag-rich alloy Ag0.64–0.71Au0.28–0.32Cu0.01–0.08Hg<0.02 (420‰–480‰) (Table A6) forms a rim on auricupride in the peripheral part of the grain. The core is composed of the bright-yellow alloy Au0.75–0.85Ag0.15–0.23Cu<0.03 (850‰–910‰), replaced by a compositionally similar phase of brown color and porous structure. Auricupride Cu3Au is surrounded by tetra-auricupride CuAu or a Cu1+xAu phase in the peripheral part of the grain, where chlorite is present. The mineral relationships indicate that auricupride, tetra-auricupride, and low-fineness gold are replaced by high-fineness gold with minor amounts of copper. The brown color of high-fineness gold should be due to the presence of micro-impurities of goethite or jarosite, which is proven by the presence of Fe, O, and S micro-inclusions in native gold, according to EPMA data.
Figure 12.
Heterogeneous structure of grain 7-32 (IV group): (a)—general photo; (b)—peripheral zone, high-fineness gold, surrounded by a Cu3Au rim, in tetra-auricupride (green box in a); (c)—compositions of mineral phases in Au-Ag-Cu diagram (in at.%).
Figure 12.
Heterogeneous structure of grain 7-32 (IV group): (a)—general photo; (b)—peripheral zone, high-fineness gold, surrounded by a Cu3Au rim, in tetra-auricupride (green box in a); (c)—compositions of mineral phases in Au-Ag-Cu diagram (in at.%).
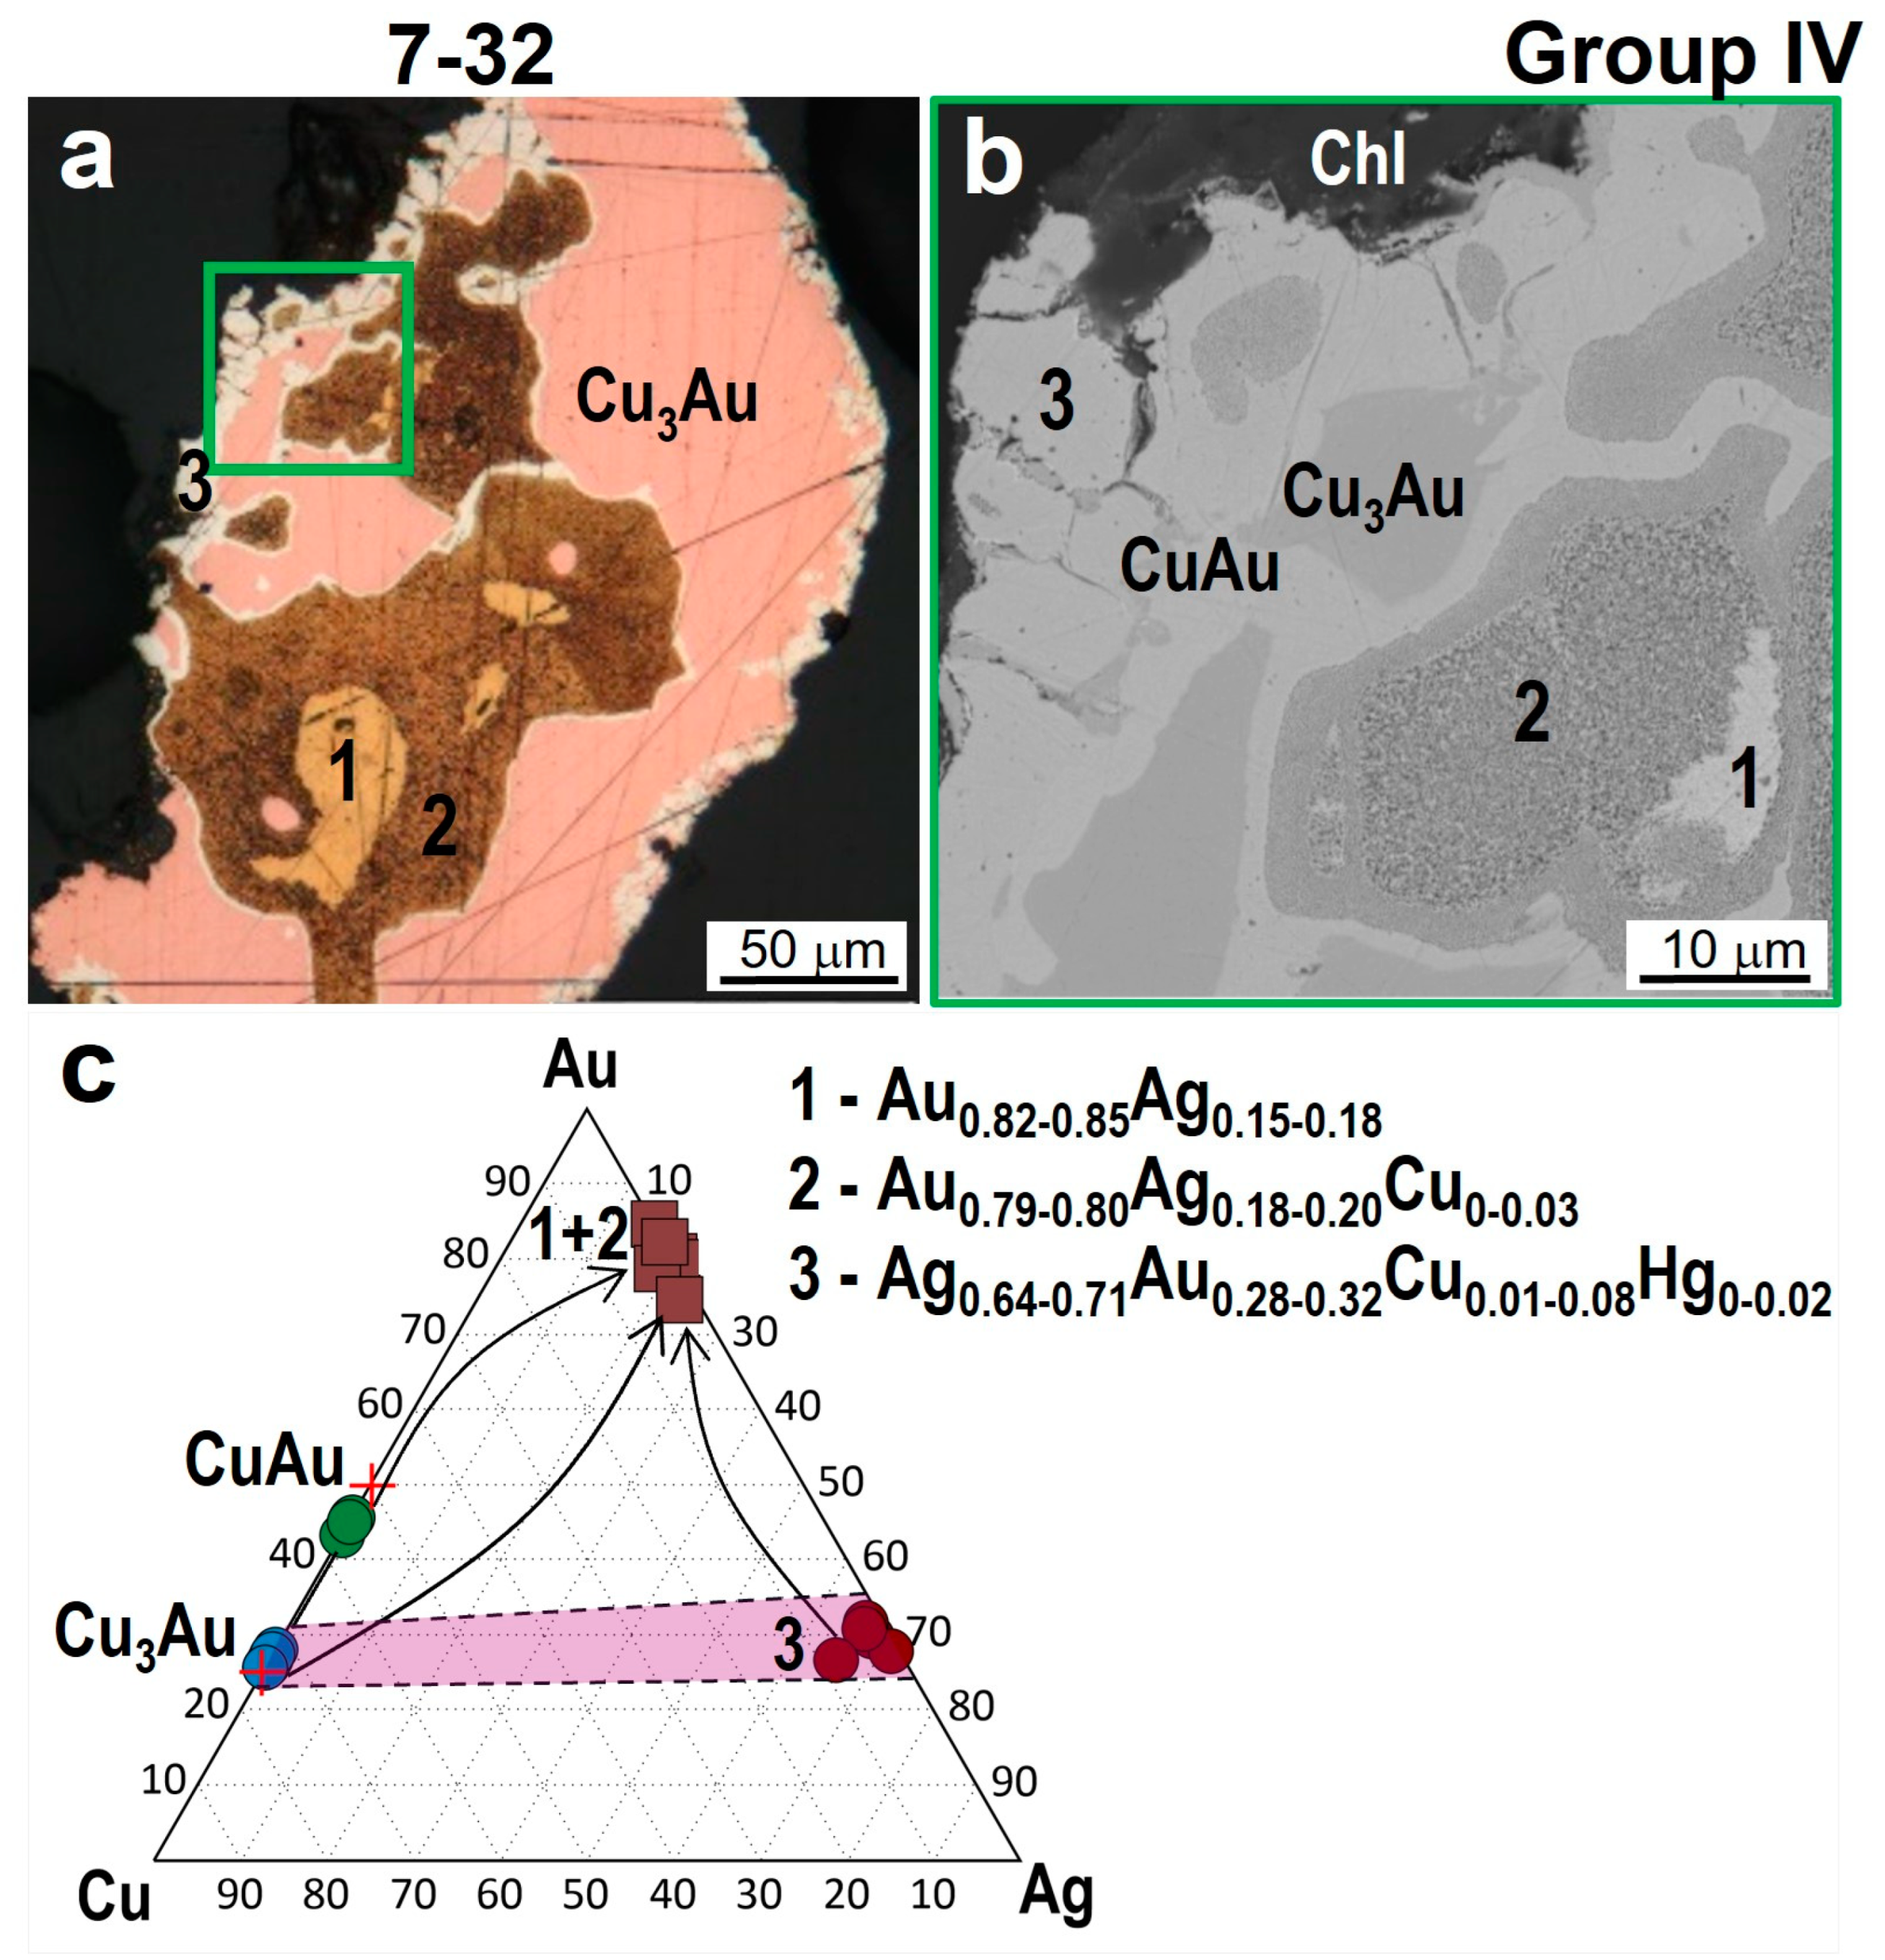
Figure 13 shows the structure of grain 7-35 (group I), which is similar to biogold. It contains spiral-like and globular segregations. Similar shapes were reported in the description of the geomicrobiology of gold [43]. The porous or mat-like structure of the periphery of gold aggregates is similar to the biomat zone [44]. The other grains (7-11, 7-31, 7-33, 7-50) have similar structures.
Figure 13.
(a–i) BSE images of biomat zones with spiral-like and globular segregations in the outer peripheral part of grain 7-35 (I group) developed along Cu3Au. They show zones of deep silver and copper leaching (lighter areas) adjoining the spongy areas of biomat development.
Figure 13.
(a–i) BSE images of biomat zones with spiral-like and globular segregations in the outer peripheral part of grain 7-35 (I group) developed along Cu3Au. They show zones of deep silver and copper leaching (lighter areas) adjoining the spongy areas of biomat development.

Six of the thirty-two studied samples occasionally contained Au-Ag-Cu particles with mercury impurities (1-7, 1-15, 1-27, 1-152, 7-8, 7-32) (Figure 2b,d). The content of Hg in these samples ranges from 1.7 to 7.5 wt.% (1 to 4.2 at.%), with the Cu content varying from 0.6 to 5.4 wt.%. Mercury-bearing micro-inclusions occur in the periphery of the grains. The presence of mercury in high-fineness cuprian gold is most likely related to hypergenic genesis [4].
4.3. Minerals in Association with Au-Ag-Cu Phases
Many studied grains, along with native Au-Ag-Cu phases, contain silicates, sulfides, oxides, hydroxides, and other minerals. On the basis of the relationships and types of intergrowths of these minerals with Au-Ag-Cu phases, earlier, syngenetic, and later minerals were identified.
Earlier minerals. The most common silicates intergrown with auricupride are pyroxene, garnet, epidote, amphibole, chlorite, and titanite. Garnet was found in several grains (1-6, 1-7, 1-145, 7-34, 7-36). Andradite garnet (Ca3Fe2Si3O12) is surrounded by auricupride in the core of grain 1-6 and is penetrated by its veins in the periphery (Figure 14a). Grain 7-34 contains grossular garnet inclusions (Ca3Al2Si3O12 with impurities of Fe < 3 wt.%) (Figure 14b) in auricupride.
Pyroxene CaMgSi2O6 (diopside) containing minor amounts of Fe, Al, Cr, and Mn is penetrated by veins of tetra-auricupride in grain 2-19 (Figure 7a and Figure 14c), which suggests the later formation of this intermetallide relative to silicate. Pyroxene of the diopside–hedenbergite series (CaMg[Si2O6]–CaFe[Si2O6]) and garnet of the andradite–grossular series (Ca3Al2Si3O12-Ca3Fe2Si3O12) in grain 1-145 (Figure 5a,g) are the earliest minerals because auricupride veinlets are located in the intergranular spaces of these minerals. Auricupride in grain 7-41 contains inclusions of titanite (CaTiSiO5) (Figure 4b).
Epidote and chlorite were identified in auricupride Cu3Au in grain 7-35 (Figure 14g). Epidote crystals are intersected by chlorite isolations. Individual crystals are arranged virtually linearly, and the ends of peripheral crystals are located in auricupride, which suggests their earlier formation relative to Cu3Au. Chlorite occurs in an intergrowth with tetra-auricupride in grain 1-7, with an irregular boundary between them (Figure 14d).
Syngenetic minerals. Some grains contain sulfides in the form of micro-inclusions in auricupride, namely, pentlandite (1-152) (Figure 14f), bornite, and galena (7-35) (Figure 14e), which are likely syngenetic to the Au-Cu intermetallide that surrounds them.
Later minerals. In many grains (7-34, 7-47, 7-26), goethite, cuprite, chalcocite, covellite, and other copper sulfides were found. These minerals occur in the periphery of the grains, and in the porous zones of Cu-Au(-Ag) phases, separate segregations are formed. For example, in the core of grain 7-47, covellite (CuS) (Figure 8d and Figure 14g), chalcocite (Cu2S), and geerite (Cu8S5) are observed, which make contact with a Au-Cu phase (Au0.82Cu0.18) with a porous structure. These hypergene mineral phases were formed after auricupride or tetra-auricupride. Several grains (1-73, 7-26, 1-15) contain goethite (Figure 3a,b and Figure 6c,g); in grain 7-26, cuprite was found in an intergrowth with high-fineness gold, and in grain 1-15, it replaced auricupride in the core of the grain. Obviously, the contact zone of silicates and Au-Ag-Cu phases was most permeable to meteoric waters, which resulted in the removal and redistribution of Au, Ag, and Cu and the formation of high-fineness rims and cuprite.
4.4. XRD Results
Three grains, 1-73, 1-90, and 7-47 (Figure 2a,c,d), were studied by powder X-ray diffractometry to identify Au-Cu intermetallides and other phases. Figure 15 shows diffractograms of the substances in peripheral fragments of these samples. Peaks of gold are present in all profiles. Sample 1-73 also contains a Cu3Au phase (auricupride), and in sample 7-47, two AuCu phases are present, which are probably two polymorphic modifications: (AuCu tetra-auricupride) (I) and (Au0.92Ag0.08)Cu (II).
The peaks of the Au3Cu phase detected by EMPA are absent in the profiles of these two samples. A possible reason is its low concentration. In grain 1-90, a fragment of a high-fineness rim containing micro-isolations with compositions of Au3Cu, Cu2Au, Cu3Au2, Au3Cu2, Au4Cu, and Au9Cu was analyzed. In the profile, only peaks of gold are present. It was impossible to obtain the peaks of these substances in diffractograms, most likely owing to the low contents of these Au-Cu phases in the studied sample or their amorphous state or structural similarity to gold. For many compositions, the last reason is the most probable. According to literature data from studies of Au-Cu intermetallic compounds in their different proportions, auricupride Cu3Au [45], tetra-auricupride AuCu [46], and Au3Cu (structural analog of bogdanovite [47]), which differ from alloys in the ordering of the atoms in their structures, can be referred to as intermetallides. At other ratios of gold and copper, these compounds are alloys whose structure is identical to that of gold (and copper) and that differ only in their scale coefficients (metric of cubic face-centered lattice) depending on the Au/Cu ratio [48].
5. Discussion
Native gold is frequently heterogeneous [1,2,38,49,50,51,52,53,54,55,56]. Its heterogeneity is formed in the process of primary crystallization or subsequent transformation in hypogenic and hypergenic environments. Under the formation conditions of placers, native gold that contains impurities undergoes corrosion, recrystallization, and purification from impurities [57,58]. Textures of gold grains may provide evidence of their origin and history [37]. Placer gold bears signs of its formation conditions before it enters the placer. Primary gold can be affected by magmatic, metamorphic, hydrothermal, sedimentary, and other processes. Under the conditions of the formation of placers, native gold undergoes changes, and new, later secondary phases appear [38,52,53,56,57,58,59]. We use phase diagrams of the Au-Cu and Au-Ag-Cu systems [60,61,62] to interpret the results on the compositions of natural phases.
5.1. The Relationships of Au-Ag-Cu Phases
Heterogeneous samples with Au-Cu-Ag minerals of different compositions (32 grains) (Figure 2) from the placers of the Olkhovaya-1 river reveal wide variations in the amounts of metals in binary phases of the Au-Cu and Au-Ag systems and the ternary phases of the Au-Cu-Ag system (Table A1, Table A2, Table A3, Table A4, Table A5 and Table A6), which reflects the complicated process of the formation of cuprian gold.
In natural systems with a long period of formation, both equilibrium and non-equilibrium processes can be observed. According to the Gibbs phase rule, a three-component system at constant temperature and pressure can have a maximum of three phases in equilibrium. Therefore, the regions of a three-phase equilibrium will be reflected in the phase diagram in the form of a triangle with vertices in the same phases. The presence of only two phases implies that this is a two-phase region. Such an equilibrium will be shown in the phase diagram by a line. If an intergrowth includes three phases, then this association is non-equilibrated. The boundaries (straight or irregular) between phases also reflect simultaneous growth, either earlier or later.
During precipitation from hydrothermal fluid, native gold is typically homogeneous. Placer gold without copper impurities usually has clearly pronounced Ag-depleted rims [1]. Au-enriched rims are well known in gold nuggets from placer deposits, and several mechanisms of their formation are known [57,58,59,63,64]. It seems reasonable to assume that Cu would be removed from the alloy in the same way as Ag [57].
The results obtained in this study provide insight into the textural characteristics of the grains, the compositions of the phases, and their relationships. The compositions of the phases of the Au-Cu system revealed in gold grains from the Olkhovaya-1 river cover virtually the whole range from pure gold to pure copper, including the intermetallides Cu3Au (auricupride), CuAu (tetra-auricupride), Au3Cu, and Cu3±xAu, Au1±xCu, and Au3±xCu (Au>>Cu) solid solutions (Table A3, Table A4, Table A5 and Table A6). Au-Cu intermetallides showed variations in the concentrations of Au and Cu, which correspond to the following formula compositions: auricupride—from Cu2.74Au1.26 to Cu3.04Au0.96; tetra-auricupride—from Cu0.94Au1.06 to Cu1.14Au0.86; and Au3Cu—from Au2.86Cu1.14 to Au3.31Cu0.69.
Au-Cu phases with the compositions Cu2Au, Cu3Au2, Au3Cu2, Au4Cu, and Au9Cu, the same as Au3Cu phases, occur in small amounts in grains (<<1 area % of grain section). They were detected in the form of micro-inclusions or segregations in high-fineness rims and veinlets in auricupride or tetra-auricupride in the periphery of many grains (Figure 2, Figure 3, Figure 4, Figure 5, Figure 6, Figure 7, Figure 8, Figure 9, Figure 10, Figure 11 and Figure 12). A detailed analysis of the high-fineness rims showed a porous structure and the formation of new microcrystal phases—Au3Cu or high-fineness Cu-bearing or pure gold (Figure 3c and Figure 4c, etc.)—which confirms their secondary genesis, which should be related to the processes of the hypergenic transformation of earlier-formed intermetallides—auricupride and tetra-auricupride and Au-Ag-Cu alloys. Figure 16 presents microprobe step-scanning profiles across two grains of group IV (1-6, 7-32), showing variations in wt.% Au, Ag, and Cu. The profiles and optical photos clearly show the relationships between tetra-auricupride, auricupride, Au-Cu, Au-Ag, and Au-Ag-Cu alloys and their sharp boundaries.
The binary Au-Cu phase diagram from [61] (Figure 17) was supplemented by the EMPA results of grains of group I (Figure 2a) and partly groups II-IV (Figure 2b–d). According to this diagram, the temperatures of Au-Cu-phase formation were below 390 °C. Auricupride was successively replaced by gold-enriched phases according to the following scheme: Cu3Au → Cu2Au → CuAu → Au3Cu2 → Au2Cu → Au3Cu → Au3+xCu (Au4Cu, Au5Cu, Au9Cu). The substitution scheme of tetra-auricupride is shorter: CuAu → Au3Cu2 → Au2Cu → Au3Cu → Au3+xCu (Au4Cu, …, Au9Cu) → Au).
The ternary Au-Cu-Ag phase diagram (Figure 18a) presents the EMPA results of phases in the exsolution structures in grains of groups IIb and IIIb (Figure 2b,c)—CuAu tetra-auricupride and Au-Cu-Ag or Au-Ag Au0.73–0.62Ag0.2–0.38Cu0<0.07 solid solutions (fineness 520‰–850‰)—and the secondary phases formed after them are located in the upper part of this diagram. Tetra-auricupride and Au-Cu-Ag and Au-Ag solid solutions are most likely equilibrated and early phases among the mineral phases of this system. The compositions of the phases in the exsolution structures in grains of groups IIa, IIIa, and IV (Figure 2b–d) are represented by auricupride or by tetra-auricupride and Au-Cu-Ag or Au-Ag phases of varying composition and fineness (Ag0.86–0.18Au0.14–0.82Cu<0.05, 160‰–850‰, Cu < 4 wt.%) (Figure 18b). Auricupride, tetra-auricupride, and alloys are replaced by Au-Cu and Au-Ag phases enriched in gold owing to the removal of silver and copper.
The compositions of the Au-Ag phases cover a wide range of Au content, from 15 to 95 wt.% (Ag0.82Au0.18–Au0.96Ag0.04, 283–978‰) (Figure 18b). The Au/Ag zoning observed in some gold particles (e.g., Figure 9c, Figure 10c,e, Figure 11a,b,d and Figure 16) may be related to their modification by fluid migration between grains [49]. The sharp contact rather than a diffusion profile between the feed phase and the product phase is a feature of coupled dissolution–reprecipitation (CDR) reactions [65].
The composition of Au-Ag-Cu particles in grains falls into the gold-rich part of the Au-Ag-Cu phase diagram, the region bounded by ≈Au3Cu–Au–≈Au0.73Ag0.20Cu0.07 (850‰), or near the sides of the Au-Ag triangle. The Au-Ag phases with the highest contents of silver are typical of some grains (Table A3, Table A4, Table A5 and Table A6). The maximum silver content in Au-Ag phases in the intergrowth with auricupride is 86.29 wt.%, with a copper content of no more than 6.3 wt.%. Figure 18b shows that copper impurities in the Au-Ag solid solution do not exceed 25 at.%.
Figure 19 illustrates the dependence of the amounts of silver on gold in Au-Cu(-Ag) phases. It is worth noting that, in most analyses, the content of Ag in these phases was below the limit of sensitivity of EPMA. The results of other analyses show that with an increase in the gold concentration in the composition of Au-Cu phases, silver contents also increase: Ag is no more than 1 wt.% in Cu3±xAu phases, <2 wt.% in Cu1±xAu, and <4 wt.% in Au3±xCu.
Figure 20 illustrates the section for 300 °C from [62], which represents single-phase regions (CuAu3, CuAu I, CuAu II—intermetallides; α′, α″, α—solid solutions), regions of two-phase equilibria, and wedge-shaped regions of three-phase equilibria occupying a position between the regions of two-phase equilibria. The EPMA results of the Au, Cu, and Ag phases in grains of groups II–IV (Figure 2b–d) are shown in this diagram. The boundaries of single-phase and two-phase regions, obtained in [62] for 300 °C, agree well with the results of studies of natural samples.
We did not observe three-phase equilibria in the studied samples. The relationships between phases of different compositions in the Au-Cu-Ag system were studied earlier using the data on cuprian gold from the 15 Mile showing and Wheaton Creek placers in Canada [8,9], Zolotaya Gora [21,22] and Chudnoe deposits [11,12,23,55], and the Kondor Massif in Russia [32]. Knight and Leitch (2001) [9] reported that the three-phase region is located among AuCu (Au1.0Cu0.971Ag0.003), Au2Cu (Au2.0Cu0.962Ag0.045), and Au3.0Ag0.71Cu0.23, whereas the two-phase region is between Au2Cu and Au3.0Ag0.71Cu0.23. The three-phase region with these minerals in the Au-Cu-Ag system was identified by Onishchenko and coauthors (2020) [11] in their study of cuprian gold from the Chudnoe deposit (Prepolar Urals, Russia). These researchers carried out the most thorough study of the Au3Cu phase with a variable composition of 23.9–29.6 at.% and determined that at a copper content of more than 30 at.%, it decomposes into AuCu and Au phases. Onishchenko and Kuznetsov (2022) [12] refined the phase diagram in the gold-rich region of the Au (100 at.%)–Ag (50 at.%)–Cu (50 at.%) system for low temperatures. They showed that a homogeneous Au-Ag-Cu solid solution with a decrease in temperature, depending on its composition, remains either homogeneous or decomposes into two phases—(1) Cu3Au and Au–Ag solid solution or (2) AuCu and Au-Ag solid solution—or into three phases: (3) Au3Cu, AuCu, and Au–Ag solid solution.
The results obtained in our work showed that the Au3Cu phase and other Au-Cu phases with high gold concentrations have a hypergenic genesis. They formed after auricupride and tetra-auricupride.
5.2. Genesis of Cuprian Gold
The heterogeneity of grains in the heavy concentrates from the Olkhovaya-1 river suggests complex crystallization processes of the primary Au-Ag-Cu solid solution, the ordering of formed phases of various compositions, and their further hypergenic transformation.
Kepezhinskas et al. [66] suggested a high-temperature (>900 °C) origin for Cu-Ag-Au intermetallic compounds in Avachinsky xenoliths. Au-Ag-Cu alloys (1–4 μm in size; Cu content varies in the range 6–39.3 and Ag in 3.9–9.5 in wt.%) are commonly observed as elongated, curved, and equant inclusions in primary-textured olivine and orthopyroxene, metasomatic amphibole, and discrete euhedral to anhedral particles localized along the boundaries between primary orthopyroxene and olivine and metasomatic orthopyroxene and amphibole. Compositionally similar Cu-Ag-Au intermetallides were also reported from the high-temperature fumaroles of the active Kudryavy volcano (Kurile Islands) with directly measured gas and gas condensate temperatures in excess of 650 °C [67]. Gold-bearing assemblages in Kudryavy high-temperature condensates (650–870 °C) are closely associated with Na-K-chlorides, while Cu-Ag-Au compounds in low-temperature vents (<650 °C) are related to the activity of sulfur species, reflecting not only a decrease in temperature but also a change in fluid composition in active volcanic conduits. Halogenides (mostly chlorides) are also associated with Cu-Ag-Au intermetallic compounds in subduction-related ultramafic rocks from the Stanovoy suture zone in Far East Russia [68]. Kepezhinskas et al. (2020) [68] suggest that these alloys in the mantle wedge beneath south Kamchatka were formed at temperatures in excess of 900 °C in the presence of chlorine-bearing fluids and hydrous silicate melts. Cu-Ag-Au microspherules were detected in the ores, in mafic to felsic explosive breccias and tuffs, and in associated basaltic and carbonatite-like rocks from the Poperechny, Kostenga, and Kaylan Fe-Mn deposits in the Jewish Autonomous Region of the Russian Far East [69].
Au-Cu-Ag primary ore mineralization from the Olkhovaya-1 river could have formed with the participation of Au,Ag,Cu-bearing fluids. As a result of postmagmatic processes, including serpentinization, Au-Cu(-Ag) solid solutions could have formed and then decomposed at appropriate temperatures (Figure 17 and Figure 20). In Figure 20, the blue dotted line shows the equilibrium of solid phases with the melt at 800 °C in the Au-Cu-Ag system. The absence of drop-shaped metal phases in the studied samples suggests that the Au-Cu-Ag solid solutions were formed not from a metal melt but at a lower temperature with the participation of Au,Ag,Cu-bearing fluids. According to data from [62], the liquid phase appears in equilibrium with the α′ and α″ phases at 767 °C, the minimum solidus temperature in this ternary system. Minerals of the Au-Cu-Ag system in grains from the Olkhovaya-1 river contain relics of minerals of primary (gabbroids and ultrabasic rocks) and altered bedrocks—garnet, pyroxene, titanite, chlorite, and epidote. The formation of these silicates indicates a high-temperature magmatic–hydrothermal stage. When temperatures decreased to 390–410 °C, Au-Ag-Cu solid solutions decomposed to form Au-Cu intermetallic compounds and Au-Ag alloys.
In grains that lack decay structures and contain low-fineness Au-Ag alloys in the center surrounded by Cu3Au (Figure 2a), the involvement of Au,Ag-rich fluids followed by Cu-rich fluids can be assumed. There are two possible mechanisms for the formation of various Cu-Au-Ag alloys: one is controlled by the composition of the fluid, and dissolution and redeposition occur, and the other is a consequence of the decomposition products of the Au-Ag-Cu solid solution. The presence of zonal structures of Au-Ag alloys of different compositions in many samples (Figure 2) can indicate non-equilibrium processes and a drastic change in crystallization conditions and Au/Ag/Cu ratios in fluids [17,18,24,58].
The formation of high-fineness gold is related to the impact of epigenetic aqueous solutions on Au-Ag-Cu alloys that underwent decomposition. These processes co-occur with the removal of copper and silver from primary phases—auricupride, tetra-auricupride, and low-fineness alloys of various compositions—accompanied by a significant increase in gold in newly formed phases and resulting in the porous structure of secondary phases. According to experimental data of Marshakov et al. (1988) [70], homogeneous Ag–Au and Cu-Au alloys undergo the anodic selective dissolution of silver and copper, but gold remains insoluble in most media. The post-hypogene modification of particles and the formation of a Au-rich rim can then occur in supergene environments in processes related to the selective leaching of Ag and other trace elements from the rim zone with dissolution-precipitation (cementation), as proposed by Groen et al. [57].
In the periphery and inner parts of grains in the intergranular space of Au-Ag-Cu phases, hypergenic minerals (goethite, cuprite, chalcocite, covellite, and others) were identified. The presence of porous zones characterized by compositions similar to Au3Cu (fineness 880‰) and containing micro-inclusions and veinlets of the Au-rich phases Au4Cu and Au9Cu (or Au3+xCu) (fineness 930‰–960‰) (Figure 3; Table A3) at the boundaries with auricupride most likely suggests its dissolution, the removal of copper, recrystallization, and redeposition with the formation of gold-rich Au-Cu phases. Uncommon structures of hypergenic high-fineness gold, which are similar to biogold, suggest the participation of bacteria in the hypergenic stage.
5.3. Source of Au-Cu-Ag Mineralization
The weak pelletizing of grains and the presence of thin rims <20 µm with high-fineness gold or pure gold suggest that they traveled only a short distance. Based on the geologic data from [39] and the obtained results on the composition of minerals present in the studied grains, we assume that the probable source of cuprian gold from the placers of the Olkhovaya-1 river is situated in the upper reaches of the water courses that erode the polymictic serpentinite melange zone to the east from the ultrabasic massif of Mount Soldatskaya (Figure 1). This zone is represented by a serpentinite matrix with blocks of gabbroids, ultrabasic rocks, flints, argillites, and other rocks. Olivine clinopyroxenites from the melange zone contain sulfides with micro-inclusions of complex compositions (PGE, Cu, Au, Ag, Te, Hg) [41].
Another possible source of Au, Cu, and Ag mineralization may be olivine websterite [40], the bedrock outcrops of which were found on the northern slope of Mount Golaya in an area of 100 × 100 m2 among the harzburgites of the ultramafic massif of Mount Soldatskaya (Figure 1). Ore mineralization in olivine websterites is represented by native copper, platinum-bearing copper, native gold, pentlandite, bornite, troilite, and Fe-Ni sulfide phases with high copper content. Micro-inclusions (1–3 μm) of high-fineness gold (880‰–970‰), occasionally with admixtures of copper and mercury, found in orthopyroxenes of olivine websterites, confirm this assumption. A genetic connection of cuprian gold with ultramafic rocks is also indicated by the findings of native copper intergrown with pyroxenes in them.
6. Conclusions
- The study of the decomposition structures of solid solutions in grains from the Olkhovaya-1 river revealed that Au-Cu-Ag solid solutions decompose to form two two-phase mineral parageneses: (1) auricupride (Cu3Au) + Ag0.86–0.67Au0.09–0.33Cu<0.05 (160‰–480‰) and (2) tetra-auricupride (CuAu) + Au0.73–0.62Ag0.2–0.38Cu<0.07 (520‰–850‰).
- One possible mechanism for the formation of various Cu-Au-Ag alloys is controlled by the fluid composition, while the other is the result of the decomposition products of the Au-Ag-Cu solid solution.
- Au-Cu and Au-Cu-Ag phases, formed after auricupride and tetra-auricupride and containing high concentrations of gold—Au3Cu2, Au2Cu, and Au3Cu up to high-fineness Cu,Ag-containing gold (930‰–980‰)—occur in supergene environments in processes related to the selective leaching of Ag and Cu from the rim zone with dissolution–precipitation. The Au3Cu phase and other gold-rich phases appear to be isostructural with gold.
- The presence of thin rims with high-fineness gold in the grains suggests that the distance of their transfer cannot be significant. Mineral inclusions—silicates (pyroxene, garnet, chlorite, epidote, and titanite)—in the Au, Cu, and Ag particles indicate a genetic connection with ultramafic rocks. The probable source of Au-Ag-Cu minerals of the Olkhovaya-1 river placers is located in the upper reaches of water courses that erode the ultrabasic massif of Mounts Soldatskaya and Golaya (Kamchatka Cape Peninsula).
Author Contributions
Conceptualization, G.A.P.; methodology, G.A.P.; formal analysis, G.A.P., T.V.B. and Y.V.S.; investigation, G.A.P., T.V.B. and Y.V.S.; resources, D.P.S.; data curation, G.A.P., T.V.B. and Y.V.S.; writing—original draft preparation, G.A.P.; writing—review and editing, G.A.P., T.V.B., Y.V.S. and D.P.S.; visualization, T.V.B., G.A.P., Y.V.S. and D.P.S.; supervision, G.A.P.; project administration, G.A.P. All authors have read and agreed to the published version of the manuscript.
Funding
This research was carried out within the framework of the state assignment of the Sobolev Institute of Geology and Mineralogy of the Siberian Branch of the Russian Academy of Sciences (No. 122041400237-8) and the Institute of Volcanology and Seismology Far Eastern Branch of the Russian Academy of Sciences (No. FWME-2024-0012) financed by the Ministry of Science and Higher Education of the Russian Federation.
Data Availability Statement
Data are contained within the article.
Acknowledgments
The authors are grateful to E.G. Sidorov for samples and to N.S. Karmanov, M.V. Khlestov, K. Kanina, and V. Zinina (the Analytical Center for Multi-elemental and Isotope Research in the Sobolev Institute of Geology and Mineralogy of the Siberian Branch of the Russian Academy of Sciences) for electron microprobe data. The authors thank three anonymous reviewers for their comments and suggestions, which helped to improve the manuscript.
Conflicts of Interest
The authors declare no conflicts of interest.
Appendix A

Table A1.
Summary report of representative analyses of gold particles in grain 2-19 (n—number of analyses, wt.%, NAu, formula) and phases in intergrowth.
Table A1.
Summary report of representative analyses of gold particles in grain 2-19 (n—number of analyses, wt.%, NAu, formula) and phases in intergrowth.
| Phase, n | wt.%, Min–Max/Mean | NAu, ‰ | Formula | Phases in Intergrowth | ||
|---|---|---|---|---|---|---|
| Cu | Au | Ag | ||||
| CuAu, 12 | 19.00–26.00 24.15 | 63.71–76.98 73.93 | 0.0 | 745–770 754 | Cu0.96–1.03Au1.04–0.97 | Au0.49–0.69Ag0.36–0.22Cu0.14–0.02, Au0.83–0.87Cu0.17–0.13, Au3Cu |
| Au-Cu, 3 | 4.07–6.15 5.24 | 85.68–92.42 89.48 | 0.0 | 938–955 945 | Au0.83–0.87Cu0.17–0.13 | CuAu |
| Au-Ag-Cu, 16 | 0.73–9.87 2.72 | 64.75–82.82 77.90 | 12.47–34.75 19.39 | 644–830 779 | Au0.49–0.71Ag0.48–0.22Cu0.14–0.02 | CuAu |
| Au3Cu, 2 | 8.07 | 86.41–89.44 87.93 | 0.0–0.57 0.29 | 909–917 913 | Au3.07–3.13Cu0.89–0.87Ag0.04–0.0 | CuAu |
Table A2.
Summary report of representative analyses of gold particles in grain 1-7 (n—number of analyses, wt.%, NAu, formula) and phases in intergrowth.
Table A2.
Summary report of representative analyses of gold particles in grain 1-7 (n—number of analyses, wt.%, NAu, formula) and phases in intergrowth.
| Phase, n | wt.%, (Min–Max)/Mean | NAu, ‰ | Formula | Phase in Intergrowth | ||
|---|---|---|---|---|---|---|
| Cu | Au | Ag | ||||
| CuAu, 4 | 23.78–25.85 24.55 | 73.83–74.85 74.50 | 0.0–0.51 0.13 | 737–759 751 | Cu0.99–1.03Au1.01–0.95Ag<0.02 | Au0.81–0.90Ag<0.04Cu0.19–0.08, Au0.51–0.55Ag0.43–0.38Cu0.11–0.02 |
| Cu3Au, 14 | 41.82–47.23 44.96 | 50.49–55.04 52.74 | 0.0 | 523–568 540 | Cu2.81–2.95Au1.19–1.05 | Au2Cu, Cu3Au2, Au3Cu, Au0.81–0.90Ag<0.04Cu0.19–0.08 |
| Au-Ag-Cu, 5 | 1.34–6.83 4.28 | 88.85–96.7 91.22 | 0.87–7.11 2.58 | 913–964 935 | Au0.81–0.90Ag0.06–0.12Cu0.19–0.04 | Cu3Au, CuAu |
| Au-Ag-Cu, 4 | 0.64–4.78 1.79 | 64.90–70.19 67.19 | 27.02–32.57 29.83 | 662–694 680 | Au0.51–0.55Ag0.43–0.38Cu0.11–0.02 | CuAu |
| Au3Cu, 2 | 9.00–9.67 9.34 | 82.11–90.68 86.22 | 0.0–0.78 0.39 | 887–906 900 | Au2.89–3.03Cu1.06–0.97Ag<0.05 | Cu3Au |
| Cu3Au2, 3 | 32.10–36.03 33.71 | 61.50–64.48 62.92 | 0.0 | 635–668 651 | Cu3.01–3.20Au1.97–1.80 | Cu3Au |
| Au2Cu, 1 | 14.54 | 83.00 | 2.04 | 834 | Cu1.03Au1.89Ag0.08 | Cu3Au |
Table A3.
Summary report of analyses of Au-Cu intermetallides and other phases of Au-Ag-Cu(-Hg) system in grains from placer ore occurrences of Olkhovaya-1 river. Group I—main phase Cu3Au.
Table A3.
Summary report of analyses of Au-Cu intermetallides and other phases of Au-Ag-Cu(-Hg) system in grains from placer ore occurrences of Olkhovaya-1 river. Group I—main phase Cu3Au.
| N Block-Grain | Cu3Au | Au3Cu | Cu3Au2, Au3Cu2, Au4Cu, Au9Cu | Au-Ag | Au-Ag-Cu |
|---|---|---|---|---|---|
| 1-73 | Cu2.95–2.98Au1.05–1.02 | Au2.82Cu1.18 | Au0.82–0.90Cu0.18–0.10 | - | - |
| 7-50 | Cu2.98–3.00Au1.02–1.00 | - | Cu2.86Au2.14 Au2.99Cu2.01 | - | - |
| 7-35 | Cu2.99–3.01Au1.01–0.99 | Au3.14–3.17Cu1.86–1.83 | Au0.87Cu0.13 | Au | Ag0.72–0.85Au0.23–0.15Cu<0.11 |
| 7-31 | Cu3.01–3.02Au0.99–0.98 | Au2.88–2.96Cu1.12–1.04 | - | Au0.96Ag0.04 | Au0.95–0.96Ag0.03Cu0.01–0.02 |
| 7-33 | Cu3.00Au1.00 | - | - | - | Au0.89Ag0.07Cu0.03 |
Table A4.
Summary report of analyses of Au-Cu intermetallides and other phases of Au-Ag-Cu(-Hg) system in grains from placer ore occurrences of Olkhovaya-1 river. Group IIA—main phases Cu3Au + Ag-Au alloys; group IIB—main phases CuAu + Ag-Au alloys.
Table A4.
Summary report of analyses of Au-Cu intermetallides and other phases of Au-Ag-Cu(-Hg) system in grains from placer ore occurrences of Olkhovaya-1 river. Group IIA—main phases Cu3Au + Ag-Au alloys; group IIB—main phases CuAu + Ag-Au alloys.
| N Block-Grain | Cu3Au/ CuAu | Au3Cu | Cu2Au, Au3Cu2, Au2Cu, Au4Cu | Au-Ag(-Hg) | Au-Ag-Cu(-Hg) |
|---|---|---|---|---|---|
| Group IIA (main phases Cu3Au + Ag-Au alloys) | |||||
| 7-41 | Cu2.93–2.98Au1.07–1.02 | Au3.00Cu1.00 | - | - | Ag0.58–0.66Au0.37–0.32Cu0.02–0.05 |
| 7-51 | Cu2.74–2.93Au1.26–1.07 | - | - | Ag0.69Au0.31 | Ag0.68–0.69Au0.28–0.31Cu0.01–0.04 Au0.86–0.91Ag0.06–0.0Cu0.05–0.09 |
| 1-15 | Cu2.90–2.95Au1.10–1.05 | - | Cu1.89–1.99Au1.11–1.01 | Ag0.73Au0.24Hg0.03 | - |
| 1-146 | Cu2.96Au1.04 | - | - | - | Au0.70Ag0.27Cu0.03 |
| 1-27 | Cu2.88–2.96Au1.12–1.04 | - | Au0.80Cu0.20 | Ag0.74Au0.24Hg0.02 | |
| 7-5 | Cu2.98Au1.02 | - | - | - | Ag0.67–0.66Au0.32Cu0.01–0.02 Au0.82–0.89Ag0.17–0.09Cu0.02 |
| 7-3 | Cu3.00–3.04Au1.00–0.96 | Au2.95Cu1.05 | Au1.97Cu1.03 | - | Ag0.65–0.70Au0.33–0.27Cu0.03–0.04 Au0.79–0.81Ag0.13–0.10Cu0.08–0.09 |
| 1-152 | Cu2.99–3.02Au1.01–0.98 | - | - | - | Ag0.62–0.85Au0.3–0.09Cu0.03–0.10Hg0.02–0.04 |
| Group IIB (main phases CuAu + Ag-Au alloys) | |||||
| 1-145 | /Cu0.94–1.12Au1.06–0.88 | Au2.94Cu1.06 | Au2.91Cu2.09 | - | Ag0.64–0.65Au0.35–0.33Cu0.01–0.02 Au0.87–0.98Cu0.11–0.02Ag<0.03 |
Table A5.
Summary report of analyses of Au-Cu intermetallides and other phases of Au-Ag-Cu(-Hg) system in grains from placer ore occurrences of Olkhovaya-1 river. Group IIIA—main phases Cu3Au + Au-Ag alloys; group IIIB—main phases CuAu + Au-Ag alloys.
Table A5.
Summary report of analyses of Au-Cu intermetallides and other phases of Au-Ag-Cu(-Hg) system in grains from placer ore occurrences of Olkhovaya-1 river. Group IIIA—main phases Cu3Au + Au-Ag alloys; group IIIB—main phases CuAu + Au-Ag alloys.
| N Block-Grain | Cu3Au/CuAu | Au3Cu | Cu2Au, Au3Cu2, Au4Cu, … | Au-Ag | Au-Ag-Cu(-Hg) |
|---|---|---|---|---|---|
| Group IIIA (main phases Cu3Au + Au-Ag-Cu alloys) | |||||
| 7-7 | Cu2.83–2.85Au1.17–1.15 | - | - | - | Ag0.68–0.70Au0.29–0.27Cu<0.01Hg<0.01 Au0.63Ag0.32Cu0.05 |
| 1-183 | Cu2.99–3.00Au1.01–1.00 | - | - | Au0.82Ag0.18 | Ag0.54–0.62Au0.44–0.38Cu0.01–0.04 Au0.62–0.69Ag0.35–0.29Cu0.01–0.09 |
| 1-23 | Cu3.00–3.06Au1.00–0.94 | - | Cu1.93Au1.07 | - | Au0.73–0.76Ag0.18–0.05Cu0.08–0.22 |
| 1-184 | Cu2.79–3.01Au1.21–0.99 | - | - | - | Au0.73–0.82Ag0.16–0.05Cu0.12–0.13 |
| 7-26 | Cu2.98–3.04Au1.02–0.96 | Au2.86–3.18Cu1.14–0.82 | Au2.88–3.11Cu2.18–1.89 | Au | Au0.84–0.90Ag0.04–0.03Cu0.07–0.12 |
| Group IIIB (main phases CuAu + Au-Ag alloys) | |||||
| 7-47 | /Cu0.99–1.02Au1.01–0.98 | Au3.28–3.31Cu0.72–0.69 | Au0.83–0.97Cu0.17–0.03 | - | Au0.40–0.53Ag0.59–0.44Cu0.01–0.03 |
| 1-64 | /Cu0.90–0.92Au1.10–1.08 | Au1.81Cu1.02Ag0.16 Au0.98–0.99Cu0.02–0.01 | - | Au0.67–0.73Ag0.20–0.14Cu0.07–0.19 | |
| 2-19 | /Cu0.90–1.03Au1.10–0.97 | Au3.07–3.13Cu0.93–0.87 | Au0.83–0.87Cu0.17–0.13 | - | Au0.49–0.69Ag0.36–0.22Cu0.02–0.14 |
Table A6.
Summary report of analyses of Au-Cu intermetallides and other phases of Au-Ag-Cu(-Hg) system in grains from placer ore occurrences of Olkhovaya-1 river. Group IV—main phases Cu3Au + CuAu + Au-Ag alloys + Au-Ag-Cu(-Hg) alloys.
Table A6.
Summary report of analyses of Au-Cu intermetallides and other phases of Au-Ag-Cu(-Hg) system in grains from placer ore occurrences of Olkhovaya-1 river. Group IV—main phases Cu3Au + CuAu + Au-Ag alloys + Au-Ag-Cu(-Hg) alloys.
| N Block-Grain | Cu3Au | CuAu | Au3Cu | Cu3Au2, Au3Cu2, Au2Cu, Au4Cu, … | x in AuxAg1-x | Au-Ag-Cu(-Hg) |
|---|---|---|---|---|---|---|
| 1-7 | Cu2.81–2.95Au1.19–1.05 | Cu0.99–1.05Au1.01–0.95 | Au3.02Cu0.98 | Au0.81Cu0.19 Cu3.12–3.48Au1.88–1.52 | - | Au0.82–0.90Ag0.12–0.01Cu0.04–0.16 |
| 1-6 | Cu2.86–3.01Au1.14–0.99 | Cu0.94–1.04Au1.06–0.96 | Au3.19Cu0.81 | - | 0.82–0.90 | Au0.66–0.89Ag<0.24Cu0.06–0.18 Ag0.51Au0.48Cu0.01 Ag0.72–0.41Au0.22–0.47Cu0<0.19 |
| 1-10 | Cu2.71–2.95Au1.29–1.05 | Cu1.08–1.03Au0.92–0.97 | Au2.89–3.09Cu1.11–0.91 | Au0.96–0.98Cu0.04–0.02 Au2.94Cu2.06 | 0.92–0.93 | Ag0.60–0.68Au0.32–0.30Cu0.01–0.10 Au0.90–0.94Ag0.04–0.02Cu0.02–0.08 |
| 1-90 | Cu2.82–2.97Au1.18–1.03 | Cu0.90–0.97Au1.03–1.10 | Au2.96–3.18Cu1.04–0.82 | Au0.82–0.94Cu0.18–0.06 | 0.91 | Au0.64Ag0.30Cu0.06 Ag0.64–0.70Au0.32–0.18Cu0.01–0.10 |
| 7-8 | Cu2.89–2.94Au1.11–1.06 | Cu0.97–1.10Au1.03–0.90 | - | Au0.85Cu0.15 | - | Ag0.45–0.67Au0.50–0.28Cu0.01–0.04Hg<0.03 |
| 7-36 | Cu2.89–2.94Au1.11–1.06 | Cu1.00Au0.99Ag0.01 | - | - | - | Au0.71Ag0.26Cu0.03 |
| 7-32 | Cu2.88–2.98Au1.12–1.02 | Cu1.09–1.14Au0.91–0.86 | - | - | 0.82–0.85 | Au0.79–0.80Ag0.18–0.20Cu0–0.03 Ag0.64–0.71Au0.28–0.32Cu0.01–0.08Hg<0.02 |
| 2-10 | Cu2.78–3.01Au1.11–0.99 | Cu1.06Au0.94–0.72Ag<0.22 | Au3.04–3.20Cu0.96–0.80 | - | 0.31–0.33 0.78–0.88 | Ag0.62–0.72Au0.32–0.26Cu0.01–0.07 Au0.78–0.86Ag0.17–0.11Cu0.02–0.10 |
| 7-34 | Cu2.81–2.91Au1.19–1.09 | Cu1.01–1.09Au0.99–0.91 | Au3.01Cu0.91Ag0.07 | Au0.87Cu0.13 | - | Ag0.57–0.59Au0.39–0.38Cu0.03–0.04 |
| 1-182 | Cu2.99–3.01Au1.01–0.99 | Cu0.89–0.97Au1.11–1.03 | - | Cu2.35–3.18Au1.95–1.62Ag<0.18 | - | Ag0.70–0.81Au0.26–0.14Cu0.03–0.07 |
References
- Petrovskaya, N.V. Native Gold; Nauka: Moscow, Russia, 1973; 348p. (In Russian) [Google Scholar]
- Boyle, R.W. The Geochemistry of Gold and Its Deposits; Bulletin/Geological Survey 280; Geological Survey of Canada: Ottawa, ON, Canada, 1979.
- Warr, L.N. IMA–CNMNC approved mineral symbols. Mineral. Mag. 2021, 85, 291–320. [Google Scholar] [CrossRef]
- Spiridonov, E.; Yanakieva, D. Modern mineralogy of gold: Overview and new data. Archéosciences 2009, 33, 67–73. [Google Scholar] [CrossRef]
- Razin, L.V.; Begizov, V.D. Gold-silver mineralization of the Talnakh and Oktyabrsky deposits of the Norilsk type. Geol. Ore Dep. 1973, 6, 32–42. (In Russian) [Google Scholar]
- Murzin, V.V.; Malyugin, A.A. New data on the unstability of natural solid solutions of the system Ag–Au–Cu at temperatures below 350 °C. Dokl. Akad. Nauk SSSR 1983, 269, 723–724. [Google Scholar]
- Murzin, V.V.; Malyugin, A.A. Typomorphism of Gold in the Hypergenesis Zone (on the Example of the Urals); UNC AN USSR: Sverdlovsk, Russia, 1987; 96p. (In Russian) [Google Scholar]
- Knipe, S.W.; Fleet, M.E. Gold-copper alloy minerals from the Kerr Mine, Ontario. Can. Mineral. 1997, 35, 573–586. [Google Scholar]
- Knight, J.; Leitch, C.H.B. Phase relations in the system Au–Cu–Ag at low temperatures, based on natural assemblages. Can. Mineral. 2001, 39, 889–905. [Google Scholar] [CrossRef]
- Kazachenko, V.T.; Miroshnichenko, N.V.; Perevoznikova, E.V.; Karabtsov, A.A. Mineral forms of noble metals in metal-bearing deposits of the Triassic-Jurassic carbonaceous sequence of Sikhote-Alin. Dokl. RAS 2008, 421, 383–386. [Google Scholar]
- Onishchenko, S.A.; Kuznetsov, S.K.; Tropnikov, E.M. Epigenetic alteration of cupreous gold in the Au-Ag-Cu-Pd exsolution texture. Dokl. Earth Sci. 2020, 492, 418–421. [Google Scholar] [CrossRef]
- Onishchenko, S.A.; Kuznetsov, S.K. Exsolution in the Au–Ag–Cu system in a gold-rich area. Geochem. Int. 2022, 60, 657–671. [Google Scholar] [CrossRef]
- Pandey, S.; Koch, R.J.; Li, G.; Misture, S.T.; Wang, H.; Phillpot, S.R. Thermodynamics and kinetics of ordered and disordered Cu/Au alloys from first principles calculations. J. Alloys Compd. 2019, 809, 151615. [Google Scholar] [CrossRef]
- Bonev, I.K.; Kerestedjian, T.; Atanassova, R.; Andrew, C.J. Morphogenesis and composition of native gold in the Chelopech volcanic-hosted Au-Cu epithermal deposit, Srednogorie zone, Bulgaria. Miner. Depos. 2002, 37, 614–629. [Google Scholar] [CrossRef]
- Arif, J.; Baker, T. Gold paragenesis and chemistry at Batu Hijau, Indonesia: Implications for gold-rich porphyry copper deposits. Miner. Depos. 2004, 39, 523–535. [Google Scholar] [CrossRef]
- Moles, N.R.; Chapman, R.J.; Warner, R. The significance of copper concentrations in natural gold alloy for reconnaissance exploration and understanding gold-depositing hydrothermal systems. Geochem. Explor. Environ. Anal. 2013, 13, 115–130. [Google Scholar] [CrossRef]
- Chudnenko, K.V.; Pal’yanova, G.A. Thermodynamic properties of solid solutions in the Ag–Au–Cu system. Russ. Geol. Geophys. 2014, 55, 349–360. [Google Scholar] [CrossRef]
- Chapman, R.J.; Moles, N.R.; Bluemel, B.; Walshaw, R.D. Detrital Gold as an Indicator Mineral. Geol. Soc. Spec. Publ. 2022, 516, 313–336. [Google Scholar] [CrossRef]
- Sluzhenikin, S.F.; Mokhov, A.V. Gold and silver in PGE-Cu-Ni and PGE ores of the Noril’sk deposits, Russia. Miner. Depos. 2015, 50, 465–492. [Google Scholar] [CrossRef]
- Palyanova, G.A. Gold and silver minerals in sulfide ore. Geol. Ore Dep. 2020, 62, 383–406. [Google Scholar] [CrossRef]
- Spiridonov, E.M.; Pletnev, P.A. The Zolotaya Gora Deposit of Copper-Containing Gold (Gold–Rodingite Mineralization); Nauchnyi Mir: Moscow, Russia, 2002; 220p. (In Russian) [Google Scholar]
- Murzin, V.V.; Chudnenko, K.V.; Palyanova, G.A.; Varlamov, D.A.; Naumov, E.A.; Pirajno, F. Physicochemical model for the genesis of Cu-Ag-Au-Hg solid solutions and intermetallics in the rodingites of the Zolotaya Gora gold deposit (Urals, Russia). Ore Geol. Rev. 2018, 93, 81–97. [Google Scholar] [CrossRef]
- Palyanova, G.; Murzin, V.; Kuznetsov, S.; Karmanov, N. Native gold of the Au-Pd-REE Chudnoye deposit (Subpolar Ural, Russia): Composition, mineral associations, genesis. Minerals 2021, 11, 451. [Google Scholar] [CrossRef]
- Chudnenko, K.V.; Palyanova, G.A. Thermodynamic modeling of native formation Cu-Ag-Au-Hg solid solutions. Appl. Geochem. 2016, 66, 88–100. [Google Scholar] [CrossRef]
- Pal’yanova, G.A.; Murzin, V.V.; Zhuravkova, T.V.; Varlamov, D.A. Au–Cu–Ag mineralization in rodingites and nephritoids of the Agardag ultramafic massif (southern Tuva, Russia). Russ. Geol. Geophys. 2018, 59, 237–255. [Google Scholar] [CrossRef]
- Murzin, V.V.; Palyanova, G.A.; Varlamov, D.A.; Shanina, S.N. Gold-Bearing Rodingites of the Agardag Ultramafic Massif (South Tuva, Russia) and Problems of Their Genesis. Geol. Ore Dep. 2020, 62, 204–224. [Google Scholar] [CrossRef]
- Koneev, R.I. Gold Nanomineralogy of Epithermal Deposits of the Chatkala–Kurama Region, Uzbekistan; Del’ta: Sankt-Peterburg, Russia, 2006; 220p. [Google Scholar]
- Nesterenko, G.V.; Kuznetsova, A.I.; Lavrentyev, Y.G. The nature of native gold of the Sinyukha deposit. Sov. Geol. Geophys. 1980, 10, 129–133. (In Russian) [Google Scholar]
- Chekryzhov, I.Y.; Safronov, P.P.; Panichev, A.M.; Golokhvast, K.S.; Vedyagin, A.A.; Bukhtiyarov, V.I. Geological and biological aspects of a find of natural alloy (Au-Cu-Ag) nanoparticles in Cenozoic zeolitized tuff of the Vanchinskaya basin (Primor’e area). Dokl. Earth Sci. 2011, 436, 55–57. [Google Scholar] [CrossRef]
- Zhmodik, S.M.; Mironov, A.G.; Zhmodik, A.S. Gold-Concentrating Systems of Ophiolite Belts (Using the Example of the Sayan-Baikal-Muya Belt); Publishing House “Geo”: Novosibirsk, Russia, 2008; 304p. [Google Scholar]
- Oen, I.S.; Kieft, C. Nickeline with pyrrhotite and cubanite exsolutions, Ni-Co rich loellingite and an Au-Cu alloy in Cr-Ni ores from Beni-Bousera, Morocco. Neues Jahrb. Miner. Monatsh. 1974, 115, 1–8. [Google Scholar]
- Nekrasov, I.Y.; Ivanov, V.V.; Lennikov, A.M.; Sapin, V.I.; Safronov, P.P.; Oktyabr’skii, R.A. Rare natural polycomponent alloys based on gold and copper from a platinum placer in the Konder alkaline-ultrabasic massif, southeastern Aldan shield, Russia. Geol. Ore Dep. 2001, 43, 406–417. [Google Scholar]
- Liu, H.; Beaudoin, G. Geochemical signatures in native gold derived from Au-bearing ore deposits. Ore Geol. Rev. 2021, 132, 104066. [Google Scholar] [CrossRef]
- Townley, B.K.; Hérail, G.; Maksaev, V.; Palacios, C.; De Parseval, P.; Sepulveda, F.; Orellana, R.; Rivas, P.; Ulloa, C. Gold grain morphology and composition as an exploration tool: Application to gold exploration in covered areas. Geochem. Explor. Environ. Anal. 2003, 3, 29–38. [Google Scholar] [CrossRef]
- Sidorov, E.G.; Sandimirova, E.I.; Chubarov, V.M.; Anikin, L.P.; Ibragimova, E.K.; Antonov, A.V. Typomorphic features of gold in placer occurrences of the Olkhovaya River 1- I (Kamchatsky Cape, Eastern Kamchatka). Vestnik KRAUNTS. Geosci. 2013, 1, 34–43. [Google Scholar]
- Tolstykh, N.; Sidorov, E.; Kozlov, A. Platinum group minerals from the Olkhovaya-1 placer related to the Karaginsky ophiolite complex, the Kamchatskiy Mys peninsula, Russia. Can. Mineral. 2009, 47, 793–811. [Google Scholar] [CrossRef]
- Craig, J.R. Ore-mineral textures and the tales they tell. Can. Mineral. 2001, 39, 937–956. [Google Scholar] [CrossRef]
- Chapman, R.J.; Leake, R.C.; Bond, D.P.G.; Stedra, V.; Fairgrieve, B. Chemical and mineralogical signatures of gold formed in oxidizing chloride hydrothermal systems and their significance within populations of placer gold grains collected during reconnaissance. Econ. Geol. 2009, 104, 563–585. [Google Scholar] [CrossRef]
- Boyarinova, M.E.; Veshnyakov, N.A.; Korkin, A.G.; Savelyev, D.P. State Geological Map of the Russian Federation. Scale 1:200,000; East Kamchatka Series. Sheets O-58-XXVI, XXXI, XXXII. Explanatory Note; Cartographic Factory VSEGEI: Sankt-Peterburg, Russia, 2007; 226p. (In Russian) [Google Scholar]
- Novakov, R.M.; Ivanov, V.V.; Trukhin, Y.P.; Panova, E.G. Copper-nickel and noble metals mineralization in olivine websterite from the Kamchatsky Mys peninsular (Kamchatka). Bull. St. Petersburg State Univ. 2015, 7, 83–97, (In Russian, abstract in English). [Google Scholar]
- Savelyev, D.P.; Philisofova, T.M.V.M. Microinclusions of platinum group elements minerals and gold in rocks from ophiolite complex in the Kamchatsky Mys Peninsula. Vestnik KRAUNTS Geosci. 2017, 34, 5–13. [Google Scholar]
- Rapson, W.S. The metallurgy of the coloured carat gold alloys. Gold Bull. 1990, 23, 125–133. [Google Scholar] [CrossRef]
- Shuster, J.; Reith, F. Reflecting on gold geomicrobiology research: Thoughts and considerations for future endeavors. Minerals 2018, 8, 401. [Google Scholar] [CrossRef]
- Melchiorre, E.B.; Orwin, P.M.; Reith, F.; Rea, M.A.D.; Yahn, J.; Allison, R. Biological and geochemical development of placer gold deposits at Rich Hill, Arizona, USA. Minerals 2018, 8, 56. [Google Scholar] [CrossRef]
- Kubiak, R.; Janczak, J. X-ray study of ordered phase formation in Au31.6 Cu68.4, Au50Cu50 and Au75Cu25. J. Alloys Compd. 1991, 176, 133–140. [Google Scholar] [CrossRef]
- Bayliss, P. Revised unit-cell dimensions, space group, and chemical formula of some metallic minerals. Can. Mineral. 1990, 28, 751–755. [Google Scholar]
- Spiridonov, E.M.; Chvileva, T.N. Bogdanovite, Au5(Cu,Fe)3(Te,Pb)2, a new mineral of the group of inter-metallic compounds of gold. Vestn. Mosk. Univ. Geol. 1979, 1, 44–52. [Google Scholar]
- Lu, H.S.; Liang, C.K. The superlattice formation and lattice spacing changes in copper-gold alloys. Chin. J. Phys. 1966, 22, 505–526. (In English) [Google Scholar]
- Chapman, R.J.; Banks, D.A.; Styles, M.T.; Walshaw, R.D.; Piazolo, S.; Morgan, D.J.; Grimshaw, M.R.; Spence-Jones, C.P.; Matthews, T.J.; Borovinskaya, O. Chemical and physical heterogeneity within native gold: Implications for the design of gold particle studies. Miner. Depos. 2021, 56, 1563–1588. [Google Scholar] [CrossRef]
- Chapman, R.; Torvela, T.; Savastano, L. Insights into Regional Metallogeny from Detailed Compositional Studies of Alluvial Gold: An Example from the Loch Tay Area, Central Scotland. Minerals 2023, 13, 140. [Google Scholar] [CrossRef]
- Nikolaeva, L.A.; Nekrasova, A.N.; Milyaev, S.A.; Yablokova, S.V.; Gavrilov, A.M. Geochemical features of native gold from deposits of various types. Geol. Ore Depos. 2013, 55, 176–184. [Google Scholar] [CrossRef]
- Nikiforova, Z.S.; Kalinin, Y.A.; Makarov, V.A. Evolution of native gold in exogenous conditions. Russ. Geol. Geophys. 2020, 61, 1244–1259. [Google Scholar] [CrossRef]
- Nikiforova, Z. Internal Structures of Placer Gold as an Indicator of Endogenous and Exogenous Processes. Minerals 2023, 13, 68. [Google Scholar] [CrossRef]
- Savva, N.E.; Kravtsova, R.G.; Anisimova, G.S.; Palyanova, G.A. Typomorphism of Native Gold (Geological-Industrial Types of Gold Deposits in the North-East of Russia). Minerals 2022, 12, 561. [Google Scholar] [CrossRef]
- Onishchenko, S.A.; Kuznetsov, S.K. Native gold of the Chudnoe gold–palladium deposit (Subpolar Urals, Russia). Russ. Geol. Geophys. 2023, 64, 233–254. [Google Scholar] [CrossRef]
- Lalomov, A.; Grigorieva, A.; Kotov, A.; Ivanova, L. Typomorphic Features and Source of Native Gold from the Sykhoi Log Area Placer Deposits, Bodaibo Gold-Bearing District, Siberia, Russia. Minerals 2023, 13, 707. [Google Scholar] [CrossRef]
- Groen, J.C.; Craig, J.R.; Rimstidt, J.D. Gold-rich rim formation on electrum grains in placers. Can. Mineral. 1990, 28, 207–228. [Google Scholar]
- Stewart, J.; Kerr, G.; Prior, D.; Halfpenny, A.; Pearce, M.; Hough, R.; Craw, D. Low temperature recrystallisation of alluvial gold in paleoplacer deposits. Ore Geol. Rev. 2017, 88, 43–56. [Google Scholar] [CrossRef]
- Dunn, S.C.; von der Heyden, B.P.; Rozendaal, A.; Taljaard, R. Secondary gold mineralization in the Amani placer gold deposit, Tanzania. Ore Geol. Rev. 2019, 107, 87–107. [Google Scholar] [CrossRef]
- Okamoto, H.; Chakrabarti, D.J.; Laughlin, D.E.; Massalski, T.B. The Au−Cu (gold-copper) system. J. Phase Equilibria 1987, 8, 454–474. [Google Scholar] [CrossRef]
- Fedorov, P.P.; Volkov, S.N. Au-Cu Phase Diagram. Russian J. Inorg. Chem. 2016, 61, 772–775. [Google Scholar] [CrossRef]
- Prince, A.; Velikanova, T.; Turchanin, M.A. Silver-Gold-Copper; Silver–Gold–Copper. Ternary Alloy Systems. Phase Diagrams, Crystallographic and Thermodynamic Data. Landolt Boernstein, Numerical Data and Functional Relationships in Science and Technology (New Series); Group IV: Physical Chemistry; Martiensen, W., Effenberg, G., Ilyenko, S., Eds.; Library of Congress Cataloging: Germany, Berlin, 2006; pp. 10–41. [Google Scholar]
- Marquez-Zavalia, M.F.; Southam, G.; Craig, J.R.; Galliski, M.A. Morphological and chemical study of placer gold from the San Luis Range, Argentina. Can. Mineral. 2004, 42, 169–182. [Google Scholar] [CrossRef]
- Alves, K.d.S.; Sánchez, S.B.; Barreiro, J.G.; Palomares, R.M.; Prieto, J.M.C. Morphological and compositional analysis of alluvial gold: The Fresnedoso gold placer (Spain). Ore Geol. Rev. 2020, 121, 103489. [Google Scholar] [CrossRef]
- Putnis, A. Mineral replacement reactions. Rev. Mineral. Geochem. 2009, 70, 87–124. [Google Scholar] [CrossRef]
- Kepezhinskas, P.; Berdnikov, N.; Kepezhinskas, N.; Konovalova, N. Metals in Avachinsky peridotite xenoliths with implications for redox heterogeneity and metal enrichment in the Kamchatka mantle wedge. Lithos 2022, 412–413, 1066. [Google Scholar] [CrossRef]
- Yudovskaya, M.A.; Distler, V.V.; Chaplygin, I.V.; Mokhov, A.V.; Trubkin, N.V.; Gorbacheva, S.A. Gaseous transport and deposition of gold in magmatic fluid: Evidence from the active Kudryavy volcano, Kurile Islands. Mineral. Depos. 2006, 40, 828–848. [Google Scholar] [CrossRef]
- Kepezhinskas, P.K.; Kepezhinskas, N.P.; Berdnikov, N.V.; Krutikova, V.O. Native metals and intermetallic compounds in subduction-related ultramafic rocks from the Stanovoy mobile belt (Russian Far East): Implications for redox heterogeneity in subduction zones. Ore Geol. Rev. 2020, 127, 103800. [Google Scholar] [CrossRef]
- Berdnikov, N.; Kepezhinskas, P.; Krutikova, V.; Kozhemyako, N.; Konovalova, N. Cu-Ag-Au Microspherules in Igneous Rocks: Morphology, Composition, Diagnostic Criteria and Possible Origin. Minerals 2023, 13, 819. [Google Scholar] [CrossRef]
- Marshakov, I.K.; Vvedensky, A.V.; Kondrashin, V.Y.; Bokov, G.A. Anodic Dissolution and Selective Corrosion of Alloys; Voronezh State Unuversitet: Voronezh, Russia, 1988; 205p. [Google Scholar]
Figure 1.
Geological map of the study area, after [39]. (1) Loose Quaternary rocks of various geneses; (2) Pliocene–Lower-Pleistocene sea deposits; (3) Miocene terrigenous rocks, (4) Cretaceous volcanic, siliceous, and terrigenous rocks; (5) Cretaceous gabbro; (6) ultrabasic rocks and serpentinite melange of ophiolite assemblage; (7) main faults; (8) Ol’khovaya-1 river placer; (9) websterites and clinopyroxenites with platinum-bearing copper and native gold [40,41].
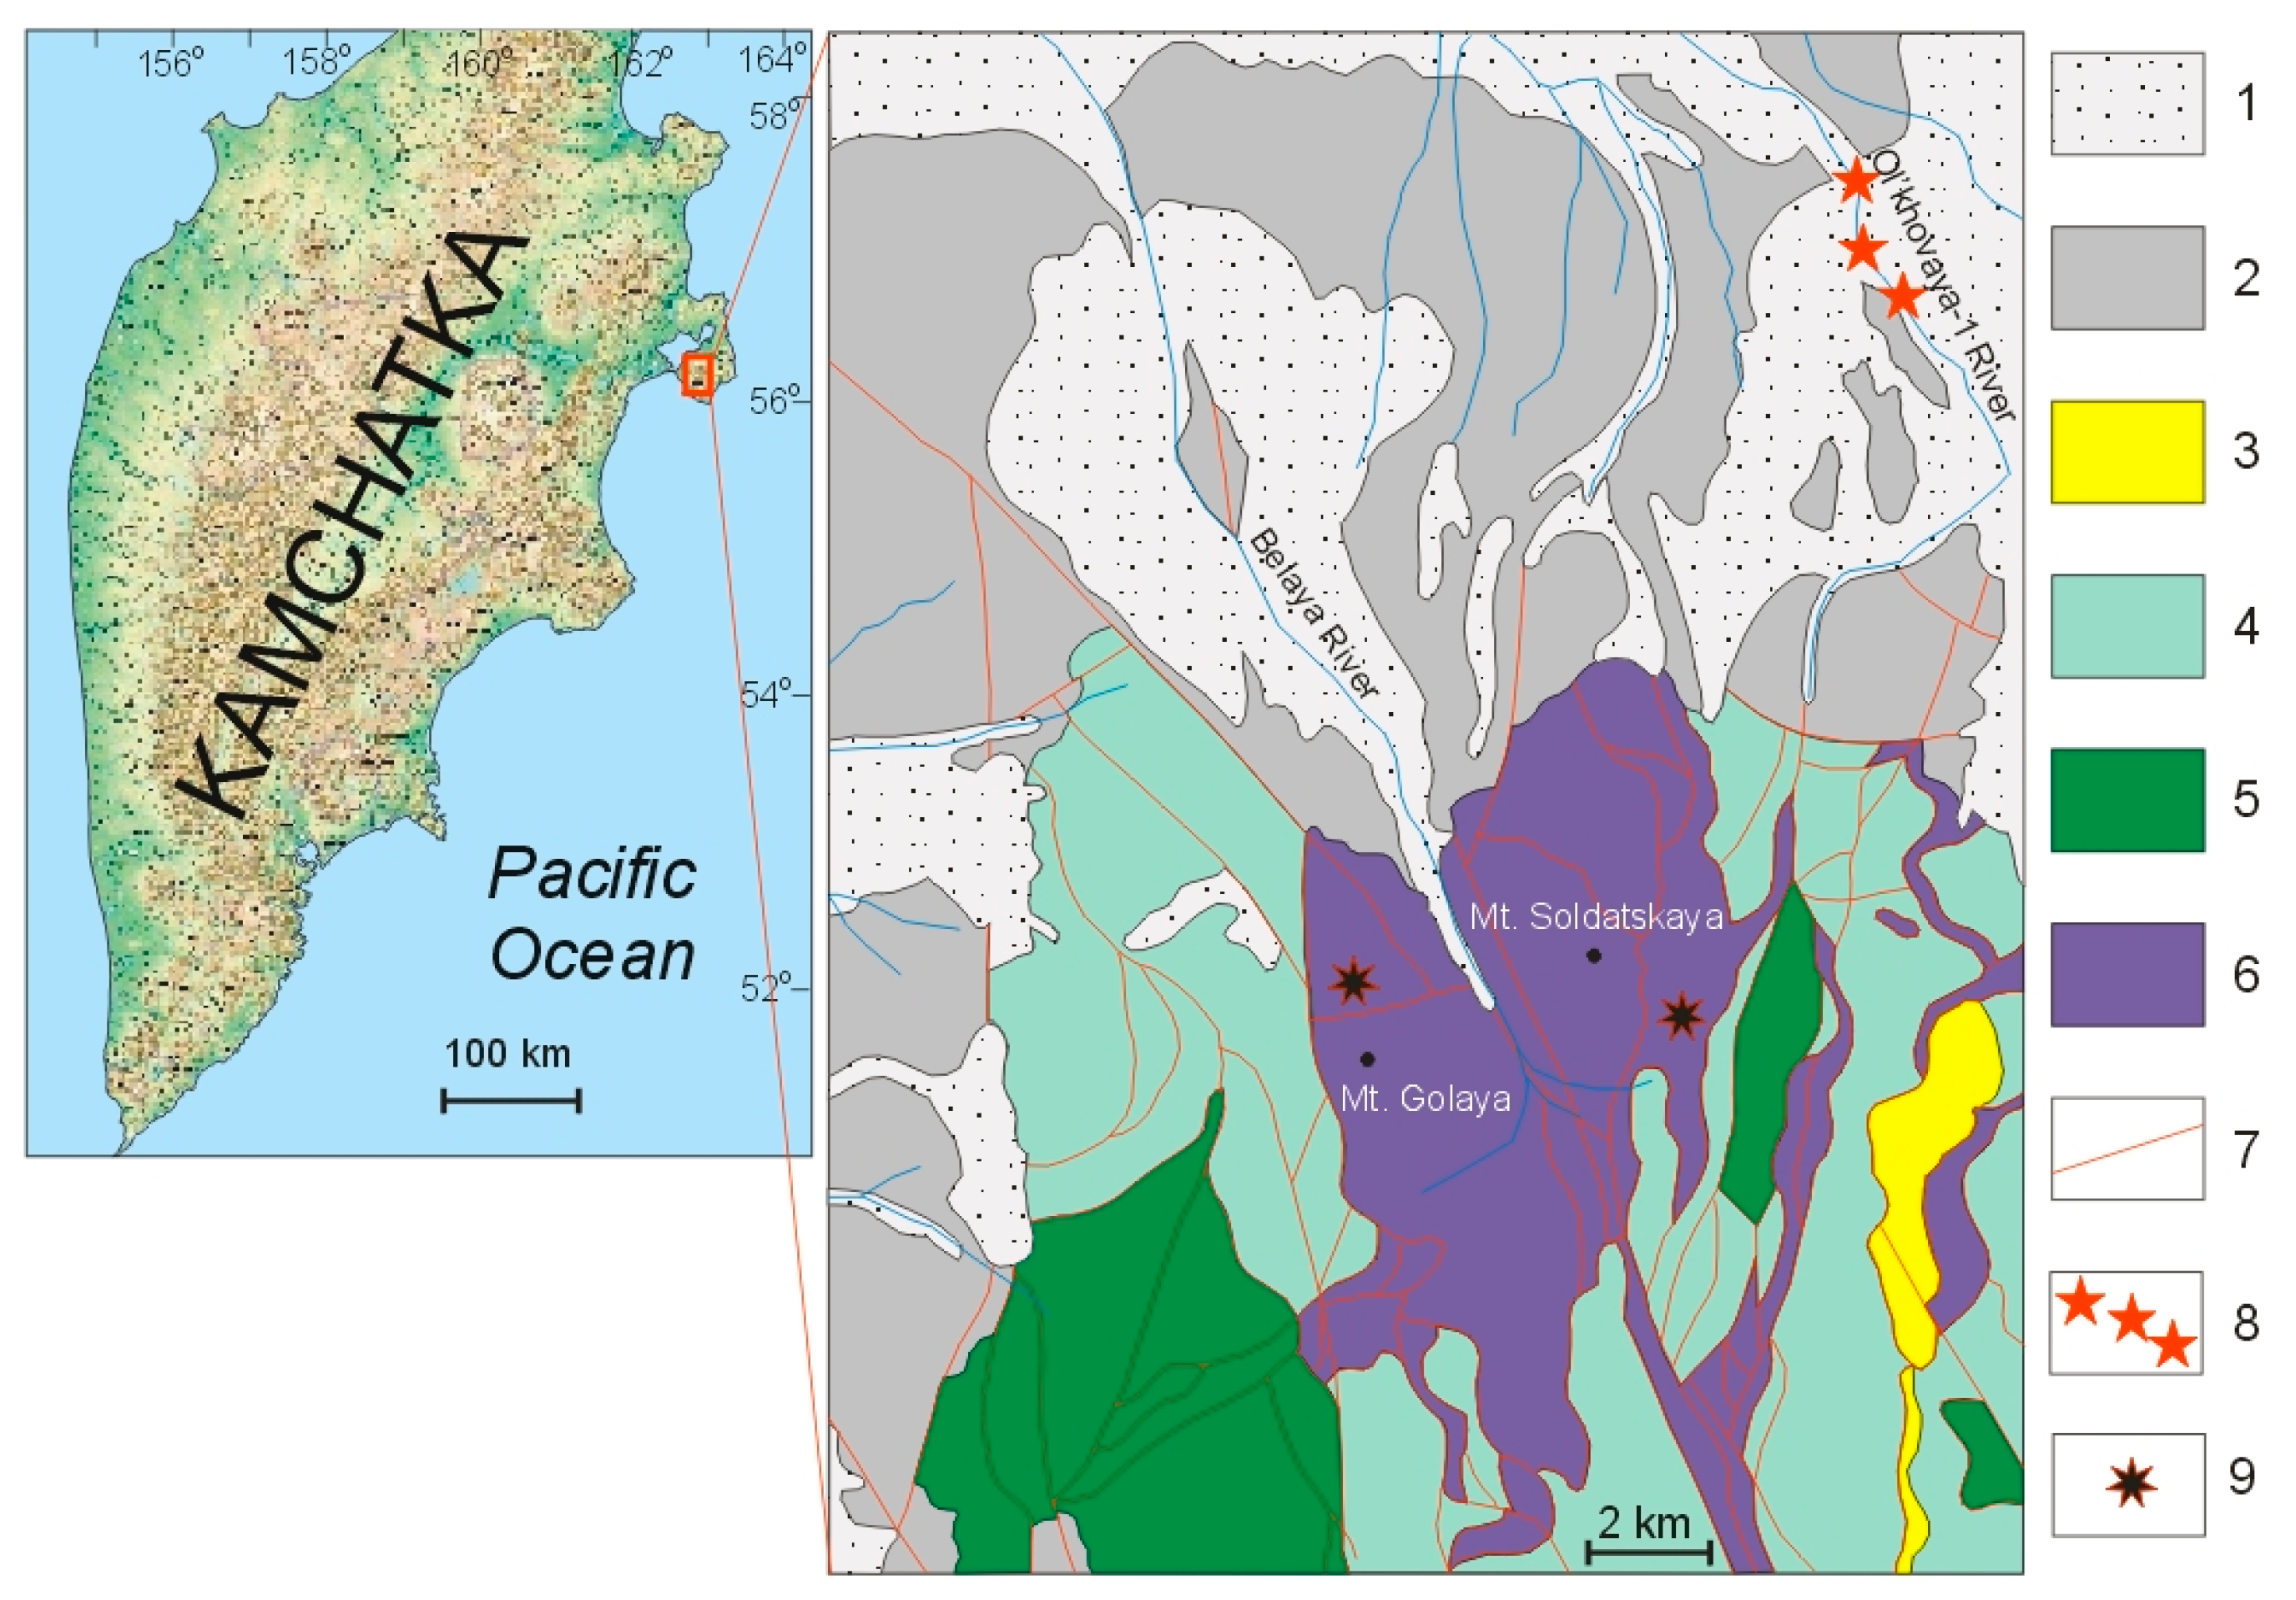
Figure 2.
Optical photos in reflected light (general view) of grains with Au-Ag-Cu mineral phases selected for detailed study. The main phases: (a) Cu3Au + Au,Cu (group I, 5 grains); (b) Cu3Au + Ag,Au (group IIA, 8 grains) and CuAu + Ag,Au (group IIB, 1 grain); (c) Cu3Au + Au,Ag (group IIIA, 5 grains) and CuAu + Au,Ag (group IIIB, 3 grains); (d) Cu3Au + CuAu + Au,Ag (IV group, 10 grains). The sizes of the grains are from 0.2 to 0.9 mm. The number of each grain is in the photo.

Figure 14.
Examples of intergrowths of silicates and sulfides with Au-Ag-Cu phases: (a) garnet (Grt1) in Cu3Au (1-6); (b) garnet (Grt2) in CuAu (7-34) (red box in optical photo in b); (c) CuAu in the intergranular space of pyroxene (Px) (2-19); (d) epidote (Ep) and chlorite (Chl) in Cu3Au (7-35); (e) inclusions of bornite (Bn), Ag-Au-Cu alloy and galena (Gn) in Cu3Au and chlorite in the intergrowth with Cu3Au (7-35); (f) an inclusion of pentlandite (Pn) in Cu3Au (1-152); (g) covellite (Cv) in the peripheral part of sample 7-47; (h) anilite (Ani) in the peripheral part of grain 7-34 (blow box in optical photo in b), (i) the compositions of the phases.
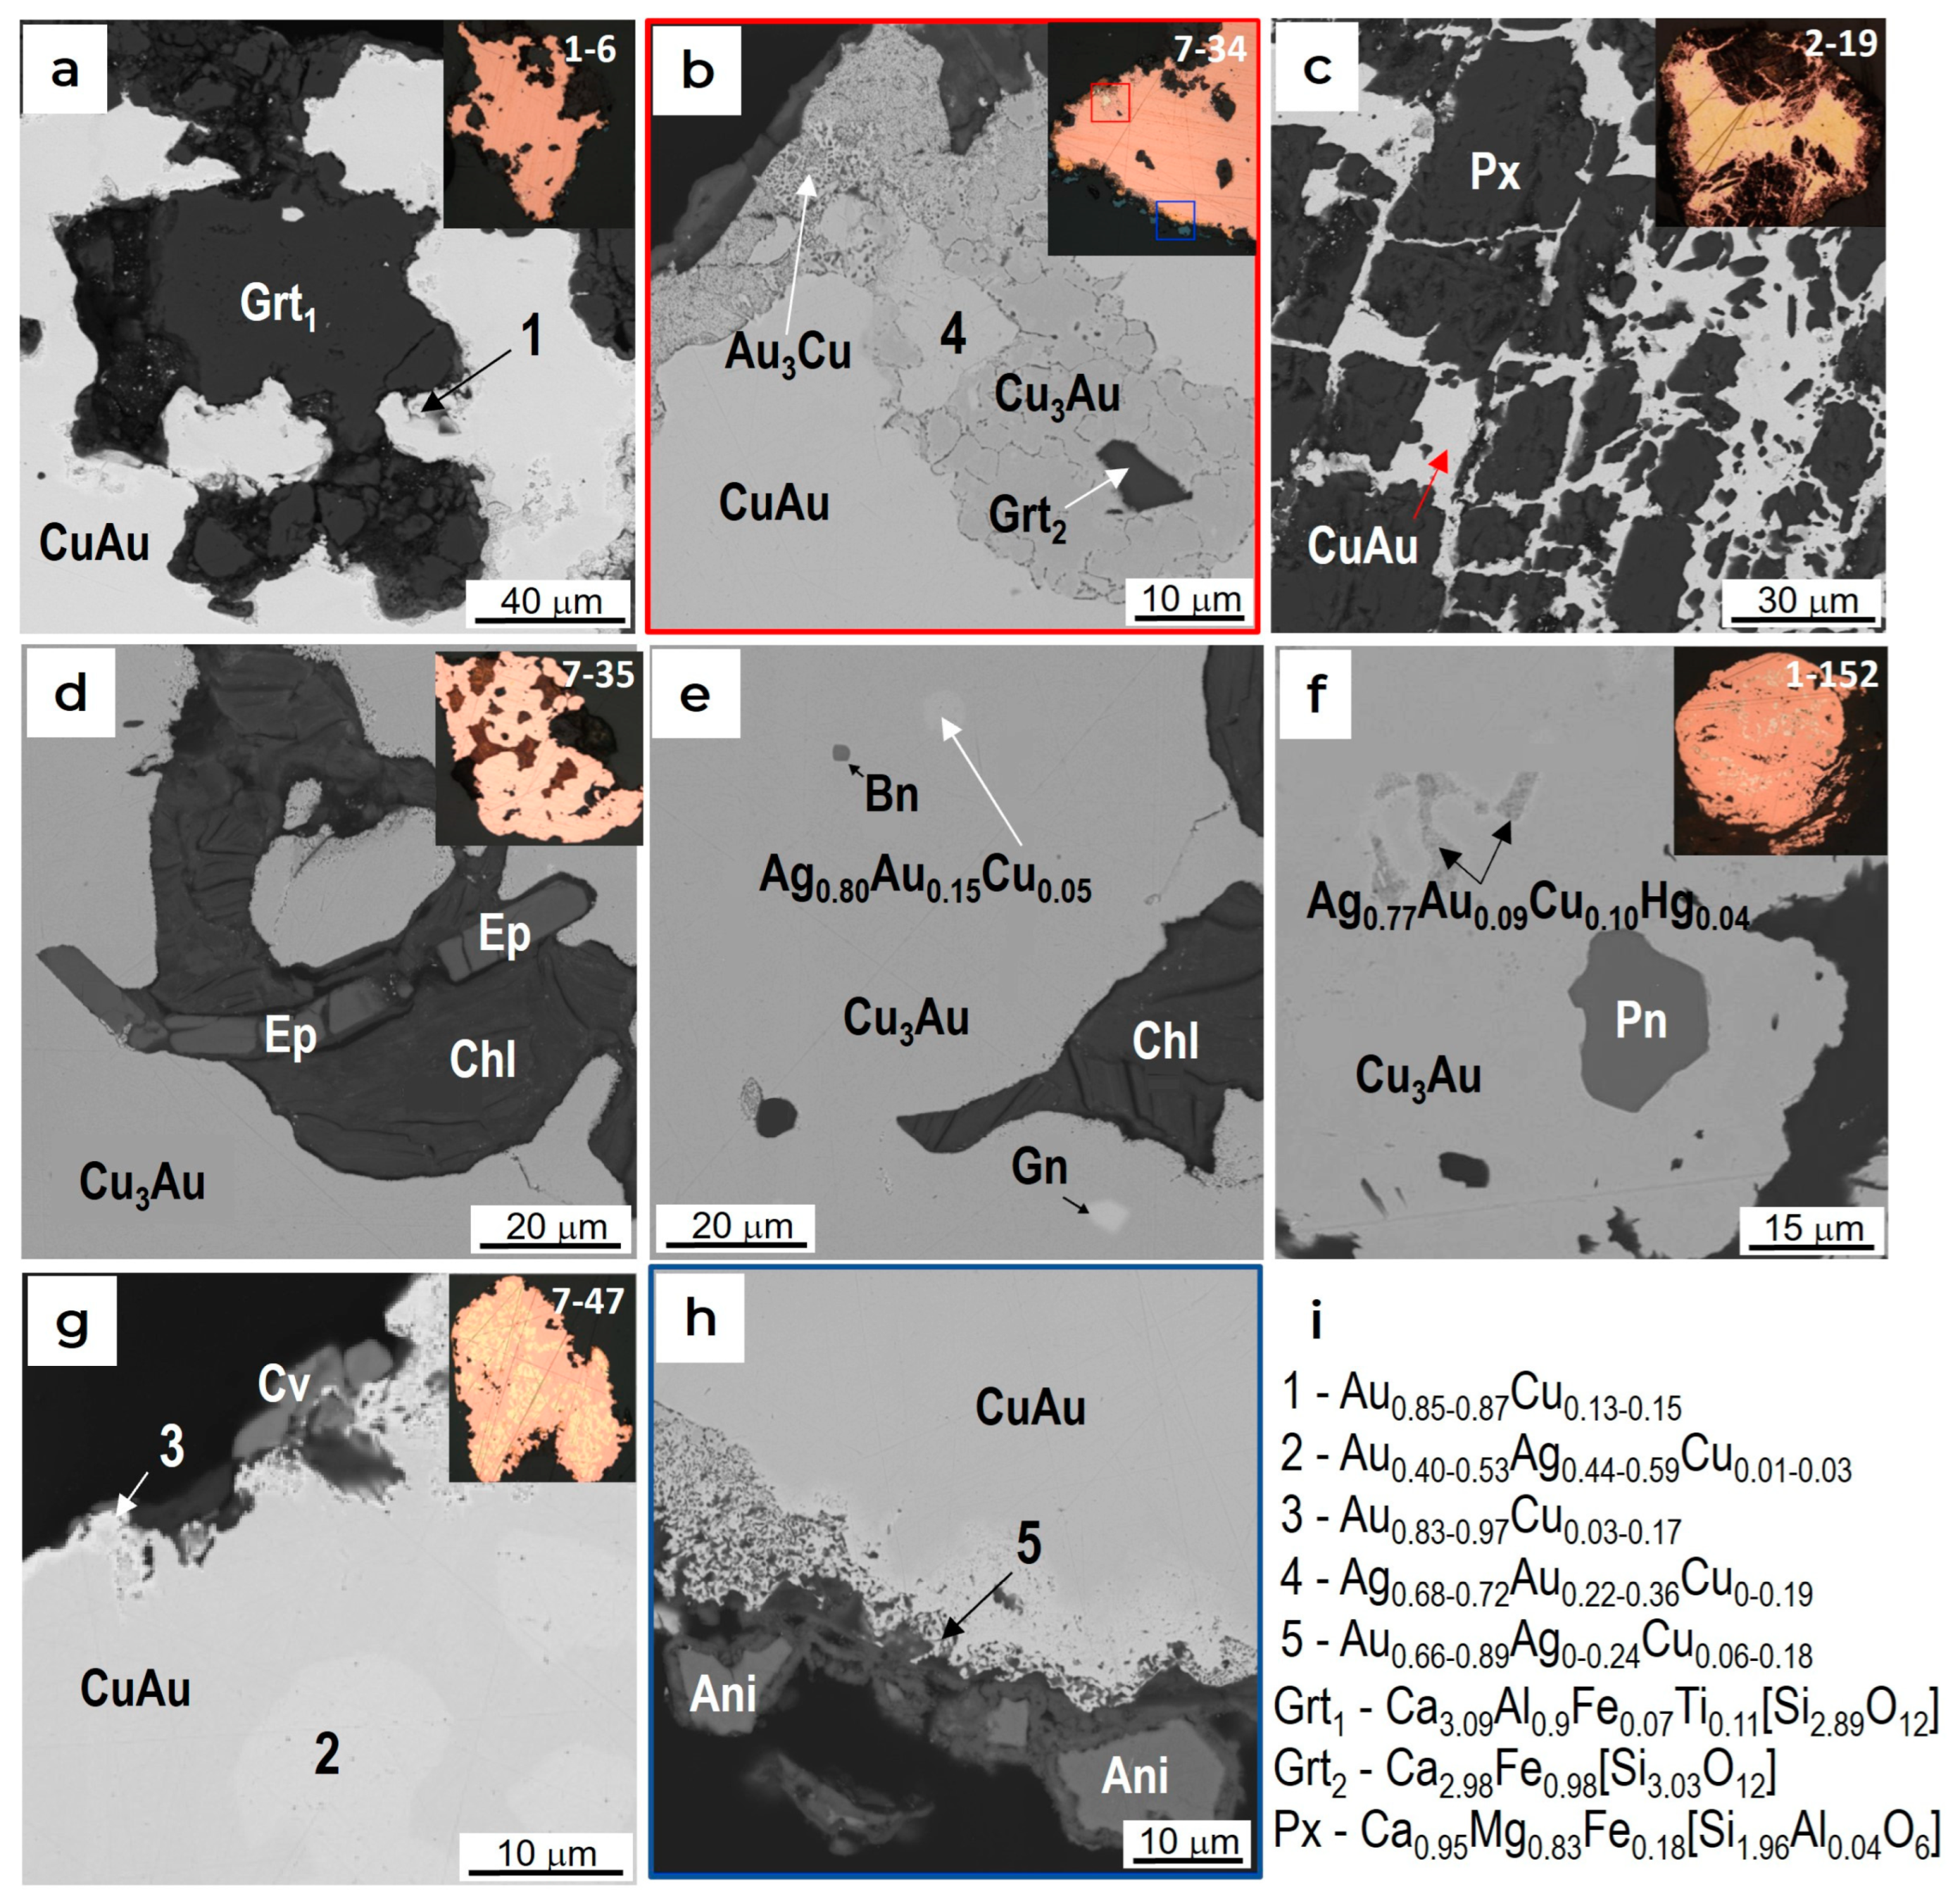
Figure 15.
X-ray diffraction patterns of outer fragments of selected grains: 1-73 (a), 1-90 (b), and 7-47 (c).
Figure 15.
X-ray diffraction patterns of outer fragments of selected grains: 1-73 (a), 1-90 (b), and 7-47 (c).

Figure 16.
Electron microprobe step-scanning (5 µm) profiles across two grains ((a) 1-6 and (b) 7-32), showing variations in wt.% Au, Ag, and Cu.
Figure 16.
Electron microprobe step-scanning (5 µm) profiles across two grains ((a) 1-6 and (b) 7-32), showing variations in wt.% Au, Ag, and Cu.

Figure 17.
A Au-Cu phase diagram [61] supplemented by the EMPA results of compositions of Au-Cu phases in grains of groups I–IV. +—corresponds to the compositions of the phases, the existence of which is justified in [13].
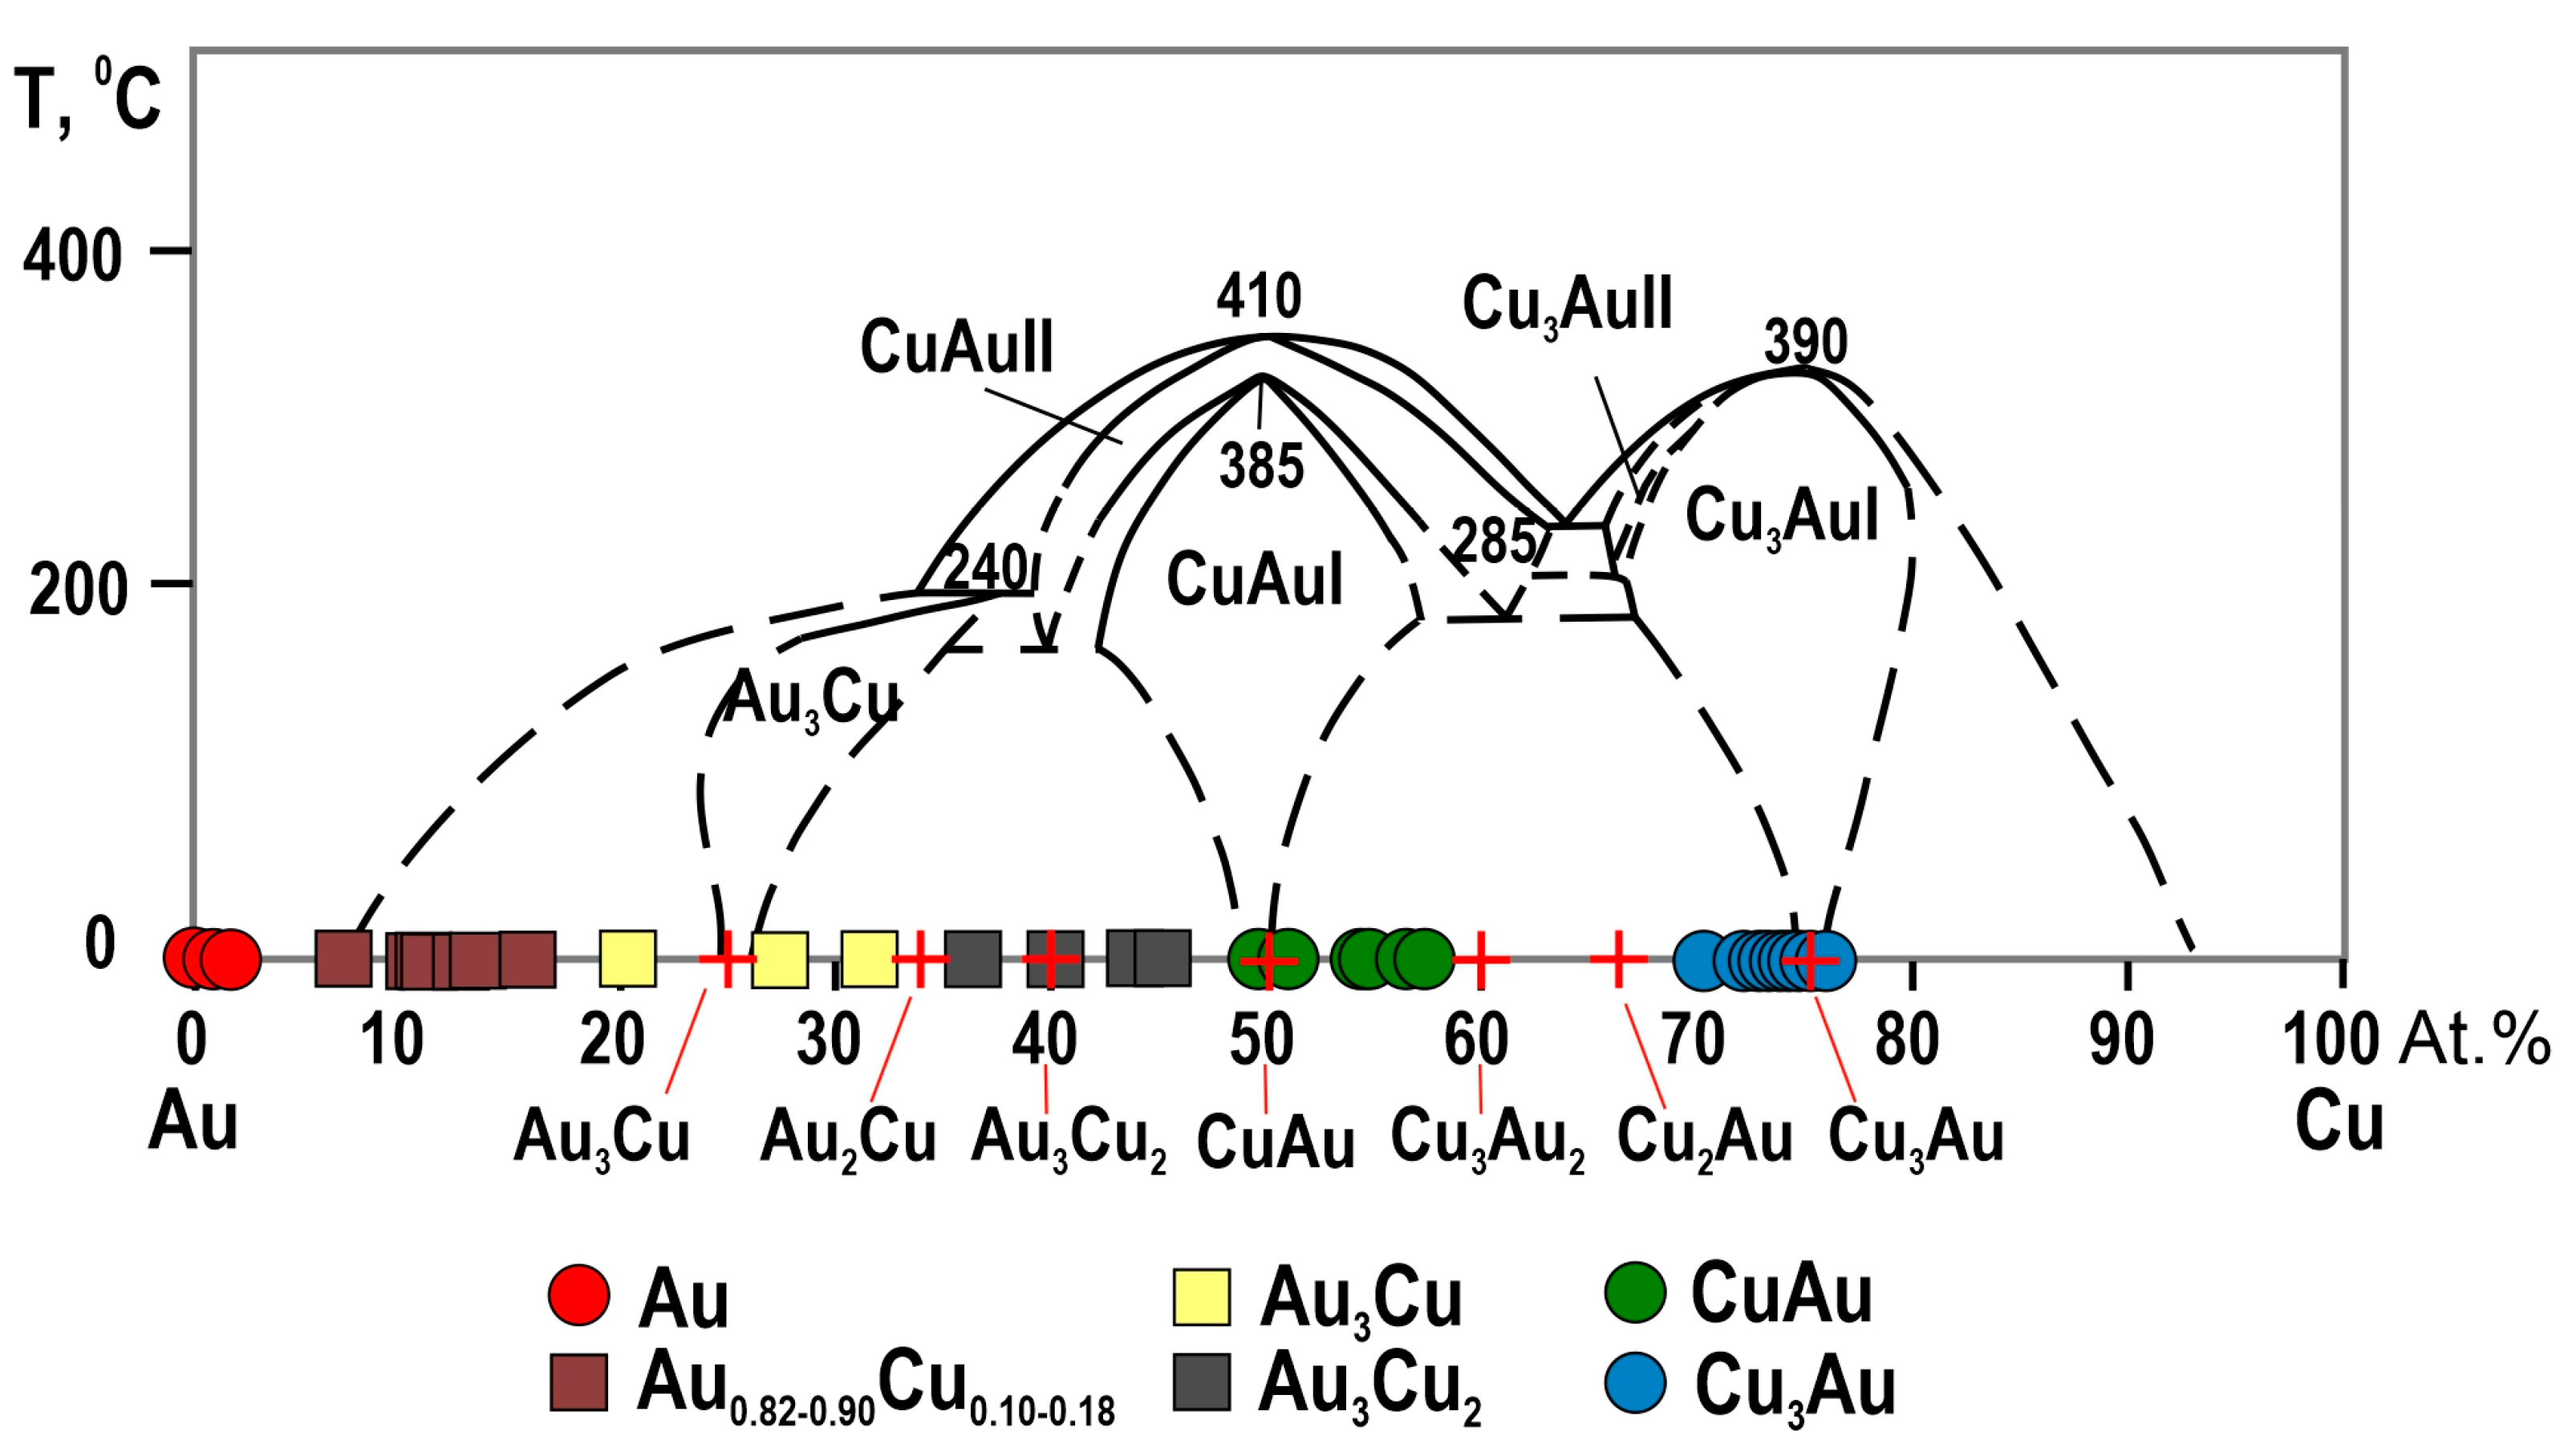
Figure 18.
The compositions of the mineral phases of the Au-Ag-Cu system (in at.%) for grains in which tetra-auricupride (groups IIB and IIIB) (a) or auricupride (groups IIA and IIIA) (b) dominates.
Figure 18.
The compositions of the mineral phases of the Au-Ag-Cu system (in at.%) for grains in which tetra-auricupride (groups IIB and IIIB) (a) or auricupride (groups IIA and IIIA) (b) dominates.
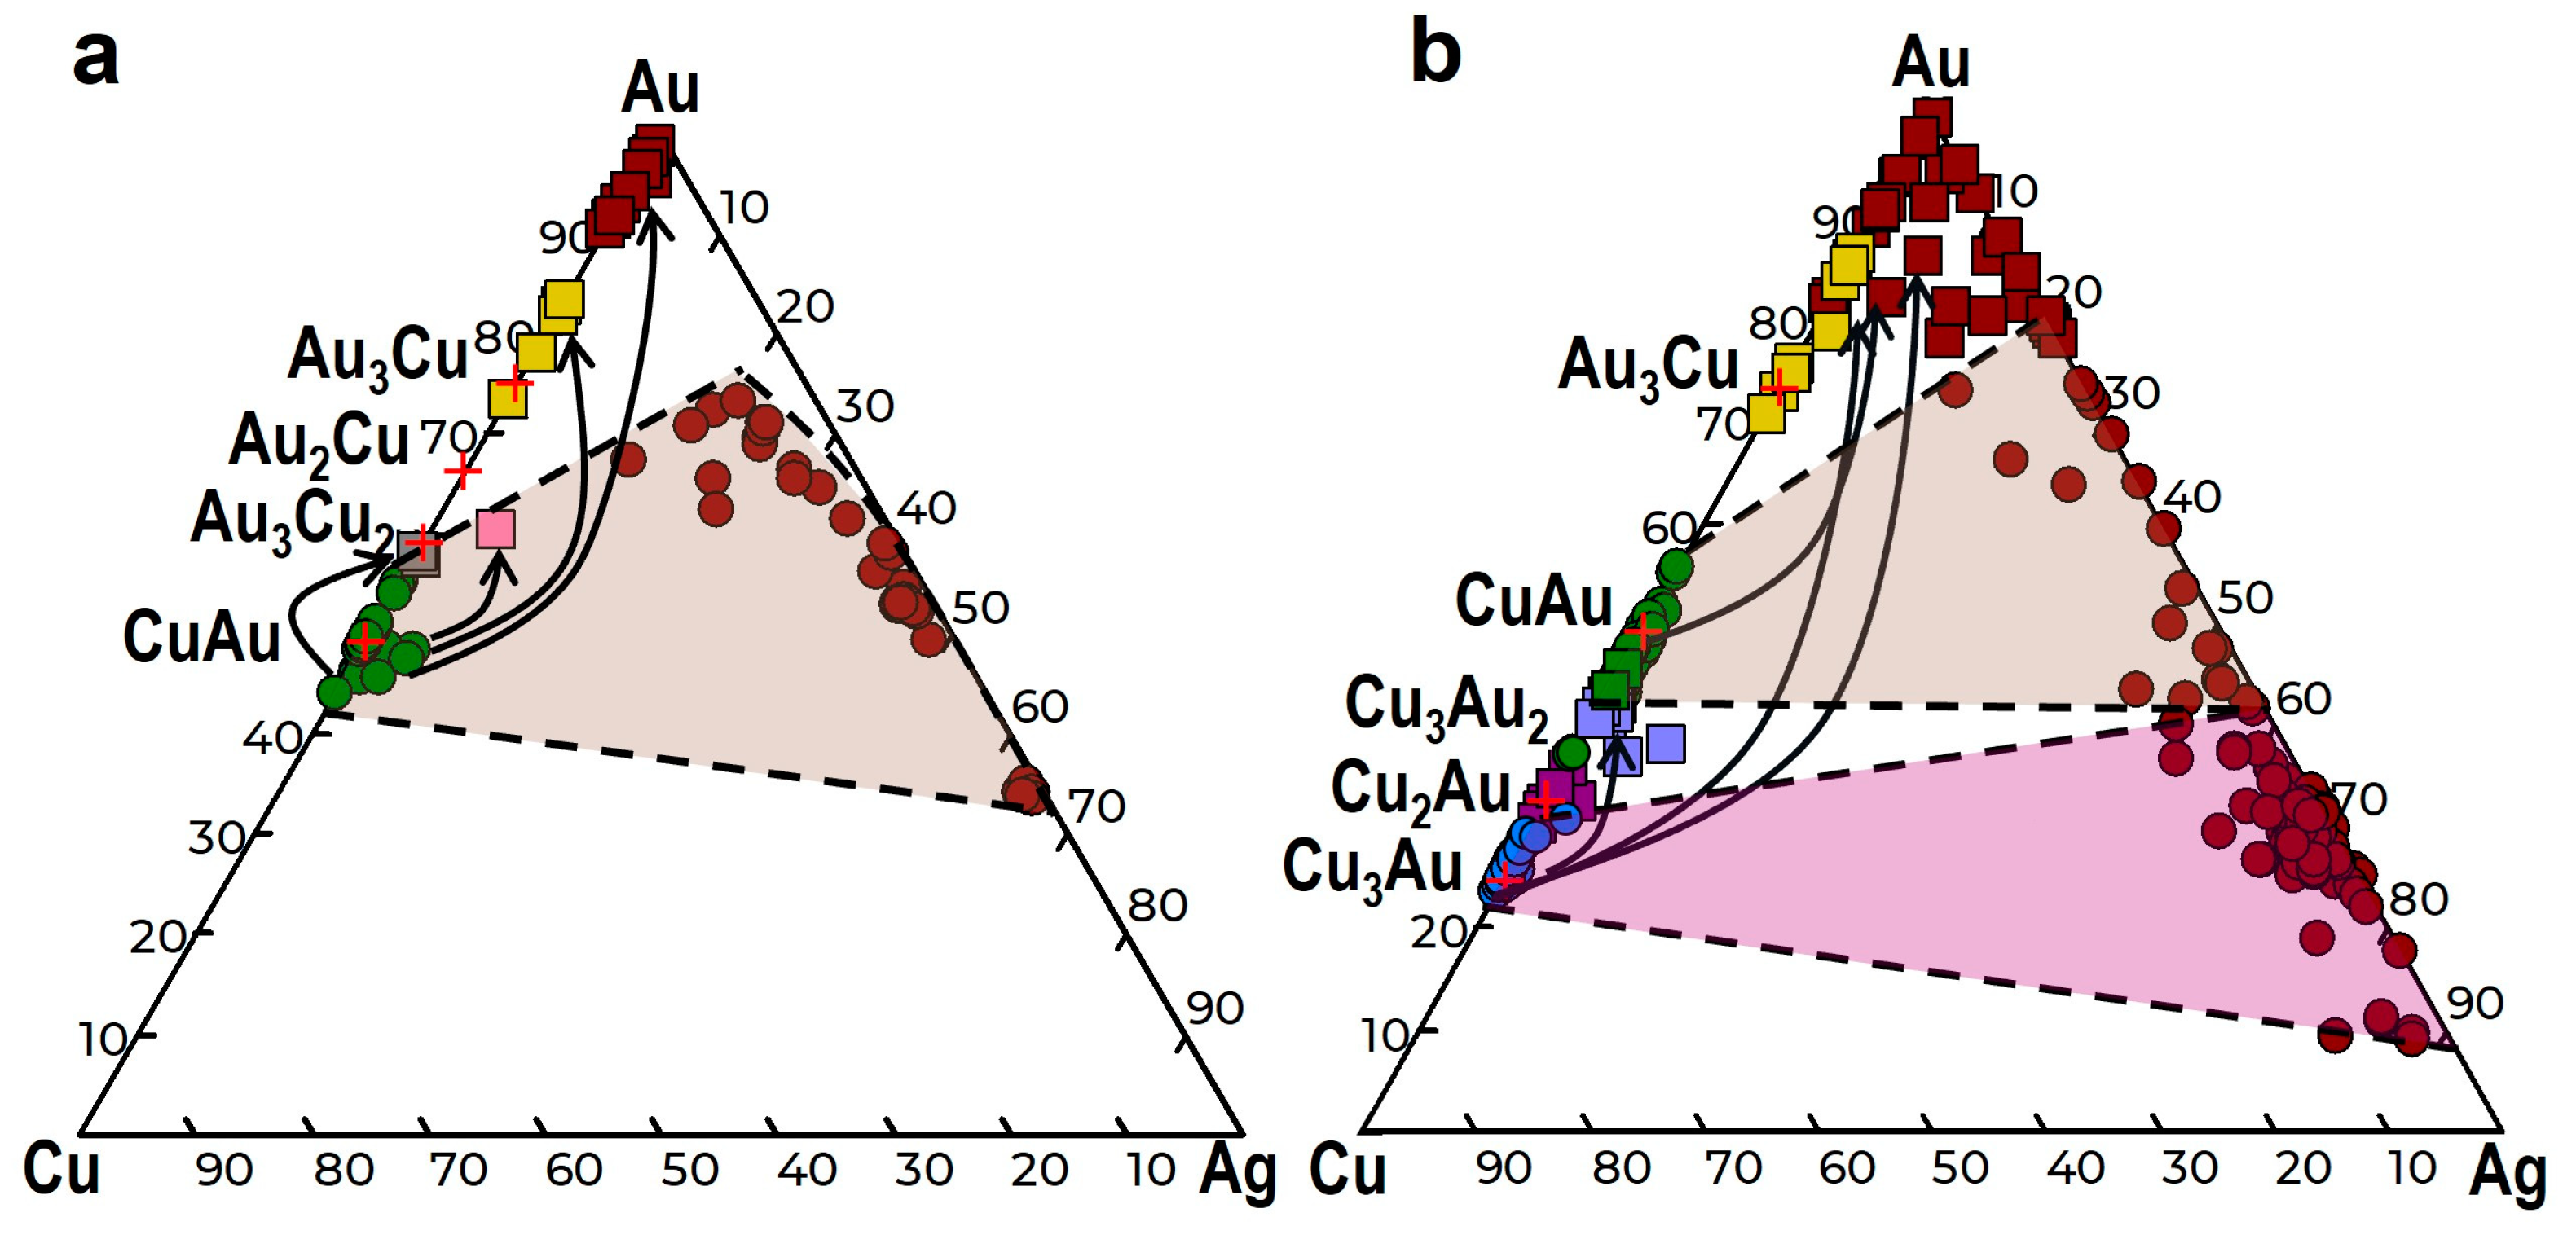
Figure 19.
Concentrations of Ag in Au-Cu phases. EPMA results of all grains.
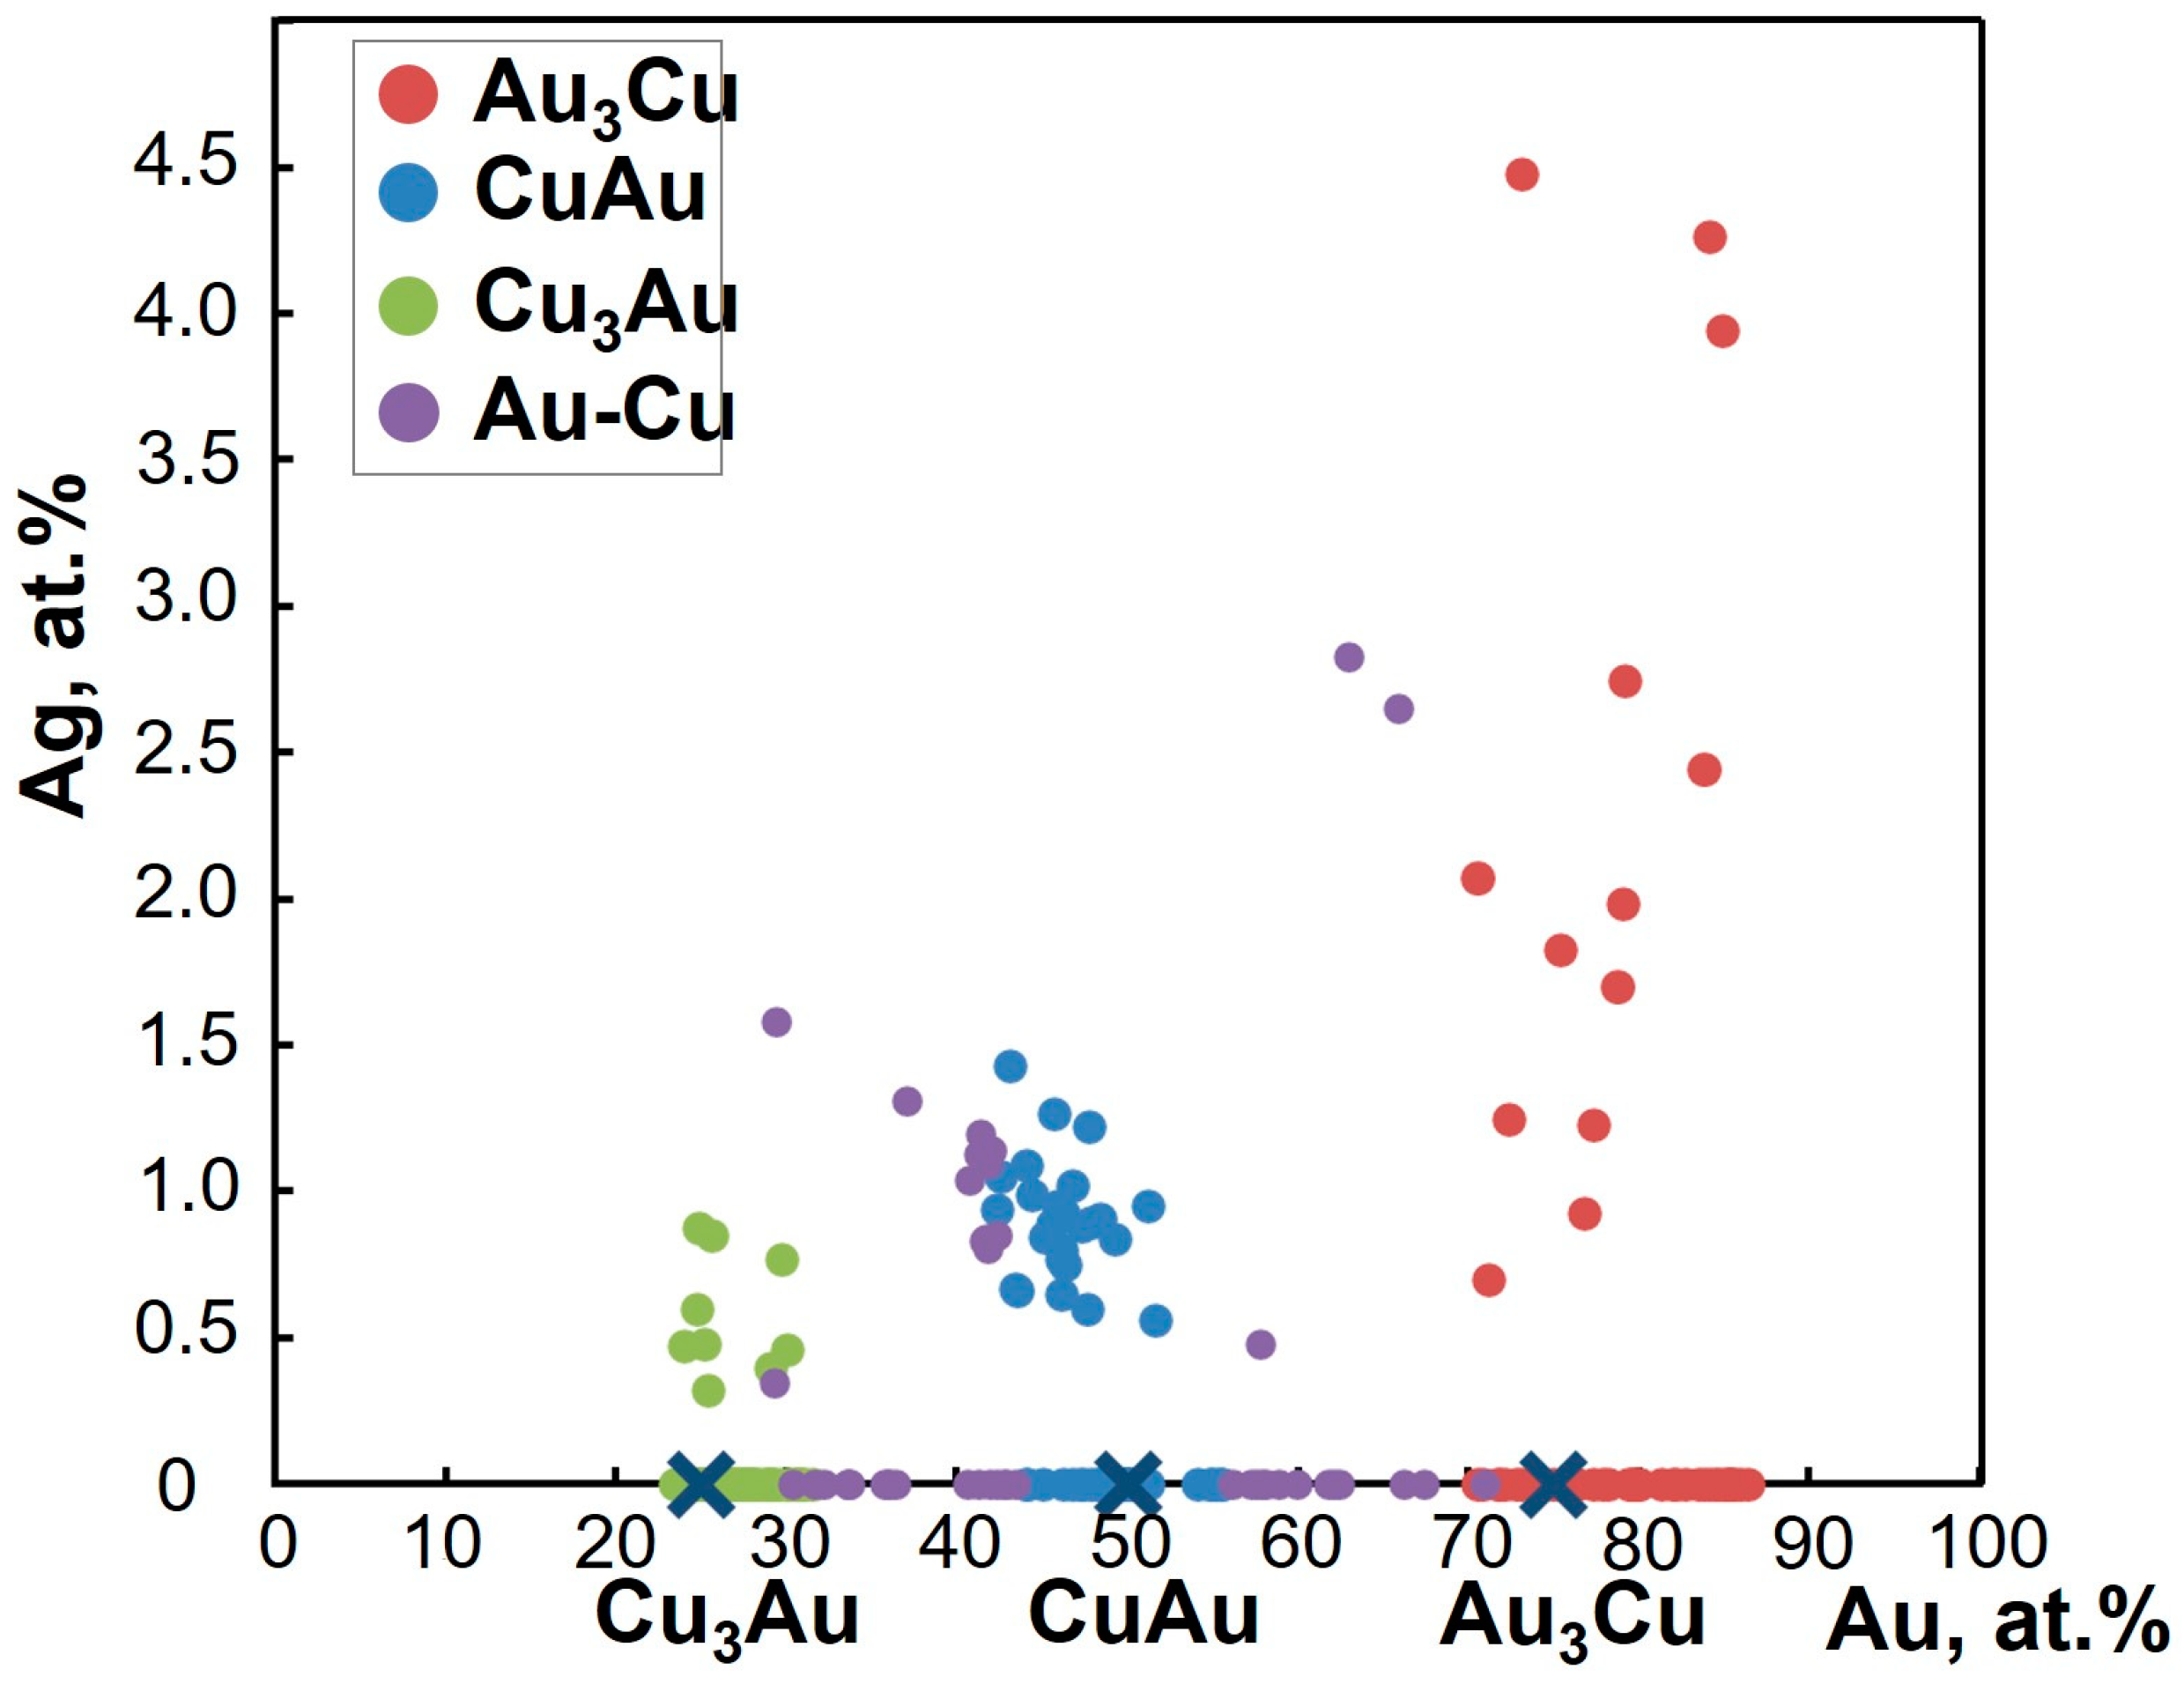
Figure 20.
Isothermal sections of the phase diagram of the Au-Ag-Cu system at 300 and 800 °C (in at.%) [62] (revised by us) and EPMA results of compositions of Au, Ag, and Cu particles in grains of groups I-IV. The blue dotted line is the equilibrium line of solid phases with the melt (L) at 800 °C.

Table 1.
The compositions of Cu,Ag-bearing gold in deposits of different types.
| Types of Deposits | Deposits | Alloy Compositions (wt.%) | References | |
|---|---|---|---|---|
| Ag | Cu (Other Metals) | |||
| Au-Ag epithermal (low-sulfidation) | Kochbulak (Uzbekistan) Kauldy (Uzbekistan) | <7.2 <15.1 | <0.29 (Fe < 0.1) <0.83 (Fe < 0.3) | [27] - “ - |
| Au-Ag epithermal (high-sulfidation) | Chelopech (Bulgaria) | <5.3 <33.9 | <2.96 (Fe < 0.6) <0.6 (Fe < 0.3) | [14] |
| Au-Cu-porphyry | Batu Hijau (Indonesia) | <10.9 | <3.1 | [15] |
| Au-Cu-skarn | Sinyukhinskoye (Russia) | 3–11 | 0.5 | [28] |
| Zeolitized tuffites | Beresovoe (Russia) | 7.2–11.8 | <14.2–29.5 | [29] |
| Au-Cu, ultrabasic lithologies | Kerr (Canada) | <4.2 | 22.3 (Hg < 0.6) | [8] |
| Au-bearing rodingites, talc-filled shear zones | the Wheaton Creek (British Columbia, Canada) | <24.9 | <23.2 (Hg < 0.2) | [9] |
| Au-bearing rodingites | Zolotaya Gora (Urals, Russia) | <13.7 | 23.7 (Hg < 2.6) | [21,22] |
| Cu-Ni-PGE | Norilsk-1 (Russia) Talnakh (Russia) | <1.2 <16.1 | <19.2 (Pt < 5.4, Pd < 8.4) <12.7 (Pd < 2.1) | [19] |
| Au-Pd-REE | Chudnoe (Urals, Russia) | <13.4 | <11.3 (Pd < 2.8) | [12,26] |
Disclaimer/Publisher’s Note: The statements, opinions and data contained in all publications are solely those of the individual author(s) and contributor(s) and not of MDPI and/or the editor(s). MDPI and/or the editor(s) disclaim responsibility for any injury to people or property resulting from any ideas, methods, instructions or products referred to in the content. |
© 2024 by the authors. Licensee MDPI, Basel, Switzerland. This article is an open access article distributed under the terms and conditions of the Creative Commons Attribution (CC BY) license (https://creativecommons.org/licenses/by/4.0/).
Share and Cite
MDPI and ACS Style
Palyanova, G.A.; Beliaeva, T.V.; Savelyev, D.P.; Seryotkin, Y.V. Minerals of the Au-Cu-Ag System in Grains from the Placers of the Olkhovaya-1 River (Eastern Kamchatka, Russia). Minerals 2024, 14, 448. https://doi.org/10.3390/min14050448
AMA Style
Palyanova GA, Beliaeva TV, Savelyev DP, Seryotkin YV. Minerals of the Au-Cu-Ag System in Grains from the Placers of the Olkhovaya-1 River (Eastern Kamchatka, Russia). Minerals. 2024; 14(5):448. https://doi.org/10.3390/min14050448
Chicago/Turabian StylePalyanova, Galina A., Tatiana V. Beliaeva, Dmitry P. Savelyev, and Yurii V. Seryotkin. 2024. "Minerals of the Au-Cu-Ag System in Grains from the Placers of the Olkhovaya-1 River (Eastern Kamchatka, Russia)" Minerals 14, no. 5: 448. https://doi.org/10.3390/min14050448
Note that from the first issue of 2016, this journal uses article numbers instead of page numbers. See further details here.