Lithium Resources and Production: Critical Assessment and Global Projections

Abstract
: This paper critically assesses if accessible lithium resources are sufficient for expanded demand due to lithium battery electric vehicles. The ultimately recoverable resources (URR) of lithium globally were estimated at between 19.3 (Case 1) and 55.0 (Case 3) Mt Li; Best Estimate (BE) was 23.6 Mt Li. The Mohr 2010 model was modified to project lithium supply. The Case 1 URR scenario indicates sufficient lithium for a 77% maximum penetration of lithium battery electric vehicles in 2080 whereas supply is adequate to beyond 2200 in the Case 3 URR scenario. Global lithium demand approached a maximum of 857 kt Li/y, with a 100% penetration of lithium vehicles, 3.5 people per car and 10 billion population.1. Introduction
The aim of this article is to examine lithium sources to determine if lithium is sufficiently abundant to meet a possibly significant increase in demand from electric vehicles using lithium ion batteries. This work is not claiming that lithium ion based electric vehicles will dominate the automotive industry, but instead intends to determine if lithium ion vehicles were to dominate demand, is there sufficient lithium. Before commencing it will be necessary to provide some definitions of terms used throughout this paper. In order to answer this question, historic and literature forecasts of lithium supply and demand will be presented in Section 2. Next, lithium resources and reserves are discussed in Section 3 and the Ultimately Recoverable Resources determined in Section 4. Next, a model describing the approach to lithium supply and demand used here is described in Section 5 and three projections of lithium supply and one projection of lithium demand will be presented in Section 6. Finally, Section 7 will analyse the various projections of supply and compare and contrast it to projected demand.
Lithium is an alkali metal with atomic number 3; it is the lightest metal, and has a high specific heat capacity. Lithium is produced from a variety of geological sources, e.g., minerals such as spodumene, clays such as hectorite, salt lakes, and underground brine reservoirs etc. In order to simplify, two broad categories of lithium sources will be defined and used throughout the paper, namely Rock and Brine sources. Rock sources will cover lithium contained in rocks; specifically Rock sources include mineral sources such as spodumene, amblygonite, jadarite, as well as clay sources of lithium such as hectorite. Typical mineral deposits have a lithium content of around 0.5%–2% Li [1]. Often the lithium from minerals is concentrated to around 2%–4% Li and used in the ceramics and glass industry [2]. Lithium rock production began with lithium minerals back in 1899 in the USA [2]. Brine sources, includes lithium found inr salt water deposits, and include lakes, salars, oilfield brines, and geothermal brines. Due to uncertainty surrounding the viability of extraction lithium from seawater, seawater is currently excluded from brines. Typically, the brines are concentrated via evaporation ponds before the lithium is precipitated in the form of lithium chloride or lithium carbonate [2]. In 1936, lithium production from brines first commenced from the Searles Lake in the USA [2]. Since then brines with high lithium concentrations have been exploited principally in South America and China. Oilfield brines are underground brine reservoirs that are located with oil, e.g., Smackover formation in Arkansas/Texas. Geothermal brines are underground brines naturally heated, e.g., in the Salton Sea California. Hectorite is a lithium bearing clay predominately found in the McDermitt Caldera deposit of Nevada/Oregon. Finally, jadarite is a newly discovered lithium-boron containing mineral found in Serbia [3].
In determining the amount of lithium that can be produced from these sources, the terms Resource, Recoverable Resources and Ultimately Recoverable Resources will be used. First, the term Resource is the amount of lithium that is physically in a geologic deposit, and the deposit is either currently commercially feasible for extraction or is likely to be in the future. The Recoverable Resources is the amount of the resource that is assumed to be extracted in the future (accounting for mining losses, and resources left in the deposit due to issues such as depth, grade, etc.). The Ultimately Recoverable Resources is the Recoverable resources plus all historic cumulative production. There are formal guidelines for calculating reserve and resource estimates in some countries, such as the JORC Code in Australia, NI 43–101 in Canada and SAMREC in South Africa, which all use the terms of ore reserves and mineral resources in distinct ways. In strict terms, ore reserves are profitably mineable at present, based on consideration of mining, metallurgical, economic, marketing, legal, environmental, social and governmental factors. Mineral resources are similar to ore reserves but have had less assessment of the above factors and are hence less certain as to profitability. In general, most mineral resources are converted to ore reserves over time once a project is developed, mineral demands grow and so on. Given this, estimates of Recoverable resources are independent of current factors (by definition) and hence it is considered more appropriate to use for long-term modelling purposes.
2. Lithium Demand and Supply
2.1. Historic Production and Demand
Historic lithium production is available in the literature, and a large variety of sources [2,4–13] were used to collate world lithium production statistics by individual countries. The historic production of lithium is shown in Figure 1 and the collation of the literature statistics is available in the electronic supplement. Significant production of lithium only commenced after World War II. From 1955 to 1980 production was steady and averaged ∼5 kt Li/y, and the principal producers of lithium were the USA and Zimbabwe. Since 1980 production has been increasing at an average rate of 5.1% per year, to reach ∼25 kt Li/y in 2008; and the principal producers today are Australia, China and Chile. The cumulative amount of lithium produced to date is estimated at 0.5 Mt Li and has been split where possible into rock and brine sources as shown in Figure 1.
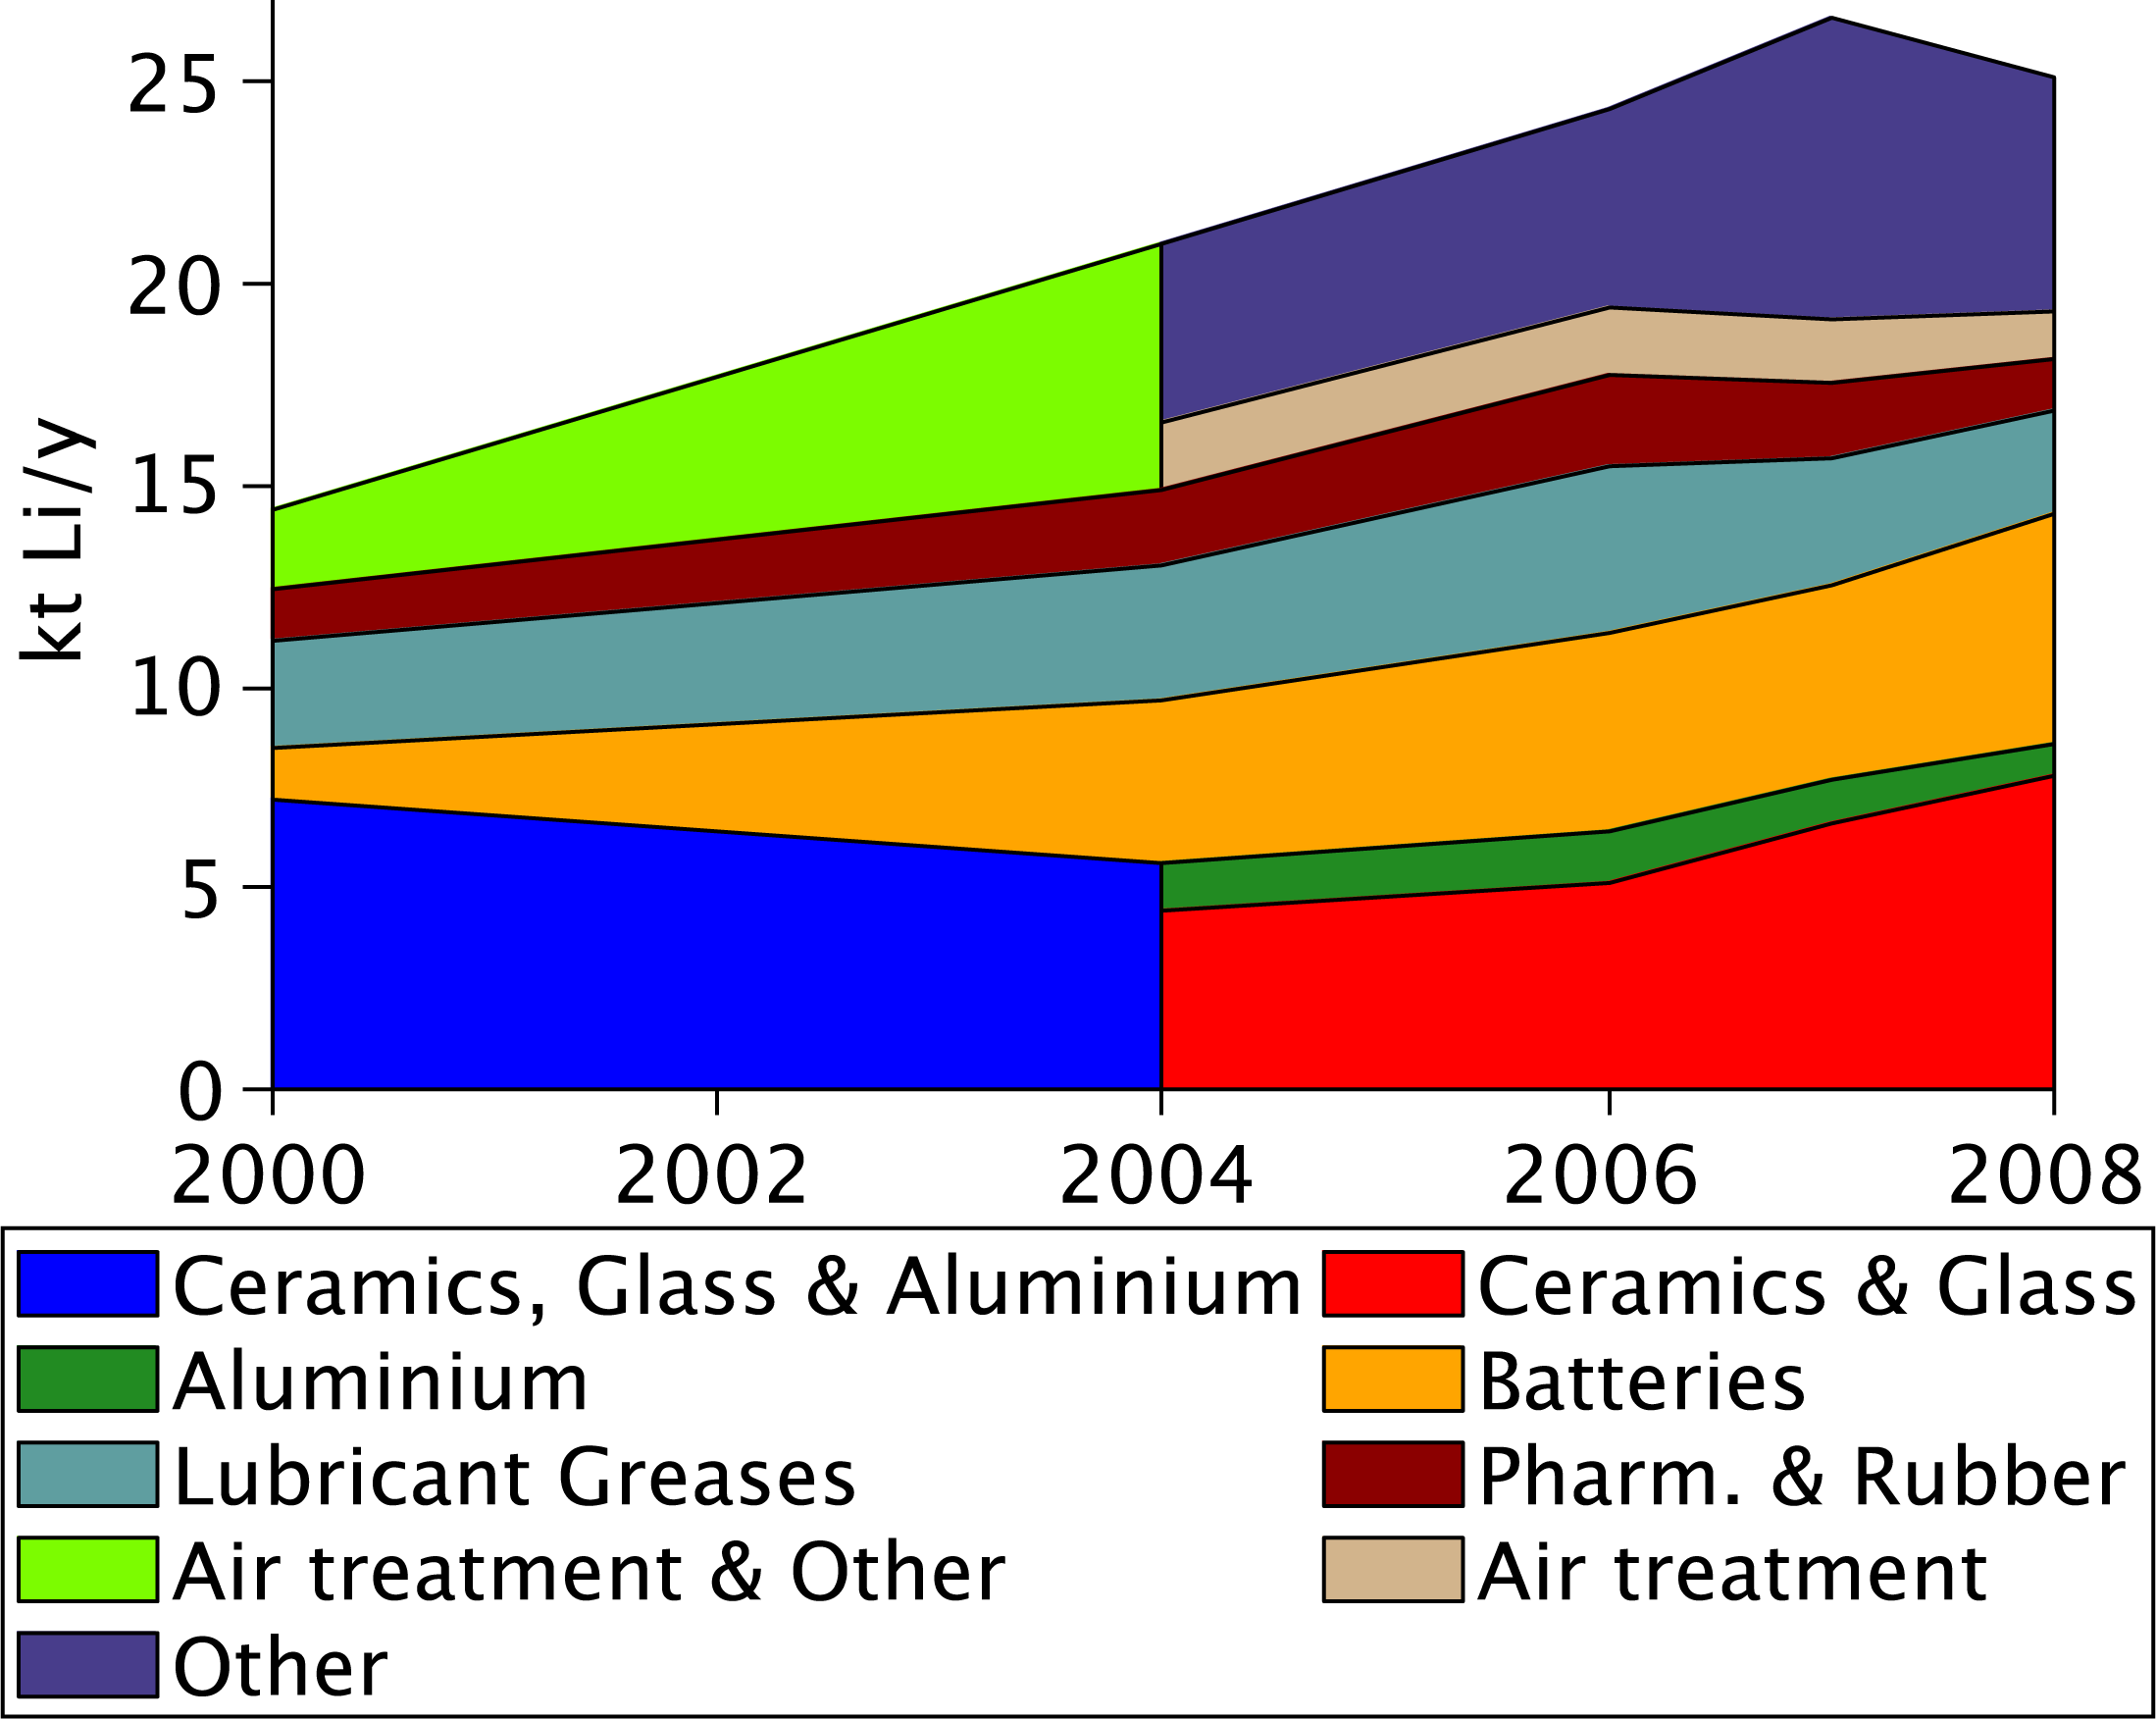
The percentage of worldwide lithium consumption by use is known [4] and assuming that historic lithium production reflected lithium consumption (i.e., recycling, stockpiling etc. of lithium has been negligible) then the amount of lithium consumption by use can be approximately determined as shown in Figure 2. Currently, the main consumption of lithium is in the glass/ceramics manufacturing industry where lithium lowers the melting point of the glass and ceramics [2], and for light weight lithium-ion batteries. Lithium is also used in the production of aluminium, temperature tolerant lubricant greases, catalysts for rubber manufacturing, air conditioning and a variety of other applications.
2.2. Forecasted Demand and Supply
There have been three literature projections of lithium supply and/or demand [14–16].
McNulty and Khaykin have projected lithium demand and production to 2020 [14]. McNulty and Khaykin estimate demand steadily growing to 37.7 kt Li/y by 2020 with an average growth rate of 7.4% between 2008 and 2020, in comparison they project supply to reach only 27 kt Li/y in 2020 from 21 kt Li/y in 2008 with an average growth rate of 2.1% between 2008 and 2020. The authors of this study also estimate production in 2008 to be 24 kt Li/y. The method used by McNulty and Khaykin to project supply and demand is not stated [14]. In addition, recycling is not mentioned in the report [14].
Angerer et al. [15] calculated two projections of lithium demand by assuming a 50% and 85% penetration of lithium vehicles by 2050 and used a systems dynamics model to calculate demand and recycling. The 50% and 85% penetration scenario have demand reaching 178 and 590 kt Li/y in 2050 with a cumulative production between 2008 and 2050 of 3.6 and 9.0 Mt Li respectively. By 2050 Angerer et al. estimate that lithium recycling will reach 51 and 185 kt Li/y for the 50 and 85% penetration scenarios [15]. Hence by 2050 primary lithium production will need to reach between 127 and 405 kt Li/y.
Carles modelled lithium supply, consumption and recycling using a stocks and flows model for the world by source (brines, ores, recycling and sea water) to 2200 [16]. Most of the stocks and flows scenarios project severe oscillation between brine and rock sources of lithium due to the energy requirement to extract brines and rocks becoming equal. This is due to the model applying an on/off control selecting the cheapest source of lithium, hence when prices are approximately equal instability in the model can be generated [16]. The model indicates that non-seawater primary lithium production will reach a level of 0.61–1.40 Mt Li/y between 2050 and 2090 (after this time, production oscillates). Further, recycling is projected to plateau at 1.04 Mt Li/y between 2100 and 2200 and annual consumption is anticipated to plateau at 1.7 Mt Li/y between 2110 and 2200 [16].
The long term projections of lithium by Carles and by Angerer et al. assume or project lithium production reaching very large rates from 127 kt Li/y to 1400 kt Li/y [15,16]. In order to see whether the uncertainty from literature projections can be reduced, it is important to look closely at the lithium supply and demand.
3. Lithium Deposits
The review of lithium resource and reserve estimates have been split into Brine and Rock sources. As mentioned in the definitions section, Brine refers to lakes, salars, oilfield brines and geothermal brines, whereas Rock refers to minerals notably spodumene and jadarite as well as lithium bearing clays generally termed hectorite.
3.1. Brines
Lithium brines are found principally in Argentina, Bolivia, Chile, China and the USA [1,2,17,18]. Lithium brine deposits have several key geologic and/or geographic characteristics such as lithium grade, the magnesium to lithium ratio, and the evaporation rate [1,2,17,18]. Higher grades of lithium and higher evaporation rates decrease the amount of time the brines have to be in evaporation ponds. Finally, lower magnesium to lithium ratios reduce the cost of production, as lower ratios make it easier to separate the magnesium from the lithium [14]. Table 1 has lithium brine characteristics for various deposits.
The Bolivian Salar de Uyuni is a very large lithium deposit [19]. Currently, only a small pilot plant is in operation [20], with full scale production anticipated to commence in 2014 [21]. The Bolivian and South Korean governments have agreed to develop the Salar de Uyuni [20] and the full scale production capacity is anticipated to be 20–30 kt Li/year [19].
The Bolivian Government through Corporación Minera de Bolivia (COMIBOL) has stated that Uyuni has very large in situ resources of 350 Mt of lithium [22]. This claim has been investigated by Gruber and Medina who critically examined the concentration, depth and porosity of the deposit [23,24]. Gruber and Medina determined an average depth of 5.07 m, average lithium grade of 0.0532% Li and porosity of 35% to determine that the in situ resources were ∼10 Mt Li. Based on the estimates by Gruber and Medina, the COMIBOL’s claim of 350 Mt of in situ resources is unlikely to be correct unless further testing reveals the depth of lithium resources to be an order of magnitude deeper than the Gruber and Medina estimate of 5 m.
3.2. Rock
Lithium rock resources are found principally in Australia, Canada, USA, Democratic Republic of the Congo (DR Congo) and Serbia [1,2,17,18,23]. Rock deposits are generally characterised by the lithium grade of the deposit and by iron content (an impurity that is not desired by end users) [1,2,17,18,23]. Table 2 has the characteristics of lithium rock deposits [1,17,18,23]. It is believed that there is potentially a large spodumene deposit in Afghanistan [2], however due to considerable uncertainty on size and characteristics of this deposit(s), Afghanistan has been excluded from the study.
The Greenbushes spodumene mineral deposit in Western Australia is currently the largest rock lithium producer at ∼6.5 kt Li/y or approximately a quarter of the world’s lithium production (see electronic supplement). The open cut mine had in 1993 an overburden ratio of 1.8:1 and a raw lithium grade of 1.86 wt.% [2]; further the iron content of the raw ore is 0.94% Fe2O3, which is slightly higher than the North Carolina Spodumene belt iron content of 0.6%–0.9% Fe2O3 [2]. The mine presently sells concentrated and glass grade spodumene ore. A pilot plant built to produce lithium carbonate was abandoned shortly after being commissioned due to it being uneconomical compared with brine producers [2].
4. Ultimately Recoverable Resources
4.1. Literature Estimates
Ultimately Recoverable Resources estimates for lithium do not exist. As a result it is necessary to estimate the URR via reserve and resource estimates instead.
4.2. Reserve and Resource Estimates
There are numerous reserve and resource (and various other terms see Table 3) estimated for the world, and these are summarised in Table 3. The terms reserve, resource, recoverable resources, broadbased reserves and in-situ resources were used by different literature sources and may not reflect the definition of resources or reserve presented in this paper. Further, it is unclear as to what a broadbased reserve used in [25] is defined. It should be noted that given the wide array of countries and deposits included, the resource, reserve etc. estimates shown in Table 3 are indicative only and not all may be consistent with statutory mineral resource reporting codes such as Australia’s JORC code. They provide a useful, if not the only, benchmark for comparison in any case [26].
Currently there has been considerable debate surround the resources, reserves etc. of lithium [17,18,23,25,27–29]. In particular Tahil in 2007 indicated that the total amount of recoverable lithium reserves is 6.6 Mt Li [28]. Evans contested Tahil’s claims and indicated that lithium resources were 28.4 Mt Li [29]. Tahil and Evans then revised their lithium resources with Tahil estimating a resource of 17.4 Mt Li and Evans estimating 29.8 Mt Li [17,27]. Yaksic and Tilton in 2009 calculated the in-situ resources of lithium to be 64.0 Mt Li [18]. Clarke and Harben determined that “broad based reserves” (the precise definition of the term broad based reserve as used by Clarke and Harben is unknown) of lithium were 39.4 Mt Li [25]. Similarly, Gruber and Medina recently calculated the world’s lithium resource to be 38.3 Mt Li [23]. Finally, Mohr et al. recently estimated the world’s lithium resources to be 50.2 Mt Li [1].
The estimate from Tahil [27] indicates a world reserve of 4 Mt (Li), whereas all other literature estimates have the Atacama salar reserves alone as greater than 5 Mt (Li). The USGS reserve estimate is also relatively low, however this is due to some countries such as Bolivia and USA being excluded. The estimate by Tahil [27] also ignores the contribution of rock sources of lithium, despite Australian spodumene production currently accounting for around 25% of total lithium production in the world. For these reasons the estimate by Tahil [27] is assumed to be a significant underestimate the actual lithium reserves, and ignored.
4.3. Estimated Ultimately Recoverable Resources
The lack of any literature proposing Ultimately Recoverable Resources (URR) estimates, means that determining the URR is difficult. If historic production were considerable then empirical techniques such as the Hubbert Linearisation technique [30] could be used to calculate the URR. However, because cumulative production totals 0.5 Mt of Li compared to resources that are typically larger than 20 Mt of Li, the URR will be estimated via literature reserve and resource estimates. The literature values presented in Table 3 will be used to estimate the recoverable resources. It should be stressed that the literature estimates to date have been inconsistent in terms of definitions, and broadly speaking the use of formal resource/reserve codes such as JORC or NI 43-101 have not been applied in general. Due to this inherent uncertainty in current literature estimates, three scenarios were used in an attempt to create upper and lower bounds on the ultimately recoverable resources in currently known deposits. It is highly likely, given how very immature the lithium market is, that further deposits will be found.
The Case 1 estimate will attempt to underestimate the URR value by combining cumulative production and the lowest reserve or resource estimate that is presented in the literature (ignoring Tahil’s [27] estimates). The Case 3 estimate will try to overestimate the URR value by combining cumulative production to the highest reserve or resource estimate that is in the known literature. Mohr et al. [1] and Yaksic and Tilton [18] present two estimates: one which represented the resources in the deposit and the other that reflects the portion that is recoverable resources or reserves. For this reason the Case 3 estimate will ignore the resource estimates of Mohr et al. [1] and Yaksic and Tilton [18] and only look at the recoverable resources or reserves estimates by these authors. Finally Case 2 represents the URR values the authors cautiously assume to be correct given the current available information. The Case 2 will combine cumulative production with the reserve estimate by Mohr et al. [1] and this value will represent the authors’ best estimate to the actual URR value. Table 4 displays the summary of the URR estimates used for all countries and highlights the range is between 19.3 and 55.0 Mt of Li, with a best estimate of 23.6 Mt of Li. It is reiterated strongly here that the use of literature resource and reserve estimates to calculate the ultimately recoverable resources is due to the lack of resource estimated in the literature based on JORC or other formal codes.
5. Future Scenarios: Forecasting Lithium Supply and Demand
The assumptions used in calculating the supply and demand will be described in this section. The lithium market is in its infancy, hence there is considerable uncertainty in the assumptions on future production, demand and recycling. For consistency the assumptions will be linked to the same source, hence the most complete source will be used namely Angerer et al. [15,31]. As a result of this considerable uncertainty, the demand and supply models are provided for readers in the electronic supplement so that the assumptions can be modified by the reader quickly and easily as new information becomes available.
5.1. Demand
One demand projection will be used in the analysis. The demand for lithium is difficult to project due to the uncertainty over the growth and continuing popularity in lithium based electric vehicles. A demand will be estimated in a simplistic format assuming that lithium based electric vehicles dominate vehicle demand in the future. The reason for this selected demand is to determine if lithium supplies are sufficient to meet this scenario, and not to claim that this scenario will occur, the authors recognise that non-lithium batteries may become popular. The future demand for lithium therefore in the decades ahead is anticipated, e.g., by Angerer et al., to be dominated by lithium batteries. Angerer et al. anticipate total lithium demand in 2050 to be 178–590 kt Li/y with non-battery demand expected to be ∼50 kt Li/y. In calculating the demand for lithium it was assumed that all demand for lithium is in electric vehicle using lithium ion batteries. The demand for lithium batteries will be determined by calculating the number of new electric vehicles produced in a given year and by assuming each car has a battery capacity of 20 kWh and that 0.15 kg of lithium is needed per kWh [31]. Hence 3 kg of lithium is assumed to be needed for each electric vehicle. The number of electric cars to be built will be estimated by projecting the future population of the world, the number of people per car and the number of cars that are electric vehicles. First, the population of the world in billion p(t) is assumed to follow an asymmetrical S curve and stabilise at 10 billion people (The asyummetrical S curve has been fitted in [32] to match as closely as possible to the UN projections [33]) (pmax = 10) according to the following equation [32]:
There are currently around 800 million cars in the world [15], representing ∼8.6 people per car in the world (Cmax = 8.6). It is assumed that the number of people per car will decline and stabilise at 3.5 people per car (Cmin = 3.5). In comparison [16] has the people per car declining to a value of 3 by 2100. Mathematically let C(t) be the number of people per car in the world then:
The fraction fE(t) of cars that are assumed to be electric vehicles are assumed to follow a symmetric S curve shape:
The number of electric vehicles E(t) in the worlds fleet is therefore E(t) = p(t)fE(t)/C(t). It is assumed that the life of the cars is 10 years (this is similar to other estimates on the life of an electric vehicle battery e.g., [34]) and that the number of new electric vehicles built (NE[t]) is the annual increase in the electric vehicle fleet plus the number of vehicles taken out of the fleet. Mathematically this is:
5.2. Supply
The supply of lithium S(t) is determined by combining the amount of lithium produced with the amount recycled, that is:
5.2.1. Production
Projections of lithium production for the world were obtained by applying the static version of an algorithm based model [32]. The model was not run in dynamic mode (where demand and supply interact) due to an exogenous demand described in Section 5.1 being used. This model has been successfully used to model coal production and unconventional oil production [32]. Briefly, the model takes information on the start date, mine production rate, mine life and URR for a given region or country. The model then uses the information to bring on-line idealised production profiles (4 year ramp up, followed by constant annual production, finally a 4 year decline to shutdown) of mines until the URR for the region is exhausted. By adding the production profiles of the various mines the production for the region can be approximated. The model operated in the Static version, that is, demand has no influence in the calculation of production.
The key inputs into the model are historic production and URR estimates. The constants for the size of mines are selected to represent the estimated average annual mine production and the rate constant is selected in such a way that ensures that the modelled production is as close as possible to actual historical production; all the constants used in the modelling are provided in the electronic supplement. In addition, the model of supply is included in the electronic supplement so that any assumptions can be changed by the reader if they wish. A detailed description of the model is provided in the literature already [32]. The key main inputs into the model (the URR and historic production) are shown in Table 4 and Figure 1.
5.2.2. Recycling
Since the vast bulk of the lithium demand is anticipated to come from lithium batteries, it is anticipated that lithium recycling will become common. It is assumed that the fraction of lithium supply being recycled will start at 0% (it is currently estimated at less than 1% [35]) and approach a limit of 80% (As a comparison steel recycling in 2008 increased to over 80% [36]), achieving 40% in 2050 (A 40% recycling in 2050 is similar to Carles 2010 [16] scenario 2 which indicated recycling account for 41% of consumption in 2054). Mathematically this fraction fR is determined as:
It is assumed that the life of the vehicles is 10 years, hence the amount of lithium recycled R(t) is determined by:
6. Results
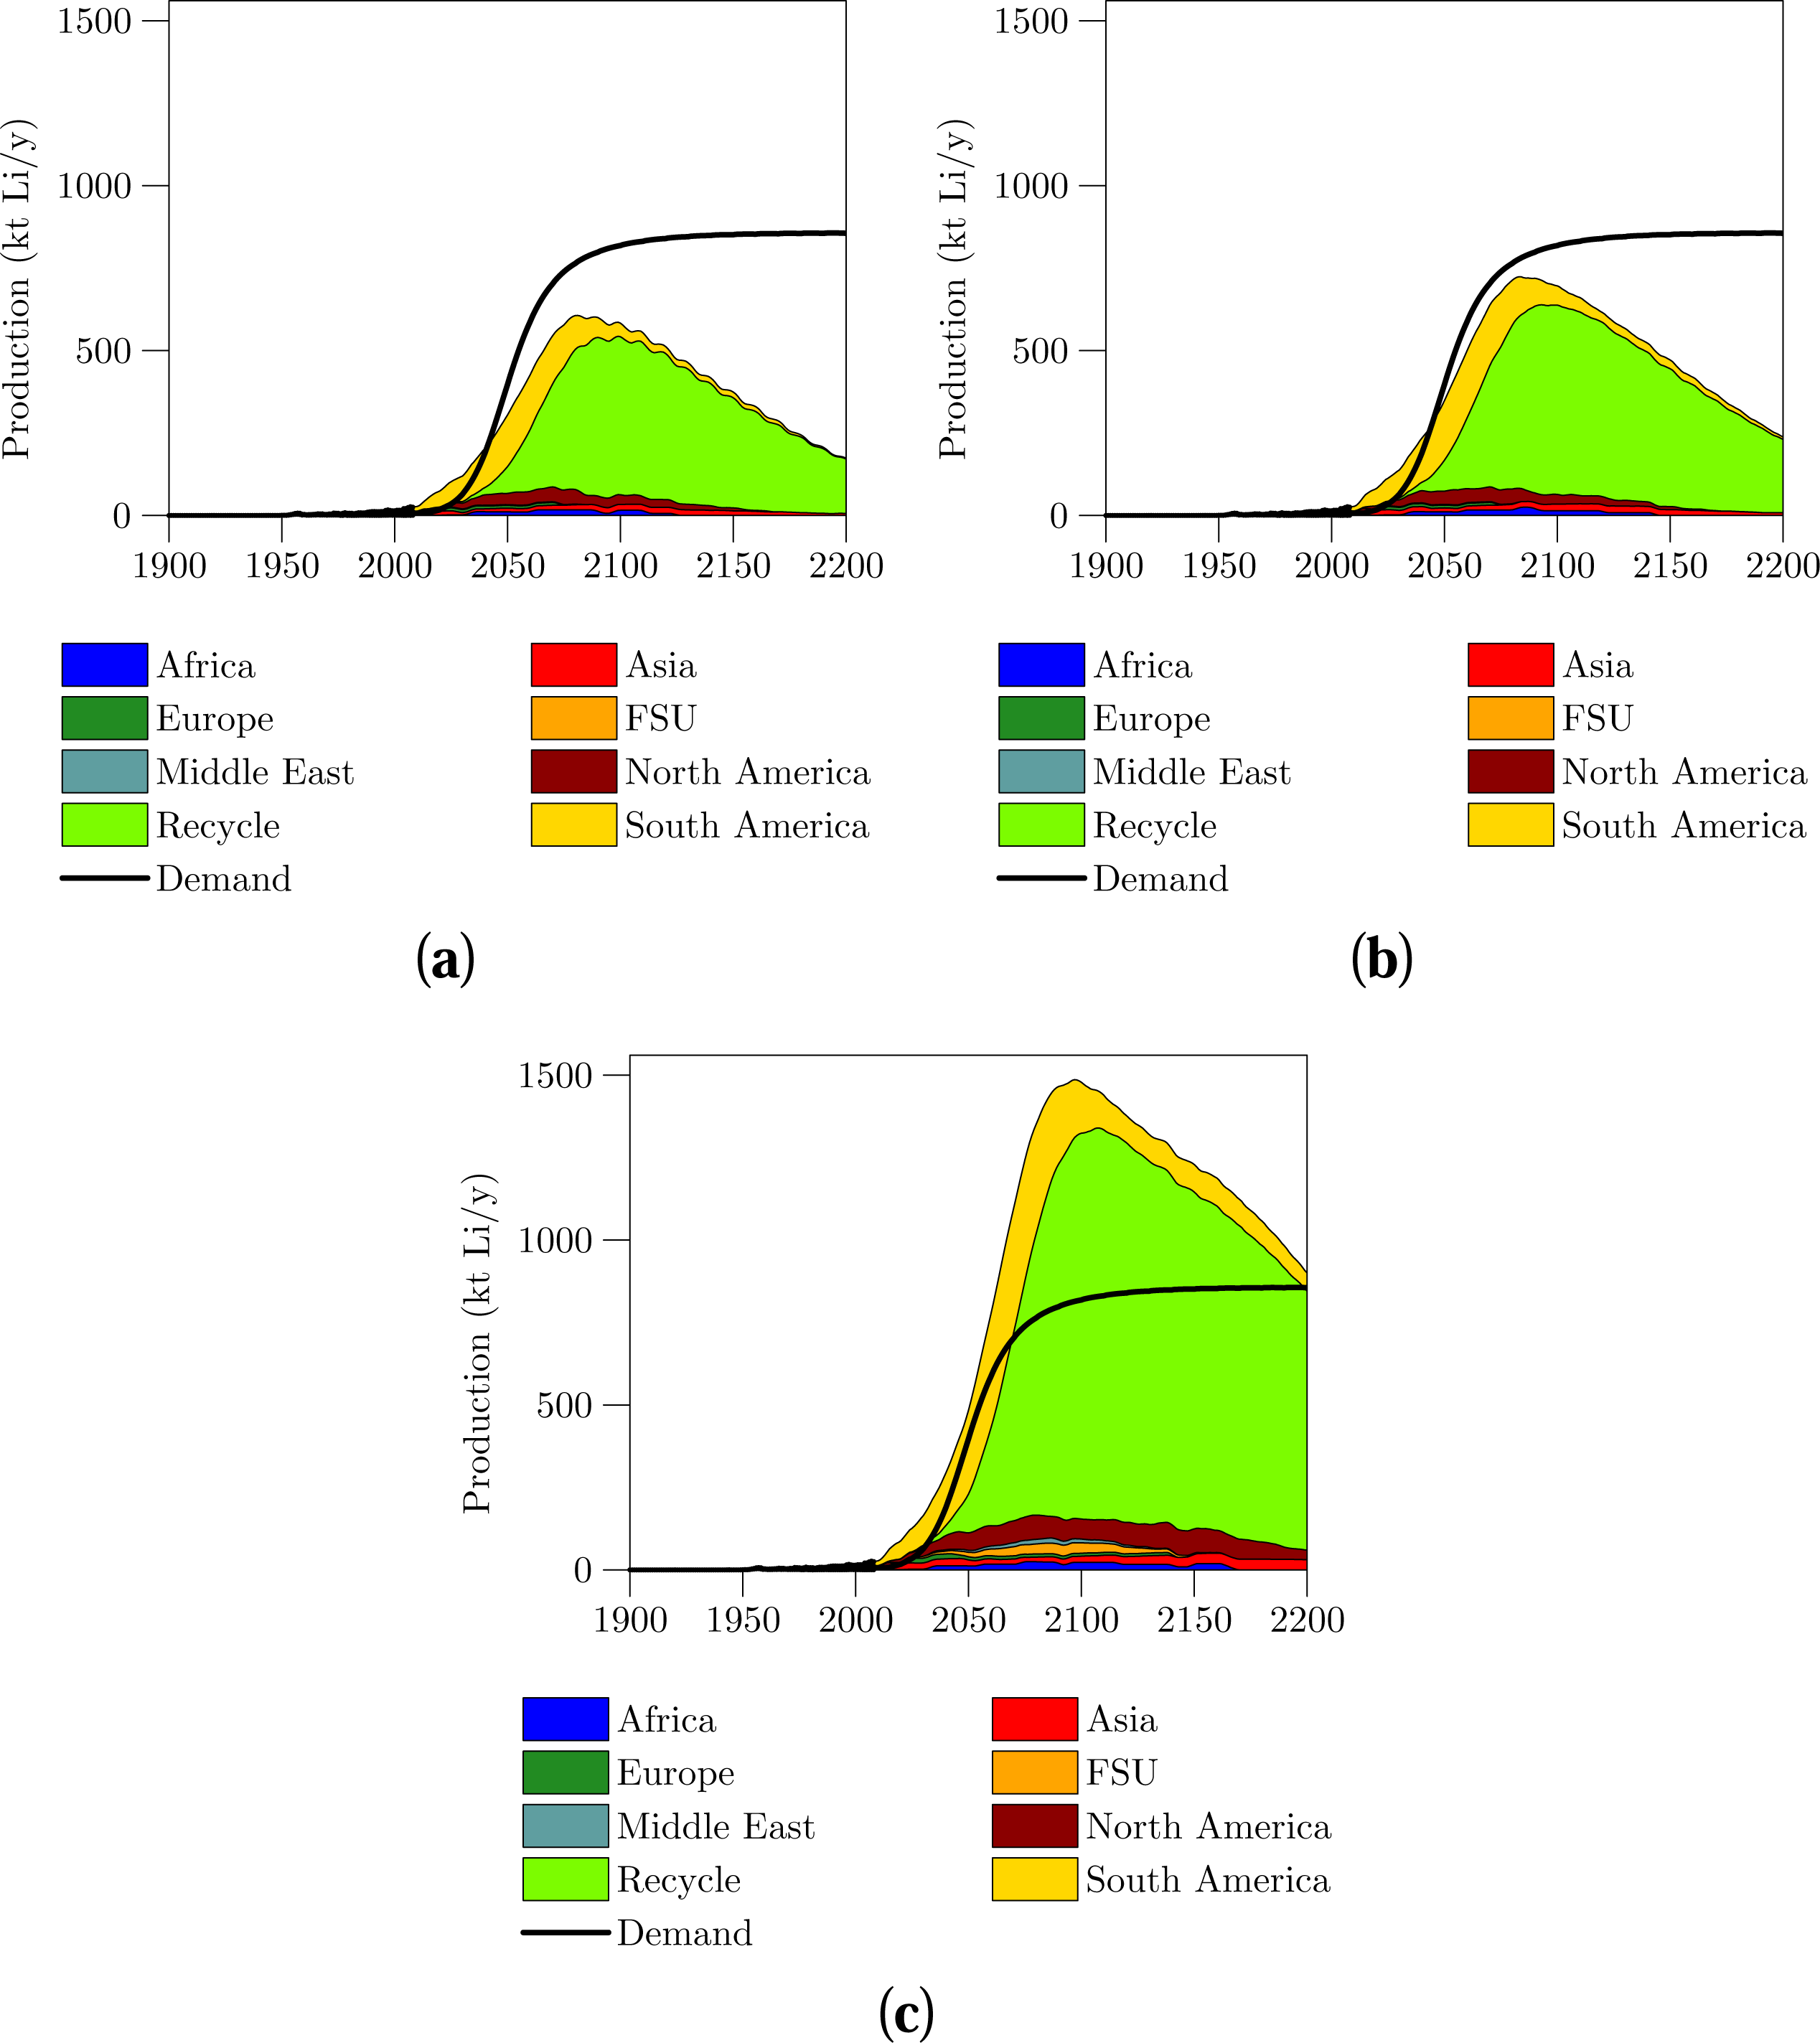
The projections of the three scenarios for supply and demand are shown in Figures 3 and 4. The peak year and rates for the lithium supply are shown in Table 5. Detailed information including the projections of all countries as well as peak year and rate values can be found in the electronic supplement. The projections in Figures 3 and 4 are extended to 2200 in order to show as much of the overall supply profile as possible.
7. Discussion
The projections in lithium supply shown in Figures 3 and 4 are very similar up to 2050. All three supply scenarios indicate that supply in 2050 will be between 305 and 485 kt Li/y which is an order of magnitude larger than the current 26 kt Li/y. The lithium market can expand for several decades with no shortages in lithium likely. Specifically, the amount of lithium URR that exists is not important to determine at this stage as lithium is very likely to be abundant for several decades ahead. From 2030 onwards, growth in supply is governed by the growth in recycling, this leads to recycling dominating the supply of lithium from 2050 onwards. If demand for lithium battery electric vehicles grows sharply then it is important that a recycling industry be set up to ensure adequate supplies of lithium.
The supply of lithium from recycling and demand for lithium are very uncertain and sensitive to the input assumptions. For instance if the life expectancy of a electric vehicle is increased from 10 to 12 years, then recycled production decreases by up to 109 kt Li/y (in the Case 3 scenario year 2087). Similarly by changing the car life from 10 to 12 years also affects the demand for lithium, with demand in 2200 decreased from 856 kt Li to 714 kt Li. In addition if the maximum recycling rate of lithium is reduced from 80% to 60% then the peak amount of lithium recycled decreases by 45%–50%. This further highlights how sensitive the recycling and demand assumptions are to the input values. As mentioned both the supply and demand models for all scenarios are provided in the electronic supplement to enable the reader to modify the inputs to suit.
The demand estimate can be compared to literature estimates. The demand assumed here reaches 400 kt Li/y in 2050 and approaches a limit of 857 kt Li/y by 2200. In comparison Angerer et al. [15] estimated lithium demand to be 178–590 kt Li/y in 2050 and Carles [16] estimated demand approaching 1700 kt Li/y in 2200. The demand for lithium by McNulty and Khaykin [14] indicate demand of 37.7 kt Li/y in 2020, while here a demand of 17.2 kt Li/y is assumed. The reason the lithium demand projection presented here is initially lower is due to demand being assumed to be from electric vehicles only, however in the longer term future, it is assumed that demand for lithium in electric vehicles will dominate all other demand. The calculations of demand are shown in the electronic supplement.
The projections determined compare well to literature projections. First, Angerer et al. [15] projected lithium recycling to be 51–185 kt Li/y in 2050; by comparison the projections presented here fall in the same range in 2050 at 81–118 kt Li/y. Further, Angerer et al. indicate that production in 2050 needs to be between 127 and 405 kt Li/y in order to meet demand, which compares well to the projections here of 224–367 kt Li/y in 2050. However, Carles [16] projects non-seawater lithium production to reach a maximum of 0.61–1.40 Mt Li/y, which is considerably higher than the maximum production levels projected here of 0.24–0.53 Mt Li/y.
The three projections of lithium supply and one demand projection need to be interpreted carefully. Numerous events could occur that may result in lithium supply being unable to meet demand. For instance lithium production from the large Salar de Uyuni deposit in Bolivia may be delayed or significantly reduced due to a lack of investment on infrastructure by the Bolivian Government. Alternatively, a lithium recycling infrastructure may not be created smoothly or fast enough due to a possible belief that lithium resources are abundant hence recycling is not critical. Issues such as peaking fossil fuel may result in difficulties to extract, transport and refine the lithium resources into lithium carbonate. Additionally, social or environmental issues surrounding the extraction of lithium may limit the exploitation of lithium resources in some locations. While it appears that lithium can be supplied to meet demand for the long term, significant issues may arise in the future.
As a further qualification, lithium production is still in its infancy and more deposits or lithium bearing minerals are likely to be discovered. For instance, in 2006 jadarite, a new lithium bearing mineral, was discovered in Serbia, and the deposit contains a similar amount of recoverable lithium resources as the Greenbushes deposit. Ultimately there is no immediate issue with the supply of lithium and hence it is not important to determine the precise lithium URR.
8. Conclusions
Lithium is a critical component of lithium battery electric vehicles. The amount of ultimately recoverable resources of lithium based on currently available information has been examined and found to lie between 19.3 and 55.0 Mt Li and, with a best guess of 23.6 Mt Li based on currently known deposits. The large brine deposit at Uyuni and the Greenbushes rock deposit were examined in detail. The review of lithium availability indicates that there is sufficient lithium to ensure significant lithium battery electric vehicles in the future. It is again stressed that this does not imply that lithium battery vehicles will be used significantly in the future, merely that there is sufficient lithium available in order for this to occur. If lithium battery vehicles will dominate in the future then it is important that policy makers ensure that lithium batteries are recycled, as recycled lithium represents a significant proportion of total lithium supply in the future but is currently insignificant. As both the lithium battery electric vehicles and lithium markets are in their infancy, it is important to note that future supply and demand is extremely uncertain, and the reality in 2050 and beyond is likely to be vastly different to that projected here.
9. Supplementary Information
The Supporting Information contains projections of lithium production for all countries, as well as peak year and rate information.
minerals-02-00065-s001.zipReferences
- Mohr, S.H.; Mudd, G.M.; Giurco, D. Lithium Resources and Production: A Critical Global Assessment; Report prepared for CSIRO Minerals Down Under Flagship; Department of Civil Engineering, Monash University Institute for Sustainable Futures, University of Technology: Sydney, Australia, 2010. [Google Scholar]
- Garrett, D.E. Handbook of Lithium and Natural Calcium Chloride: Their Deposits, Processing, Uses and Properties, 1st ed; Elsevier: Amsterdam, The Netherlands, 2004. [Google Scholar]
- Superman Beware, Kryptonite is Real; National History Museum: 24 April 2007. Available online: http://www.nhm.ac.uk/about-us/news/2007/april/news11392.html (accessed on 4 January 2012).
- US Bureau of Mines; US Geological Survey. Minerals Yearbook, Metals and Minerals; US Geological Survey: Volcano, HI, USA, 1925–2010. Available online: http://minerals.usgs.gov/minerals/pubs/commodity/myb (accessed on 17 June 2010).
- Mineral Commodity Summary Lithium; US. Geological Survey: Volcano, HI, USA, 1976–1985, 1991–2010. Available online: http://minerals.usgs.gov/minerals/pubs/mcs (accessed on 17 June 2010).
- Government of WA, Western Australian Mineral and Petroleum Statistical Digest; Department of Mines and Petroleum, Government of Western Australia: Perth, Australia, 1984–2010.
- Government of WA, Department of Mines, and Petroleum Resources Data Files; Department of Mines and Petroleum: Perth, Australia, 2010; Available online: http://www.dmp.wa.gov.au/1521.aspx (accessed on 28 April 2010).
- Minerals, UK. World Mineral Statistics; British Geological Survey: Nottinghamshire, UK, 1913–2010. Available online: http://www.bgs.ac.uk/mineralsuk/statistics/worldArchive.html (accessed on 3 July 2010).
- Anstett, T.F.; Krauss, U.H.; Ober, J.A.; Schmidt, H.W. International Strategic Minerals Inventory Summary Report—Lithium; USGS: Denver, CO, USA, 1990. [Google Scholar]
- Crowson, P. Minerals Handbook; Stockton Press: New York, NY, USA, 1980, 1987–1992. [Google Scholar]
- ABS, Australian Bureau of Statistics Yearbook; ABS: Canberra, Australia, 1961; Available online: http://www.abs.gov.au (accessed on 20 April 2010).
- Rothwell, R.P. Mineral Industry, Its Statistics, Technology, and Trade; Engineering and Mining Journal, Scientific Publishing Company: New York, NY, USA, 1899–1937. [Google Scholar]
- NSW Legislative Assembly, Annual Report of the Department of Mines, New South Wales; Alfred James Kent Government Printer: Sydney, Australia, 1960–1963.
- McNulty, J.P.; Khaykin, A. Lithium: Extracting the Details on the Lithium Market; Credit Suisse: Zurich, Switzerland, 2009. Available online: http://www.scribd.com/doc/20604464/Lithium (accessed on 4 January 2012).
- Angerer, G.; Marcheider-Weidemann, F.; Wendl, M.; Wietschel, M. Lithium für Zukunftstechnologien—Nachfrage und Angebot unter Besonderer Berücksichtigung der Elektromobilit¨at; Fraunhofer Fraunhofer ISI: Karlsruhe, Germany, 2009. [Google Scholar]
- Carles, L. Modelling Long-Term Global Lithium Stocks and Flows. Master Thesis, École Polytechnique Fédérale de Lausanne: Lausanne, Switzerland, 2010.
- Evans, R.K. An Abundance of Lithium Part Two. 2008. Available online: http://www.evworld.com/library/KEvansLithiumAbunancept2.pdf (accessed on 17 June 2010). [Google Scholar]
- Yaksic, A.; Tilton, J.E. Using the cumulative availability curve to assess the threat of mineral depletion: The case of lithium. Resour. Policy 2009, 34, 185–194. [Google Scholar]
- Moores, S. Behind Bolivia’s Lithium; Industrial Minerals: Sacramento, CA, USA; September; 2009. [Google Scholar]
- Moores, S. Bolivia Strikes Uyuni Li Deal with South Korea; Industrial Minerals: Sacramento, CA, USA; September; 2009. [Google Scholar]
- Mapstone, N. Bolivia Salt Flat Stores Global Battery Power Financial Times. 2010.
- COMIBOL. The reserves in Uyuni COMIBOL, 2010. Available online: http://evaporiticosbolivia.org/indexi.php?Modulo=Temas&Opcion=Reservas (accessed on 23 July 2010).
- Gruber, P.; Medina, P. Global Lithium Availability: A Constraint for Electric Vehicles? Master of Science; University of Michigan: Ann Arbor, MI, USA; April; 2010. [Google Scholar]
- Gruber, P.W.; Medina, P.A.; Keoleian, G.A.; Kesler, S.E.; Everson, M.P.; Wallington, T.J. Global lithium availability: A constraint for electric vehicles? J. Ind. Ecol 2011, 15, 760–775. [Google Scholar]
- Clarke, G.M.; Harben, P.W. Lithium Availability Wall Map, 2009. Available online: http://www.lithiumalliance.org/about-lithium/lithium-sources/85-broad-based-lithium-reserves (accessed on 30 July 2010).
- Australasian Code for Reporting of Exploration Results, Mineral Resources and Ore reserves: The JORC, 2004. Available online: http://www.jorc.org/pdf/jorc2004print_v2.pdf (accessed on 5 September 2010).
- Tahil, W. The Trouble With Lithium 2; Meridian International Research: Martainville, France, 2008. Available online: http://www.meridian-int-res.com/Projects/Lithium_Microscope.pdf (accessed on 17 June 2010).
- Tahil, W. The Trouble With Lithium; Meridian International Research: Martainville, France, 2007. Available online: http://www.meridian-int-res.com/Projects/Lithium_Problem_2.pdf (accessed on 17 June 2010).
- Evans, R.K. An Abundance of Lithium. March 2008. Available online: http://www.che.ncsu.edu/ILEET/phevs/lithium-availability/AnAbundanceofLithium.pdf (accessed on 17 June 2010). [Google Scholar]
- Deffeyes, K.S. World’s oil production peak reckoned in near future. Oil Gas J 2002, 100, 46–48. [Google Scholar]
- Angerer, G. The case of lithium. Proceedings of the Conference Eco-Efficient Economy, Linköping, Sweden, 3 November 2009.
- Mohr, S.H. Projection of World Fossil Fuel Production with Supply and Demand Interactions; PhD thesis, The University of Newcastle: Newcastle, UK; 2010. [Google Scholar]
- World Population Prospects; The 2008 revision. United Nations: New York, NY, USA, 2009. Available online: http://esa.un.org/unpp (accessed on 12 October 2009).
- Becker, T.A.; Sidhu, I.; Tenderich, B. Electric Vehicles in the United States, A New Model with Forecasts to 2030; Center for Entrepreneurship and Technology, University of California: Berkeley, CA, USA, 2009. Available online: http://cet.berkeley.edu/dl/CET_Technical%20Brief_EconomicModel2030_f.pdf.
- Graedel, T.E.; Allwood, J.; Birat, J.-P.; Reck, B.K.; Sibley, S.F.; Sonnermann, G.; Buchert, M.; Hagelüken, C. Recycling Rates of Metals—A Status Report, A Report of the Working Group on the Global Metal Flows to the International Resource Panel. Available online: http://www.unep.org/resourcepanel/Portals/24102/PDFs/Metals_Recycling_Rates_110412-1.pdf (accessed on May 2011).
- Steel Recycling Rates; Steel Recycling Institute: Pittsburgh, PA, USA, 2011. Available online: http://www.recycle-steel.org/en/Recycling%20Resources/Steel%20Recycling%20Rates.aspx (accessed on 5 January 2012).


| Country | Deposit | Li grade (wt.%) | Mg:Li (−) | Evaporation rate(m/y) | Elevation (km) | Surface area (103 km2) | Porosity (%) | Depth (m) | Density (g/cm3) | Commenced |
|---|---|---|---|---|---|---|---|---|---|---|
| Argentina | H. Muerto a | 0.062 | 1.37 | 2.6–2.8 | 3.7–4.3 | 565 | 15 | 15 | ∼1.2 | 1997– |
| Argentina | Rincon | ∼0.04 | ∼8.5 | 2.6 | 3.7 | 0.25–0.28 | 23–30 | 30–40 | 1.204 | ∼2011 |
| Argentina | Olaroz | 0.07 | 2.8 | 2.6–2.8 | 0.12 | 6–8 b | 55 | 1.2 | ∼2012 | |
| Argentina | Cauchari | 0.051 | 2.84 | 3.95 | 1.215 | NA c | ||||
| Bolivia | Uyuni | 0.045 | ∼20 | 1.5 | 3.65 | ∼10 | 35 | 11–20 | 1.211 | ∼2014 d |
| Chile | Atacama | 0.15 | 6.4 | 3–3.7 | 2.3 | 3 | 18 e | 200 f | 1.223 | 1984– |
| Chile | Maricunga | 0.092 | 8 | 2.6 | NA | |||||
| China | Zhabuye | ∼0.1 | 0.001 | 2.3 | 4.42 | 0.243 | 0.7 | 1.297 | 2005– | |
| China | Qinghai g | ∼0.03 | 34+ | 3.56 | 2.79 | 2004– h | ||||
| China | DXC | 0.033 | 0.25 | 2.3 | 4.48 | 0.06 | NA i | 7.6 | NA j | |
| USA | Clayton k | 0.023 | ∼1.4 | 0.76–1.8 l | 1.3 | 0.08 | ∼1966– | |||
| USA | Searles | 0.0065 | 125 | 1 | 0.1 | 35 | 8 | 1.3 | 1936–1978 | |
| USA | Great Salt Lake | ∼0.004 | 250 | 1.8 | NA | 1.218 | NA | |||
| USA | Salton Sea m | ∼0.02 | 1.3 | 1.8 | NA | 0.017 | NA | 1.2 | NA | |
| Canada | Fox Creek n | ∼0.01 | ∼10 | NA | 4 | 6–7 | NA | NA | ||
| USA | Smackover n | ∼0.037 | ∼20 | NA | NA | 1.2 | NA |
aHombre Muerto;btop 40–50m;cCurrently at planing stage;dThe current plan;edisputed, value is the average for the upper 25 m [2];fdisputed, there are claims the porosity is ∼0 after 35–40 m [2];gIncluding Taijinaier;hpilot plant commencement date;ibelieved to be a lake;jproject appears to have stalled;kSilver Peak;lliterature reports a wide range of estimates;mGeothermal brine;nOilfield brine.
| Country | Deposit | Type a | % Li | Mine type b | Commenced |
|---|---|---|---|---|---|
| Australia | Greenbushes | S | 1.9 | O | 1982– |
| Australia | Mt Marion | S | 0.65 | ∼2010 | |
| Australia | Mt Cattlin | S | 0.5 | O | ∼2011 |
| Austria | Koralpe | S | 0.78 | NA | |
| Brazil | Country | V | - | 1943 | |
| Canada | Bernic Lake | S | 1.28 | R | 1984–2009 |
| Canada | Wekusko | S | 0.79 | NA | |
| Canada | La Corne | S | 0.52 | O | ∼2012 |
| Canada | La Motte | S | 0.5 | O | NA |
| Canada | Sep. Rapids | P | ∼0.7 | O | NA |
| Canada | Yellowknife | ||||
| China | Jaijika | S | 0.6 | NA | |
| China | Gajika | ||||
| China | Maerkang | ||||
| China | Yichun | L | ∼2 | O | Unknown c |
| China | Daoxin | ||||
| DRC d | Manono | S | ∼0.6 | NA | |
| Finland | Country | S | 0.5 | ∼2010 | |
| FSU e | Country | - | 1973 | ||
| Mali | Country | A,S | 1.4 | 1956–1970 | |
| Namibia | Country | A,L,P | 0.93 | 1930–1998 | |
| Portugal | Country | V | ∼0.57 f | 1925– | |
| Serbia | Country | J | 0.84 | NA | |
| S. Africa | Country | S | - | 1950–1974 | |
| USA | N. Carolina g | S | 0.7 | O | 1943–1998 |
| USA | N. Carolina h | S | 0.7 | NA | |
| USA | McDermitt | H | 0.33 | O | ∼2014 |
| USA | Rest | H | - | NA | |
| Zimbabwe | Bikita | V | 1.4 | 1948 | |
| Total |
aA = Amblygonite, H = Hectorite, J = Jadarite, L = Lepidolite, P = Petalite, S = Spodumene, V = Various;bO = Open cut, R = Room and Pillar (type of underground mining technique, where a considerable proportion of the ore is left behind to support the roof of the mine);ccurrently operating;dDemocratic Republic of Congo;eFormer Soviet Union;f0.37–0.77;gNorth Carolina developed;hNorth Carolina undeveloped.
| Cty a | Deposit | O b | [27] | [27] | [1] | [1] | [18] | [18] | [17] | [23] | [5] | [5] | [25] | |||
|---|---|---|---|---|---|---|---|---|---|---|---|---|---|---|---|---|
| r | R | r | R | rr | IR | R | R | r | R | Br | ||||||
| ARG | H. Muerto | B | 0.4 | 0.8 | 0.4 | 0.8 | 0.4 | 0.8 | 0.9 | 0.8 | } | 0.9 | 2.6 | 6.0 | ||
| ARG | Rincon | B | 0.3 | 0.5 | 1.4 | 2.8 | 0.8 | 1.9 | 1.4 | 1.1 | ||||||
| ARG | Olaroz | B | 0.2 | 0.3 | 0.1 | 0.3 | 0.1 | 0.3 | 0.3 | 0.2 | ||||||
| ARG | Cauchari | B | 0.5 | 0.9 | ||||||||||||
| AUS | Greenbushes | S | 0.2 | 0.7 | 0.1 | 0.3 | 0.2 | 0.6 | } | 0.6 | 0.6 | 1.6 | ||||
| AUS | Mt Marion | S | - | - | - | - | - | |||||||||
| AUT | Koralpe | S | - | 0.1 | 0.1 | 0.1 | 0.1 | 0.1 | 0.1 | |||||||
| BOL | Uyuni | B | 0.6 | 5.5 | 3.6 | 8.9 | 2.5 | 5.5 | 5.5 | 10.2 | 9.0 | 5.4 | ||||
| BRA | Brazil | M | 0.1 | 0.9 | - | 0.1 | 0.1 | 0.1 | 0.1 | 1.0 | 0.1 | |||||
| CAN | Bernic Lake | M | - | 0.1 | - | - | - | } | 0.4 | 1.1 | ||||||
| CAN | La Corne | S | 0.2 | 0.4 | 0.1 | 0.1 | 0.1 | |||||||||
| CAN | Yellowknife | M | 0.1 | 0.1 | - c | |||||||||||
| CAN | Fox Creek | O | 0.3 | 0.5 | 0.5 | |||||||||||
| CHL | Atacama | B | 1.0 | 3.0 | 7.5 | 35.7 | 16.1 | 35.7 | 6.9 | 6.3 | } | 7.5 | 7.5 | 7.5 | ||
| CHL | Maricunga | B | 0.2 | 0.4 | 0.1 | 0.2 | 0.2 | |||||||||
| CHN | Zhabuye | B | 0.8 | 1.3 | 0.8 | 1.5 | 0.7 | 1.5 | } | 2.6 | { | 1.5 | } | 3.5 | 5.4 | 6.2 |
| CHN | Qinghai | B | 0.5 | 1.0 | 1.0 | 2.3 | 0.9 | 2.3 | 2.0 | |||||||
| CHN | DXC | B | 0.1 | 0.2 | 0.1 | 0.2 | 0.1 | 0.1 | 0.2 | |||||||
| CHN | Jaijika | M | 0.2 | 0.5 | 0.2 | 0.5 | } | 0.8 | { | 0.2 | ||||||
| CHN | Gajika | M | 0.3 | 0.6 | 0.3 | 0.6 | 0.6 | |||||||||
| CHN | Maerkang | M | 0.2 | 0.5 | 0.1 | 0.2 | 0.2 | |||||||||
| CHN | Yichun | M | 0.2 | 0.3 | 0.3 | |||||||||||
| CHN | Daoxin | M | 0.1 | 0.2 | 0.2 | |||||||||||
| COD | Manono | S | 1.5 | 3.1 | 1.2 | 2.3 | 2.3 | 1.1 | 1.0 | 1.1 | ||||||
| FSU | FSU | M | 0.1 | 1.2 | 0.6 | 1.2 | 1.0 | 0.8 | 2.5 | |||||||
| ISR | Dead Sea | B | 2.0 | 0.9 | 2.0 | |||||||||||
| SRB | Serbia | J | 0.4 | 0.9 | 0.5 | 0.9 | 0.9 | 1.0 | 1.0 | 1.0 | ||||||
| USA | Silver peak | B | 0.1 | 0.3 | - | - | - | - | - | 0.3 | } | - | 4.0 | 6.6 | ||
| USA | G. Salt Lake | B | 0.5 | 0.3 | 0.5 | 0.2 | 0.5 | |||||||||
| USA | Salton Sea | B | 1.0 | 0.3 | 1.0 | 0.5 | 1.0 | 1.0 | 1.3 | |||||||
| USA | N. Carolina | S | 1.2 | 2.6 | 1.6 | 3.1 | 2.8 | 5.5 | ||||||||
| USA | Smackover | O | 1.0 | 0.5 | 1.0 | 0.5 | 1.0 | 0.8 | 0.8 | |||||||
| USA | US Hectorite | H | 1.1 | 2.0 | 1.0 | 2.0 | 2.0 | 2.0 | ||||||||
| Other | V | - | 0.3 | 0.5 | 0.2 | 0.3 | 0.2 | 0.1 | − | 0.2 | ||||||
| Total | 3.9 | 17.4 | 23.1 | 71.3 | 29.6 | 64.7 | 29.8 | 38.3 | 13.0 | 29.0 | 39.4 | |||||
B = Brine, H = Hectorite, J = Jadarite, M = Mineral, O = Oilfield brine, S = Spodumene, V = Various, r = reserve, R = Resource, rr = recoverable resources, Br = Broadbased reserves, IR = In-situ resources.aCountry, ISO ALAPHA-3 code used, except FSU which denotes the Former Soviet Union;bOre type;cOther Canada.
| cty a | Deposit | O b | Cp c | Case 1 | Case 2 | Case 3 | cty a | Deposit | O b | Cp c | Case 1 | Case 2 | Case 3 |
|---|---|---|---|---|---|---|---|---|---|---|---|---|---|
| ARG | rock | M | - | - | - | - | DEU | Germany | M | - | - | - | - |
| ARG | H. Muerto | B | 0.016 | 0.383 | 0.416 | 0.866 | KOR | Korea | M | - | - | - | - |
| ARG | Rincon | B | 0 | 0.842 | 1.400 | 1.400 | IRL | Ireland | M | 0 | 0 | 0 | 0.013 |
| ARG | Olaroz | B | 0 | 0.140 | 0.140 | 0.300 | ISR | Dead Sea | B | 0 | 0 | 0 | 0.900 |
| ARG | Cauchari | B | 0 | 0.463 | 0.463 | 0.463 | MLI | Bougouni | M | 0 | 0.004 | 0.004 | 0.013 |
| AUS | L.derry | P | - | - | - | - | MOZ | M.bique | L | - | - | - | - |
| AUS | R.thorpe | S | - | - | - | - | MOZ | M.bique | S | - | - | - | - |
| AUS | Ubini | A | - | - | - | - | MOZ | M.bique | A | - | - | - | - |
| AUS | Euriowie | A | - | - | - | - | MOZ | M.bique | P | - | - | - | - |
| AUS | Finniss | A | - | - | - | - | NAM | Karibib | M | 0.006 | 0.012 | 0.016 | 0.016 |
| AUS | G.bushes | S | 0.056 | 0.183 | 0.279 | 0.616 | PRT | Portugal | A | - | - | - | - |
| AUS | Mt Marion | S | 0 | 0.010 | 0.030 | 0.030 | PRT | Portugal | l | - | - | - | - |
| AUS | Mt Cattlin | S | 0 | 0.020 | 0.056 | 0.056 | PRT | Portugal | M | 0.006 | 0.011 | 0.016 | 0.016 |
| AUT | Koralpe | S | 0 | 0.010 | 0.010 | 0.113 | SRB | Serbia | J | 0 | 0.425 | 0.425 | 0.990 |
| BOL | Uyuni | B | 0 | 2.475 | 3.560 | 10.200 | ZAF | S. Africa | A | - | - | - | - |
| BRA | Brazil | M | 0.004 | 0.046 | 0.089 | 0.194 | ZAF | S. Africa | S | - | 0.015 | 0.015 | 0.015 |
| CAN | Bernic L. | M | 0.014 | 0.024 | 0.033 | 0.033 | ESP | Spain | M | - | - | - | - |
| CAN | Old Mines | M | 0.006 | 0.006 | 0.006 | 0.006 | ESP | Spain | L | 0.001 | 0.001 | 0.001 | 0.073 |
| CAN | Wekusko | M | 0 | 0.013 | 0.054 | 0.054 | SUR | Suriname | A | - | - | - | - |
| CAN | La Corne | S | 0 | 0.053 | 0.163 | 0.163 | SWE | Sweden | P | - | - | - | - |
| CAN | La Motte | S | 0 | 0.011 | 0.023 | 0.023 | SWE | Sweden | S | - | - | - | - |
| CAN | S. Rapids | M | 0 | 0.036 | 0.056 | 0.056 | UGA | Uganda | A | - | - | - | - |
| CAN | Y.knife | M | 0 | 0 | 0 | 0.065 | USA | Hist. prod. | V | 0.165 | 0.165 | 0.165 | 0.165 |
| CAN | Fox Creek | O | 0 | 0.258 | 0.258 | 0.515 | USA | Silver peak | B | 0 d | 0.018 | 0.020 | 0.300 |
| CHL | Atacama | B | 0.105 | 6.405 | 7.605 | 16.170 | USA | Searles L. | B | 0 d | 0 | 0 | 0.014 |
| CHL | Maricunga | B | 0 | 0.099 | 0.220 | 0.220 | USA | G. Salt L. | B | 0 d | 0.237 | 0.260 | 0.260 |
| CHN | China | V | 0.058 | 2.558 | 2.966 | 6.231 | USA | Salton Sea | B | 0 d | 0.316 | 0.316 | 1.316 |
| COD | Manono | A | 0.001 | 0.001 | 0.001 | 0.001 | USA | N. Carolina | S | 0 d | 1.230 | 1.230 | 5.454 |
| COD | Manono | S | - | 1.145 | 1.500 | 2.300 | USA | Smackover | O | 0 | 0.450 | 0.500 | 0.750 |
| CSK | C.slovakia | M | - | - | - | - | USA | Hectorite | h | 0 | 1.000 | 1.000 | 2.000 |
| FIN | Finland | M | 0 | 0.006 | 0.015 | 0.015 | ZWE | Bikita | V | 0.047 | 0.070 | 0.070 | 0.104 |
| FRA | France | L | - | - | - | - | Total | 0.534 | 19.319 | 23.558 | 55.017 | ||
| FSU | FSU | M | 0.050 | 0.180 | 0.180 | 2.530 |
aCountry, ISO ALPHA 3 codes, except FSU which denotes Former Soviet Union;bOre type A = Amblygonite, B = Brine, H = Hectorite, J = Jadarite, L = Lepidolite, l = Lithiophylite, M = Mineral, O = Oilfield brine, P = Petalite, S = Spodumene, V = Various;cCumulative production 1900–2008;dhistoric production accounted for in Hist. prod.
| Type | Peak Year | Max Production | ||||
|---|---|---|---|---|---|---|
| Case 1 | Case 2 | Case 3 | Case 1 | Case 2 | Case 3 | |
| Africa | 2075 | 2085 | 2077 | 17.0 | 25.1 | 24.9 |
| Asia | 2112 | 2112 | 2175 | 18.2 | 20.9 | 32.8 |
| Europe | 2032 | 2025 | 2042 | 9.2 | 9.4 | 15.0 |
| FSU | 2029 | 2029 | 2091 | 2.0 | 2.0 | 33.0 |
| Middle East | 2086 | 15.4 | ||||
| North America | 2078 | 2054 | 2140 | 45.8 | 45.7 | 79.3 |
| South America | 2059 | 2,061 | 2070 | 166.2 | 204.6 | 377.3 |
| Production | 2063 | 2,061 | 2073 | 241.5 | 285.6 | 529.4 |
| Recycle | 2091 | 2094 | 2107 | 481.7 | 576.0 | 1,187.8 |
| Supply | 2081 | 2083 | 2097 | 606.5 | 723.9 | 1,486.3 |
© 2012 by the authors; licensee MDPI, Basel, Switzerland This article is an open access article distributed under the terms and conditions of the Creative Commons Attribution license (http://creativecommons.org/licenses/by/3.0/).
Share and Cite
Mohr, S.H.; Mudd, G.M.; Giurco, D. Lithium Resources and Production: Critical Assessment and Global Projections. Minerals 2012, 2, 65-84. https://doi.org/10.3390/min2010065
Mohr SH, Mudd GM, Giurco D. Lithium Resources and Production: Critical Assessment and Global Projections. Minerals. 2012; 2(1):65-84. https://doi.org/10.3390/min2010065
Chicago/Turabian StyleMohr, Steve H., Gavin M. Mudd, and Damien Giurco. 2012. "Lithium Resources and Production: Critical Assessment and Global Projections" Minerals 2, no. 1: 65-84. https://doi.org/10.3390/min2010065