Article

Characterizing Frothers through Critical Coalescence Concentration (CCC)95-Hydrophile-Lipophile Balance (HLB) Relationship

1
Department of Mining and Materials Engineering, McGill University, 3610 Univeristy Street, Wong Building, Montreal, QC H3A 2B2, Canada
2
NesseTech Consulting Services Inc., 17-35 Sculler’s Way, St., Catharines, ON L2N 7S9, Canada
*
Author to whom correspondence should be addressed.
Minerals 2012, 2(3), 208-227; https://doi.org/10.3390/min2030208
Submission received: 22 June 2012 / Revised: 26 July 2012 / Accepted: 31 July 2012 / Published: 13 August 2012
(This article belongs to the Special Issue Advances in Mineral Processing)

Abstract

:
Frothers are surfactants commonly used to reduce bubble size in mineral flotation. This paper describes a methodology to characterize frothers by relating impact on bubble size reduction represented by CCC (critical coalescence concentration) to frother structure represented by HLB (hydrophile-lipophile balance). Thirty-six surfactants were tested from three frother families: Aliphatic Alcohols, Polypropylene Glycol Alkyl Ethers and Polypropylene Glycols, covering a range in alkyl groups (represented by n, the number of carbon atoms) and number of Propylene Oxide groups (represented by m). The Sauter mean size (D32) was derived from bubble size distribution measured in a 0.8 m3 mechanical flotation cell. The D32 vs. concentration data were fitted to a 3-parameter model to determine CCC95, the concentration giving 95% reduction in bubble size compared to water only. It was shown that each family exhibits a unique CCC95-HLB relationship dependent on n and m. Empirical models were developed to predict CCC95 either from HLB or directly from n and m. Commercial frothers of known family were shown to fit the relationships. Use of the model to predict D32 is illustrated.

1. Introduction

Flotation, widely used for processing mineral ores, is based on the capture of hydrophobic particles by air bubbles [1]. In the process surface-active agents known as frothers are commonly employed to aid production of fine air bubbles which facilitate particle capture and transport.
Bubbles in flotation machines in the absence of frother exhibit a wide, often bi-modal size distribution with a Sauter mean size (diameter, D32) ca. 4 mm which the addition of frother narrows to a mono-modal distribution of Sauter mean size typically ca. 1 mm [2]. This reduced bubble size enhances flotation kinetics. Treating flotation as a first order kinetic process, Gorain et al. [3,4] showed that the flotation rate constant increased inversely with bubble size (1/Db) a dependence used in the JKSimFloat simulator [5]. Others have suggested an even stronger dependence, as high as 1/Db3 [6]. Recent plant-based work showed dependence on 1/Db2 [7]. Regardless, it is evident that flotation rate is related to bubble size and thus to the effect of frother on bubble size.
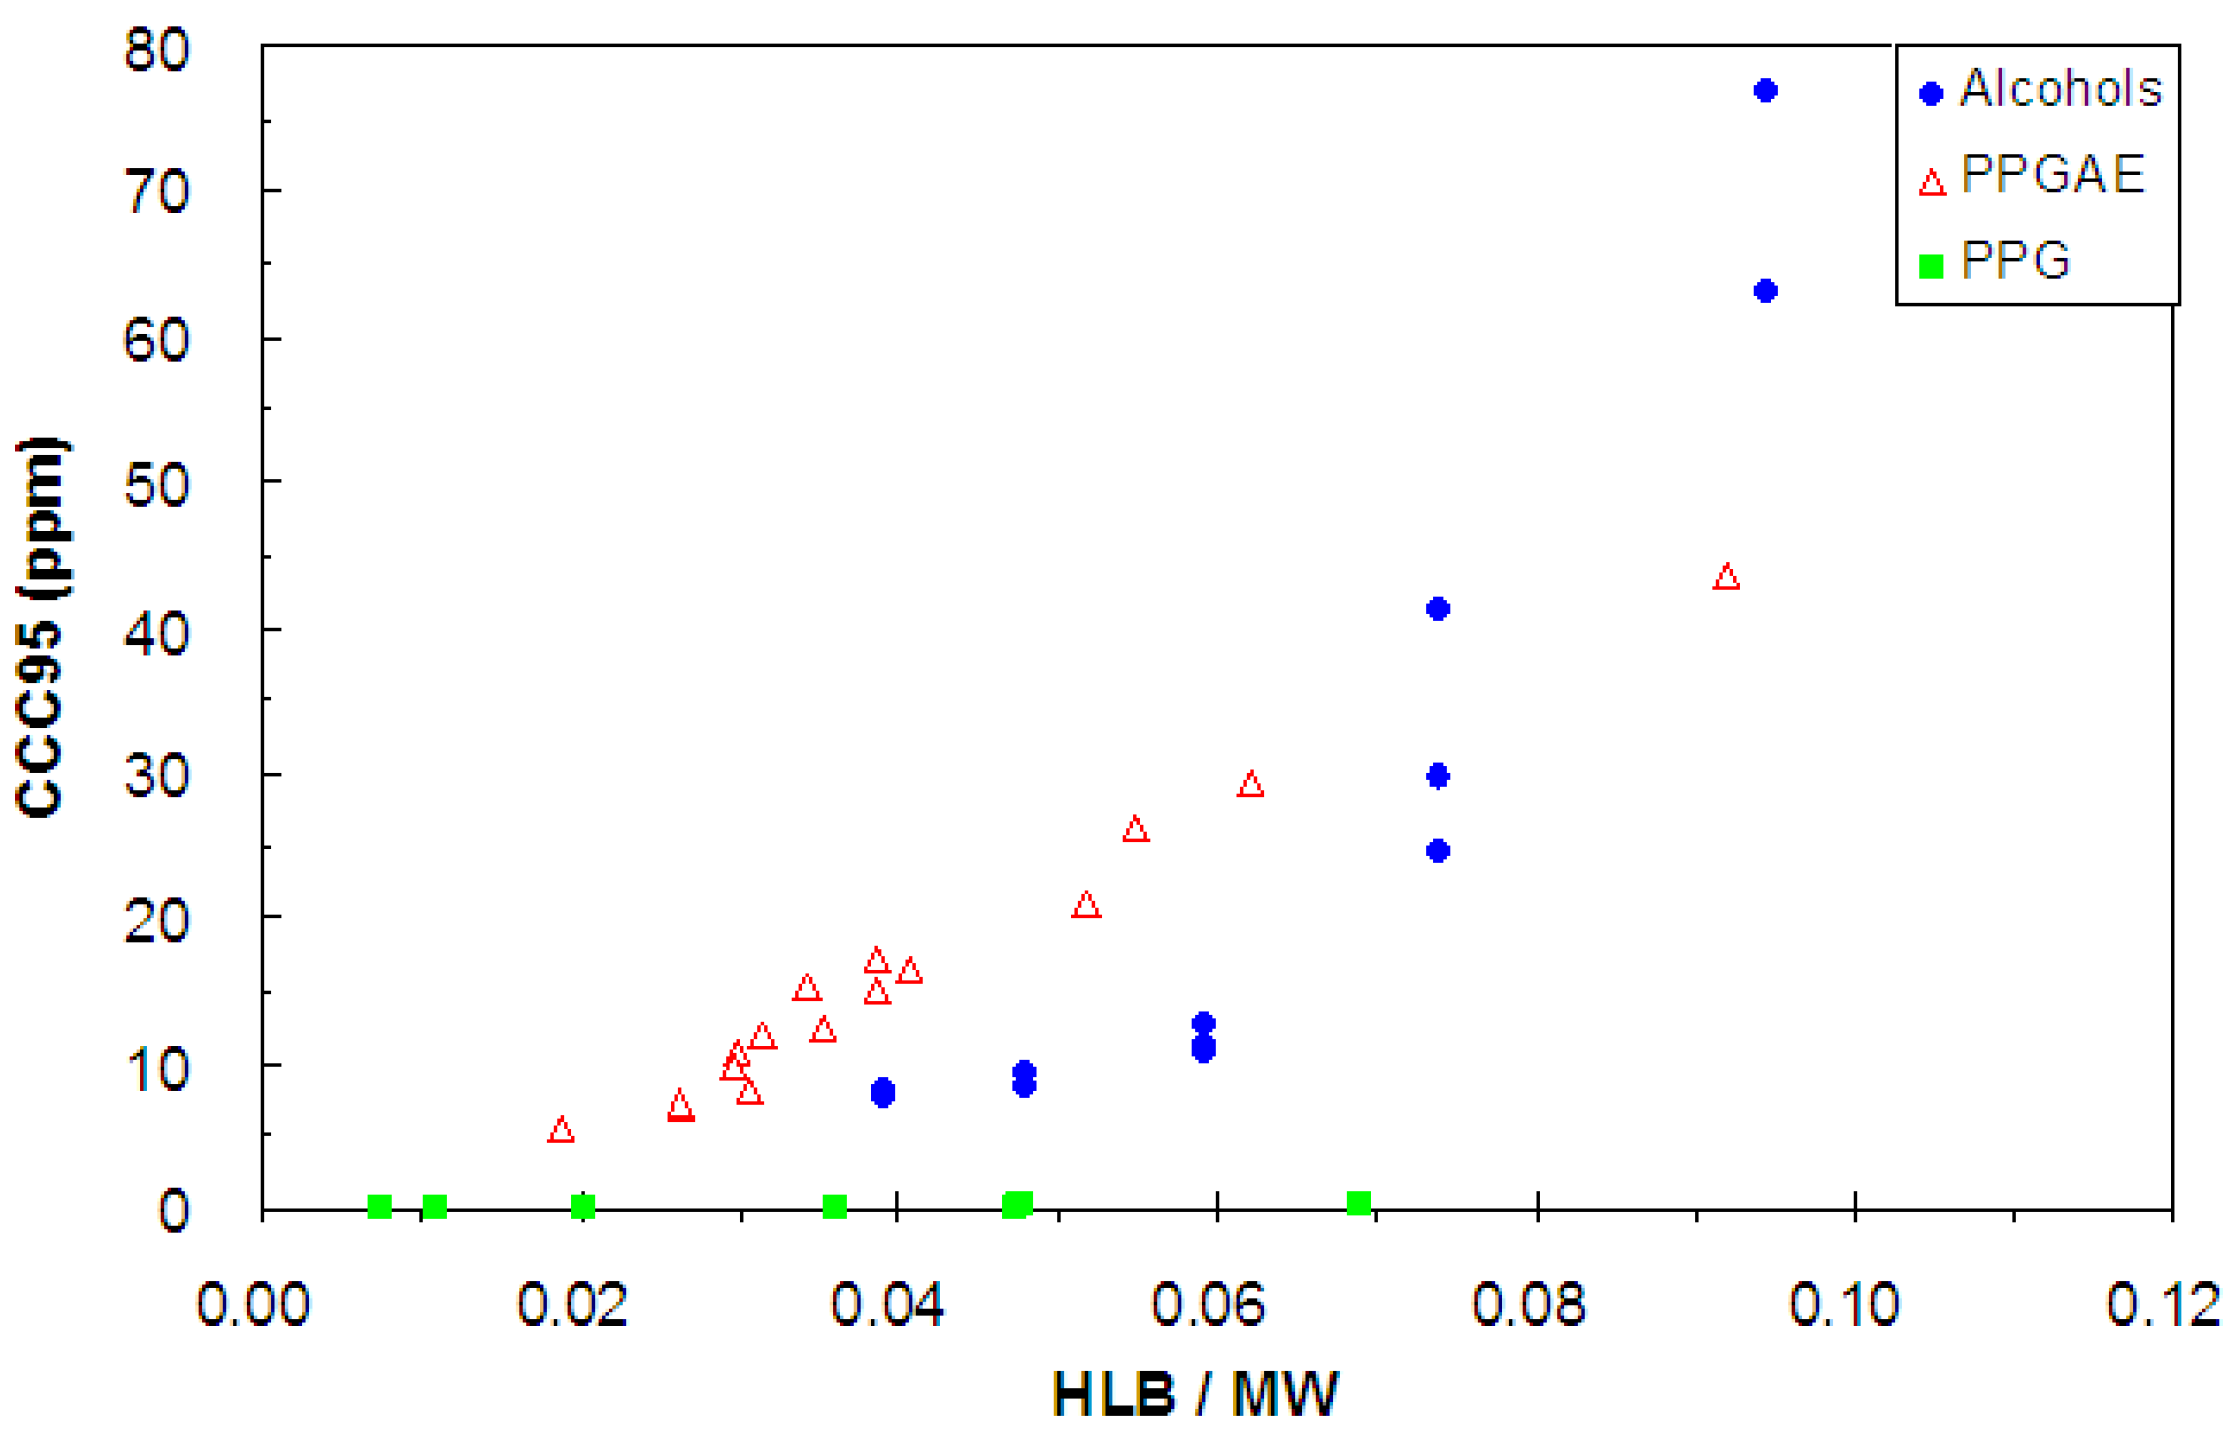
Three frother families are the subject of the present work: Aliphatic Alcohols (CnH2n+1OH), PPGAE (Polypropylene Glycol Alkyl Ethers, CnH2n+1(OC3H6)mOH) and PPG (Polypropylene Glycols, H(OC3H6)mOH), the latter two sometimes lumped as “Polyglycols”. The purpose is to determine the link between frother’s role in reducing bubble size measured by CCC (critical coalescence concentration) and frother structure measured by HLB (hydrophile-lipophile balance); i.e., to forge a structure-function relationship. Some background will justify the choice of CCC and HLB.

2. Critical Coalescence Concentration and Hydrophile-lipophile Balance

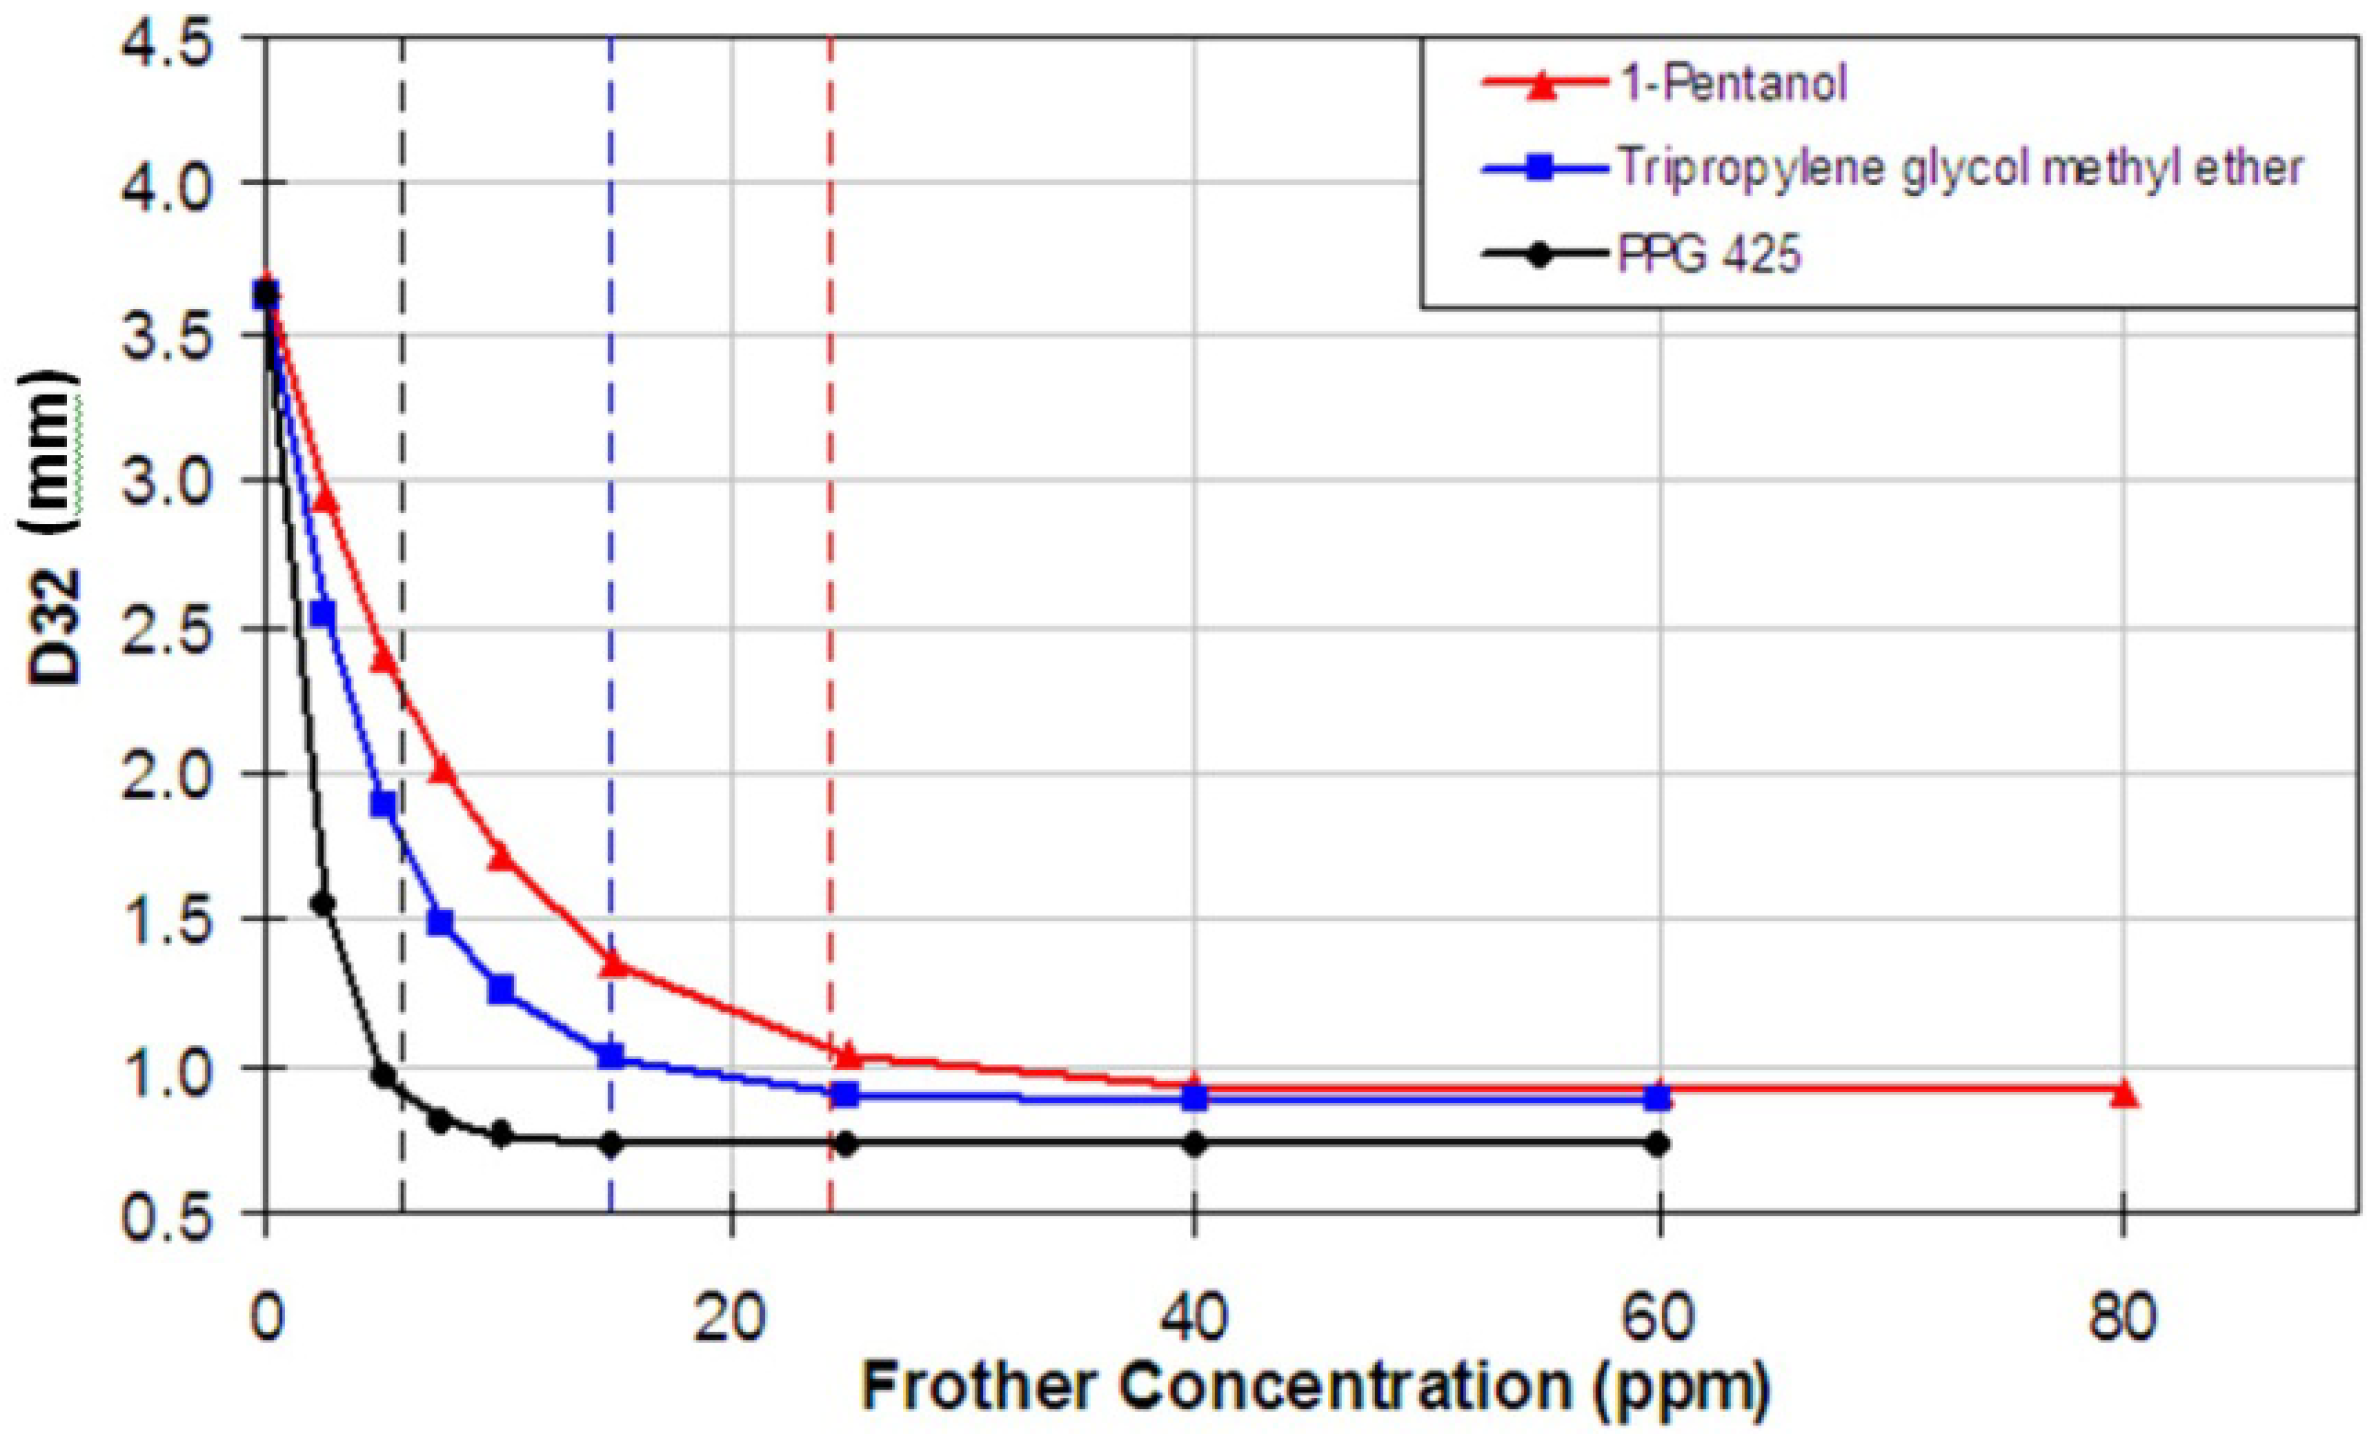
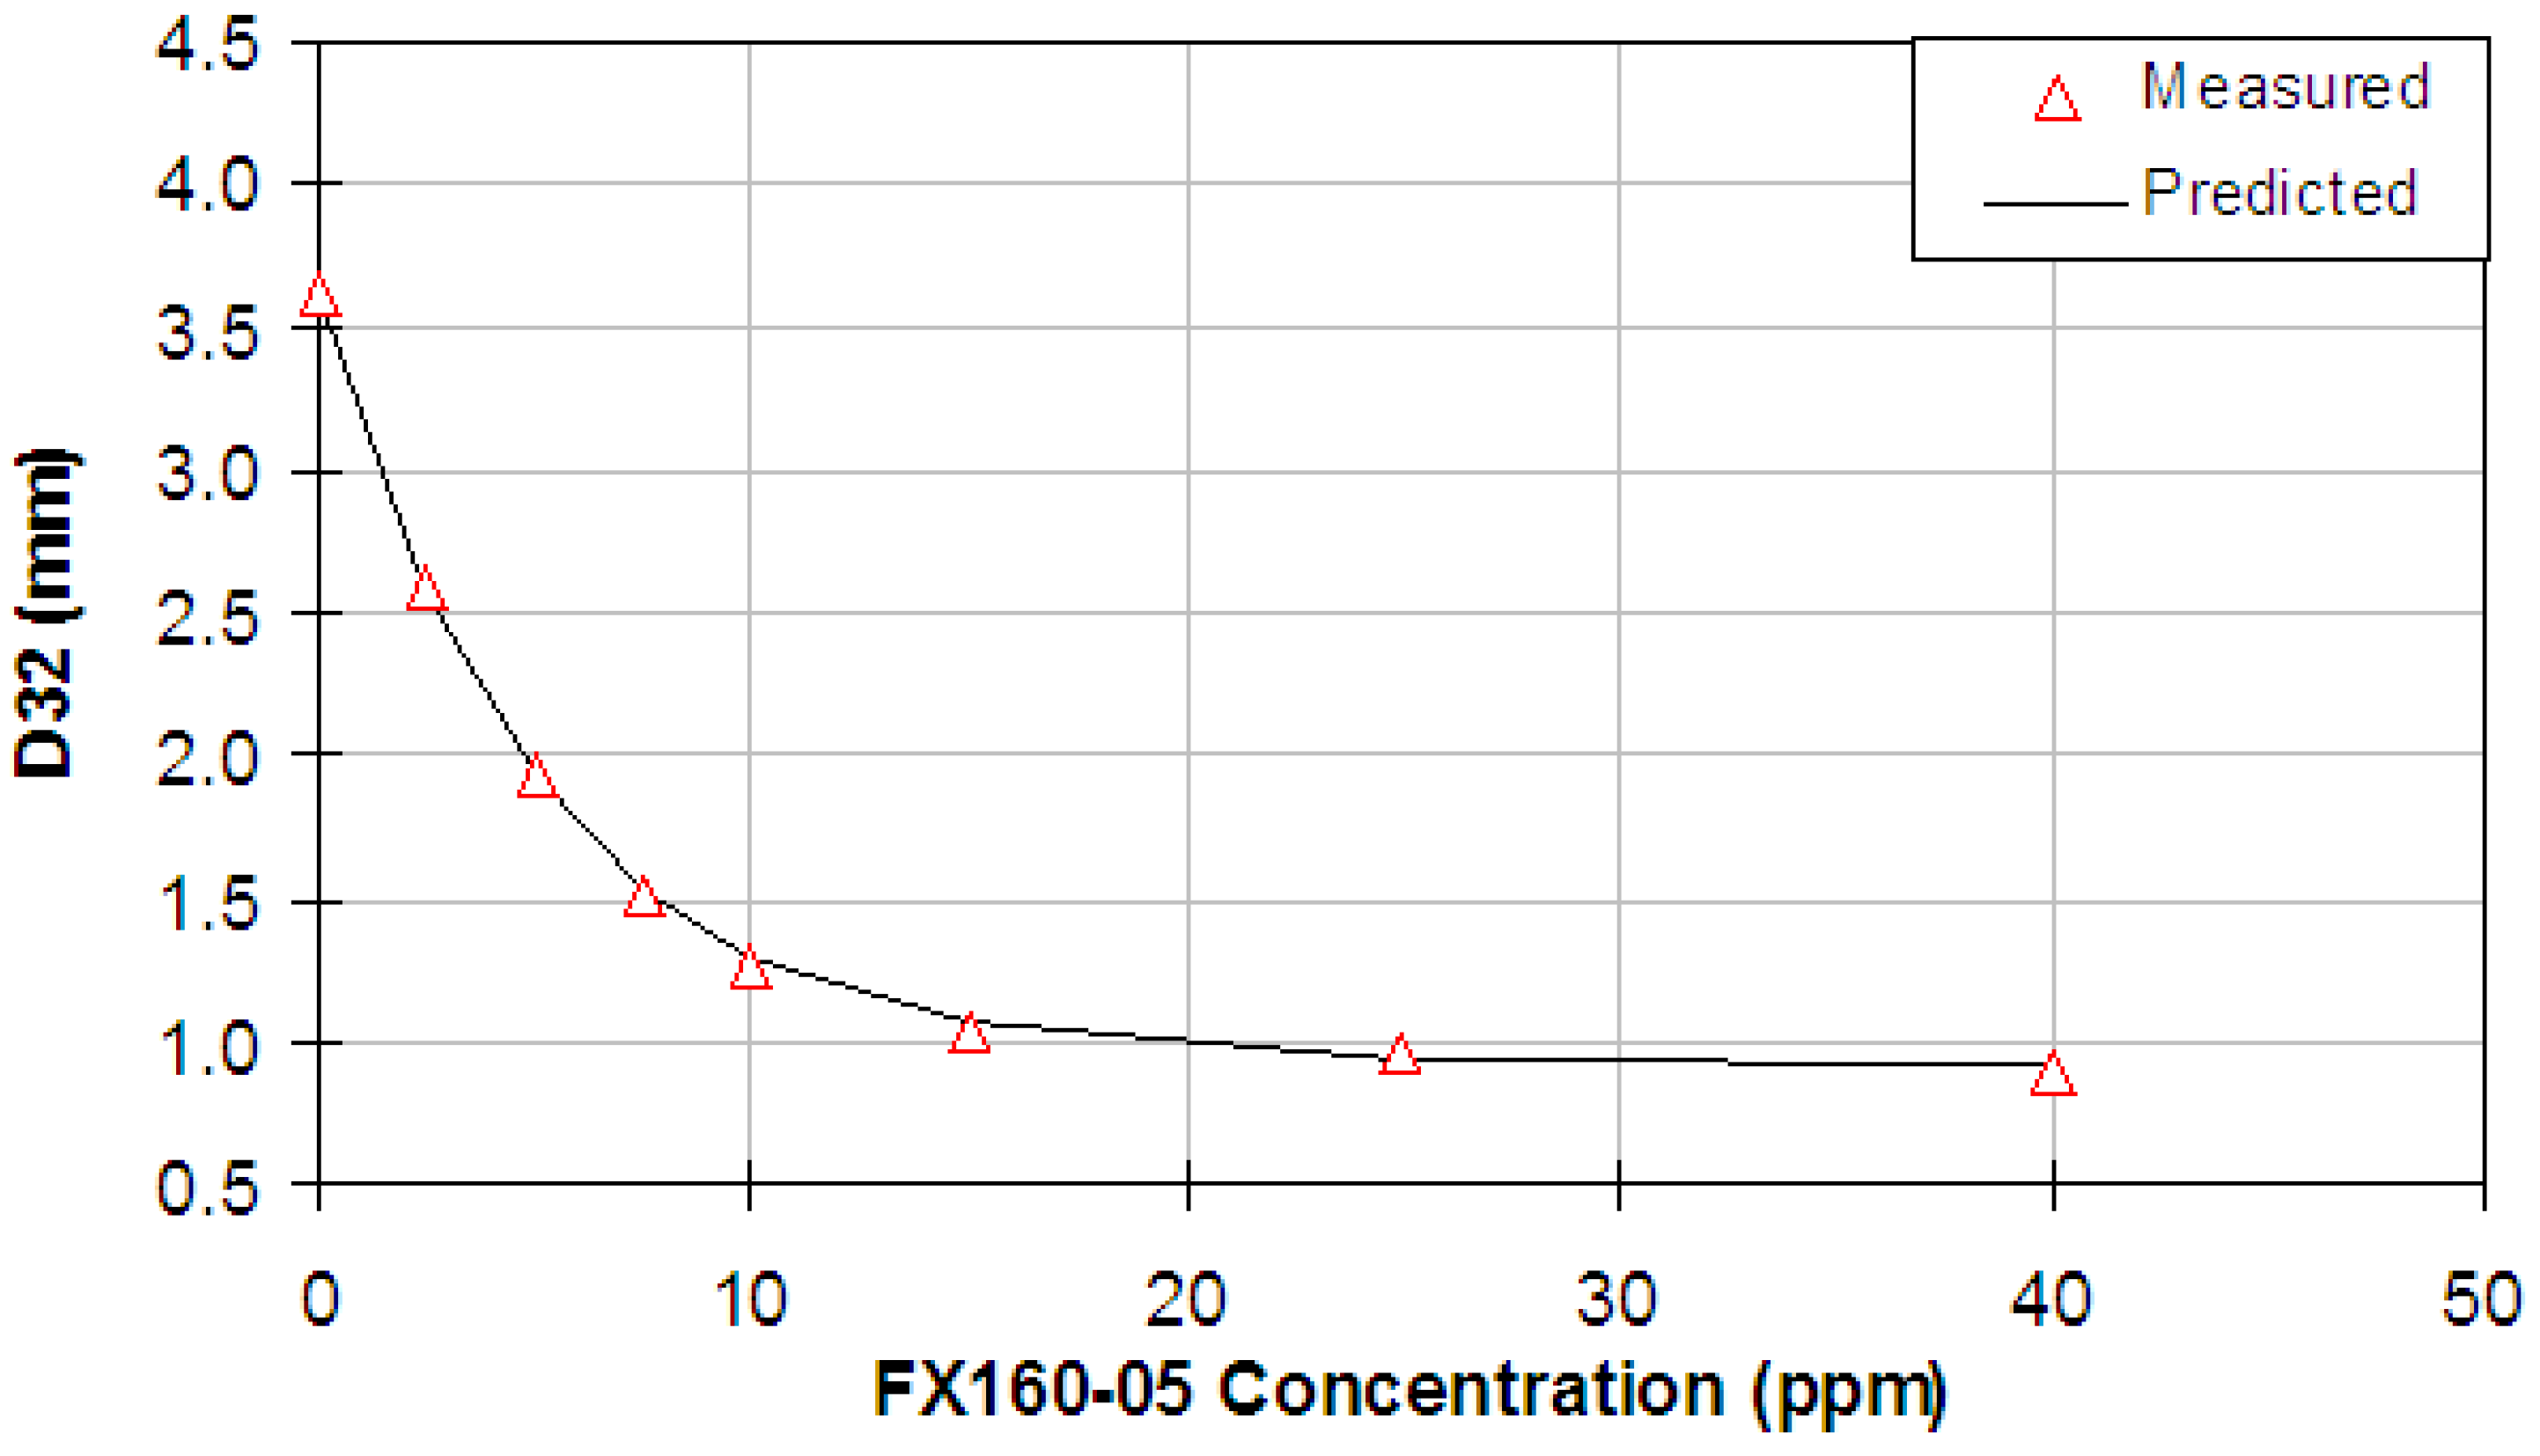
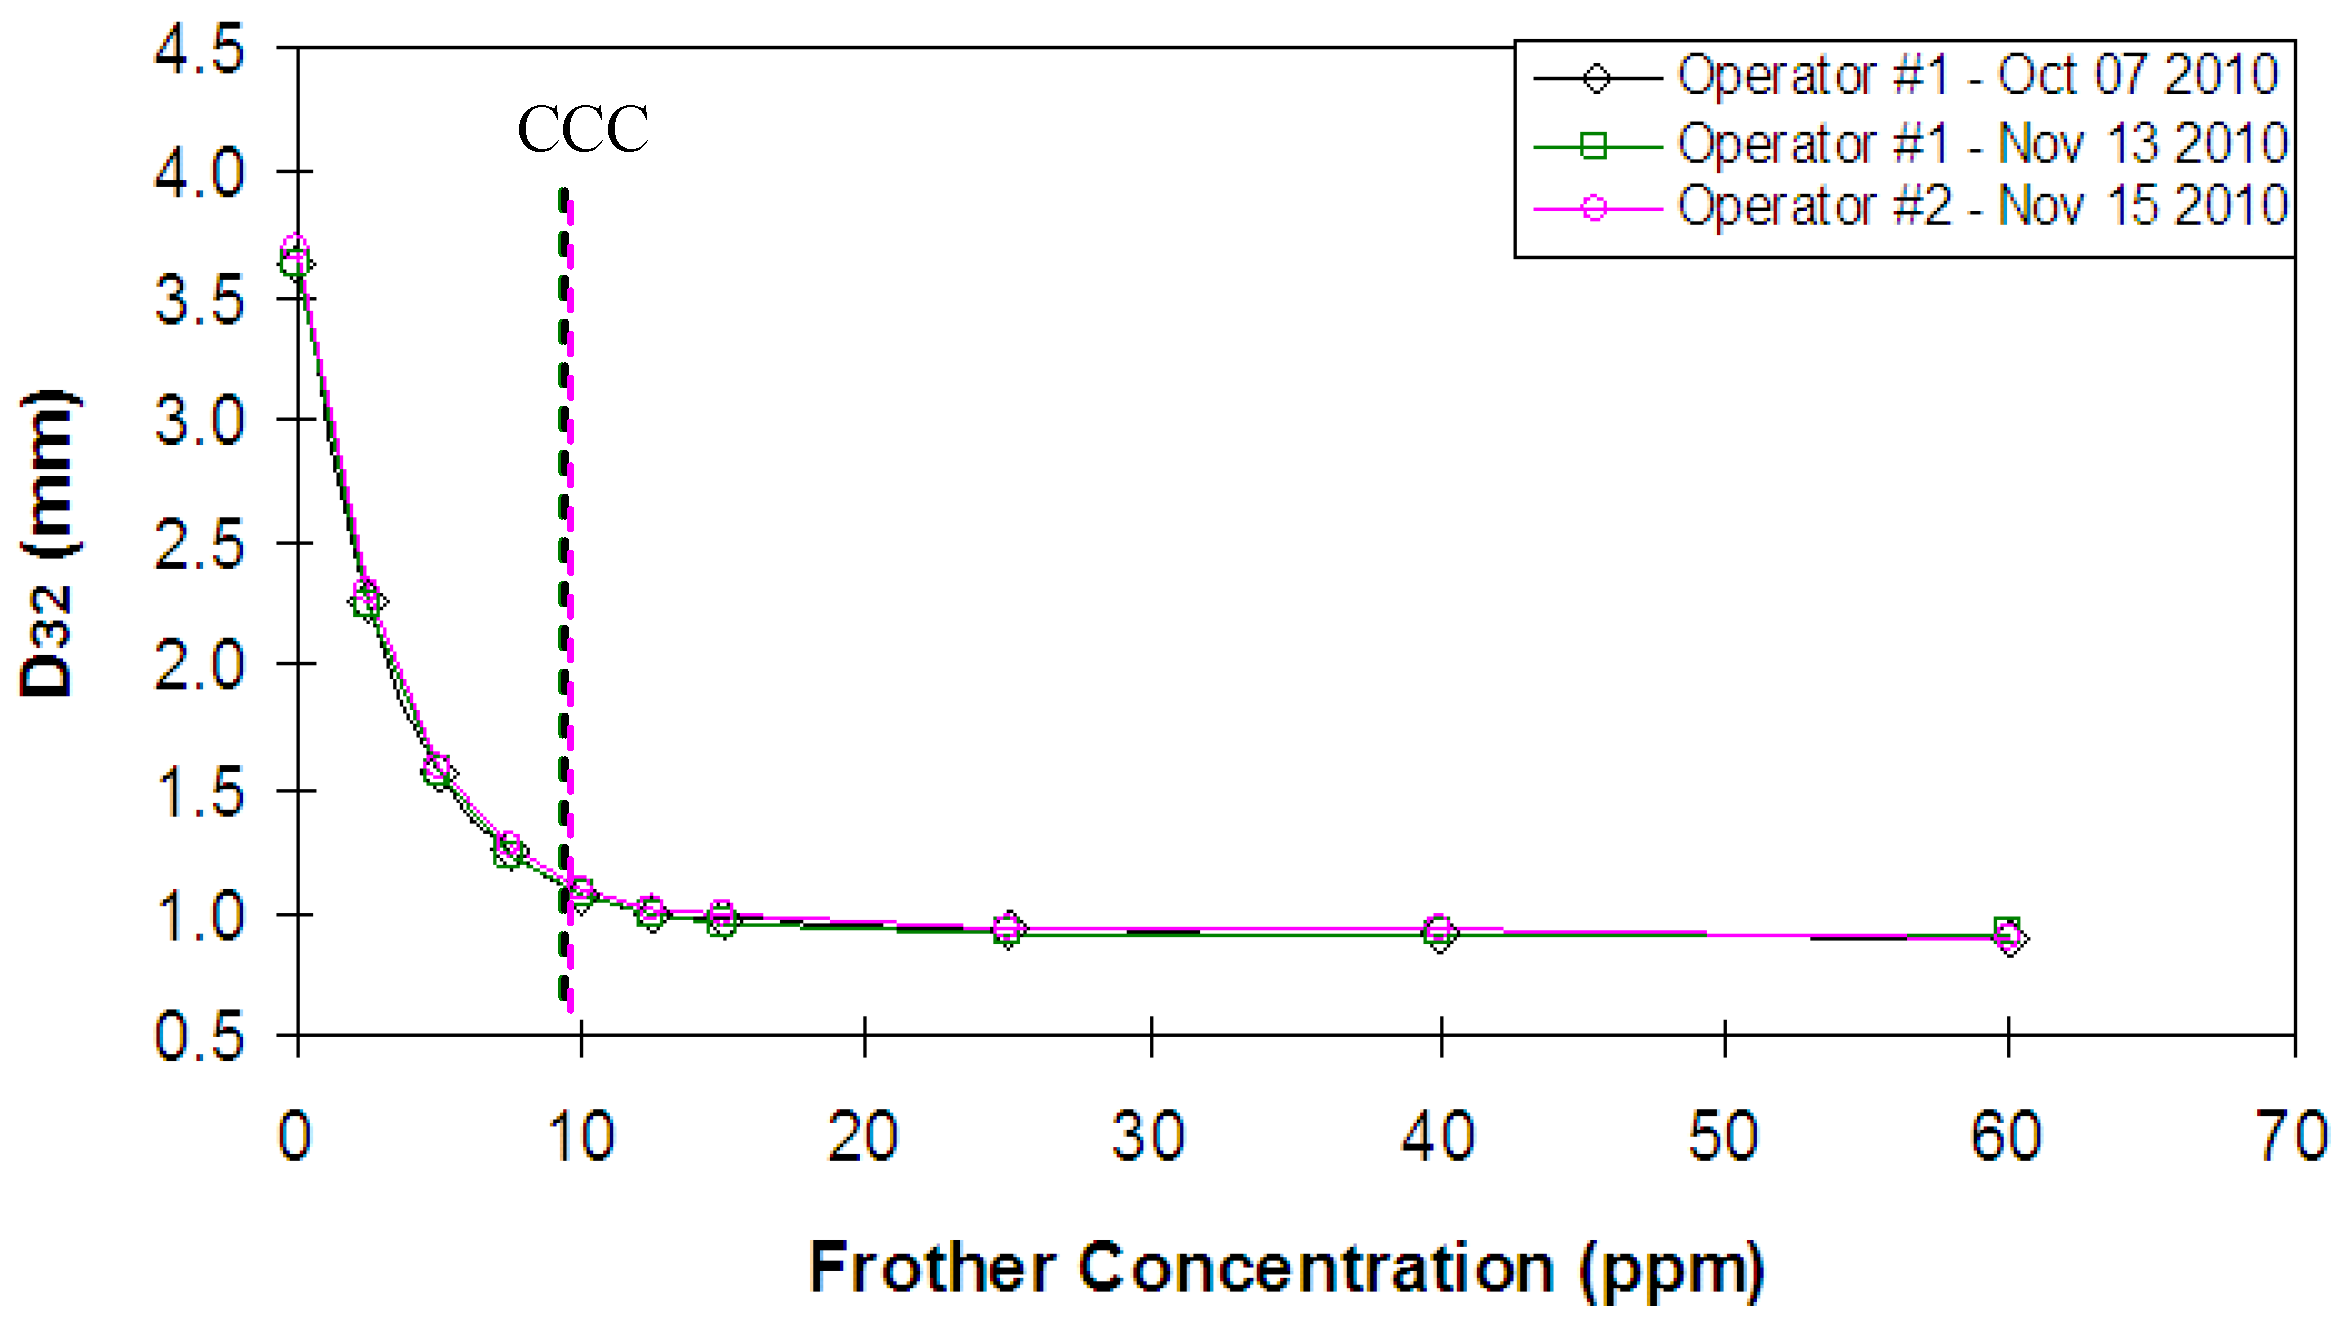
The general dependence on frother concentration (C) is that D32 decreases exponentially to reach a minimum size at some concentration [8]. This action is usually ascribed to frothers acting to reduce coalescence [9]. Combining these points Cho and Laskowski [10] introduced the term critical coalescence concentration (CCC) to describe the minimum concentration giving the minimum bubble size. Laskowski [11] showed that all frothers produced a similar D32-C trend, differing only in their CCC, for example DowFroth 250 with CCC 9.1 ppm and MIBC 11.2 ppm. This self-similarity gave a unique trend line for all frothers by plotting D32 against the normalized concentration C/CCC.
Laskowski [11] described a graphical method to estimate CCC. Recognizing the difficulty in identifying the end point of an exponential function Nesset et al. [2] substituted a 3-parameter model to fit the D32-C data and estimate CCC as the concentration giving 95% reduction in bubble size to that in water alone, termed the CCC95. The 3-parameter model was presented as:
Minerals 02 00208 i001
where DL is the minimum (limiting) bubble size, A the bubble size reduction (i.e., D0, the initial (zero-frother) bubble size, minus DL), and B the decay constant, which depends on the frother in question.
The normalized trend then becomes:
Minerals 02 00208 i002
where b can be derived as following:
Minerals 02 00208 i003
It is evident in Equation (2) that other CCCx values could be quoted; for example CCC75 would mean the concentration giving 75% reduction in bubble size from water alone.
Grau et al. [12] suggested CCC is a material constant; i.e., is unique for a given frother. Nesset et al. [2,13] explored the dependence of CCC95 on operating variables, for example showing it was independent of impeller speed but increased with air rate. Both research groups employed mechanical flotation machines (air is dispersed through a rotating impeller). Data on CCC for other flotation machines is too limited to determine a “machine” effect. While the CCC95 is, therefore, not entirely a material constant it does meet the criterion here of quantifying the role of frother type in effecting bubble size reduction.
The hydrophile-lipophile balance (HLB) is one of the most widely used indicators of a surfactant’s suitability for a given application. Since its introduction by Griffin [14] there have been several attempts to develop a rapid and reproducible technique to determine HLB both experimentally and computationally [15,16,17,18]. Among all, the Davies method has been most widely used [15,19]. Davies assumed that HLB was additive with hydrophilic and lipophilic (hydrophobic) group numbers assigned to various structural components. In the Davies approach the HLB is given by:
Minerals 02 00208 i004
Typically HLB values range between 1 and 20 [20], with high numbers indicating high water solubility (high hydrophilicity) and vice versa. Applications for different ranges of HLB are shown in Table 1. The group numbers related to the present investigation are listed in Table 2.
Table 1. Correlation of HLB and application [20].
HLB valueApplication
1.5–3Antifoaming agents
3.5–6Water-in-oil emulsifiers
4–10Frothers
7–9Wetting agents
8–18Oil-in-water emulsifiers
10–20Collectors
13–15Detergents
15–18Solubilizers
Table 2. The selected group number used in the Davies method of estimating hydrophile-lipophile balance (HLB).
Functional groupGroup contribution number
Hydrophilic
–OH1.9
–O–1.3
Lipophilic (or hydrophobic)
–CH–; CH2–; –CH3–; =CH−0.475
An example calculation is given for Dipropylene Glycol (H(OC3H6)2OH) (Equation (5)) where there are 2 OH groups, 6 C atoms in the alkyl chain, and 1 O atom:
Minerals 02 00208 i005
Laskowski [11] and Pugh [21] have discussed a link between frother functions and HLB. Laskowski noted that frothers with low CCC values had low HLB numbers, i.e., were more hydrophobic than frothers with higher CCC values, but no general correlation emerged. His data base was dominated by commercial frothers and did not include Polypropylene Glycols. In the current paper a range of pure surfactants from the three families is studied, varying both n in the alkyl group and m the number of Propylene Oxide groups.
Establishing a correlation between CCC and HLB is a step towards predicting bubble size in flotation systems from frother structure which is illustrated in the paper for commercial frothers. The work is designed to aid frother selection and might lead to fundamental understanding of how frother structure impacts bubble size that could result in new frother formulations with properties tailored to a particular duty.

3. Experimental Section

3.1. Apparatus

An AutoCAD sketch of the set-up to measure bubble size is shown in Figure 1 and Figure 2. The nominal volume of the cell is 800 L, with a standard test volume of 700 L being employed. The impeller diameter was 21 cm and that of the outside diffuser 33 cm. A feature of the design is the baffle ring at 40 cm from the bottom of the tank (32 cm below water surface) which divides the turbulent zone around the impeller from the quiescent zone above where bubble size was determined. Air supply was from a compressed air system and manipulated via a 400 LPM KMSTM mass flow meter.
Figure 1. Schematic CAD drawing of Metso RCSTM 0.8 m3 mechanical cell and accessories.
Minerals 02 00208 g001
Bubble sizing employed the McGill Bubble Size Analyzer (MBSA), a sampling-for-imaging technique [22,23]. The sampling tube of the MBSA was positioned 33 cm from the central shaft (19 cm from the wall) and 52 cm from the bottom of the tank (20 cm below the water surface). This location inside the quiescent zone had been established previously as being both representative of the average air rate in the cell and giving reproducible data [2]. All experiments were run under the following conditions: air superficial velocity (Jg, i.e., volumetric air rate divided by cell cross-sectional area) 0.5 cm/s; room temperature 20–22 °C; and impeller speed 1,500 rpm (equivalent to 5.73 m/s tip speed). From previous work on this unit the air velocity was selected to correspond to the “base” air rate in the bubble size model of Nesset et al. [2,13]; and the impeller speed was selected as being within the range determined to have no impact on bubble size [2,13].
Figure 2. A cut-away view of Metso RCSTM 0.8 m3 mechanical cell showing dimensions and location of McGill Bubble Size Analyzer (MBSA) sampling tube.
Minerals 02 00208 g002
Experiments were conducted in a water-air system. The cell was filled with Montréal tap water one day before the test to equilibrate the water to room temperature. Frother solutions were prepared for the cell (“cell concentration”) and for the MBSA assembly (“chamber concentration”) independently. The chamber concentration was kept at least above the CCC75 for surfactant (frother) being tested to prevent coalescence in the sampling tube [24]. Fifteen minutes of agitation at 4200 rpm without air prior to testing ensured the frother was fully mixed.
Frother was added incrementally to give some 20 concentration points ranging up to 200 ppm. This number of points ensures reliable estimation of the three fitted parameters (Equation (1)). The bubble size data were corrected to report at standard temperature and pressure. Up to 100,000 bubbles were counted at each concentration.
The bubble sizing technique was validated against an independent measure using particle imaging velocimetry (PIV). For this a bubble column (110 cm × 10 cm) was used to provide the necessary transparent wall for the PIV laser light. Bubbles were generated at a stainless steel sparger (5 μm nominal porosity). The bubble size was measured by PIV at the same location as the MBSA sampling point. The PIV apparatus (model: Gemini 200–15 Hz) consisted of two CCD cameras (lens model: Nikon AF 50 mm) and laser synchronizer (model: 630149-G). The bubbles which passed the laser plane were observed in the PIV images. The imaged area was 74 mm × 92.5 mm giving a smallest detectable bubble size of about 0.3 mm (0.1 mm for MBSA technique). A threshold method was used to identify bubbles from the PIV images. Some 100 images comprising up to 15,000 bubbles were recorded in each experiment.

3.2. Reagents

The surfactants from the three frother families are identified in Table 3a which shows the range in n and m and corresponding range in HLB (note, Polypropylene Glycol Ethyl Ethers (i.e., n = 2) are not available). All were reagent grade from Aldrich-Sigma (St. Louis, MO, USA) (98%~99.9% purity). Several commercial frothers were included and are listed in Table 3b.
Table 3. (a) Frother families and range of surfactants (n, m and HLB) used in the study; (b) Commercial frothers used in the study.
(a)
Frother familyChemical structurenmHLB
Aliphatic Alcohols Minerals 02 00208 i0283–85–7.5
Polypropylene Glycols (PPG) Minerals 02 00208 i02903–177.4–9.3
Polypropylene Glycol Alkyl Ethers (PPGAE) Minerals 02 00208 i0301,3,41–76.5–8.3
(b)
Frother FamilyCommercial Frother TypeSuppliernmMolecular WeightHLB
Aliphatic AlcoholsFX120-01Flottec6-1026.05
Polypropylene Glycol (PPG)F150Flottec074258.625
Polypropylene Glycol Alkyl Ether (PPGAE)DowFroth 250Dow Chemical142647.83
DowFroth 1012Dow Chemical16.73987.48
FX160-01Flottec13.82517.86
FX160-05Flottec32.52077.11
F160Flottec42.52176.63

4. Results

4.1. Reliability and Validation

Figure 3 shows Sauter mean bubble size (D32) as a function of concentration for three repeats for the commercial frother DowFroth 250 (DF 250). Replicate tests (i.e., starting from solution preparation) were conducted by two different operators at three different times. The D32-C curves were consistent and the 95% confidence interval on the calculated CCC95 was 0.6 ppm or 0.0024 mmol/L, which is too small to indicate on subsequent plots.
Figure 3. Reliability: Inter-operator and intra-operator replicated experiments at same conditions for DowFroth 250 (DF 250).
Minerals 02 00208 g003
As validation, the results (Figure 4) show that the D32 data from MBSA are in good agreement with D32 from PIV. Together Figure 3 and Figure 4 confirm reliability and validity, respectively, of the bubble size data.
Figure 4. Validation: Sauter mean bubble size as a function of frother DF 250 concentration measured by the MBSA technique (open diamonds) and the particle imaging velocimetry (PIV) technique (closed triangles); (a) Example image at 0 ppm concentration by MBSA technique; (b) Example image at 0 ppm concentration by PIV technique; (c) Example image at 60ppm concentration by MBSA technique; (d) Example image at 60 ppm concentration by PIV technique. (Note, line is the 3-parameter model fit to the MBSA D32-C data.)
Minerals 02 00208 g004

4.2. CCC95 vs. HLB

The trend in Figure 3 was seen for all frothers, illustrated in Figure 5 for three surfactants. Table 4 summarizes the parameters from fitting to the 3-parameter model, Equation (1), for all reagents tested with their corresponding molecular weight (MW) and HLB. The literature CCC values included for reference are in agreement with the current values.
Figure 5. The effect of frother addition on D32 for three frother types; the critical coalescence concentration (CCC)95 is noted by the vertical dashed line.
Minerals 02 00208 g005
Laskowski [11] considered a dependency between the CCC and molecular weight. This is tested in Figure 6 which shows trends dependent on family. Nesset et al. [13] correlated CCC95 in ppm against HLB/MW for a selection of commercial frothers; this is tested in Figure 7 for all 36 frothers. The trend for the Alcohols is consistent but for the Polyglygols it becomes progressively scattered.
Figure 6. CCC95 (mmol/L) versus molecular weight for the 36 frothers.
Minerals 02 00208 g006
Figure 8a shows the CCC95-HLB relationship for the Aliphatic Alcohols. Starting with Propanol there is a sharp decrease in CCC95 as HLB decreases (i.e., n increases) which levels off above 6 carbons (n = 6 or C-6). For C < 6 there is an increasing isomer effect, i.e., effect of position of the OH group, which is illustrated by comparing Hexanol and Pentanol in Figure 8b. For practical purposes, however, since such short chain Alcohols are not employed as frothers, the isomer effect is later ignored. The commercial frother FX120-01 is seen to fit the trend (Figure 8a).
Table 4. Summary of properties (n, m and HLB), CCC95 and DL determined for the tested surfactants.
Frother FamilyFrother TypenmHLBMolecular Weight /(g/mol)Grau and Laskowski, 2006 [25]Current Work
CCC/ppmCCC95/ppmCCC95/(mmol/L)DL/mmAb
Aliphatic Alcohols 1-Propanol3-7.4860-2363.920.872.84−0.01
1-Butanol4-774-630.850.882.72−0.05
1-Pentanol5-6.5388-250.290.922.74−0.12
1-Hexanol6-6.0510211110.111.002.62−0.28
1-Heptanol7-5.58116-80.0721.082.54−0.36
1-Octanol8-5.1130-80.0601.152.47−0.39
2-Propanol3-7.4860-3075.100.862.77−0.01
2-Butanol4-774-771.040.882.76−0.04
2-Pentanol5-6.5388-300.340.912.67−0.10
2-Hexanol6-6.05102-110.111.012.60−0.26
2-Heptanol7-5.58116-90.0801.082.54−0.32
2-Octanol8-5.1130-80.0621.122.49−0.37
3-Pentanol5-6.5388-410.470.932.65−0.07
3-Hexanol6-6.05102-130.121.002.64−0.24
Polypropylene Glycol Ethers Propylene Glycol Methyl Ether118.289047440.480.842.77−0.07
Propylene Glycol Propyl Ether317.33118-290.250.882.75−0.10
Propylene Glycol Butyl Ether416.85132-210.160.922.72−0.14
Di(Propylene Glycol) Methyl Ether128.1314825260.180.832.86−0.11
Di(Propylene Glycol) Propyl Ether327.18176-160.0940.892.71−0.18
Di(Propylene Glycol) Butyl EtherTri(Propylene Glycol) Methyl Ether426.7190-120.0660.912.73−0.24
137.9820617150.0730.892.74−0.20
Tri(Propylene Glycol) Propyl Ether337.03234-110.0450.922.70−0.28
Tri(Propylene Glycol) Butyl Ether436.55248-70.0290.962.67−0.42
Polypropylene Glycols Di Propylene Glycol-29.25134-530.400.712.89−0.06
Tri Propylene Glycol-39.125192-330.170.693.01−0.09
Tetra Propylene Glycol-49250-220.0880.712.90−0.14
Polypropylene Glycol 425-78.625425-60.0140.742.88−0.50
Polypropylene Glycol 725-128725-70.00910.792.84−0.45
Polypropylene Glycol 1000-177.3751000-80.00840.882.73−0.36
Commercial Frothers FX120-016-6.05102-110.100.982.68−0.27
DowFroth250147.832649100.0380.852.76−0.30
DowFroth101216.77.48420660.0140.862.75−0.53
FX160-0532.57.11207-150.0740.902.72−0.20
FX160-0113.87.86251-120.0480.882.73−0.25
F150-78.625425-60.0140.762.85−0.49
F16042.56.63217-80.0370.952.66−0.37
Figure 7. CCC95 (ppm) versus HLB/molecular weight for the 36 frothers.
Minerals 02 00208 g007
Figure 9 shows CCC95 vs. HLB for the two Polyglycol families, in this case as a function of m for a given n. There is a pattern: CCC95 decreases with increasing m in a series of parallel or self-similar plots which trend to lower HLB with increasing n. For n = 0 (i.e., Polypropylene Glycols) m = 1 was tested but showed no bubble size reduction up to 13 mmol/L (1,000 ppm) and is omitted. The commercial frothers are shown to fit the pattern.
Figure 8. (a) CCC95 versus HLB for the Aliphatic Alcohols and their isomers (1-Alcohol, 2-Alcohol and 3-Alcohol); (b) the effect of –OH group position on CCC95 for Pentanol and Hexanol isomers.
Minerals 02 00208 g008
Figure 9. CCC95 versus HLB for the Polyglycols as function of m and n.
Minerals 02 00208 g009

4.3. Developing a CCC-HLB Model

The trends in Figure 8a and Figure 9 show consistent patterns that can be fitted to the following exponential Equation:
Minerals 02 00208 i014
where α and β are constants that depend on the family (i.e., n and m). Table 5 gives the values for the Polyglycols and 1-Alcohols.
Table 5. The constants in Equation (6) for the range of n and m and goodness-of-fit (precision) statistics.
FamilynmαβPrecision
Data Points, NR2R2AdjustedSSERMSE
1-Alcohol3–801.52E-103.20760.98150.97690.0021360.02311
Polypropylene Glycol02–174.76E-173.95160.96150.9420.0060690.04498
Polypropylene Glycol Methyl Ether11–71.61E-184.85560.97450.96820.0040490.03181
Polypropylene Glycol Propyl Ether31–33.15E-195.62440.99370.99050.00015810.008891
Polypropylene Glycol Butyl Ether41–39.58E-206.12540.99720.99573.027E-50.003891
For Polyglycols, the α and β can be linked to n as follows:
Minerals 02 00208 i015
Minerals 02 00208 i016

4.4. Developing CCC95 Model as a Function of n and m

4.4.1. Polyglycols

Figure 10 presents HLB values versus m, which shows simple linear relationships. Taking 0.149 as the average slope this yields:
Minerals 02 00208 i017
where γ depends on n (see inset).
The γ is then correlated to n, yielding:
Minerals 02 00208 i018
To define the relationship between HLB and parameters m and n, Equation (8) and (9) are combined:
Minerals 02 00208 i019
The expressions for α (Equation (7)), β (Equation (8)) and HLB (Equation (11)) are inserted into Equation (6) to obtain an overall expression for CCC95 as a function of m and n. After re-arranging and gathering terms one obtains:
Minerals 02 00208 i020
Equation (12), while cumbersome, gives an excellent fit (Figure 11) for n = 1, 3 and 4 and an acceptable fit for n = 0. It is evident, therefore, that knowing m and n for Polyglycols, in essence the structure, CCC95 can be predicted.
Figure 10. HLB for the polyglycols as function of m for a given n.
Minerals 02 00208 g010
Figure 11. Model (Equation (12)) fit CCC95 versus HLB data for the Polyglycols plotted as function of m for a given n.
Minerals 02 00208 g011

4.4.2. 1-Alcohols

Applying the same approach as described for Polyglycols, the CCC95 for 1-Alcohols can be expressed by the general relationship:
Minerals 02 00208 i023
The experimental data and model fit (line) are shown in Figure 12; it is evident that the CCC95 of 1-Alcohols can be predicted if n is known.
Figure 12. Model (Equation (12)) fit to CCC95 versus HLB data for the 1-Alcohols.
Minerals 02 00208 g012

4.5. DL and HLB

Nesset et al. [2] suggested that the minimum bubble diameter (determined from the model fit, Equation (1), DL) tended to decrease as CCC95 increased, i.e., as HLB increased. Figure 13 expands the database and confirms this trend, showing a linear decrease in DL as HLB increases fitted by:
Minerals 02 00208 i025
Figure 13. Minimum bubble size DL versus HLB for all surfactants tested: the line is the regression model, Equation (14).
Minerals 02 00208 g013

4.6. Predicting D32

According to Equation (2), for a given frother the D32 at any concentration can be predicted knowing DL, A, b and CCC95. The b is calculated from Equation (3) and DL is determined from Equation (14), once the frother’s molecular structure is known (i.e., HLB is known). The constant A can be estimated from the difference between D0 and DL. Example calculation is given using a commercial frother FX160-05 (Table 4).
Table 6. D32 prediction for FX160-05.
InputOutput
Structural info. (given)Bubble size related info. (calculated)
Frother typePolypropylene Glycol Propyl EtherCCC95/(mmol/L)0.074
n3DL/mm0.90
m2.5b−0.20
Calculated HLB7.11A2.72
Assembling the output data from Table 6 into Equation (2), the equation to predict D32 forFX 160-05 becomes:
Minerals 02 00208 i027
Figure 14 shows the predicted and measured D32-C trends are in excellent agreement.
Figure 14. Comparison of measured and predicted D32 versus FX160-05 frother concentration.
Minerals 02 00208 g014
To test more than one frother we select the D32 at the CCC50: Figure 15 shows the fit obtained for all the commercial frothers examined.
Figure 15. Comparison of measured and predicted D32 at CCC50 for all commercial frothers
Minerals 02 00208 g015

5. Discussion

In many flotation systems, frothers have the key function of controlling bubble size. Consequently understanding and predicting their action is of interest to modellers and plant operators alike. The approach here was to explore a structure-function relationship. To quantify structure HLB was used as it encompasses the hydrophilic-hydrophobic (amphipathic) character that controls adsorption at the air-water interface, which arguably is the basis for frother action. The function, bubble size reduction, was quantified through the CCC concept derived from the plot of Sauter mean diameter (D32) versus concentration (C). The D
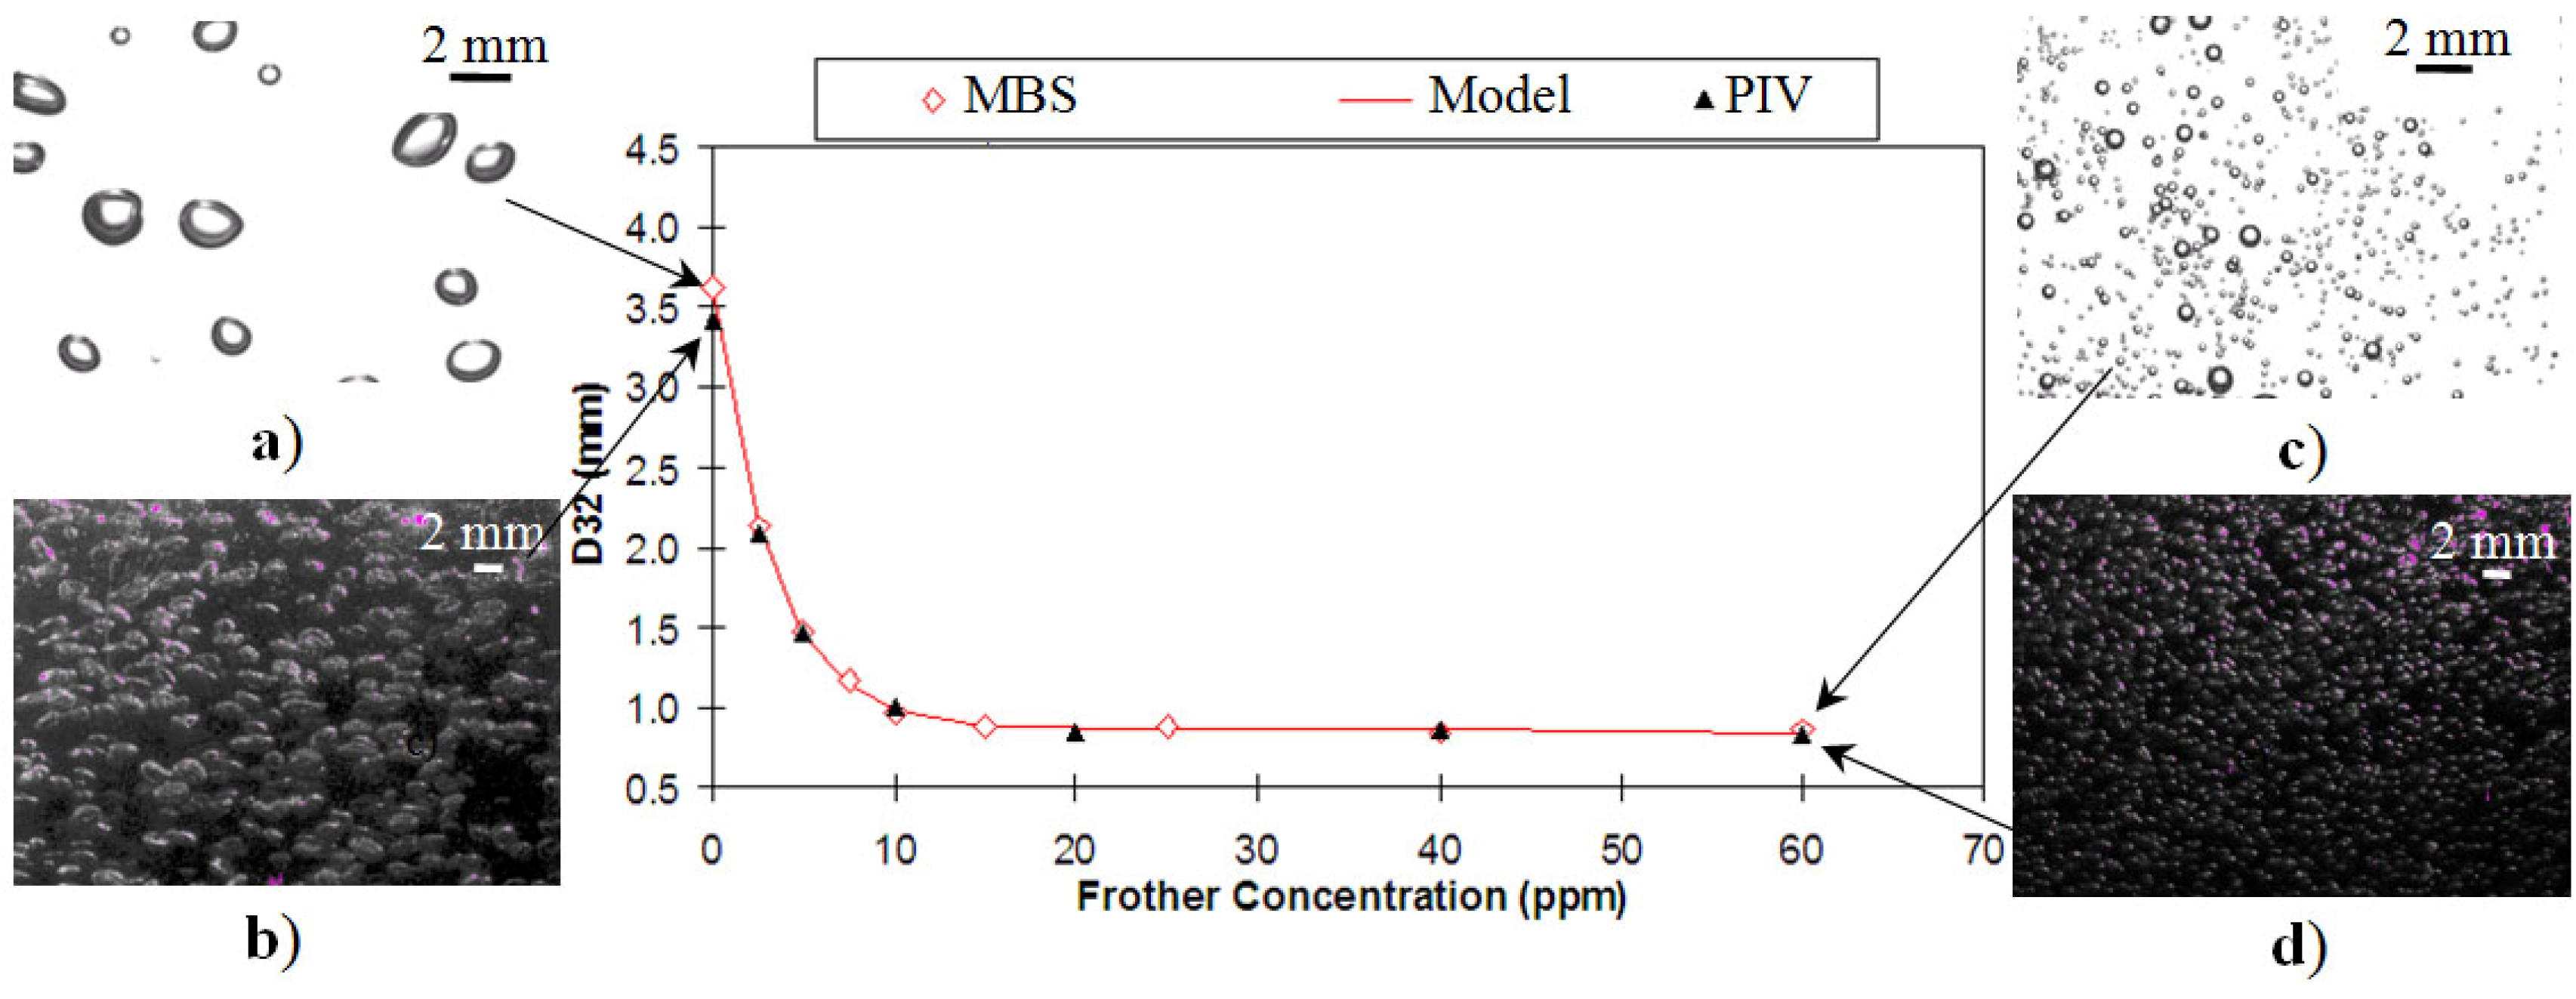
32 was calculated from bubble size distribution obtained using a sampling-for-imaging technique and validated against a second, PIV-based method. The estimation of CCC95 from the 3-parameter model fit to the D32 vs. C data proved reliable based on replicated tests and by showing CCC95 values were similar to published CCC data (
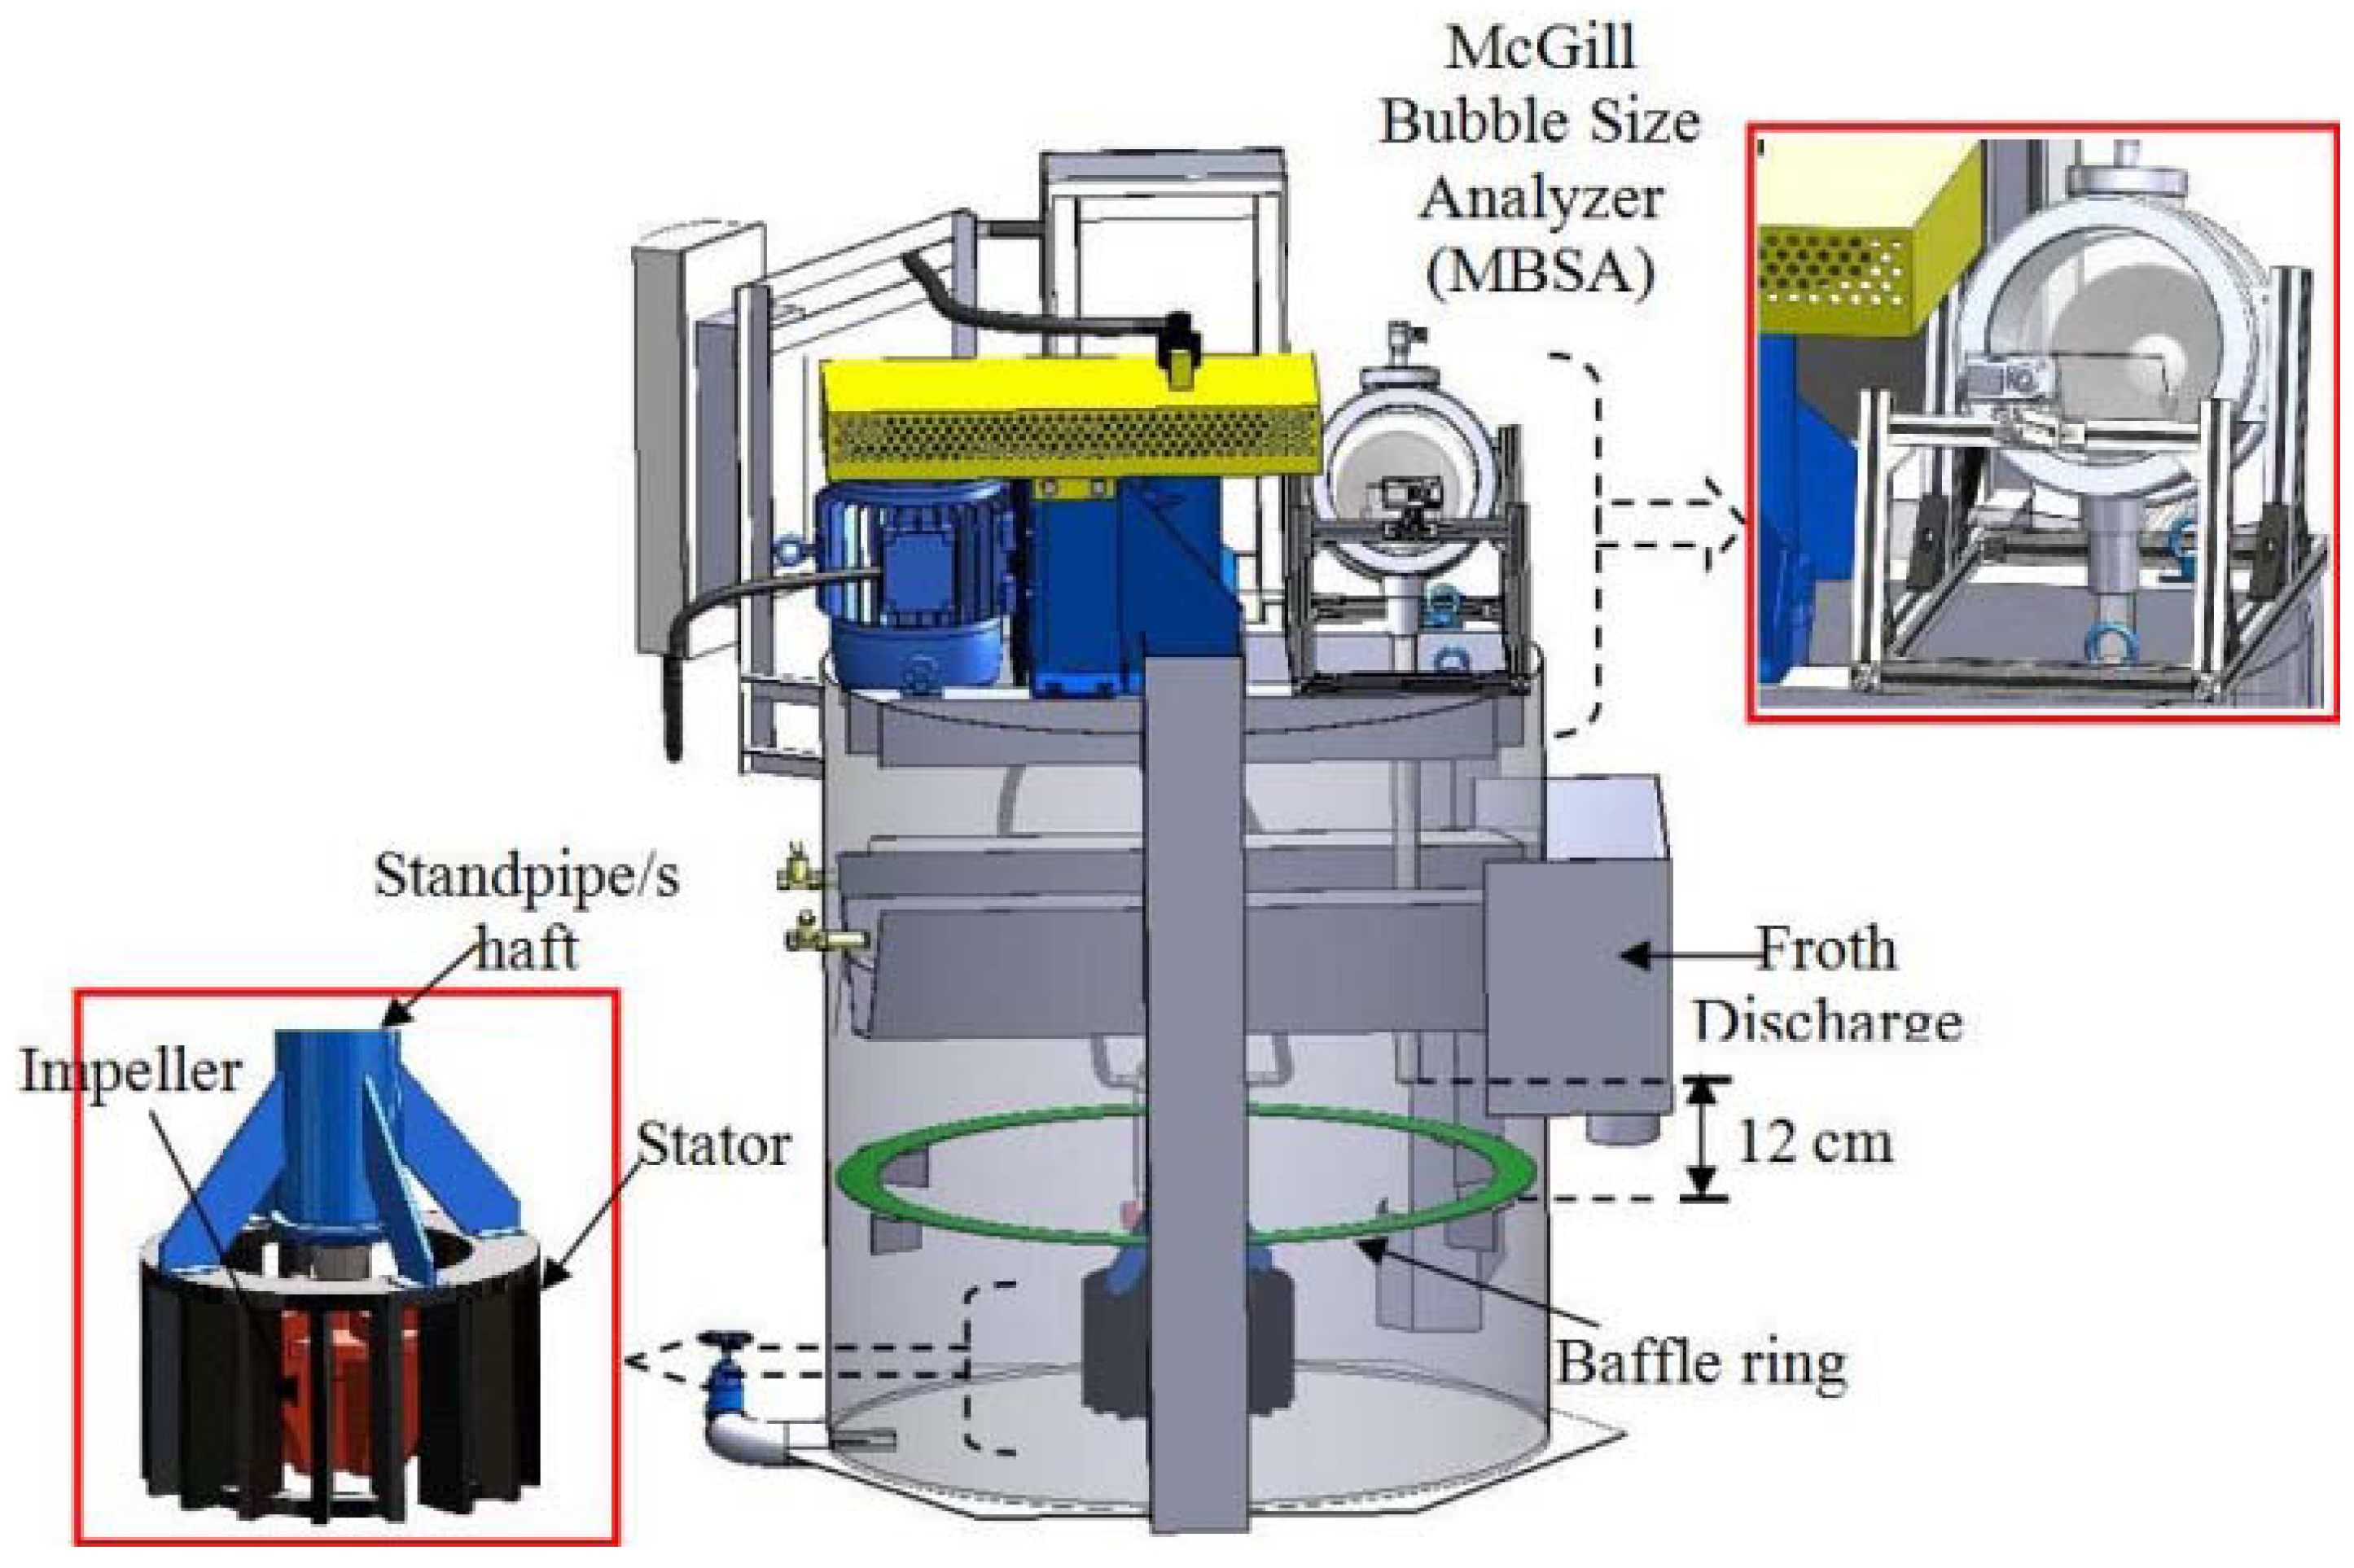
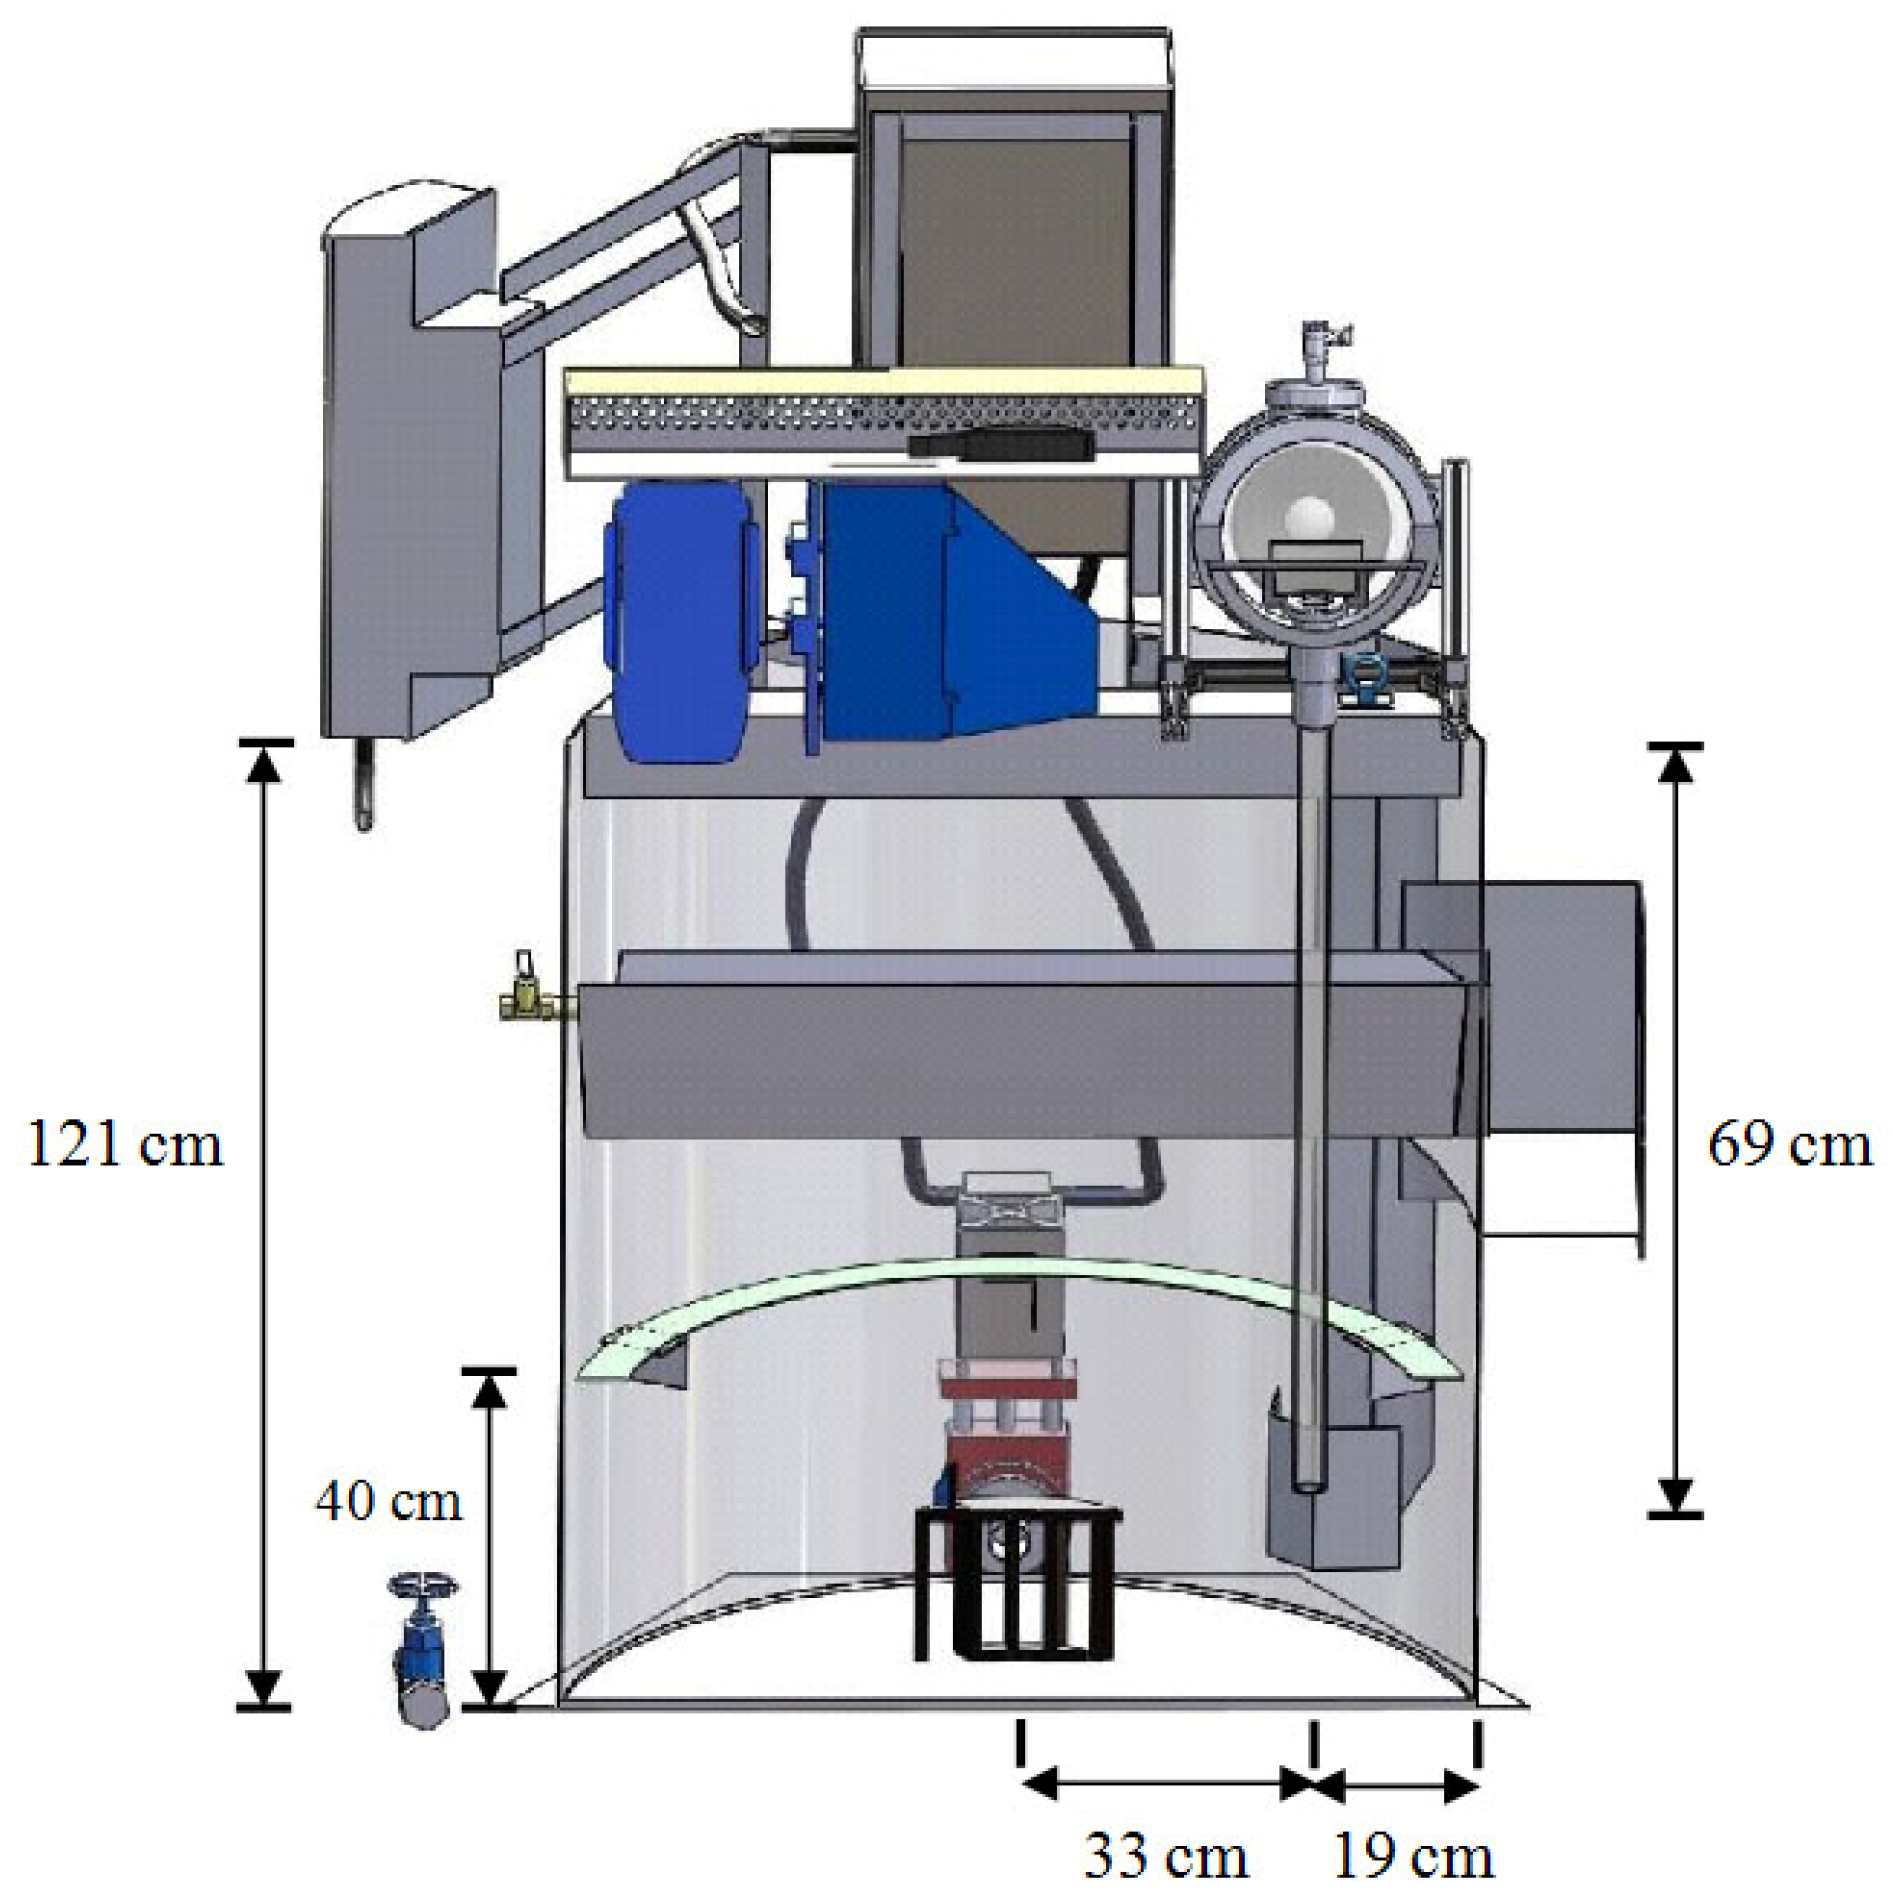
Table 4). The large cell volume (700 L water) permitted sufficient chamber surfactant concentration in the MBSA to avoid coalescence without contaminating the cell contents (water in the MBSA is displaced into the cell, as bubbles (air) accumulate) which improves data reliability at cell concentrations below CCC95 and thus improves the fit to Equation (1). Previous work had established that bubble size response in water-air systems translates well to three-phase flotation systems [2,13].
Efforts along this structure-function approach by Laskowski [11] and Nesset et al. [2,
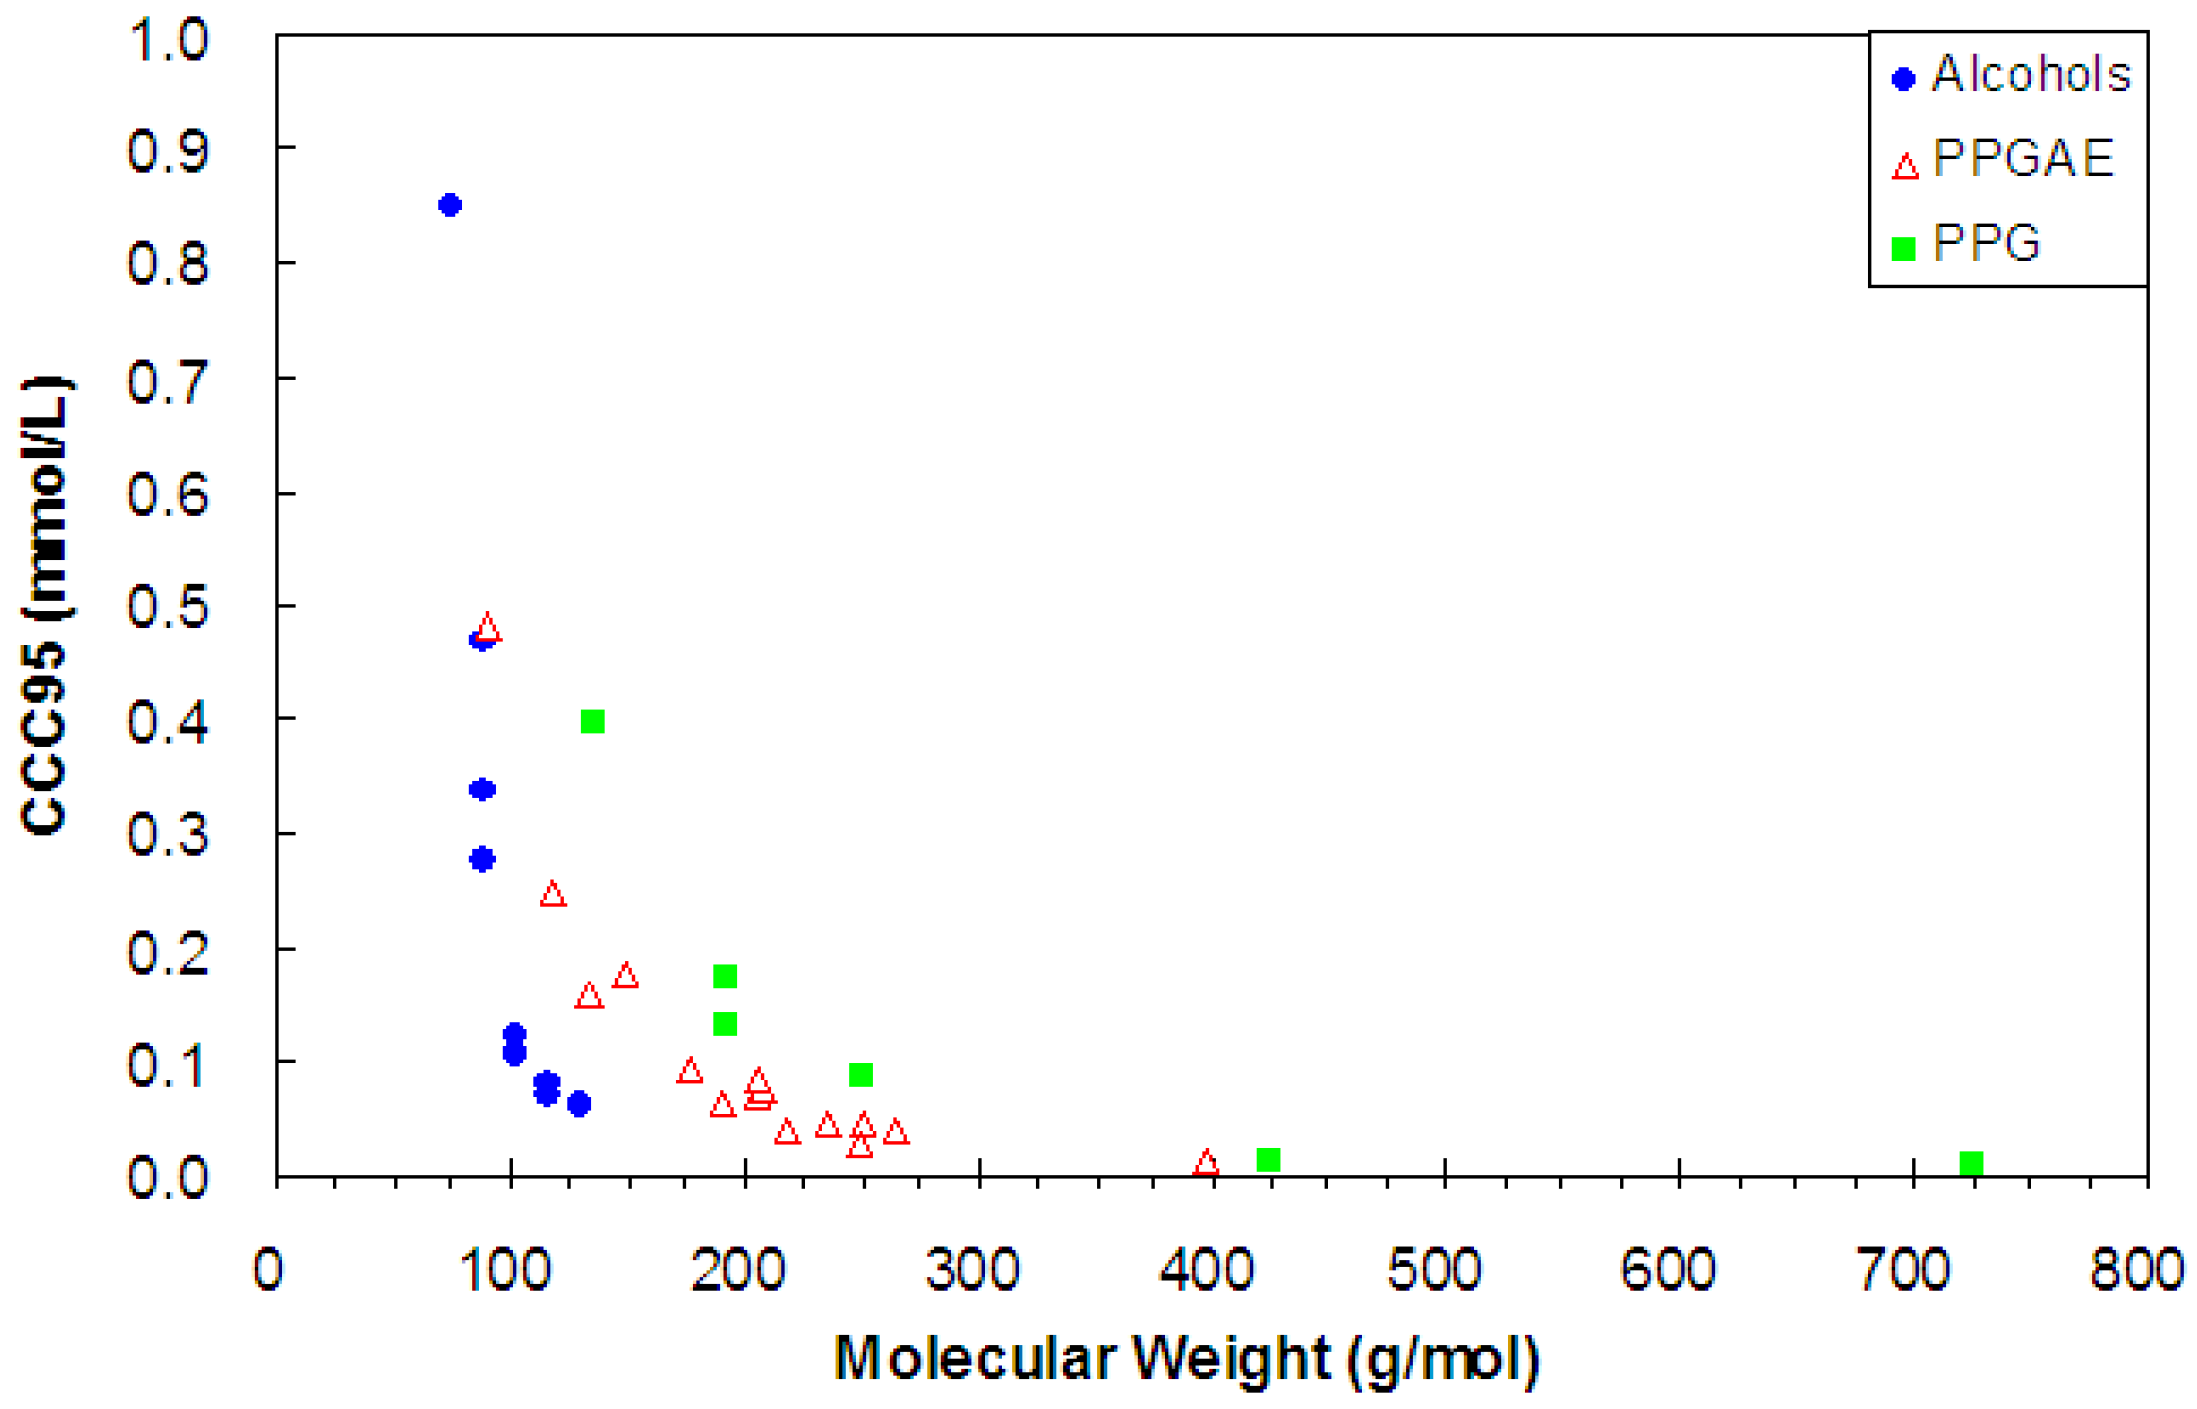
13] laid a foundation. Correlations involving molecular weight were explored in Figure 6 and Figure 7 but the focus was to employ HLB alone. That pursuit revealed a family-based CCC-HLB pattern, confirming the possibility entertained by Pugh [
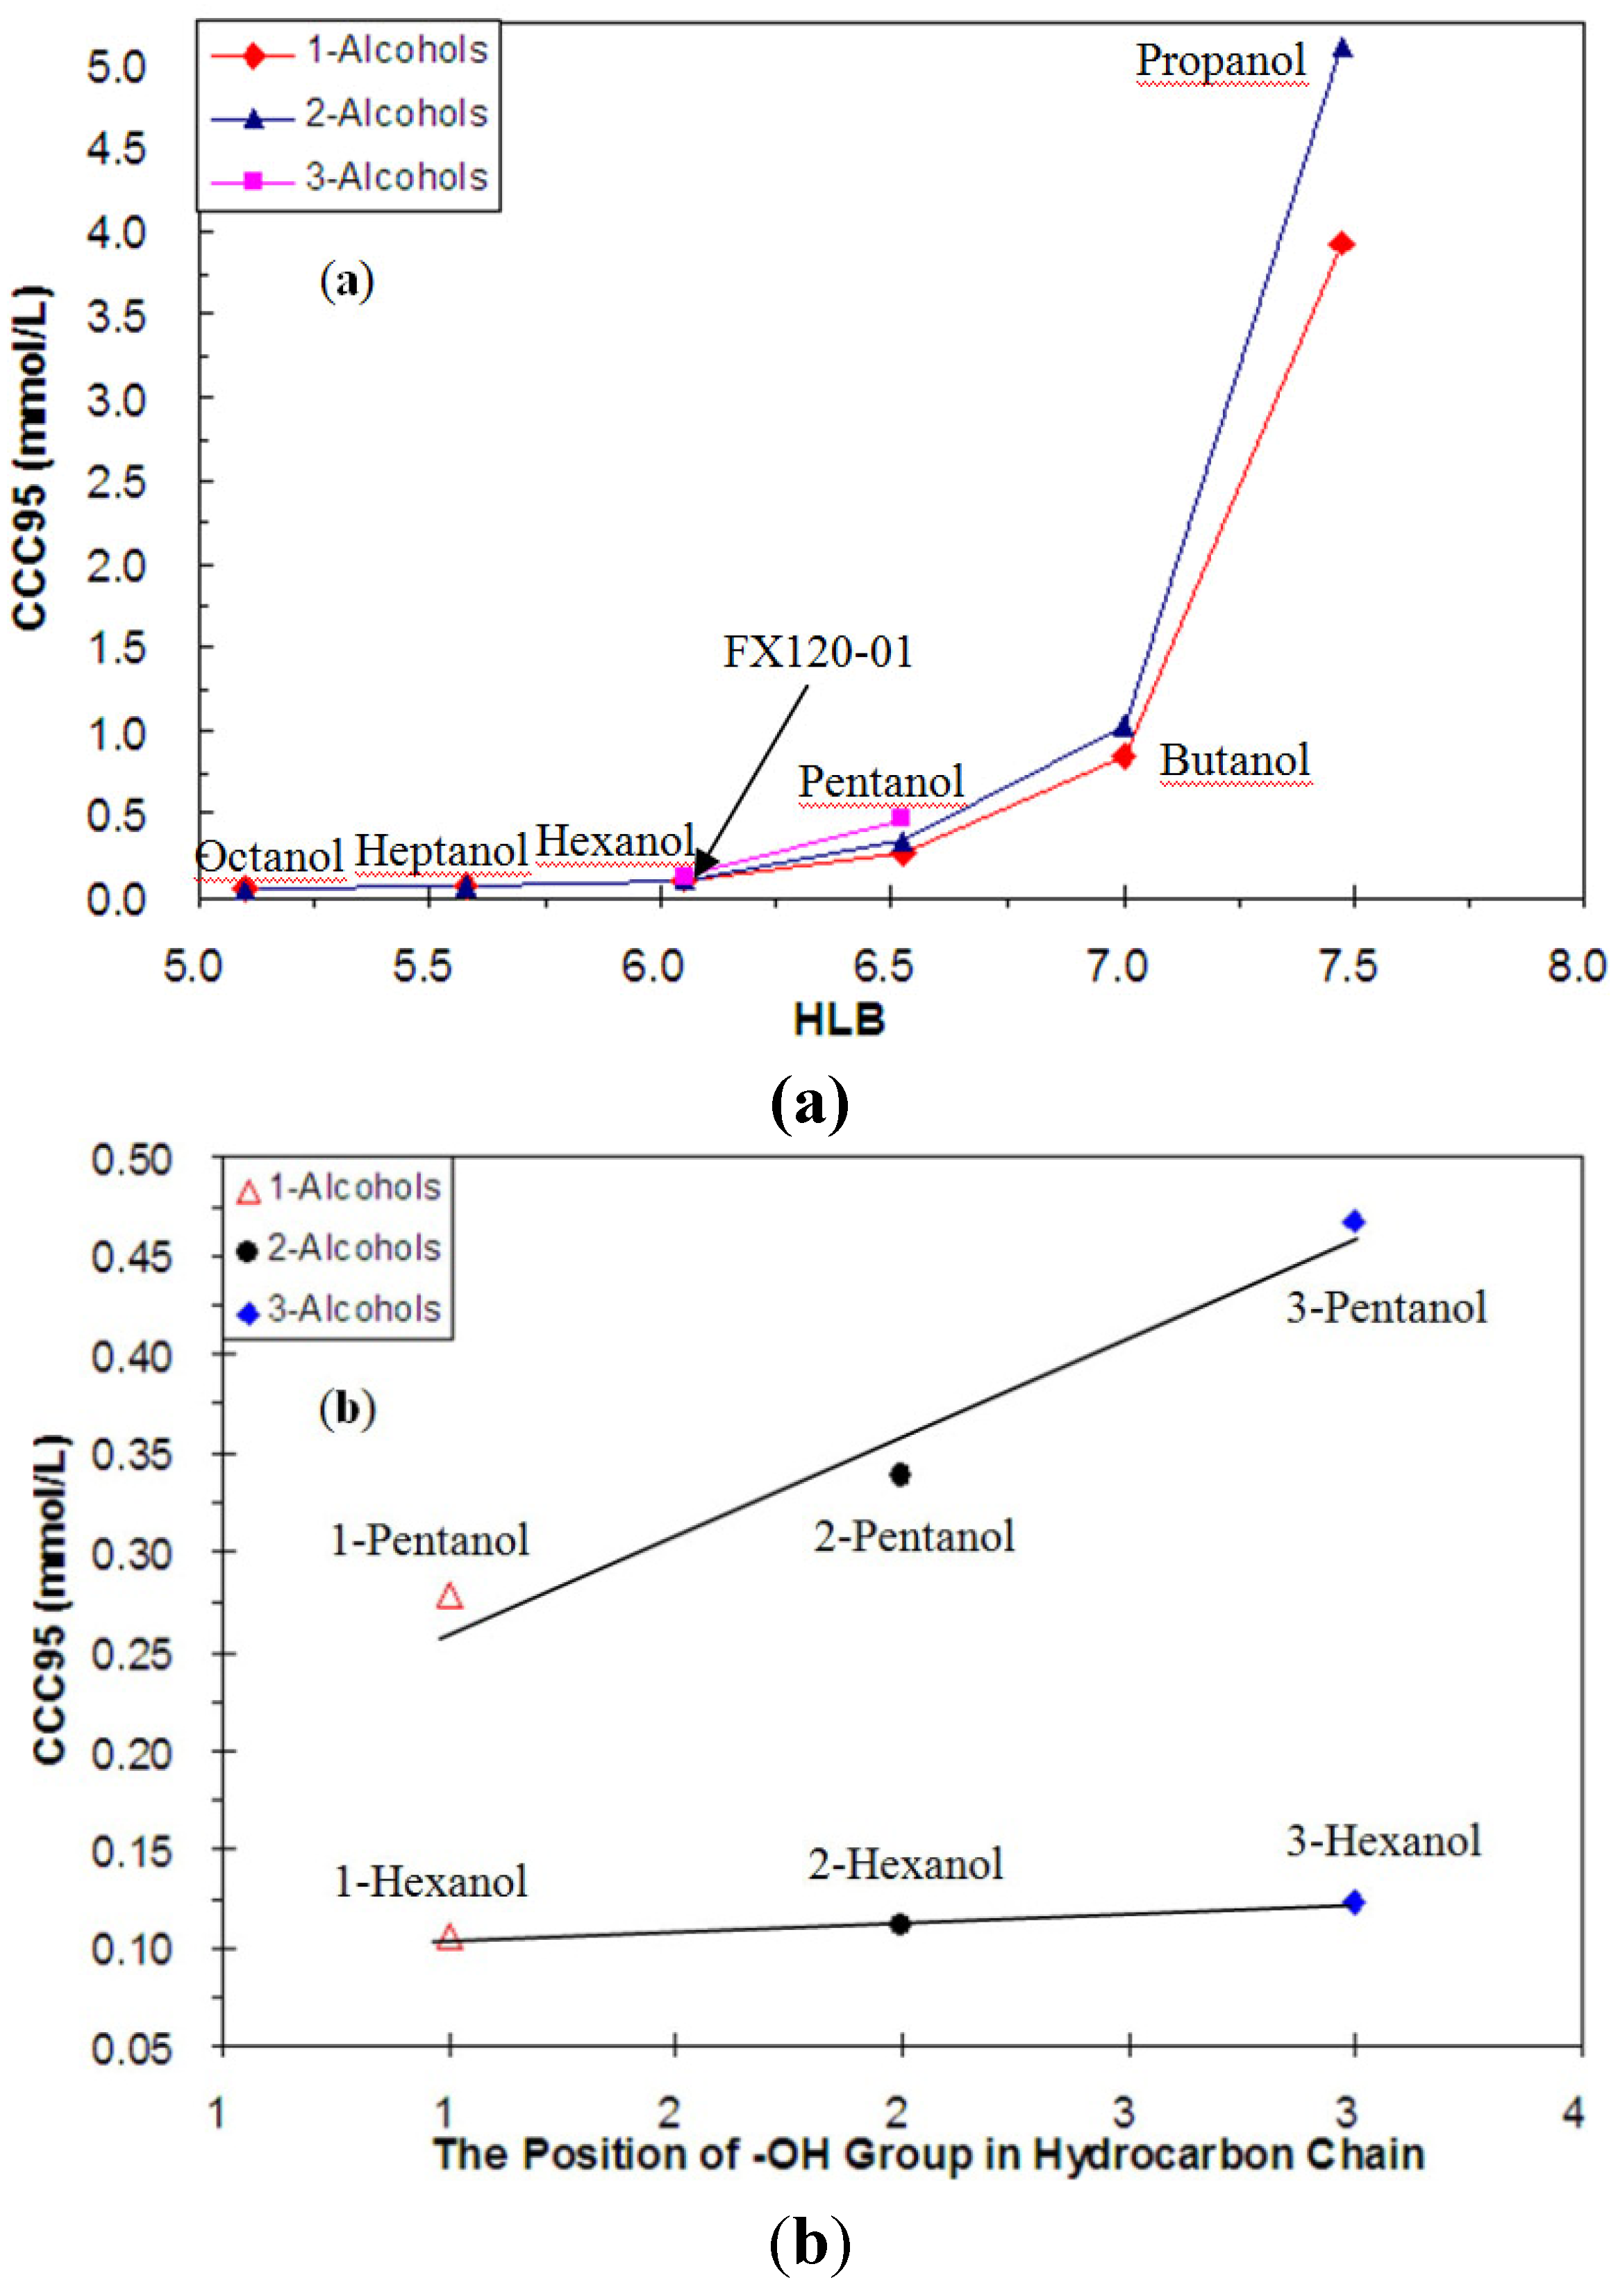
21]. For the Alcohols the trend was a decrease in CCC95 as HLB was reduced by increasing the number of carbons (n), especially going from n = 3 to 6 (Figure 8a). Studies on inhibition of bubble coalescence by Alcohols reveal a similar trend, the concentration required decreasing with increasing n to approach a limiting value for n > 6 [26,27]. The work here also identified an isomer effect (Figure 8b). Given this only becomes significant for C < 5 and such alcohols are not commonly employed commercially as frothers we chose to omit the isomer effect in subsequent analysis.
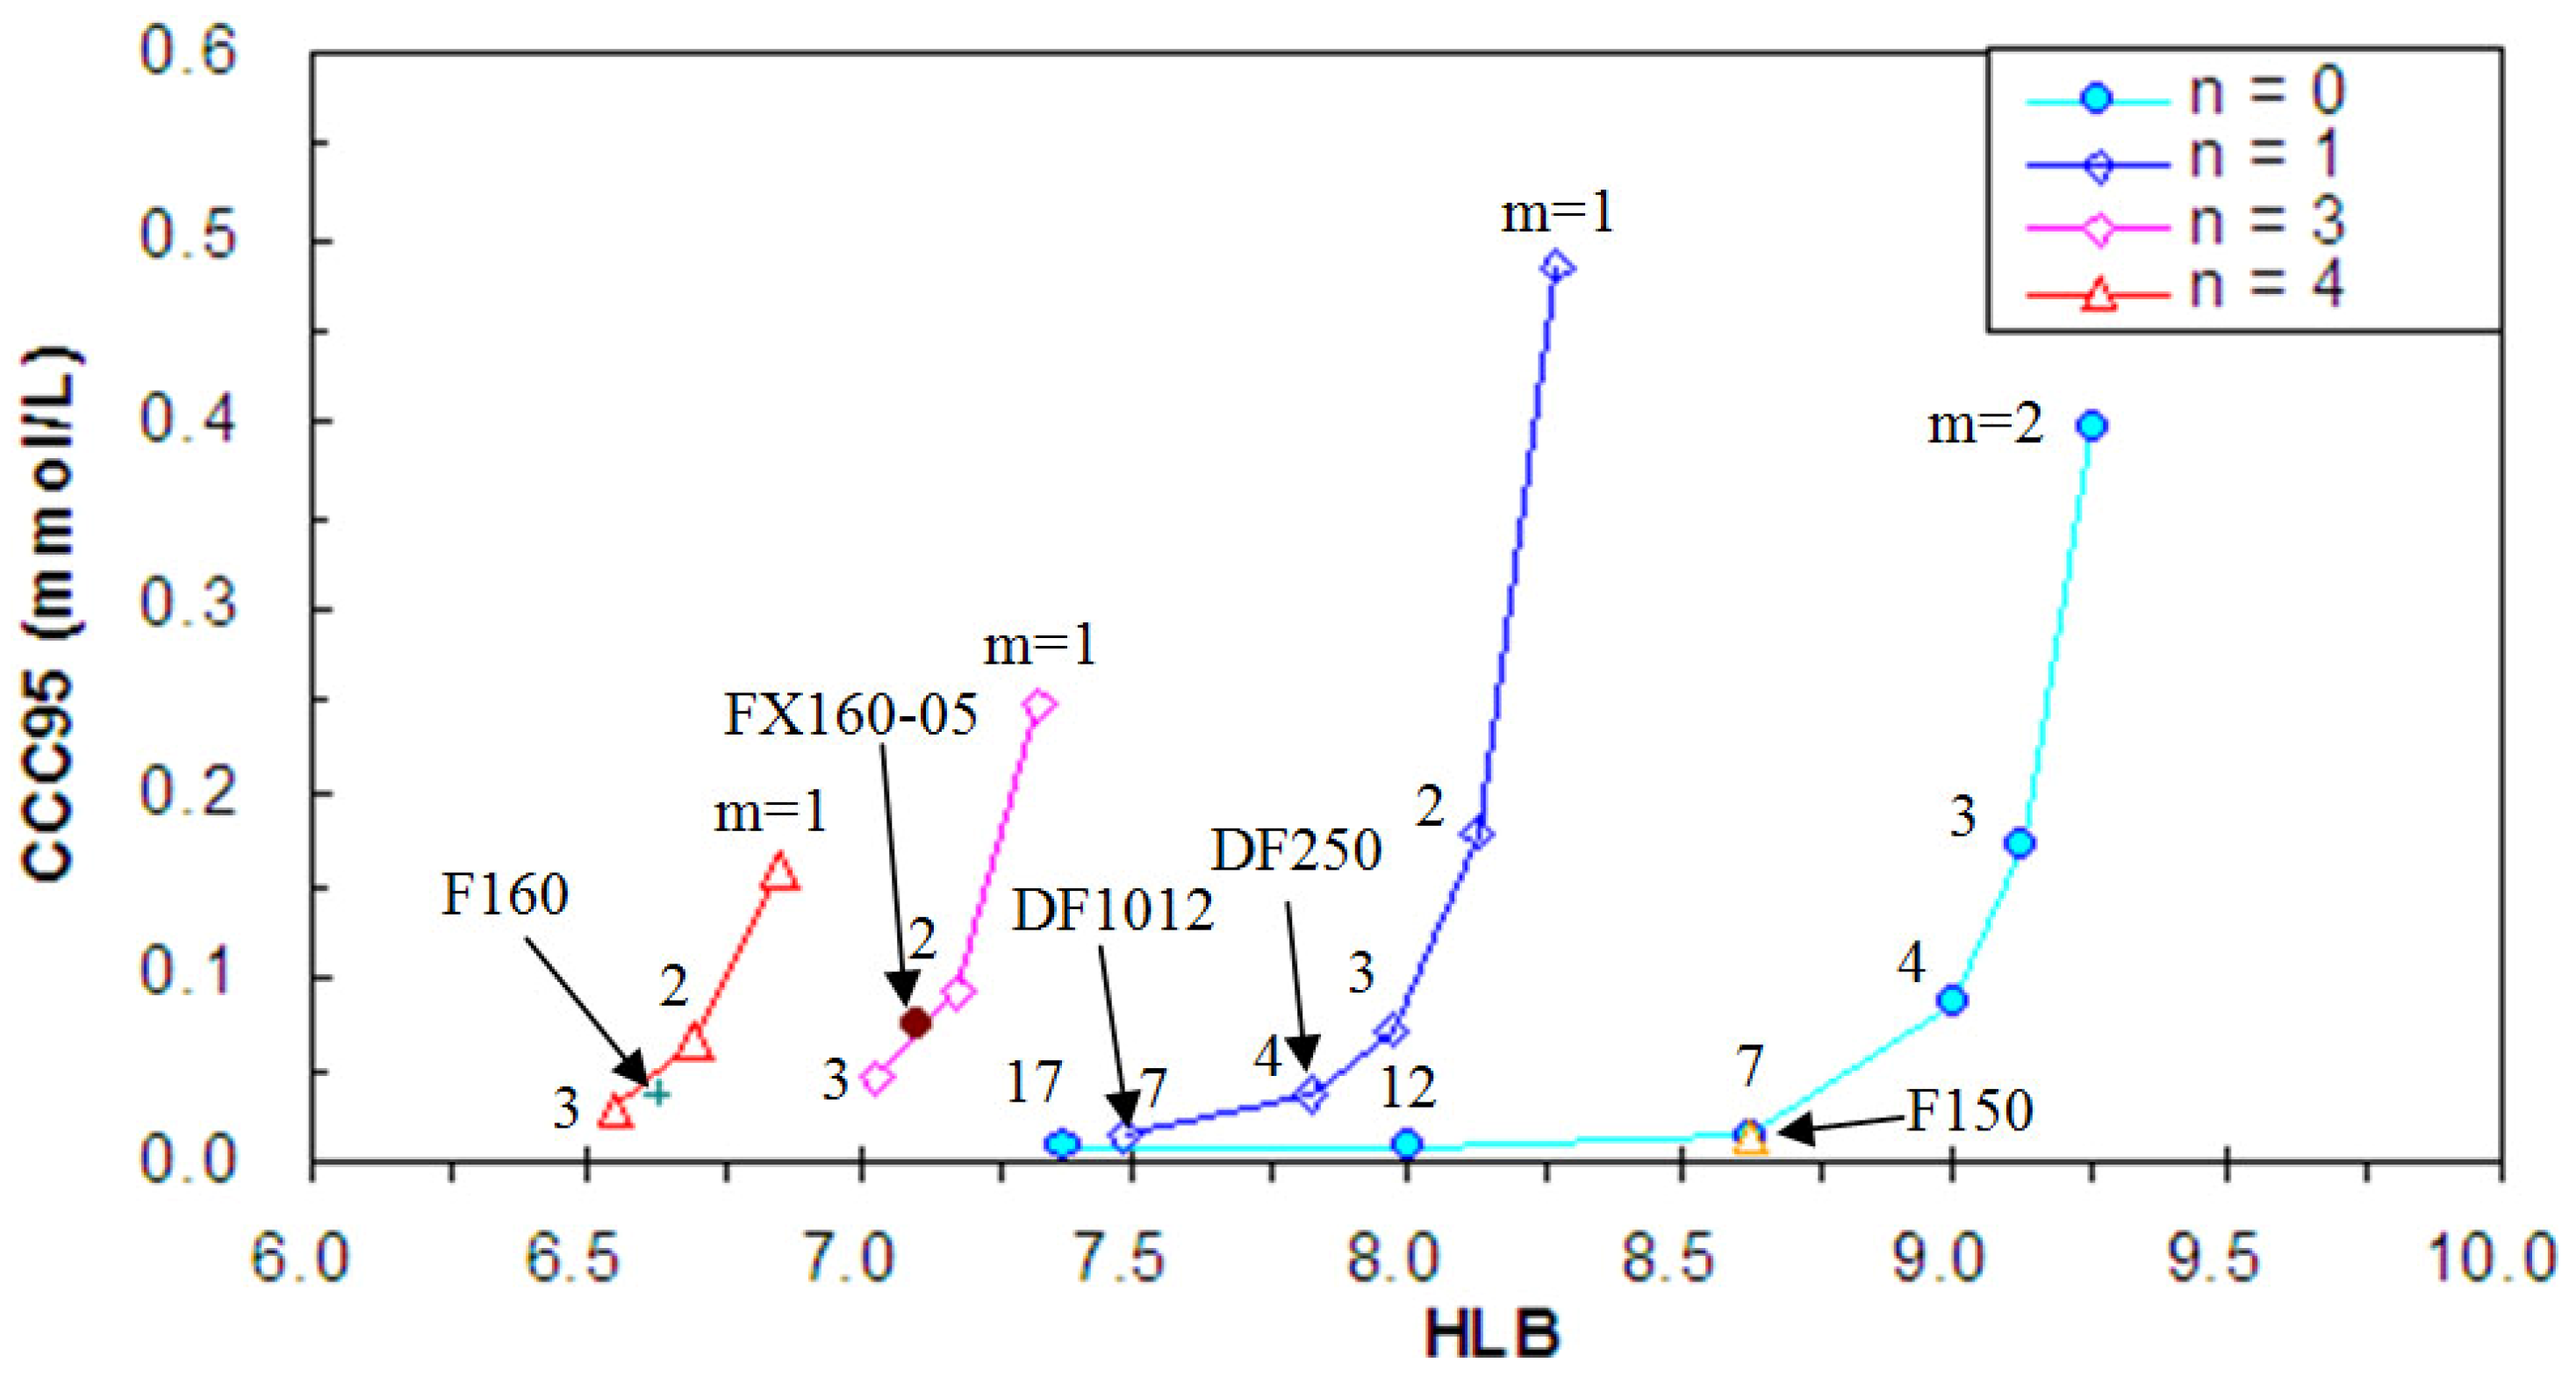
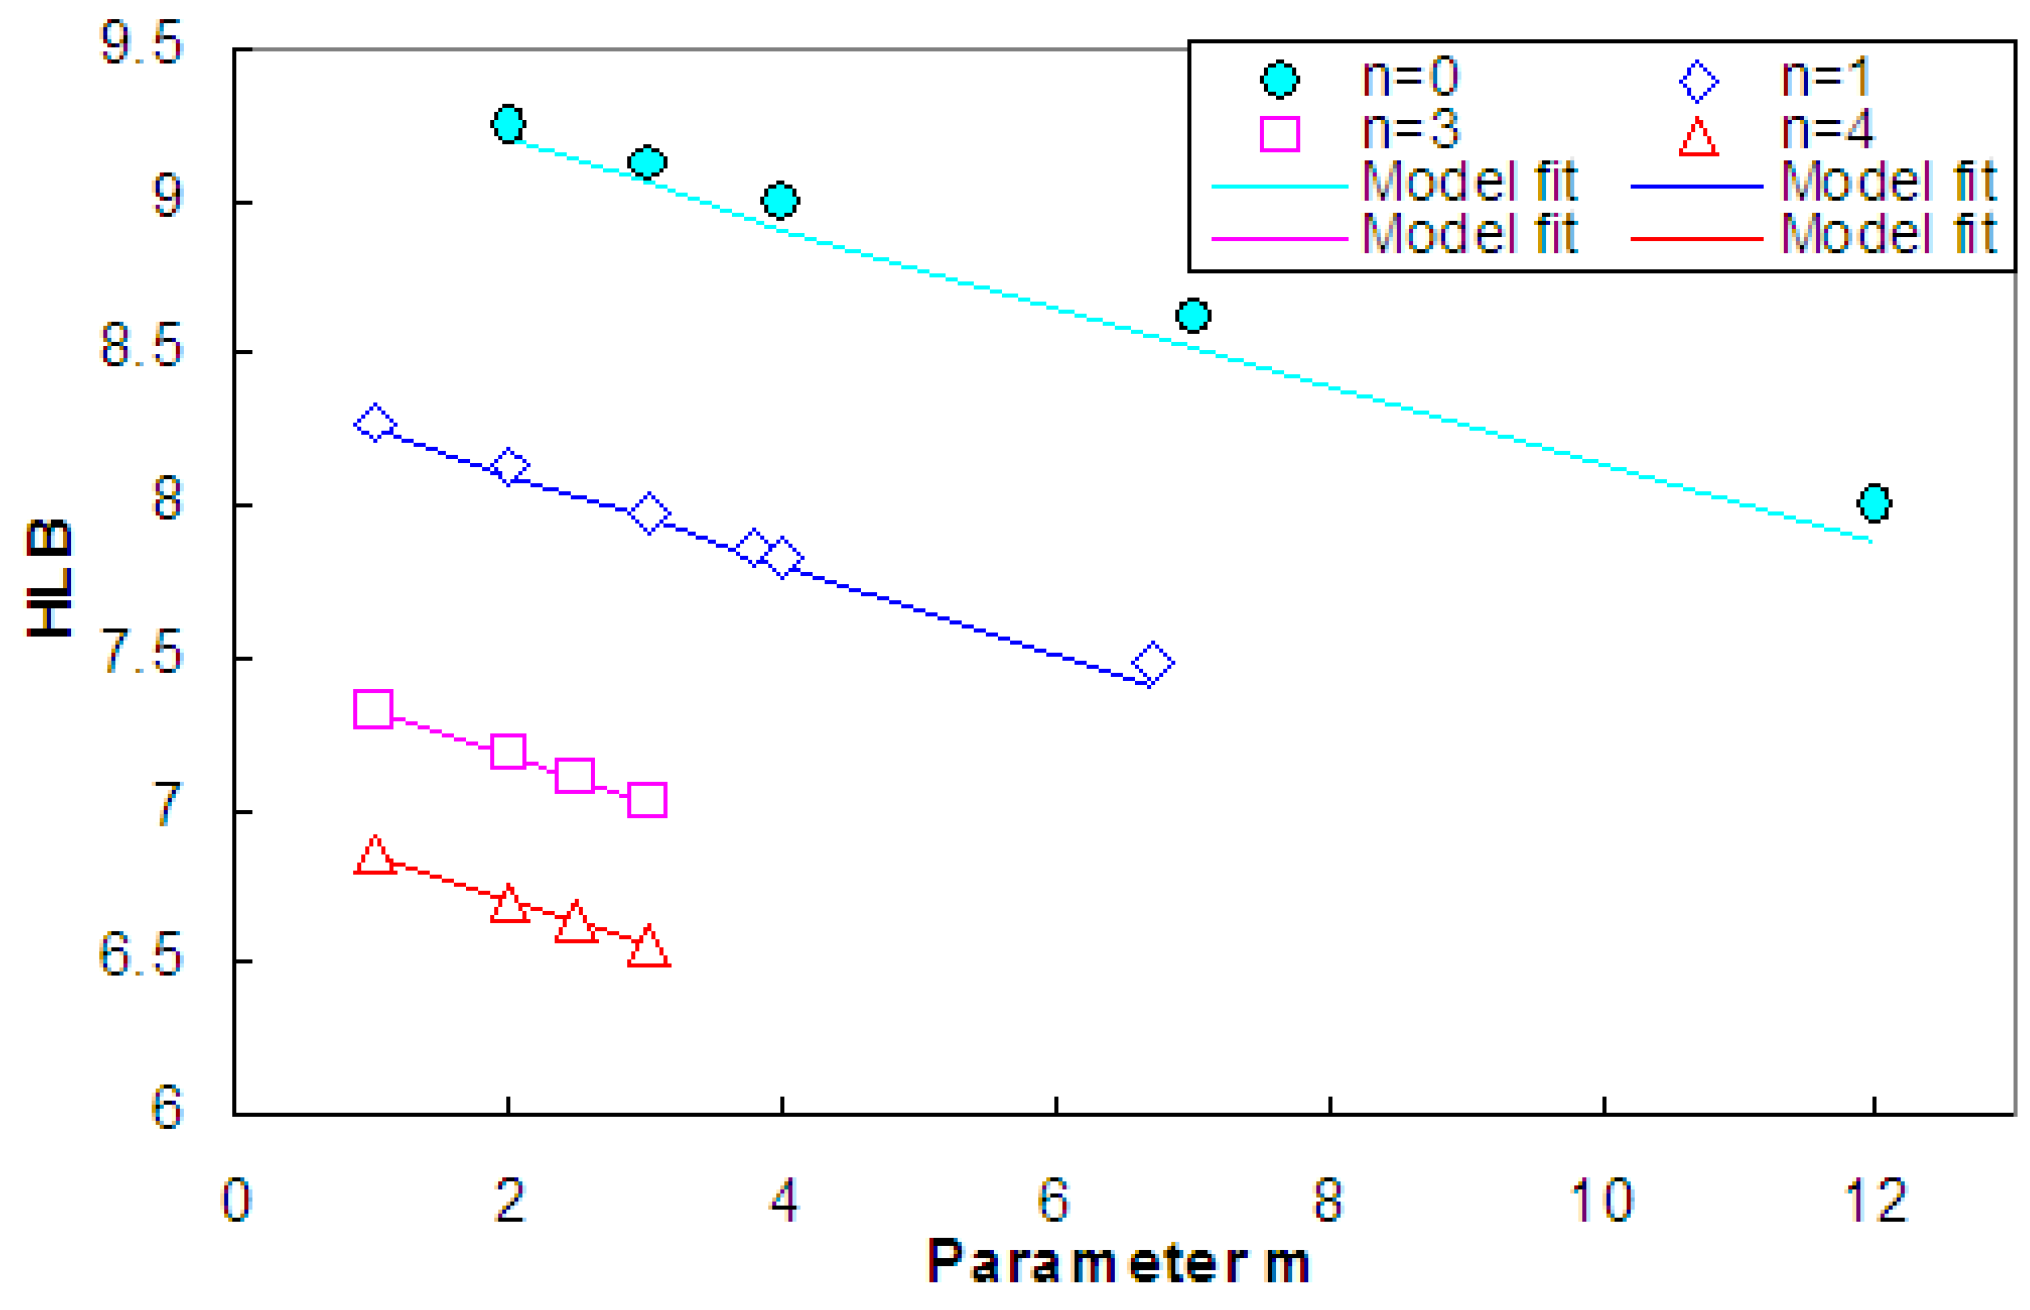
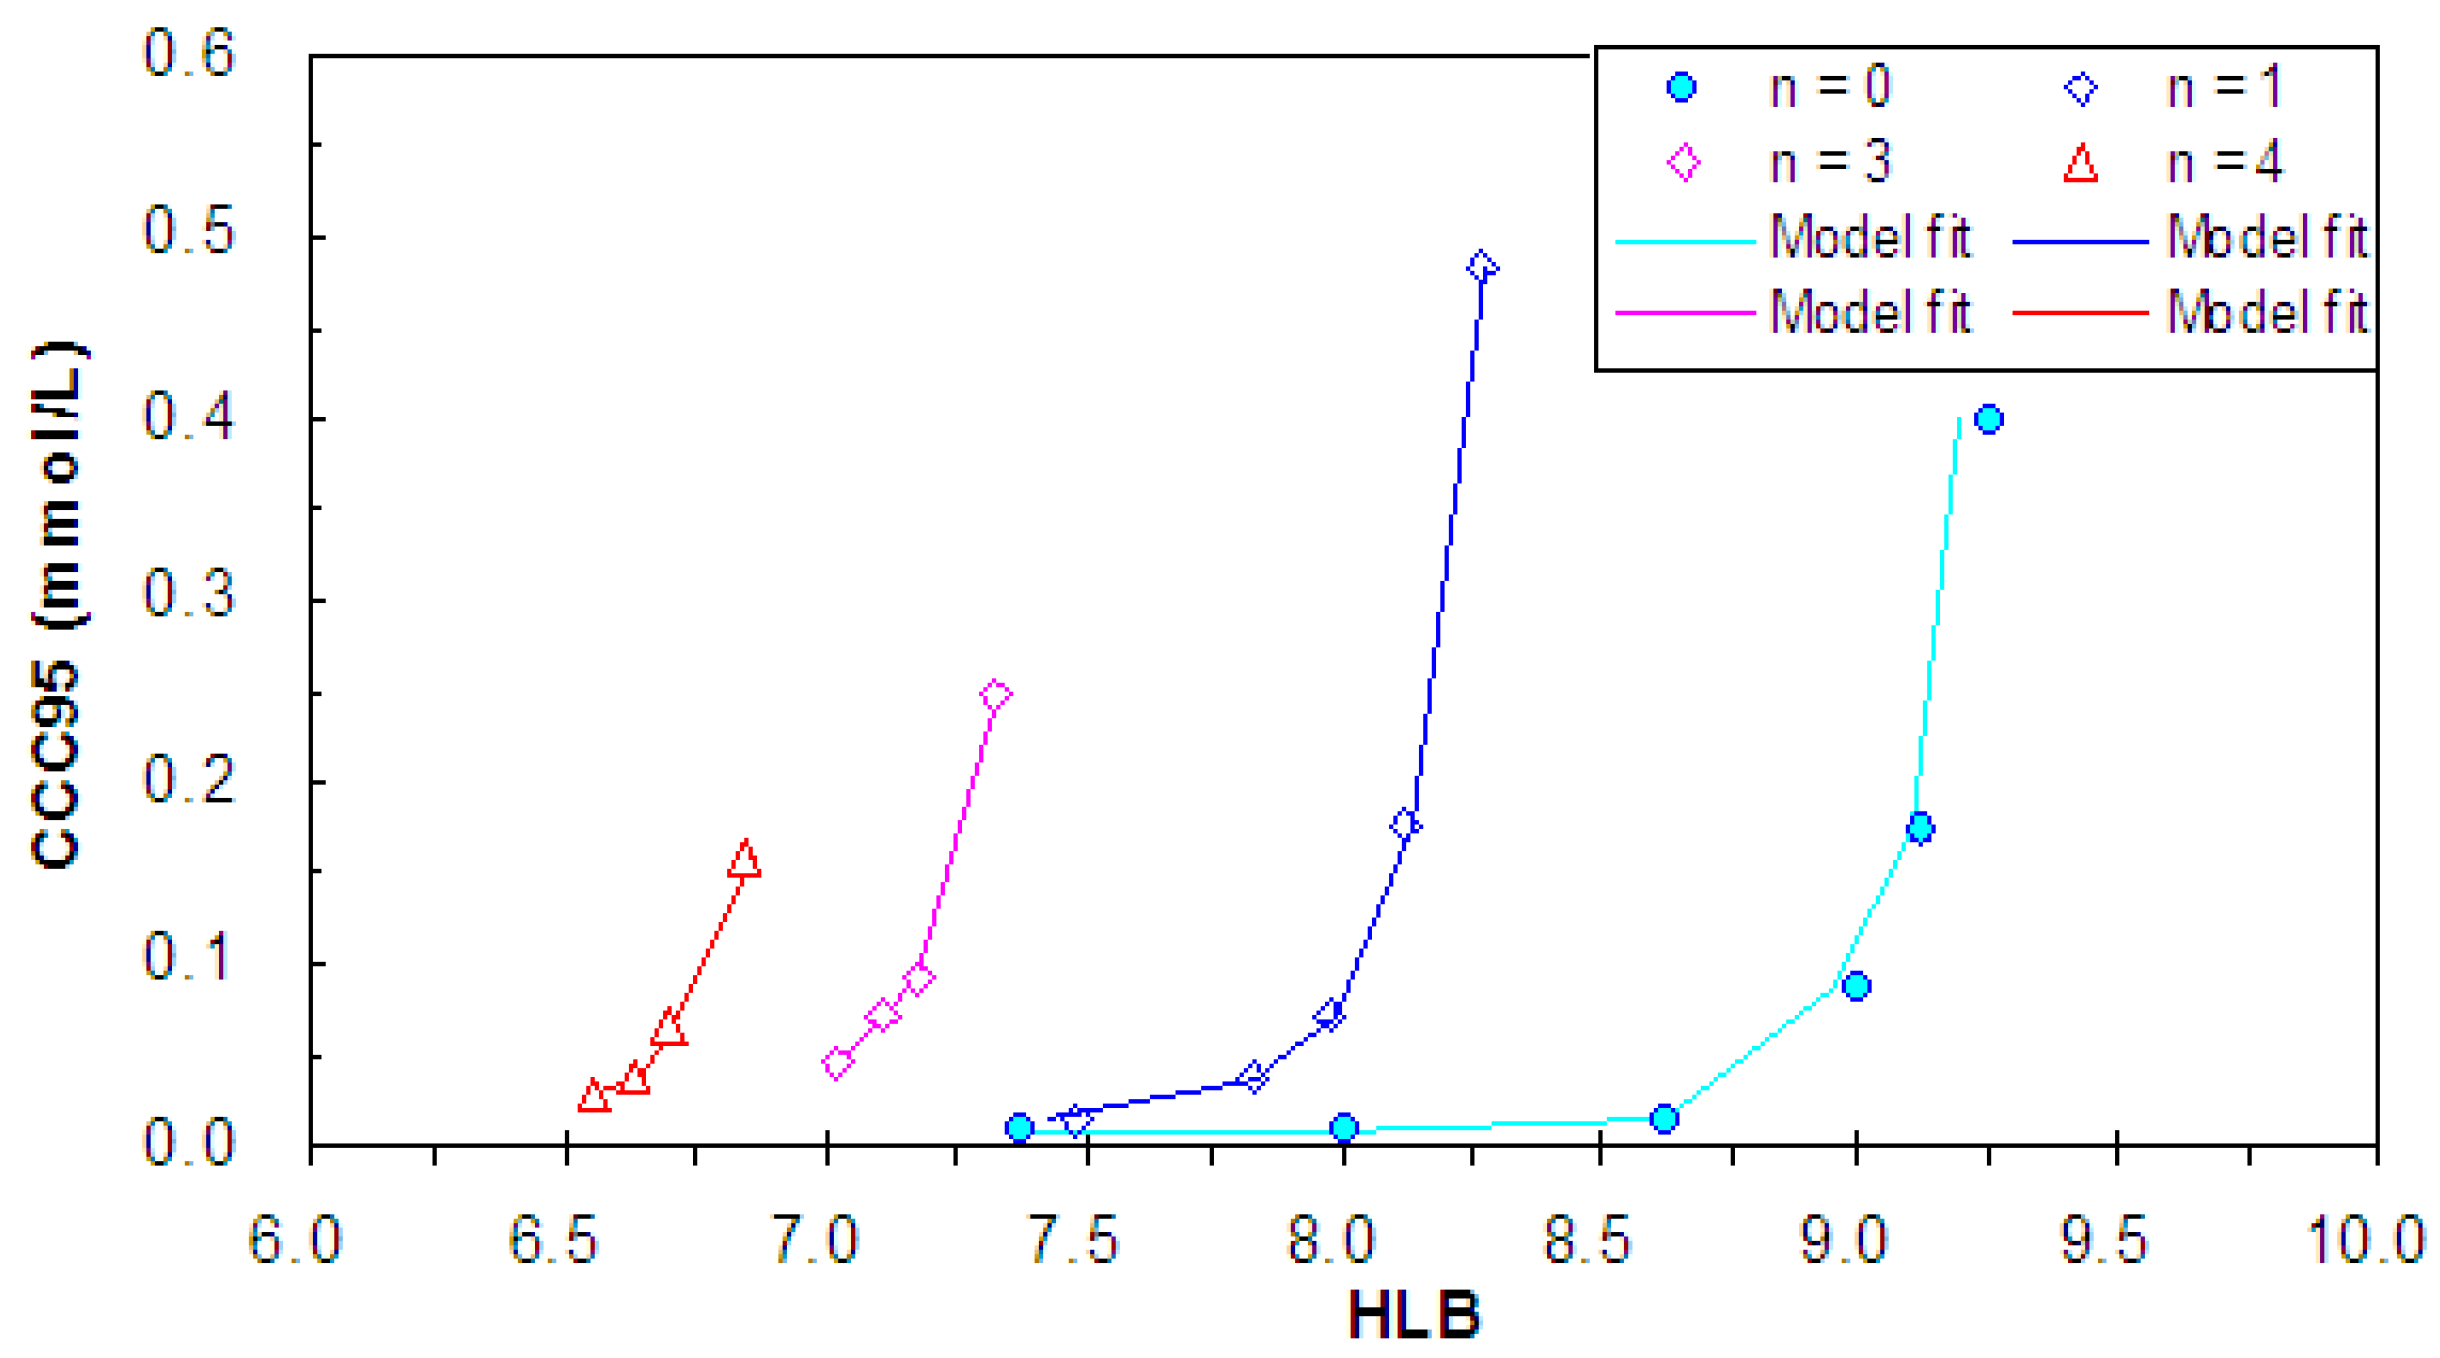
The pattern for Polyglycols was that CCC95 decreased as m increased in a series of self-similar plots shifting to lower HLB as n increased (Figure 9). Although the PPGAEs and PPGs are usually considered separate families, the pattern suggests they can be treated as one.
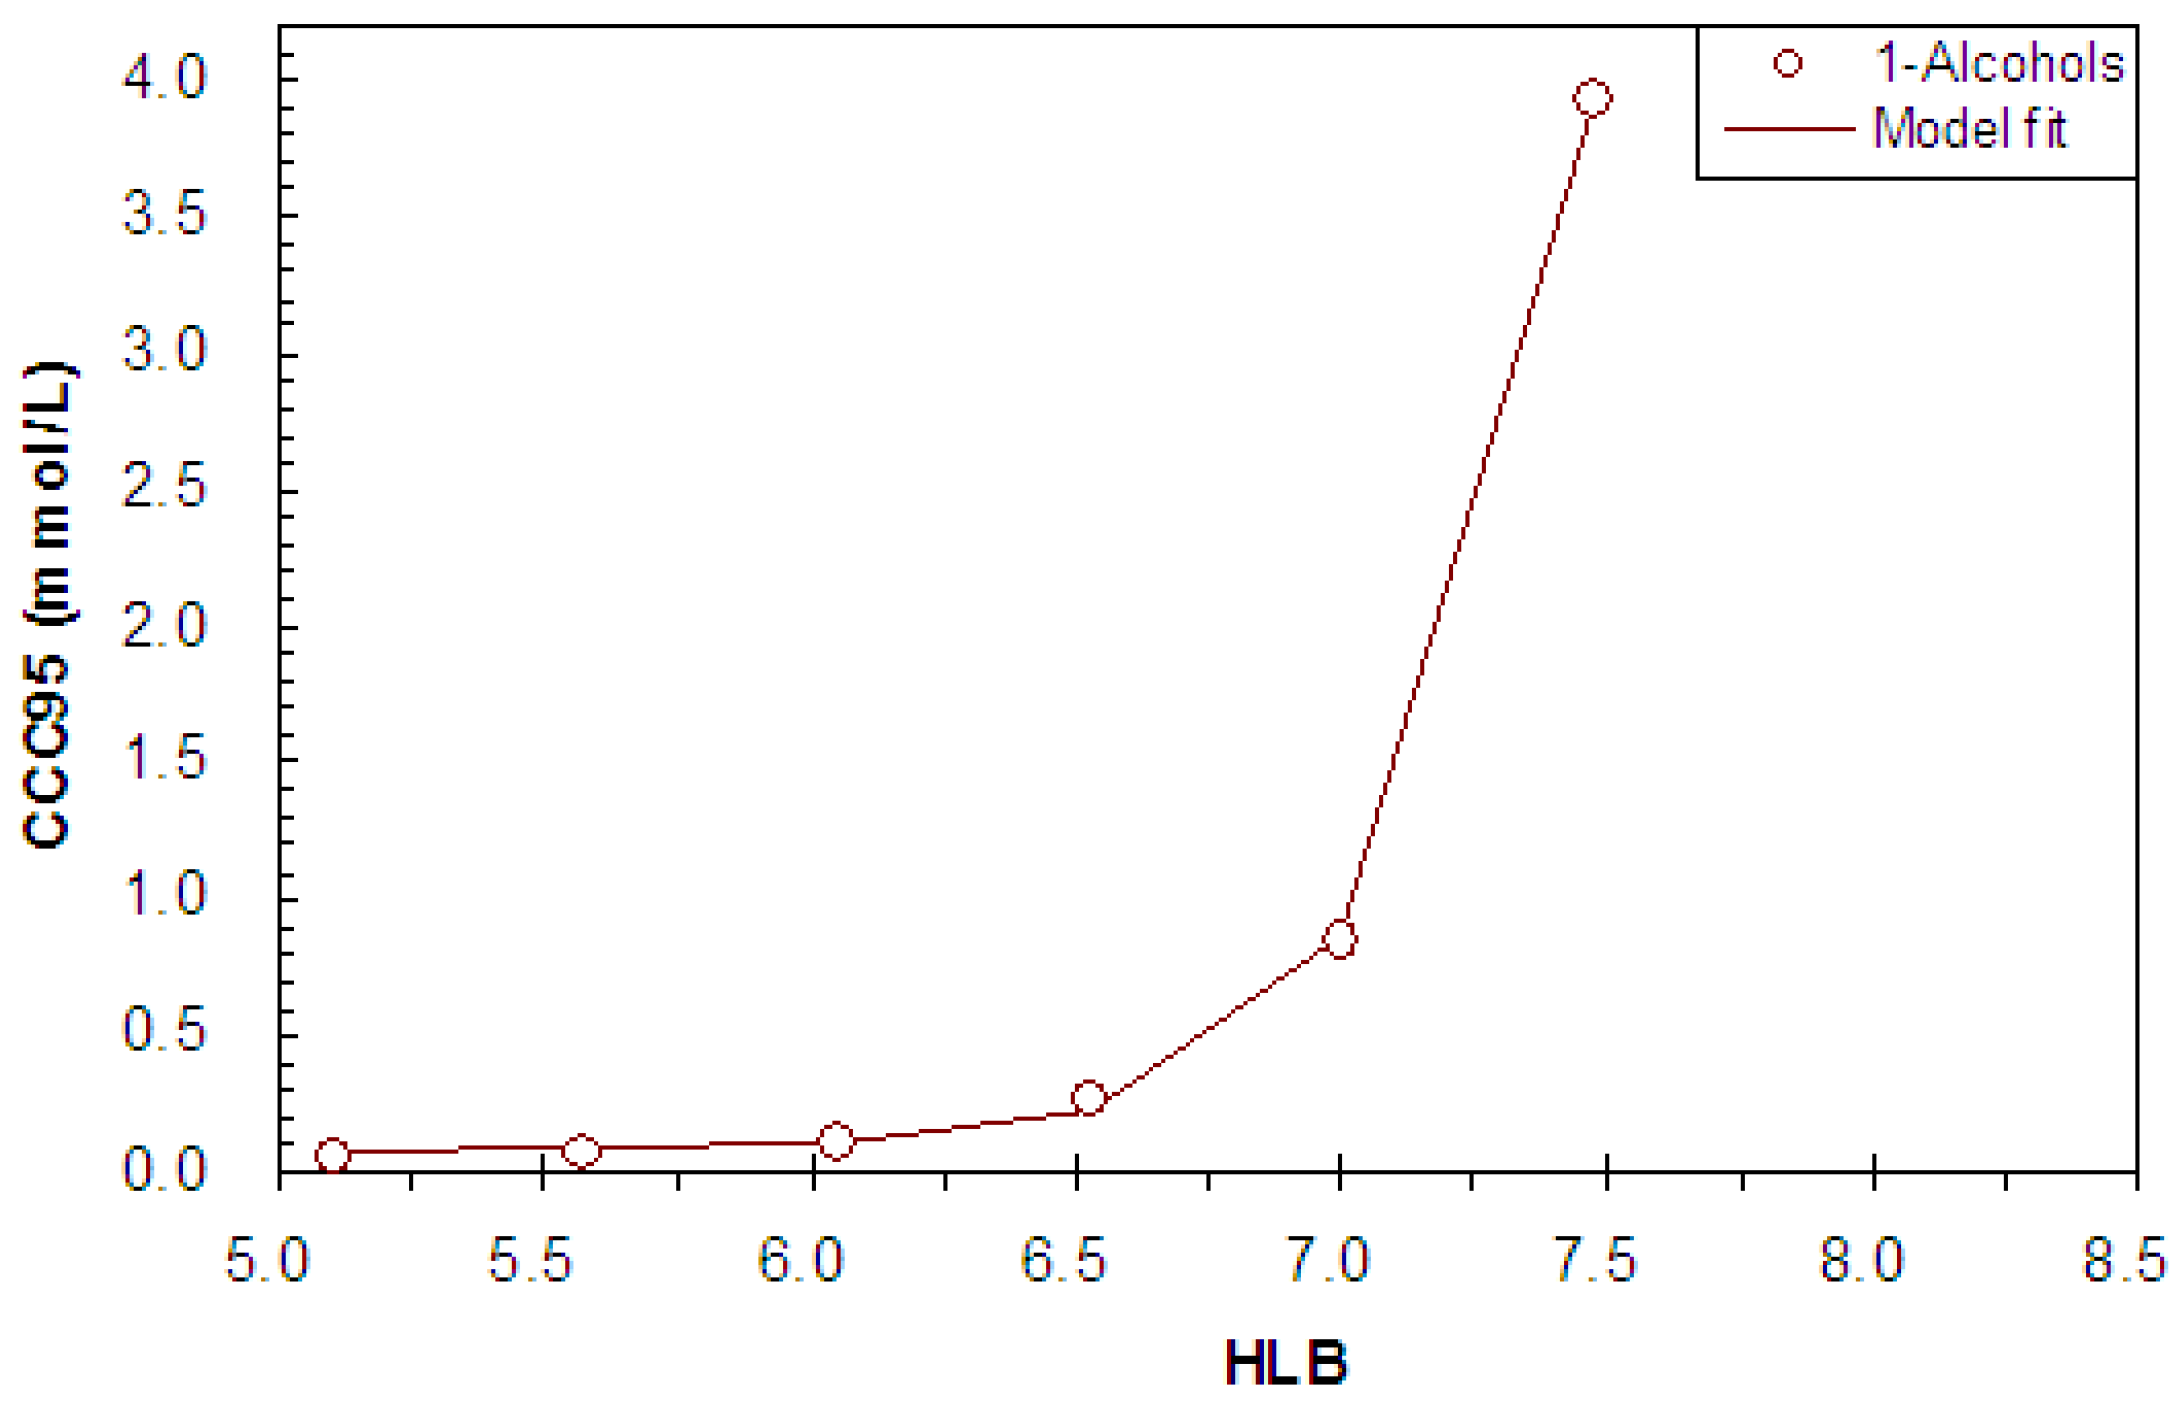
The large database permitted development of empirical models, which well describe the results for Polyglycols (Figure 11) and 1-Alcohols (Figure 12). Thus it is possible to deduce CCC95 knowing n and m, either directly via Equations (12) (Polyglycols) and (13) (1-Alcohols) or from HLB via Equation (6) and 
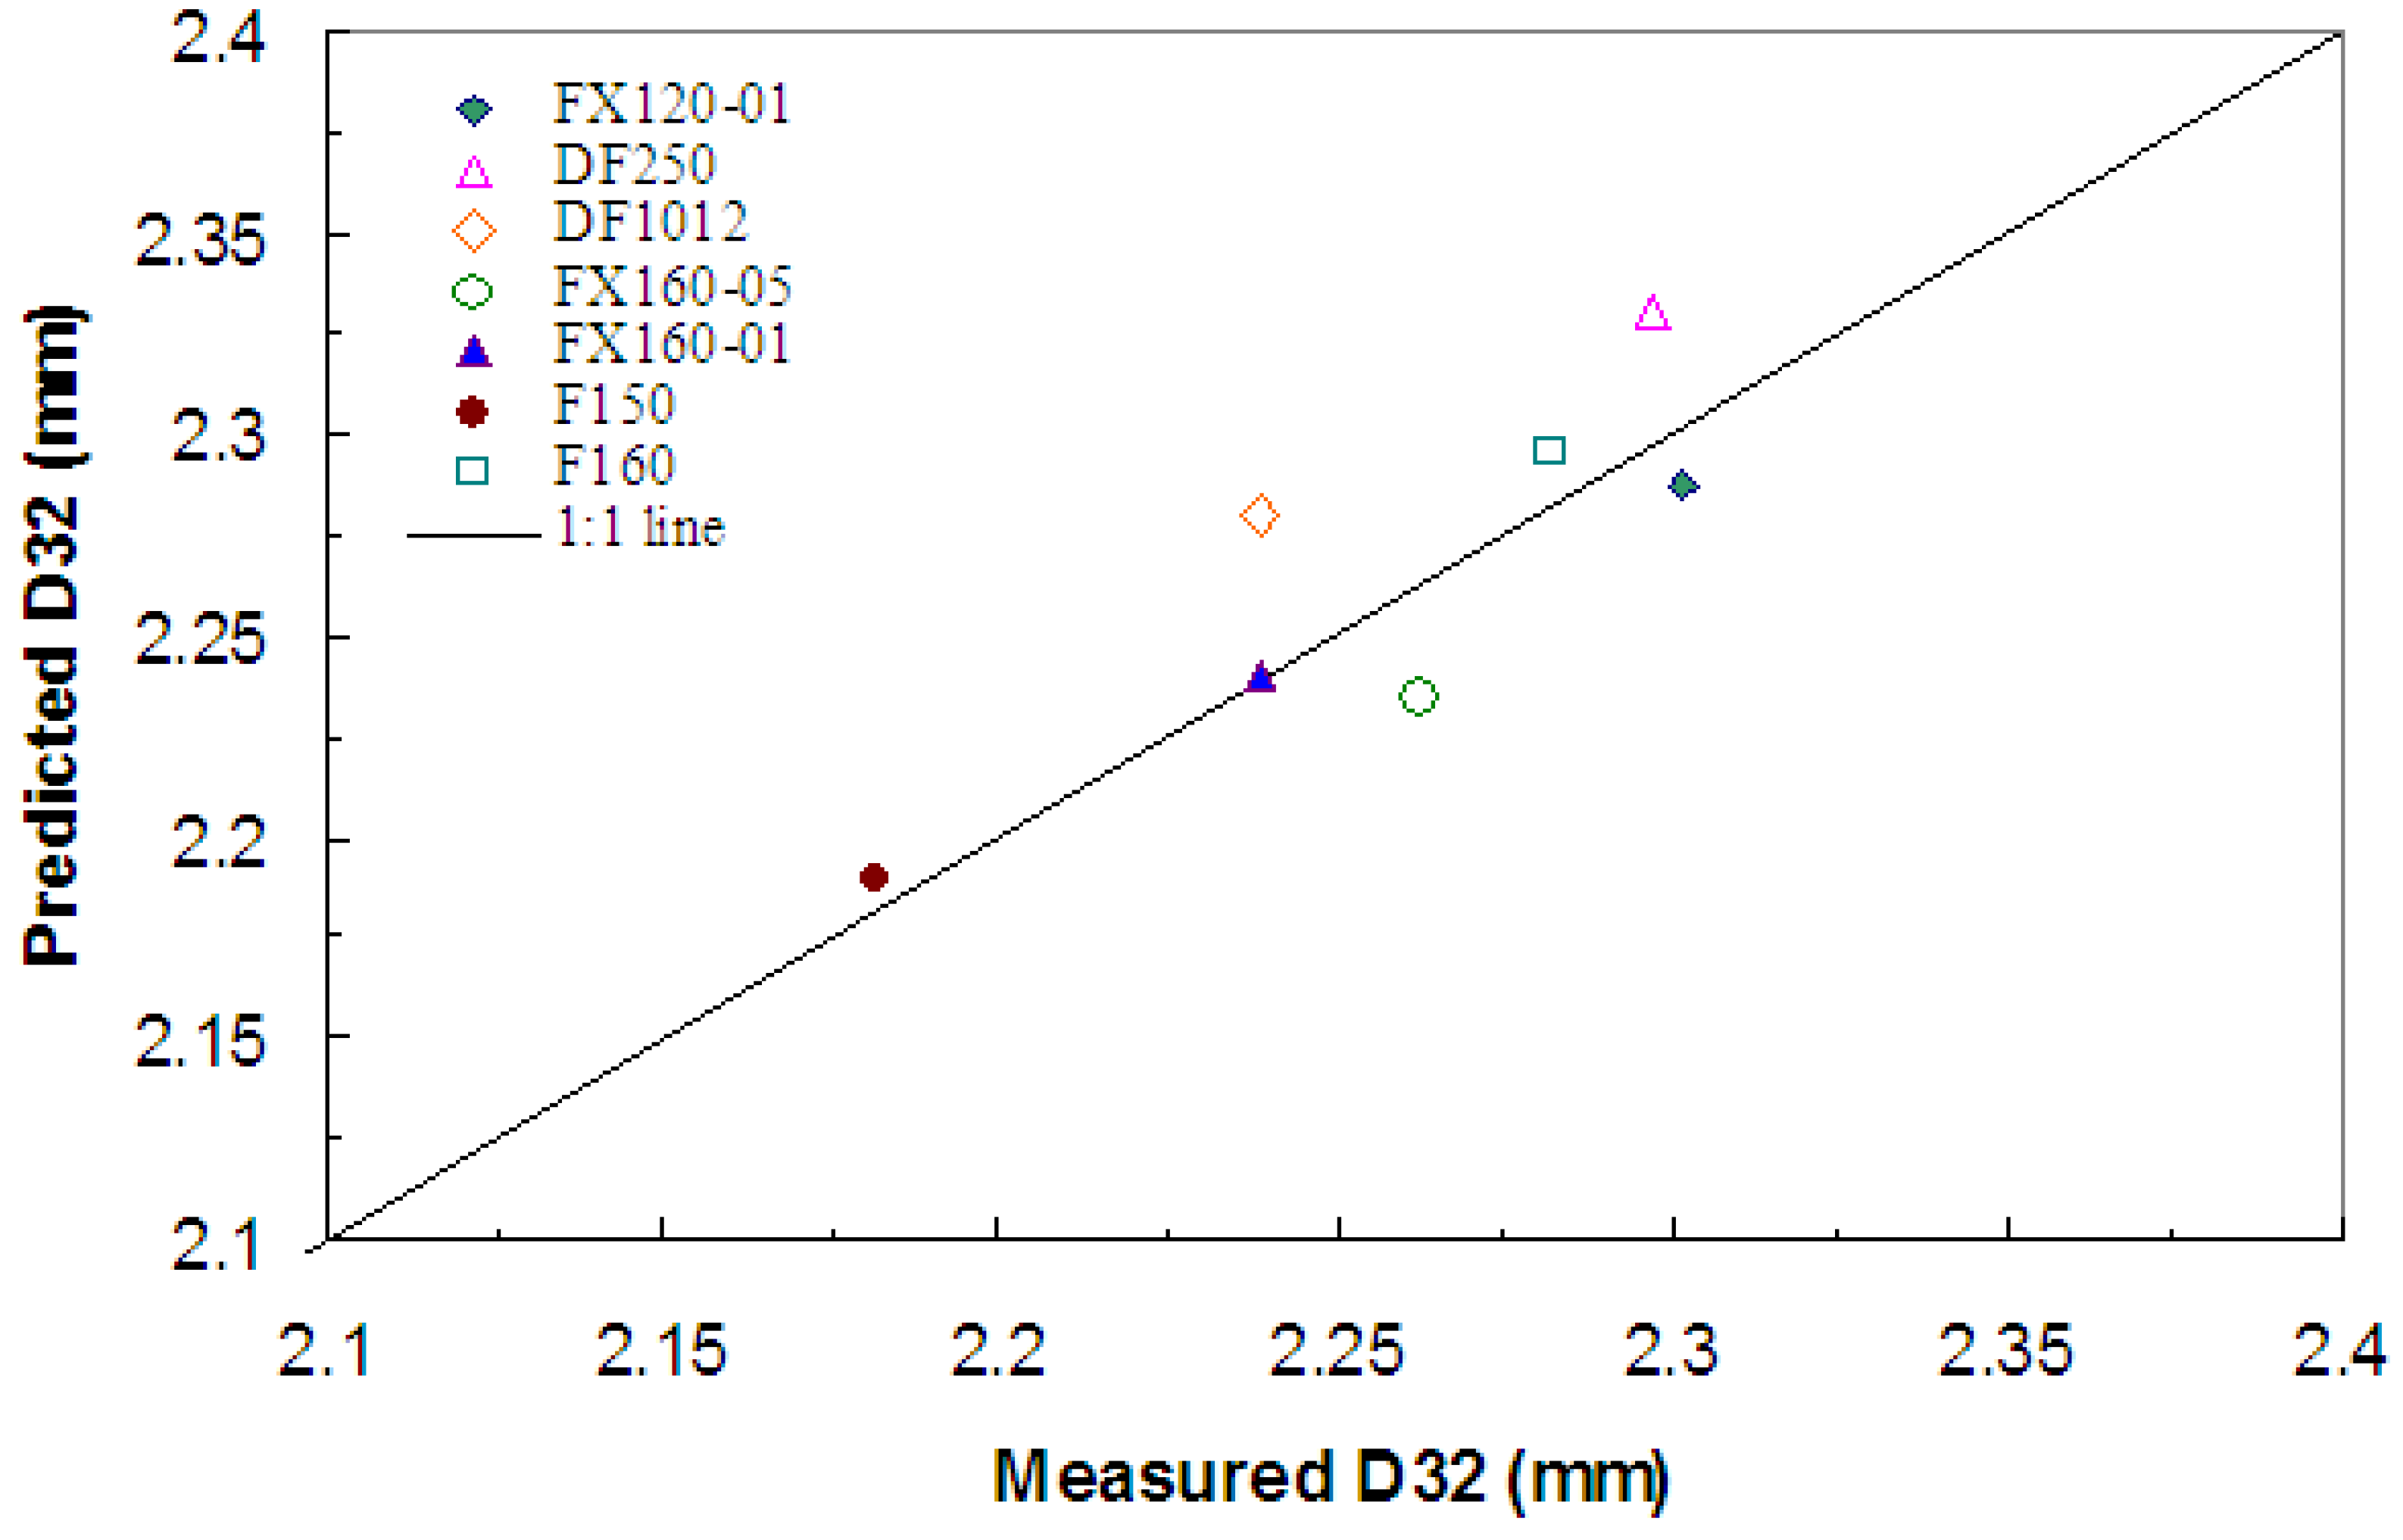
Table 5. Either approach represents a significant step towards a structure-based prediction of the impact of frother on bubble size in flotation machines which was illustrated for the commercial frothers.
At present the prediction relates directly to mechanical flotation cells. The correlations are derived for one impeller speed and one air superficial velocity, Jg. As reported by Nesset et al. [13] impeller speed over the range from 3 to 9 m/s, covering the normal operating range, has no effect on D32 and their correlation of D32 with Jg means, in principle, the predictions can be extended to other air velocities. For other flotation machines the same trends found here will most likely apply. Future work may see a relationship between CCC and machine type enabling the present results to be generalized.
In flotation practice there are reagents other than frother that could influence bubble size. Collectors in sulphide flotation probably have little effect but amines and fatty acids used in non-sulphide systems may contribute to bubble size reduction. High concentrations of some salts likewise can reduce bubble size. The most important starting point in addressing chemical control of bubble size, however, is the frother.
There are some objections to using the Davies definition of HLB and the group numbers assigned. The results for Alcohol isomers where HLB is constant show there is an effect on CCC95 as the OH position changes, especially as chain length (n) decreases. An argument can be advanced that the OH group number should reflect its position in the molecule. Likewise, the unique number for all CH groups can be questioned. With a sufficient database perhaps new empirical group numbers could be deduced that apply to prediction of CCC95. There are precedents for such modifications [28,29,30,31,32,33].
There are alternatives to HLB. We are exploring the use of nuclear magnetic resonance (NMR) spectroscopy to determine the H-ratio to substitute for HLB [34]. The NMR spectrum also provides structural information, i.e., helps identify the family which is a necessary first step in applying the correlations reported here to commercial frothers. The use of NMR will be addressed in a future paper.
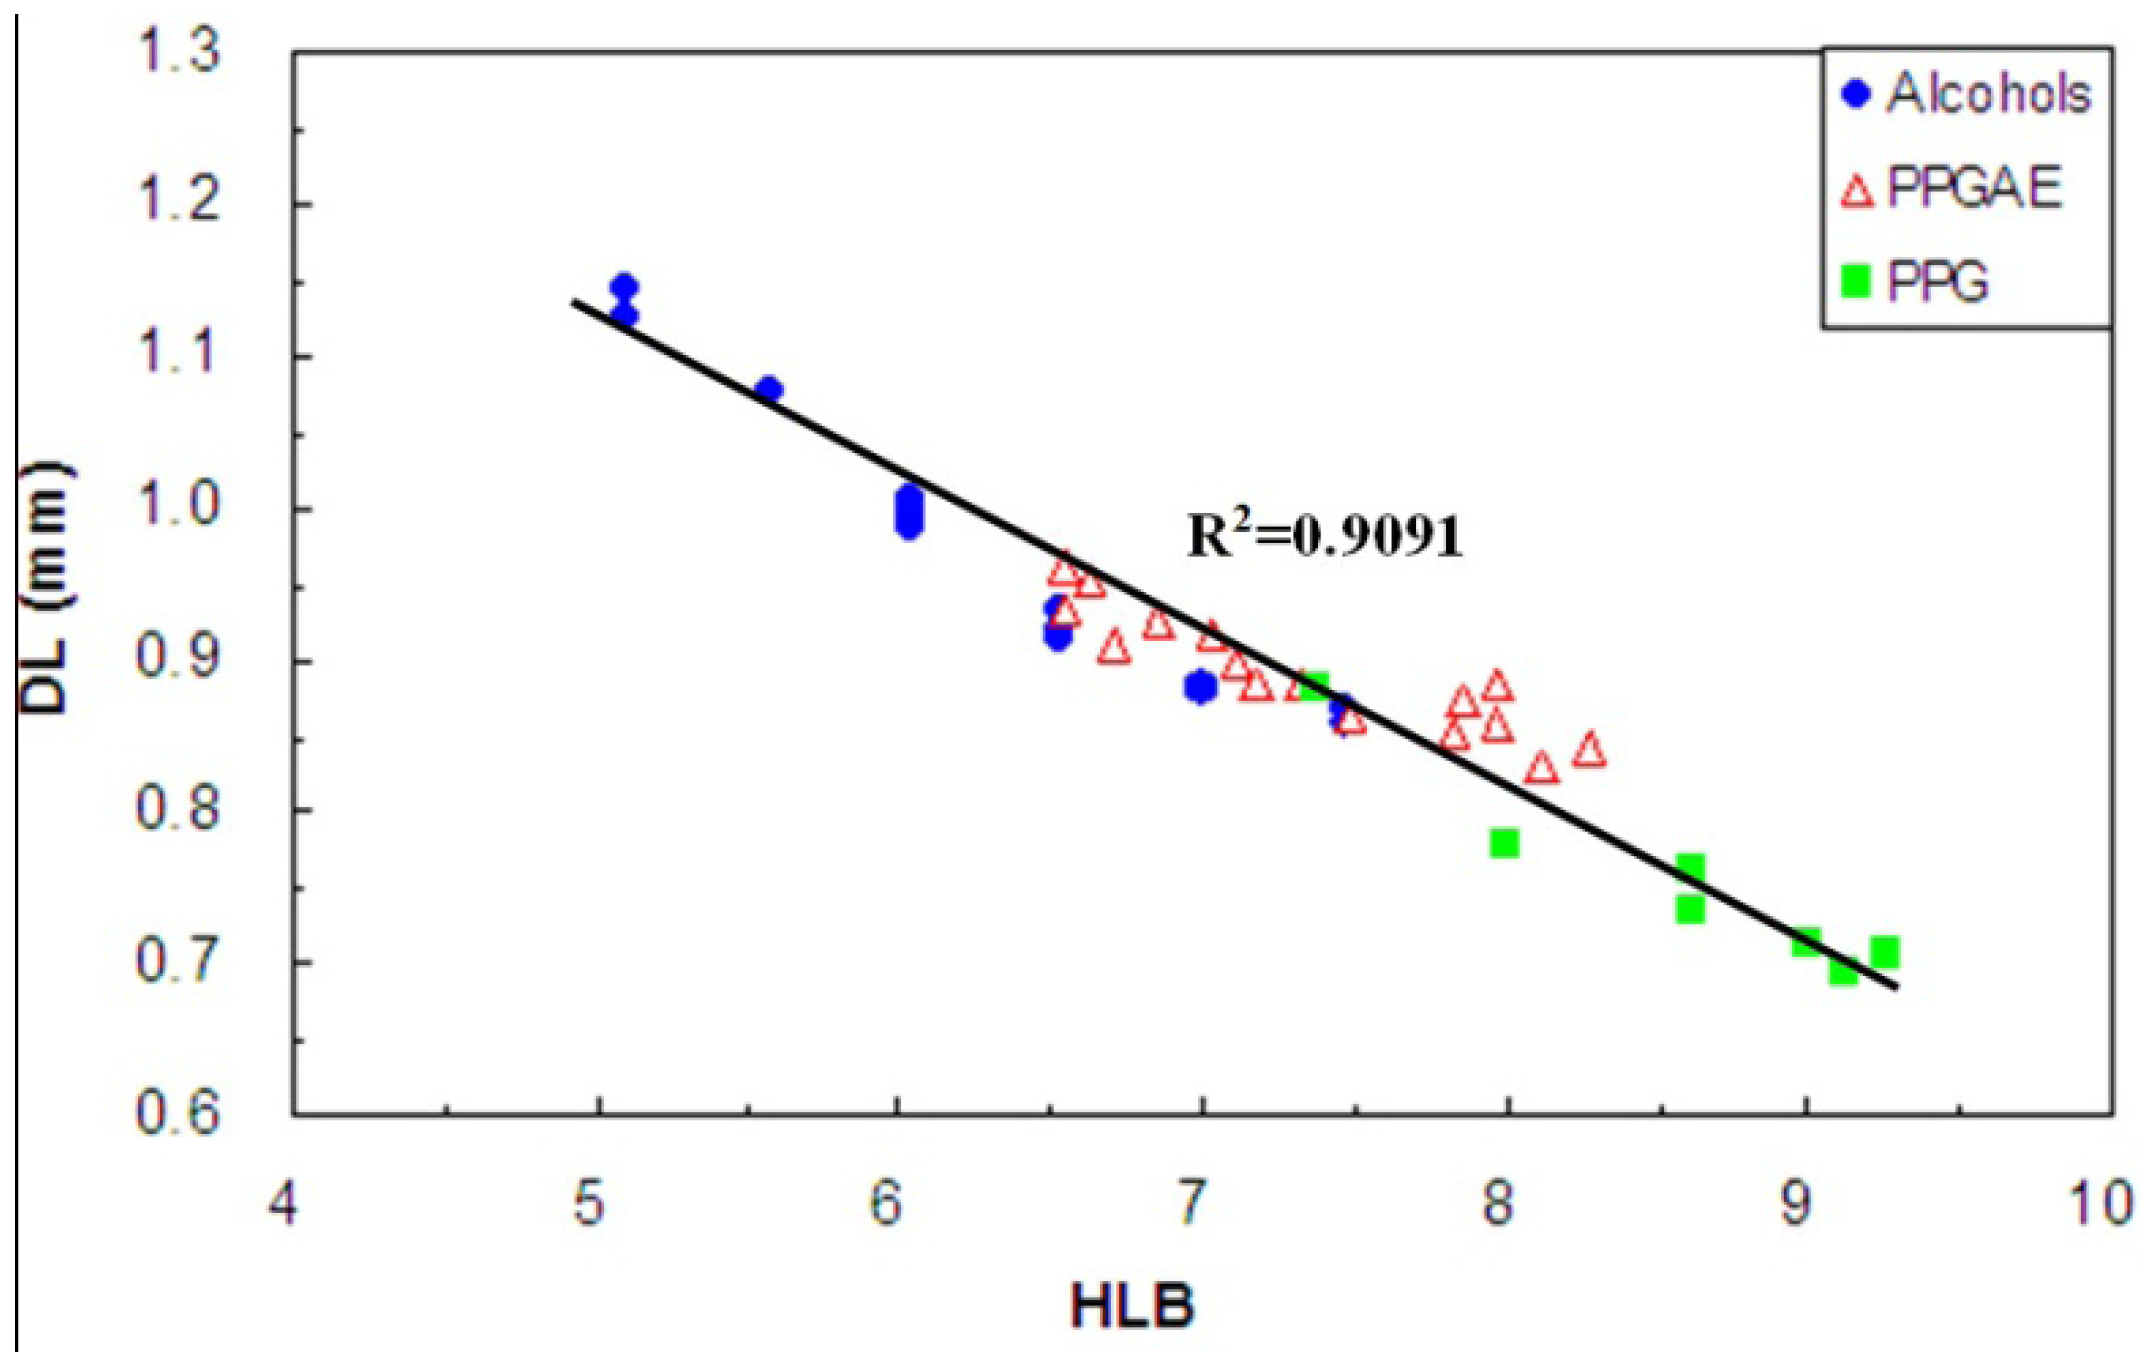
While the emphasis was CCC95 it became evident that the minimum Sauter mean bubble size (DL) is not constant but decreases as HLB increases. One consequence is that the unique trend normalized by C/CCC95 is compromised. Thus in the prediction of D32 we need to estimate the A, b values, as the example illustrated. A practical aspect of the finding is that unless there is a specific reason otherwise it is usually desirable to have the minimum bubble size in flotation to achieve maximum bubble surface area flux (Sb), and, hence, flotation kinetics. From the work here a finer minimum bubble size (DL) can be achieved by selecting a surfactant of higher HLB which may be worth considering for increasing recovery kinetics especially of fine particles. The observation also raises a fundamental question. The CCC concept implies frother is involved only in preserving the bubble size produced by the machine; i.e., the machine produces, frother preserves hypothesis [10,35]. This argument means that DL is the machine-produced Sauter mean size and might be expected to be invariant for given machine operating conditions but Figure 13 argues that frothers play some role in the initial bubble creation size. There seem to be three possibilities: bubbles produced are finer than DL and the different frothers control coalescence to a different extent to reach different DL; frother affects breakup of the air mass; or frother affects breakup of bubbles circulated through the impeller.

6. Conclusions

A structure-function approach to characterizing frothers is explored using hydrophile-lipophile balance (HLB) to represent chemical structure and critical coalescence concentration (CCC95) to represent the bubble size reduction function. The tests were conducted in a 0.8 m3 mechanical cell on 36 pure surfactants and commercial frothers of the Aliphatic Alcohol, and Polypropylene Glycol Alkyl Ether and Polypropylene Glycol (Polyglycol) families. The result was a series of self-similar CCC95-HLB trends dependent on n (number of C-atoms in alkyl group) and m (number of Propylene Oxide groups). The Alcohol data also showed an isomer effect at n < 5. Empirical models were developed for the Polyglycols and 1-Alcohols showing that CCC95 could be predicted knowing n and m, i.e., knowing the structure. Application of the model to predict Sauter mean bubble size is illustrated.

Acknowledgements

The authors thank Kinnor Chattopadhyay, Luis Calzado and Donghui Li for their assistance in the PIV experiments. The work was funded through the Chair in Mineral Processing sponsored by Vale, Teck Resources, Barrick Gold, Xstrata Process Support, Shell Canada, SGS Lakefield, COREM and Flottec, and through the Amira International P9O project, both under the NSERC (Natural Sciences and Engineering Research Council of Canada) CRD (Collaborative Research and Development) program.

References

  1. Rao, S.R.; Leja, J. Surface Chemistry of Froth Flotation, 2nd ed; Kluwer Academic Publication: New York, NY, USA, 2004. [Google Scholar]
  2. Nesset, J.E.; Finch, J.A.; Gomez, C.O. Operating variables affecting bubble size in force-air mechanical flotation machines. In Proceeding of the 9th Mill Operators Conference, Fremantle, Australia, 19-21 March 2007; pp. 55–65.
  3. Gorain, B.K.; Franzidis, J.P.; Manlapig, E.V. Studies on impeller type, impeller speed and air flow rate in an industrial scale flotation cell. Part 4: Effect of bubble surface area flux on flotation performance. Miner. Eng. 1997, 10, 367–379. [Google Scholar] [CrossRef]
  4. Gorain, B.K.; Napier-Munn, T.J.; Franzidis, J.P.; Manlapig, E.V. Studies on impeller type, impeller speed and air flow rate in an industrial scale flotation cell. Part 5: Validation of the k-Sb relationship and effect of froth depth. Miner. Eng. 1998, 11, 615–626. [Google Scholar] [CrossRef]
  5. Harris, M.C.; Runge, K.C.; Whiten, W.J.; Morrison, R.D. JKSimFloat as a practical tool for flotation process design and optimization. In Proceedings of the Mineral Processing Plant Design Practice and Control Conference, BC, Canada, 20-24 October 2002; Mular, A.L., Halbe, D.N., Barratt, D.L., Eds.; Society for Mining Metallurgy & Exploration: New York, NY, USA, 2002; pp. 461–478. [Google Scholar]
  6. Yoon, R.H. Microbubble flotation. Miner. Eng. 1993, 6, 619–630. [Google Scholar] [CrossRef]
  7. Hernandez-Aguilar, J.R.; Basi, J.; Finch, J.A. Improving column flotation operation in a copper/molybdenum separation circuit. CIM J. 2010, 1(3), 165–175. [Google Scholar]
  8. Finch, J.A.; Dobby, G.S. Column flotation—A selected review. Part 1. Int. J. Miner. Proc. 1991, 33, 343–354. [Google Scholar]
  9. Harris, C.C. Flotation machines. In Flotation, A.M. Gaudin Memorial Volume; Fuerstenau, M.C., Ed.; AM Gaudin Memorial Volume AIME: New York, NY, USA, 1976; Volume 2, pp. 753–815. [Google Scholar]
  10. Cho, Y.S.; Laskowski, J.S. Effect of flotation frothers on bubble size and foam Stability. Int. J. Miner. Process. 2002, 64(2-3), 69–80. [Google Scholar] [CrossRef]
  11. Laskowski, J.S. Fundamental properties of flotation frothers. In Proceedings of the 22nd International Mineral Processing Congress, Cape Town, South Africa, 28 September-3 October 2003; pp. 788–797.
  12. Grau, R.A.; Laskowski, J.S.; Heiskanen, K. Effect of frothers on bubble size. Int. J. Miner. Process. 2005, 76, 225–233. [Google Scholar] [CrossRef]
  13. Nesset, J.E.; Zhang, W.; Finch, J.A. A benchmarking tool for assessing flotation cell performance. In Proceedings of 2012—44th Annual Meeting of the Canadian Mineral Processors (CIM), Ottawa, Canada, 17-19 January 2012; pp. 183–209.
  14. Griffin, W.C. Classification of surface-active agents by HLB. J. Cosmet. Chem. 1949, 1, 311–326. [Google Scholar]
  15. Davies, J.T. De door Davies toegekende HLB-groepswaarden zijn gebaseerd op een klein aantal experimenteel bepaalde HLB-waarden en daardoor beperkt toepasbaar. Het feit dat de groepswaarden toch veelvuldig gebruikt worden,wijst op een duidelijke behoefte om emulsiesl.abili telt te kunnen vooi—Spellen op basis van de chemische structuur van de emulgator. In. In Proceeding of 2nd International Congress on Surface Activity, London, UK, 1957; 1, p. 426.
  16. Mittal, K.L.; Lindman, B. Surfactants in Solution; Plenum Press: New York, NY, USA, 1984; Volume 3, p. 1925. [Google Scholar]
  17. Proverbio, Z.E.; Bardavid, S.M.; Arancibia, E.L.; Schulz, P.C. Hydrophile-lipophile balance and solubility parameter of cationic surfactants. Colloid. Surface. A 2003, 214, 167–171. [Google Scholar] [CrossRef]
  18. Wu, J.Y.; Xu, Y.M.; Dabros, T.; Hamza, H. Development of a method for measurement of relative solubility of nonionic surfactants. Colloid. Surface. A 2004, 232, 229–137. [Google Scholar] [CrossRef]
  19. Davies, J.T.; Rideal, E.K. Interfacial Phenomena; Academic Press: New York, NY, USA, 1961; p. 371. [Google Scholar]
  20. Tanaka, K.; Igarashi, A. Determination of nonionic surfactants. In Handbook of Detergents Part C: Analysis; Waldhoff, H., Spilker, R., Eds.; CRC Press: Boca Raton, FL, USA, 2005; pp. 149–214. [Google Scholar]
  21. Pugh, R.J. The physics and chemistry of frothers. In Froth Flotation:A Century of Innovation; Fuerstenau, M.C., Jameson, G., Yoon, R.H., Eds.; SME: Englewood, CO, USA, 2007; pp. 259–281. [Google Scholar]
  22. Hernandez-Aguilar, J.R.; Gomez, C.O.; Finch, J.A. A technique for the direct measurement of bubble size distribution in industrial flotation cells. In Proceedings of 2002—34th Annual Meeting of the Canadian Mineral Processors (CIM), Ottawa, Canada, 22-24 January 2002; pp. 389–402.
  23. Gomez, C.O.; Finch, J.A. Gas dispersion measurements in flotation cells. Int. J. Miner. Process. 2007, 84, 51–58. [Google Scholar] [CrossRef]
  24. Zhang, W.; Kolahdoozan, M.; Nesset, J.E.; Finch, J.A. Use of frother with sampling-for-imaging bubble sizing technique. Miner. Eng. 2009, 22, 513–515. [Google Scholar] [CrossRef]
  25. Grau, R.A.; Laskowski, J.S. Role of frothers in bubble generation and coalescence in a mechanical flotation cell. Can. J. Chem. Eng. 2006, 84, 170–182. [Google Scholar]
  26. Keitel, G.; Onken, U. Inhibition of bubble coalescence by solutes in air/water dispersions. Chem. Eng. Sci. 1982, 37, 1635–1638. [Google Scholar] [CrossRef]
  27. Drogaris, G.; Weiland, P. Coalescence behaviour of gas bubbles in aqueous solutions of n-alcohols and fatty acids. Chem. Eng. Sci. 1983, 38, 1501–1506. [Google Scholar] [CrossRef]
  28. Lin, I.J.; Somasundaran, P. Free energy changes on transfer of surface active agents between various colloidal and interfacial states. J.Colloid Interface Sci. 1971, 37, 731–743. [Google Scholar] [CrossRef]
  29. Lin, I.J.; Friend, J.P.; Zimmels, Y. The effect of structural modification on the hydrophile-lipophile balance of ionic surfactants. J. Colloid Interface Sci. 1973, 45, 378–385. [Google Scholar] [CrossRef]
  30. Lin, I.J.; Marszall, L. CMC, HLB, and effective chain length of surface-active anionic and cationic substances containing oxyethylene groups. J. Colloid Interface Sci. 1976, 57, 85–93. [Google Scholar] [CrossRef]
  31. Lin, I.J. Colloid and Interface Science; Kevker, M., Ed.; Academic Press: New York, NY, USA, 1976; Volume 2, p. 431. [Google Scholar]
  32. McGowan, J.C. A new approach for the calculation of hydrophile-lipophile balance values of surfactants. Tenside Surfactants Deterg. 1990, 27, 229–230. [Google Scholar]
  33. Sowada, R.; McGowan, J.C. Calculation of Hydrophile-lipophile Balance (HLB) group number for some structural units of emulsifying agents. Tenside Surfactants Deterg. 1992, 29, 109–113. [Google Scholar]
  34. Berguerio, J.R.; Bao, M.; Casares, J.J. Determination of HLB of non-ionic dispersants by NMR. Anal. Quim. 1978, 74, 529–530. [Google Scholar]
  35. Gomez, C.O.; Finch, J.A. Gas dispersion measurements in flotation machines. CIM Bull. 2002, 95(1066), 73–78. [Google Scholar]

