3.1. Flow Details for Db = 0.5 mm
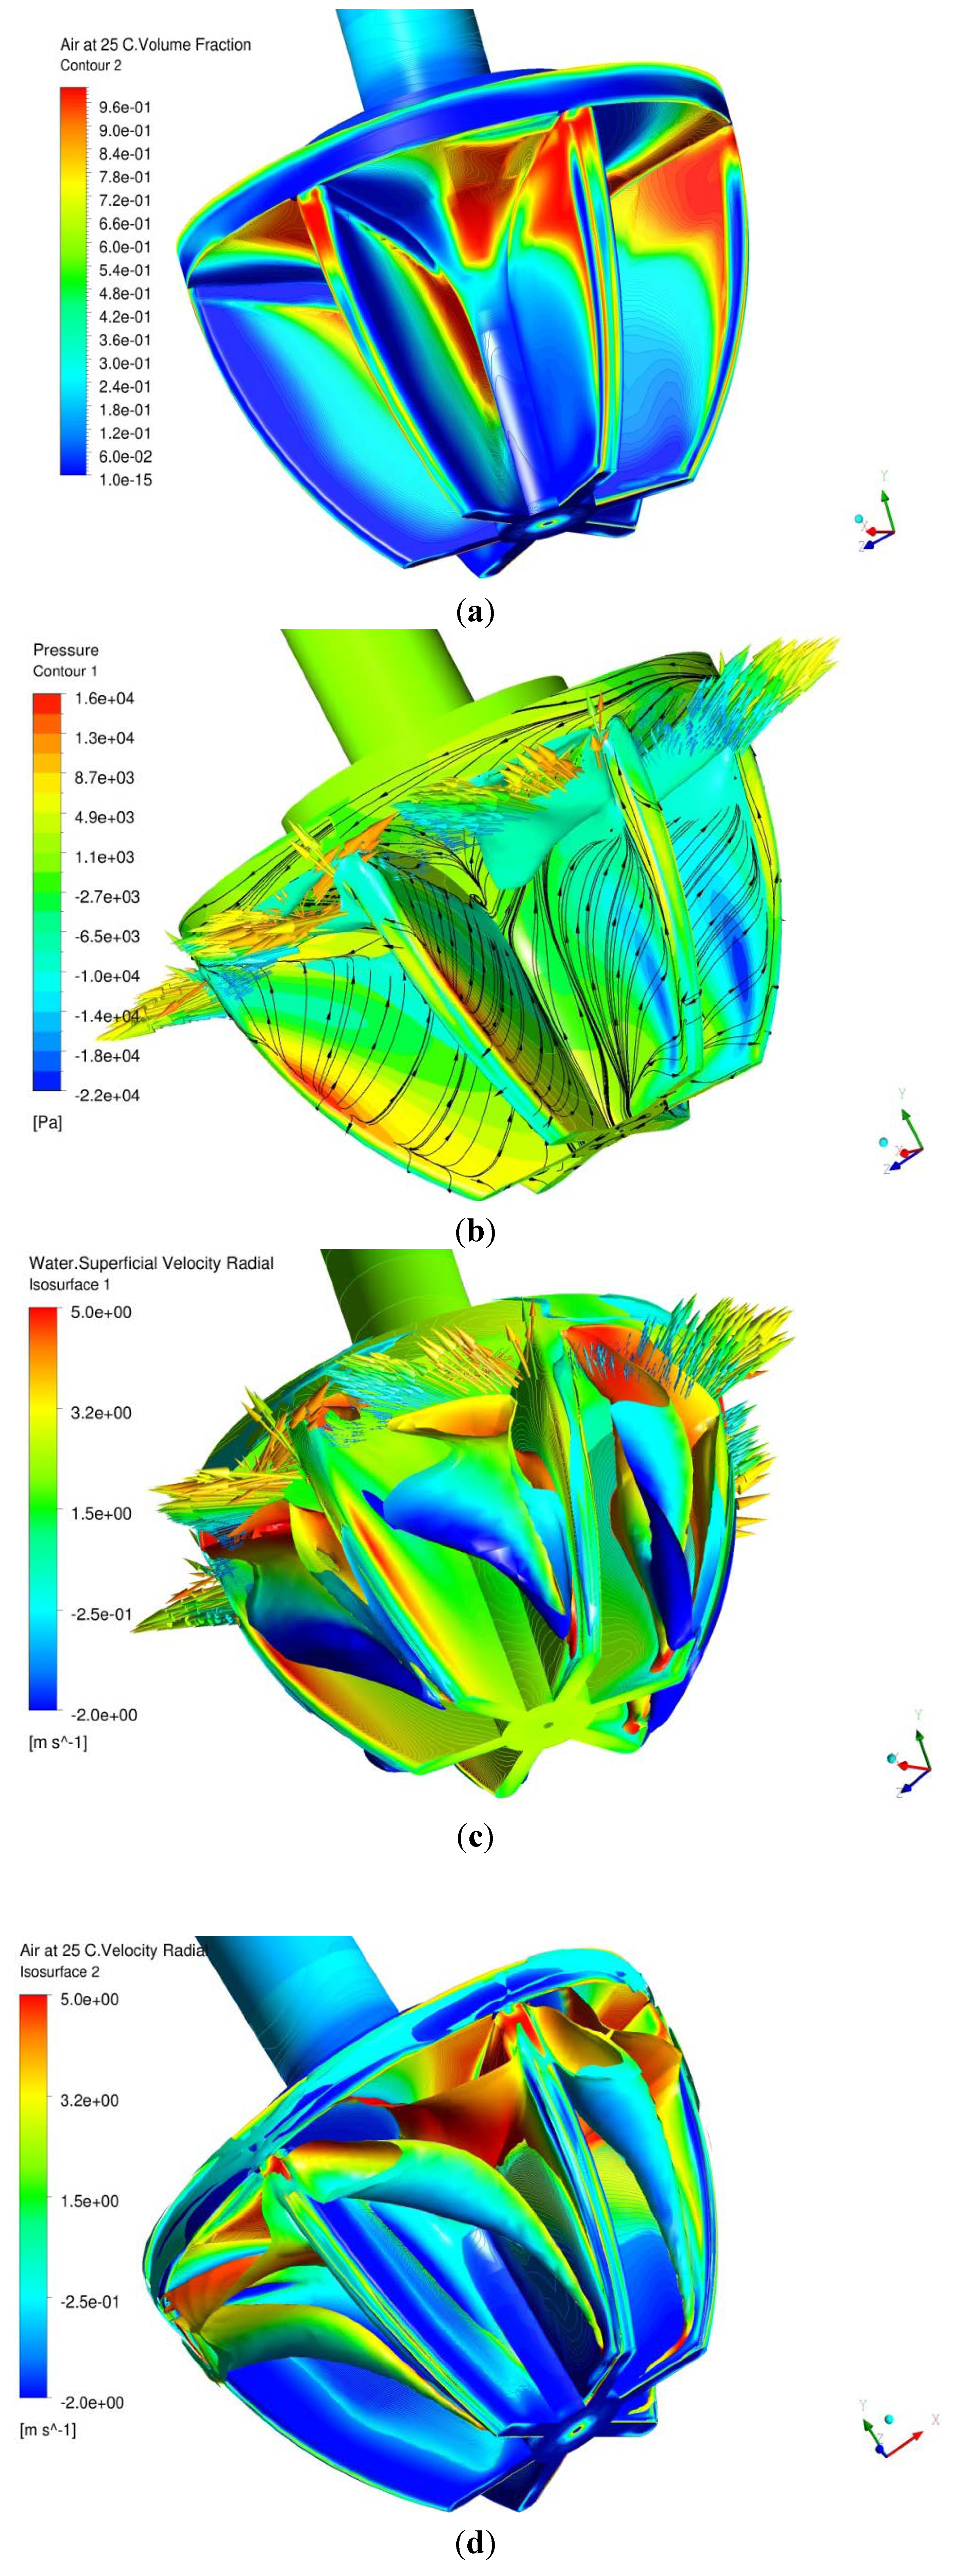
The results for the case of bubble diameter of 0.5 mm will be presented in more details here. The effects of bubble diameter will be briefly discussed. Contours of air volume fraction (α) on the rotor surface are depicted in
Figure 3a. Upon exiting the injection slots, air adheres to the rotor top plate and drifts towards the suction sides (these are the receding faces) of the rotor blades. Air exits the rotor mainly from corners at the intersections of the suction sides of the blade with the ceiling of rotor. The major part of pressure sides (advancing surfaces) is wetted with water. Shown in
Figure 3b are pressure (
P) contours (flooded contours) and friction lines (black lines) that give the direction of water velocity (relative to the rotor) very close to the rotor surface. Friction lines show attachment line in the region of high pressure near the leading edges of the blades.
Water flows inward on the pressure sides and outward on the suction sides, which implies the presence of passage vortices. Relative superficial air velocity vectors at the rotor exit are concentrated near the rotor top and mainly near the suction sides. These vectors are colored by the local air volume fraction. Also shown in the figure is an iso-surface of air volume fraction equal to (α = 0.6). Iso-surface of water relative velocity magnitude (
Vwr) of 5.0 m/s is shown in
Figure 3c. The iso-surface is colored by the water radial velocity component. The negative radial velocity (blue color) indicates that water enters rotor passages through the lower two thirds of rotor and exits through the upper one third with maximum outward radial velocity near the end plate. Also shown in the figure are air relative velocity vectors, which are colored by the air volume fraction. An air jet exits the rotor passage near the upper corner, above and somewhat segregated from the water jet. An iso-surface of air volume fraction of (α = 0.1) is used to show the passage vortices, which are shown in
Figure 3d. The iso-surface is colored by air radial velocity. The blue color on bottom (negative radial velocity) and the red color on top (positive radial velocity) clearly indicate the presence of a vortex.
The vortex is floated on the suction side of the blade and exits the rotor near the upper corner of the pressure side. The vortex is made visible by air bubbles trapped in the vortex core. In addition, as air is injected into the rotor it is squeezed by the water flow towards the rotor end wall.
Figure 3.
(a) Air volume fraction (α) on rotor surface; (b) pressure (P) contours on rotor surface; (c) iso-surface of water superficial relative velocity (Vwr = 5.0 m/s); and (d) iso-surface of air volume fraction (α = 0.1) showing rotor passage vortices.
Figure 3.
(a) Air volume fraction (α) on rotor surface; (b) pressure (P) contours on rotor surface; (c) iso-surface of water superficial relative velocity (Vwr = 5.0 m/s); and (d) iso-surface of air volume fraction (α = 0.1) showing rotor passage vortices.
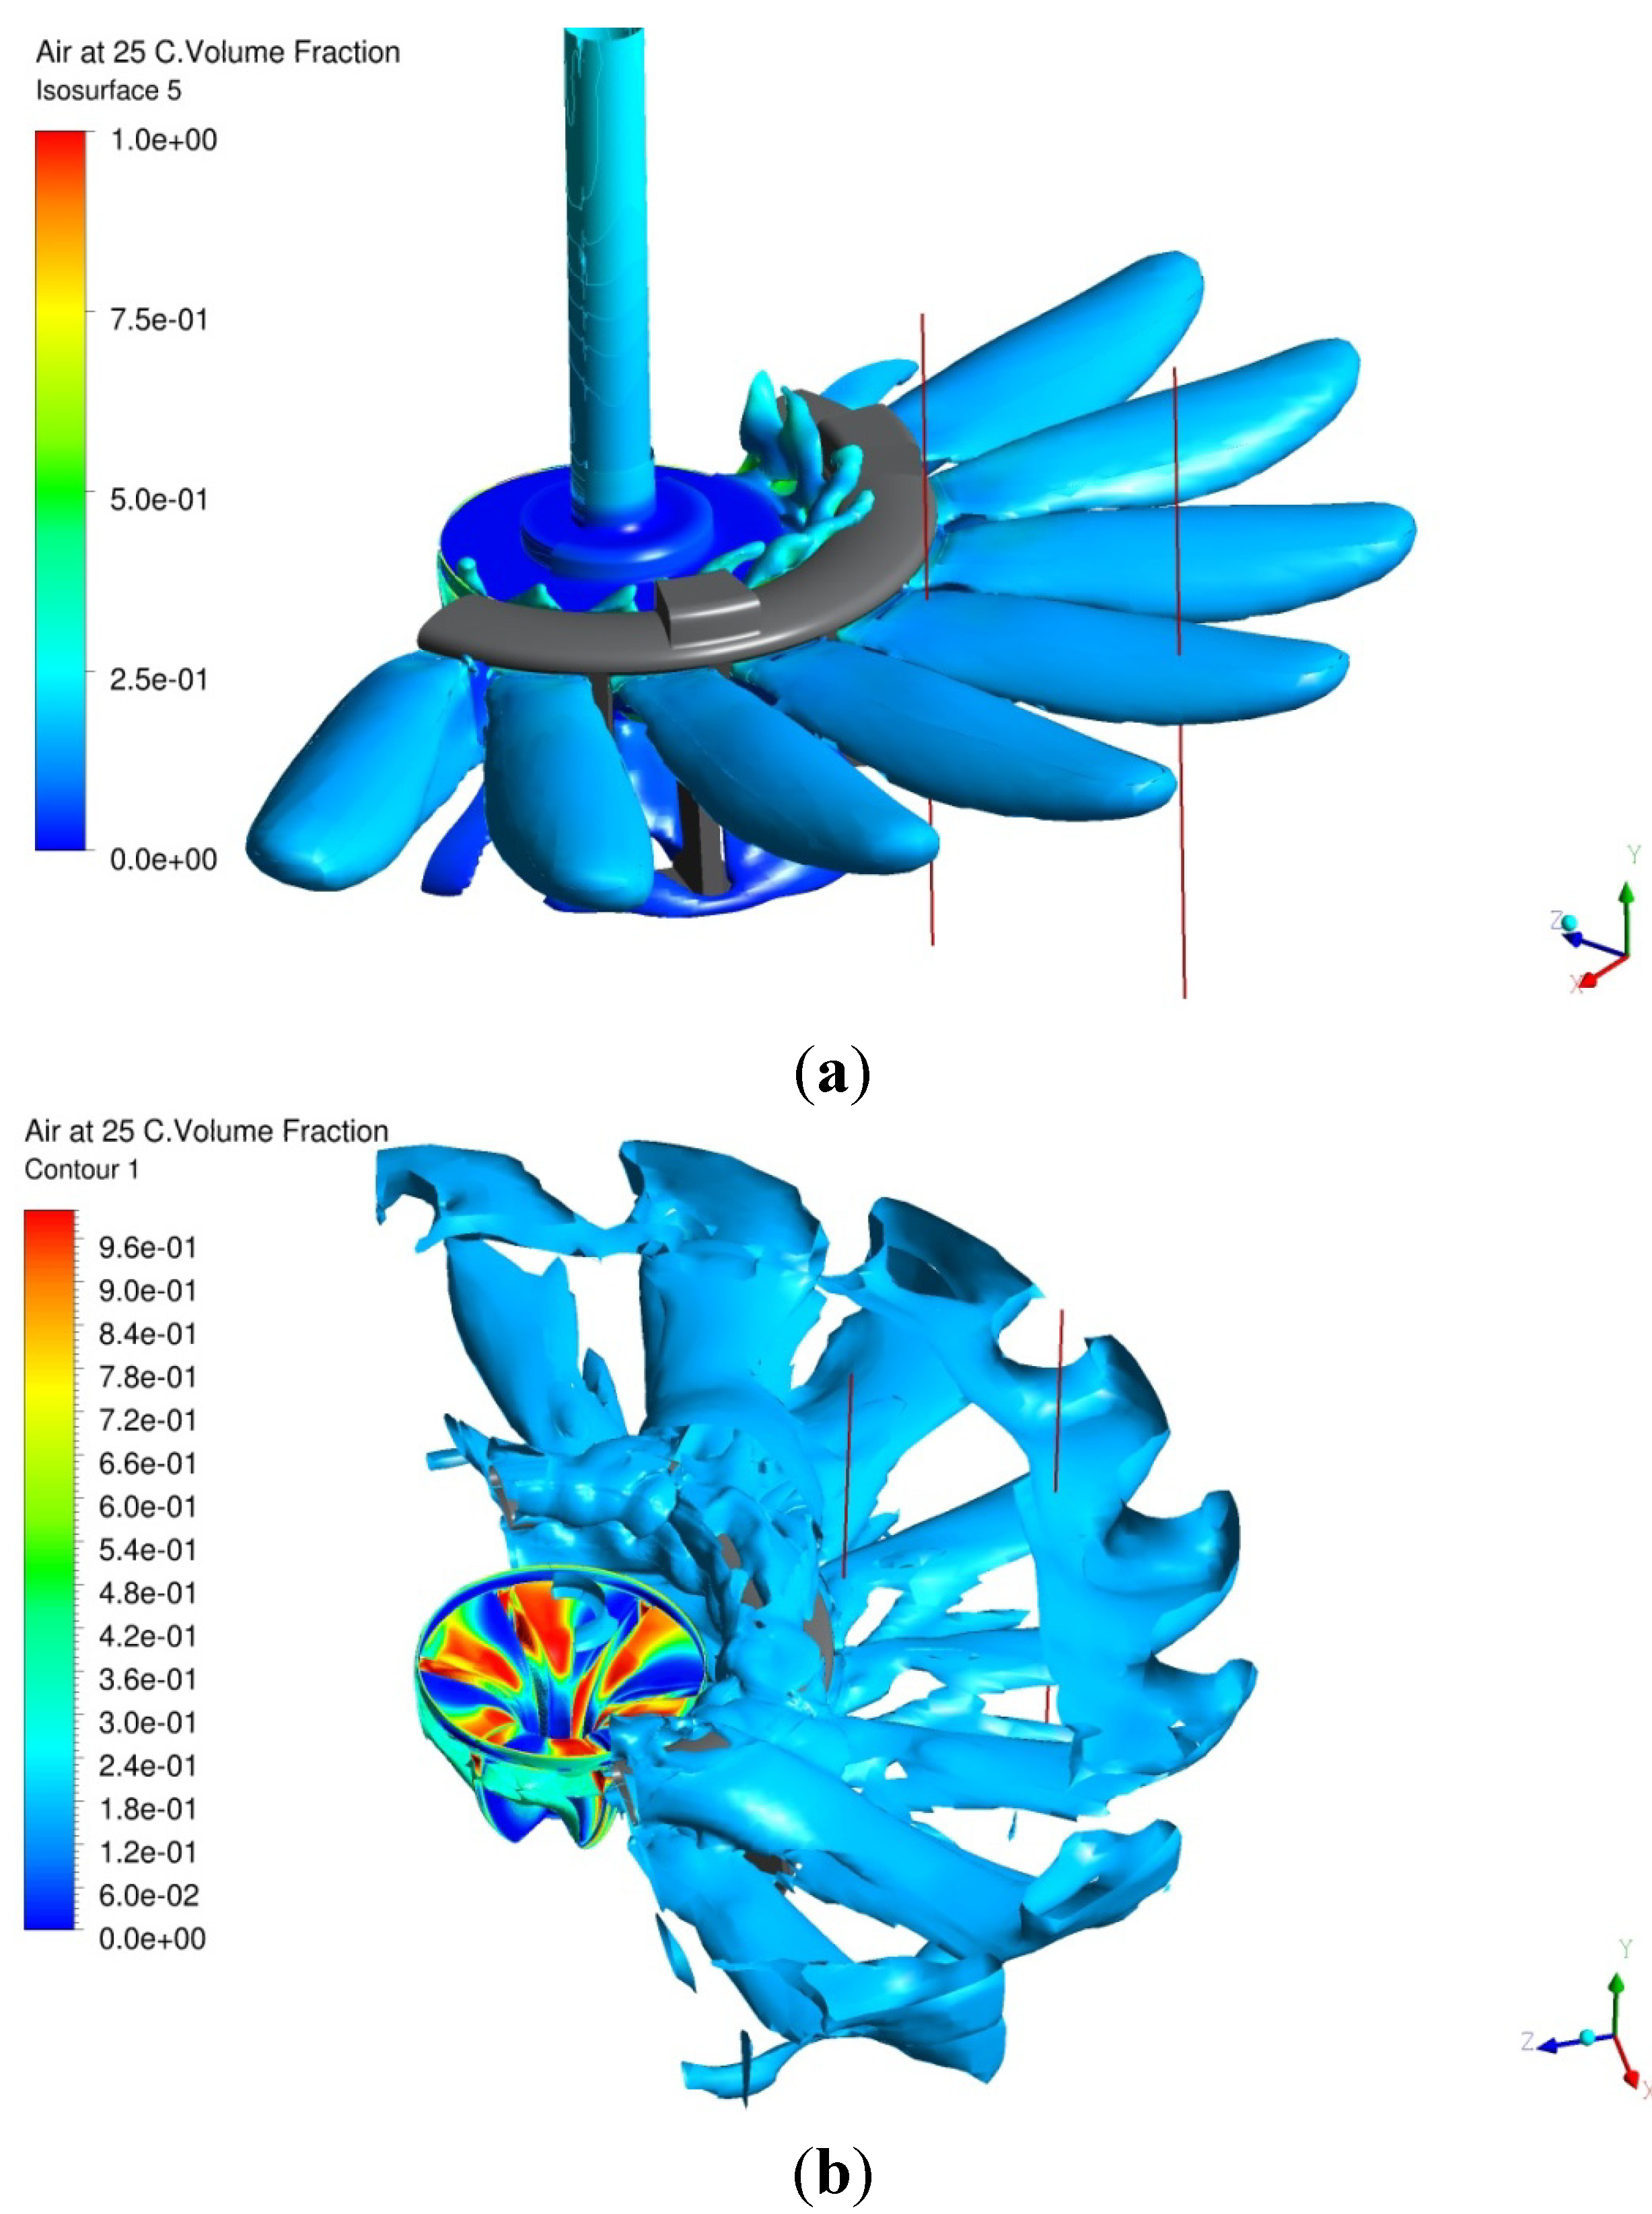
Next, we discuss the flow characteristics downstream of the stator blades. The flow exits the upper third of the rotor as six pulsating jets with strong radial and circumferential velocity components. The six jets impinge on the sixteen-blade stator and emerge from the stator as sixteen radial jets. The jet locations relative to stator are shown in
Figure 4a by water superficial velocity (
Vw) iso-surface of 0.92 m/s, which is colored by air volume fraction. As the flow exits the rotor and impinges on stator blades leading edges, a small fraction of it splashes over the ring carrying some of the high air volume fraction above the ring as indicated by the color of the small eight tongs between rotor and stator. The major part of flow, however, goes below the stator ring.
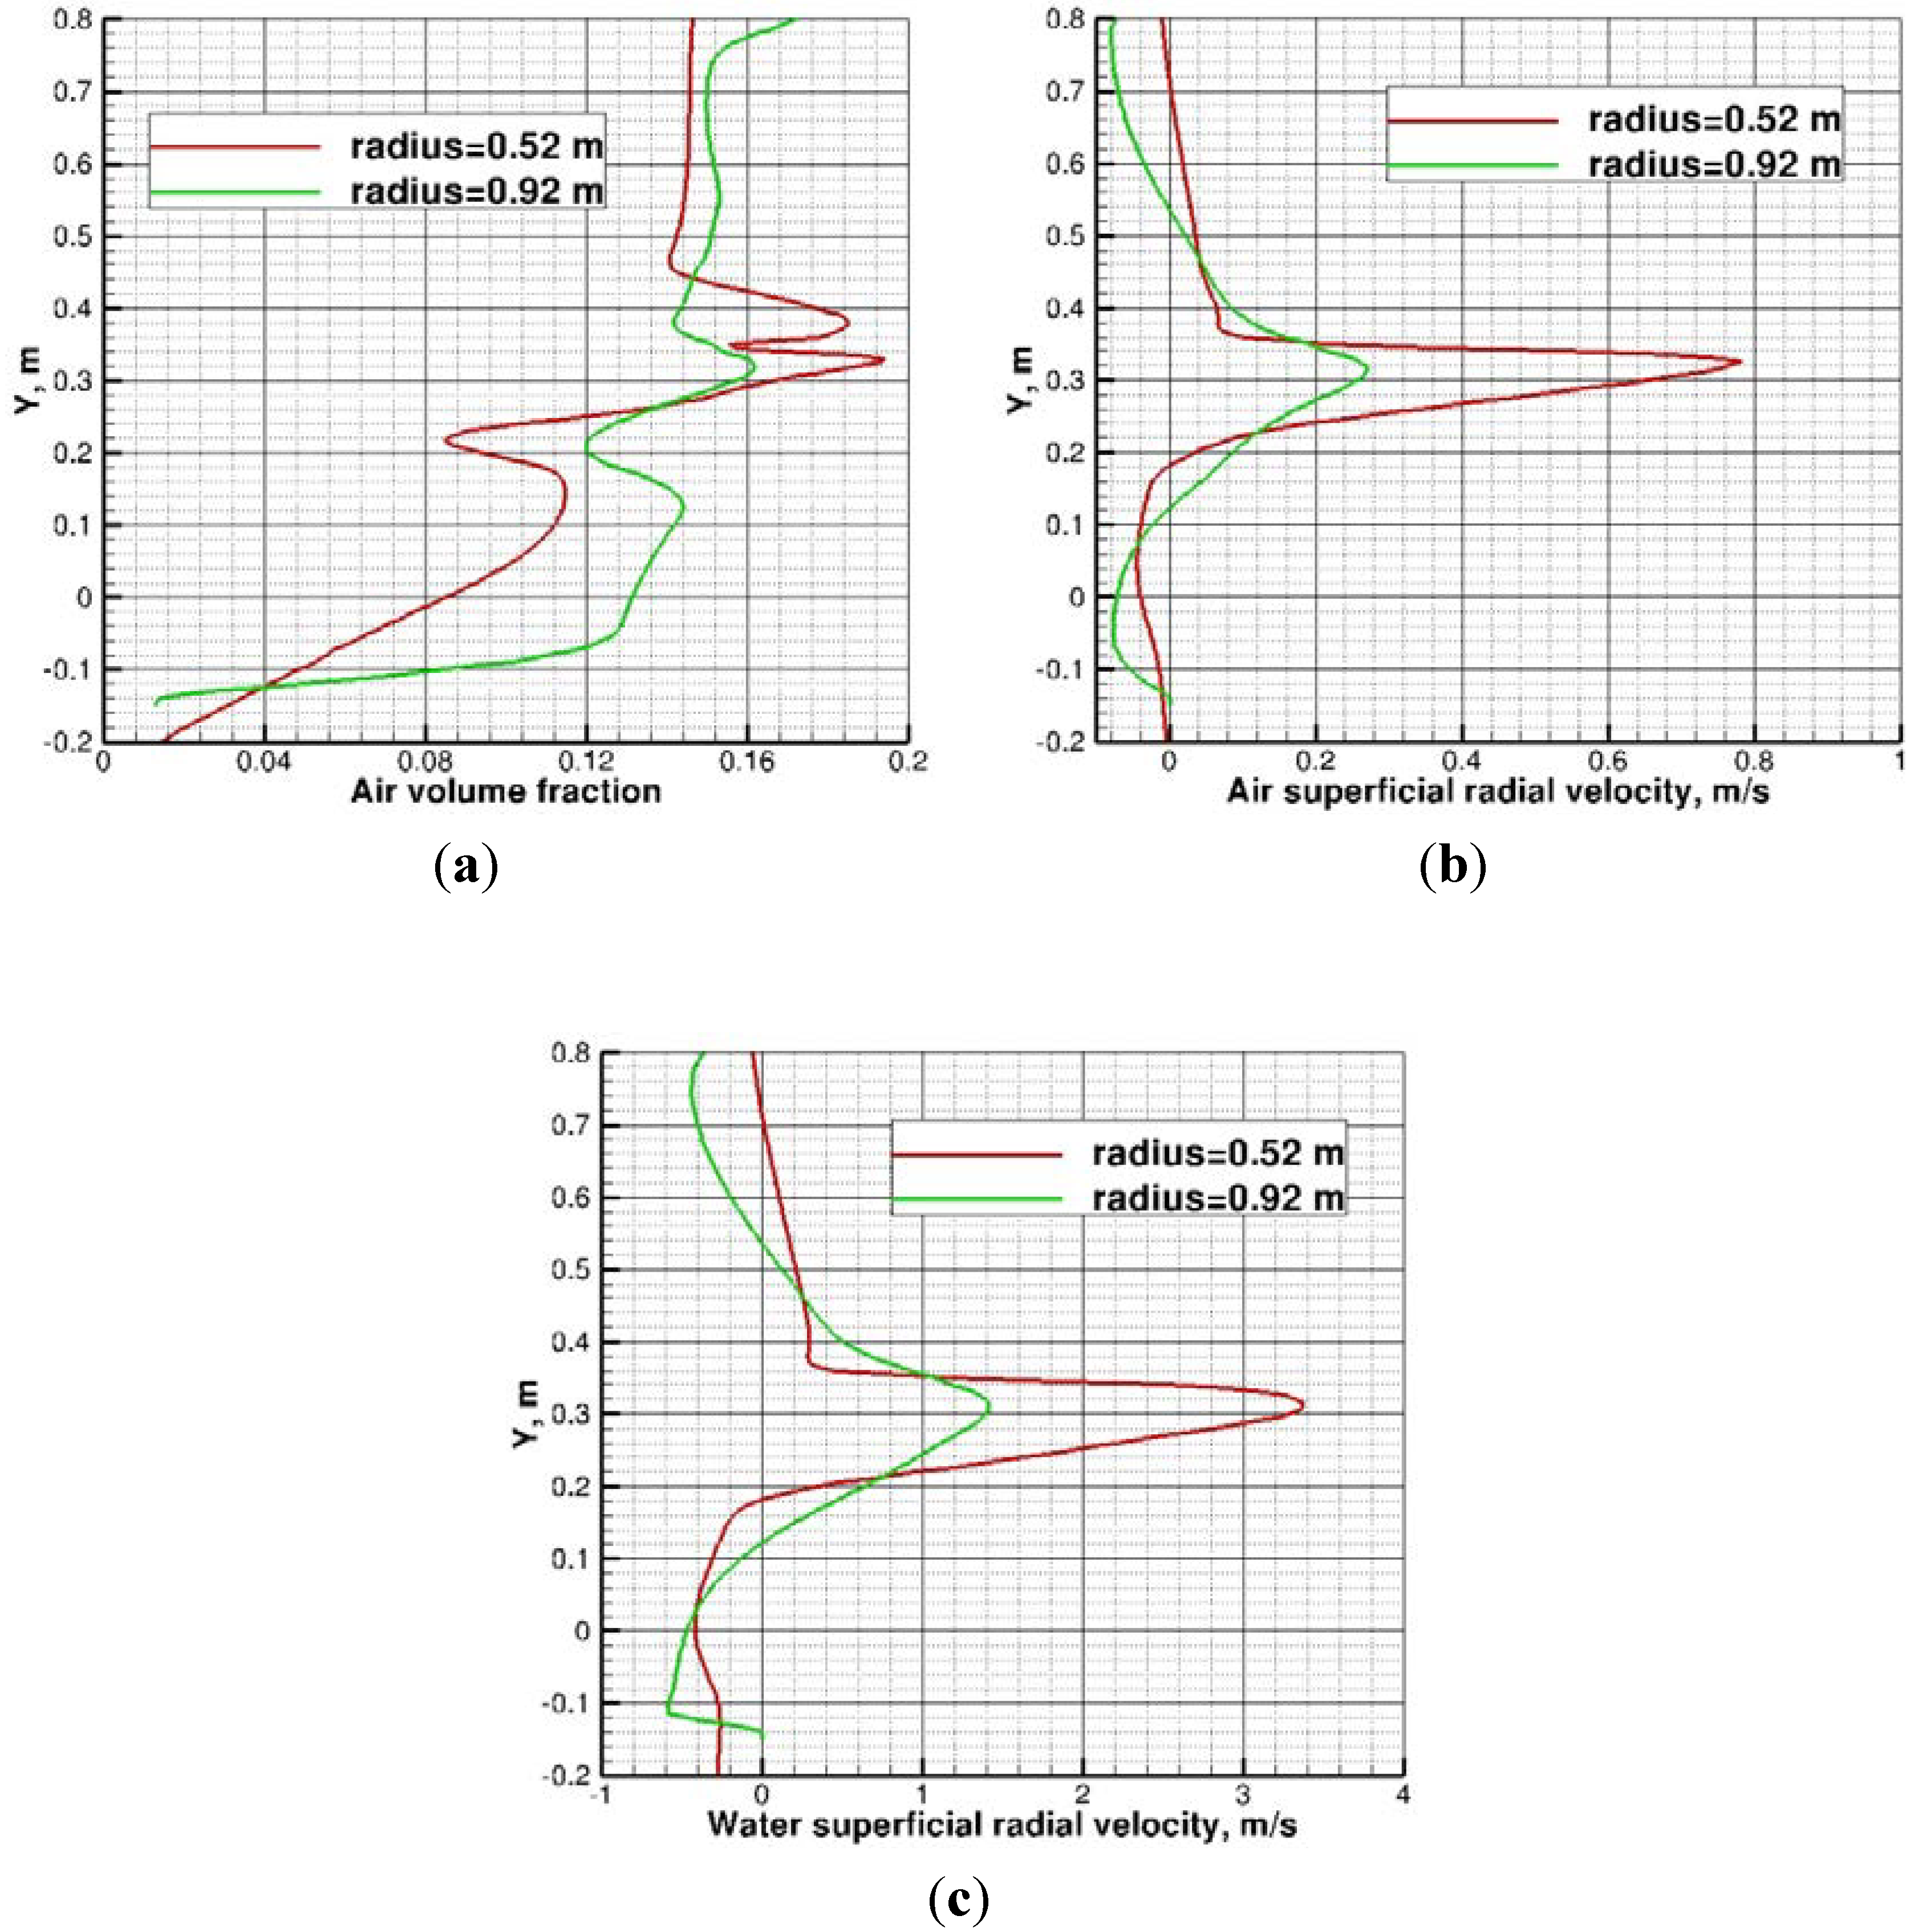
Figure 4b shows an iso-surface of air volume fraction of (α = 0.15) and the contours of air volume fraction on the rotor surface. Air bubbles are mainly convected by the jets towards the tank walls. Some of the air-rich flow splashes on the stator blades and escapes through the gap between rotor and stator. Air volume fraction, air superficial radial velocity, and water superficial radial velocity profiles on two vertical lines at radial distances (
r = 0.52 and 0.92 m) are shown
Figure 5a–c, respectively. Air volume fraction profiles very close to the stator at
r = 0.52 m shows a double peak, but only the lower peak is convected as can be deduced from the air superficial radial velocity profile shown in
Figure 5b. The air volume fraction profile at
r = 0.92 m shows a maximum in the jet region but also an increase in air concentration above and below the jets. As the jets impinge nearly normally on the tank walls, they recirculate part of the air into the lower and upper portions of the tank. The velocity profiles diffuse due to turbulent momentum transport and also because of the increase of flow area in the radial direction. Negative radial velocity indicates the return flow into the rotor region. The jets are directed slightly upward, and the two profiles for air and water are somewhat similar in the jet regions.
Figure 4.
(a) Iso-surface of water superficial velocity (Vw = 0.92 m/s) showing jets downstream of stator and (b) iso-surface of air volume fraction of (α = 0.15), lines at radii r = 0.52 and 0.92 m.
Figure 4.
(a) Iso-surface of water superficial velocity (Vw = 0.92 m/s) showing jets downstream of stator and (b) iso-surface of air volume fraction of (α = 0.15), lines at radii r = 0.52 and 0.92 m.
Figure 5.
(a) Air volume fraction (α) at r = 0.52 (red) and 0.92 m (green); (b) Air superficial radial velocity (Va,radial) at r = 0.52 (red) and 0.92 m (green); and (c) Water superficial radial velocity (Vw,radial) at r = 0.52 (red) and 0.92 m (green).
Figure 5.
(a) Air volume fraction (α) at r = 0.52 (red) and 0.92 m (green); (b) Air superficial radial velocity (Va,radial) at r = 0.52 (red) and 0.92 m (green); and (c) Water superficial radial velocity (Vw,radial) at r = 0.52 (red) and 0.92 m (green).
3.2. Effects of Bubble Diameter on Void Fraction
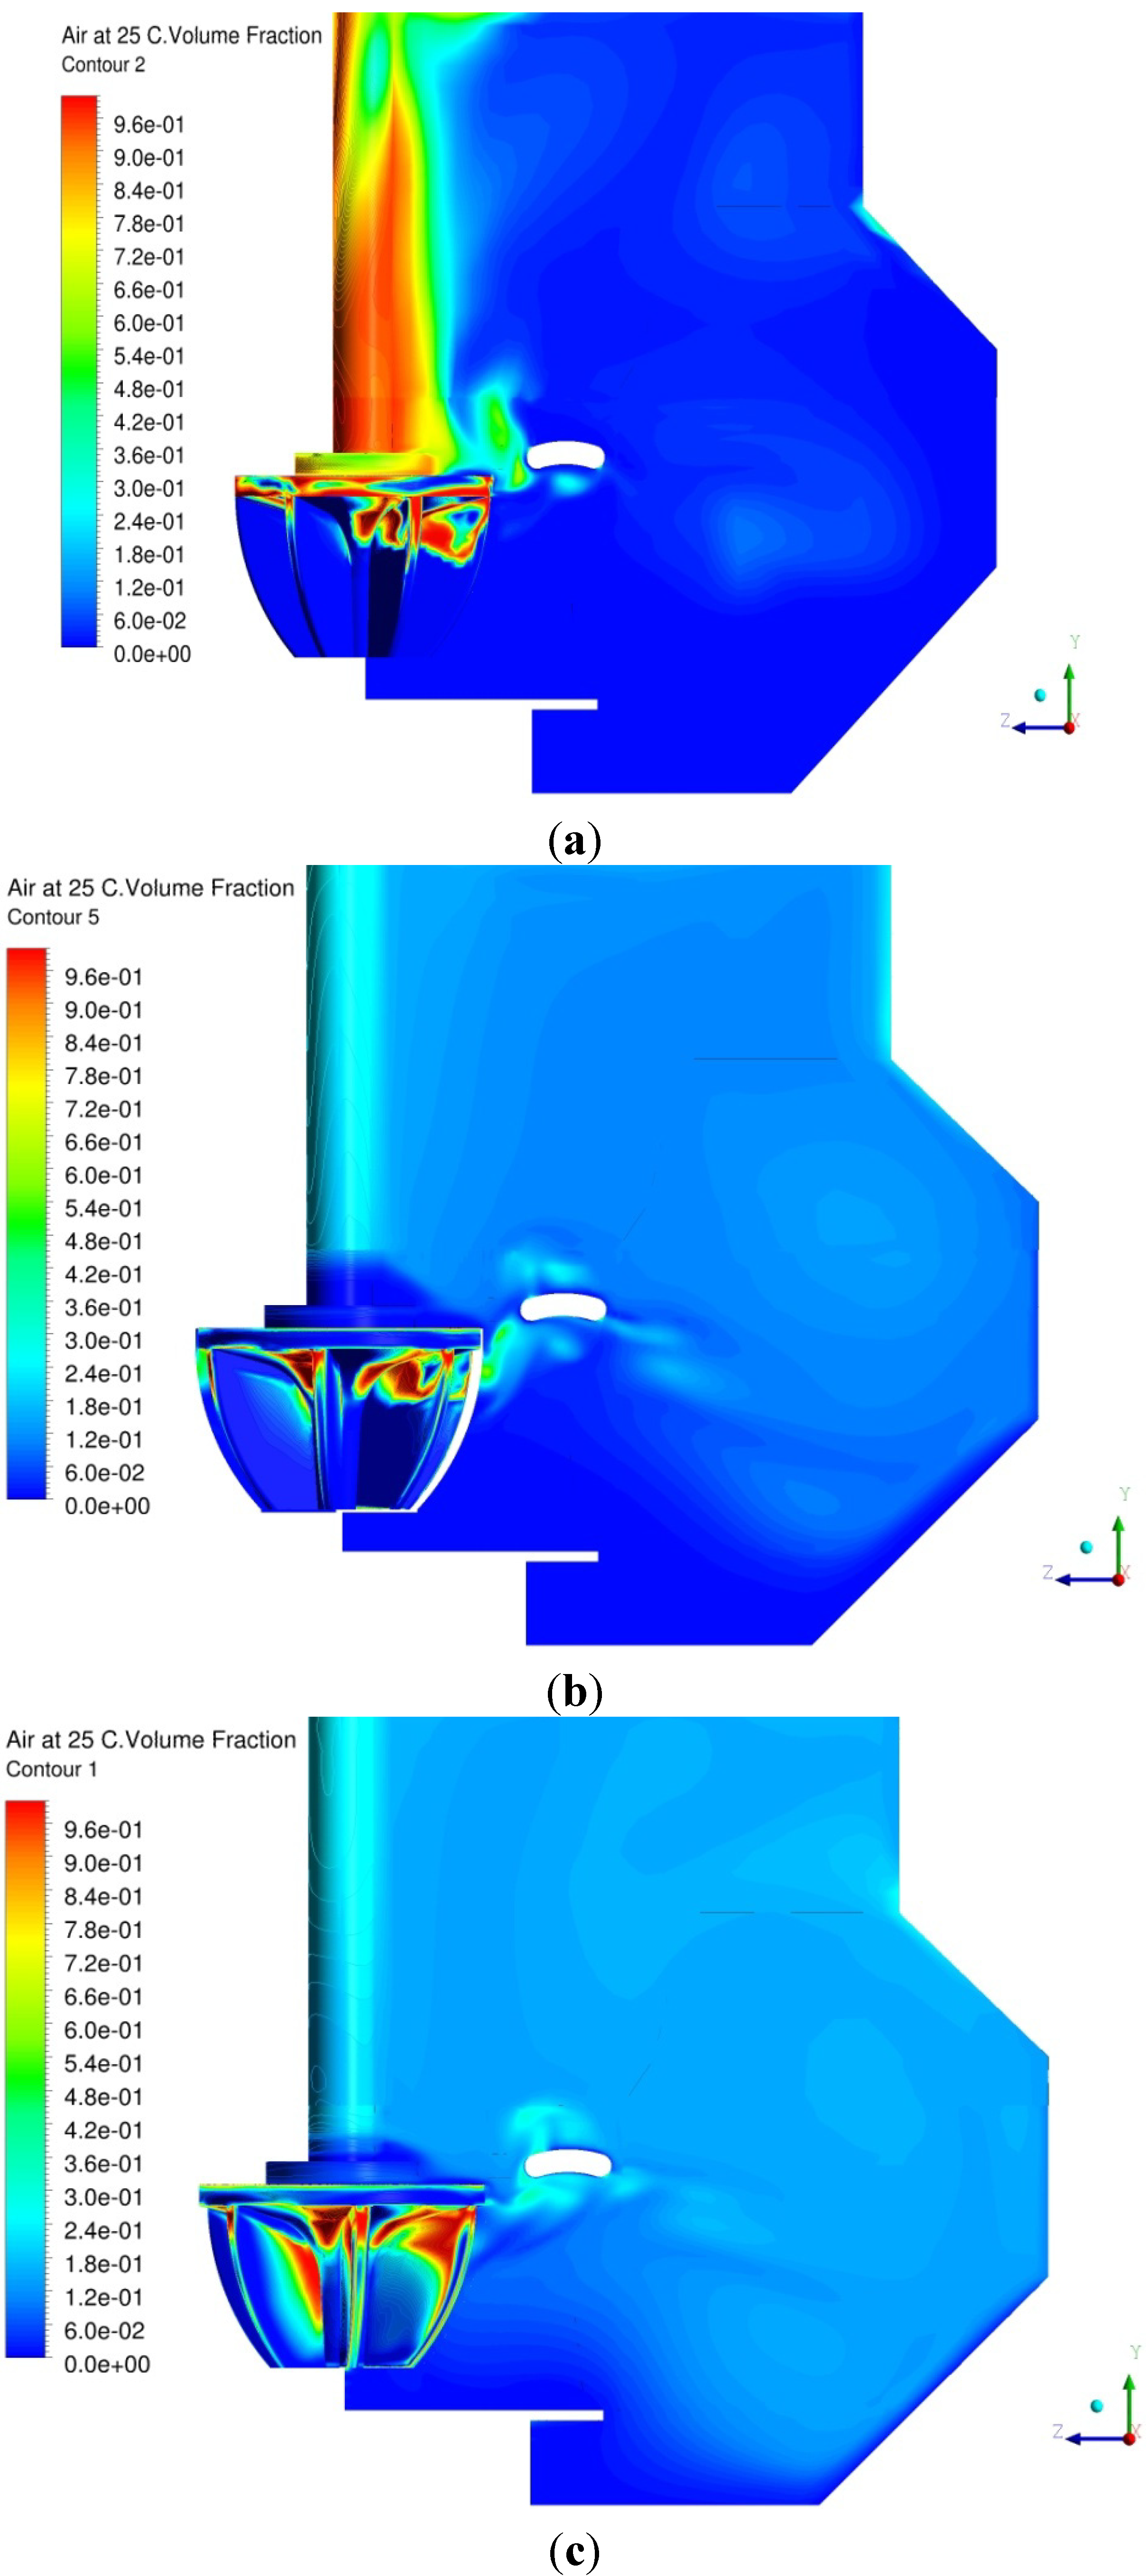
In the present two-phase flow simulations, a uniform bubble diameter is used. To study the effects of bubble diameter on the flow characteristics, three separate simulations for bubble diameters of 2.0, 1.0, and 0.5 mm are conducted. Air volume fraction contours in a vertical plane passing through jet region are shown in
Figure 6a–c for the three mentioned bubble diameters, respectively.
As shown in
Figure 6a for a large bubble diameter of 2 mm, higher buoyancy force relative to drag causes air bubbles to escape through the gap between rotor and stator. The portion of air that escapes through the gap drifts towards the shaft (low pressure region due to centrifugal forces) and rises upward to the water surface. The portion of air bubbles that passes through stator is convected with water jets and rises upward near tank walls towards water free surface. Most of the air for this bubble diameter escapes through the gap between rotor and stator. Negligible amount of air bubbles are convected downward with water stream to re-enter the rotor.
Similarly, it is concluded from
Figure 6b that for bubble diameter of 1 mm, buoyancy force on air bubbles is still high enough to cause some air to escape through the gap between rotor and stator. The portion of air bubbles that passes through stator is convected with water jets and drifts upward near tank walls towards water surface. Some of the air is convected downward into lower portion of the tank. The air is well dispersed throughout the tank.
Unlike the previous two cases, as shown in
Figure 6c for a small bubble diameter of 0.5 mm, higher drag relative to buoyancy causes air bubbles to travel longer with water jets. Most of the air bubbles pass through stator and are convected with water stream. Air bubbles are dispersed throughout the tank volume, and some air re-enters the rotor.
Figure 6.
(a) Air volume fraction (α) contours for bubble diameter = 2 mm; (b) Air volume fraction (α) contours for bubble diameter = 1 mm; and (c) Air volume fraction (α) contours for bubble diameter = 0.5 mm.
Figure 6.
(a) Air volume fraction (α) contours for bubble diameter = 2 mm; (b) Air volume fraction (α) contours for bubble diameter = 1 mm; and (c) Air volume fraction (α) contours for bubble diameter = 0.5 mm.
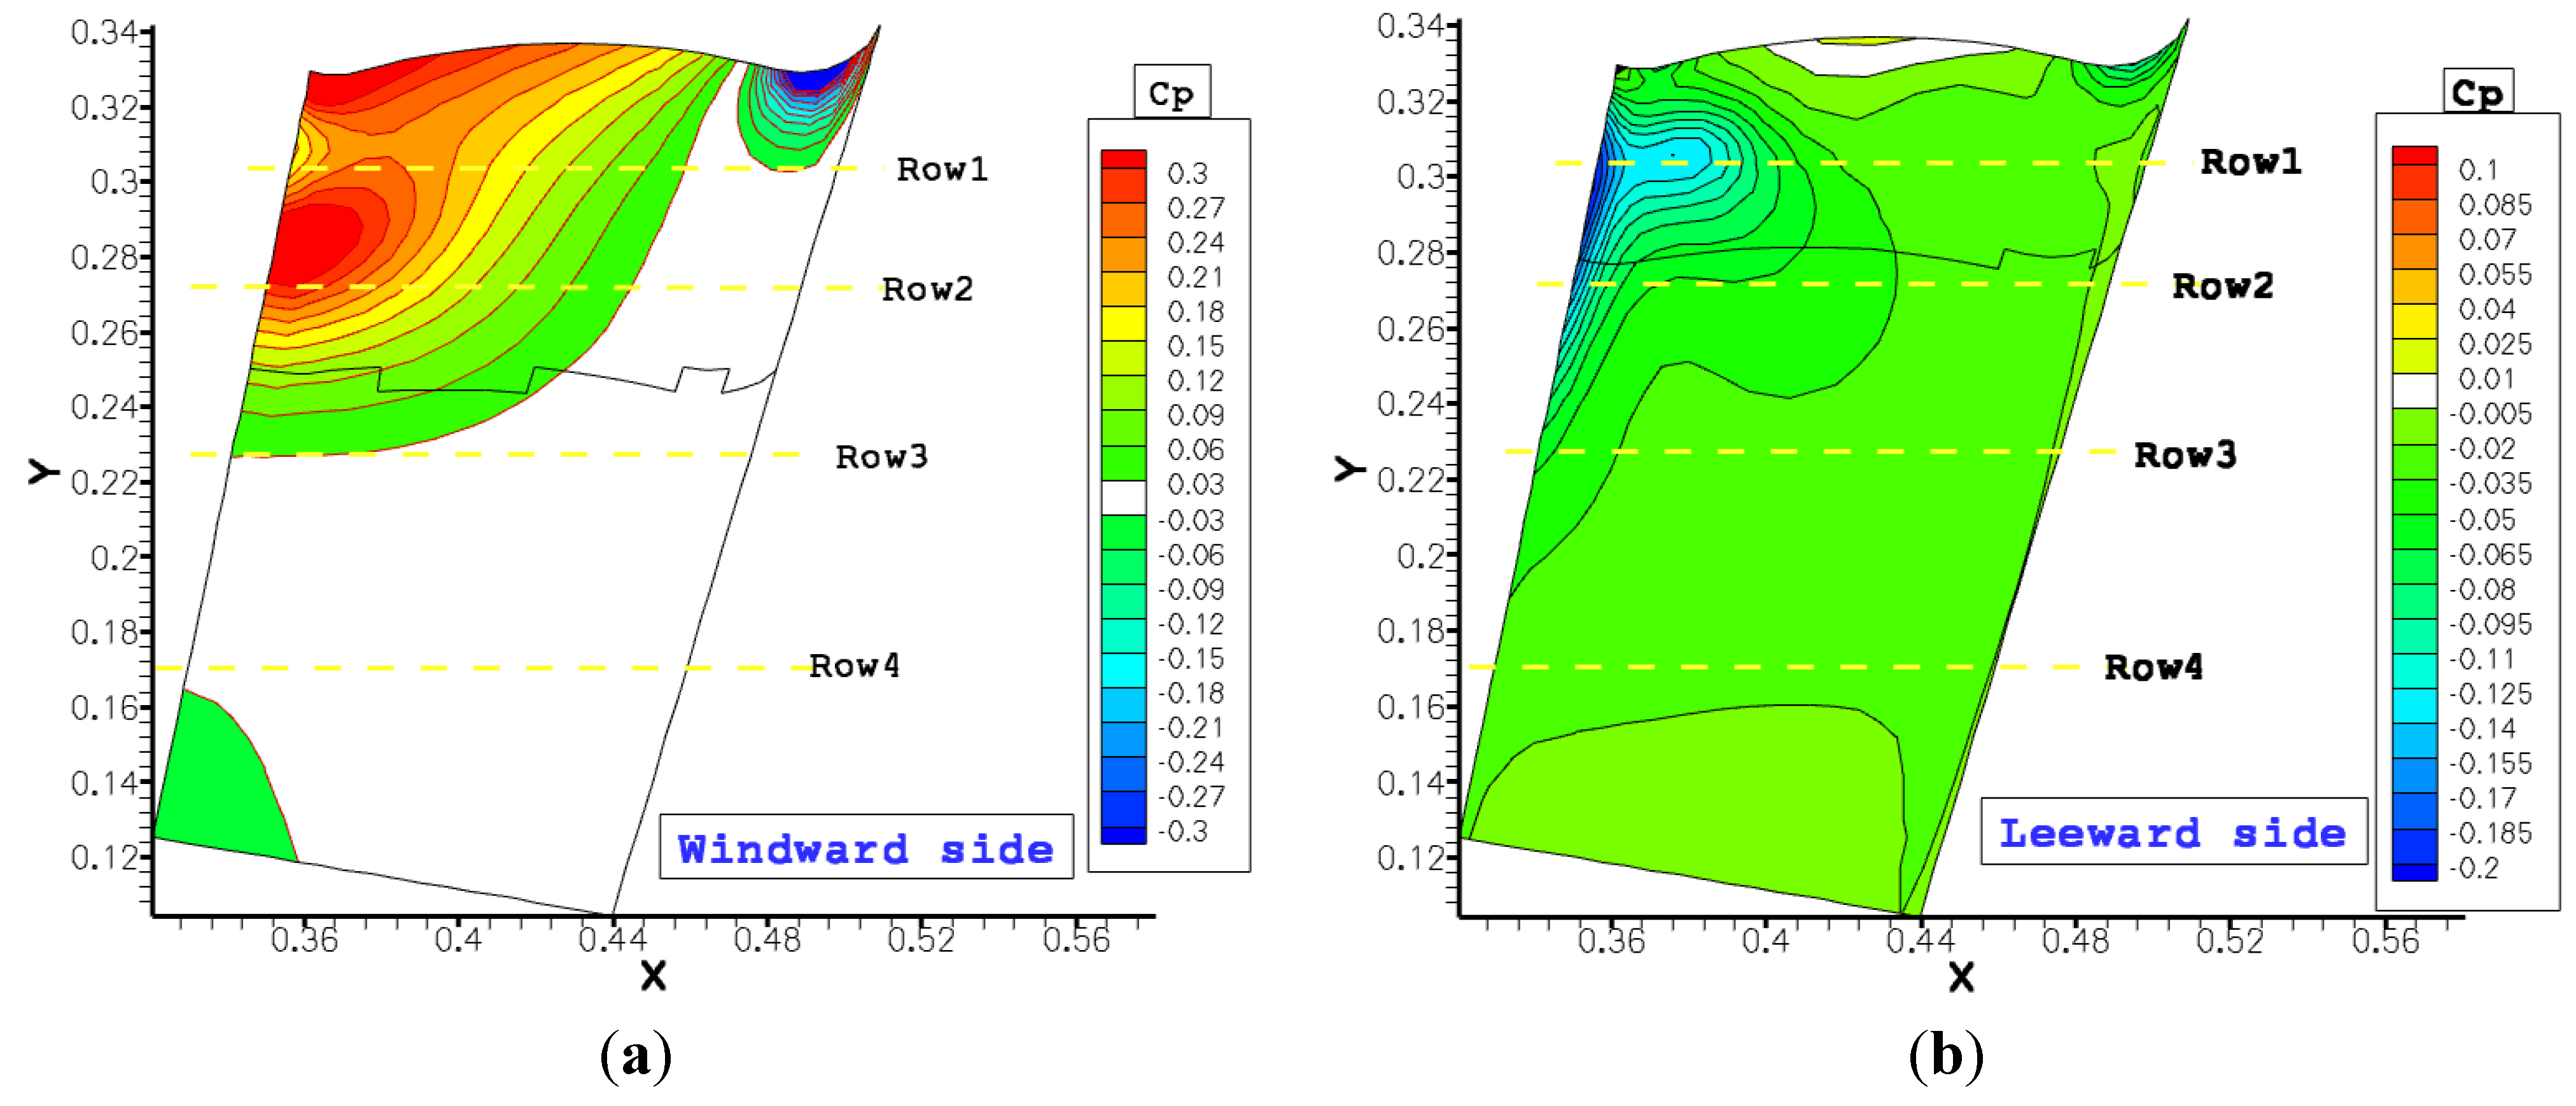
3.3. Comparison of CFD Results with Experiments
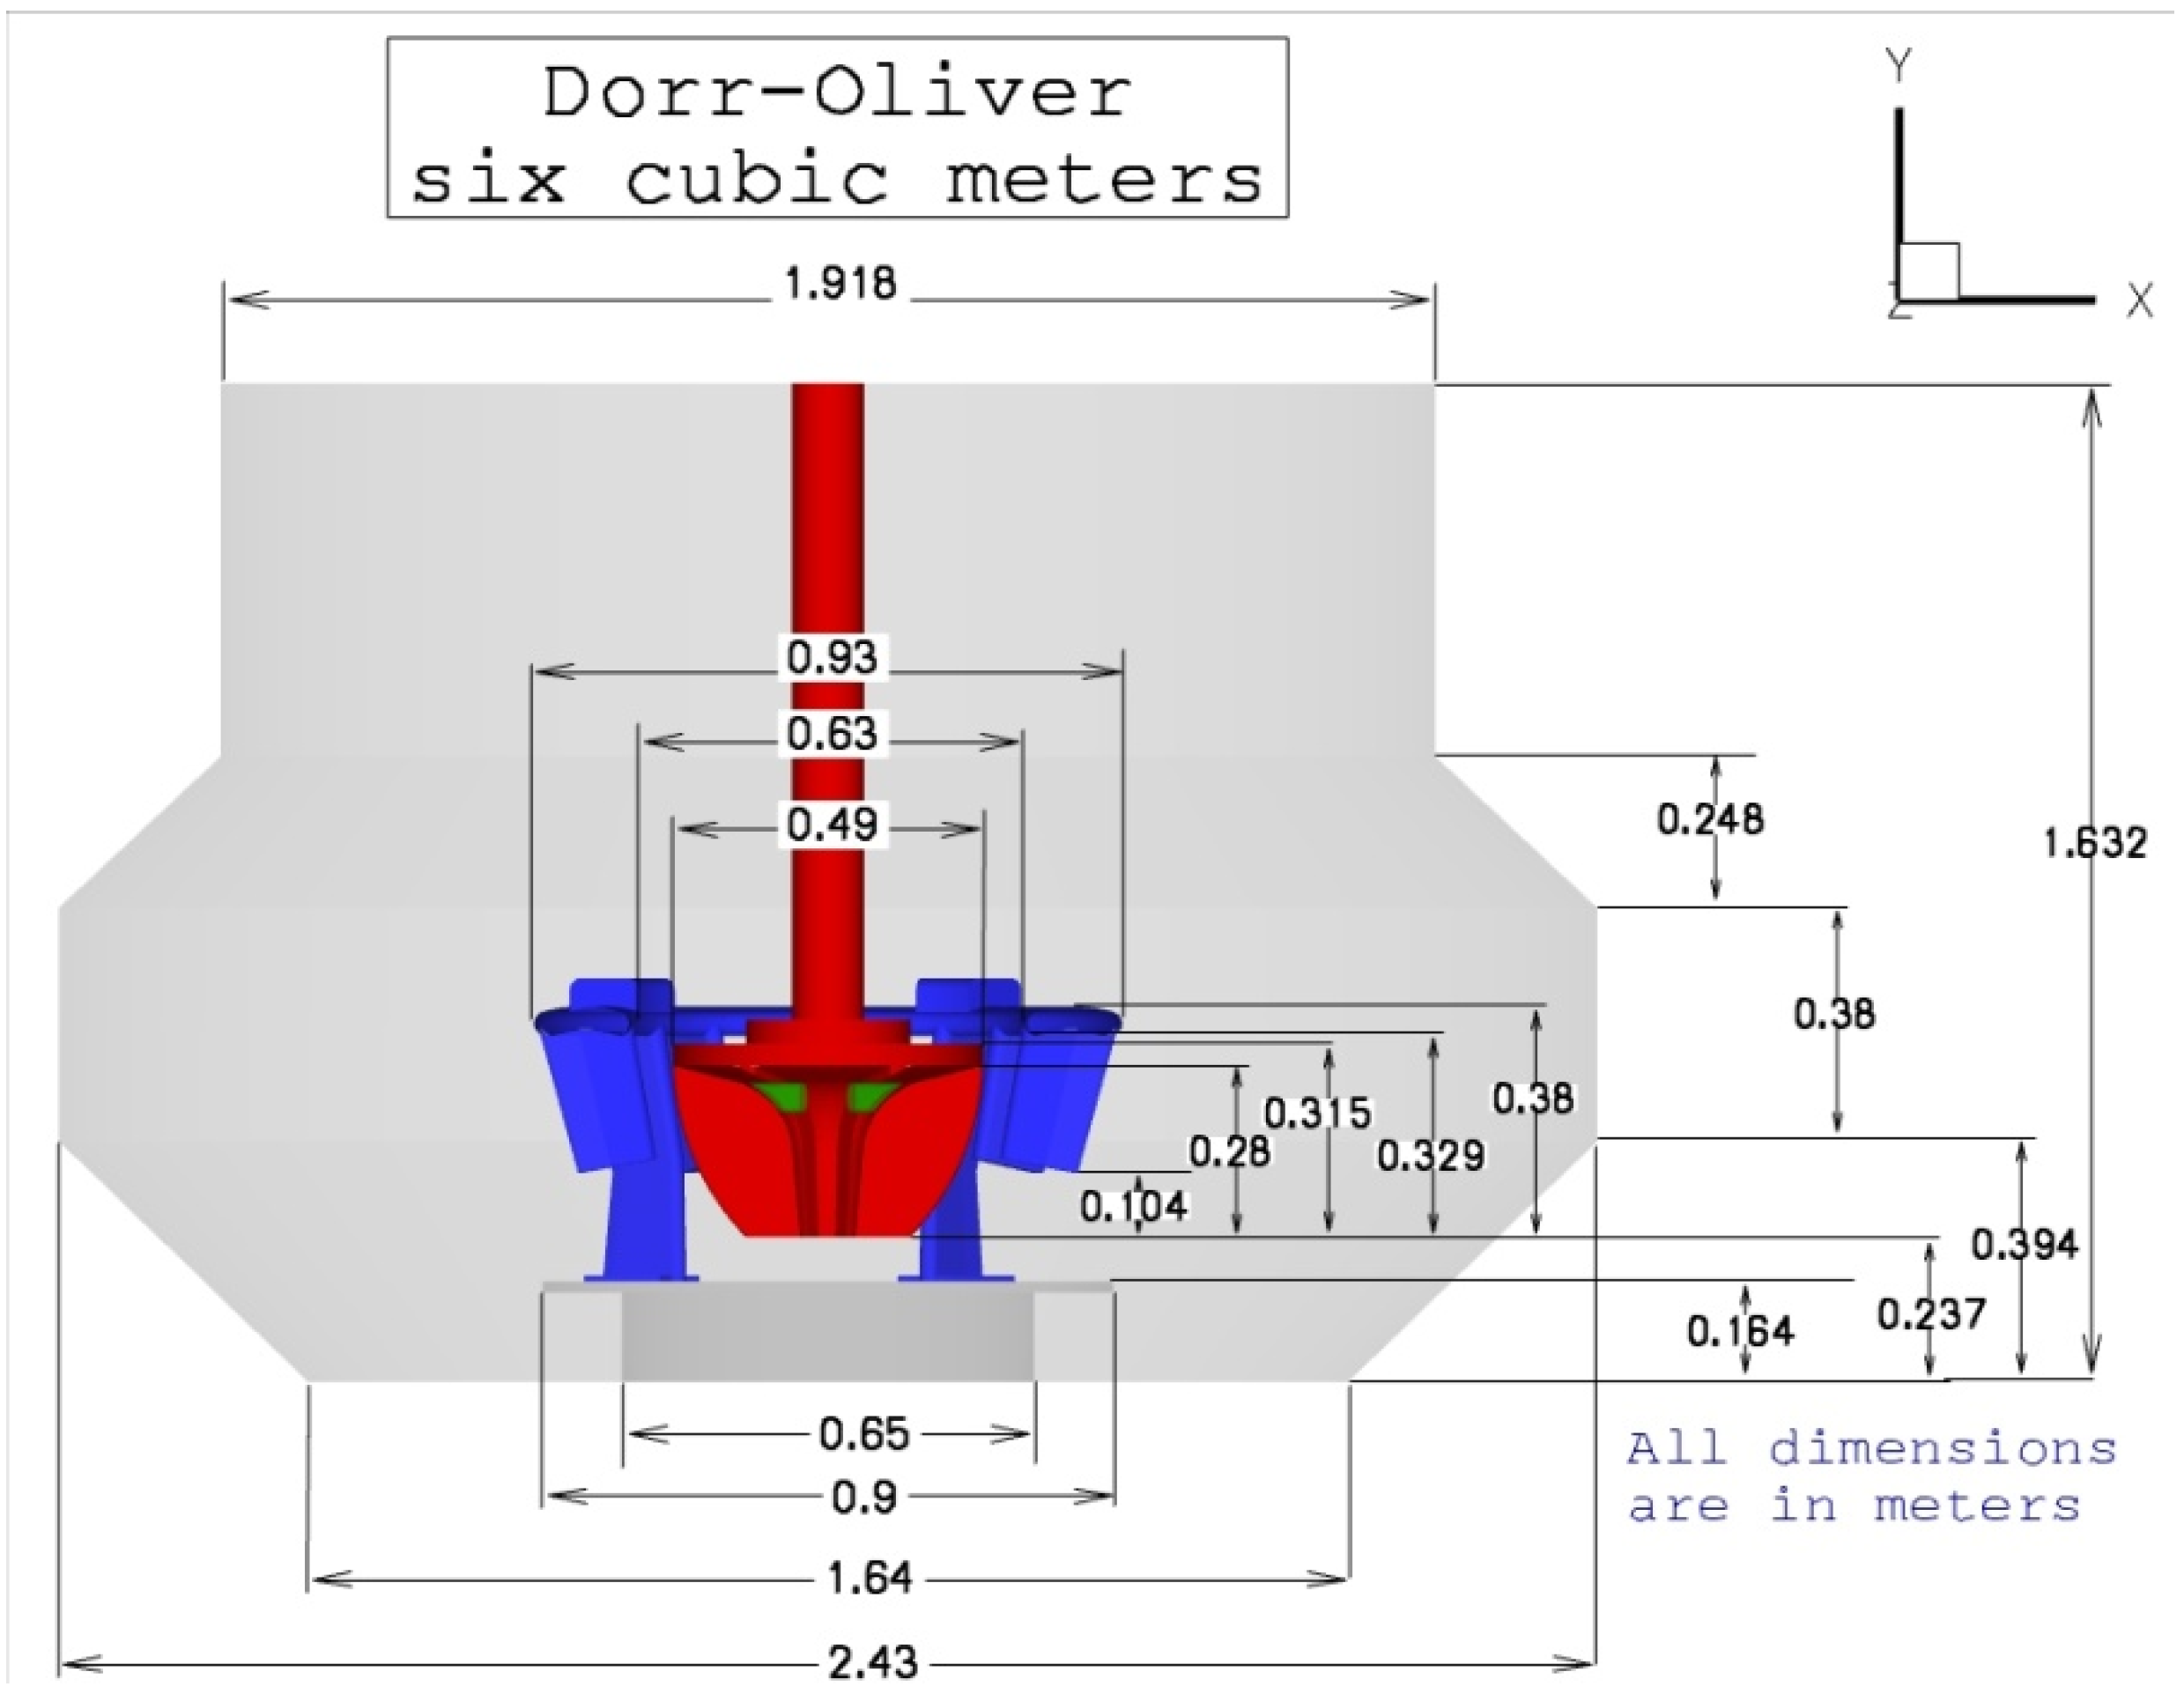
Validation of the computational model is very important to build confidence in CFD as a viable tool for the analysis of such a complex two-phase flows. The flow in a flotation cell poses many challenges to both CFD modeling and experimental measuring techniques. Such challenges including three-dimensional unsteady shear flow, turbulence production and dissipation, rotating components, and multiphase phenomena. Mean velocity and turbulence statistics have been measured in a 6 m
3 Dorr-Oliver pilot cell for both single and two phase flow [
15,
16].
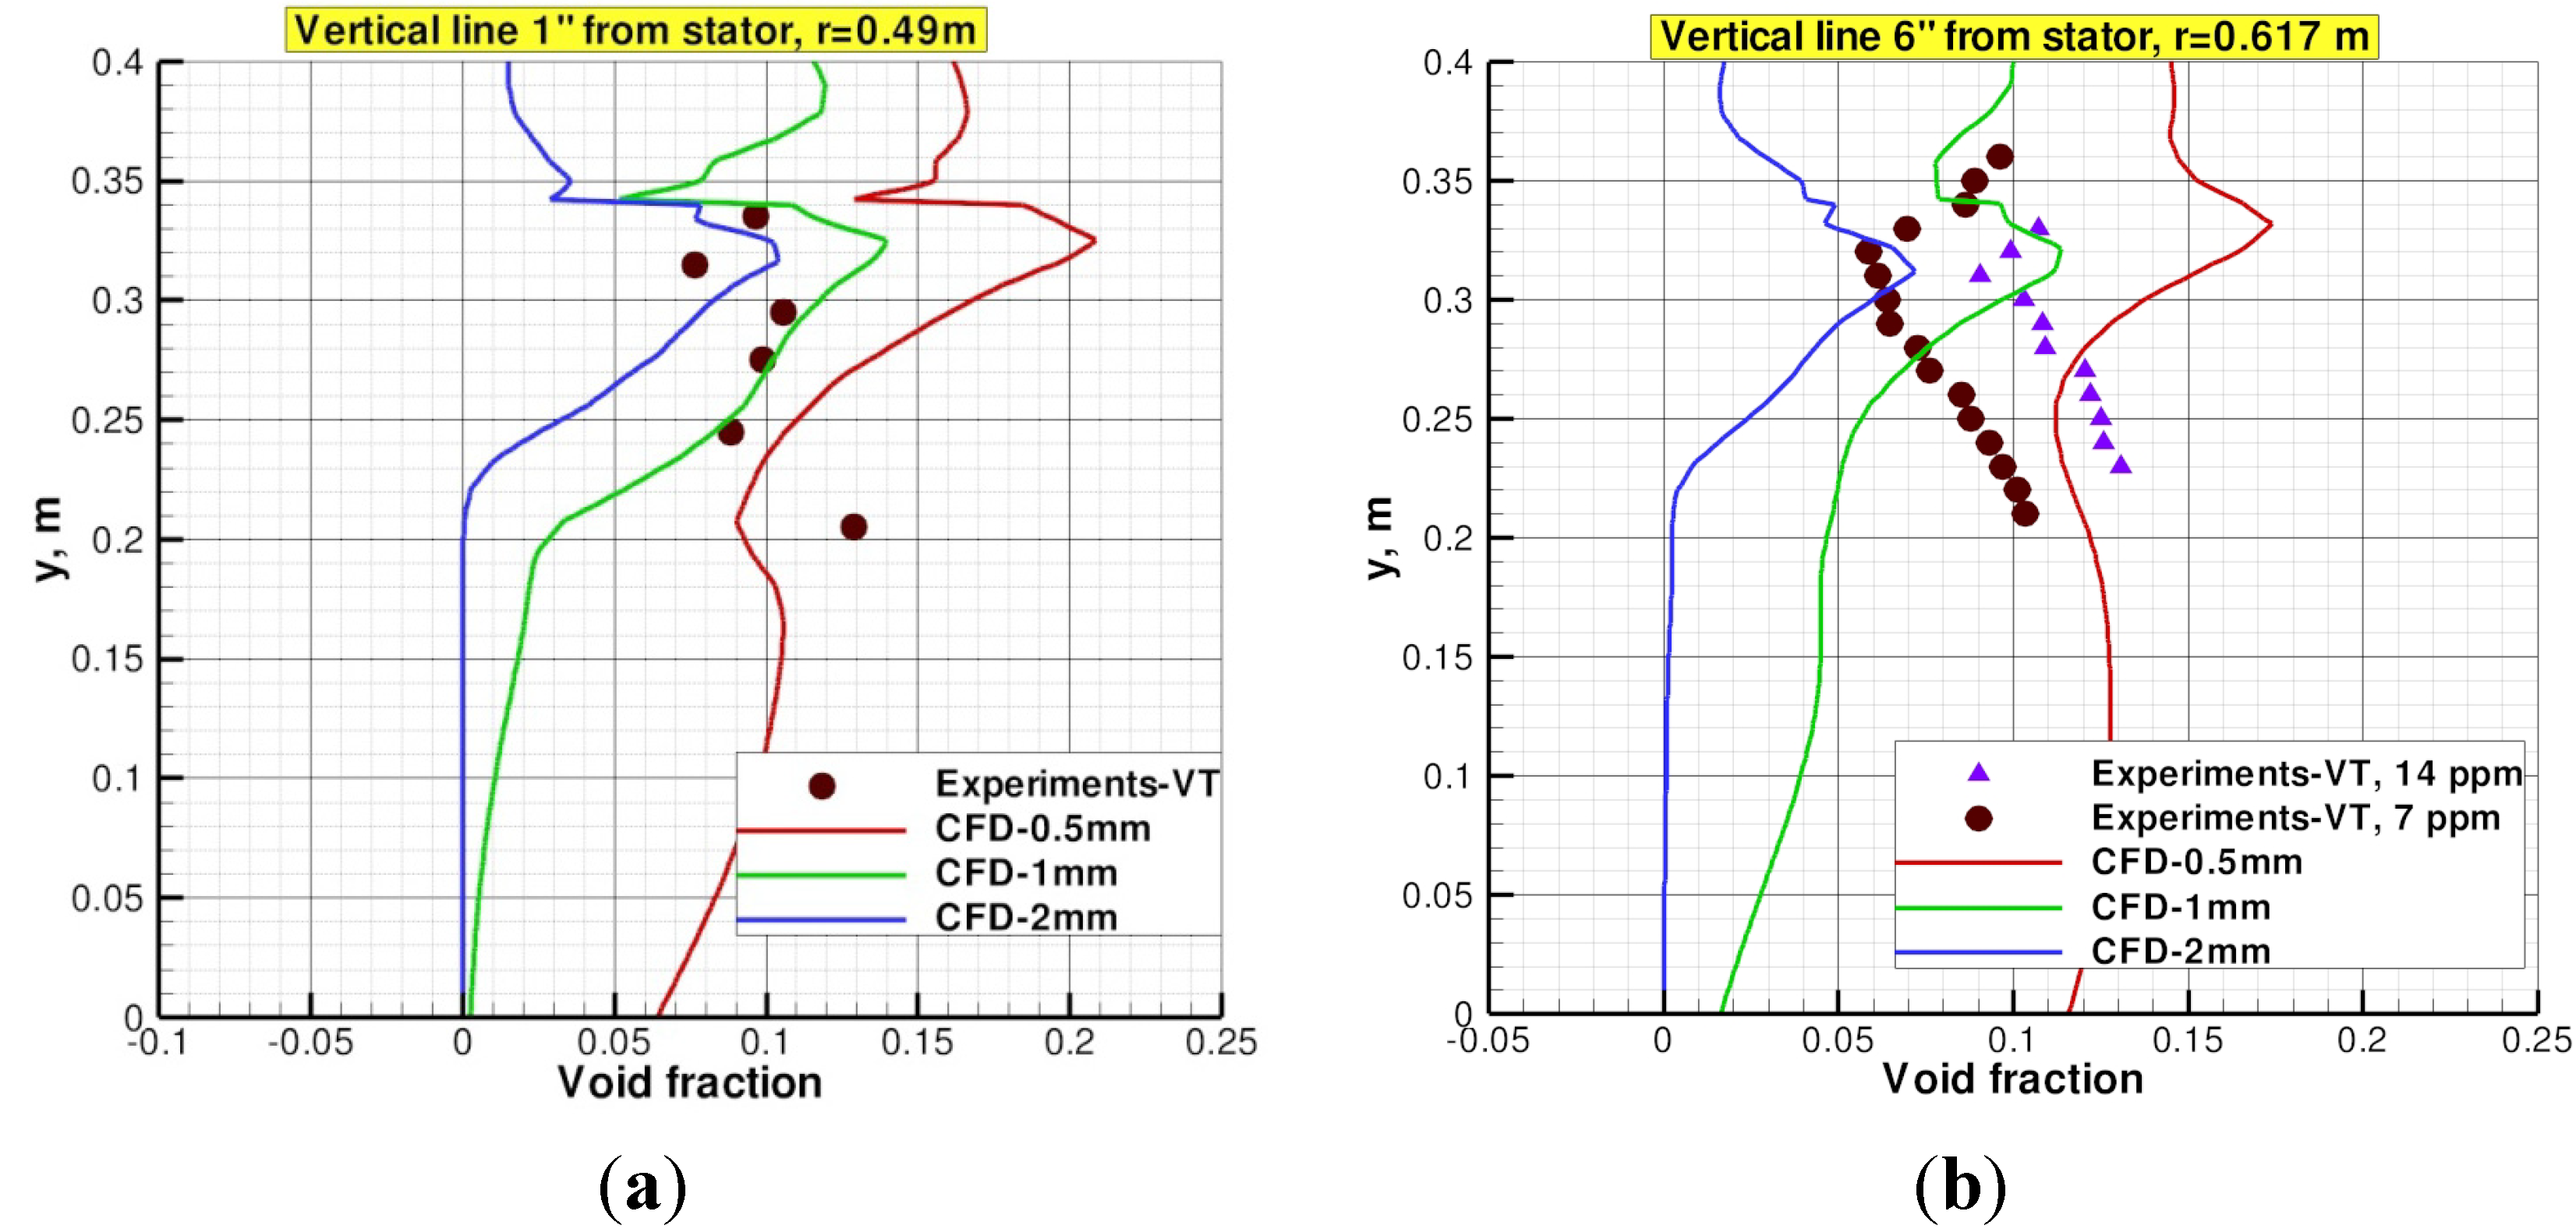
Comparisons between CFD and experimental data [
15,
16] for void fraction on two vertical lines outside stator are shown in
Figure 7a,b. An iso-kinetic probe had been developed and used to measure air void fraction [
16]. The comparison in
Figure 7a,b shows that the CFD agrees with the experimental data in the jet region for bubble diameter (
Db) of 1.0 mm. Away from the stator, the overall level air volume fraction of CFD is comparable to the level of the experimental data however the trend below the jet is different. This may be attributed to the production of smaller bubbles (smaller than the diameter specified in the simulations) in the jet shear layers thereby increasing the local void fraction as supported by the increase of the void fraction below the jets as the bubble size decreases from 2.0 to 0.5 mm. In the simulation, gas holdup is 13%, 8% and 3% for bubble diameters of 0.5, 1.0 and 2.0 mm, respectively. Experimental gas holdup reports 6.8% where a bubble size distribution exists in the physical experiment.
Figure 7.
(a) Air volume fraction (α) profile at 25.4 mm downstream of stator and (b) air volume fraction (α) profile at 152.4 mm downstream of stator.
Figure 7.
(a) Air volume fraction (α) profile at 25.4 mm downstream of stator and (b) air volume fraction (α) profile at 152.4 mm downstream of stator.
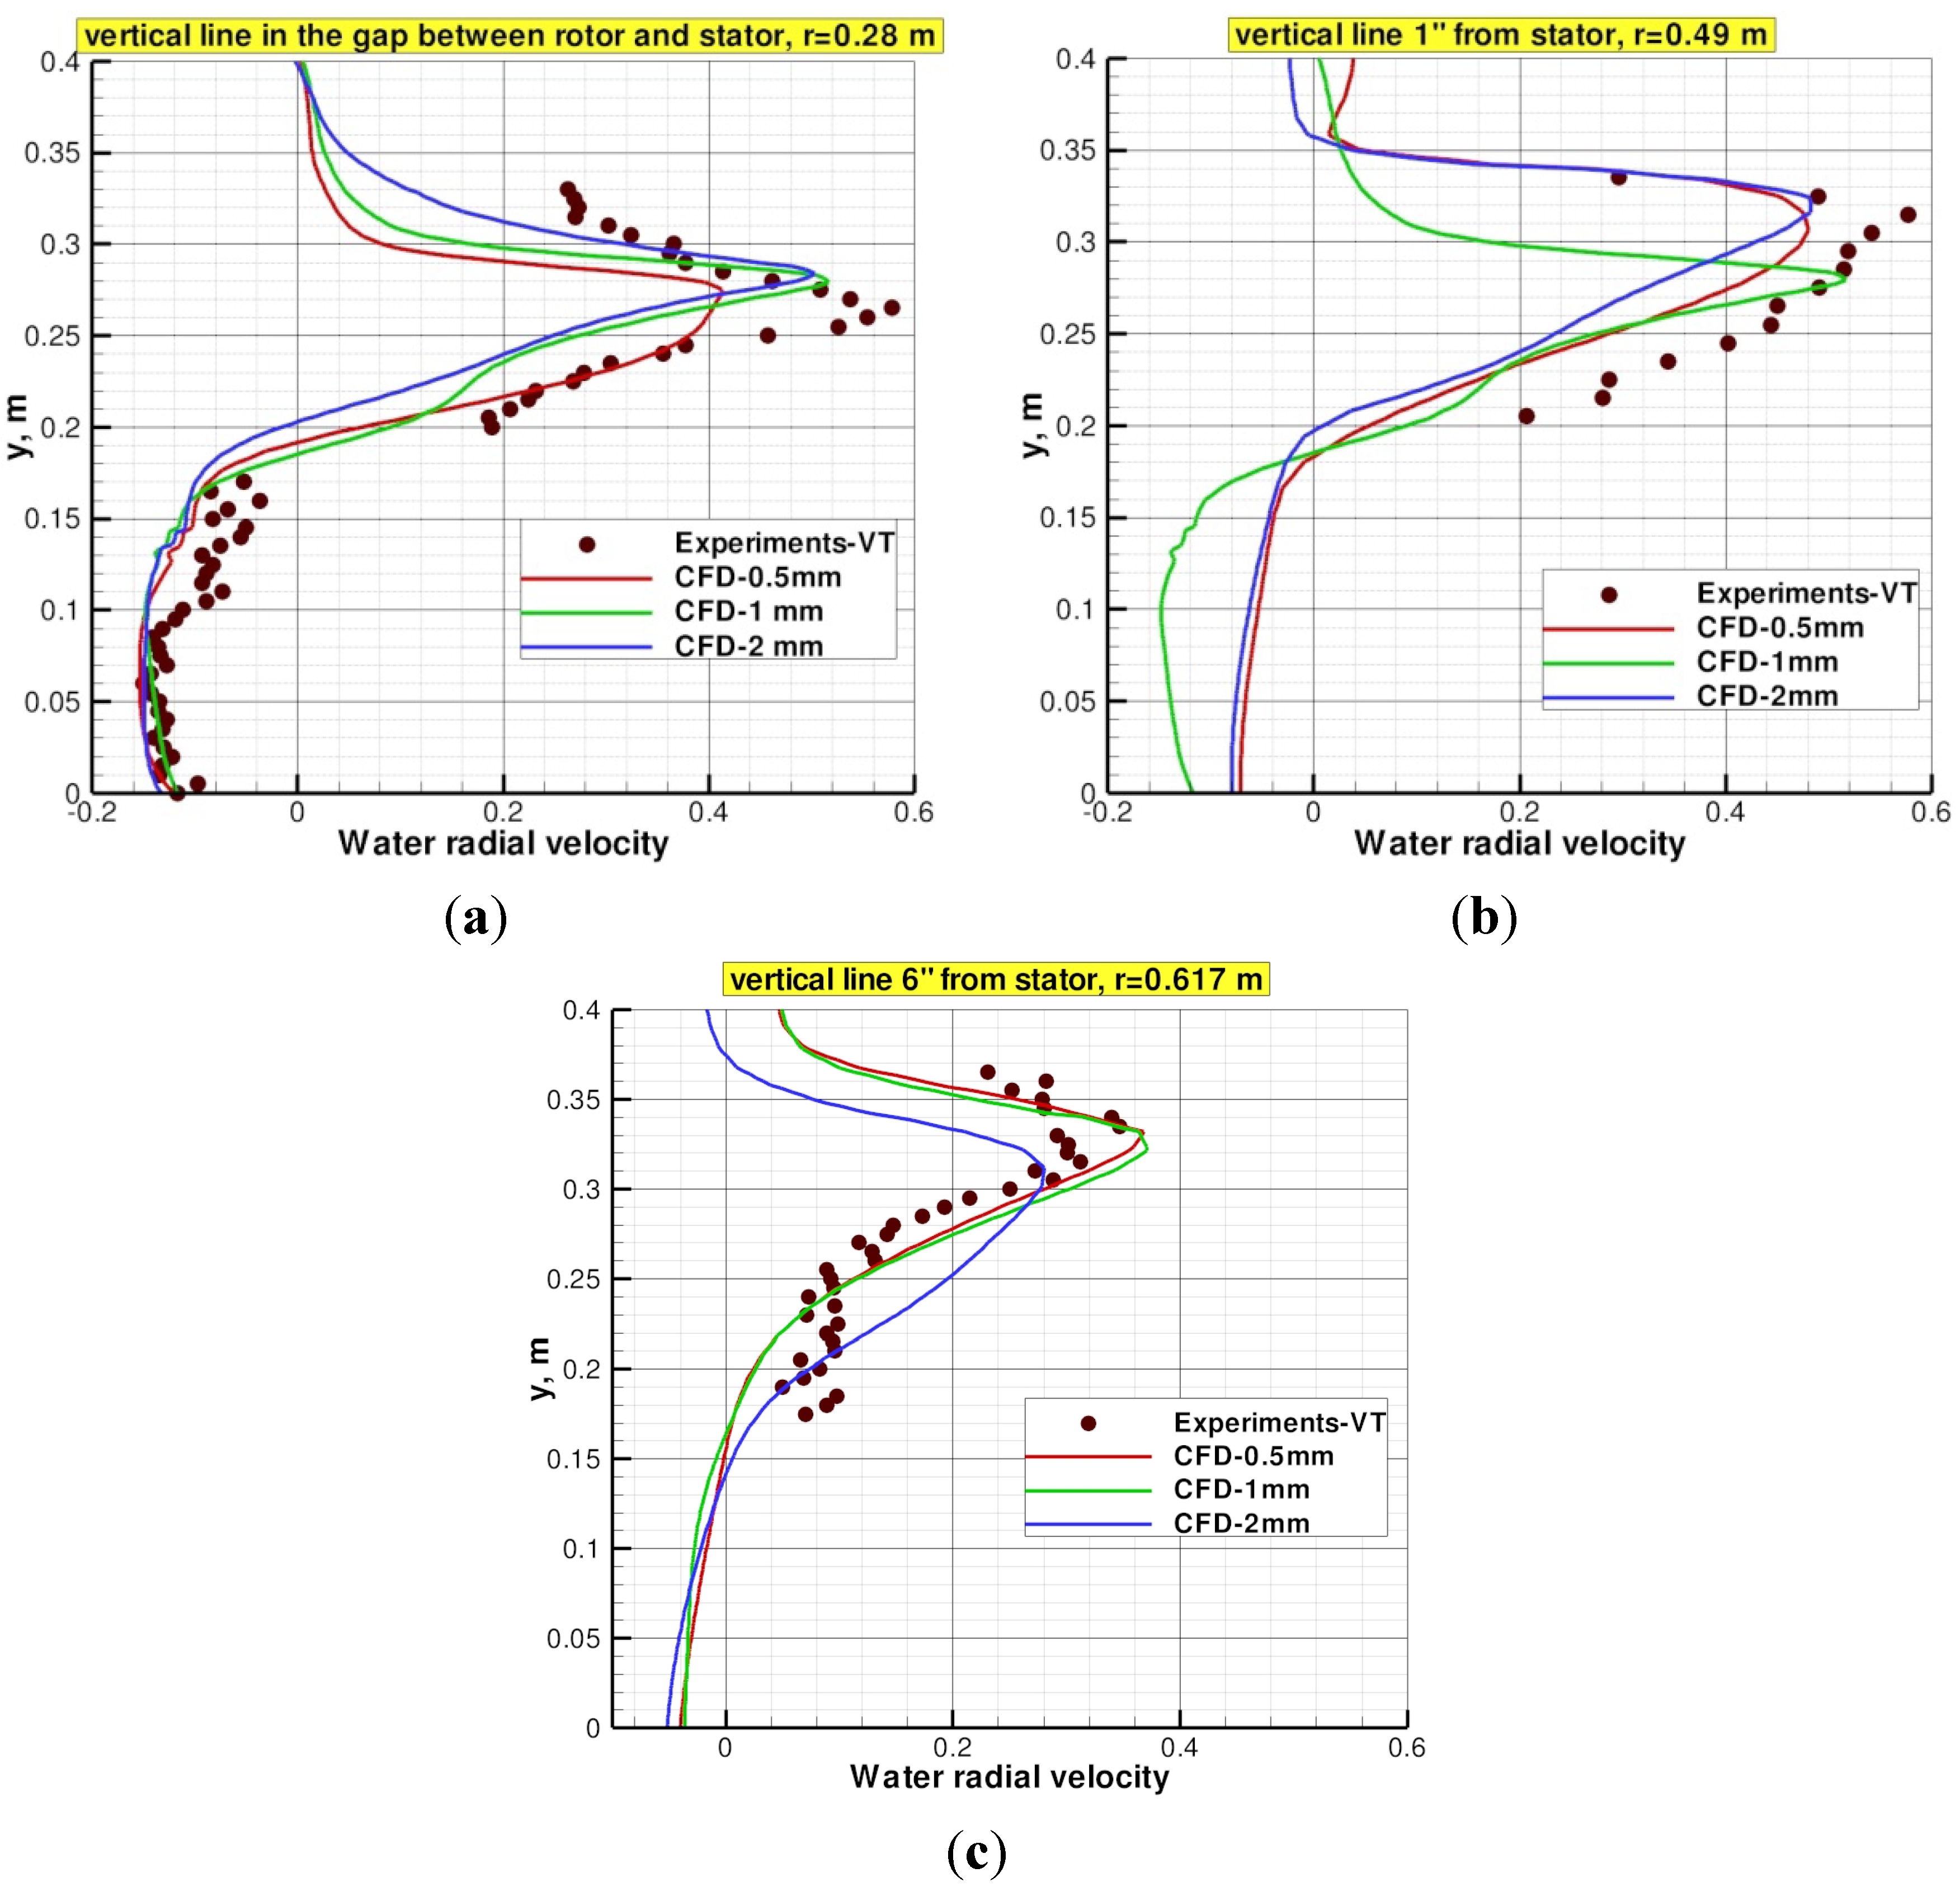
Water superficial velocity profiles on vertical lines in the gap between rotor and stator and outside that region are shown in
Figure 8 and
Figure 9. All velocities are normalized by the rotor tip speed (
U = 6.414 m/s.). Each profile is an average over 16 vertical lines that have the same circumferential location relative to the stator; which has 16 blades; however, they are not averaged over time.
It is evident from
Figure 8 that the bubble diameter has some effects on the water superficial radial velocity within and outside the rotor-stator regions. CFD profiles for 1.0 mm bubble diameter show good agreement with the experimental data. Of course, in the experiments, a bubble size distribution exists, and the present simulations suggest that the most probable bubble diameter is 1.0 mm.
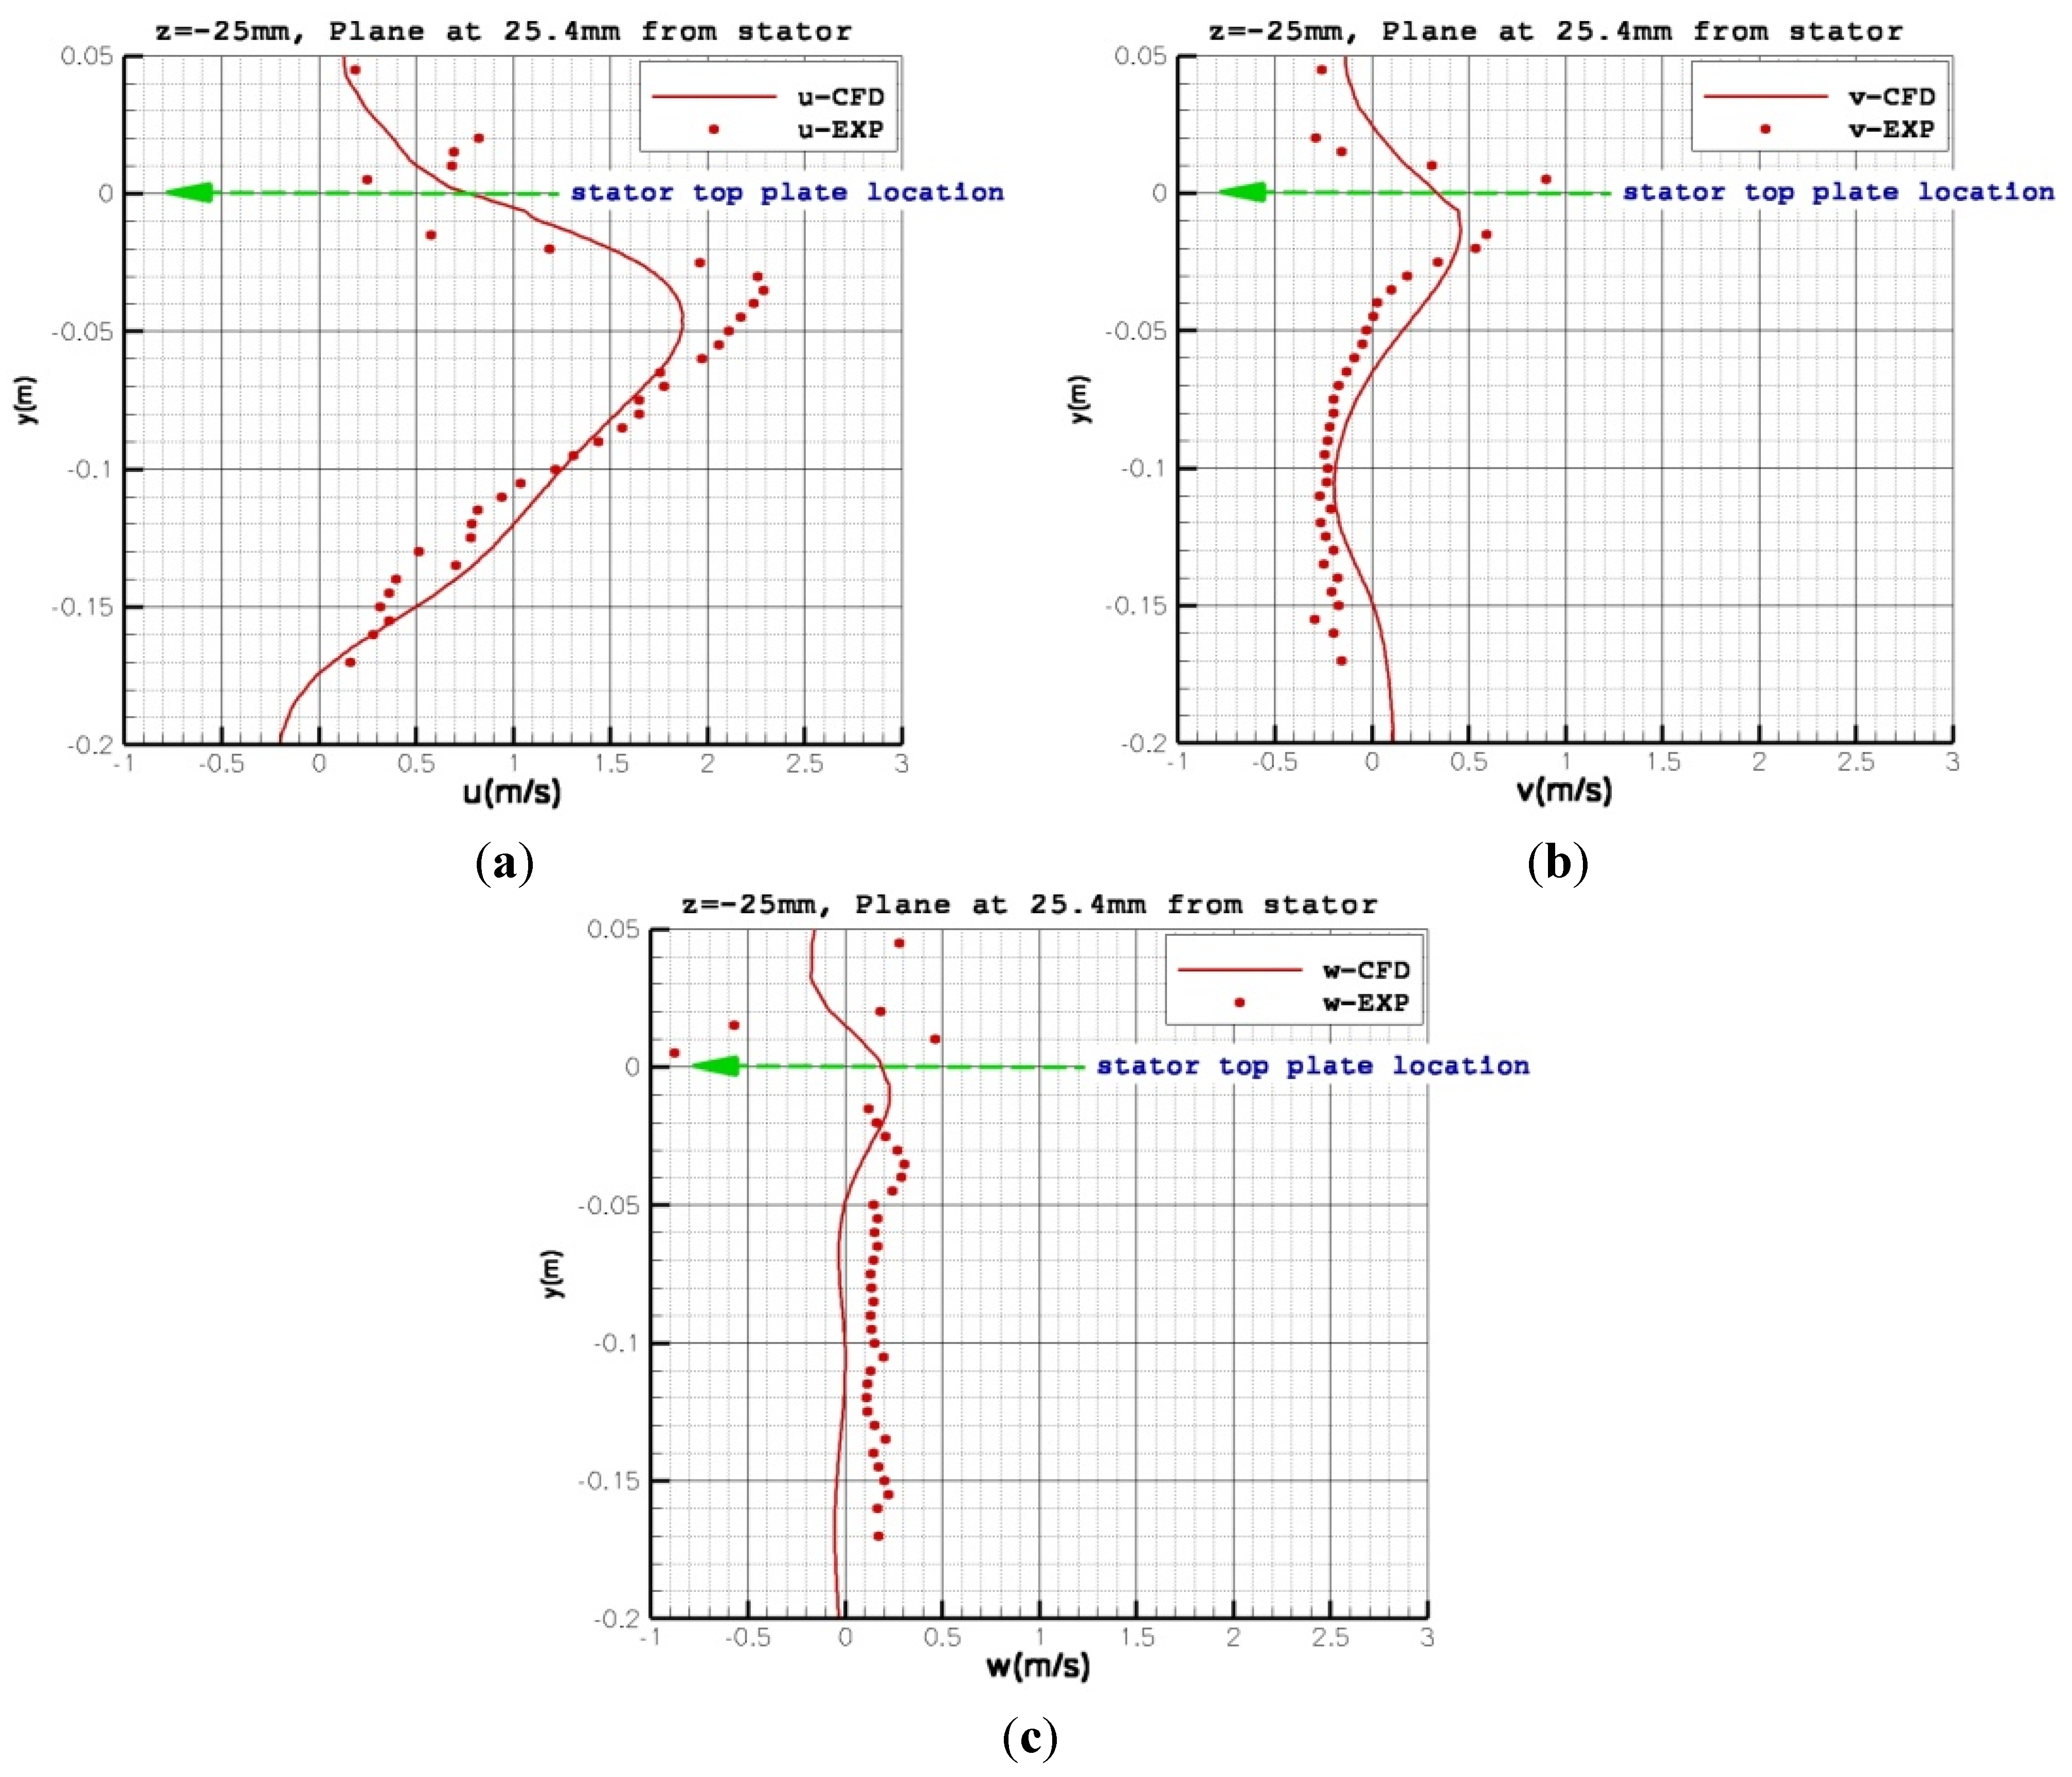
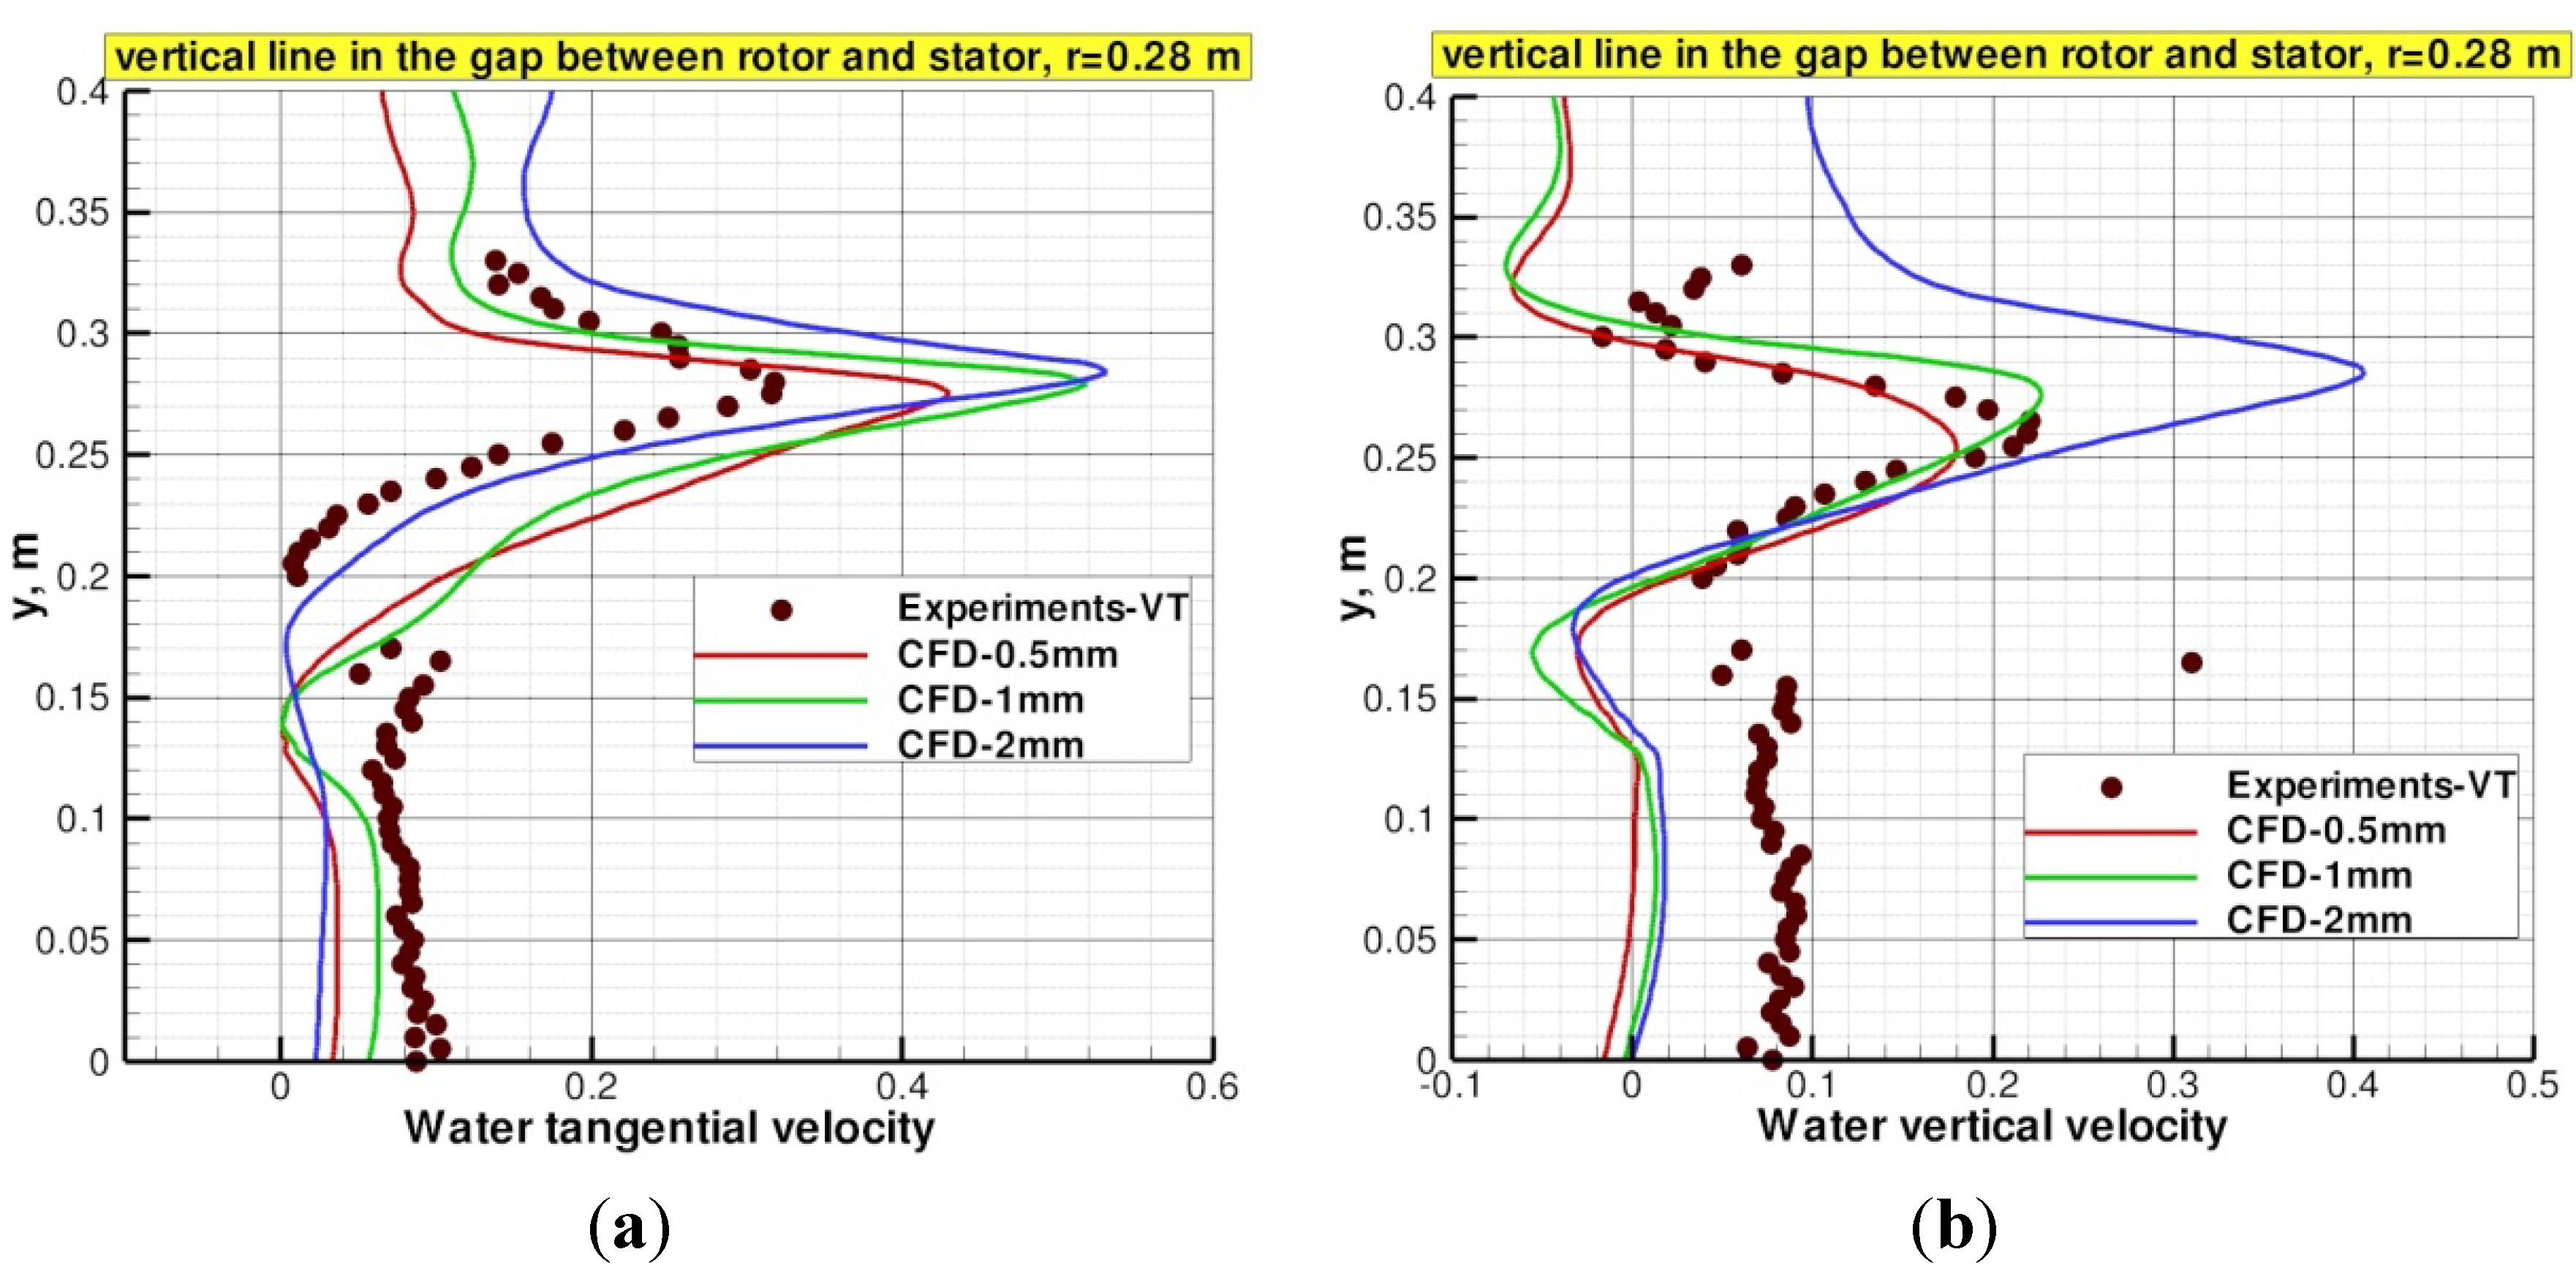
Comparison between CFD profiles and experimental data for tangential and vertical velocity components in the gap between rotor and stator are depicted in
Figure 9a,b, respectively. Very good agreement is obtained in that region for bubble diameters of 1 and 0.5 mm. The strong buoyancy effects on the larger bubble diameter of 2 mm gives significantly higher vertical water velocity in the gap. Outside the stator, the tangential component is small in comparison to the radial component; not presented here.
The comparison shows some deviations between experimental and CFD results due to the existence of multi-size bubbles in the experimental work, while in CFD work a mono-size of the bubbles has been applied. Other sources of uncertainty in the CFD model is the model used to evaluate drag on bubbles which is valid only at low volume fraction, whereas in this machines regions of volume fraction as high as 100% exist. Notwithstanding the deviations between CFD and experimental data, and considering the complexity of such a flow, the agreement between CFD results and experimental data is deemed good; which lends strong support for the validity of the CFD model.
Figure 8.
(a) Normalized water superficial radial velocity on a vertical line r = 0.28 m in the gap between the rotor and stator; (b) normalized water superficial radial velocity on a vertical line at radial distance 25.4 mm from the stator ring; and (c) normalized water superficial radial velocity on a vertical line at radial distance 152.4 mm from the stator ring.
Figure 9.
(a) Normalized water superficial tangential velocity on a vertical line r = 0.28 m in the gap between the rotor and the stator and (b) normalized water superficial vertical velocity on a vertical line r = 0.28 m in the gap between the rotor and the stator.
Figure 9.
(a) Normalized water superficial tangential velocity on a vertical line r = 0.28 m in the gap between the rotor and the stator and (b) normalized water superficial vertical velocity on a vertical line r = 0.28 m in the gap between the rotor and the stator.
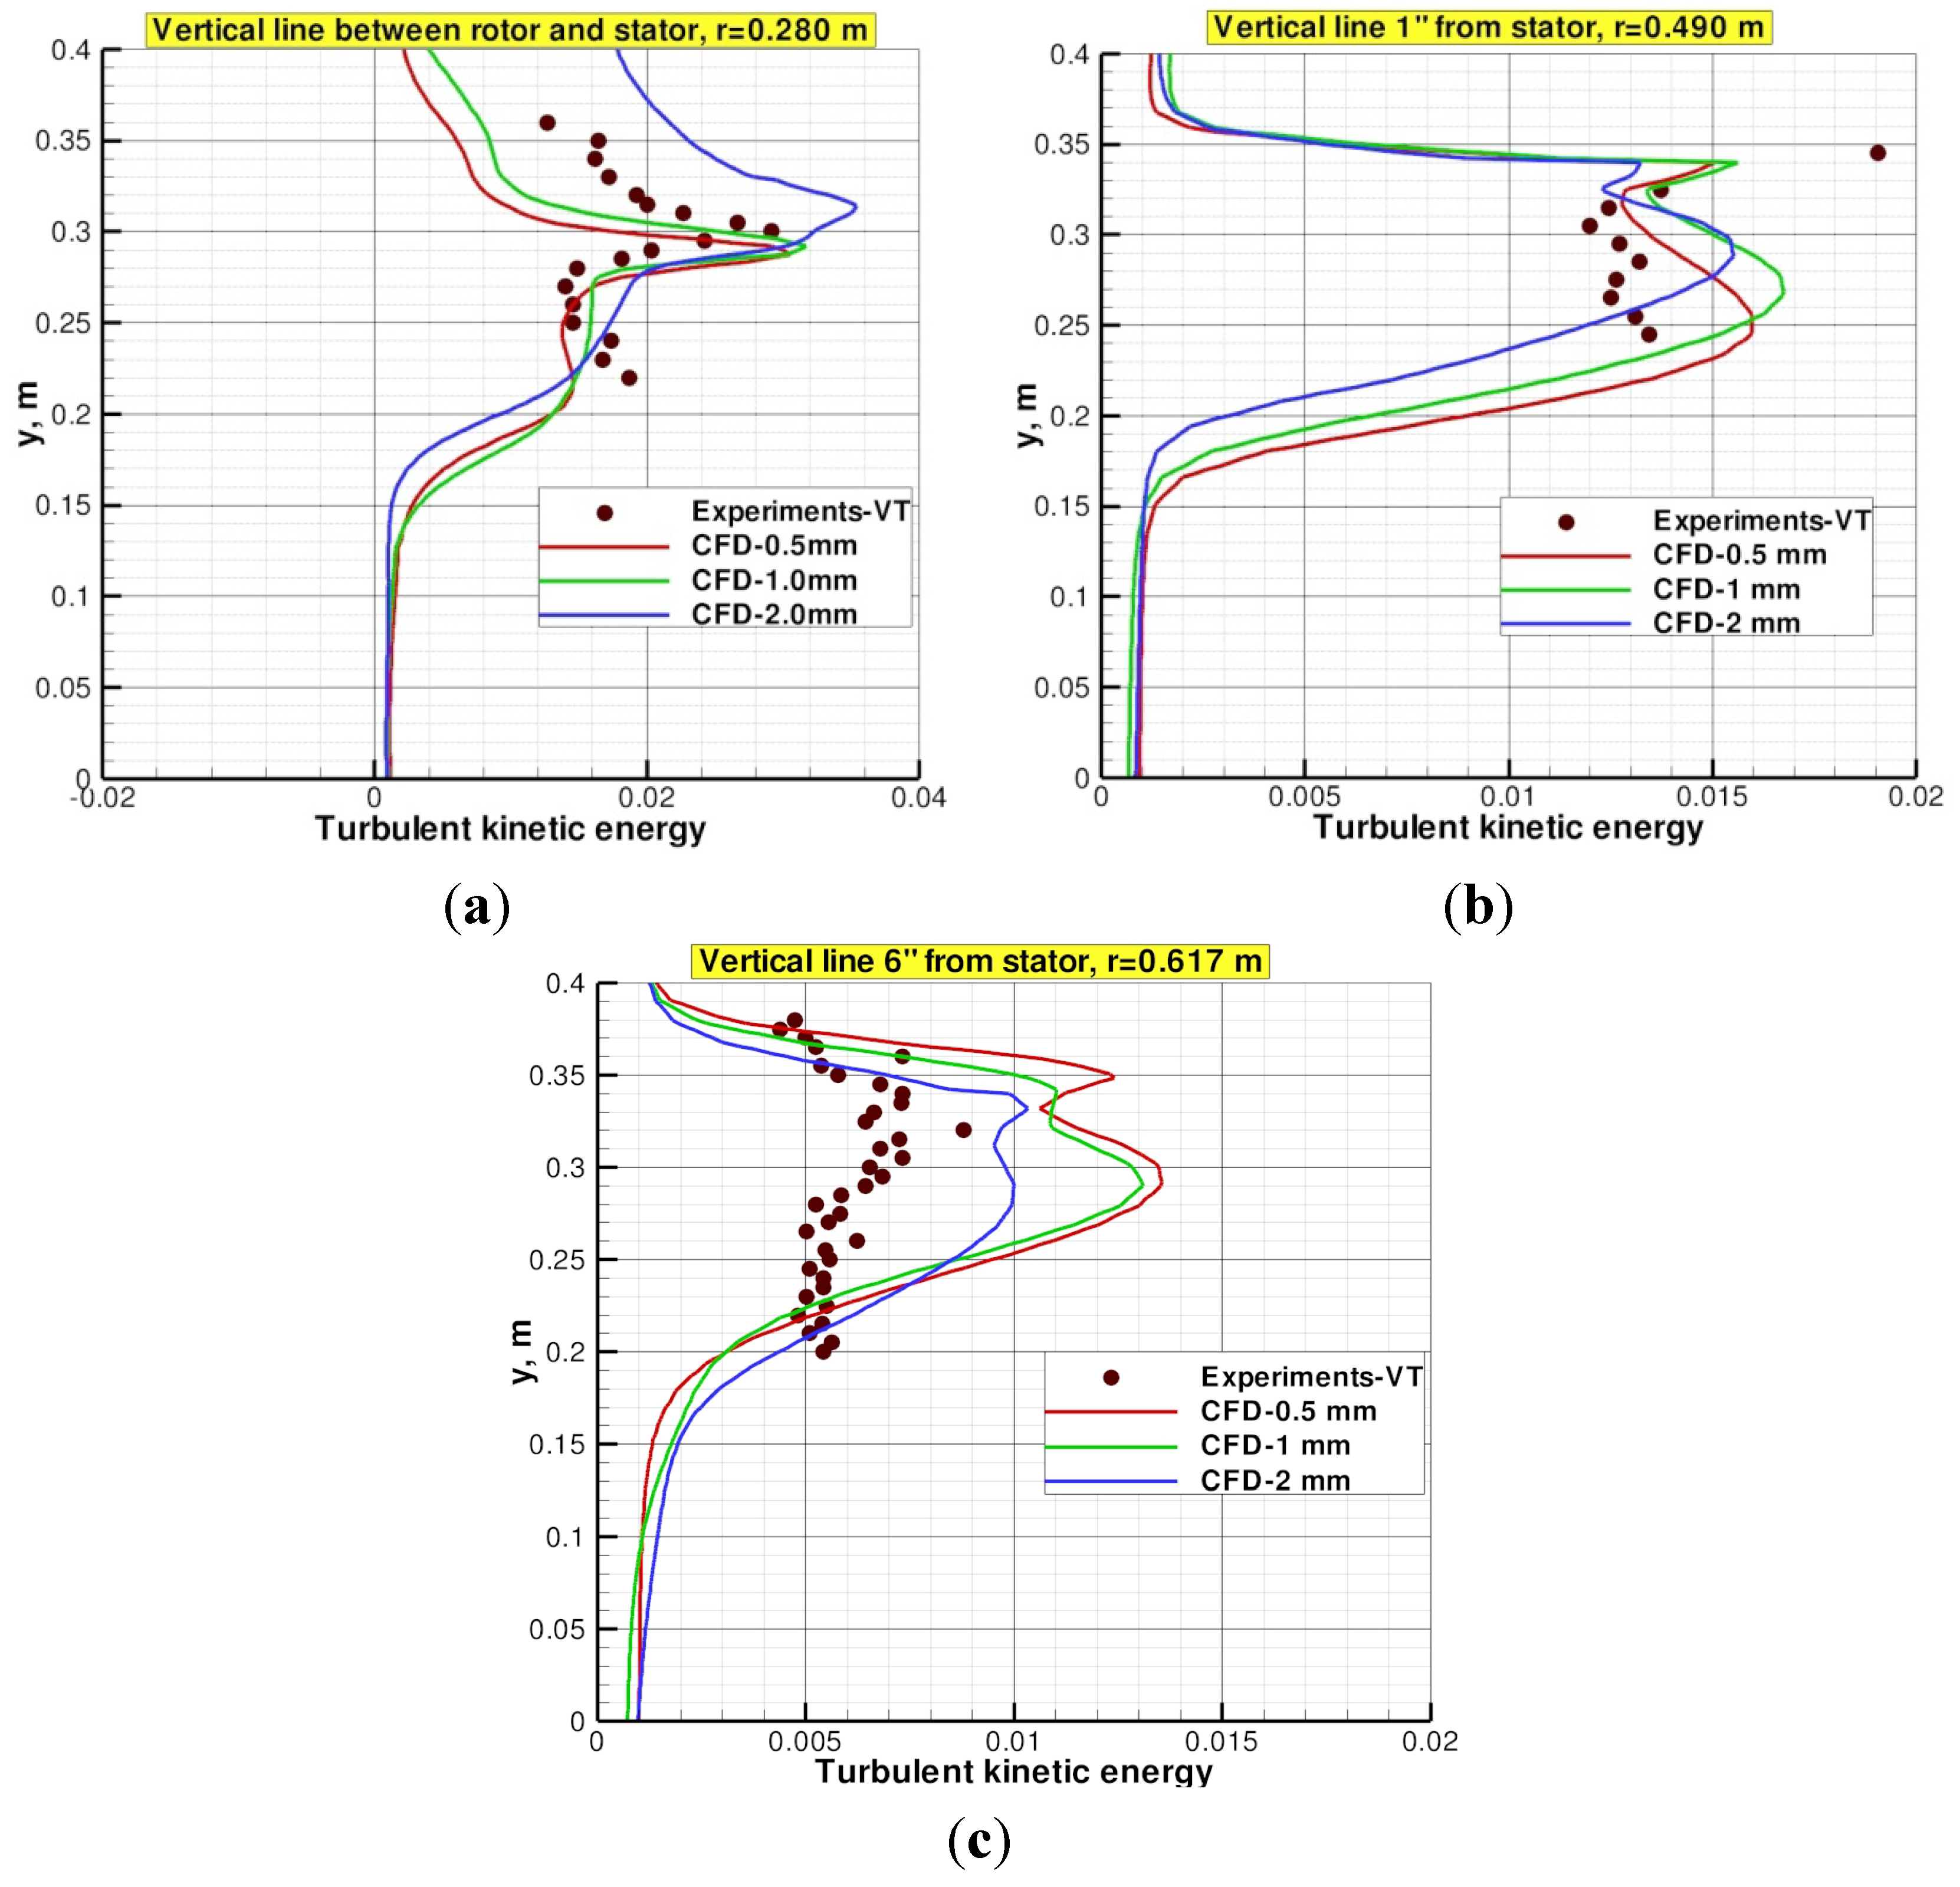
Figure 10 shows a comparison between CFD and experiments [
15,
16] for turbulent kinetic energy (TKE) normalized by the square of the rotor tip speed (
U2) in different regions in Dorr-Oliver 6 m
3 pilot cell. High levels of turbulent kinetic energy are predicted in the gap between rotor and stator. The high levels are localized in the high speed jets out of the rotor. As the jets impinge on stator blades, they break up into smaller jets downstream of the stator resulting in a more uniform distribution of turbulent kinetic energy but over a larger volume. Very good agreement is obtained for bubble diameter (
Db) of 1.0 mm in the gap between rotor and stator. In addition, good agreement is obtained immediately downstream of the stator, but there is significant differences in the region far from the stator. As mentioned earlier the bubble size distribution in the experiments could cause these deviations, and also the turbulence model utilized with the RANS equations in the CFD model does not account for bubble induced turbulence, its importance is noted by Van den Akker [
13]. Generally, turbulence in the continuous phase may be generated by shear due to large-scale velocity gradient as well as by the presence and relative motion of the dispersed phase. In addition, the dispersed phase may exhibit a turbulent flow behavior in response to the turbulent motions of the continuous phase. Another source of uncertainties in the CFD results is the fact that in unsteady RANS simulations there is no clear-cut distinction between time scales, some scales are treated by the turbulence models, and others are resolved by the averaged equations. There are also uncertainties in the experimental data. The CFD results are encouraging; however, further improvements in turbulence modeling for multiphase flow are needed. Further validation for single phase flow is presented in the appendix.
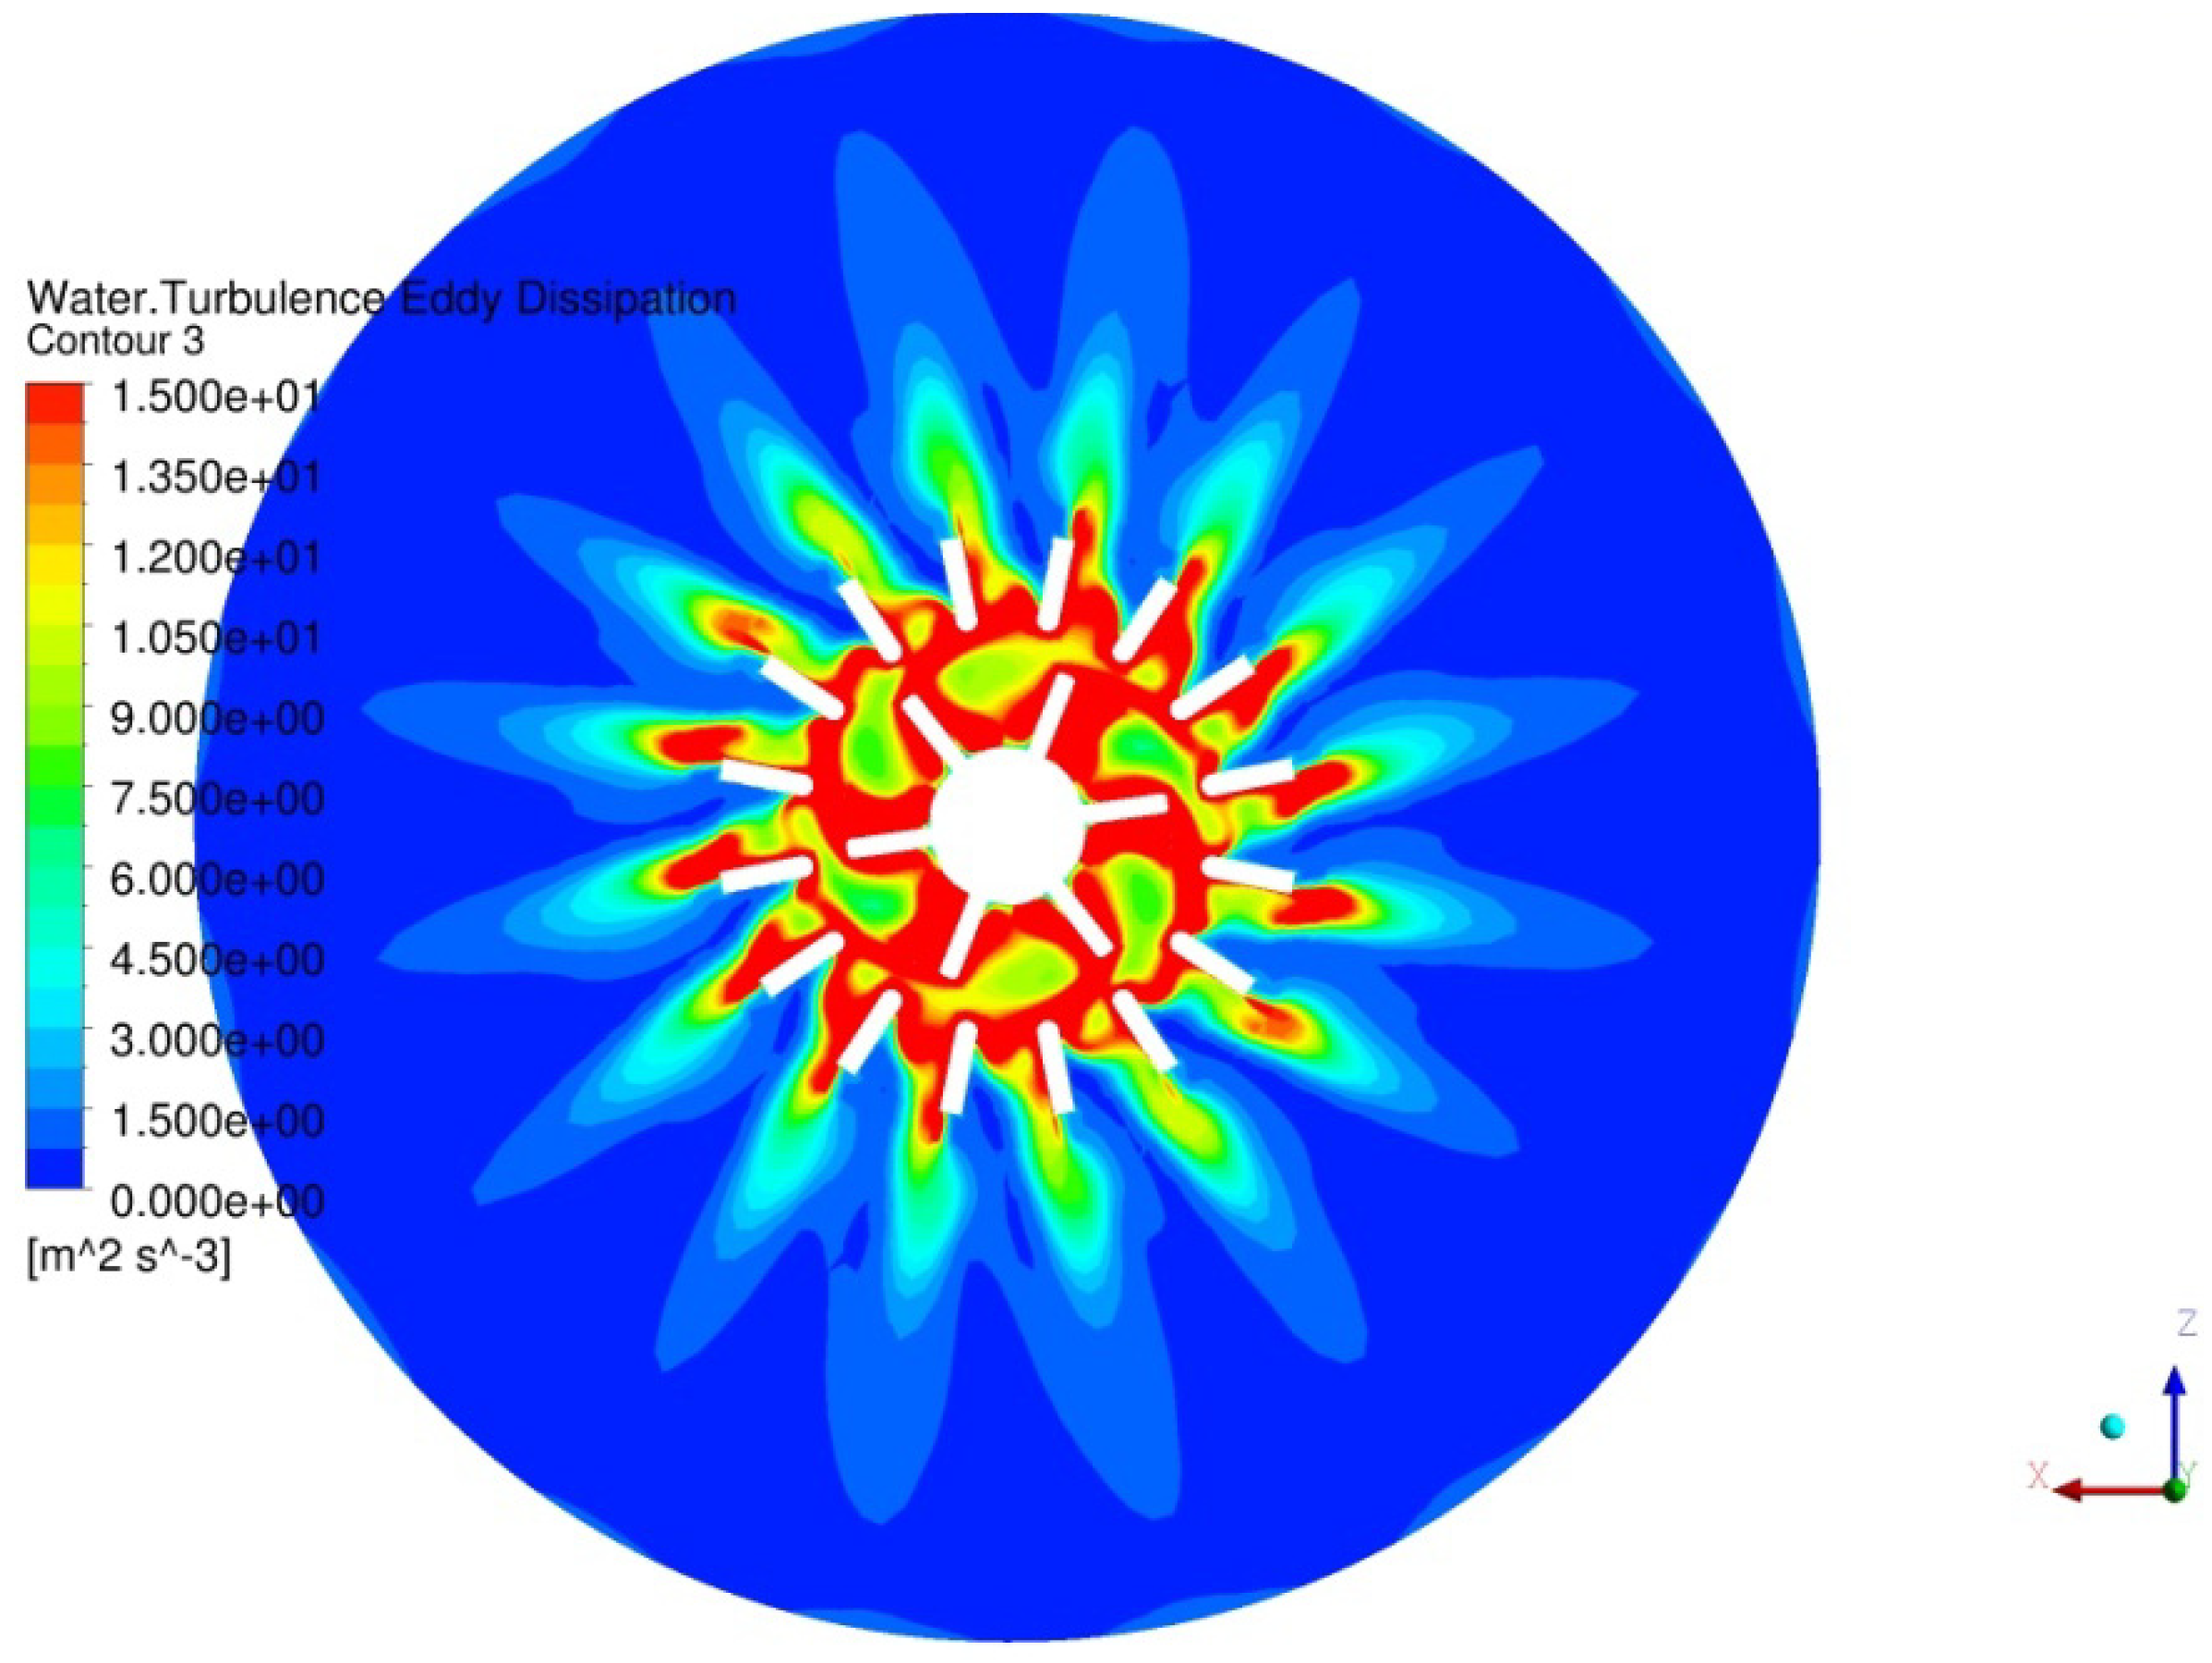
Figure 11 shows contours of the turbulent kinetic energy dissipation rate (ε) in a horizontal plane passing through the rotor, stator and the tank at the jets maximum velocity. TKE dissipation rate are maximum in the regions between rotor and stator and between stator blades. Ragab and Fayed [
3] showed that high dissipation rate has favorable effects on collisions frequency of particles and bubbles in the regions between rotor and stator blades. Nevertheless, high dissipation rate has also adverse effects on the attachment probability in these regions.
Figure 10.
(a) Normalized TKE on a vertical line r = 0.28 m in the gap between the rotor and the stator; (b) normalized TKE along vertical line at 25.5 mm from the stator ring in the radial direction; and (c) normalized TKE on a vertical line 152.4 mm from the stator ring in the radial direction.
Figure 10.
(a) Normalized TKE on a vertical line r = 0.28 m in the gap between the rotor and the stator; (b) normalized TKE along vertical line at 25.5 mm from the stator ring in the radial direction; and (c) normalized TKE on a vertical line 152.4 mm from the stator ring in the radial direction.
Figure 11.
Turbulent kinetic energy dissipation rate in a horizontal plane passing through the jets.
Figure 11.
Turbulent kinetic energy dissipation rate in a horizontal plane passing through the jets.
