3.1. Major and Trace Element Data
The major and trace element data for perovskite investigated in this study are listed in
Table 2 and
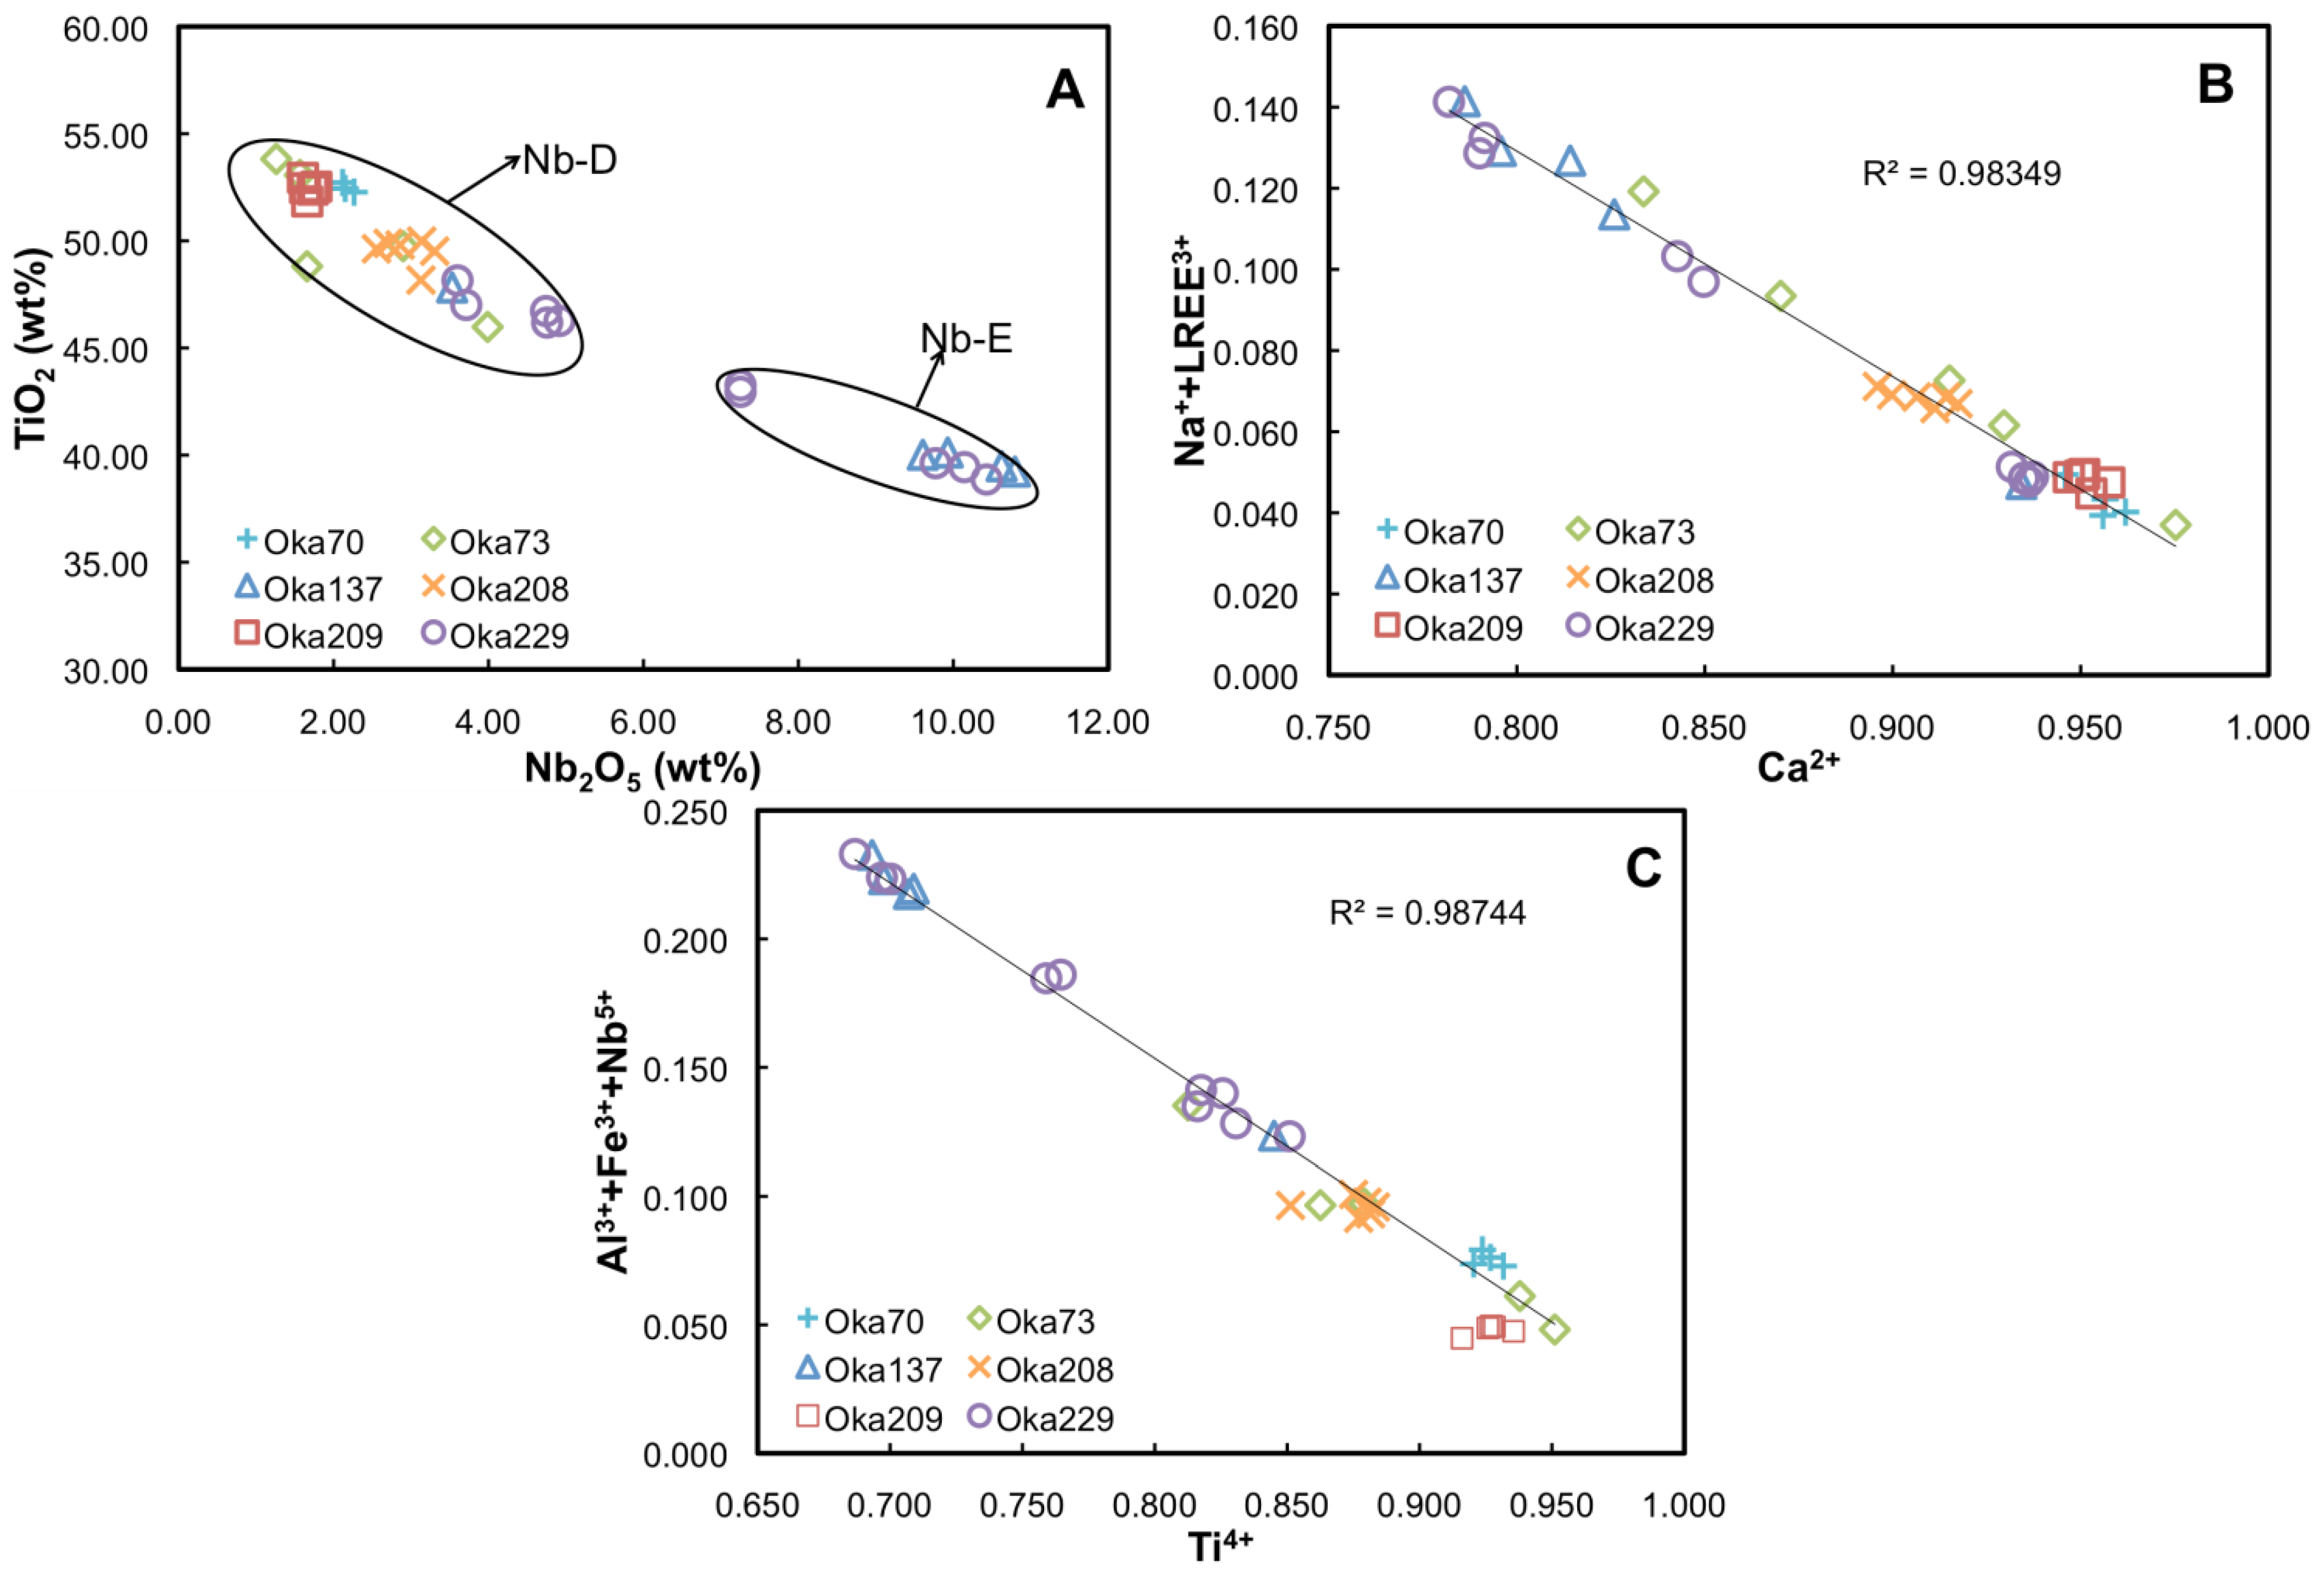
Table 3. In total, >30 chemical analyses of perovskite from okaite (Oka229, Oka137, and Oka208), alnöite (Oka73), and jacupirangite (Oka70) were obtained. Based on their major element compositions, the data for perovskite plot into two groups, in particular relative to their Nb
2O
5 wt % abundances (
Figure 4A). One group (Nb-E: Nb-enriched) contains high Nb
2O
5 contents (between 7.25 and 10.80 wt %), whereas the other (Nb-D: Nb-depleted) is characterized by lower Nb
2O
5 abundances (between 1.56 and 4.92 wt %).
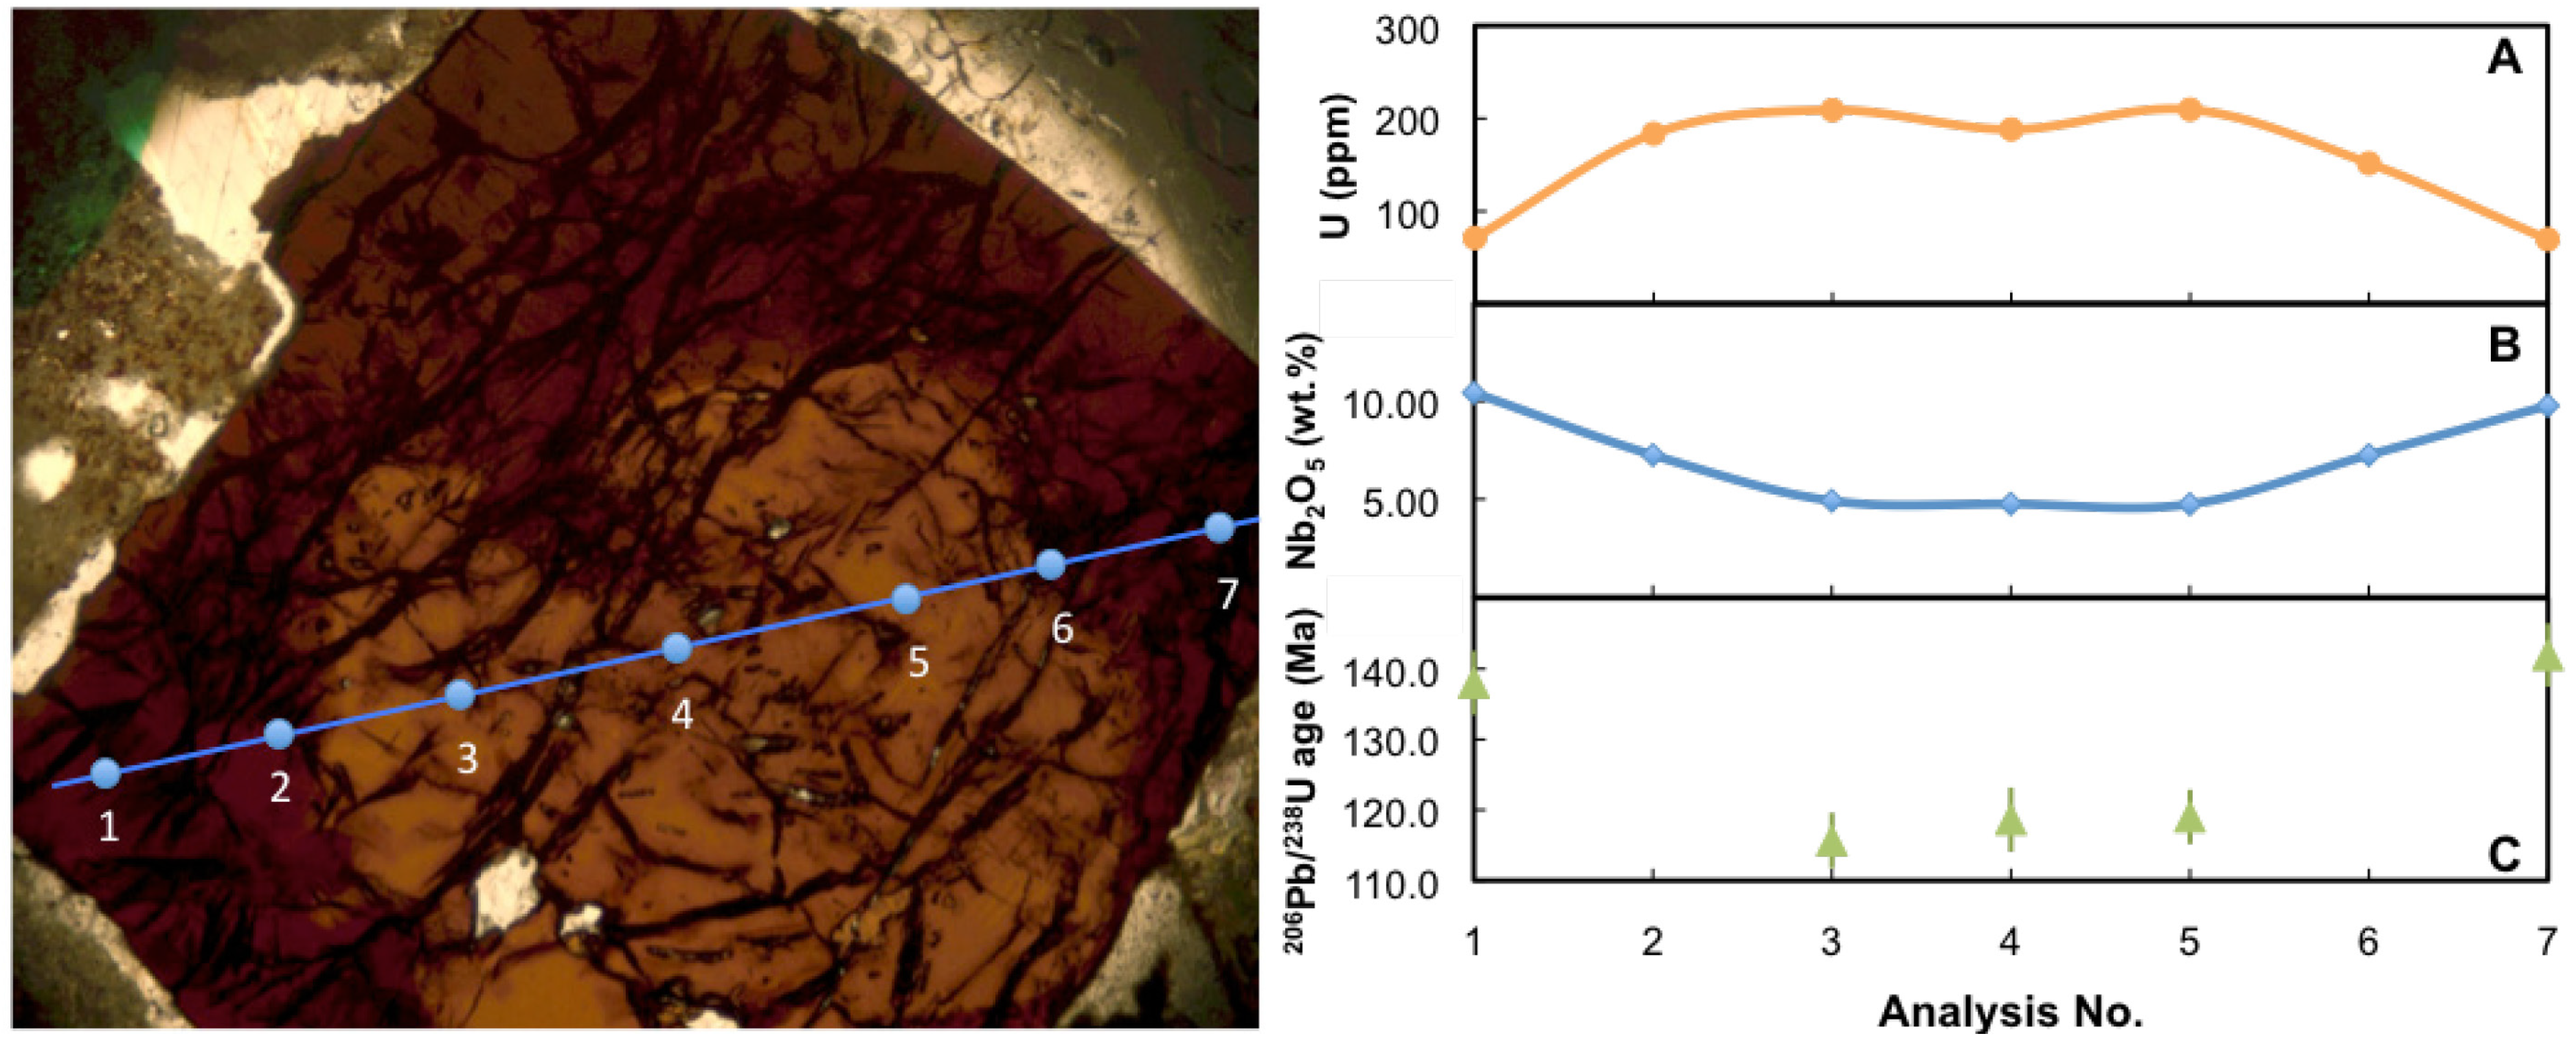
Table 2 shows that perovskite from both alnöite and jacupirangite belongs to the Nb-D group, whereas compositions for those from okaite are variable. Of importance, both Nb-E and Nb-D types of perovskite are present within individual samples (
i.e., Oka137 and Oka229) and even within singular zoned grains (e.g.,
Figure 5; in total two well-zoned grains have been identified). For example, the zoned perovskite grain shown in
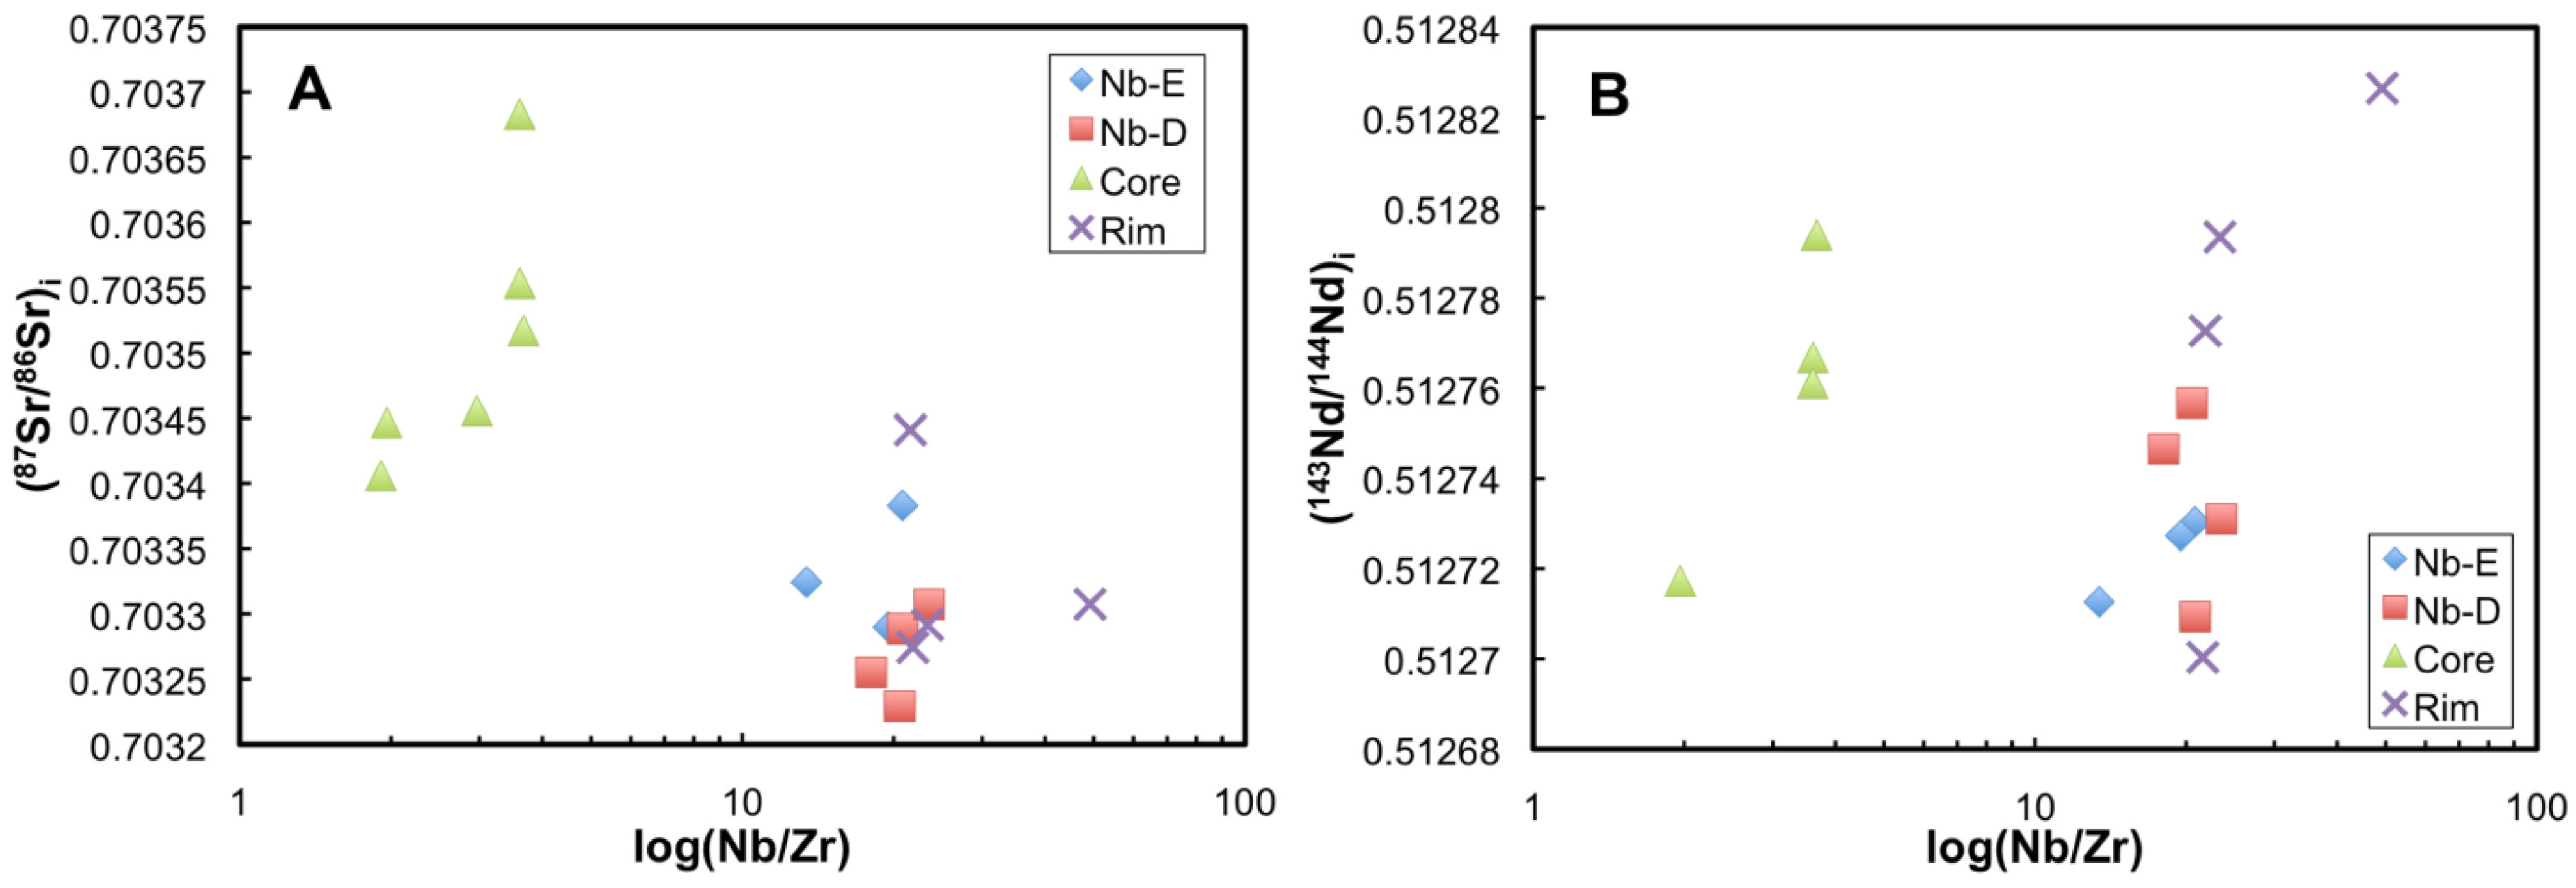
Figure 5 has a rim that consists of a Nb-E composition, whereas the central area is characterized by the Nb-D component. In general, Nb-E perovskite is characterized by high contents of Na, Al, Fe, Sr, Ta and REEs (
Figure 4B,C;
Table 2 and
Table 3). The composition for the Nb-E perovskite is not that of the ideal end-member, but can be described by involving components of lueshite (NaNbO
3), latrappite (CaNb
0.5Fe
0.5O
3), and (LREE)FeO
3 (light REEs), which form by elemental substitutions into the structure at both Ca and Ti sites [
53,
54]. Molar percentages of different perovskite endmembers are also listed in
Table 2. The most significant substituents in the Ca site are REEs and Na (
Figure 4B), which comprise up to 8.70 mol % of the (LREE)FeO
3 component in some Nb-E perovskite (
Table 2). Another example is the coupled substitution between Ti and Nb + Fe
3+ or Nb + Al, which accounts for up to 10.96 mol % of CaNb
0.5Fe
0.5O
3 (latrappite) or CaNb
0.5Al
0.5O
3 (
Figure 4C;
Table 2).
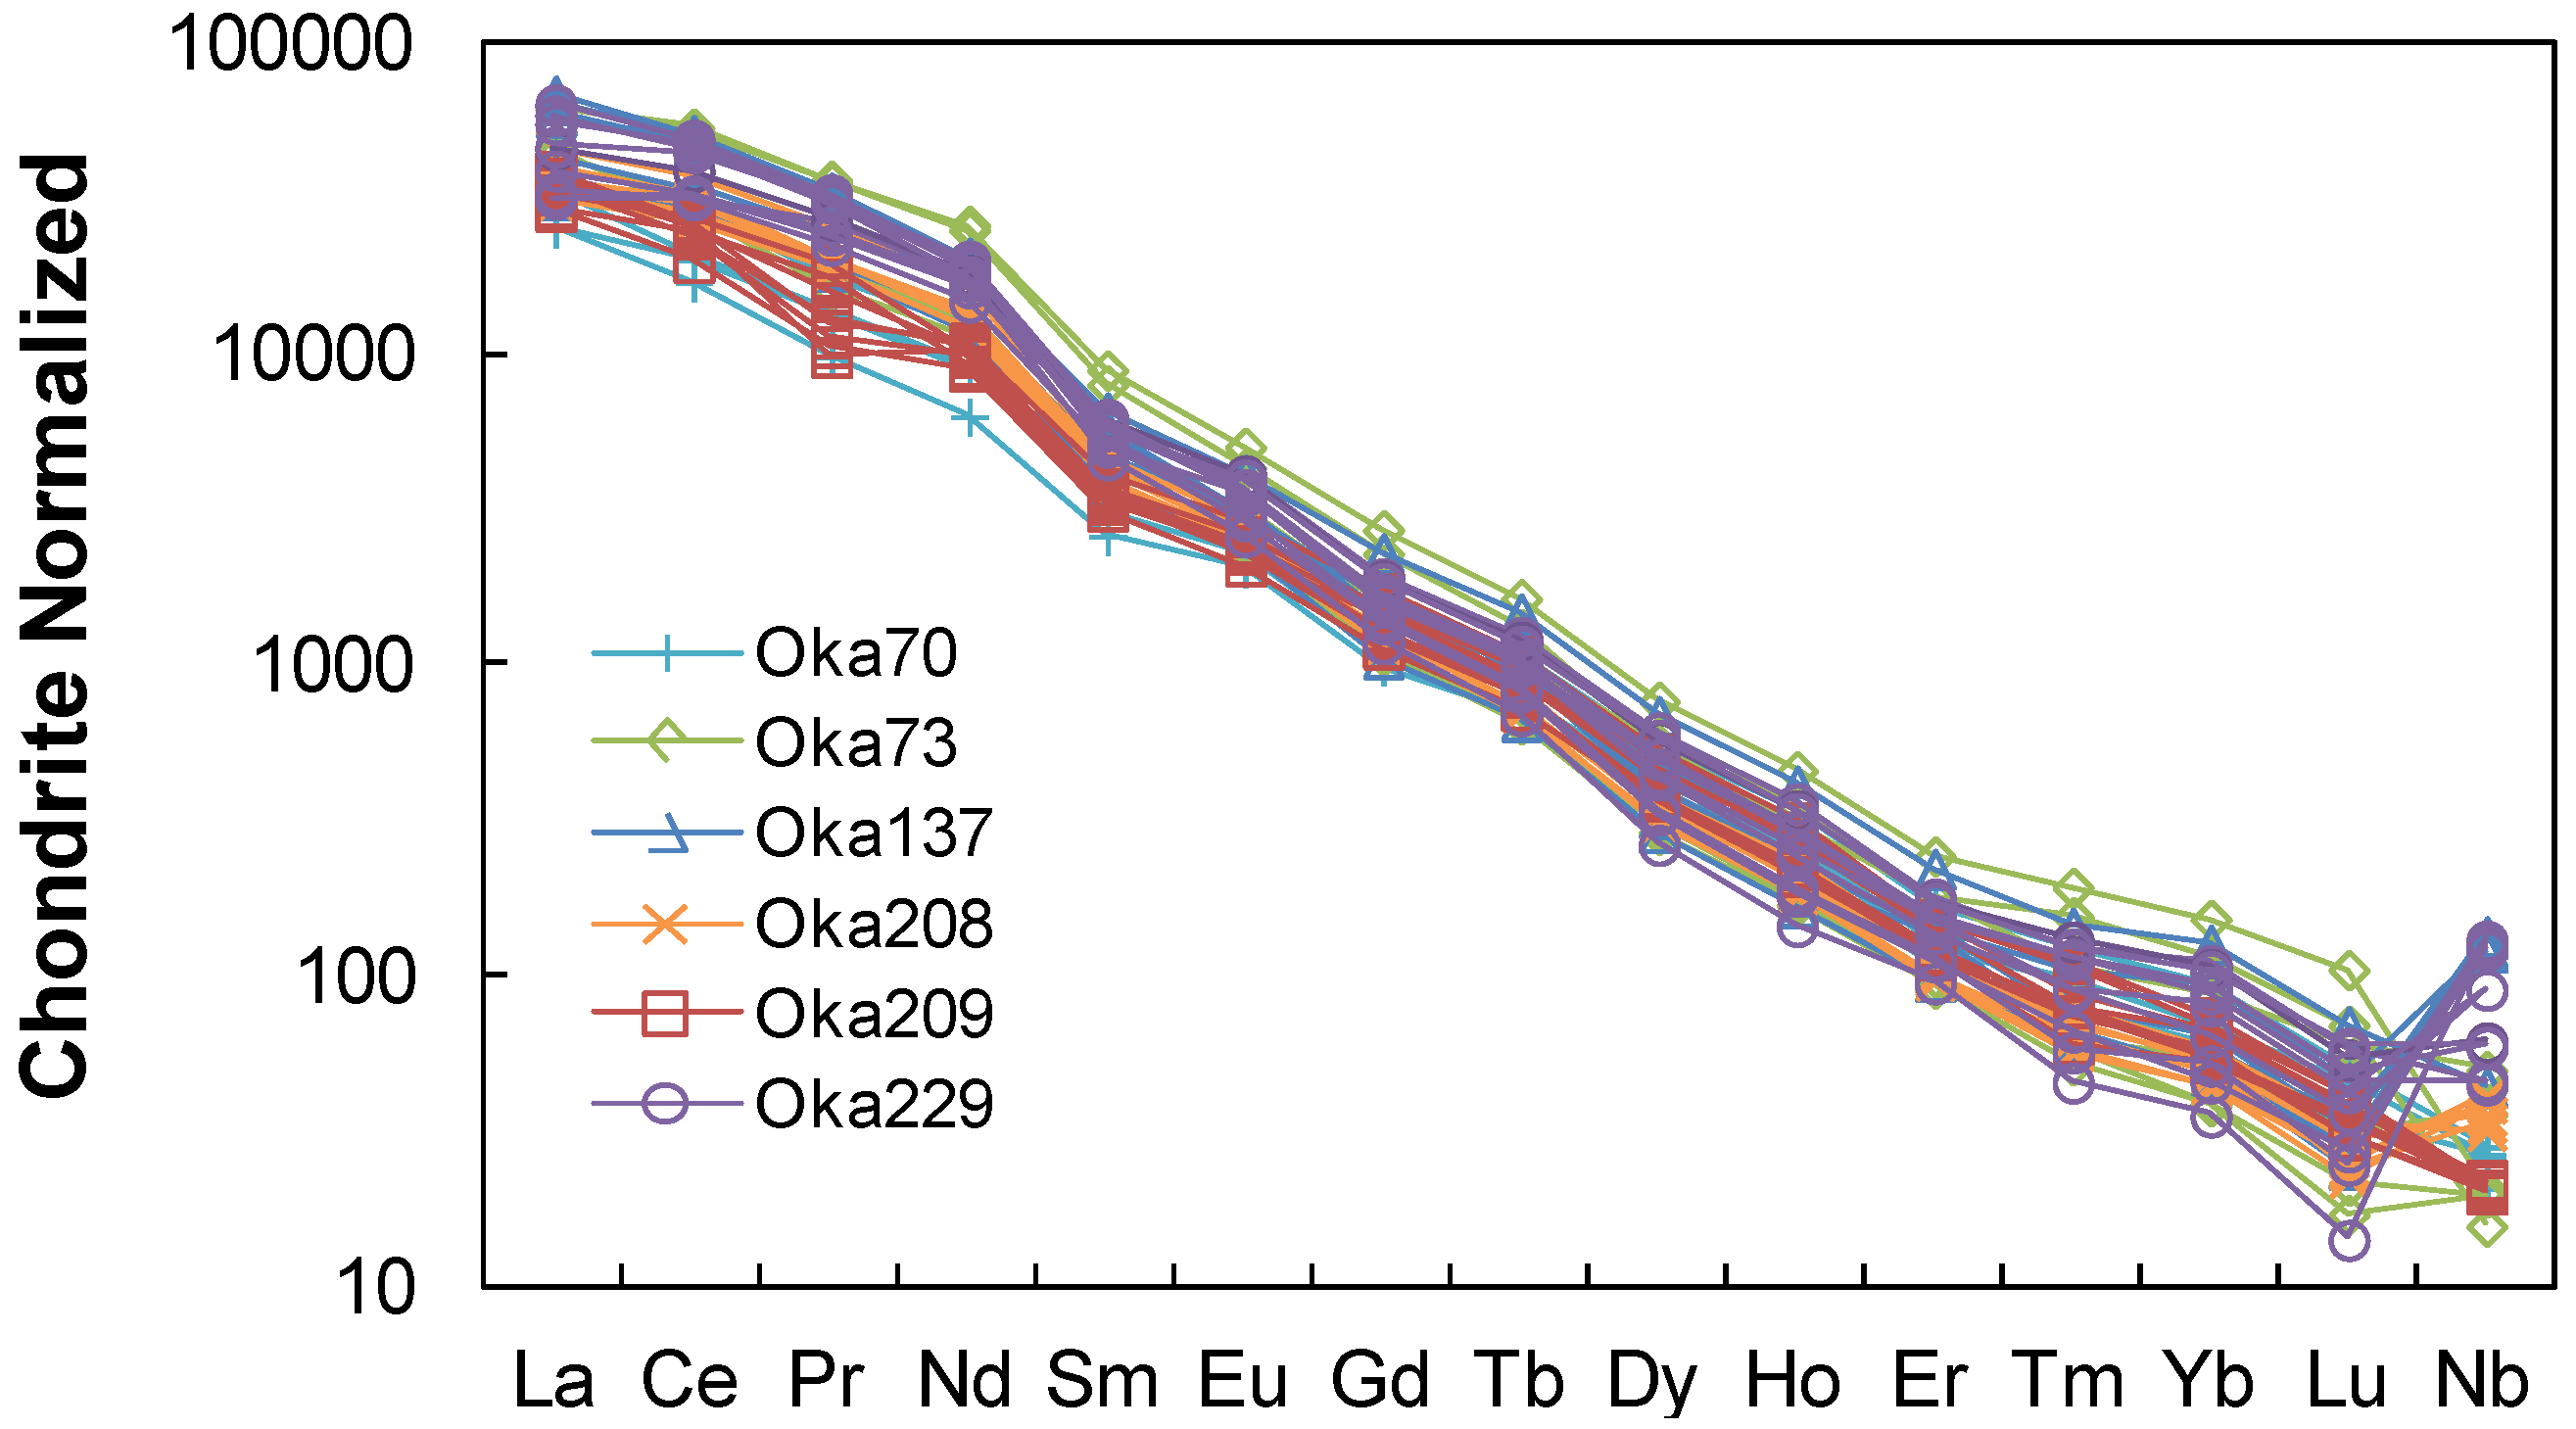
The total REE budget for perovskite is dominated by the light REEs (LREEs;
i.e., La, Ce, Pr, Nd) abundances with (La/Yb)
CN ratios that vary between 364 and 1652 (
Table 3), and as illustrated by the pronounced, negatively-sloped chondrite-normalized REE patterns (
Figure 6). Pb and Th abundances for perovskite both define negative correlations with Ca contents and suggest their substitution within the same Ca site (
Figure 7A,B); in contrast, U abundances do not show any covariance with Ca contents (not shown). Of note, some elements are reported for both EMP and LA-ICP-MS analysis (e.g., LREEs). For example, the relative difference in the measured abundances of Pr obtained by these two methods is ~10%.
Table 2.
Major element compositions of perovskite from the Oka complex.
Table 2.
Major element compositions of perovskite from the Oka complex.
| Sample | Oka70 (Jacupirangite) | Oka73 (Alnoite) | |
|---|
| PV1 | PV2 | PV3 | PV4 | PV3 | PV4 | PV7 | PV8 | PV9 | |
|---|
| Nb2O5 | 2.15 | 2.12 | 2.26 | 1.67 | 2.90 | 1.66 | 1.56 | 3.99 | 1.26 | |
| Ta2O5 | 0.01 | 0.00 | 0.18 | 0.05 | 0.10 | 0.43 | 0.15 | 0.14 | 0.07 | |
| SiO2 | 0.01 | 0.00 | 0.01 | 0.01 | 0.00 | 0.00 | 0.00 | 0.00 | 0.00 | |
| TiO2 | 52.45 | 52.72 | 52.27 | 52.09 | 49.75 | 48.81 | 53.07 | 45.98 | 53.82 | |
| ZrO2 | 0.07 | 0.08 | 0.06 | 0.05 | 0.25 | 0.06 | 0.02 | 0.28 | 0.14 | |
| Al2O3 | 0.40 | 0.40 | 0.43 | 0.48 | 0.48 | 0.54 | 0.37 | 0.52 | 0.21 | |
| Fe2O3 | 2.66 | 2.48 | 2.72 | 2.68 | 3.34 | 4.03 | 2.16 | 4.94 | 1.82 | |
| La2O3 | 0.85 | 0.90 | 0.93 | 0.88 | 1.72 | 2.08 | 1.33 | 2.32 | 0.93 | |
| Ce2O3 | 1.49 | 1.46 | 2.04 | 1.82 | 3.19 | 4.48 | 2.70 | 5.24 | 1.52 | |
| Pr2O3 | 0.12 | 0.13 | 0.22 | 0.23 | 0.39 | 0.50 | 0.22 | 0.54 | 0.14 | |
| Nd2O3 | 0.42 | 0.50 | 0.65 | 0.61 | 0.98 | 1.72 | 0.93 | 1.88 | 0.45 | |
| Sm2O3 | 0.09 | 0.04 | 0.08 | 0.06 | 0.16 | 0.09 | 0.00 | 0.19 | 0.05 | |
| CaO | 37.98 | 38.22 | 37.58 | 38.01 | 36.36 | 34.58 | 36.94 | 33.13 | 38.75 | |
| SrO | 0.52 | 0.54 | 0.48 | 0.49 | 0.38 | 0.25 | 0.43 | 0.39 | 0.40 | |
| Na2O | 0.31 | 0.31 | 0.35 | 0.28 | 0.38 | 0.38 | 0.38 | 0.70 | 0.23 | |
| Total | 99.01 | 99.43 | 99.74 | 98.87 | 99.74 | 98.83 | 99.84 | 99.29 | 99.43 | |
| Structural formulae | |
| Nb5+ | 0.023 | 0.022 | 0.024 | 0.018 | 0.031 | 0.018 | 0.017 | 0.042 | 0.013 | |
| Ta5+ | 0.000 | 0.000 | 0.001 | 0.000 | 0.001 | 0.003 | 0.001 | 0.001 | 0.000 | |
| Si4+ | 0.000 | 0.000 | 0.000 | 0.000 | 0.000 | 0.000 | 0.000 | 0.000 | 0.000 | |
| Ti4+ | 0.925 | 0.929 | 0.922 | 0.918 | 0.877 | 0.861 | 0.936 | 0.811 | 0.949 | |
| Zr4+ | 0.000 | 0.000 | 0.000 | 0.000 | 0.001 | 0.000 | 0.000 | 0.002 | 0.001 | |
| Al3+ | 0.011 | 0.011 | 0.012 | 0.013 | 0.013 | 0.015 | 0.010 | 0.014 | 0.006 | |
| Fe3+ | 0.047 | 0.044 | 0.048 | 0.047 | 0.059 | 0.071 | 0.038 | 0.087 | 0.032 | |
| La3+ | 0.007 | 0.008 | 0.008 | 0.008 | 0.015 | 0.018 | 0.011 | 0.020 | 0.008 | |
| Ce3+ | 0.013 | 0.013 | 0.018 | 0.016 | 0.027 | 0.038 | 0.023 | 0.045 | 0.013 | |
| Pr3+ | 0.001 | 0.001 | 0.002 | 0.002 | 0.003 | 0.004 | 0.002 | 0.005 | 0.001 | |
| Nd3+ | 0.004 | 0.004 | 0.005 | 0.005 | 0.008 | 0.014 | 0.008 | 0.016 | 0.004 | |
| Sm3+ | 0.001 | 0.000 | 0.001 | 0.000 | 0.001 | 0.001 | 0.000 | 0.002 | 0.000 | |
| Ca2+ | 0.954 | 0.960 | 0.944 | 0.954 | 0.913 | 0.868 | 0.927 | 0.832 | 0.973 | |
| Sr2+ | 0.007 | 0.007 | 0.007 | 0.007 | 0.005 | 0.003 | 0.006 | 0.005 | 0.005 | |
| Na+ | 0.014 | 0.014 | 0.016 | 0.013 | 0.017 | 0.017 | 0.017 | 0.032 | 0.011 | |
| mol % of the endmembers | |
| CaTiO3 | 93.68 | 93.63 | 93.00 | 93.25 | 89.46 | 89.62 | 93.79 | 85.43 | 94.84 | |
| CaNb0.5(Fe,Al)0.5O3 | 2.89 | 3.00 | 2.18 | 3.61 | 3.51 | 0.75 | 0.00 | 2.06 | 2.33 | |
| NaNbO3 | 0.86 | 0.76 | 1.44 | 0.01 | 1.44 | 1.73 | 1.73 | 3.36 | 0.21 | |
| (LREE)FeO3 | 2.57 | 2.61 | 3.37 | 3.12 | 5.59 | 7.89 | 4.48 | 9.15 | 2.62 | |
| Sample | Oka229 (Okaite) |
| PV1 | PV1_2 | PV2_1 | PV2_2 | PV2_3 | PV2_4 | PV2_5 | PV2_6 | PV2_7 | PV2_8 |
| | Rim | Core | Core | Core | Rim | Rim | | |
| Nb2O5 | 3.71 | 3.60 | 10.43 | 4.92 | 4.76 | 4.74 | 9.77 | 10.14 | 7.25 | 7.25 |
| Ta2O5 | 0.31 | 0.17 | 0.80 | 0.17 | 0.20 | 0.21 | 0.92 | 0.90 | 0.38 | 0.43 |
| SiO2 | 0.00 | 0.00 | 0.17 | 0.00 | 0.02 | 0.05 | 0.12 | 0.04 | 0.02 | 0.05 |
| TiO2 | 47.01 | 48.15 | 38.86 | 46.26 | 46.18 | 46.72 | 39.62 | 39.44 | 42.95 | 43.26 |
| ZrO2 | 1.35 | 0.98 | 0.35 | 0.90 | 0.81 | 0.83 | 0.34 | 0.21 | 0.34 | 0.39 |
| Al2O3 | 0.74 | 0.75 | 0.87 | 0.73 | 0.70 | 0.74 | 0.85 | 0.74 | 0.86 | 0.77 |
| Fe2O3 | 4.30 | 4.04 | 6.18 | 4.33 | 4.09 | 4.35 | 6.04 | 6.02 | 5.26 | 5.51 |
| La2O3 | 1.02 | 1.03 | 2.33 | 1.23 | 1.18 | 1.07 | 2.35 | 2.41 | 1.94 | 1.67 |
| Ce2O3 | 2.71 | 2.65 | 4.64 | 2.72 | 2.55 | 2.65 | 4.75 | 4.94 | 4.27 | 4.17 |
| Pr2O3 | 0.29 | 0.27 | 0.46 | 0.34 | 0.22 | 0.24 | 0.44 | 0.45 | 0.46 | 0.46 |
| Nd2O3 | 1.11 | 1.12 | 1.38 | 0.97 | 0.99 | 0.95 | 1.44 | 1.46 | 1.41 | 1.42 |
| Sm2O3 | 0.15 | 0.16 | 0.08 | 0.15 | 0.07 | 0.04 | 0.16 | 0.11 | 0.14 | 0.14 |
| CaO | 37.15 | 37.24 | 31.39 | 37.02 | 37.15 | 37.20 | 31.45 | 31.07 | 33.48 | 33.76 |
| SrO | 0.22 | 0.22 | 0.52 | 0.22 | 0.20 | 0.21 | 0.52 | 0.57 | 0.44 | 0.40 |
| Na2O | 0.08 | 0.09 | 1.15 | 0.11 | 0.12 | 0.12 | 1.18 | 1.34 | 0.72 | 0.65 |
| Total | 99.32 | 99.71 | 98.44 | 99.24 | 98.45 | 99.29 | 98.81 | 98.68 | 98.93 | 99.29 |
| Structural formulae |
| Nb5+ | 0.039 | 0.038 | 0.110 | 0.052 | 0.050 | 0.050 | 0.104 | 0.107 | 0.077 | 0.077 |
| Ta5+ | 0.002 | 0.001 | 0.005 | 0.001 | 0.001 | 0.001 | 0.006 | 0.006 | 0.002 | 0.003 |
| Si4+ | 0.000 | 0.000 | 0.004 | 0.000 | 0.000 | 0.001 | 0.003 | 0.001 | 0.000 | 0.001 |
| Ti4+ | 0.829 | 0.849 | 0.685 | 0.816 | 0.814 | 0.824 | 0.699 | 0.695 | 0.757 | 0.763 |
| Zr4+ | 0.008 | 0.006 | 0.002 | 0.005 | 0.005 | 0.005 | 0.002 | 0.001 | 0.002 | 0.002 |
| Al3+ | 0.020 | 0.021 | 0.024 | 0.020 | 0.019 | 0.020 | 0.023 | 0.020 | 0.024 | 0.021 |
| Fe3+ | 0.076 | 0.071 | 0.109 | 0.076 | 0.072 | 0.077 | 0.107 | 0.106 | 0.093 | 0.097 |
| La3+ | 0.009 | 0.009 | 0.020 | 0.011 | 0.010 | 0.009 | 0.020 | 0.021 | 0.017 | 0.014 |
| Ce3+ | 0.023 | 0.023 | 0.040 | 0.023 | 0.022 | 0.023 | 0.041 | 0.042 | 0.037 | 0.036 |
| Pr3+ | 0.002 | 0.002 | 0.004 | 0.003 | 0.002 | 0.002 | 0.004 | 0.004 | 0.004 | 0.004 |
| Nd3+ | 0.009 | 0.009 | 0.012 | 0.008 | 0.008 | 0.008 | 0.012 | 0.012 | 0.012 | 0.012 |
| Sm3+ | 0.001 | 0.001 | 0.001 | 0.001 | 0.001 | 0.000 | 0.001 | 0.001 | 0.001 | 0.001 |
| Ca2+ | 0.933 | 0.935 | 0.788 | 0.930 | 0.933 | 0.934 | 0.790 | 0.780 | 0.841 | 0.848 |
| Sr2+ | 0.003 | 0.003 | 0.007 | 0.003 | 0.003 | 0.003 | 0.007 | 0.008 | 0.006 | 0.005 |
| Na+ | 0.004 | 0.004 | 0.052 | 0.005 | 0.006 | 0.005 | 0.054 | 0.061 | 0.033 | 0.030 |
| mol % of the endmembers |
| CaTiO3 | 86.76 | 87.41 | 75.41 | 84.58 | 85.14 | 85.08 | 76.31 | 75.71 | 80.48 | 81.12 |
| CaNb0.5(Fe,Al)0.5O3 | 8.57 | 8.03 | 10.59 | 10.96 | 10.74 | 10.58 | 9.36 | 8.99 | 8.60 | 8.64 |
| NaNbO3 | 0.00 | 0.00 | 5.70 | 0.00 | 0.00 | 0.00 | 5.85 | 6.61 | 3.47 | 3.14 |
| (LREE)FeO3 | 4.67 | 4.56 | 8.30 | 4.46 | 4.13 | 4.34 | 8.48 | 8.70 | 7.45 | 7.11 |
| Sample | Oka137 (Okaite) | Oka209 (Okaite) |
| PV1_1 | PV1_2 | PV3 | PV4 | PV5 | PV2 | PV3_1 | PV3_2 | PV4 | PV5 |
| Core | Rim | | | | | | | | |
| Nb2O5 | 3.53 | 10.80 | 10.62 | 9.61 | 9.93 | 1.63 | 1.78 | 1.60 | 1.73 | 1.66 |
| Ta2O5 | 0.28 | 1.02 | 0.87 | 0.76 | 0.67 | 0.06 | 0.14 | 0.02 | 0.04 | 0.04 |
| SiO2 | 0.01 | 0.00 | 0.00 | 0.01 | 0.00 | 0.00 | 0.01 | 0.00 | 0.00 | 0.00 |
| TiO2 | 47.82 | 39.23 | 39.48 | 40.01 | 40.12 | 52.46 | 52.53 | 52.94 | 52.39 | 51.84 |
| ZrO2 | 0.99 | 0.19 | 0.40 | 0.40 | 0.42 | 0.07 | 0.06 | 0.03 | 0.08 | 0.07 |
| Al2O3 | 0.75 | 0.75 | 0.74 | 0.84 | 0.73 | 0.42 | 0.44 | 0.41 | 0.46 | 0.48 |
| Fe2O3 | 4.09 | 6.11 | 5.65 | 5.80 | 5.90 | 2.40 | 2.54 | 2.36 | 2.37 | 2.69 |
| La2O3 | 0.92 | 2.46 | 2.03 | 1.93 | 2.14 | 1.18 | 1.15 | 1.16 | 1.20 | 0.91 |
| Ce2O3 | 2.66 | 4.74 | 4.21 | 4.23 | 4.44 | 2.11 | 2.10 | 2.06 | 2.10 | 1.95 |
| Pr2O3 | 0.32 | 0.43 | 0.45 | 0.40 | 0.43 | 0.17 | 0.20 | 0.12 | 0.15 | 0.21 |
| Nd2O3 | 1.05 | 1.42 | 1.30 | 1.32 | 1.34 | 0.72 | 0.64 | 0.65 | 0.67 | 0.56 |
| Sm2O3 | 0.08 | 0.09 | 0.11 | 0.02 | 0.08 | 0.07 | 0.06 | 0.09 | 0.01 | 0.03 |
| CaO | 37.12 | 31.24 | 31.62 | 32.82 | 32.35 | 37.79 | 37.75 | 38.05 | 37.62 | 37.86 |
| SrO | 0.20 | 0.56 | 0.51 | 0.48 | 0.51 | 0.44 | 0.52 | 0.47 | 0.47 | 0.47 |
| Na2O | 0.09 | 1.38 | 1.31 | 1.00 | 1.19 | 0.29 | 0.30 | 0.28 | 0.29 | 0.29 |
| Total | 99.14 | 99.24 | 98.23 | 98.52 | 99.12 | 99.35 | 99.71 | 99.79 | 99.15 | 98.55 |
| Structural formulae |
| Nb5+ | 0.037 | 0.114 | 0.113 | 0.102 | 0.105 | 0.017 | 0.019 | 0.017 | 0.018 | 0.018 |
| Ta5+ | 0.002 | 0.006 | 0.006 | 0.005 | 0.004 | 0.000 | 0.001 | 0.000 | 0.000 | 0.000 |
| Si4+ | 0.000 | 0.000 | 0.000 | 0.000 | 0.000 | 0.000 | 0.000 | 0.000 | 0.000 | 0.000 |
| Ti4+ | 0.843 | 0.692 | 0.696 | 0.705 | 0.707 | 0.925 | 0.926 | 0.933 | 0.924 | 0.914 |
| Zr4+ | 0.006 | 0.001 | 0.002 | 0.002 | 0.002 | 0.000 | 0.000 | 0.000 | 0.000 | 0.000 |
| Al3+ | 0.021 | 0.021 | 0.020 | 0.023 | 0.020 | 0.012 | 0.012 | 0.011 | 0.013 | 0.013 |
| Fe3+ | 0.072 | 0.108 | 0.100 | 0.102 | 0.104 | 0.042 | 0.045 | 0.042 | 0.042 | 0.047 |
| La3+ | 0.008 | 0.021 | 0.018 | 0.017 | 0.018 | 0.010 | 0.010 | 0.010 | 0.010 | 0.008 |
| Ce3+ | 0.023 | 0.041 | 0.036 | 0.036 | 0.038 | 0.018 | 0.018 | 0.018 | 0.018 | 0.017 |
| Pr3+ | 0.003 | 0.004 | 0.004 | 0.003 | 0.004 | 0.001 | 0.002 | 0.001 | 0.001 | 0.002 |
| Nd3+ | 0.009 | 0.012 | 0.011 | 0.011 | 0.011 | 0.006 | 0.005 | 0.005 | 0.006 | 0.005 |
| Sm3+ | 0.001 | 0.001 | 0.001 | 0.000 | 0.001 | 0.001 | 0.000 | 0.001 | 0.000 | 0.000 |
| Ca2+ | 0.932 | 0.784 | 0.794 | 0.824 | 0.812 | 0.949 | 0.948 | 0.955 | 0.945 | 0.951 |
| Sr2+ | 0.003 | 0.008 | 0.007 | 0.007 | 0.007 | 0.006 | 0.007 | 0.006 | 0.006 | 0.006 |
| Na+ | 0.004 | 0.063 | 0.060 | 0.046 | 0.054 | 0.013 | 0.014 | 0.013 | 0.013 | 0.013 |
| mol % of the endmembers |
| CaTiO3 | 87.50 | 74.85 | 75.69 | 75.54 | 75.59 | 93.37 | 93.37 | 93.68 | 93.50 | 93.17 |
| CaNb0.5(Fe,Al)0.5O3 | 8.07 | 9.90 | 10.35 | 12.40 | 10.93 | 2.36 | 2.13 | 2.19 | 2.07 | 3.63 |
| NaNbO3 | 0.00 | 6.81 | 6.47 | 4.87 | 5.80 | 0.60 | 0.92 | 0.62 | 0.85 | 0.00 |
| (LREE)FeO3 | 4.42 | 8.44 | 7.50 | 7.19 | 7.68 | 3.67 | 3.58 | 3.50 | 3.59 | 3.19 |
| Sample | Oka208 (Okaite) | | | | |
| PV1 | PV2 | PV3 | PV5 | PV6 | PV7 | | | | |
| Nb2O5 | 2.55 | 3.13 | 2.86 | 3.30 | 3.14 | 2.70 | | | | |
| Ta2O5 | 0.18 | 0.16 | 0.13 | 0.20 | 0.09 | 0.20 | | | | |
| SiO2 | 0.02 | 0.01 | 0.00 | 0.00 | 0.00 | 0.01 | | | | |
| TiO2 | 49.63 | 48.17 | 49.81 | 49.52 | 49.99 | 49.88 | | | | |
| ZrO2 | 0.04 | 0.07 | 0.06 | 0.07 | 0.05 | 0.07 | | | | |
| Al2O3 | 0.55 | 0.53 | 0.61 | 0.51 | 0.52 | 0.58 | | | | |
| Fe2O3 | 3.10 | 3.05 | 3.18 | 3.23 | 3.02 | 3.04 | | | | |
| La2O3 | 1.27 | 1.32 | 1.37 | 1.35 | 1.38 | 1.35 | | | | |
| Ce2O3 | 2.83 | 2.97 | 2.92 | 2.99 | 2.86 | 2.89 | | | | |
| Pr2O3 | 0.27 | 0.33 | 0.35 | 0.28 | 0.26 | 0.30 | | | | |
| Nd2O3 | 0.96 | 1.04 | 0.95 | 1.02 | 1.00 | 0.95 | | | | |
| Sm2O3 | 0.08 | 0.09 | 0.17 | 0.04 | 0.12 | 0.10 | | | | |
| CaO | 35.60 | 36.32 | 36.45 | 35.75 | 36.01 | 36.21 | | | | |
| SrO | 0.47 | 0.49 | 0.52 | 0.51 | 0.53 | 0.51 | | | | |
| Na2O | 0.54 | 0.42 | 0.39 | 0.45 | 0.45 | 0.39 | | | | |
| Total | 97.50 | 97.53 | 99.15 | 98.61 | 98.84 | 98.61 | | | | |
| Structural formulae | | | | |
| Nb5+ | 0.027 | 0.033 | 0.030 | 0.035 | 0.033 | 0.029 | | | | |
| Ta5+ | 0.001 | 0.001 | 0.001 | 0.001 | 0.001 | 0.001 | | | | |
| Si4+ | 0.000 | 0.000 | 0.000 | 0.000 | 0.000 | 0.000 | | | | |
| Ti4+ | 0.875 | 0.849 | 0.878 | 0.873 | 0.881 | 0.879 | | | | |
| Zr4+ | 0.000 | 0.000 | 0.000 | 0.000 | 0.000 | 0.000 | | | | |
| Al3+ | 0.015 | 0.015 | 0.017 | 0.014 | 0.014 | 0.016 | | | | |
| Fe3+ | 0.055 | 0.054 | 0.056 | 0.057 | 0.053 | 0.054 | | | | |
| La3+ | 0.011 | 0.011 | 0.012 | 0.012 | 0.012 | 0.012 | | | | |
| Ce3+ | 0.024 | 0.026 | 0.025 | 0.026 | 0.025 | 0.025 | | | | |
| Pr3+ | 0.002 | 0.003 | 0.003 | 0.002 | 0.002 | 0.003 | | | | |
| Nd3+ | 0.008 | 0.009 | 0.008 | 0.009 | 0.008 | 0.008 | | | | |
| Sm3+ | 0.001 | 0.001 | 0.001 | 0.000 | 0.001 | 0.001 | | | | |
| Ca2+ | 0.894 | 0.912 | 0.915 | 0.898 | 0.904 | 0.909 | | | | |
| Sr2+ | 0.006 | 0.007 | 0.007 | 0.007 | 0.007 | 0.007 | | | | |
| Na+ | 0.025 | 0.019 | 0.018 | 0.020 | 0.020 | 0.018 | | | | |
| mol % of the endmembers | | | | |
| CaTiO3 | 91.29 | 89.23 | 89.90 | 90.38 | 90.63 | 90.51 | | | | |
| CaNb0.5(Fe,Al)0.5O3 | 1.89 | 6.52 | 3.77 | 2.49 | 2.33 | 2.99 | | | | |
| NaNbO3 | 1.99 | 0.32 | 1.30 | 2.11 | 2.10 | 1.58 | | | | |
| (LREE)FeO3 | 4.83 | 3.93 | 5.03 | 5.02 | 4.93 | 4.92 | | | | |
Table 3.
Trace element abundances of perovskite.
Table 3.
Trace element abundances of perovskite.
| Sample | Oka70 (Jacupirangite) | Oka73 (Alnoite) | |
|---|
| PV1 | PV2 | PV3 | PV4 | PV3 | PV4 | PV7 | PV8 | PV9 | |
|---|
| Mn | 490 | 475 | 493 | 435 | 452 | 440 | 327 | 637 | 506 | |
| Mn | 490 | 475 | 493 | 435 | 452 | 440 | 327 | 637 | 506 | |
| Ga | 12 | 11 | 13 | 11 | 18 | 20 | 14 | 30 | 24 | |
| Sr | 3,599 | 3,412 | 3,616 | 3,444 | 2,951 | 1,862 | 3,073 | 2,828 | 3,709 | |
| Y | 232 | 240 | 307 | 205 | 156 | 407 | 144 | 268 | 347 | |
| Zr | 288 | 243 | 247 | 214 | 433 | 2,488 | 68 | 1,494 | 600 | |
| Ba | 55 | 50 | 64 | 51 | 91 | 104 | 70 | 143 | 111 | |
| La | 6,020 | 8,086 | 8,177 | 6,054 | 10,489 | 14,881 | 8,296 | 14,658 | 10,781 | |
| Ce | 10,488 | 13,001 | 1,7787 | 12,401 | 19,381 | 31,900 | 16,769 | 32,891 | 17,526 | |
| Pr | 914 | 1,287 | 1,641 | 1,260 | 1,858 | 3,382 | 1,801 | 3,341 | 1,521 | |
| Nd | 2,891 | 4,298 | 5,504 | 4,057 | 5,784 | 11,918 | 5,641 | 11,492 | 5,114 | |
| Sm | 387 | 513 | 673 | 468 | 571 | 1,323 | 559 | 1,187 | 628 | |
| Eu | 116 | 133 | 173 | 129 | 138 | 284 | 136 | 244 | 183 | |
| Gd | 198 | 250 | 321 | 217 | 222 | 545 | 215 | 457 | 310 | |
| Tb | 26 | 29 | 39 | 26 | 25 | 59 | 24 | 48 | 37 | |
| Dy | 98 | 104 | 135 | 91 | 75 | 190 | 71 | 135 | 138 | |
| Ho | 14 | 15 | 18 | 12 | 10 | 25 | 9 | 17 | 20 | |
| Er | 28 | 30 | 40 | 26 | 24 | 58 | 22 | 42 | 42 | |
| Tm | 2.4 | 2.4 | 3.0 | 2.0 | 1.5 | 4.8 | 1.3 | 2.7 | 3.9 | |
| Yb | 11.2 | 11.2 | 14.9 | 9.8 | 8.7 | 24.7 | 6.3 | 13.9 | 18.5 | |
| Lu | 1.1 | 0.9 | 1.3 | 0.8 | 0.8 | 2.6 | 0.4 | 1.5 | 1.7 | |
| Hf | 7.5 | 6.9 | 6.4 | 5.6 | 10.0 | 48.9 | 1.8 | 44.1 | 15.8 | |
| Ta | 243 | 395 | 376 | 353 | 460 | 5,412 | 622 | 427 | 177 | |
| Pb | 5 | 8 | 10 | 9 | 21 | 36 | 24 | 45 | 14 | |
| Th | 219 | 478 | 688 | 426 | 761 | 1403 | 1,282 | 2,417 | 229 | |
| U | 144 | 110 | 111 | 112 | 124 | 124 | 113 | 101 | 206 | |
| (La/Yb)N | 364 | 490 | 372 | 421 | 819 | 409 | 895 | 715 | 396 | |
| Sample | Oka229 (Okaite) |
| PV1 | PV1_2 | PV2_1 | PV2_2 | PV2_3 | PV2_4 | PV2_5 | PV2_6 | PV2_7 | PV2_8 |
| | | Rim | Core | Core | Core | Rim | Rim | | |
| Mn | 306 | 536 | 802 | 338 | 525 | 332 | 853 | 750 | 681 | 791 |
| Ga | 13 | 15 | 22 | 16 | 16 | 13 | 23 | 22 | 19 | 21 |
| Sr | 1,689 | 1,962 | 3,465 | 1,623 | 1,710 | 1,770 | 3,568 | 3,668 | 2,813 | 3,072 |
| Y | 312 | 255 | 145 | 299 | 293 | 262 | 147 | 115 | 214 | 199 |
| Zr | 5,862 | 3,661 | 1,347 | 4,039 | 3,975 | 3,967 | 1,350 | 622 | 1,660 | 1,616 |
| Ba | 71 | 83 | 114 | 83 | 81 | 70 | 117 | 116 | 100 | 111 |
| La | 7,549 | 7,565 | 15,129 | 10,849 | 9,278 | 7,877 | 15,016 | 13,962 | 13,081 | 11,088 |
| Ce | 19,887 | 19,407 | 29,922 | 23,870 | 19,961 | 19,381 | 30,154 | 28,404 | 28,579 | 27,510 |
| Pr | 2,299 | 2,455 | 2,946 | 2,524 | 2,257 | 2,097 | 3,046 | 2,862 | 2,944 | 2,951 |
| Nd | 7,905 | 7,954 | 8,672 | 8,267 | 7,527 | 6,781 | 8,893 | 8,182 | 9,185 | 9,116 |
| Sm | 922 | 850 | 769 | 915 | 862 | 751 | 790 | 684 | 914 | 881 |
| Eu | 229 | 209 | 165 | 231 | 224 | 200 | 173 | 147 | 209 | 200 |
| Gd | 381 | 336 | 274 | 375 | 368 | 318 | 286 | 236 | 341 | 330 |
| Tb | 45 | 39 | 30 | 43 | 42 | 37 | 31 | 25 | 38 | 36 |
| Dy | 151 | 127 | 82 | 142 | 143 | 123 | 83 | 65 | 111 | 106 |
| Ho | 20 | 16 | 10 | 19 | 18 | 16 | 11 | 8 | 14 | 13 |
| Er | 42 | 37 | 27 | 42 | 41 | 36 | 27 | 23 | 35 | 33 |
| Tm | 3.1 | 2.8 | 1.7 | 3.2 | 3.0 | 2.8 | 1.4 | 1.1 | 2.3 | 2.2 |
| Yb | 17.6 | 14.3 | 7.4 | 17.1 | 16.8 | 15.0 | 8.4 | 5.7 | 13.1 | 10.3 |
| Lu | 1.4 | 1.1 | 0.7 | 1.3 | 1.5 | 1.2 | 0.6 | 0.4 | 1.1 | 0.9 |
| Hf | 50.4 | 20.1 | 29.9 | 21.1 | 25.3 | 21.8 | 27.9 | 16.5 | 19.7 | 23.0 |
| Ta | 1,412 | 1,264 | 3,945 | 1,055 | 1,165 | 1,141 | 3,833 | 3,485 | 1,934 | 2,412 |
| Pb | 5 | 9 | 37 | 6 | 5 | 5 | 43 | 29 | 31 | 35 |
| Th | 194 | 238 | 1,746 | 255 | 97 | 95 | 2,224 | 1,162 | 1,558 | 1,889 |
| U | 191 | 186 | 71 | 209 | 188 | 210 | 70 | 58 | 183 | 152 |
| (La/Yb)N | 291 | 360 | 1,391 | 431 | 375 | 356 | 1,219 | 1,652 | 680 | 728 |
| Sample | Oka137 (Okaite) | Oka209 (Okaite) |
| PV1_1 | PV1_2 | PV3 | PV4 | PV5 | PV2 | PV3_1 | PV3_2 | PV4 | PV5 |
| core | rim | | | | | | | | |
| Mn | 289 | 719 | 865 | 807 | 683 | 348 | 353 | 416 | 319 | 374 |
| Ga | 16 | 23 | 25 | 23 | 21 | 8 | 9 | 9 | 13 | 8 |
| Sr | 1,656 | 3,473 | 3,711 | 3,611 | 3,492 | 4,025 | 3,155 | 3,352 | 3,047 | 3,095 |
| Y | 367 | 182 | 165 | 189 | 144 | 190 | 214 | 258 | 204 | 185 |
| Zr | 5,427 | 1,508 | 1,481 | 1,817 | 1,535 | 240 | 279 | 276 | 250 | 213 |
| Ba | 73 | 106 | 119 | 111 | 87 | 49 | 49 | 54 | 84 | 52 |
| La | 7,515 | 16,177 | 15,177 | 13,939 | 8,859 | 6,870 | 8,551 | 8,771 | 8,335 | 7,076 |
| Ce | 21,468 | 31,025 | 31,244 | 30,380 | 18,276 | 12,187 | 15,534 | 15,508 | 14,481 | 15,036 |
| Pr | 2,299 | 2,926 | 3,093 | 2,974 | 1,735 | 944 | 815 | 794 | 829 | 893 |
| Nd | 8,239 | 9,030 | 9,391 | 9,275 | 5,398 | 4,066 | 4,643 | 4,747 | 4,503 | 4,210 |
| Sm | 969 | 817 | 849 | 847 | 562 | 467 | 532 | 551 | 511 | 492 |
| Eu | 232 | 171 | 178 | 177 | 135 | 119 | 137 | 147 | 129 | 133 |
| Gd | 459 | 337 | 321 | 329 | 211 | 227 | 292 | 301 | 250 | 245 |
| Tb | 53 | 38 | 35 | 36 | 24 | 26 | 33 | 35 | 29 | 29 |
| Dy | 170 | 97 | 92 | 98 | 72 | 91 | 114 | 121 | 92 | 94 |
| Ho | 23 | 12 | 11 | 13 | 9 | 12 | 15 | 16 | 12 | 12 |
| Er | 53 | 35 | 32 | 33 | 23 | 28 | 36 | 36 | 30 | 27 |
| Tm | 3.6 | 1.8 | 1.7 | 1.9 | 1.6 | 2.0 | 2.1 | 2.8 | 1.9 | 1.8 |
| Yb | 20.5 | 9.4 | 7.9 | 9.6 | 8.1 | 9.0 | 10.7 | 12.0 | 8.8 | 9.4 |
| Lu | 1.7 | 0.8 | 0.7 | 0.9 | 0.7 | 0.7 | 0.9 | 1.0 | 0.9 | 0.7 |
| Hf | 46.9 | 35.0 | 32.3 | 41.3 | 15.8 | 7.1 | 9.5 | 7.6 | 7.5 | 6.3 |
| Ta | 1,527 | 4,131 | 4,305 | 3,761 | 1,249 | 353 | 409 | 438 | 394 | 341 |
| Pb | 5 | 40 | 46 | 40 | 19 | 8 | 9 | 9 | 9 | 9 |
| Th | 192 | 2,504 | 2,630 | 2,327 | 845 | 409 | 494 | 517 | 487 | 413 |
| U | 164 | 79 | 63 | 86 | 103 | 100 | 102 | 127 | 113 | 110 |
| (La/Yb)N | 249 | 1,165 | 1,313 | 991 | 745 | 516 | 545 | 496 | 641 | 510 |
| Sample | Oka208 (Okaite) | | | | |
| PV1 | PV2 | PV3 | PV5 | PV6 | PV7 | | | | |
| Mn | 346 | 318 | 342 | 358 | 352 | 415 | | | | |
| Ga | 13 | 17 | 14 | 15 | 13 | 17 | | | | |
| Sr | 3,219 | 3,592 | 3,532 | 3,338 | 3,548 | 3,488 | | | | |
| Y | 201 | 169 | 186 | 171 | 162 | 174 | | | | |
| Zr | 236 | 222 | 242 | 233 | 215 | 279 | | | | |
| Ba | 82 | 94 | 78 | 81 | 77 | 97 | | | | |
| La | 8,624 | 7,369 | 9,318 | 8,351 | 8,341 | 10,879 | | | | |
| Ce | 19,084 | 16,432 | 19,665 | 18,405 | 17,216 | 23,169 | | | | |
| Pr | 1,872 | 1,734 | 1,899 | 1,890 | 1,852 | 2,394 | | | | |
| Nd | 6,320 | 5,601 | 6,255 | 6,102 | 5,887 | 7,449 | | | | |
| Sm | 662 | 590 | 630 | 619 | 581 | 705 | | | | |
| Eu | 154 | 139 | 150 | 151 | 143 | 167 | | | | |
| Gd | 273 | 230 | 257 | 245 | 231 | 270 | | | | |
| Tb | 30 | 26 | 29 | 27 | 26 | 31 | | | | |
| Dy | 94 | 79 | 90 | 84 | 77 | 88 | | | | |
| Ho | 13 | 10 | 12 | 11 | 10 | 11 | | | | |
| Er | 28 | 23 | 27 | 24 | 24 | 26 | | | | |
| Tm | 2.0 | 1.4 | 1.8 | 1.6 | 1.4 | 1.7 | | | | |
| Yb | 9.4 | 7.1 | 8.4 | 7.8 | 7.3 | 8.9 | | | | |
| Lu | 0.8 | 0.6 | 0.7 | 0.6 | 0.6 | 0.6 | | | | |
| Hf | 5.5 | 5.5 | 5.6 | 5.4 | 4.8 | 6.1 | | | | |
| Ta | 776 | 724 | 801 | 866 | 722 | 864 | | | | |
| Pb | 17 | 15 | 16 | 22 | 17 | 19 | | | | |
| Th | 1,179 | 1,002 | 1,125 | 1,337 | 1,016 | 1,149 | | | | |
| U | 79 | 76 | 81 | 91 | 88 | 97 | | | | |
| (La/Yb)N | 624 | 708 | 754 | 724 | 778 | 833 | | | | |
Figure 4.
Compositional variation diagrams for perovskite from Oka. (A) TiO2 vs. Nb2O5, with Nb-E and Nb-D groups identified; (B) (Na+ + LREE3+) vs. Ca2+; (C) (Al3+ + Fe3+ + Nb5+) vs. Ti4+.
Figure 4.
Compositional variation diagrams for perovskite from Oka. (A) TiO2 vs. Nb2O5, with Nb-E and Nb-D groups identified; (B) (Na+ + LREE3+) vs. Ca2+; (C) (Al3+ + Fe3+ + Nb5+) vs. Ti4+.
Figure 5.
Petrographic image showing the zonation of perovskite. (A) U (ppm) concentrations obtained by LA-ICPMS with a 25 μm spot size; (B) Nb2O5 (wt %) abundances analyzed by EMP with a 5 µm beam; and (C) 206Pb/238U weighted mean ages (determined by LA-MC-ICPMS using a spot size of 75 μm) across a zoned perovskite grain from sample Oka229 (okaite).
Figure 6.
Chondrite normalized Rare Earth Element (REE) patterns for perovskite from alkaline silicate samples at Oka. Chondrite values are from McDonough and Sun [
55].
Figure 6.
Chondrite normalized Rare Earth Element (REE) patterns for perovskite from alkaline silicate samples at Oka. Chondrite values are from McDonough and Sun [
55].
Figure 7.
Plots exhibiting the correlations between Pb (A) and Th (B) abundances vs. Ca2+ (a.p.f.u.) for perovskite from Oka.
Figure 7.
Plots exhibiting the correlations between Pb (A) and Th (B) abundances vs. Ca2+ (a.p.f.u.) for perovskite from Oka.
Newly obtained chemical compositions for apatite from alnöite, ijolite and jacupirangite are listed in
Table 4 and
Table 5.
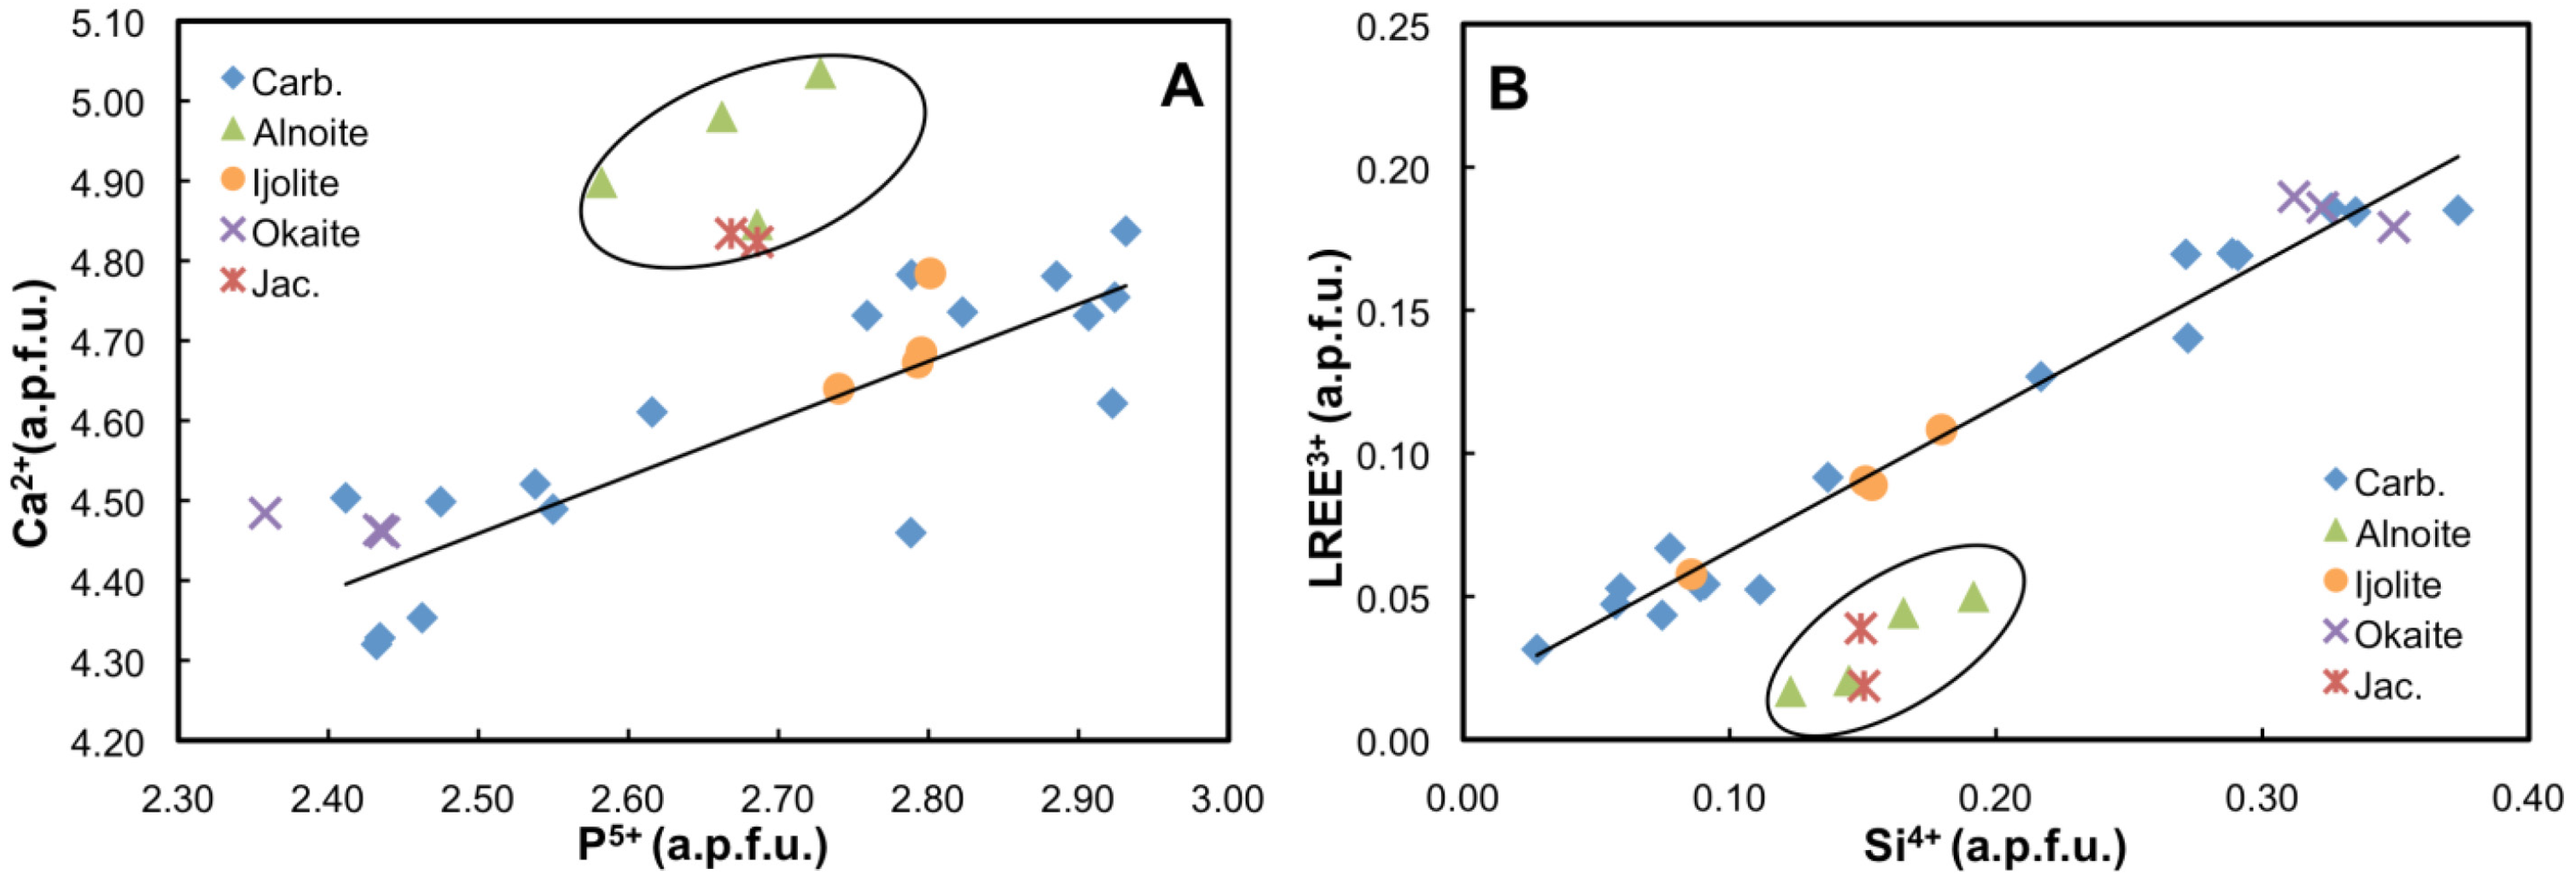
Figure 8 plots the major element and LREE compositions for apatite from all rock types investigated here, along with those from carbonatite and okaite (Chen and Simonetti [
14]). The compositions of fluorapatite from alnöite and jacupirangite are chemically distinct relative to the remaining rock types at Oka (
Figure 8),
i.e., they contain a higher Ca content for a given P abundance (
Figure 8A). As explained by Chen and Simonetti [
14], REE abundances for apatite exhibit a positive correlation with Si contents due to their co-substitution within Ca and P structural sites. Once again, the same substitution scheme is evidenced here for all the apatites with the exception of those from alnöite and jacupirangite (
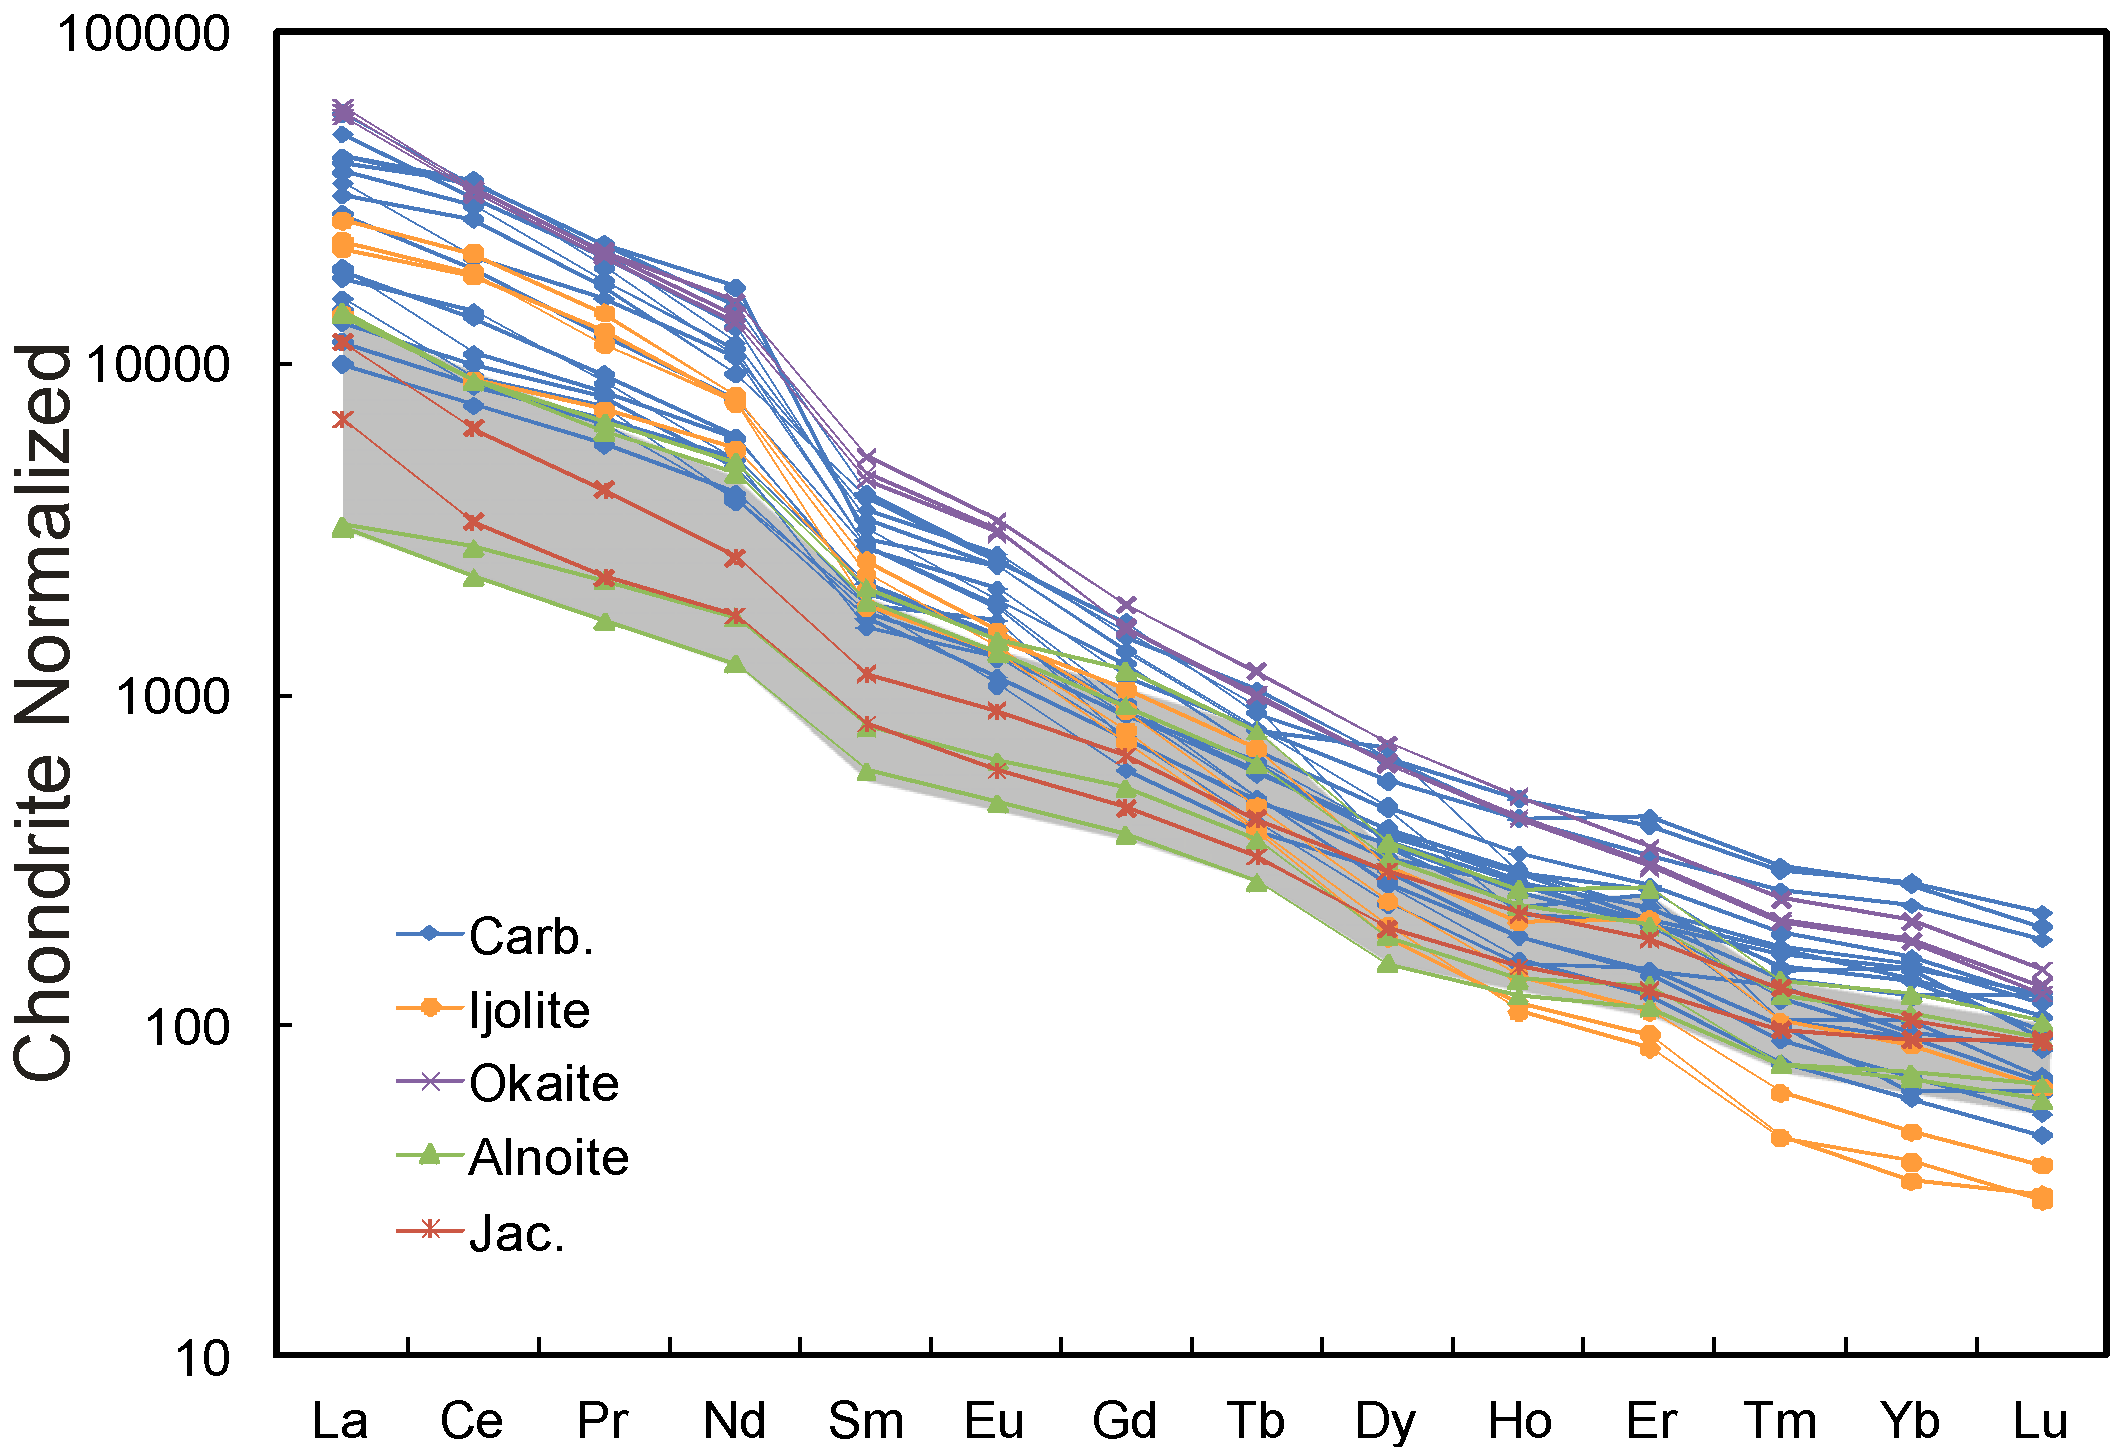
Figure 8B). Chondrite normalized REE patterns for apatite investigated here are also negatively-sloped (
Figure 9), but are more variable compared to those for perovskite (
Figure 6). Of note, the chondrite normalized REE patterns for apatite from alnöite and jacupirangite exhibit less negative slopes among all rock types, with lower LREE abundances and comparable heavy REE (HREE) contents (
Figure 9). (La/Yb)
N ratios vary from 45 to 161 for apatite from alnöite and jacupirangite (
Table 5), whereas ratios range between 106 and 695 for the remaining apatite [
14]; these ratios for apatite are generally lower compared to those for perovskite (
Table 3).
Figure 8.
Chemical variation diagrams for apatite from different rock types (carbonatite (Carb.), alnöite, ijolite, okaite, and jacupirangite (Jac.)). (
A) Ca
2+ vs. P
5+; (
B) LREE
3+ vs. Si
4+. Additional chemical compositions for apatite from carbonatite, okaite and melanite ijolite are from Chen and Simonetti [
14].
Figure 9.
Chondrite normalized REE patterns for apatite from different rock types at Oka. As with
Figure 8, additional REE abundances for apatite from carbonatite, okaite and melanite ijolite are from Chen and Simonetti [
14]. The grey shaded area outlines the normalized patterns for apatite from alnöite and jacupirangite. Chondrite values are from McDonough and Sun [
55].
Table 4.
Major element abundances of apatite from ijolite, alnöite and jacupirangite.
Table 4.
Major element abundances of apatite from ijolite, alnöite and jacupirangite.
| Sample | Oka132 | Oka134 | Oka73 | Oka75 | Oka88 | Oka70 | Oka78 |
|---|
| alnöite | alnöite | alnöite | alnöite | ijolite | jacupirangite | jacupirangite |
|---|
| n = 5 | n = 10 | n = 4 | n = 17 | n = 9 | n = 5 | n = 2 |
|---|
| P2O5 | 37.93 | 36.47 | 37.60 | 38.53 | 39.56 | 37.93 | 37.69 |
| SiO2 | 1.73 | 2.29 | 1.98 | 1.47 | 1.02 | 1.79 | 1.80 |
| La2O3 | 0.19 | 0.48 | 0.40 | 0.17 | 0.54 | 0.43 | 0.20 |
| Ce2O3 | 0.27 | 0.73 | 0.62 | 0.20 | 0.90 | 0.61 | 0.29 |
| Pr2O3 | 0.02 | 0.06 | 0.14 | 0.05 | 0.07 | 0.03 | 0.05 |
| Nd2O3 | 0.19 | 0.38 | 0.29 | 0.13 | 0.38 | 0.19 | 0.07 |
| MgO | 0.04 | 0.03 | 0.03 | 0.03 | 0.01 | 0.02 | 0.04 |
| CaO | 54.07 | 54.66 | 55.58 | 56.19 | 53.39 | 53.83 | 53.95 |
| MnO | 0.02 | 0.01 | 0.02 | 0.01 | 0.05 | 0.03 | 0.04 |
| FeO | 0.04 | 0.04 | 0.03 | 0.04 | 0.04 | 0.13 | 0.03 |
| SrO | 0.48 | 0.46 | 0.46 | 0.47 | 0.85 | 0.83 | 0.52 |
| F | 1.77 | 2.24 | 2.10 | 2.05 | 4.00 | 2.31 | 1.93 |
| Total | 96.75 | 97.84 | 99.24 | 99.33 | 100.82 | 98.15 | 96.60 |
| P5+ | 2.686 | 2.582 | 2.662 | 2.728 | 2.801 | 2.686 | 2.668 |
| Ca2+ | 4.845 | 4.898 | 4.980 | 5.035 | 4.784 | 4.824 | 4.834 |
| Sr2+ | 0.023 | 0.022 | 0.022 | 0.023 | 0.041 | 0.040 | 0.025 |
| Si4+ | 0.145 | 0.192 | 0.165 | 0.123 | 0.086 | 0.149 | 0.150 |
| La3+ | 0.006 | 0.015 | 0.012 | 0.005 | 0.017 | 0.013 | 0.006 |
| Ce3+ | 0.008 | 0.022 | 0.019 | 0.006 | 0.028 | 0.019 | 0.009 |
| Pr3+ | 0.001 | 0.002 | 0.004 | 0.002 | 0.002 | 0.001 | 0.002 |
| Nd3+ | 0.006 | 0.011 | 0.009 | 0.004 | 0.011 | 0.006 | 0.002 |
| LREE3+ | 0.021 | 0.050 | 0.044 | 0.017 | 0.058 | 0.039 | 0.019 |
Table 5.
Trace element abundances of apatite from ijolite, alnöite and jacupirangite.
Table 5.
Trace element abundances of apatite from ijolite, alnöite and jacupirangite.
| Sample | Oka132 | Oka134 | Oka73 | Oka75 | Oka88 | Oka70 | Oka78 |
|---|
| alnöite | alnöite | alnöite | alnöite | ijolite | jacupirangite | jacupirangite |
|---|
| n = 5 | n = 10 | n = 4 | n = 17 | n = 9 | n = 5 | n = 2 |
|---|
| Mn | 120 | 163 | 167 | 119 | 358 | 194 | 164 |
| Rb | 0.26 | 0.20 | b.d. | 1.37 | b.d. | b.d. | b.d. |
| Sr | 3798 | 3716 | 3393 | 3842 | 5774 | 8938 | 4236 |
| Y | 195 | 358 | 327 | 187 | 256 | 325 | 243 |
| Ba | 19.80 | 27.21 | 28.71 | 10.19 | 92.66 | 32.36 | 11.83 |
| La | 780 | 3423 | 3346 | 763 | 3361 | 2772 | 1624 |
| Ce | 1728 | 5496 | 5515 | 1411 | 5513 | 3961 | 2060 |
| Pr | 208 | 623 | 584 | 157 | 677 | 390 | 212 |
| Nd | 788 | 2320 | 2149 | 572 | 2540 | 1201 | 801 |
| Sm | 120 | 314 | 285 | 87 | 312 | 173 | 122 |
| Eu | 35.38 | 82.65 | 76.00 | 26.35 | 82.89 | 51.03 | 33.12 |
| Gd | 104 | 238 | 186 | 75.15 | 209 | 130 | 90.48 |
| Tb | 13.10 | 28.42 | 22.19 | 9.79 | 24.69 | 15.16 | 11.67 |
| Dy | 45.59 | 87.78 | 77.74 | 37.85 | 74.42 | 71.85 | 48.47 |
| Ho | 7.50 | 14.02 | 12.57 | 6.70 | 11.23 | 11.86 | 8.22 |
| Er | 21.14 | 41.28 | 31.95 | 18.09 | 33.37 | 29.24 | 20.35 |
| Tm | 1.88 | 3.37 | 3.04 | 1.89 | 2.54 | 3.21 | 2.39 |
| Yb | 11.12 | 20.04 | 17.54 | 11.54 | 14.15 | 16.73 | 14.58 |
| Lu | 1.46 | 2.54 | 2.24 | 1.63 | 1.60 | 2.19 | 2.23 |
| Pb | 2.93 | 4.69 | 4.61 | 3.20 | 9.79 | 2.96 | 2.50 |
| Th | 105 | 240 | 161 | 140 | 600 | 52.29 | 59.41 |
| U | 20.86 | 36.87 | 25.71 | 22.52 | 6.73 | 21.45 | 11.29 |
| (La/Yb)N | 48 | 116 | 130 | 45 | 161 | 113 | 76 |
3.2. Geochronological Data
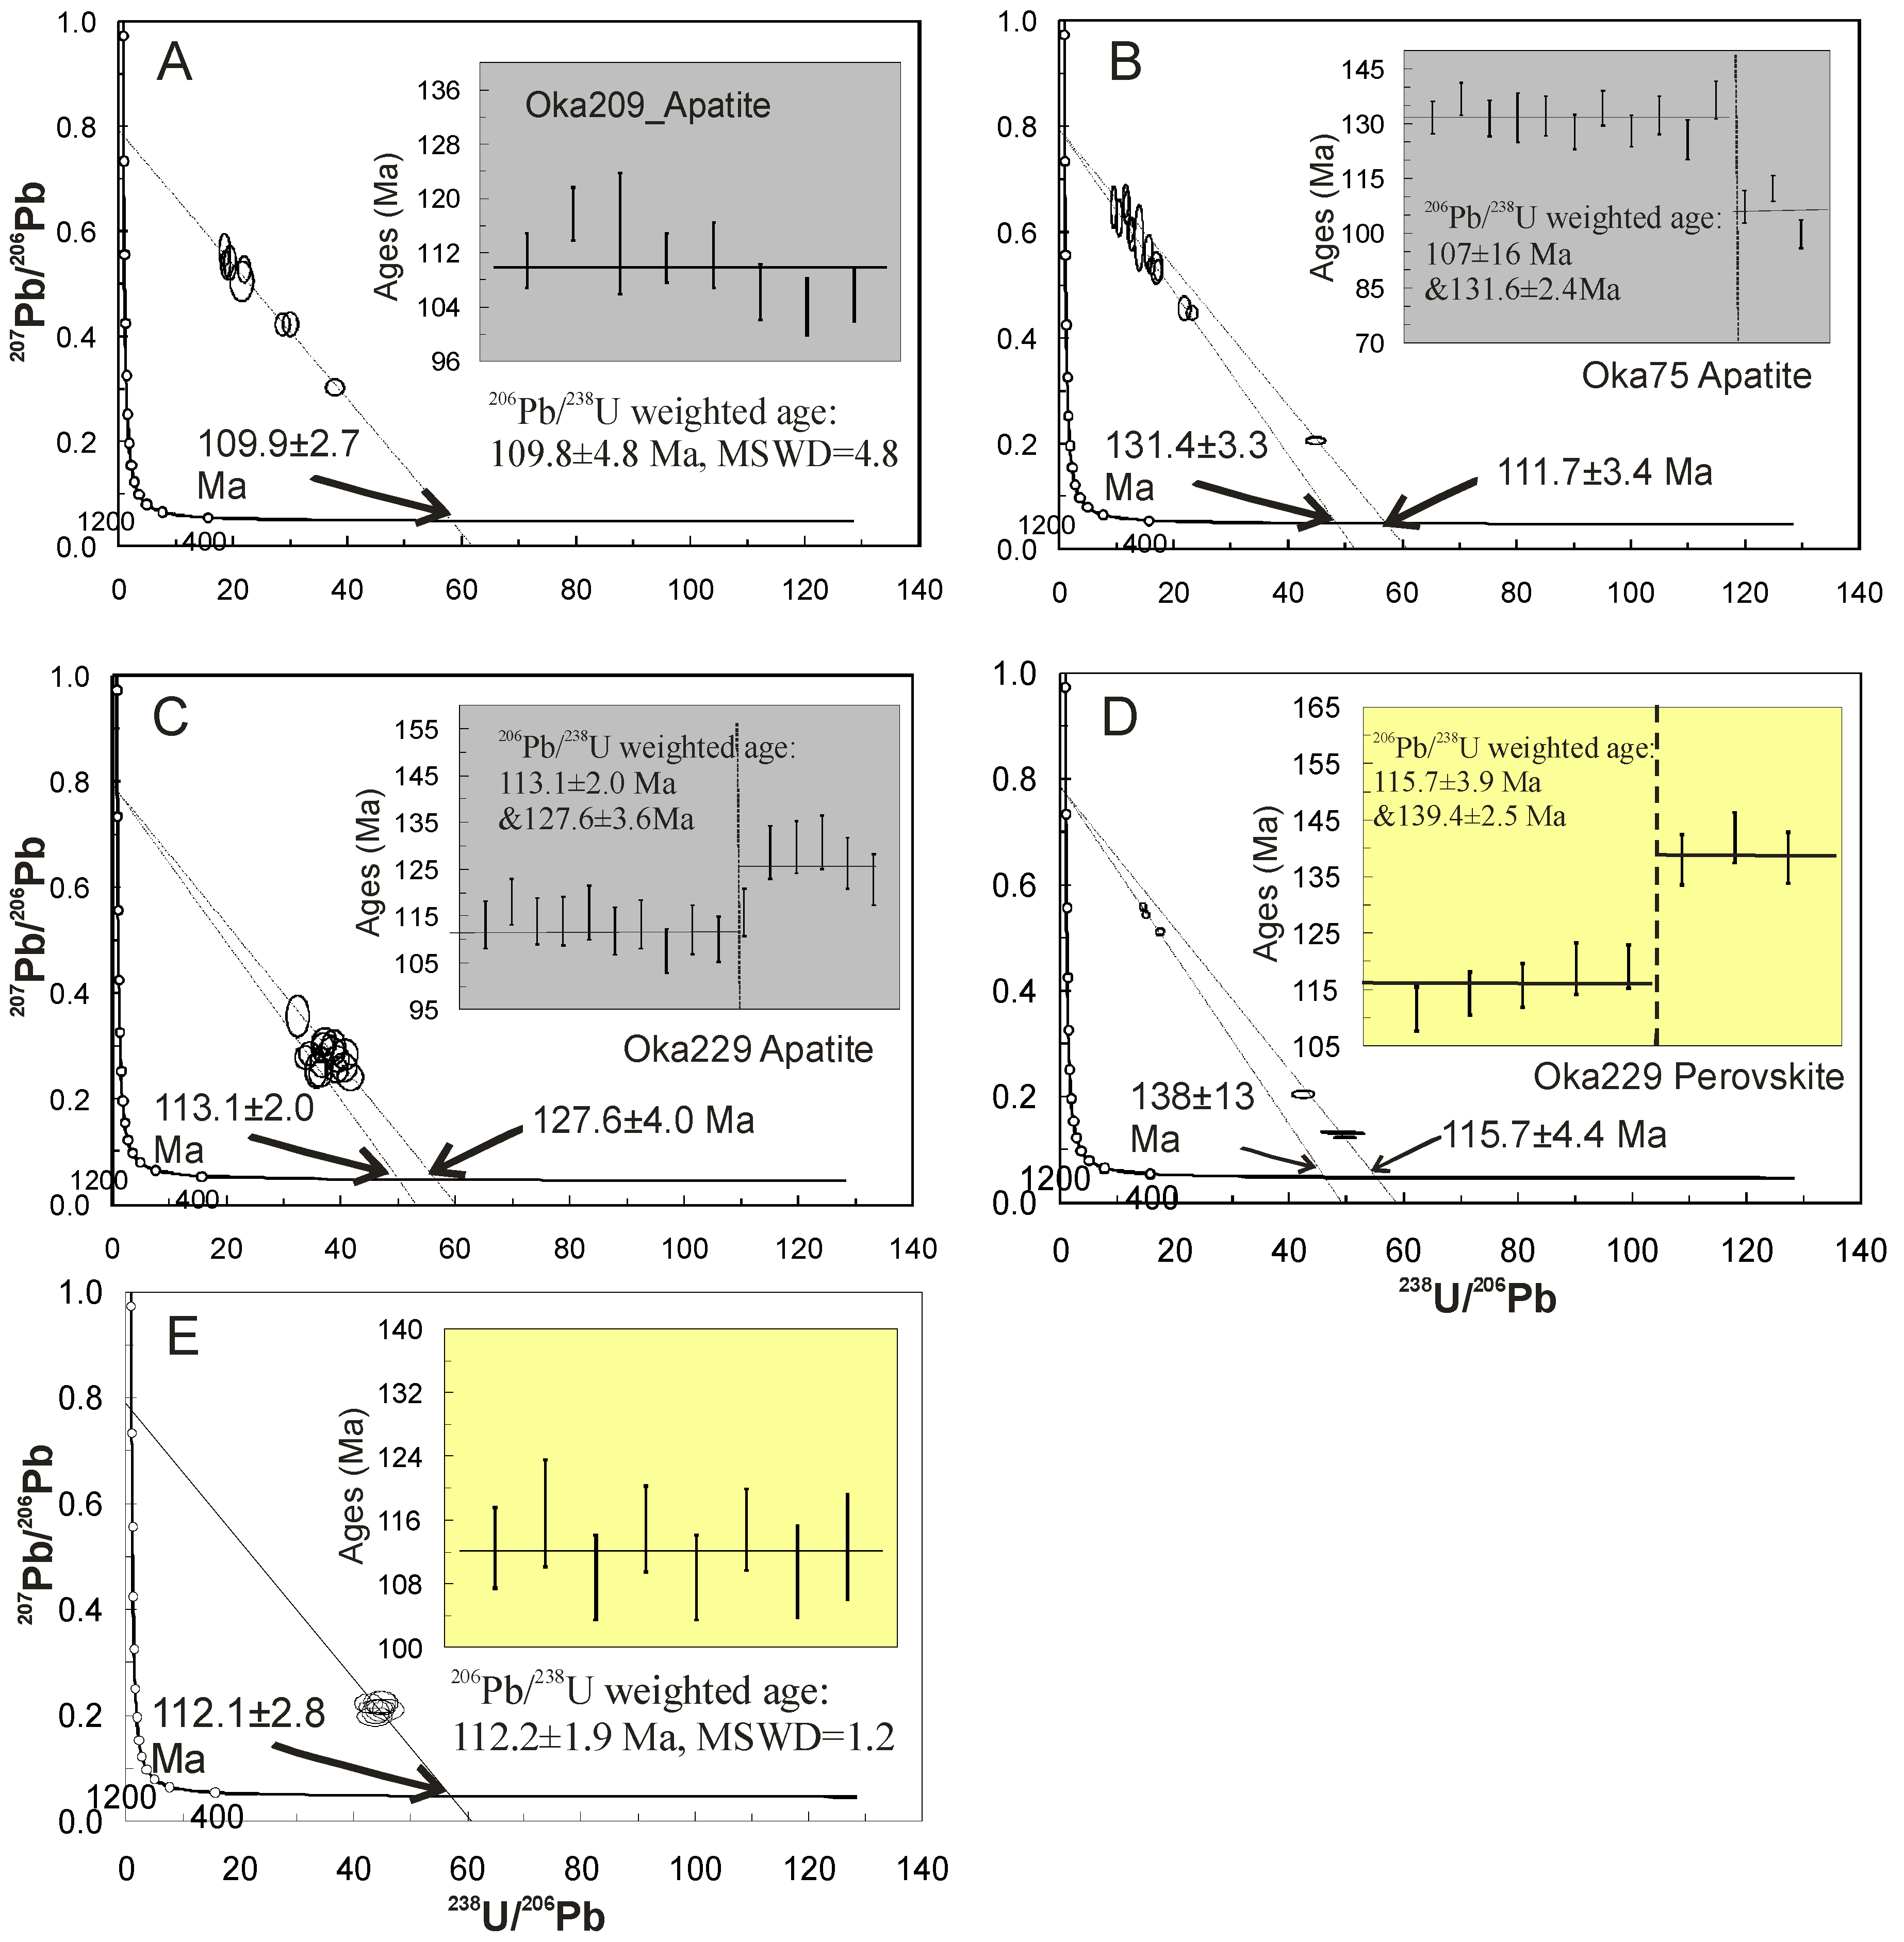
New,
in-situ U-Pb ages for apatite are reported here from three alnöites, one ijolite, two okaites, and one jacupirangite (
Table 6). As with the
in-situ U-Pb dating results documented previously for apatite from Oka by Chen and Simonetti [
14], the newly obtained ages for several alkaline silicate rock samples also indicate a bimodal distribution (e.g., Oka132 and Oka229;
Figure 10B,C). For example, apatite from alnöite sample Oka75 yields bimodal
206Pb/
238U weighted mean ages of 111.7 ± 3.4 and 131.6 ± 2.4 Ma. In general, samples with only one age peak (
i.e., Oka209,
Figure 10A) yield a relatively young age.
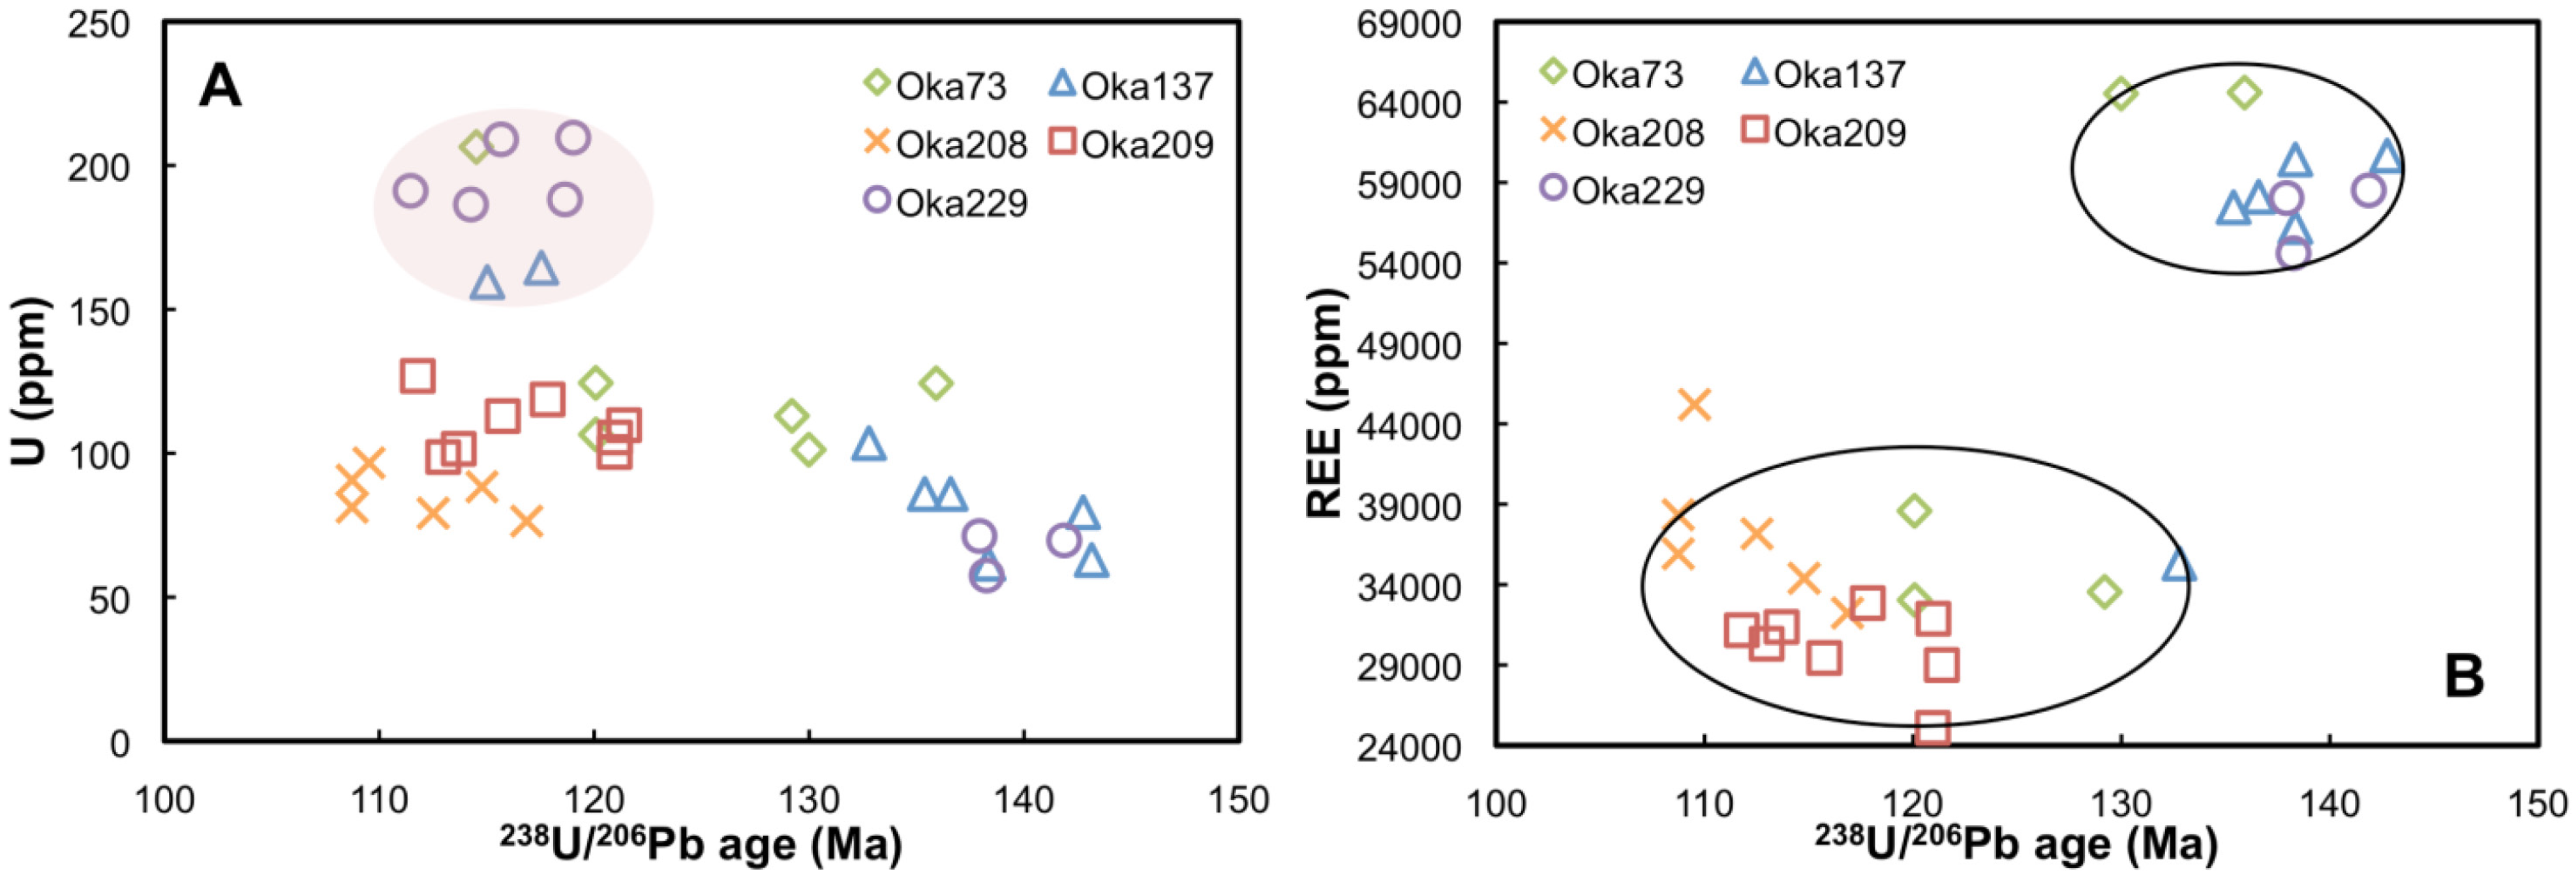
In total, ~40 U-Pb analyses for perovskite from four okaites and one alnöite obtained here are listed in
Table 7. Of interest, U-Pb ages for perovskite from okaite sample Oka229 also yields a bimodal distribution (
Figure 10D). Moreover, individual ages correlate with their corresponding chemical compositions,
i.e., older perovskites that define a
2°
6Pb/
238U weighted mean age of 139.4 ± 2.5 Ma are characterized by high Nb
2O
5 contents (Nb-E group), whereas younger perovskites with an age of 115.7 ± 3.9 Ma belong to the Nb-D group (
Figure 5). Of note, the young ages for perovskite obtained in this study (
Table 4 and
Figure 10E) are younger than the previously reported (single) U-Pb age of 131 ± 7 Ma for the same mineral from carbonatite at Oka [
13]. Thus, as with the recently published apatite and niocalite ages for Oka [
14,
15], the U-Pb perovskite ages obtained here also suggest a rather protracted crystallization history for Oka. Of importance, the Th/U ratios for perovskite investigated in this study are all >1 with the highest value up to 31. Chew
et al. [
41] pointed out that using the
208Pb-correction method in conjunction with determining
208Pb-
232Th ages only yields reliable geochronological results when
232Th/
238U ratios are <0.5. Consequently, we do not report the
232Th-
208Pb ages for perovskite investigated here.
Figure 10.
U-Pb isotopic ages for apatite and perovskite from the Oka carbonatite complex. Examples are illustrated for samples with a single age for apatite (
A) and bimodal age distributions (
B,
C). Diagrams (
D) and (
E) illustrate examples of perovskite age results, (
D) gives a bimodal distribution age and (
E) yields a single young age. All reported uncertainties are at 2σ level as determined by Isoplot [
46]. The Mean Square Weighted Deviation (MSWD) is used as a statistical validity of the regression line according to the criteria defined by Wendt and Carl [
56].
Table 6.
In-situ U-Pb geochronological results for apatite by LA-ICP-MS. Rad.: Radiogenic.
Table 6.
In-situ U-Pb geochronological results for apatite by LA-ICP-MS. Rad.: Radiogenic.
| Analyses | 206Pb (cps) | 238U (cps) | 238U/206Pb | 2σ | 207Pb/206Pb | 2σ | F206 | Rad. 206Pb/238U | Rad. 206Pb/238U Age (Ma) | 2σ |
|---|
| Oka75 | | | | | | | | | | |
| ap2 | 3860 | 73,757 | 17.297 | 0.581 | 0.528 | 0.016 | 0.35 | 0.020 | 130 | 4 |
| ap5 | 3846 | 67,692 | 16.153 | 0.531 | 0.536 | 0.013 | 0.34 | 0.021 | 135 | 4 |
| ap6 | 2005 | 27,238 | 12.429 | 0.474 | 0.603 | 0.018 | 0.25 | 0.020 | 129 | 5 |
| ap7 | 2118 | 39,197 | 17.029 | 0.874 | 0.532 | 0.024 | 0.35 | 0.020 | 130 | 7 |
| ap8 | 2793 | 19,763 | 9.551 | 0.395 | 0.647 | 0.033 | 0.19 | 0.020 | 129 | 5 |
| ap12 | 2241 | 32,451 | 12.690 | 0.448 | 0.595 | 0.025 | 0.26 | 0.021 | 132 | 5 |
| ap13 | 3514 | 93,575 | 23.239 | 0.786 | 0.447 | 0.011 | 0.46 | 0.020 | 127 | 4 |
| ap16 | 2105 | 51,591 | 21.907 | 0.857 | 0.455 | 0.019 | 0.45 | 0.021 | 131 | 5 |
| ap17 | 1034 | 16,038 | 13.968 | 0.601 | 0.589 | 0.051 | 0.27 | 0.019 | 124 | 5 |
| ap18 | 1542 | 17,890 | 10.492 | 0.402 | 0.627 | 0.028 | 0.22 | 0.021 | 134 | 5 |
| ap10 | 2247 | 31,047 | 11.825 | 0.485 | 0.646 | 0.025 | 0.19 | 0.016 | 105 | 4 |
| ap11 | 8678 | 436,411 | 44.920 | 1.414 | 0.205 | 0.006 | 0.79 | 0.018 | 112 | 4 |
| Oka132 | | | | | | | | | | |
| ap1 | 2987 | 42,448 | 12.778 | 0.613 | 0.618 | 0.037 | 0.23 | 0.018 | 116 | 6 |
| ap2 | 2542 | 26,579 | 9.461 | 0.486 | 0.660 | 0.045 | 0.18 | 0.019 | 118 | 6 |
| ap3 | 4431 | 120,443 | 24.373 | 0.858 | 0.452 | 0.017 | 0.46 | 0.019 | 119 | 4 |
| ap4 | 4405 | 127,135 | 26.202 | 1.067 | 0.414 | 0.017 | 0.51 | 0.019 | 124 | 5 |
| ap6 | 5230 | 136,876 | 23.515 | 0.833 | 0.448 | 0.017 | 0.46 | 0.020 | 125 | 4 |
| ap7 | 5770 | 123,850 | 22.334 | 1.045 | 0.473 | 0.023 | 0.43 | 0.019 | 122 | 6 |
| ap8 | 4040 | 107,693 | 24.499 | 0.891 | 0.469 | 0.035 | 0.43 | 0.018 | 113 | 4 |
| ap9 | 6320 | 213,332 | 31.331 | 1.108 | 0.331 | 0.014 | 0.62 | 0.020 | 126 | 4 |
| ap10 | 4256 | 111,559 | 24.952 | 1.074 | 0.417 | 0.024 | 0.50 | 0.020 | 129 | 6 |
| ap12 | 4215 | 127,533 | 28.325 | 1.113 | 0.411 | 0.016 | 0.51 | 0.018 | 115 | 5 |
| ap13 | 2014 | 39,761 | 18.813 | 1.039 | 0.513 | 0.029 | 0.37 | 0.020 | 127 | 7 |
| ap15 | 4526 | 134,623 | 27.585 | 0.916 | 0.402 | 0.015 | 0.52 | 0.019 | 121 | 4 |
| ap16 | 5532 | 182,371 | 29.898 | 1.000 | 0.362 | 0.016 | 0.58 | 0.019 | 123 | 4 |
| ap17 | 4954 | 134,766 | 24.557 | 0.859 | 0.426 | 0.019 | 0.49 | 0.020 | 128 | 4 |
| ap18 | 5098 | 140,484 | 25.011 | 1.026 | 0.431 | 0.016 | 0.48 | 0.019 | 124 | 5 |
| ap19 | 4482 | 118,700 | 24.078 | 0.896 | 0.440 | 0.019 | 0.47 | 0.020 | 125 | 5 |
| ap20 | 4578 | 117,506 | 23.534 | 0.935 | 0.455 | 0.020 | 0.45 | 0.019 | 123 | 5 |
| ap21 | 4537 | 126,595 | 25.390 | 0.899 | 0.402 | 0.017 | 0.52 | 0.021 | 131 | 5 |
| Oka134 | | | | | | | | | | |
| ap3 | 2633 | 46,091 | 11.623 | 0.512 | 0.632 | 0.033 | 0.21 | 0.018 | 117 | 5 |
| ap4 | 2047 | 57,963 | 31.557 | 1.069 | 0.337 | 0.011 | 0.61 | 0.019 | 124 | 4 |
| ap6_2 | 1881 | 48,510 | 12.961 | 0.513 | 0.613 | 0.024 | 0.24 | 0.018 | 118 | 5 |
| ap7 | 2226 | 63,035 | 12.111 | 0.460 | 0.620 | 0.028 | 0.23 | 0.019 | 121 | 5 |
| ap8 | 4950 | 220,877 | 26.580 | 1.025 | 0.450 | 0.019 | 0.46 | 0.017 | 110 | 4 |
| ap10 | 3204 | 96,354 | 36.193 | 1.188 | 0.306 | 0.008 | 0.65 | 0.018 | 115 | 4 |
| Oka78 | | | | | | | | | | |
| ap1 | 2515 | 44,472 | 15.505 | 0.655 | 0.576 | 0.031 | 0.29 | 0.019 | 119 | 5 |
| ap2 | 2419 | 36,383 | 13.013 | 0.545 | 0.636 | 0.033 | 0.21 | 0.016 | 102 | 4 |
| ap2_2 | 2682 | 49,979 | 15.883 | 0.719 | 0.590 | 0.018 | 0.27 | 0.017 | 109 | 5 |
| ap5 | 3147 | 36,786 | 10.981 | 0.475 | 0.616 | 0.041 | 0.23 | 0.021 | 136 | 6 |
| ap6 | 2235 | 26,384 | 9.809 | 0.432 | 0.650 | 0.038 | 0.19 | 0.019 | 123 | 5 |
| ap7 | 2127 | 25,446 | 10.862 | 0.638 | 0.629 | 0.050 | 0.22 | 0.020 | 127 | 7 |
| ap8 | 3479 | 86,154 | 20.688 | 0.770 | 0.472 | 0.016 | 0.43 | 0.021 | 132 | 5 |
| Oka88 | | | | | | | | | | |
| ap1 | 1928 | 24,364 | 10.634 | 0.571 | 0.630 | 0.034 | 0.22 | 0.020 | 130 | 7 |
| ap5 | 3191 | 52,289 | 14.240 | 0.526 | 0.599 | 0.023 | 0.26 | 0.018 | 116 | 4 |
| ap9 | 2266 | 22,820 | 8.590 | 0.379 | 0.671 | 0.029 | 0.16 | 0.019 | 119 | 5 |
| ap12 | 2087 | 28,603 | 11.739 | 0.460 | 0.639 | 0.034 | 0.20 | 0.017 | 111 | 4 |
| Oka209 | | | | | | | | | | |
| ap1 | 3806 | 136,013 | 28.715 | 1.044 | 0.423 | 0.017 | 0.50 | 0.017 | 110 | 4 |
| ap2 | 2669 | 61,596 | 18.711 | 0.627 | 0.537 | 0.022 | 0.34 | 0.018 | 116 | 4 |
| ap3 | 2792 | 82,285 | 21.569 | 1.675 | 0.505 | 0.031 | 0.38 | 0.018 | 114 | 9 |
| ap5 | 5696 | 262,191 | 37.865 | 1.239 | 0.302 | 0.013 | 0.66 | 0.017 | 111 | 4 |
| ap6 | 2535 | 61,132 | 19.526 | 0.857 | 0.540 | 0.027 | 0.34 | 0.017 | 110 | 5 |
| ap7 | 2545 | 55,895 | 18.549 | 0.728 | 0.564 | 0.026 | 0.30 | 0.016 | 105 | 4 |
| ap8 | 2418 | 63,624 | 21.972 | 0.892 | 0.527 | 0.020 | 0.35 | 0.016 | 103 | 4 |
| ap9 | 2622 | 93,867 | 30.042 | 1.094 | 0.423 | 0.019 | 0.49 | 0.016 | 105 | 4 |
Table 7.
In-situ U-Pb geochronological results for perovskite by LA-(MC)-ICP-MS.
Table 7.
In-situ U-Pb geochronological results for perovskite by LA-(MC)-ICP-MS.
| Analyses | 206Pb (V) | 238U (V) | 238U/206Pb | 2σ | 207Pb/206Pb | 2σ | F206 | Rad. 206Pb/238U | Rad. 206Pb/238U Age (Ma) | 2σ |
|---|
| Oka229 | | | | | | | | | | |
| PV1 | 0.0014 | 0.075 | 51.008 | 1.791 | 0.130 | 0.001 | 0.89 | 0.017 | 111 | 4 |
| PV1_2 | 0.0012 | 0.065 | 49.588 | 1.661 | 0.132 | 0.001 | 0.89 | 0.018 | 114 | 4 |
| PV2_1 | 0.0016 | 0.029 | 17.390 | 0.569 | 0.511 | 0.005 | 0.38 | 0.022 | 138 | 5 |
| PV2_2 | 0.0012 | 0.064 | 49.735 | 1.689 | 0.122 | 0.001 | 0.90 | 0.018 | 116 | 4 |
| PV2_3 | 0.0011 | 0.049 | 42.489 | 1.631 | 0.205 | 0.006 | 0.79 | 0.019 | 119 | 5 |
| PV2_4 | 0.0010 | 0.052 | 47.546 | 1.537 | 0.133 | 0.001 | 0.89 | 0.019 | 119 | 4 |
| PV2_5 | 0.0014 | 0.022 | 14.934 | 0.470 | 0.544 | 0.006 | 0.33 | 0.022 | 142 | 4 |
| PV2_6 | 0.0013 | 0.020 | 14.402 | 0.470 | 0.558 | 0.006 | 0.31 | 0.022 | 138 | 5 |
| Oka208 | | | | | | | | | | |
| PV1 | 2,006 | 90,727 | 44.557 | 2.004 | 0.209 | 0.016 | 0.78 | 0.018 | 112 | 5 |
| PV2 | 2,127 | 92,231 | 43.726 | 2.517 | 0.198 | 0.014 | 0.80 | 0.018 | 117 | 7 |
| PV3 | 1,928 | 89,696 | 45.028 | 2.215 | 0.223 | 0.018 | 0.76 | 0.017 | 108 | 5 |
| PV4 | 2,163 | 92,836 | 42.614 | 2.005 | 0.223 | 0.015 | 0.76 | 0.018 | 115 | 5 |
| PV5 | 2,329 | 104,011 | 46.008 | 2.261 | 0.211 | 0.016 | 0.78 | 0.017 | 108 | 5 |
| PV6 | 2,079 | 91,906 | 43.869 | 1.961 | 0.207 | 0.018 | 0.79 | 0.018 | 115 | 5 |
| PV7 | 2,130 | 94,597 | 44.558 | 2.351 | 0.225 | 0.017 | 0.76 | 0.017 | 109 | 6 |
| PV7_2 | 2,137 | 96,161 | 44.041 | 2.579 | 0.216 | 0.011 | 0.77 | 0.018 | 112 | 7 |
| Oka209 | | | | | | | | | | |
| PV2 | 0.0004 | 0.017 | 38.887 | 1.274 | 0.244 | 0.003 | 0.74 | 0.019 | 121 | 4 |
| PV2_2 | 0.0004 | 0.019 | 48.124 | 1.593 | 0.159 | 0.002 | 0.85 | 0.018 | 113 | 4 |
| PV3 | 0.0006 | 0.029 | 48.942 | 1.685 | 0.144 | 0.002 | 0.87 | 0.018 | 114 | 4 |
| PV3_2 | 0.0006 | 0.033 | 50.112 | 1.714 | 0.140 | 0.002 | 0.88 | 0.017 | 112 | 4 |
| PV4 | 0.0006 | 0.028 | 47.879 | 1.605 | 0.147 | 0.002 | 0.87 | 0.018 | 116 | 4 |
| PV4_2 | 0.0006 | 0.030 | 43.947 | 1.397 | 0.189 | 0.003 | 0.81 | 0.018 | 118 | 4 |
| PV5 | 0.0006 | 0.028 | 44.530 | 1.509 | 0.162 | 0.002 | 0.85 | 0.019 | 121 | 4 |
| PV5_2 | 0.0006 | 0.028 | 44.981 | 1.481 | 0.158 | 0.002 | 0.85 | 0.019 | 121 | 4 |
| Oka137 | | | | | | | | | | |
| PV1 | 0.0009 | 0.042 | 45.790 | 1.615 | 0.165 | 0.002 | 0.84 | 0.018 | 118 | 4 |
| PV1_2 | 0.0012 | 0.018 | 13.855 | 0.500 | 0.560 | 0.006 | 0.31 | 0.022 | 143 | 5 |
| PV3 | 0.0012 | 0.019 | 14.283 | 0.478 | 0.552 | 0.006 | 0.32 | 0.022 | 143 | 5 |
| PV3_2 | 0.0011 | 0.017 | 14.344 | 0.464 | 0.559 | 0.006 | 0.31 | 0.022 | 138 | 4 |
| PV4 | 0.0010 | 0.020 | 18.015 | 0.587 | 0.504 | 0.005 | 0.39 | 0.021 | 137 | 4 |
| PV4_2 | 0.0011 | 0.020 | 17.352 | 0.636 | 0.517 | 0.005 | 0.37 | 0.021 | 135 | 5 |
| PV5 | 0.0011 | 0.028 | 23.512 | 0.936 | 0.427 | 0.005 | 0.49 | 0.021 | 133 | 5 |
| PV5_2 | 0.0009 | 0.041 | 42.112 | 1.336 | 0.228 | 0.004 | 0.76 | 0.018 | 115 | 4 |
| Oka73 | | | | | | | | | | |
| PV3 | 0.0009 | 0.039 | 39.781 | 1.357 | 0.235 | 0.003 | 0.75 | 0.019 | 120 | 4 |
| PV4 | 0.0014 | 0.027 | 17.431 | 0.686 | 0.515 | 0.005 | 0.37 | 0.021 | 136 | 5 |
| PV7 | 0.0006 | 0.028 | 42.803 | 1.349 | 0.148 | 0.002 | 0.87 | 0.020 | 129 | 4 |
| PV7_2 | 0.0007 | 0.033 | 45.200 | 1.532 | 0.160 | 0.002 | 0.85 | 0.019 | 120 | 4 |
| PV8 | 0.0021 | 0.059 | 26.176 | 1.013 | 0.395 | 0.007 | 0.53 | 0.020 | 130 | 5 |
| PV9 | 0.0018 | 0.093 | 50.231 | 1.697 | 0.123 | 0.002 | 0.90 | 0.018 | 115 | 4 |
A recent geochronological study by Chen
et al. [
15] focused on the Nb-disilicate mineral, niocalite, for which Oka is the type locality. Niocalite from one of the carbonatite samples investigated by Chen
et al. [
15] also indicates a bimodal age distribution with weighted mean
206Pb/
238U ages of 110.1 ± 5.0 and 133.2 ± 6.1 Ma, and overlaps that of co-existing apatite for the same sample [
15]. Niocalite from two other carbonatite samples yield younger ages of 110.6 ± 1.2 and 115.0 ± 1.9 Ma [
15].
In summary, a total of 293
in-situ U-Pb apatite ages yield a bimodal distribution pattern using the Kernel Density Estimation (KDE) diagram (
Figure 11A; KDE is a standard statistical technique used for estimating the density distribution in geochronlogical studies) [
57], with two peaks at ~126 and ~115 Ma. The variable perovskite ages indicate an additional older age peak at 135.4 ± 3.2 Ma (
Figure 11D), which is similar (given the associated uncertainties) to the age of 131 ± 7 Ma for perovskite obtained by Cox and Wilton [
13]. In contrast, the niocalite U-Pb dating results tend to converge toward the younger age, with a peak at 112.6 ± 1.2 Ma (
Figure 11C) [
15]. The majority of the combined
in situ U-Pb dating results for apatite, perovskite, and niocalite from Oka clearly support a protracted history of magmatic activity in the order of ~10–15 million years (
Figure 11A).
Figure 11.
Kernel Density Estimation (KDE) plots for the weighted mean 206Pb/238U ages for the different rock/mineral groups. (A) The entire geochronological data for Oka (n = 363); (B) apatite (n = 293); (C) niocalite (n = 38); (D) perovskite (n = 32); (E) carbonatite (n = 160); (F) okaite (n = 101); (G) ijolite (n = 44); (H) alnöite (n = 41).
3.3. Radiogenic Isotope Data
The Sr and Nd isotope results for perovskite and apatite obtained here are listed in
Table 8 and shown in
Figure 12. Overall, Rb concentrations are below (or close to) the detection limit, and consequently the calculated Rb/Sr ratios are extremely low so that the age correction of the measured
87Sr/
86Sr ratio is negligible. For the Sm-Nd data, a correction for radiogenic
143Nd was applied, and ages used for the correction were based on the U/Pb dating results obtained here. The
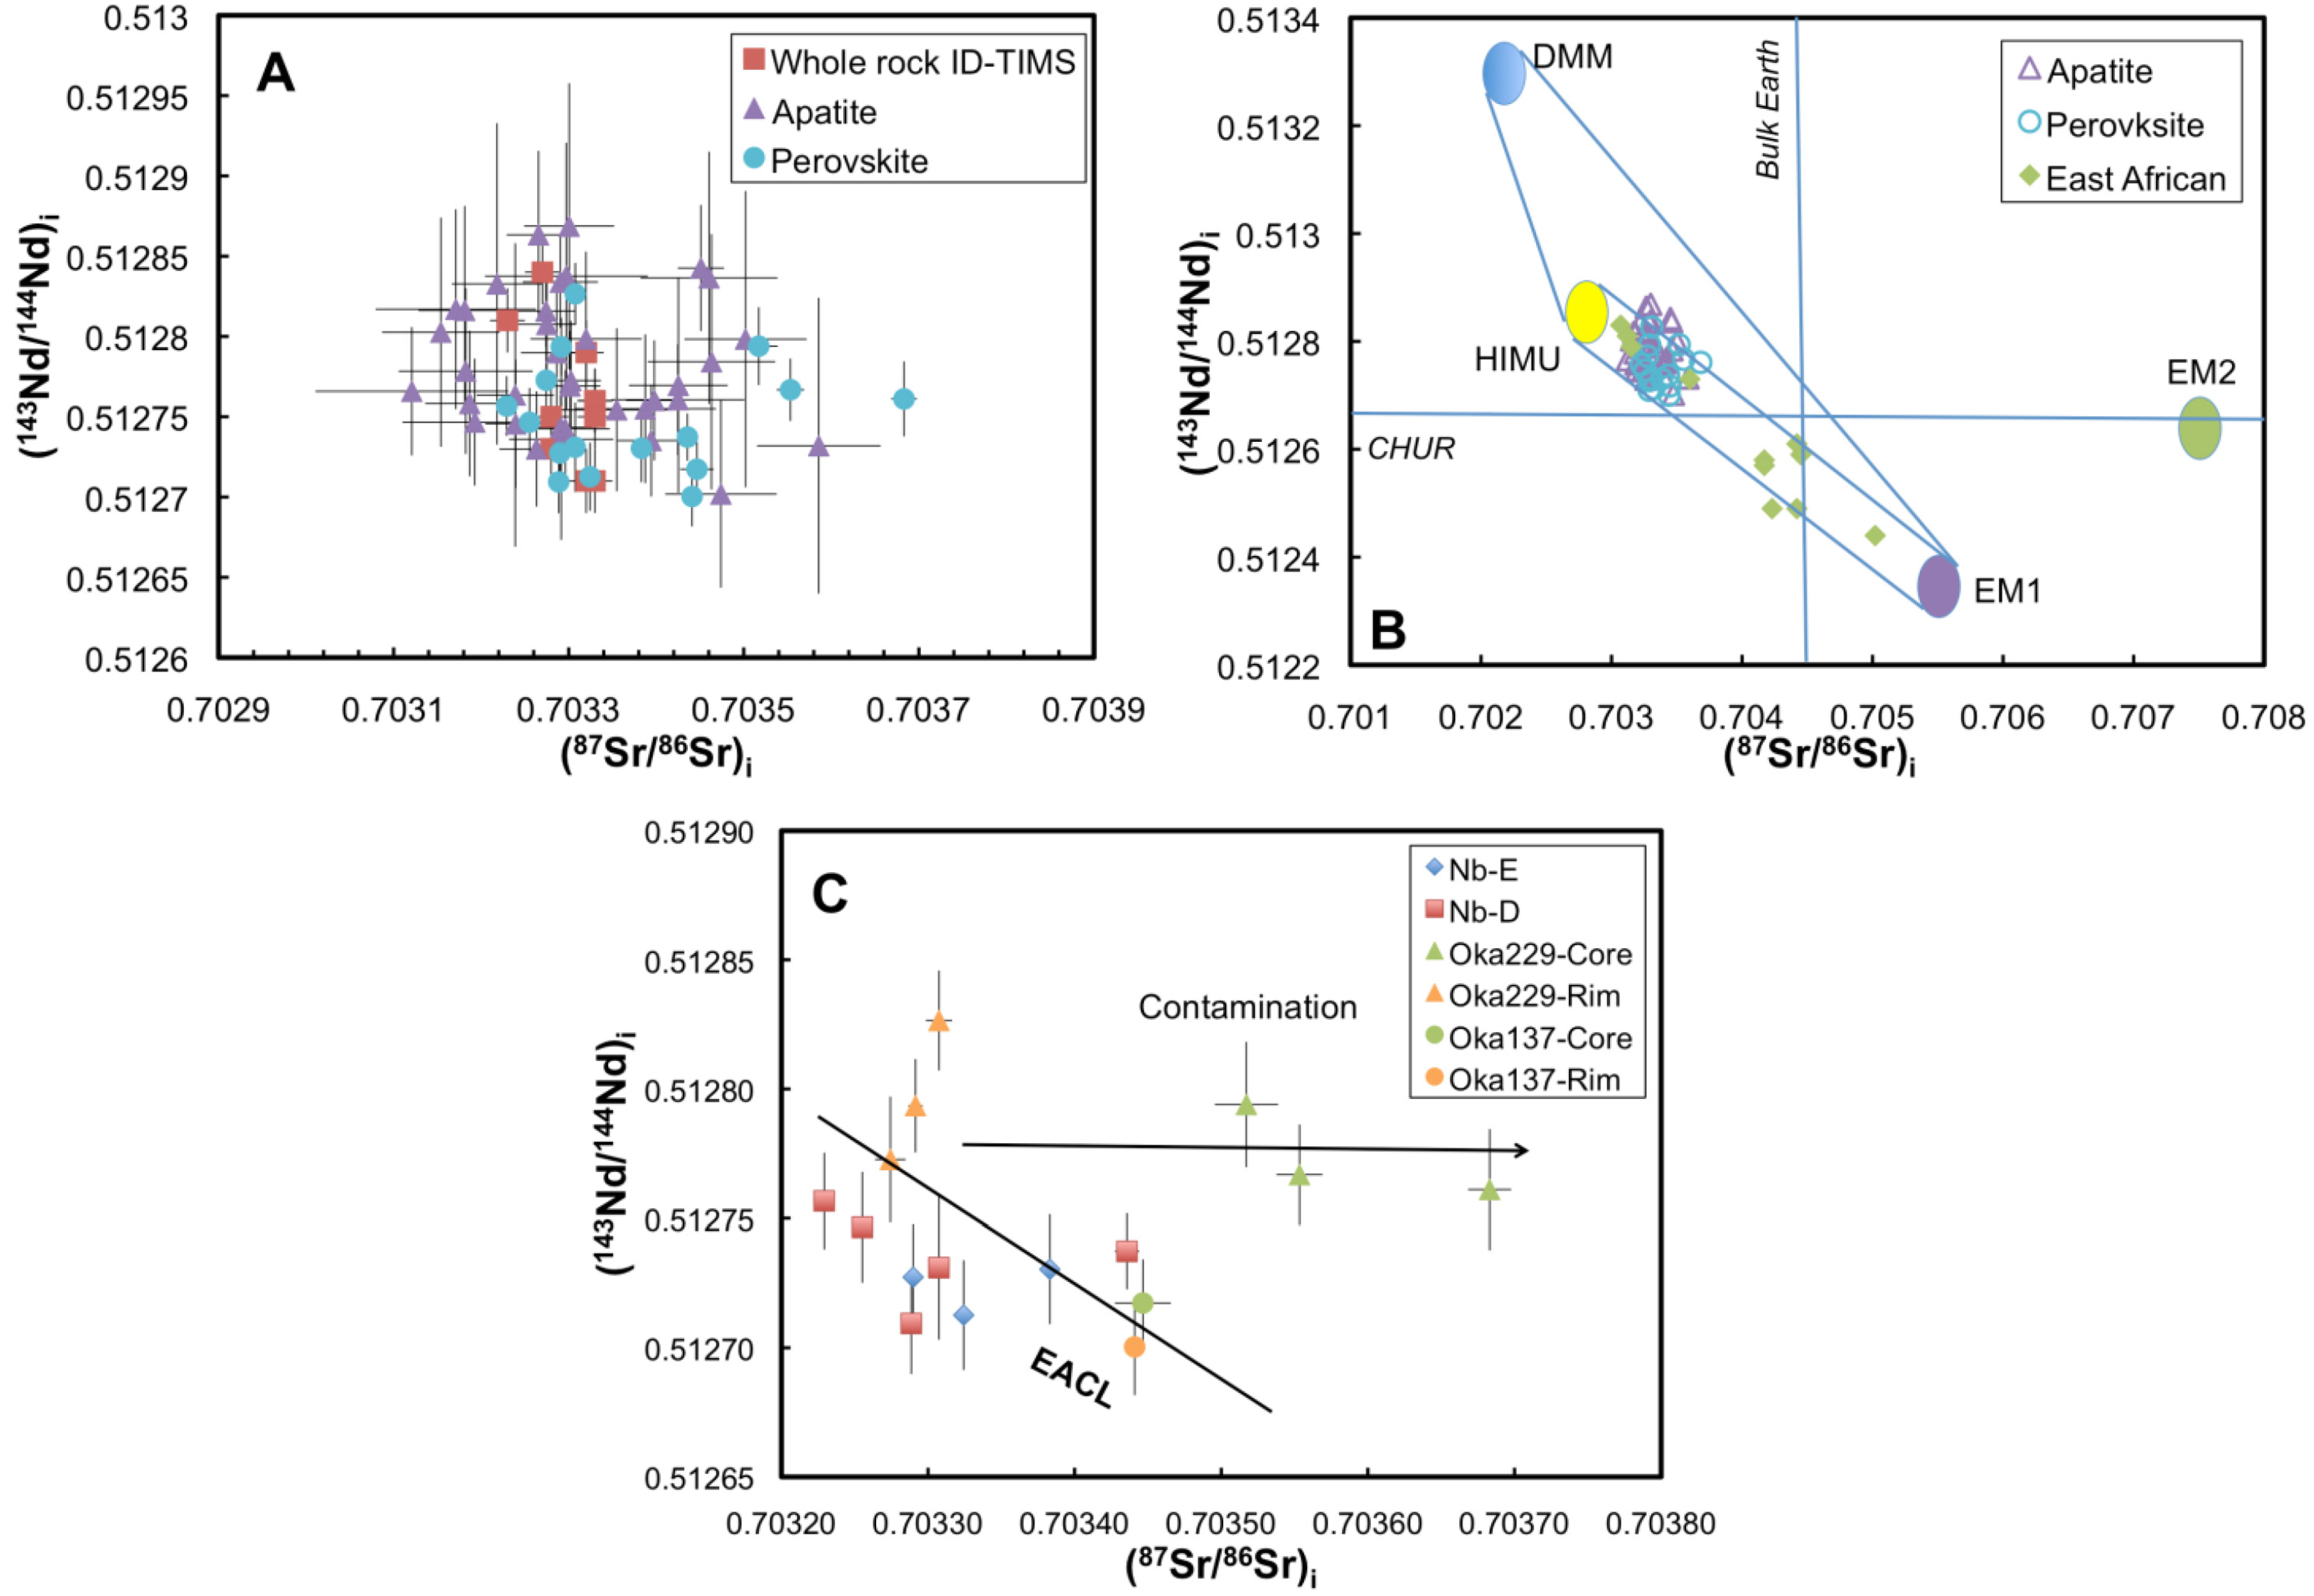
in-situ Sr and Nd isotope data for both perovskite and apatite overlap the entire range defined by previously reported whole rock data for carbonatite from Oka [
12], but definitely indicate a larger variation (
87Sr/
86Sr: 0.70312–0.70367;
143Nd/
144Nd: 0.51270–0.51286), and is not consistent with closed-system behavior (
Figure 12A). Of interest, the Nd and Sr isotope data from Oka overlap the upper end of the East African Carbonatite Line (EACL;
Figure 12B) [
58]. The EACL is defined by the Nd-Sr isotope values for young (<40 Ma old) East African carbonatites, and was interpreted to represent mixing between two end-member mantle components: HIMU (mantle component with time integrated, high
238U/
204Pb ratio)- and EMI (enriched mantle 1)-like.
Figure 12.
(
A) Diagram of
143Nd/
144Nd
vs. 87Sr/
86Sr shows data obtained in this study and by Wen
et al. [
12]. (
B) Plot of
143Nd/
144Nd
vs. 87Sr/
86Sr. Also shown are the East African Carbonatite Line (EACL) from Bell and Blenkinsop [
58], and CHUR and Bulk Earth (BE) values for comparison. (
C) Diagram of
143Nd/
144Nd
vs. 87Sr/
86Sr values for the different groups of perovskite.
Table 8.
In-situ Sr and Nd isotopic compositions for perovskite and apatite by LA-MC-ICP-MS.
Table 8.
In-situ Sr and Nd isotopic compositions for perovskite and apatite by LA-MC-ICP-MS.
| Sample | Analysis | (87Sr/86Sr)i | 2σ | 143Nd/144Nd | (143Nd/144Nd)i | 2σ |
|---|
| Oka4b | AP1 | 0.70327 | 0.00004 | 0.51283 | 0.51279 | 0.00004 |
| AP7 | 0.70326 | 0.00004 | 0.51277 | 0.51273 | 0.00004 |
| AP12 | 0.70330 | 0.00003 | 0.51281 | 0.51277 | 0.00004 |
| Oka51 | AP1 | 0.70329 | 0.00006 | 0.51279 | 0.51274 | 0.00006 |
| AP5 | 0.70330 | 0.00005 | 0.51292 | 0.51287 | 0.00009 |
| AP8 | 0.70343 | 0.00006 | 0.51282 | 0.51277 | 0.00007 |
| AP14 | 0.70319 | 0.00005 | 0.51281 | 0.51276 | 0.00005 |
| Oka72 | AP2 | 0.70349 | 0.00003 | 0.51275 | 0.51270 | 0.00018 |
| AP17 | 0.70346 | 0.00007 | 0.51283 | 0.51278 | 0.00008 |
| Oka153 | AP22 | 0.70345 | 0.00003 | 0.51277 | 0.51272 | 0.00003 |
| Oka200a | AP6 | 0.70322 | 0.00005 | 0.51288 | 0.51283 | 0.00010 |
| AP12 | 0.70350 | 0.00008 | 0.51284 | 0.51275 | 0.00013 |
| Oka206 | AP1 | 0.70327 | 0.00003 | 0.51285 | 0.51281 | 0.00003 |
| AP13_1 | 0.70329 | 0.00004 | 0.51287 | 0.51283 | 0.00003 |
| Oka21 | AP10 | 0.70332 | 0.00006 | 0.51284 | 0.51280 | 0.00005 |
| AP11 | 0.70315 | 0.00007 | 0.51285 | 0.51280 | 0.00007 |
| AP14 | 0.70330 | 0.00009 | 0.51288 | 0.51284 | 0.00008 |
| Oka31 | AP1 | 0.70329 | 0.00004 | 0.51285 | 0.51281 | 0.00004 |
| AP5 | 0.70324 | 0.00003 | 0.51281 | 0.51276 | 0.00004 |
| AP7 | 0.70330 | 0.00003 | 0.51283 | 0.51279 | 0.00004 |
| AP11 | 0.70327 | 0.00003 | 0.51279 | 0.51275 | 0.00004 |
| AP12 | 0.70329 | 0.00004 | 0.51281 | 0.51277 | 0.00003 |
| Oka89 | AP2 | 0.70359 | 0.00007 | 0.51277 | 0.51273 | 0.00009 |
| AP3 | 0.70347 | 0.00006 | 0.51274 | 0.51270 | 0.00006 |
| AP9 | 0.70346 | 0.00008 | 0.51288 | 0.51284 | 0.00008 |
| Oka138 | AP4 | 0.70340 | 0.00003 | 0.51281 | 0.51276 | 0.00004 |
| AP6 | 0.70330 | 0.00005 | 0.51279 | 0.51274 | 0.00004 |
| AP7 | 0.70339 | 0.00004 | 0.51278 | 0.51274 | 0.00003 |
| AP13 | 0.70339 | 0.00008 | 0.51280 | 0.51275 | 0.00005 |
| AP14 | 0.70342 | 0.00008 | 0.51281 | 0.51276 | 0.00003 |
| AP19 | 0.70335 | 0.00006 | 0.51280 | 0.51275 | 0.00005 |
| Oka229 | AP7 | 0.70319 | 0.00008 | 0.51280 | 0.51275 | 0.00004 |
| AP18 | 0.70318 | 0.00008 | 0.51283 | 0.51278 | 0.00005 |
| AP19 | 0.70312 | 0.00011 | 0.51282 | 0.51277 | 0.00004 |
| AP20 | 0.70317 | 0.00009 | 0.51286 | 0.51282 | 0.00006 |
| Oka75 | AP8 | 0.70336 | 0.00004 | 0.51279 | 0.51272 | 0.00016 |
| AP12 | 0.70349 | 0.00005 | 0.51278 | 0.51271 | 0.00021 |
| AP13 | 0.70342 | 0.00005 | 0.51290 | 0.51283 | 0.00007 |
| Oka132 | AP8 | 0.70353 | 0.00007 | 0.51287 | 0.51280 | 0.00013 |
| AP9 | 0.70350 | 0.00007 | 0.51286 | 0.51280 | 0.00009 |
| AP10 | 0.70364 | 0.00008 | 0.51299 | 0.51293 | 0.00016 |
| AP18 | 0.70367 | 0.00006 | 0.51288 | 0.51282 | 0.00013 |
| Oka137 | PV1_1 | 0.70345 | 0.00002 | 0.51277 | 0.51272 | 0.00002 |
| PV1_2 | 0.70344 | 0.00001 | 0.51275 | 0.51270 | 0.00002 |
| PV3_2 | 0.70338 | 0.00001 | 0.51277 | 0.51273 | 0.00002 |
| PV4_2 | 0.70332 | 0.00000 | 0.51276 | 0.51271 | 0.00002 |
| PV5 | 0.70329 | 0.00000 | 0.51277 | 0.51273 | 0.00002 |
| PV5_2 | 0.70344 | 0.00001 | 0.51278 | 0.51274 | 0.00001 |
| Oka209 | PV2_1 | 0.70323 | 0.00000 | 0.51281 | 0.51276 | 0.00002 |
| PV2_2 | 0.70326 | 0.00001 | 0.51280 | 0.51275 | 0.00002 |
| PV4 | 0.70329 | 0.00000 | 0.51276 | 0.51271 | 0.00002 |
| PV5 | 0.70331 | 0.00001 | 0.51279 | 0.51273 | 0.00003 |
| Oka229 | PV2_1 | 0.70329 | 0.00000 | 0.51284 | 0.51279 | 0.00002 |
| PV2_2 | 0.70352 | 0.00002 | 0.51285 | 0.51279 | 0.00002 |
| PV2_3 | 0.70355 | 0.00002 | 0.51282 | 0.51277 | 0.00002 |
| PV2_4 | 0.70368 | 0.00001 | 0.51281 | 0.51276 | 0.00002 |
| PV2_5 | 0.70327 | 0.00001 | 0.51282 | 0.51277 | 0.00002 |
| PV2_6 | 0.70331 | 0.00001 | 0.51287 | 0.51283 | 0.00002 |


