Article

Biomineralization Patterns of Intracellular Carbonatogenesis in Cyanobacteria: Molecular Hypotheses

1
IMPMC, CNRS UMR 7590, Sorbonne Universités, MNHN, UPMC, IRD UMR 206, Paris 75005, France
2
Key Laboratory of Earth and Planetary Physics, Institute of Geology and Geophysics, Chinese Academy of Sciences, Beijing 100029, China
3
Laboratoire de Réactivité de Surface (LRS), Sorbonne Universités, UMR CNRS 7197, UPMC Univ Paris 06, 3 rue Galilée, Ivry-sur-Seine 94200, France
4
Sorbonne Universités, UPMC Univ. Paris 06, UJF, CNRS, IMT, NUS, Image and Pervasive Access Lab. (IPAL), Singapore 138632, Singapore
5
Bioinformatics Institute, Agency for Science, Technology and Research (A*STAR), Singapore 138671, Singapore
6
France Chimie Métallurgique des Terres Rares, ICMPE, UMR 7182, CNRS, 2-8 rue Henri Dunant, 94320 Thiais Cedex, France
7
Geomicrobiology Laboratory, Department of Geological Sciences, University of Colorado, Boulder, CO 80309-0450, USA
8
Unité d’Ecologie, Systématique et Evolution, CNRS UMR 8079, Université Paris-Sud, Orsay Cedex 91405, France
9
CEA, CNRS, Université Paris-Sud, I2BC UMR9198, LBBC, Bat 142 CEA-Saclay, F-91191 Gif sur Yvette Cedex, France
*
Author to whom correspondence should be addressed.
Minerals 2016, 6(1), 10; https://doi.org/10.3390/min6010010
Submission received: 25 November 2015 / Revised: 20 January 2016 / Accepted: 25 January 2016 / Published: 3 February 2016

Abstract

:
The recent discovery of intracellular carbonatogenesis in several cyanobacteria species has challenged the traditional view that this process was extracellular and not controlled. However, a detailed analysis of the size distribution, chemical composition and 3-D-arrangement of carbonates in these cyanobacteria is lacking. Here, we characterized these features in Candidatus Gloeomargarita lithophora C7 and Candidatus Synechococcus calcipolaris G9 by conventional transmission electron microscopy, tomography, ultramicrotomy, and scanning transmission X-ray microscopy (STXM). Both Ca. G. lithophora C7 and Ca. S. calcipolaris G9 formed numerous polyphosphate granules adjacent or engulfing Ca-carbonate inclusions when grown in phosphate-rich solutions. Ca-carbonates were scattered within Ca. G. lithophora C7 cells under these conditions, but sometimes arranged in one or several chains. In contrast, Ca-carbonates formed at cell septa in Ca. S. calcipolaris G9 and were segregated equally between daughter cells after cell division, arranging as distorted disks at cell poles. The size distribution of carbonates evolved from a positively to a negatively skewed distribution as particles grew. Conventional ultramicrotomy did not preserve Ca-carbonates explaining partly why intracellular calcification has been overlooked in the past. All these new observations allow discussing with unprecedented insight some nucleation and growth processes occurring in intracellularly calcifying cyanobacteria with a particular emphasis on the possible involvement of intracellular compartments and cytoskeleton.

1. Introduction

Cyanobacteria are abundant and widespread photosynthetic bacteria which have contributed massively to the primary production of some ecosystems for more than ~2.3 billion years [1,2]. The biomineralization of carbonates by cyanobacteria has received much interest for several decades [3,4,5,6,7]. Cyanobacteria favor the precipitation of carbonate minerals by fixing CO2 by RuBisCO [8,9]. Therefore, they have been considered as major contributors to the formation of carbonates rocks such as stromatolites, which are found abundantly in the geological record up to ~3.5 Ga ago [10] and whitings, which are ephemeral square kilometer-sized milk-white patches in lakes or shallow tropical seas [11]. Finally, it has been suggested repeatedly that cyanobacterial calcification might be used for carbon capture and sequestration [12,13].
Until recently, the formation of carbonates by cyanobacteria has invariably been considered as an extracellular and biologically induced mineralization process [14,15,16]. Many studies have measured the rates of extracellular calcification by diverse cyanobacterial species [7,17,18,19]. The general model proposes that cyanobacteria import HCO3, which is enzymatically converted to CO2 and OH within the cells. CO2 is subsequently fixed by RuBisCO, while OH production is balanced by H+ import. This buffers the cytoplasmic pH and results in the production of an alkaline microenvironment around the cell. At least part of the H+ import is coupled with an active export of Ca2+ from the cells [20,21]. Altogether, these transports of H+ and Ca2+ increase the saturation of the extracellular solution with carbonates. As a result, various carbonate phases such as calcite (CaCO3), Mg-calcite ((Mg,Ca)CO3), aragonite (CaCO3) or hydromagnesite (Mg5(CO3)4(OH)2·4H2O) can precipitate depending on the chemical conditions prevailing in the cyanobacterial environment [22,23].
However, diverse cyanobacterial taxa have been shown recently to form carbonates intracellularly [24]. Couradeau et al. [25] first described this biomineralization process in a deep-branching cyanobacterial species, Candidatus Gloeomargarita lithophora, isolated from a highly alkaline lake in Mexico. They showed that the cells formed intracellular Ca-Mg-Sr-Ba carbonate inclusions measuring several hundreds of nanometers in diameter and increasing the density of the cells by as much as 12%. These carbonate inclusions were amorphous by electron diffraction. Couradeau et al. [25] suggested among other possibilities that such an intracellular carbonate precipitation may act as a pH buffering system possibly serving as an efficient carbon concentrating mechanism. Benzerara et al. [26] discovered additional diverse unicellular cyanobacterial taxa forming intracellular electron diffraction amorphous Ca-carbonates, including strains deposited in culture collections, which were isolated from diverse environments around the world. Based on transmission electron microscopy (TEM) images, Benzerara et al. [26] described two different distribution patterns of the carbonate inclusions in these strains: (i) one with Ca-carbonate inclusions apparently scattered within the cell cytoplasm such as in Ca. G. lithophora; and (ii) another one in which Ca-carbonate inclusions likely formed at the cell division septum, and were subsequently located preferentially at the cell poles such as in Candidatus Synechococcus calcipolaris. This last pattern was detected in all the studied members of a particular phylogenetic clade which included Thermosynechococcus elongatus BP-1, showing that intracellular calcification at the division septum constitutes a synapomorphy (shared inherited trait) in all members of this clade. Benzerara et al. [26] briefly mentioned some mechanisms possibly involved in the biomineralization of intracellular carbonates but only based on a few SEM and conventional TEM observations.
By using specific 16S rDNA primers, Ragon et al. [27] evidenced the presence of members of the Ca. G. lithophora and T. elongatus lineages in many biotopes around the world including carbonate rocks from several Mexican lakes, karstic areas and thermophilic or hypersaline microbial mats collected in South America and Europe. Amarouche-Yala et al. [28] also found 16S rDNA sequences phylogenetically close to Ca. G. lithophora in hot springs in Algeria. Overall, these studies demonstrated that, intracellularly, calcifying cyanobacteria are phylogenetically diverse and geographically widespread. Bacterial intracellular carbonatogenesis is even more widely distributed phylogenetically and geographically when one considers the large yet-uncultured sulfur bacterium Achromatium oxaliferum which has been shown to form intracellular (crystalline) calcite [29,30] and has fostered significant interest recently [31,32].
Yet, the mechanisms involved in intracellular calcification and the molecular properties differentiating intracellularly calcifying cyanobacteria from other cyanobacteria remain unknown. Cam et al. [33] abiotically synthesized amorphous carbonates with a chemical composition, a morphology and a size similar to the carbonates formed by Ca. G. lithophora. However, this was performed in solutions highly supersaturated with carbonate phases, while it is commonly assumed that cyanobacterial cells regulate their cytoplasmic chemical composition below Ca-carbonate saturation, with a Ca concentration around 100 nM, a near-neutral pH and a high inorganic carbon content around 30 mM [21,34,35]. These conditions are not conducive to the formation of intracellular carbonates, which clearly shows that our understanding of this process is still too limited.
A better assessment of the precise distribution, as well as the chemical and morphological features of intracellular carbonate inclusions formed by cyanobacteria is needed to constrain hypotheses about the formation mechanisms. So far, only 2-D TEM images of carbonate inclusions in cyanobacteria have been provided by Benzerara et al. [26]. Here, we present new scanning transmission X-ray microscopy, 2-D electron microscopy and 3-D electron tomography data acquired on both Candidatus Gloeomargarita lithophora C7 and Candidatus Synechococcus calcipolaris G9. Based on these new observations and a review of the literature, we discuss with unprecedented detail the molecular pathways possibly involved in the formation of intracellular carbonates in both cyanobacterial groups.

2. Materials and Methods

2.1. Bacterial Culture and Sample Preparation

Two cyanobacterial strains enriched from the alkaline Lake Alchichica in Mexico were used in the present study: Ca. G. lithophora C7 and Ca. S. calcipolaris G9 [25,26]. Both strains were cultured in media BG-11 and MS-2. Medium BG-11 has been commonly used to culture cyanobacteria [36], while MS-2, which did not contain supplemented phosphate and had a higher Mg/Ca ratio, was designed to mimic chemical conditions existing in Lake Alchichica. Briefly, 1 L of BG-11 medium contained 17.65 mM of NaNO3, 0.18 mM of K2HPO4·3H2O, 0.3 mM of MgSO4·7H2O, 0.25 mM of CaCl2·2H2O, 0.03 mM citric acid, 0.03 mM of ferric ammonium citrate, 0.003 mM EDTA, 0.38 mM of Na2CO3, and 1 mL of trace mineral solution (noted as A5 + Co in [36]). One liter of MS-2 medium contained 8 mM of NaNO3, 0.5 mM of KCl, 6 mM of MgSO4·7H2O, 0.1 mM of CaCl2·2H2O, 0.03 mM citric acid, 13 mM of NaHCO3, and 1 mL of A5 + Co solution. All cultures were carried out at 22 °C for one week to three months under an alternation of 12 h-light and 12 h-darkness. One sample analyzed by electron tomography was collected from an aquarium, where microbialites from Lake Alchichica were incubated as described by Couradeau et al. [25]. The typical chemical composition of the solution in this aquarium is provided by Couradeau et al. [25].
For microscopy sample preparation, 0.5 mL of culture was centrifuged at 5000 g for 10 min at 4 °C. Cell pellets were washed three times in Milli-Q (mQ) water (Millipore, Billerica, MA, USA) and suspended in 200 µL of mQ water. For TEM experiments, a drop of 5 µL of cell suspension was deposited on a carbon-coated 200-mesh copper grid and dried at ambient temperature. For scanning transmission X-ray microscopy (STXM) analyses, the cells were deposited on silicon nitride windows.

2.2. Transmission Electron Microscopy Analyses

Conventional TEM analyses were carried out on a JEOL-2100F (JEOL Ltd., Tokyo, Japan) microscope operating at 200 kV. This microscope was equipped with a field emission gun, an ultra-high resolution (UHR) pole piece, a Gatan energy filter (GIF200) system (Gatan, Inc., Pleasanton, CA, USA), a JEOL detector with an ultrathin window allowing detection of light elements, and a scanning TEM (STEM) device, which allowed Z-contrast imaging in high angle annular dark field (HAADF) mode. Chemical analyses were acquired by performing energy dispersive X-ray spectrometry (EDXS) mapping in the HAADF STEM mode. STEM EDX spectrum analysis was made using the JEOL Analysis Station software, and the semi-quantitative chemical microanalyses of individual carbonate and polyphosphate inclusions relied on the use of K-factors. After subtracting out the background noise in the EDX spectrum, the software performed a Gaussian fit of selected elemental peaks and calculated the area under the peaks. From this, the atomic percentage of selected element was assessed.
Bright-field TEM and HAADF-STEM tomography experiments were performed at 200 kV accelerating voltage on a JEOL-2100 microscope equipped with a LaB6 gun and on a Tecnai F20 microscope (FEI Company, Hillsboro, OR, USA) equipped with a Shottky field emission gun, respectively. Tomographic tilt series were obtained at ±70° with 2° intervals in the Saxton mode. Images at each angular increment were recorded by a 1024 × 1024 pixel Ultrascan cooled CCD detector (Gatan) for bright-field TEM images and with a Gatan 777 HAADF-STEM detector. The acquisition was performed using the Gatan Tomography package running under GMS1.8.5. Tomograms were reconstructed using the IMOD software package (University of Colorado, Boulder, CO, USA) or DIGIECT software [37].
The particle sizes (diameters) of carbonate inclusions were calculated from more than 200 measurements performed on HAADF-STEM images using Image J software (v1.50b). The frequency distribution of particle sizes was analyzed by the IBM SPSS Statistics software (v.22) (IBM, New York, NY, USA), and the skewness was calculated using the equation (µ − ν)/σ, where µ is the mean, ν is the median, and σ is the standard deviation. A skewness value of zero means that the distribution is symmetric (Gaussian distribution), while a positive skewness indicates an asymmetrical distribution with a long tail towards higher values, and a negative skewness indicates an asymmetrical distribution with a long tail towards lower values.

2.3. Sample Preparation for Conventional Ultramicrotomy

G. lithophora cells cultured in BG-11 were prepared for ultramicrotomy sectioning following a standard protocol used for ultrastructural studies of bacteria [24,36,38]. Briefly, cells were first fixed in 2% glutaraldehyde at 4 °C for 18 h, centrifuged (5000 g, 4 °C, 10 min), and rinsed three times in 10 mM HEPES buffer (pH 7) at ambient temperature. Some samples were then post-fixed in 1% OsO4 for 2 h in the same HEPES buffer, while duplicates were not treated by OsO4. Then, all samples were rinsed three times in distilled water, dehydrated in a graded ethanol series (50%–100%), transitioned through 1,2-propylene oxide and then progressively embedded in an Epon resin (Epon 812). Ultrathin sections (70-nm thick) were cut with a LEICA ultramicrotome (EM-UC6) and deposited on TEM copper grids. Some samples were stained with uranyl acetate (2% w/v) while others were not. G. lithophora cells were analyzed by (S)TEM imaging and STEM-EDXS mapping after each step of the protocol described above.

2.4. Scanning Transmission X-Ray Microscopy Analyses

STXM experiments were carried out at the P L2,3-edges. STXM and X-ray absorption near-edge structure (XANES) spectroscopy analyses were performed on beamline 11.0.2.2 at the Advanced Light Source (Lawrence Berkeley National Laboratory, Berkeley, CA, USA). The ALS storage ring was operated at 1.9 GeV and 500 mA current in a top-up mode. Energy calibration was achieved using the well-resolved 3p Rydberg peak of gaseous CO2 at 294.96 eV for the C K-edge. A 25-nm zone plate was used. Alignment of images of stacks and extraction of XANES spectra were done using the aXis2000 Software [39]. Carbonate inclusions were discriminated based on their different spectral signature at the C K-edge and the Ca L2,3-edges following the approach detailed by Cosmidis et al. [40].

3. Results

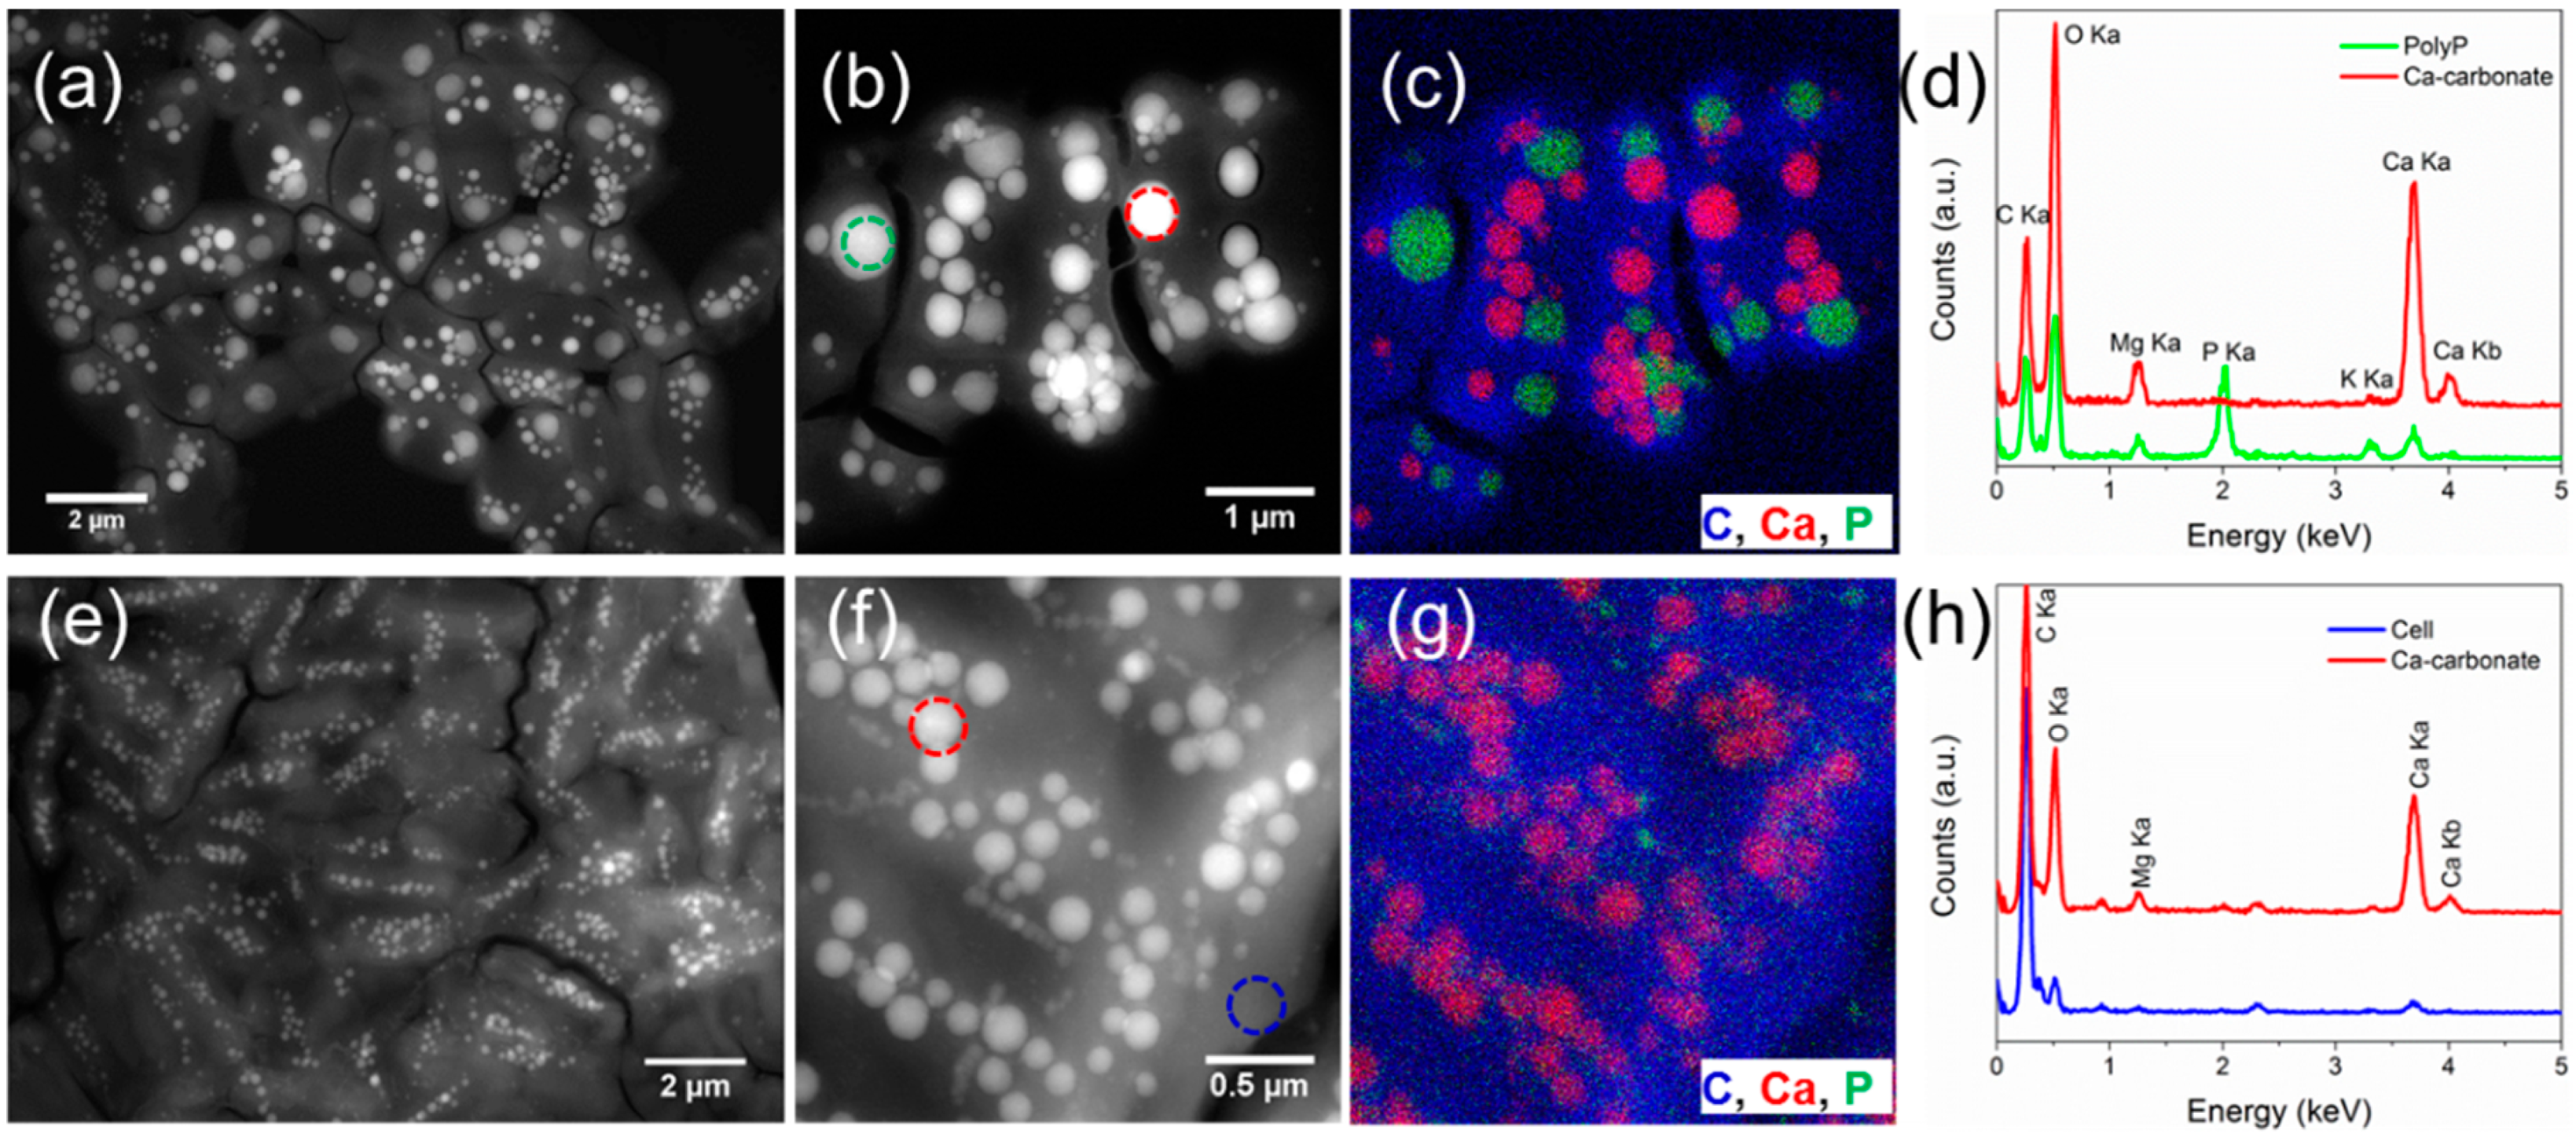
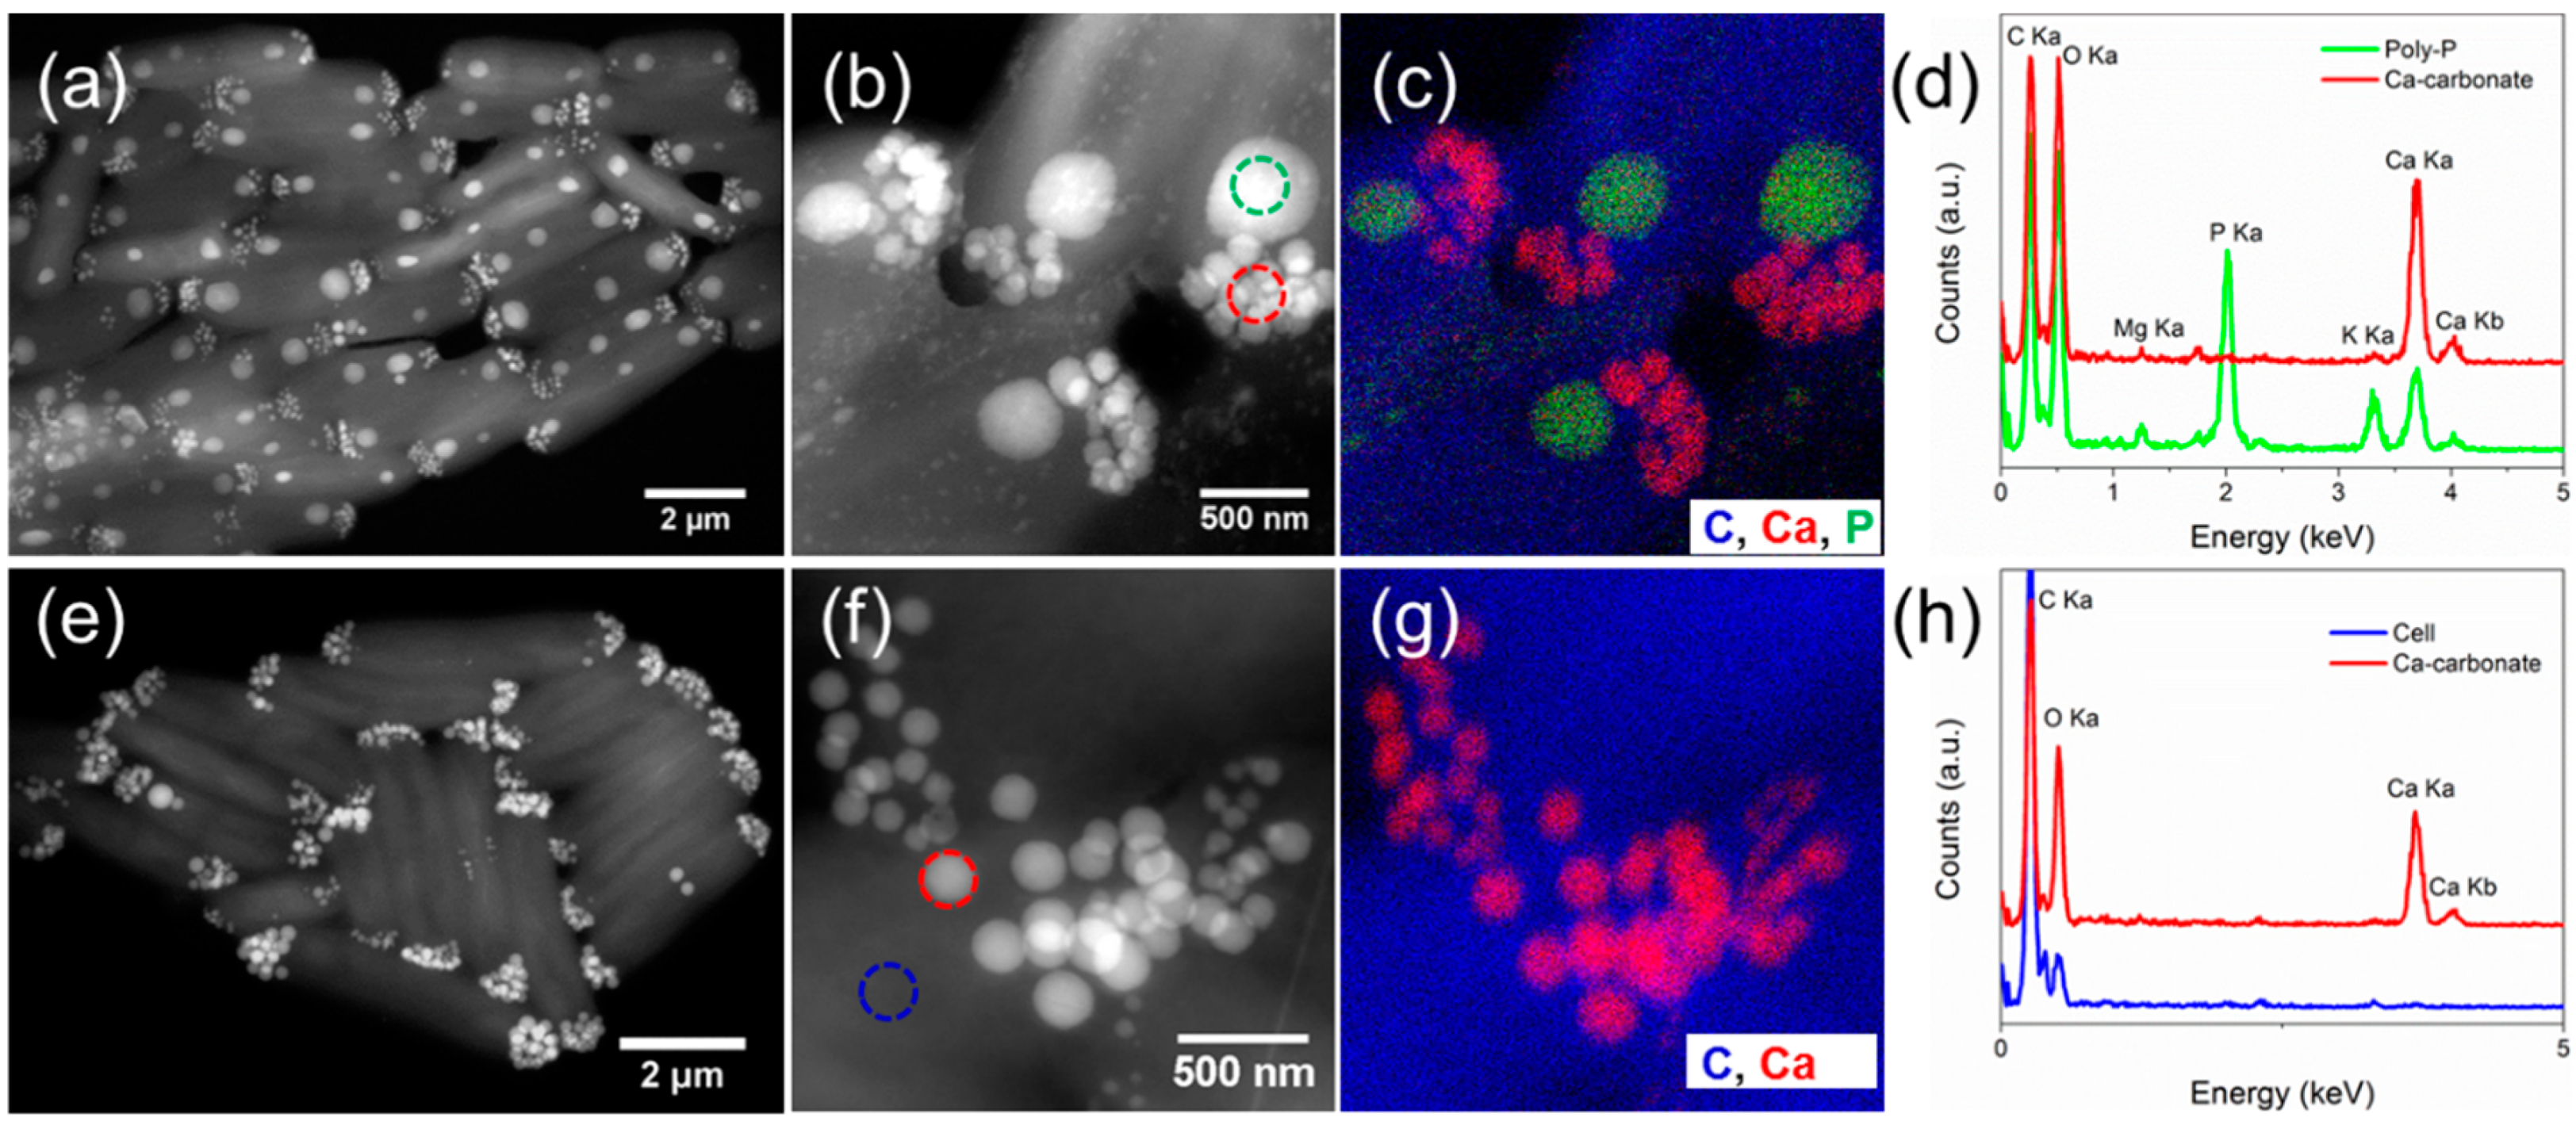
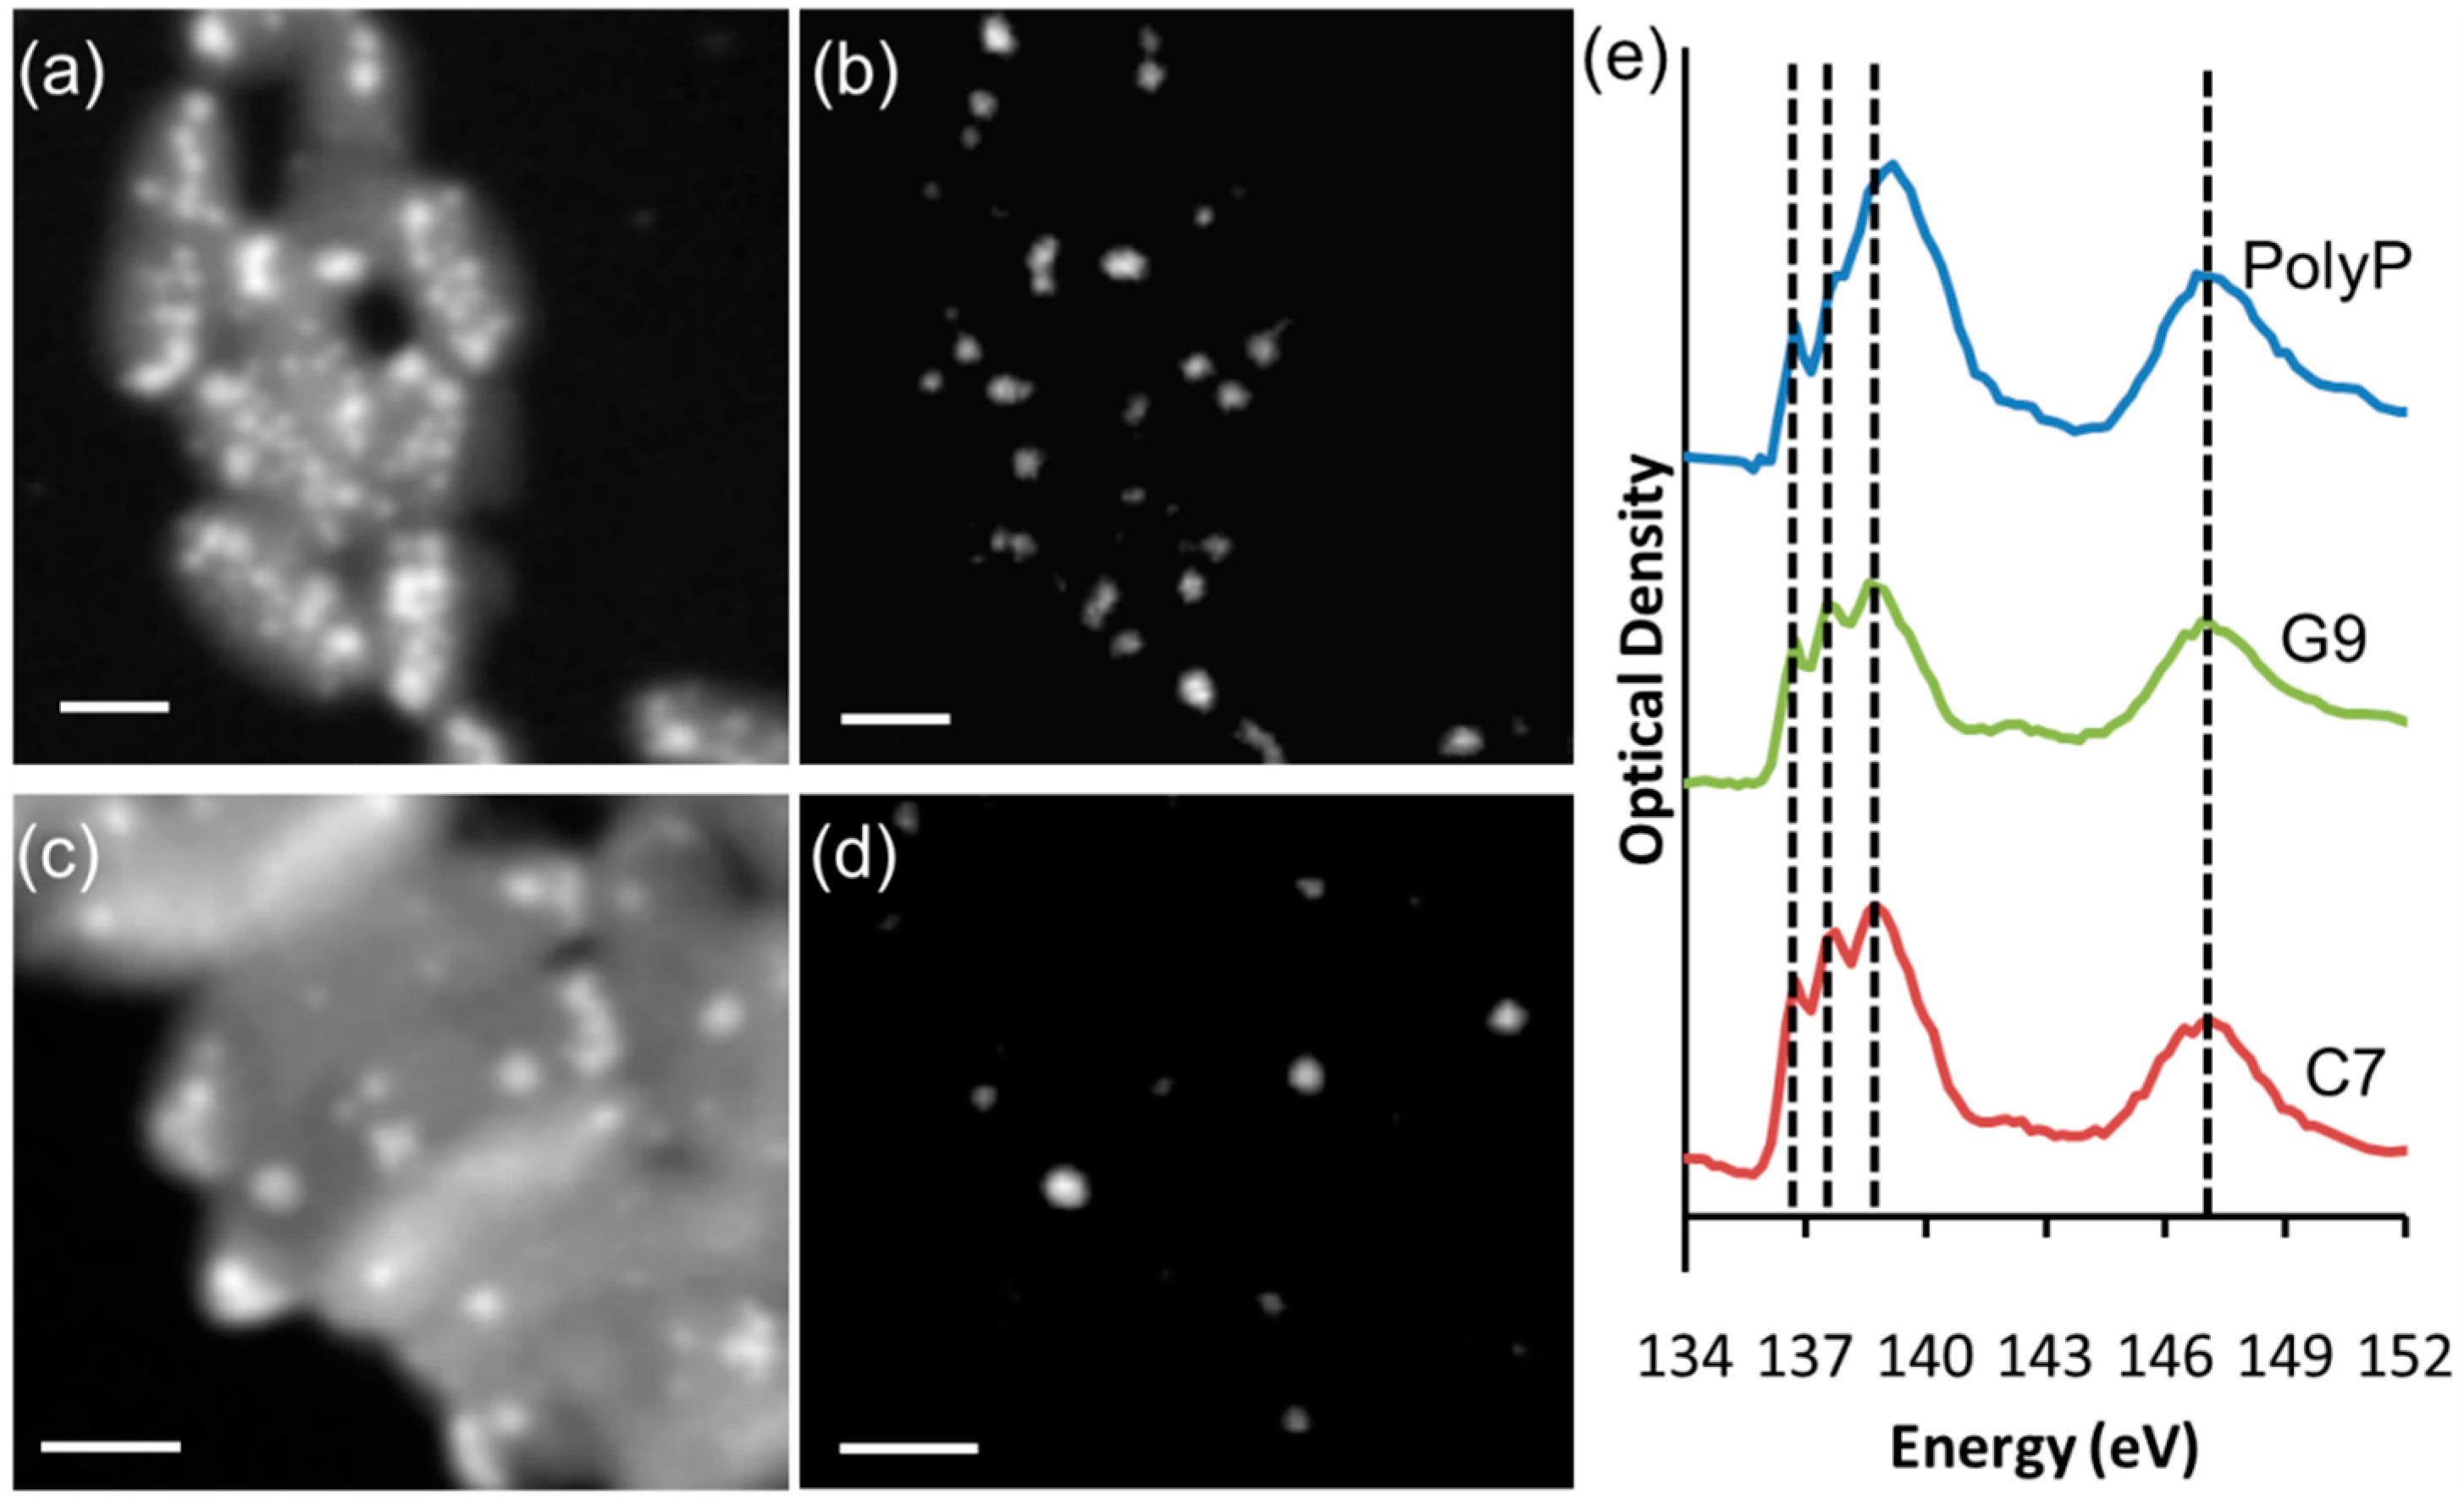
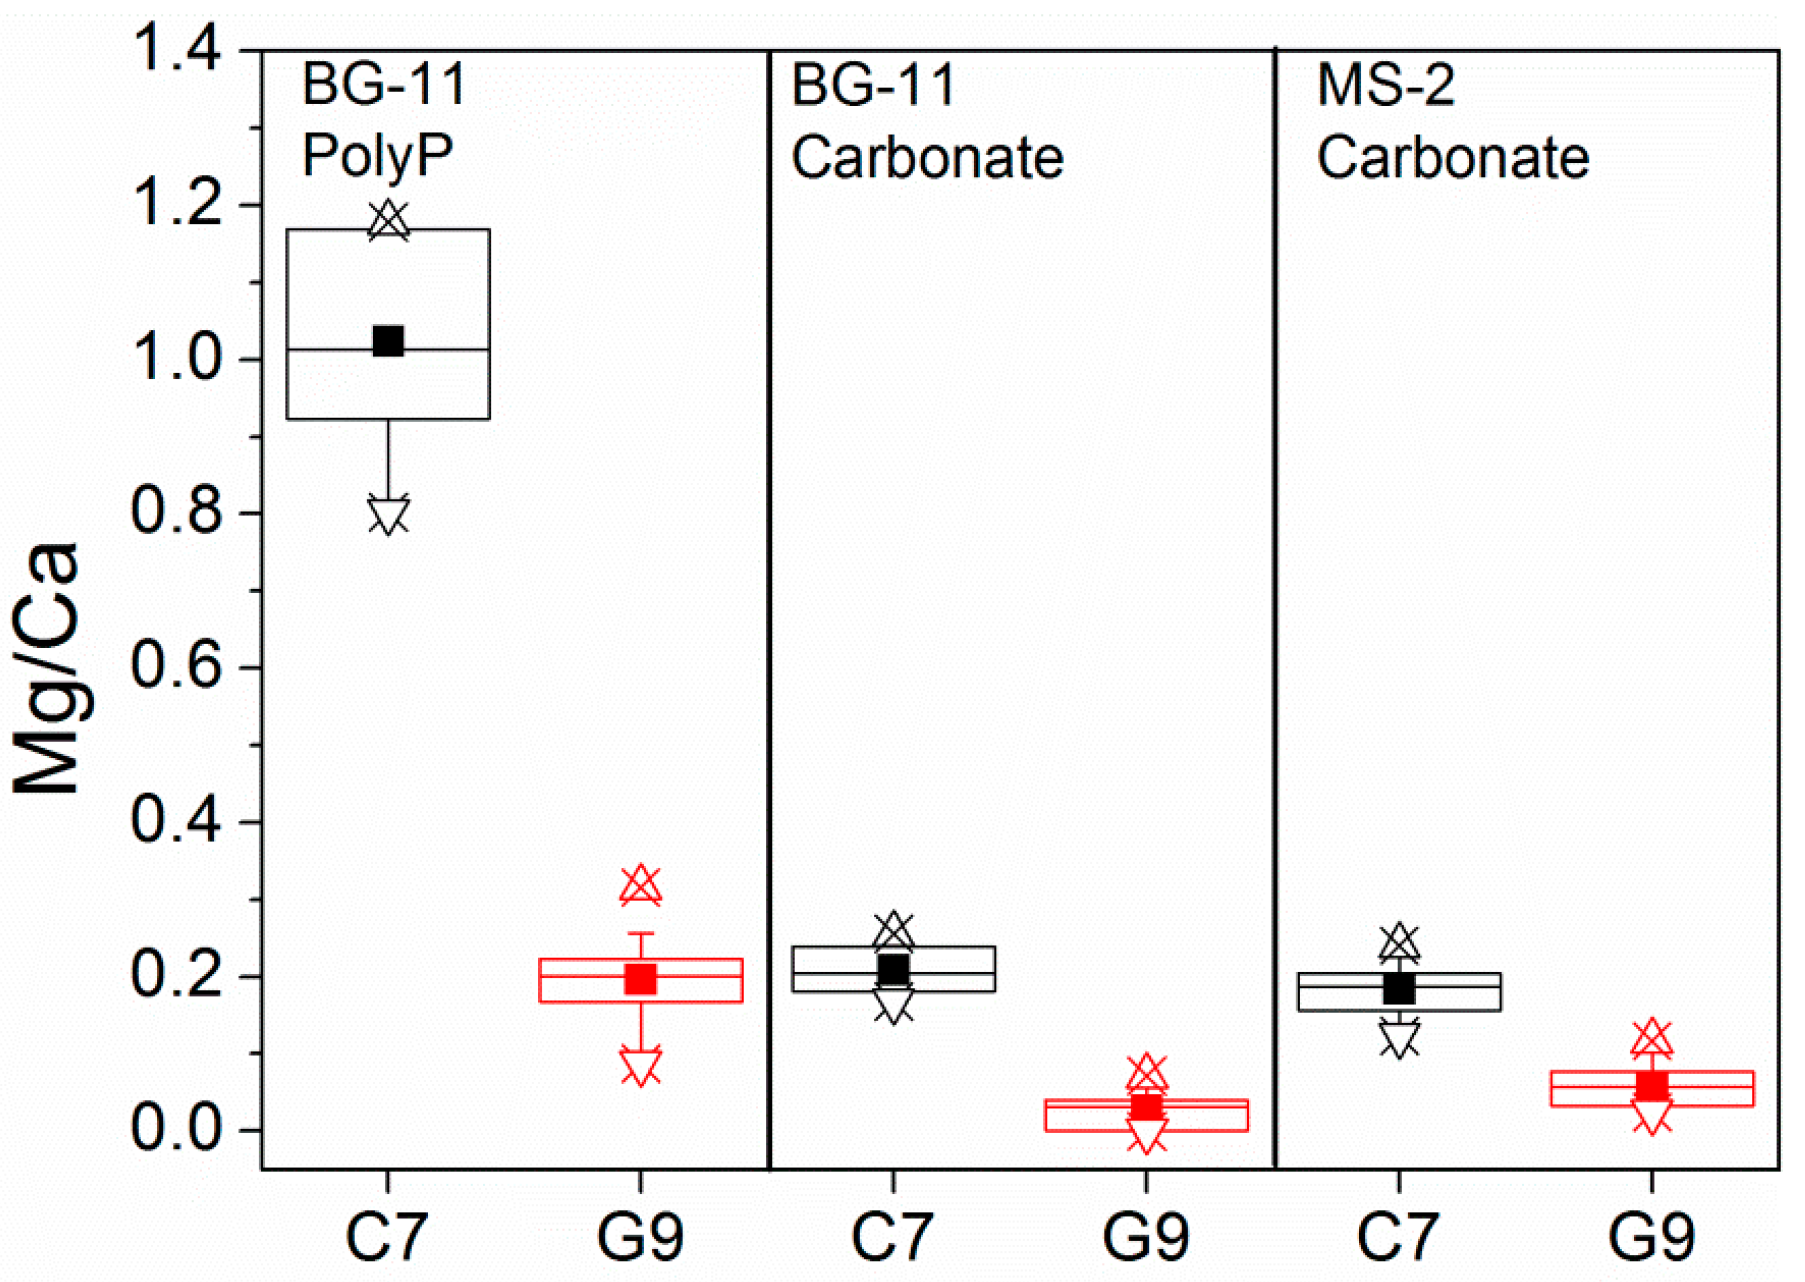
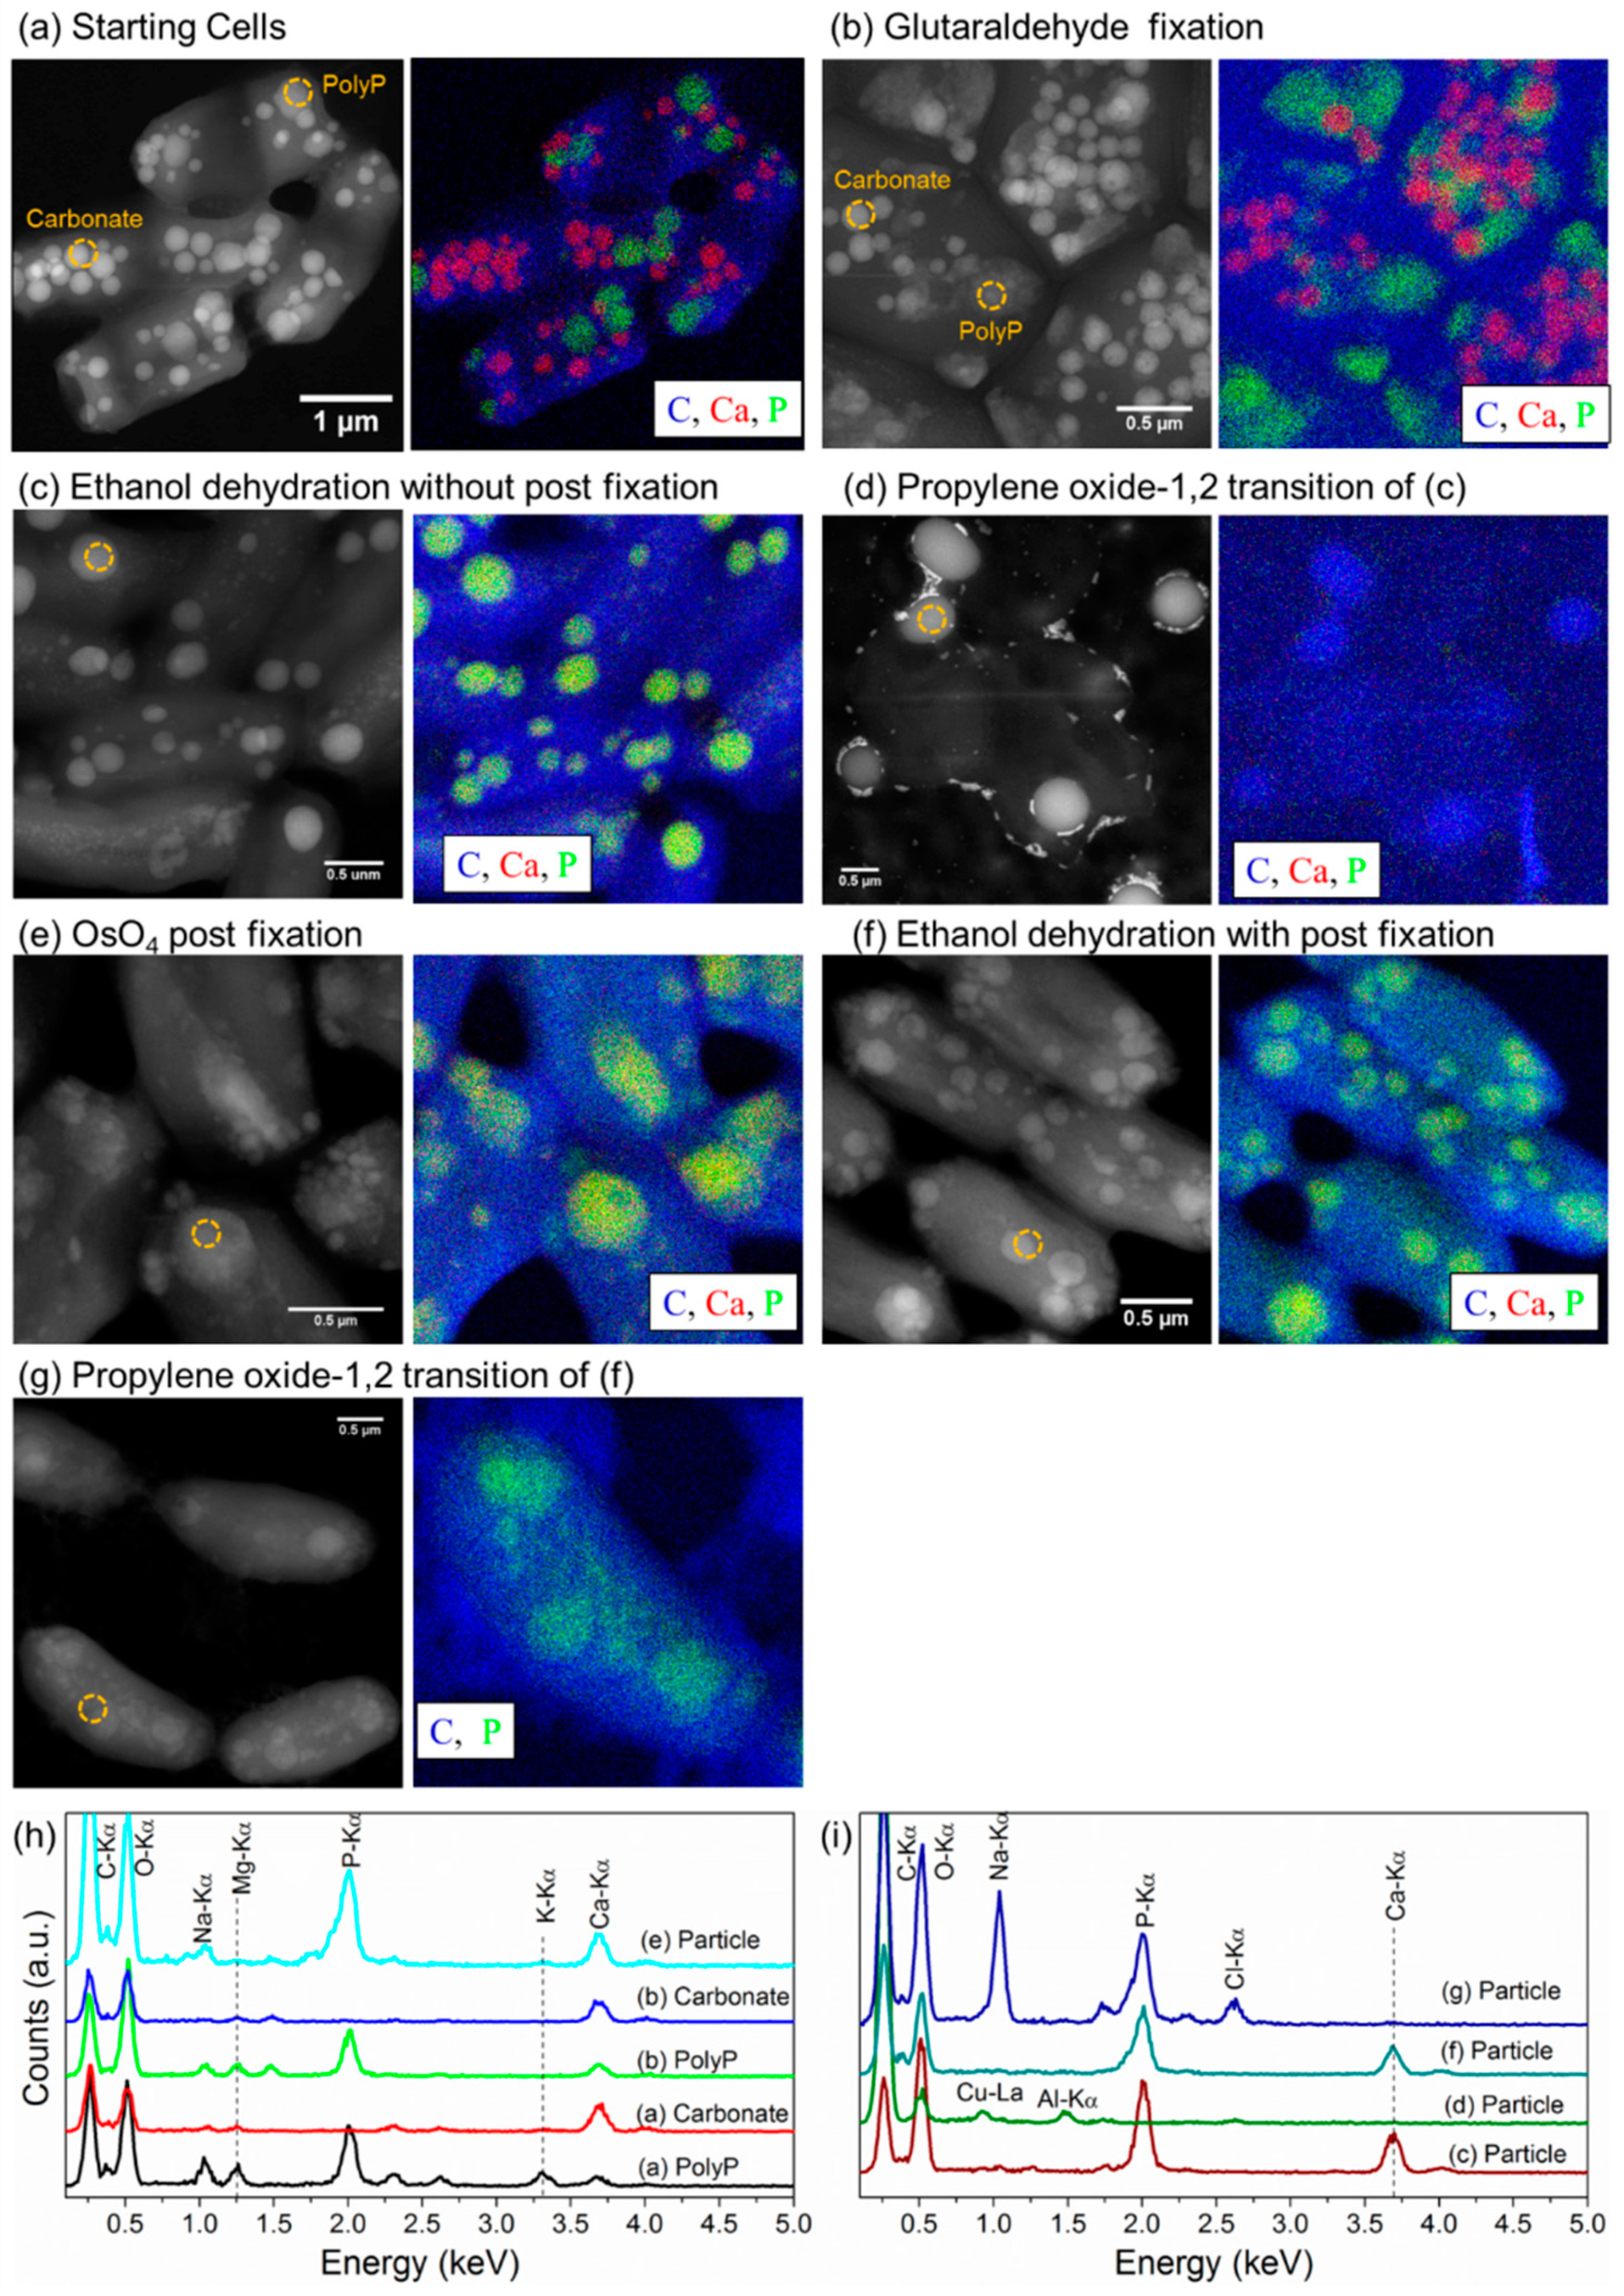
3.1. Chemical Composition of Carbonate and Polyphosphate Inclusions in Ca. Gloeomargarita lithophora and Ca. Synechococcus calcipolaris

Ca-carbonate inclusions were scattered throughout the cell cytoplasm in Ca. G. lithophora C7, while they were clustered at the cell poles and sometimes in the middle of the cells, i.e., at the division septum in Ca. S. calcipolaris G9 (Figure 1 and Figure 2). The two strains formed Ca-carbonate inclusions in both BG-11 and MS-2 culture media. The chemical composition of Ca-carbonate inclusions was systematically analyzed by STEM imaging and STEM-EDXS mapping in the HAADF mode (Figure 1 and Figure 2).
Figure 1. (a,b) HAADF-STEM images of Ca. G. lithophora C7 cells grown in BG-11; (c) STEM-EDXS map of C7 cells (same area as in (b)); (d) EDX spectra extracted from one single inclusion of Ca-carbonate (red line) and polyphosphate (green line) which are indicated by red and green dashed circles in image b, respectively; (e,f) HAADF-STEM images of C7 cells grown in MS-2; (g) STEM-EDXS map of C7 cells (same area in (f)); (h) EDX spectra extracted from one single inclusion of Ca-carbonate (red line) and cytoplasm area as background (cell, blue line) which are indicated by red and blue dashed circles on image (f), respectively. In (c,g), each color in the elemental map corresponds to one element indicated by its own symbol with the same color.
Minerals 06 00010 g001
When grown in BG-11, both cyanobacterial strains also produced several P-rich granules (Figure 1a–d and Figure 2a–d). Ca-carbonate and P-rich inclusions were readily distinguished based on the presence/absence of P as shown by STEM-EDXS analyses (e.g., Figure 1c,d and Figure 2c,d). They also had a different contrast in STEM-HAADF images with Ca-carbonates appearing brighter (e.g., Figure 1a,b). XANES spectra acquired by STXM at the P L2,3-edges on P-rich granules were identical for Ca. G. lithophora C7 and Ca. S. calcipolaris G9. They showed peaks at 136.7, 137.7 and 139 eV as well as a wider peak at 146.8 eV, similarly to the measured reference polyphosphate compound (Figure 3). These XANES spectra could be assigned to polyphosphates based on existing libraries of P-containing compounds [40,41,42]. When transferred to MS-2 medium, both strains lost their polyphosphate granules, and produced Ca-carbonates only (Figure 1e–h and Figure 2e–h).
STEM-EDXS microanalyses showed that polyphosphate granules generally contained about 53%–63% of phosphorus (atomic proportion of P over P + Ca + K + Mg), ~13% to ~29% of calcium, ~2% to ~18% of magnesium and ~7% to ~15% of potassium (Figure 1d and Figure 2d, Table A1 and Table A3). In contrast, Ca-carbonate inclusions only contained Ca and Mg for both strains grown in BG-11 (e.g., Figure 1d and Figure 2d). The results show that the chemical compositions of the Ca-carbonate inclusions, in particular their Ca/Mg ratio, varied mostly with the nature of the cyanobacterial strain, not significantly with the composition of the culture medium (Figure 4, Table A1, Table A2, Table A3 and Table A4). Ca. S. calcipolaris G9 formed purer Ca-carbonates with little amount of Mg compared to Ca. G. lithophora C7. The Mg/Ca ratio was equal to 0.0263 ± 0.0237 (N = 10) and 0.0458 ± 0.0232 (N = 21) for the Ca-carbonate inclusions of Ca. S. calcipolaris G9 grown in BG-11 and MS-2, respectively. In comparison, this ratio reached 0.209 ± 0.0332 (N = 8) and 0.185 ± 0.033 (N = 19) in C7 grown in BG-11 and MS-2, respectively. Consistently, the Mg/Ca ratio in polyphosphates was 0.196 ± 0.0685 (N = 9) for G9 and 1.024 ± 0.143 (N = 8) for C7 (Figure 4).
Figure 2. (a,b) HAADF-STEM images of Ca. S. calcipolaris G9 cells grown in BG-11; (c) STEM-EDXS map of G9 cells (same area as in (b)); (d) EDX spectra extracted from Ca-carbonate (red line) and polyphosphate (green line) inclusions which are indicated by red and green dashed circles in image b, respectively; (e,f) HAADF-STEM images of G9 cells grown in MS-2; (g) STEM-EDXS map of G9 cells (same area in (f)); (h) EDX spectra extracted from Ca-carbonate (red line) and cytoplasm as a background (cell, blue line) which are indicated by red and blue dashed circles on image (f), respectively. In (c,g), each color in the elemental map corresponds to one element indicated by its own symbol with the same color.
Minerals 06 00010 g002
Figure 3. (a) STXM image at 136 eV of Ca. G. lithophora C7 cells grown in BG-11; (b) Corresponding map of phosphorus compounds absorbing at 136 eV (same area as in (a)). The map was obtained by subtracting an image at 132 eV from an image at 136 eV. Pixel size is 50 nm; (c) STXM image at 132 eV of Ca. S. calcipolaris G9 cells grown in BG-11; (d) Corresponding map of phosphorus compounds absorbing at 138 eV (same area). The map was obtained by subtracting an image at 132 eV from an image at 138 eV. Pixel size is 70 nm; (e) XANES spectra at the P L2,3-edges of reference polyphosphates (top), P-rich inclusions of G9 cells shown in (c) (middle), P-rich inclusions of C7 cells shown in (a) (bottom). Vertical lines are located at 136.7, 137.7, 139 and 146.8 eV. Scale bar is 1 µm for all images.
Minerals 06 00010 g003
Figure 4. Box charts of atomic ratios of Mg/Ca of individual carbonate and polyphosphate (PolyP) inclusions of Ca. G. lithophora C7 and Ca. S. calcipolaris G9 cells grown in BG-11 and MS-2.
Minerals 06 00010 g004

3.2. Spatial Arrangement and Total Volume of Ca-Carbonate Inclusions

Polyphosphate granules were often located down to few nanometers away from the carbonate inclusions in Ca. G. lithophora C7 and Ca. S. calcipolaris G9 cells cultured in BG-11 (Figure 5). In several cases, polyphosphate granules engulfed carbonate inclusions in C7 (Figure 5b,c).
Figure 5. Spatial relationships between carbonate and polyphosphate inclusions within Ca. S. calcipolaris G9 (a) and Ca. G. lithophora C7 (b,c). The red-line arrows indicate polyphosphate inclusions close to carbonate inclusions (ac), and sometimes engulfing carbonate inclusions (b,c).
Minerals 06 00010 g005
We used electron tomography to study the 3-D morphology and arrangement of carbonates in Ca. G. lithophora C7 and Ca. S. calcipolaris G9 (Figure 6 and Figure 7). In many Ca. G. lithophora C7 cells, the Ca-carbonate inclusions were scattered throughout the cell cytoplasm (Figure 6a,d and Movie S1), consistently with 2-D (S)TEM observations. However, Ca-carbonate inclusions appeared to be aligned to one or several chains in some C7 cells grown in MS-2, BG-11 or the aquarium (Figure 6b,c,e,f; Movies S2 and S3). In contrast, carbonate inclusions were arranged as distorted disks at cell poles in Ca. S. calcipolaris G9 cells (Figure 7; Movies S4 and S5). From 3-D tomography, a rough estimation of the volumes of carbonate inclusions could be computed for C7. The total volume of carbonate inclusions in four analyzed Ca. G. lithophora C7 cells (e.g., Figure 6b,e) ranged between 0.13 and 0.19 µm3, which equals to 2.44–3.51 fmol of Ca per cell based on a density of 2.18 g·cm−3 for amorphous calcium carbonate (ACC) [43]. Considering a cylinder shape for the cells, their volume was estimated to be approximately 2.89 µm3. If Ca stored in an ACC was virtually dispersed in the cells, this would represent a total concentration of Ca of ~0.8–1.2 mol·L−1. Total volumes of inclusions could not be estimated for Ca. S. calcipolaris G9 because of the difficulty of segmenting the Ca-carbonate inclusions due to their high compaction.
Figure 6. HAADF-STEM tomography of Ca. G. lithophora C7. (ac) HAADF-STEM images of C7 cell(s) grown in BG-11 (a) or in the aquarium (b,c) and selected for tilt series acquisition and tomographic reconstruction. (df) 3-D visualization of the reconstruction from carbonates showing in (ac). See movies in supplementary data. The red-line arrows indicate polyphosphate inclusions.
Minerals 06 00010 g006
Figure 7. HAADF-STEM (a,b) and TEM (c,d) tomography of Ca. S. calcipolaris G9. (a) HAADF-STEM image of several G9 cells selected for tilt series acquisition and tomographic reconstruction; (b) 3-D visualization of the reconstruction from carbonate inclusions showing in (a); (c) Bright-field TEM image of part of three G9 cells selected for title series acquisition tomographic reconstruction; (d) 3-D visualization of the reconstruction from carbonate inclusions showing in (c).
Minerals 06 00010 g007

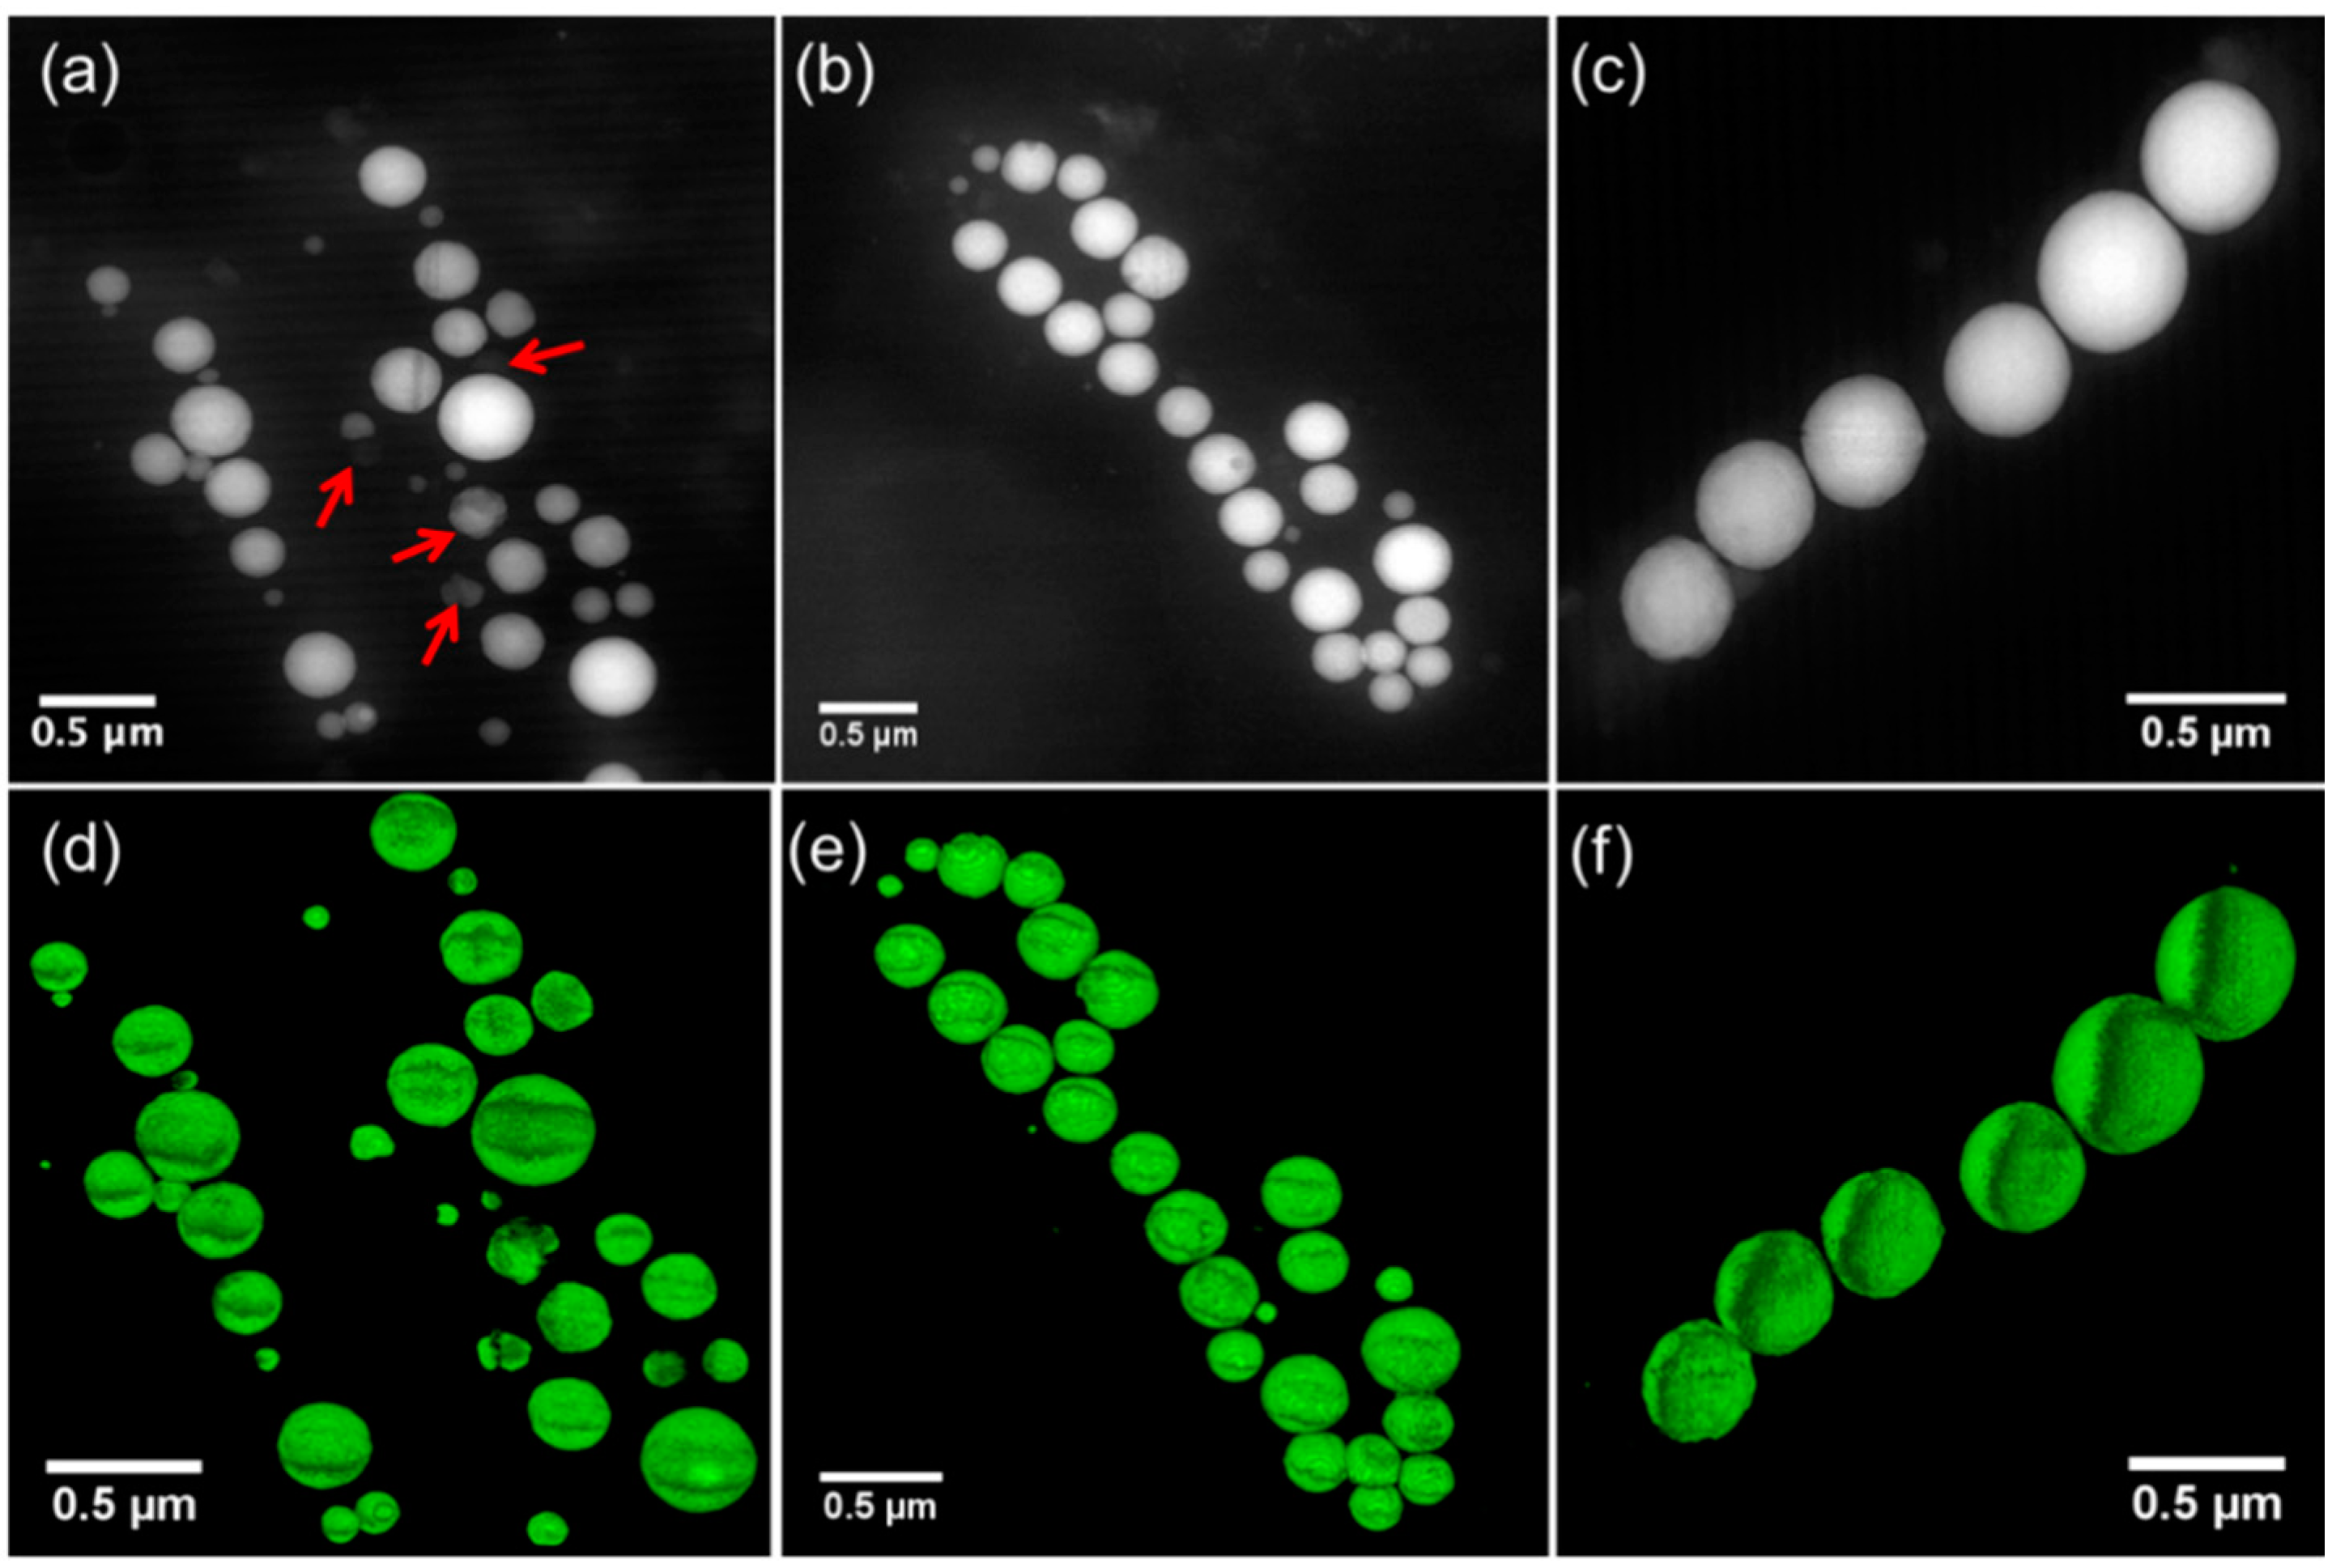
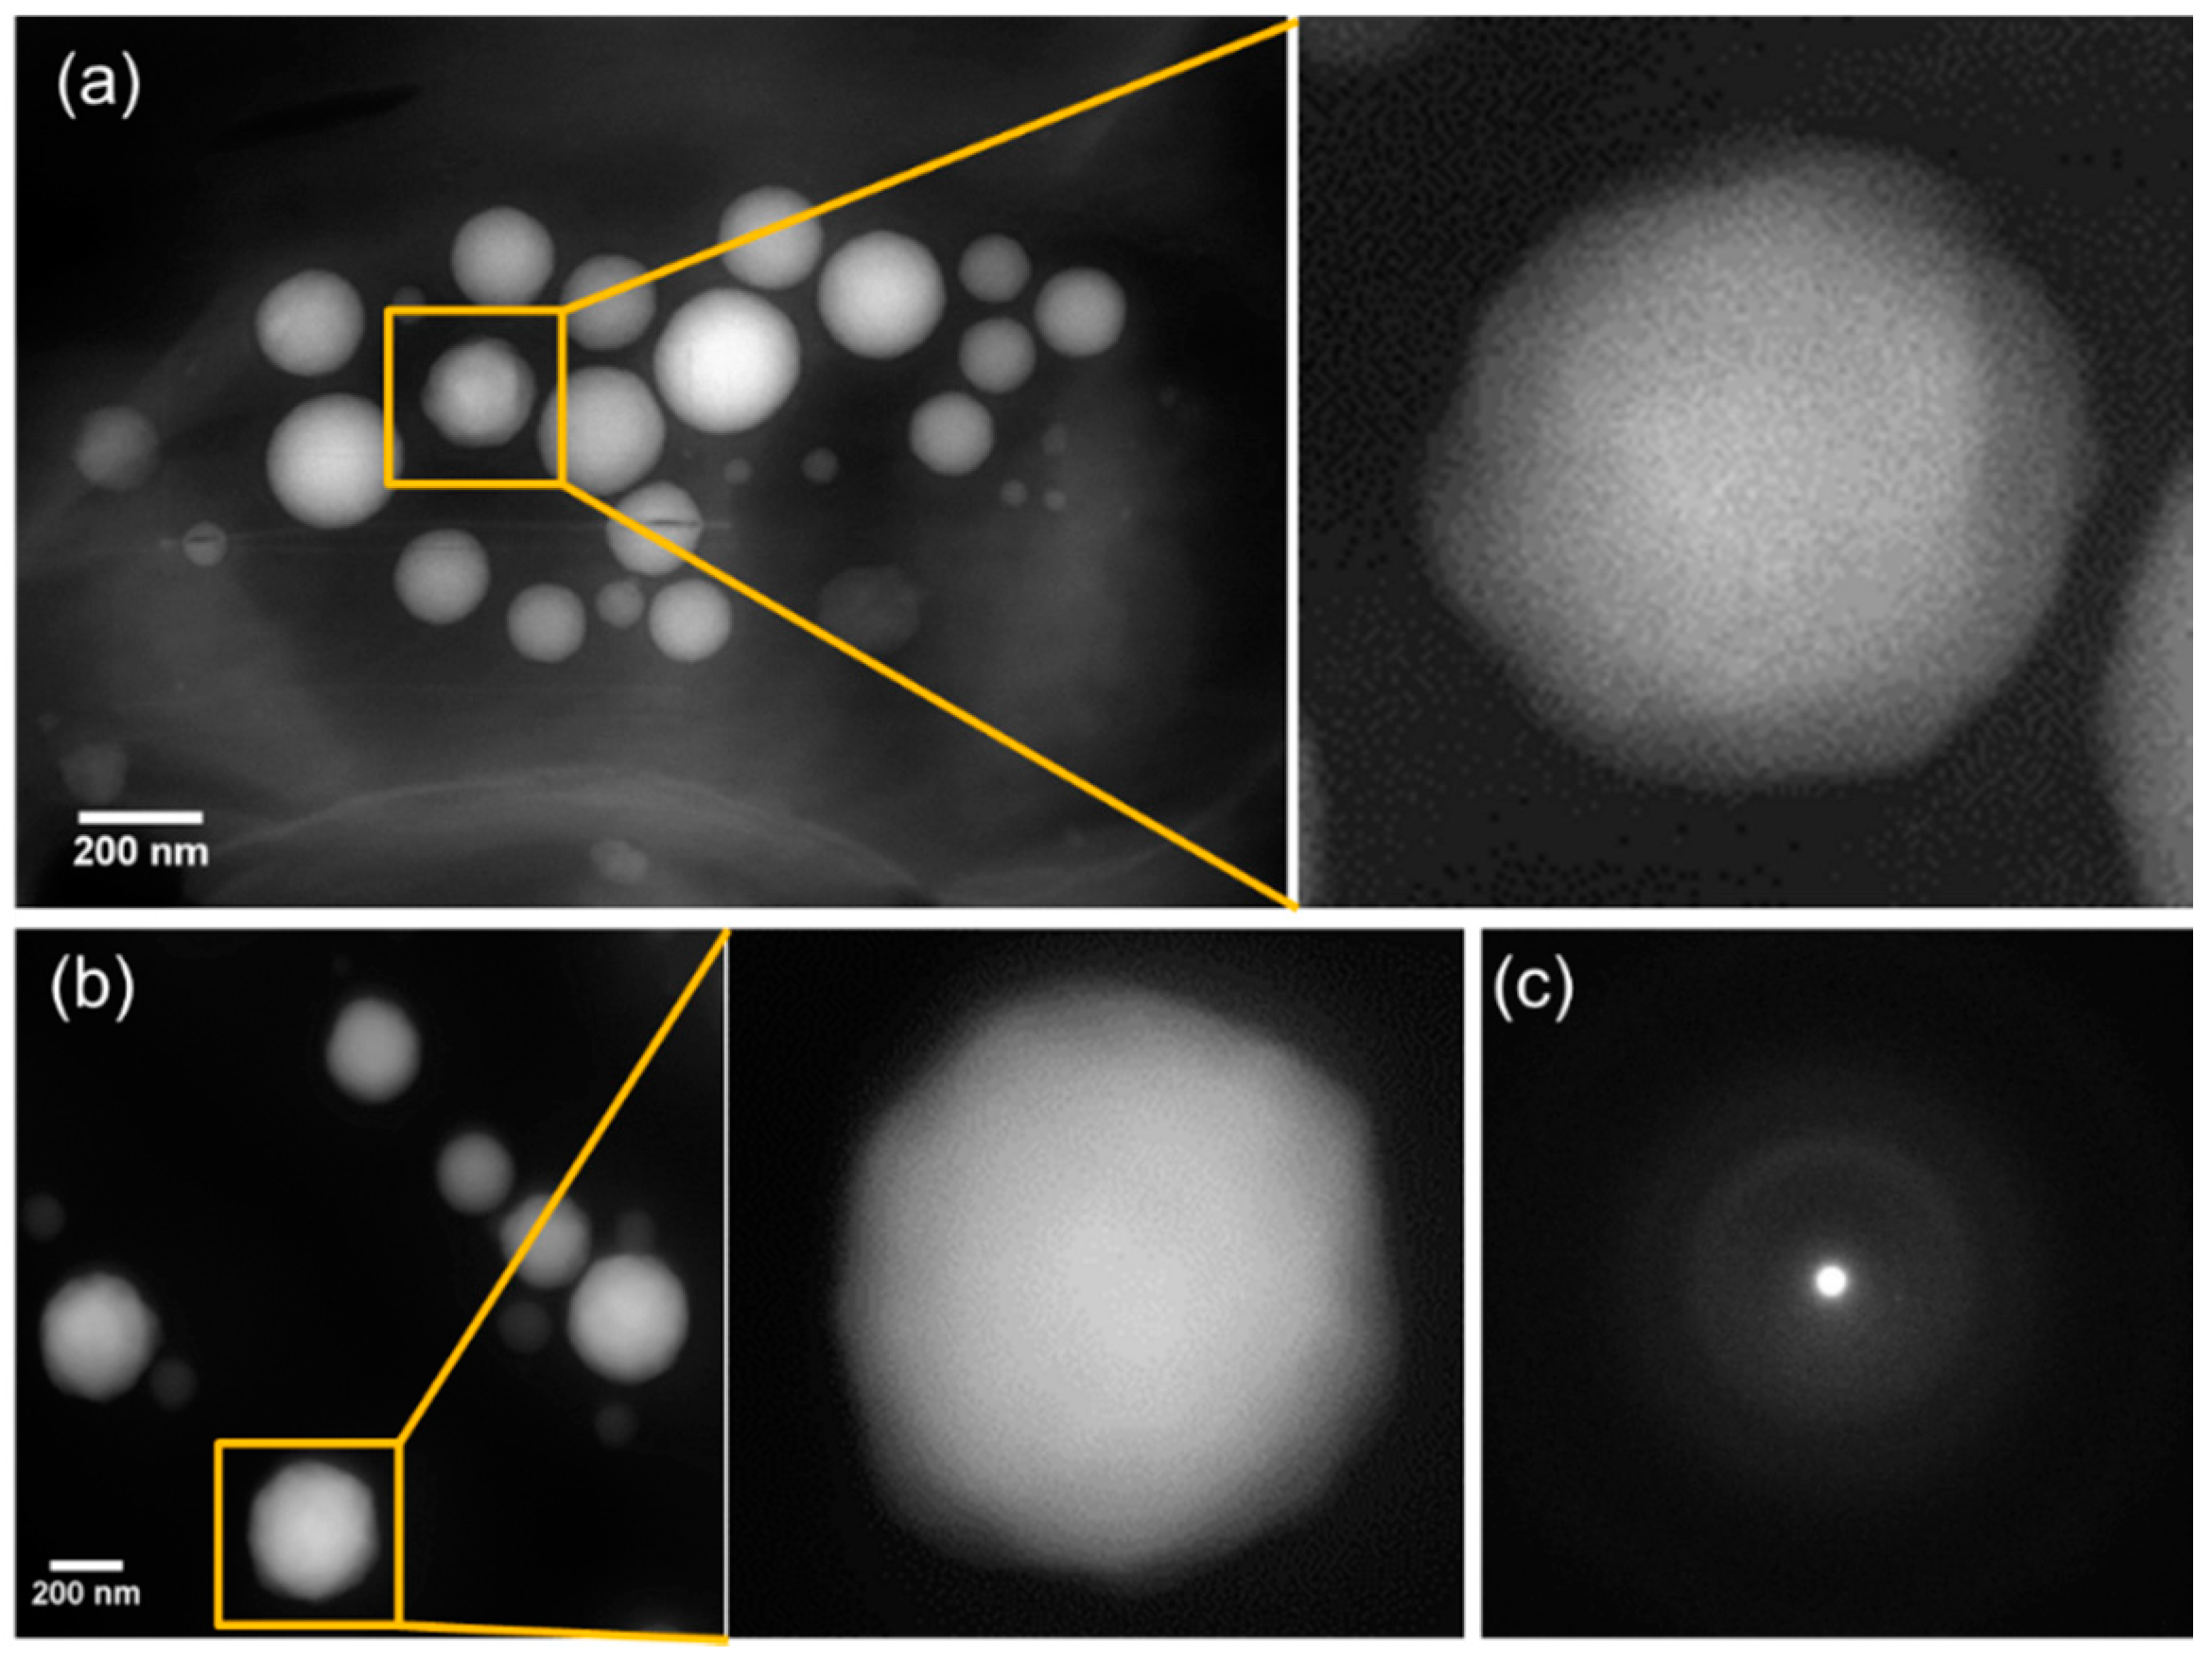
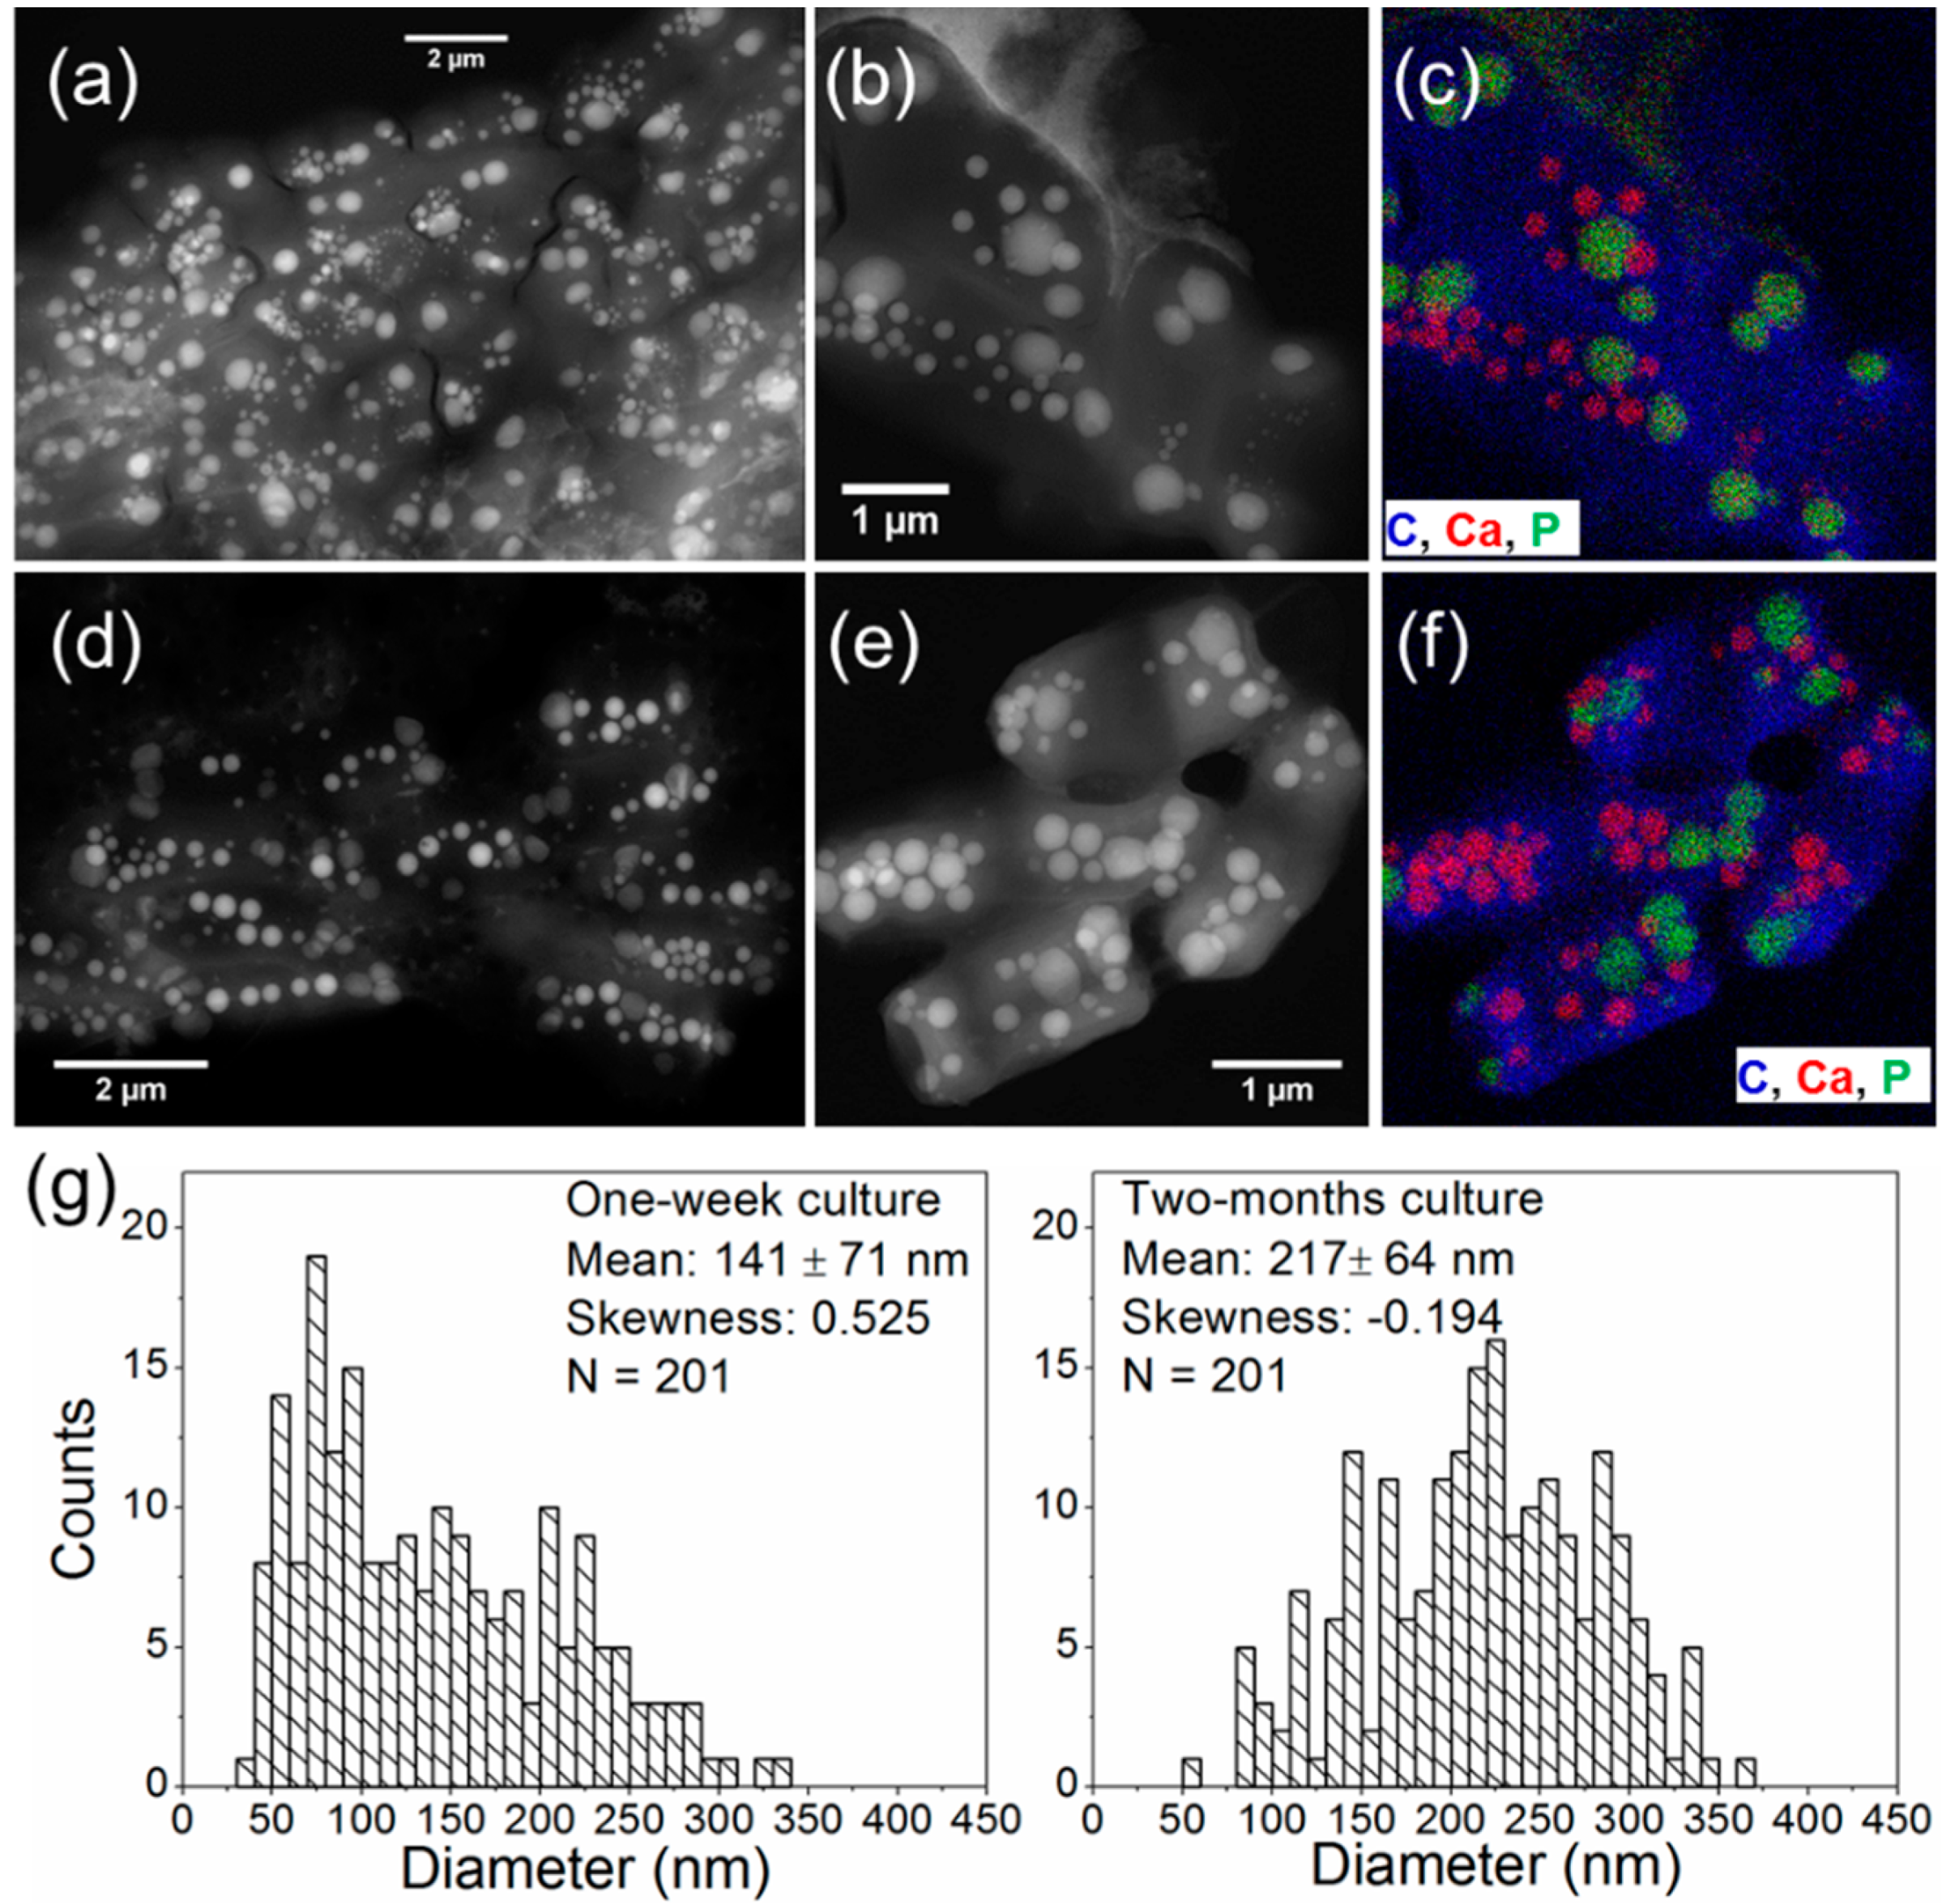
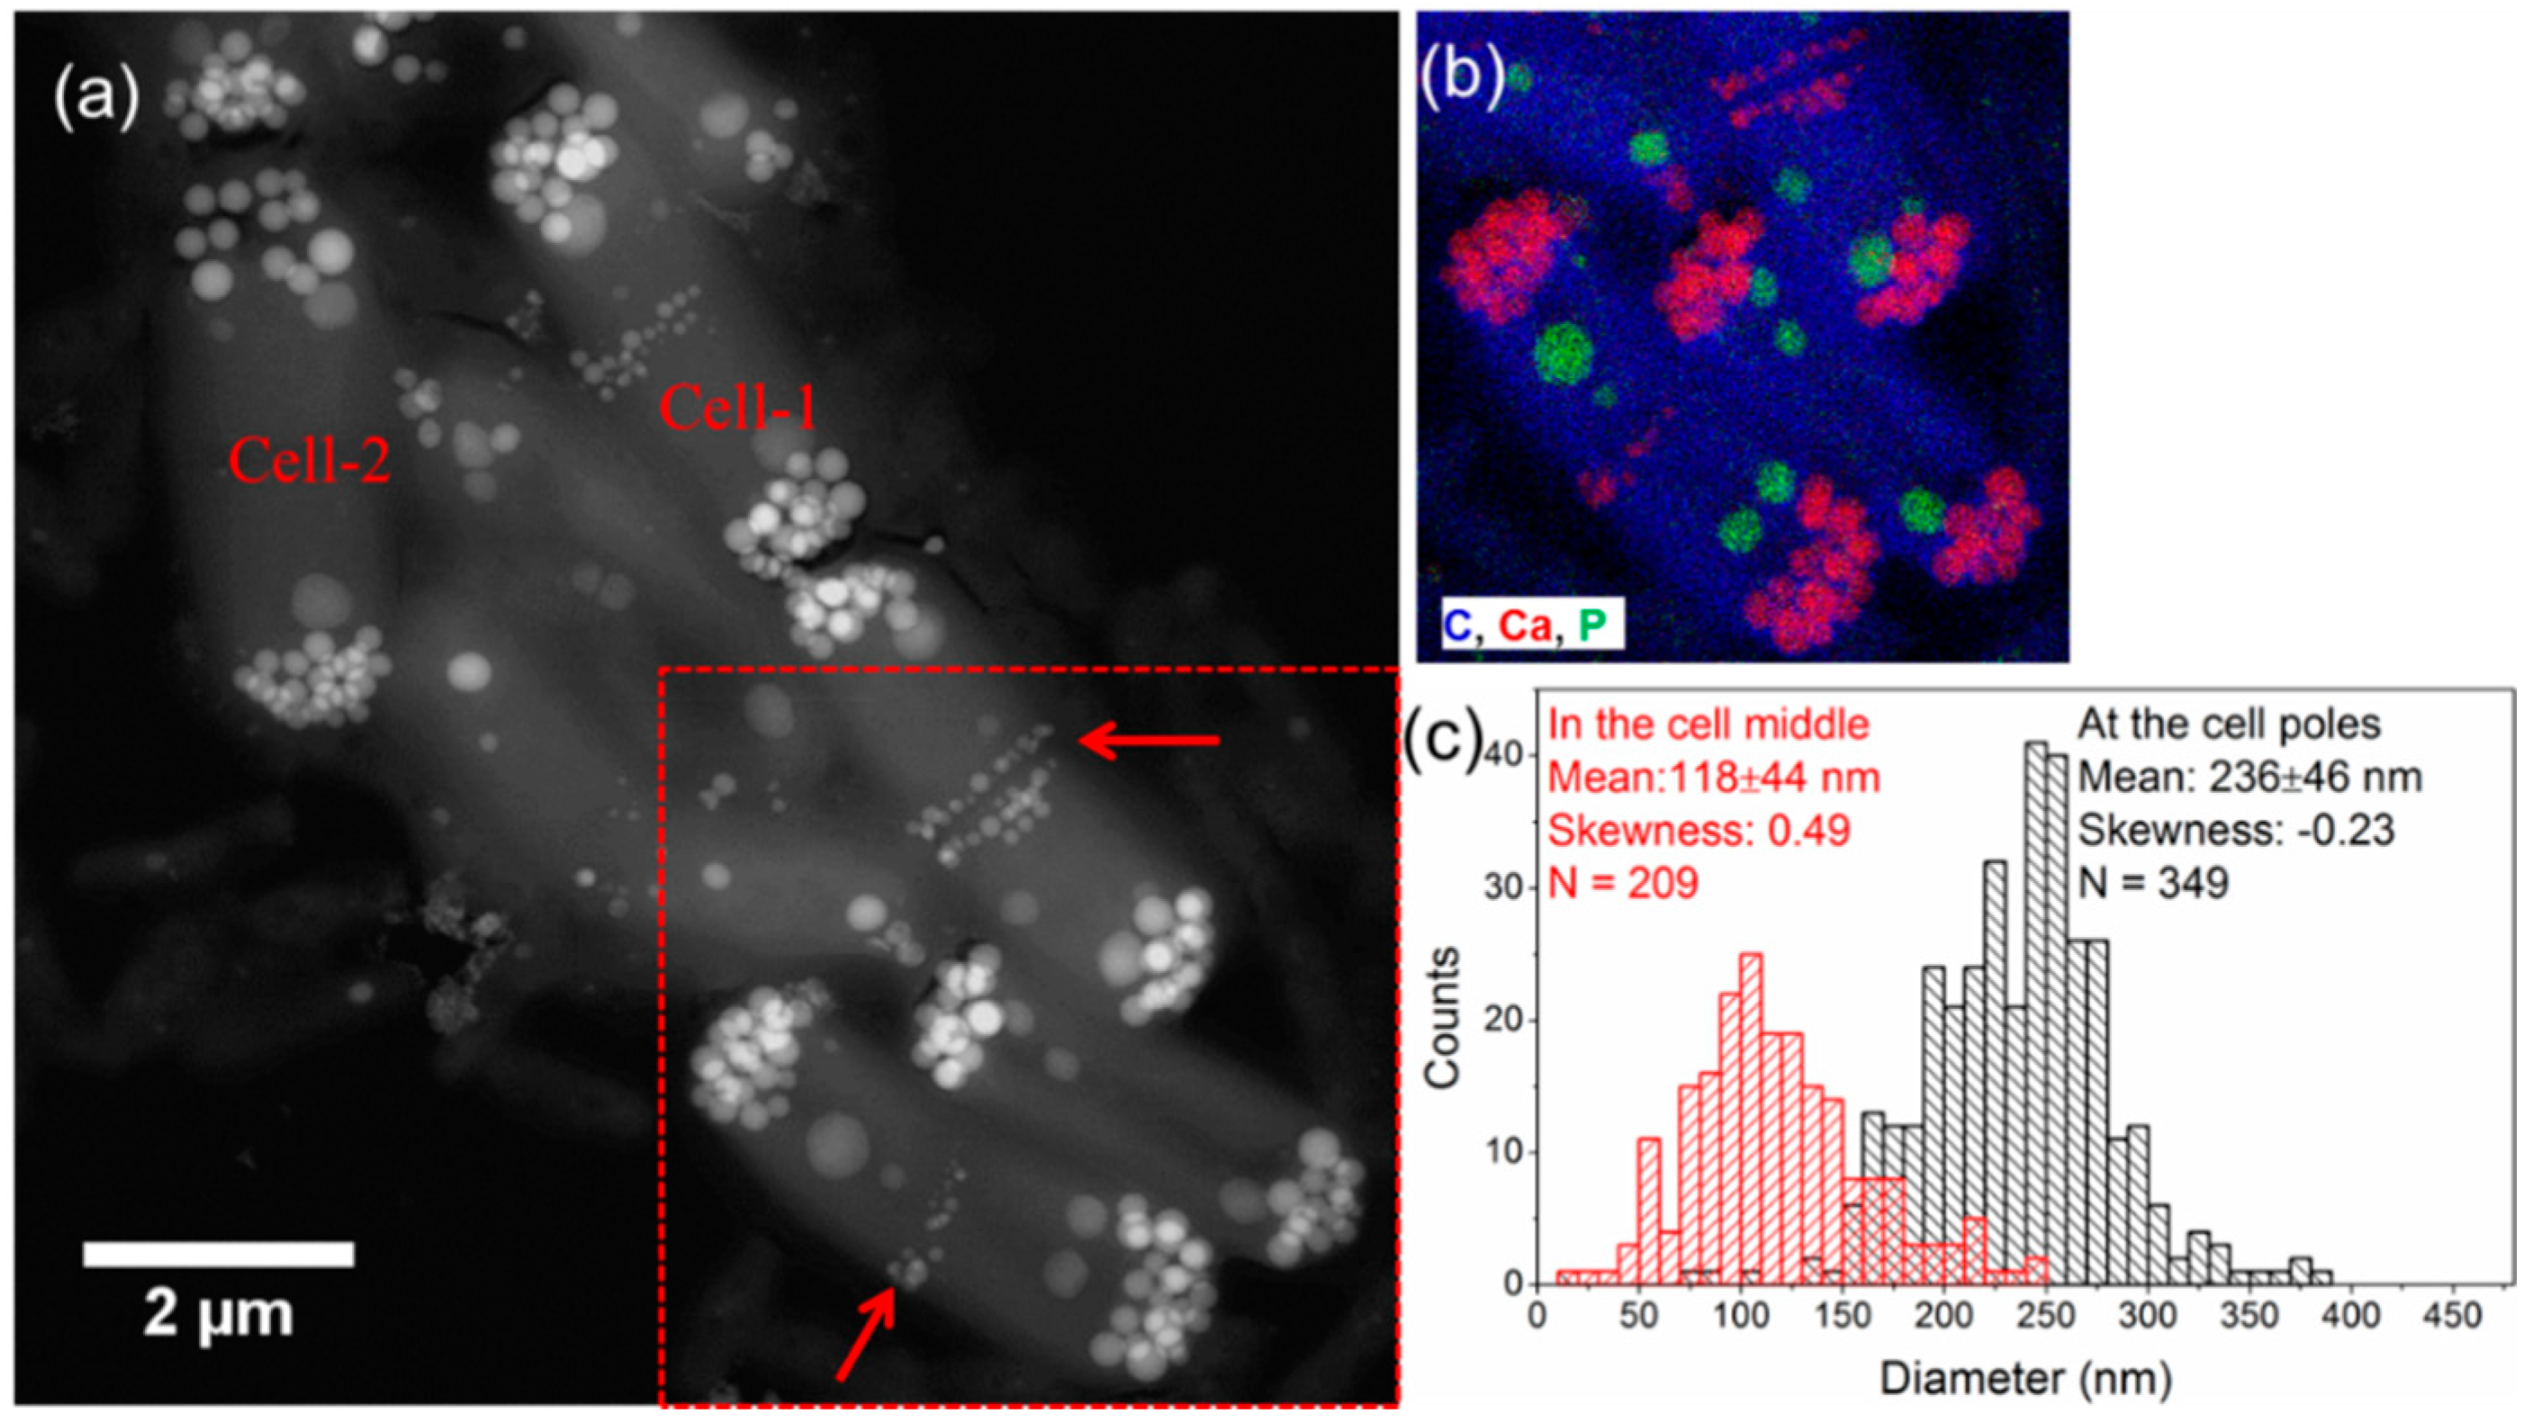
3.3. Morphology and Size Distribution of Ca-Carbonate Inclusions

Since cells of both strains contained carbonate inclusions throughout the growth of the cultures, it was not possible to follow the progressive particle growth starting with empty cells as this was done for magnetotactic bacteria, for example [44]. However, we could measure the size distribution of intracellular Ca-carbonates in Ca. G. lithophora C7 after different incubation durations (Figure 8). The mean particle diameter of carbonates increased with time from 141 ± 71 nm for one-week cultures to 217 ± 64 nm for two-month cultures. Interestingly, the size distribution evolved as well. For one-week cultures, the diameters of carbonate inclusions in C7 showed a typically positive distribution (the skewness is 0.525), i.e., skewed towards higher values. This distribution evolved towards a nearly negative shape with a cut-off toward ~350 nm and a skewness of −0.194 after two months (Figure 8).
Figure 8. HAADF-STEM images and STEM-EDXS maps of Ca. G. lithophora C7 cells grown in BG-11 for one week (ac) or two months (df). (a,d) show low-magnification HAADF-STEM images of tens of cells; (b,e) show high-magnification HAADF-STEM images of several cells which were analyzed by EDXS mapping; (c,f) show overlaid elemental maps where each color corresponds to one element indicated by its own symbol with the same color; (g) Particle size distributions of carbonate inclusions grown for one week (left panel) and two months (right panel).
Minerals 06 00010 g008
In addition, many of the Ca-carbonate inclusions appeared spherical. However, some inclusions showed facets (Figure 9). Zero-loss filtered selected area electron diffraction (SAED) study shows that such Ca-carbonate inclusions are also electron diffraction amorphous.
Interestingly, the time-evolution of the particle size distribution evidenced for Ca. G. lithophora C7 was also observed for the carbonate inclusions located at the septum and cell poles of Ca. S. calcipolaris G9 cells. As shown in Figure 10, carbonate inclusions at the septum had a positive diameter distribution (skewness of 0.49), while the carbonates at the cell poles had a negative distribution (skewness is −0.23). Correspondingly, the mean diameter value of carbonates was 118 ± 44 nm and 236 ± 46 nm for carbonate inclusions at the septum and at the cell poles, respectively. It should be noted that some cells have carbonate inclusions with the same size at their two poles (e.g., Cell-1 in Figure 10a), while others have inclusions with different sizes at the poles (e.g., Cell-2 in Figure 10a).
Figure 9. (ab) High-magnification HAADF-STEM images showing that some Ca-carbonates appear to have some facets. (c) Zero-loss filtered selected area electron diffraction (SAED) pattern of one single carbonate particle such as the one indicated by the yellow square in (b) showing that it is electron diffraction amorphous.
Minerals 06 00010 g009
Figure 10. Spatial arrangement and morphological features of carbonates formed by Ca. S. calcipolaris G9 grown in BG-11 for one week. (a) HAADF-STEM image of seven cells showing that three cells contain Ca-carbonate inclusions at the cell poles and also at the middle of the cells (red-line arrows). The red-line arrows indicate that carbonate inclusions at mid-cells are generally smaller than those at the cell poles. Cell-1 indicates one cell which contains carbonate inclusions with similar size at the two poles, while Cell-2 seems to have differently sized polar inclusions; (b) EDXS element map of a small area indicated by the red-dashed square on the image (a) showing the spatial arrangement of carbonate (red colors) and polyphosphate (green colors) inclusions; (c) Particle size distributions of carbonates at the cell poles (histogram in black) and at mid-cells (histogram in red).
Minerals 06 00010 g010

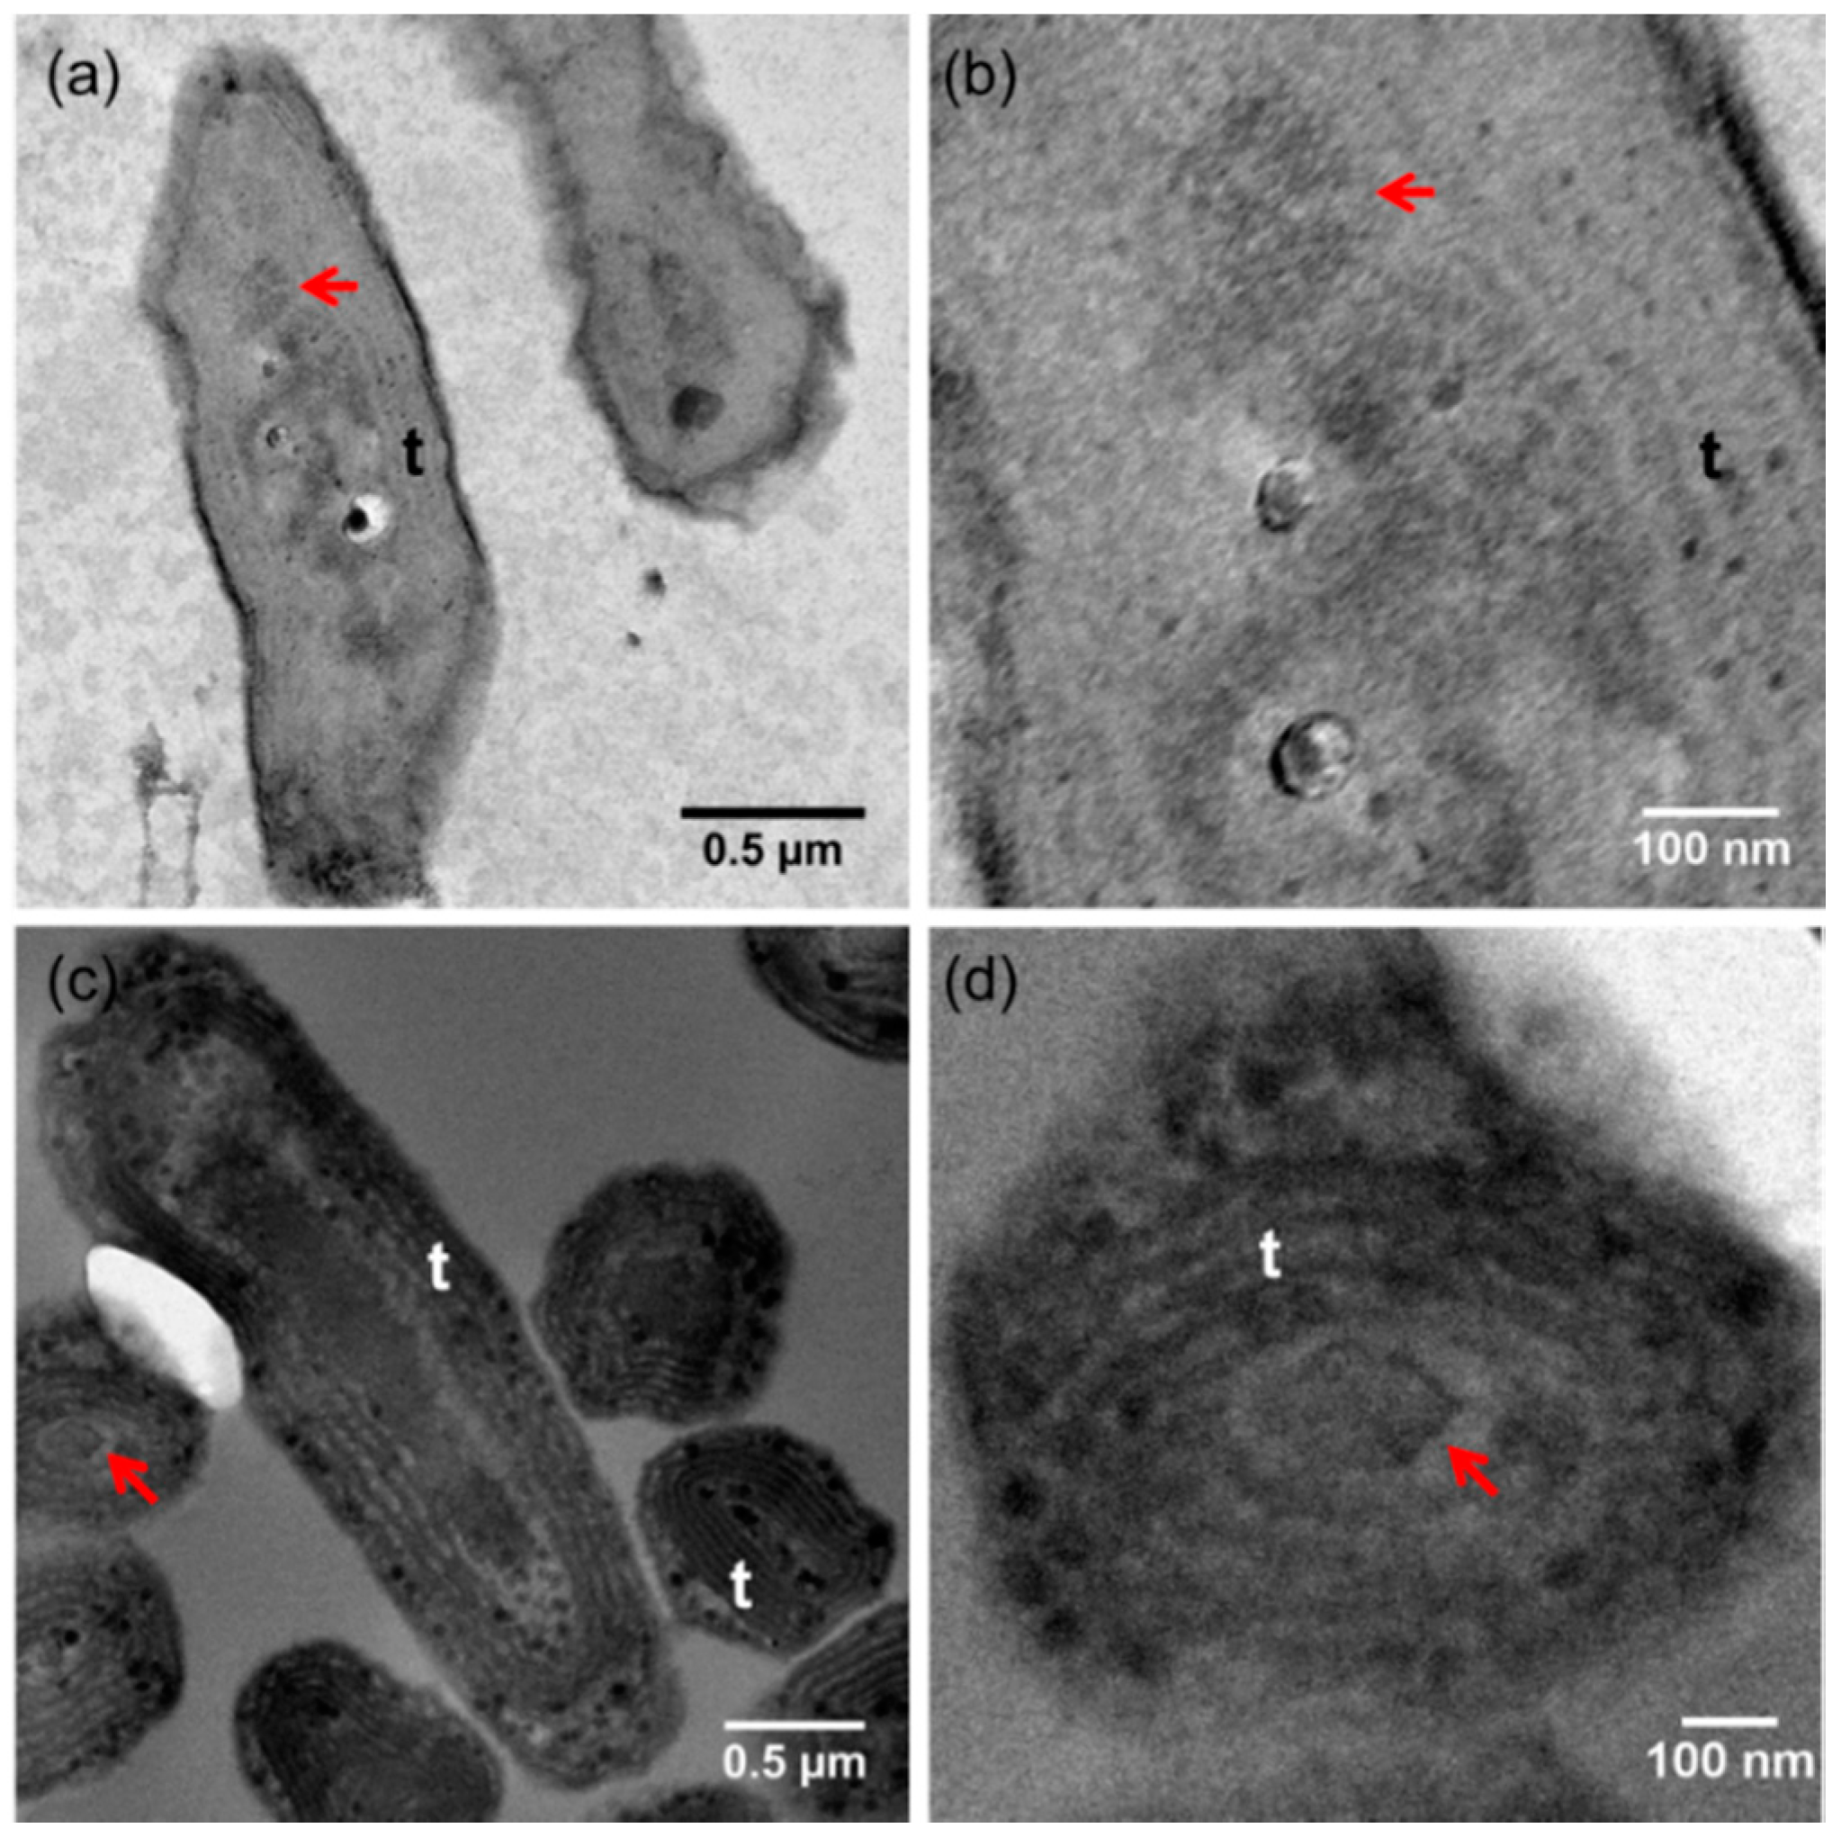
3.4. Conventional Ultramicrotomy of Intracellularly Calcifying Cyanobacteria

Thin sections of cells were prepared by ultramicrotomy to study potential subcellular structures associated with intracellular carbonates by TEM. However, the standard ultramicrotomy protocol proved unsuitable for both C7 and G9 due to chemical alteration of intracellular carbonates (Figure 11). Fixation by glutaraldehyde did not significantly affect the chemical and morphological features of intracellular carbonates, but it resulted in partial dissolution of polyphosphate granules (Figure 11a,b,h). OsO4 post fixation and ethanol dehydration led to complete dissolution of carbonates, and induced the formation of new spherical particles chemically rich in both Ca and P (Figure 11c,e,f). Compared with polyphosphate inclusions in starting cells, which contained Mg, K, Na and Ca, these newly-formed particles contained Ca and Na only, and had slightly higher atomic ratio of Ca/P (e.g., 0.34 for polyphosphate, 0.40 for particles formed after ethanol dehydration without OsO4 post fixation, 0.37 for particles formed after OsO4 post fixation, and 0.45 for particles formed after both ethanol dehydration and OsO4 post fixation) (Figure 11h,i).
Figure 11. Chemical alterations of carbonate inclusions within Ca. G. lithophora C7 during ultramicrotomy sample preparation. (a) Starting Ca. G. lithophora C7 cells; (b) Cells after glutaraldehyde fixation; (c) Cells after ethanol dehydration (from 50% to 100%) without osmium tetroxide (OsO4) post fixation; (d) Cell debris after 1,2-propylene oxide treatment without OsO4 post fixation; (e) Cells after OsO4 post fixation; (f) Cells after ethanol (from 50% to 100%) dehydration with OsO4 post fixation; (g) Cells after 1,2-propylene oxide treatment with OsO4 post fixation; (h) EDX spectra showing chemical alteration of polyphosphate (polyP) and carbonate inclusions after glutaraldehyde fixation and OsO4 post fixation; (i) EDX spectra showing chemical alterations of intracellular particles after ethanol dehydration and 1,2-propylene oxide treatment. In each panel, the left image was obtained by HAADF-STEM, and the right image corresponds to a STEM-EDXS map. The dashed circles in the HAADF-STEM images indicate the areas from which the EDX spectra were extracted in (h,i).
Minerals 06 00010 g011
The cells not post-fixed by OsO4 were completely disrupted by the propylene oxide-1,2 treatment. In these samples, some spherical particles were observed by HAADF-STEM (Figure 11d). They were very different chemically from polyphosphate, carbonate and phosphate inclusions, with no Ca and P and only C and O and traces of Al (Figure 11d,i). In contrast, cells post-fixed by OsO4 were preserved after the 1,2-propylene oxide treatment. However, calcium phosphate inclusions formed during OsO4 post fixation and ethanol dehydration, dissolved and calcium was completely lost.
As expected, the chemical alterations occurring during sample preparation for ultramicrotomy prevented the reliable analysis of the potential subcellular structures associated with intracellular carbonates, although subcellular structures typical of cyanobacteria including thylakoid membranes and possible carboxysomes could be observed by TEM in C7 and G9 cells (Figure 12).
Figure 12. Bright-field TEM image of ultramicrotomy thin section of strain Ca. G. lithophora C7 (a,b) and strain Ca. S. calcipolaris G9 (c,d). The red-line arrows indicate possible carboxysomes. t thylakoid membranes.
Minerals 06 00010 g012

4. Discussion

4.1. Inaccuracy of Standard Ultramicrotomy to Study Amorphous Calcium Carbonates in Cyanobacteria

Before the recent advent of cryo-techniques, the ultrastructure of microorganisms had often been investigated by conventional ultramicrotomy sectioning to produce electron transparent samples [45]. For example, the ultrastructure of several intracellular carbonate-forming cyanobacterial strains from culture collections were studied previously by room temperature TEM and conventional ultramicrotomy. This is the case for PCC 7425 in which Porta et al. [46] observed an unusually high content of electron dense and electron transparent granular inclusions but no intracellular carbonate. The reason why intracellularly calcifying cyanobacteria have been overlooked before may be partly due to the fact that these conventional sample preparation procedures result in the loss of the carbonate inclusions as shown in the present study.
ACC is notably very soluble and labile, much more reactive than crystalline Ca-carbonate phases and therefore prone to rapid dissolution [47,48]. This is also the case for polyphosphate [49]. The TEM observations of the different steps of the ultramicrotomy protocol can therefore been explained as follows: the fixation step by glutaraldehyde first permeabilizes the cell wall and partially dissolves polyphosphate granules. The osmium tetroxide and dehydrating solutions added thereafter to the samples are undersaturated with ACC. Thus, when they permeate inside the cells, they induce the dissolution of polyphosphate granules and ACC inclusions, leading to in the creation of a local Ca2+- and PO43−-rich environment within the cells. This environment is then likely oversaturated with Ca-phosphate mineral phases which are relatively insoluble. In the end, polyphosphate granules and ACC inclusions have completely disappeared and have been replaced by Ca-phosphate inclusions, and it is not clear whether the localization of the primary inclusions is preserved by this replacement.
This artefact might be of broader significance to the field of biomineralization. Indeed, ACC has been searched intensively and found in diverse organisms including ostracodes, plants, sponges or molluscs [50]. For instance, Keyser and Walter [51] interpreted Ca-phosphate granules observed by SEM and TEM in fixed and dehydrated ostracode samples, as precursors of Ca-carbonates. Such observations should be considered with extreme caution considering the potential artefacts described in the present study. Overall, it becomes apparent that the use of conventional ultramicrotomy limits the possibility to investigate reliably the ultrastructure of intracellularly calcifying cyanobacteria. The use of high pressure freeze substitution or cryo-electron microscopy of vitreous sections [52], which has proved valuable for the study of biomineralizing microorganisms [53], appear as promising tools for future studies.

4.2. Possible Biomineralization Processes Operating in Intracellularly Calcifying Cyanobacteria

The formation of ACC within bacteria is surprising since the cytoplasm should be undersaturated with this phase considering the chemical measurements (pH, [Ca2+] and [HCO3]) performed on some cyanobacteria [33]. Only few cyanobacteria strains can form intracellular amorphous calcium carbonates [26]. Intracellular biomineralization by cyanobacteria may therefore involve specific processes that increase supersaturation with Ca-carbonates at some location within the cells and/or possibly favor heterogeneous nucleation. The difference in Mg content of the carbonate inclusions between C7 and G9 as observed in the present study may result from a different regulation of the Ca and Mg concentrations within the cell and/or inside intracellular vesicles and/or the involvement of different nucleation processes. In the following, we discuss some potential mechanisms which might operate concomitantly. In addition to demonstrating the broad phylogenetic diversity of intracellularly calcifying cyanobacteria, Benzerara et al. [26] already mentioned some potential mechanisms involved in the biomineralization of intracellular carbonates. However, this was based on only a few 2D-TEM and SEM observations which did not allow for a deep insight into these mechanisms. Here, while discussion of the biomineralization mechanisms remains tentative, it is supported by much more detailed structural and chemical observations which provide a greater insight.

4.2.1. Possible Involvement of a Membrane-Limited Compartment in the Formation of Intracellular Carbonates

The time evolution of particle size distribution from a positively to a negatively skewed shape has been observed before in magnetotactic bacteria which form magnetosomes, i.e., magnetite nano-crystals within intracellular membrane vesicles [44,54]. At an early stage of crystal nucleation and growth, the magnetite crystal is significantly smaller than the magnetosome vesicle, and thus grows within a relatively open system according to the Law of Proportionate Effect [55], resulting in the formation of magnetite crystals with a positively skewed size distribution, i.e., log-normal shape [56]. After some time, the magnetosome vesicles stop the crystal growth due to space constraints imposed by the size of the vesicle, resulting in a negatively skewed distribution for magnetite crystals [56]. The present study revealed a similar time evolution of particle size distribution for intracellular Ca-carbonates in Ca. G. lithophora C7 cells and Ca. S. calcipolaris G9 cells. This may indicate that a similar vesicle-based process is involved in the formation of Ca-carbonates within C7 and G9. The presence of such membrane- or vesicle-like structures could not be observed but standard ultramicrotomy proved to be inaccurate to investigate these cyanobacterial cells.
A vesicle-based formation of calcite has been suggested for Achromatium sp., a giant sulfur-oxidizing bacterium belonging to Gammaproteobacteria and remarkable for its ability to accumulate micrometer-large intracellular crystals of calcite [57]. Based on TEM analyses, Head et al. [58] proposed that some calcite inclusions within A. oxaliferum cells were surrounded by membranes, although preparation of thin sections of cells often resulted in the loss of intracellular calcite as seen in the present study. Some internal structures were detected within calcite crystals, including electron-dense structures at the center of the crystal interpreted as crystal nucleation sites [58]. It was suggested that the membrane could enable a directed transport of CO32−/H+/OH and control the precipitation or dissolution of calcite as a consequence of pH changes [59]. In the case of cyanobacteria, the formation of ACC within intracellular vesicles would solve one paradox mentioned by Cam et al. [33]: on one hand, a relatively high supersaturation with Ca-carbonates of the solution is needed at ACC nucleation sites; on the other hand, the pH and Ca concentration homeostasis often observed in cyanobacteria tends to regulate these parameters at values not compatible with ACC precipitation. Alternatively, high local chemical heterogeneities not associated with vesicles but allowed by the high viscosity of the cytoplasm could be imagined. As mentioned above, analyses using cryo-TEM of the ultrastructure of cyanobacteria forming intracellular carbonates will be needed in order to test this hypothesis.

4.2.2. Carboxysomes as Possible Nucleation Sites for Ca-Carbonate Inclusions in Ca. Gloeomargarita lithophora

Cyanobacteria possess CO2-concentrating mechanisms (CCMs) which increase CO2 concentration at the CO2 fixation sites located within carboxysomes. Carboxysomes are intracellular microcompartments in cyanobacteria and some proteobacteria, delimited by a proteinaceous shell. They encapsulate several enzymes needed for CO2 fixation such as ribulose-1,5-bisphosphate carboxylase/oxygenase (RuBisCO) and carbonic anhydrase [60]. Inorganic carbon in the cytoplasm is mostly under the form of bicarbonates (HCO3). It diffuses across the carboxysome shell and is transformed in CO2 under the catalysis of carbonic anhydrase, generating OH. This local OH production and the high concentration of inorganic carbon may increase supersaturation with Ca-carbonates and favor their nucleation. One hypothesis, alternative to the vesicle hypothesis, is that carboxysomes act as nucleation points for at least some intracellular calcium carbonates in Ca G. lithophora. Here, we consider several structural features and discuss how they might be consistent with or favor this hypothesis. G9 also contains carboxysomes. However, the onset of Ca-carbonate inclusions at the septum and their preferential location at the cell poles of this strain seem less compatible with the hypothesis of nucleation on carboxysomes.
In general, the number of carboxysomes per cell is highly variable in cyanobacteria. In most studied species, one to 20 carboxysomes have been observed per cell with an average range between four and 10 carboxysomes per cell [61]. For example, the number of carboxysomes per cell varies between two and 15 in Synechocystis sp. PCC6803 [62], while the average is 3.7 ± 1.2 carboxysomes per cell in PCC7942 [63]. In comparison, the number of carbonate inclusions in Ca. Gloeomargarita lithophora cells amounts to up to 15 which is consistent overall with typical numbers of carboxysomes in cells.
There are two types of carboxysomes that differ by their protein composition and the form of RuBisCO they contain [60]. Non-marine unicellular cyanobacteria such as G9 and C7 synthesize beta-carboxysomes [64]. Beta-carboxysomes are typically bigger than alpha-carboxysomes: their observed diameters vary from 200 to 400 nm [65]. This size is compatible with the average size of Ca-carbonate inclusions in C7 but not with the smallest ones. However, partial carboxysome structures in the process of assembly or degradation have been observed in some cyanobacteria [66], making the size criterion poorly constraining.
The close spatial association between carbonate and polyphosphate inclusions as observed in C7 is remarkable. Interestingly, Iancu et al. [66] observed similar clear spatial associations between polyphosphate granules and carboxysomes with electron dense strings connecting both types of particles. Similarly, Liberton et al. [67] showed the clustering of carboxysomes with polyphosphate granules in Cyanothece sp. ATCC 51142. The origin of such connections remains unknown and the specificity of such associations will have to be further documented before concluding that carboxysomes may template carbonate inclusions.
Carbonate inclusions were observed to be aligned in some cells. Similarly, Savage et al. [63] evidenced the alignment of carboxysomes in cyanobacterial cells in relation with cytoskeletal proteins forming filament-like structures which segregate carboxysomes evenly between daughter cells during cell division. The reason why some cells contain aligned inclusions and how this may be linked with the cytoskeleton remains uncertain and will require further studies.
Lastly, the morphology of carbonate inclusions is another interesting feature. Expectedly, most carbonate inclusions are spherical which is consistent with the fact that they are amorphous as shown by selected area electron diffraction [26,33]. However, some inclusions showed facets but did not diffract electrons. Their habit was not reminiscent of that of usual crystalline calcium carbonate polymorphs such as calcite or aragonite. In contrast, it may look similar to the facetted shape of some carboxysomes [68]. This suggests that at least these carbonate inclusions may result from nucleation of Ca-carbonates at the surface of carboxysomes.

4.2.3. Division Proteins as Nucleation Sites for Ca-Carbonate Inclusions in Ca. Synechococcus calcipolaris

The distribution of carbonate inclusions is very different in G9 compared to C7 with an exclusive location at the poles and the septum of the cells. This type of distribution has been observed in several cyanobacteria with a strong link with phylogeny since it is shared by all analyzed members of the clade containing Thermosynechococcus elongatus [26]. This pattern seems to be linked with cell division. TEM images and, in particular, the evolution of size distributions suggest that carbonates inclusions are initially formed at the septum at mid-cell. The distribution of the inclusions at the poles as distorted discs is reminiscent of the circular distribution of some division proteins. For example, one of the most important proteins during cell division is the tubulin-like protein FtsZ [69]. This protein, which is ubiquitous in bacteria, archaea, plastids and some mitochondria [70], polymerizes into a more or less continuous ring structure (the Z ring) at the middle of the cell, where the septum is formed. It has been shown that this structure is not static but constantly remodeling. There are additional proteins recruited by Z-ring that contribute to the formation of the division complex [71,72].
In addition to spatial distribution, another property of FtsZ suggests a possible link with Ca-carbonate formation. Yu and Margolin [73] showed that the polymerization of E. coli FtsZ protofilaments requires millimolar levels of Ca2+. Based on this observation, they suggested that local high influxes of Ca may occur close to the septum upon cell division. This would reconcile the apparently contradicting ideas that bacteria tend to regulate their cytoplasmic Ca concentration at the sub-µM level, while much higher Ca-concentration are needed at a physiological pH for ACC precipitation to occur [33]. Up to now, only cyanobacteria from the Thermosynechococcus elongatus BP-1 clade, which includes strain G9, have been shown to form Ca-carbonate at their septum [26]. The reason for this specificity will have to be investigated in the future, in particular by considering their ability to concentrate inorganic carbon intracellularly and their pH and Ca homeostasis. It has been mentioned that not all bacteria synthesize FtsZ proteins that require high Ca concentrations to polymerize [74,75]. Therefore, it would be interesting to test whether there is some correlation between the ability of some cyanobacteria to form intracellular carbonates and the Ca concentration required for polymerization of their FtsZ. Finally, an asymmetry was observed between the poles of some cells regarding the size of their carbonate inclusions. Similar asymmetries between cell poles in biomineralizing bacteria have been observed in the past [76]. Since cell divide by binary fission in these strains, there is a pole that is older than the other in all cells. The continuation of some growth of the carbonates at the poles may therefore explain this asymmetry. Alternatively, the size of the carbonates formed at the septum of the cells may decrease with culture duration. In any case, it will be interesting to investigate whether accumulation of bigger inclusions at some poles might be advantageous, neutral or detrimental to the fitness of cells as evidenced for some protein aggregates in E. coli [77]. If detrimental, older cells with older poles might be preferentially lost from cell populations and asymmetry may therefore become a rare pattern.

5. Conclusions

We provide here a detailed view of the chemical composition, the morphology and the 2D and 3D distribution of intracellular carbonate and polyphosphate inclusions in two cyanobacterial strains: Ca G. lithophora C7 and Ca. S. calcipolaris G9. In both cases, the size distribution of carbonates evolves from a positively to a negatively skewed distribution. In Ca. S. calcipolaris G9, carbonate formation seems to be related to cell division. In Ca G. lithophora C7, carbonate inclusions show preferential alignment in some cells and can be engulfed by polyphosphate inclusions. Both strains contain carbonates with different Mg/Ca ratios. We also show that conventional ultramicrotomy fails in preserving carbonate inclusions and is therefore not appropriate for the study of associated ultrastructures. This may explain at least partly why intracellular carbonatogenesis has been overlooked in the past. Altogether, these observations open up discussion of the different non-exclusive nucleation and growth processes occurring in these cyanobacteria. At least some inclusions may nucleate and grow within intracellular vesicles. Carboxysomes and proteins involved in cell division may be additional actors in the nucleation of carbonate inclusions. Genomic and genetic approaches will likely be crucial in the future in order to get more definitive answers about the biochemical processes involved in the formation of intracellular carbonates by cyanobacteria.

Supplementary Materials

The following are available online at www.mdpi.com/2075-163X/6/1/10/s1, Movie S1-C7, Movie S2-C7, Movie S3-C7, Movie S4-G9, Movie S5-G9, Movie S6-G9.

Acknowledgments

The research leading to these results has received funding from the European Research Council under the European Community’s Seventh Framework Programme (FP7/2007–2013 Grant Agreement No. 307110-ERC CALCYAN). The TEM facility at IMPMC was purchased owing to a support by Region Ile-de-France grant SESAME 2000 E 1435. Advanced Light Source (ALS) Molecular Environmental Science beamline 11.0.2 is supported by the Office of Science, Office of Basic Energy Sciences, Division of Chemical Sciences, Geosciences, and Biosciences and Materials Sciences Division, U.S. Department of Energy, at the Lawrence Berkeley National Laboratory.

Author Contributions

Jinhua Li, Isabel Margaret Oliver, Corinne Cassier-Chauvat, Franck Chauvat, Purificacion Lopez-Garcia, David Moreira, Karim Benzerara wrote the manuscript. Corinne Cassier-Chauvat, Franck Chauvat, Feriel Skouri-Panet, Jinhua Li, Purificacion Lopez-Garcia, David Moreira and Karim Benzerara designed the experiments. Jinhua Li, Julie Cosmidis, Feriel Skouri-Panet, Céline Férard, Mélanie Poinsot prepared samples. Jinhua Li, Nithavong Cam, Marine Blondeau, Julie Cosmidis, Jean- Michel Guigner, Eric Leroy measured data. Jinhua Li and Thomas Boudier analyzed data.

Conflicts of Interest

The authors declare no conflict of interest.

Appendix

Table A1. Atomic ratios of Mg-P-K-Ca within polyphosphate and carbonate inclusions formed by Ca. G. lithophora C7 grown in BG-11 medium for two weeks.
InclusionsMg KP KK KCa K
Polyphosphate-113.2962.848.7115.13
Polyphosphate-212.7960.8510.4215.94
Polyphosphate-317.8459.407.6315.14
Polyphosphate-417.6160.516.8914.99
Polyphosphate-516.4860.147.7715.62
Polyphosphate-615.0561.517.9115.54
Polyphosphate-716.0461.878.2913.80
Polyphosphate-815.1762.237.0115.6
Ca-carbonate-116.230.572.7880.42
Ca-carbonate-219.521.472.7876.23
Ca-carbonate-319.370.791.6778.17
Ca-carbonate-415.390.553.3480.71
Ca-carbonate-514.290.591.5383.59
Ca-carbonate-618.45-1.6879.82
Ca-carbonate-716.86-1.2781.87
Ca-carbonate-813.941.771.3282.96
Table A2. Atomic ratios of Mg-Ca within carbonate inclusions formed by Ca. G. lithophora C7 grown in MS-2 medium for two months.
InclusionsMg KCa K
Ca-carbonate-116.8183.19
Ca-carbonate-215.7584.25
Ca-carbonate-313.5186.49
Ca-carbonate-418.5981.41
Ca-carbonate-518.0981.91
Ca-carbonate-615.3984.61
Ca-carbonate-716.0483.96
Ca-carbonate-814.8485.16
Ca-carbonate-917.7882.22
Ca-carbonate-1016.9583.05
Ca-carbonate-1119.3780.63
Ca-carbonate-1216.6483.36
Ca-carbonate-1312.9287.08
Ca-carbonate-1418.6681.34
Ca-carbonate-1513.2786.73
Ca-carbonate-1616.8783.13
Ca-carbonate-1711.0188.99
Ca-carbonate-1813.4886.52
Ca-carbonate-1914.9985.01
Ca-carbonate-2011.8688.14
Ca-carbonate-2113.3686.64
Table A3. Atomic ratios of Mg-P-K-Ca within polyphosphate and carbonate inclusions formed by Ca. S. calcipolaris G9 grown in BG-11 medium for two weeks.
InclusionsMg KP KK KCa K
Polyphosphate-15.6656.1612.7225.45
Polyphosphate-24.9257.6213.8623.58
Polyphosphate-36.7557.9913.8821.37
Polyphosphate-45.8253.7411.5128.93
Polyphosphate-52.9957.7113.9525.35
Polyphosphate-62.1560.6112.7024.54
Polyphosphate-74.3255.8414.0625.79
Polyphosphate-86.0956.6813.4523.78
Polyphosphate-94.8956.8912.5825.64
Ca-carbonate-13.884.341.7190.07
Ca-carbonate-26.43-3.1990.38
Ca-carbonate-3--2.7697.22
Ca-carbonate-43.692.711.3892.23
Ca-carbonate-52.461.621.3494.85
Ca-carbonate-6--2.2197.79
Ca-carbonate-7--0.5899.42
Ca-carbonate-83.491.510.9894.02
Ca-carbonate-93.47--96.43
Ca-carbonate-100.96-0.2798.77
Table A4. Atomic ratios of Mg-Ca within carbonates formed by Ca. S. calcipolaris G9 grown in MS-2 medium for one month.
InclusionsMg KCa K
Ca-carbonate-16.1893.82
Ca-carbonate-24.695.4
Ca-carbonate-31.4698.54
Ca-carbonate-44.5395.47
Ca-carbonate-57.4692.54
Ca-carbonate-62.9897.02
Ca-carbonate-75.9994.01
Ca-carbonate-83.7496.26
Ca-carbonate-97.1592.85
Ca-carbonate-105.5994.41
Ca-carbonate-113.2696.74
Ca-carbonate-125.994.1
Ca-carbonate-131.1998.81
Ca-carbonate-142.3797.63
Ca-carbonate-156.5993.41
Ca-carbonate-164.6495.36
Ca-carbonate-170.8599.15
Ca-carbonate-181.6298.38
Ca-carbonate-196.2393.77

References

  1. Golubic, S.; Seong-Joo, L. Early cyanobacterial fossil record: Preservation, palaeoenvironments and identification. Eur. J. Phycol. 1999, 34, 339–348. [Google Scholar] [CrossRef]
  2. Blank, C.E.; Sánchez-Baracaldo, P. Timing of morphological and ecological innovations in the cyanobacteria—A key to understanding the rise in atmospheric oxygen. Geobiology 2010, 8, 1–23. [Google Scholar] [CrossRef] [PubMed]
  3. Merz, M. The biology of carbonate precipitation by cyanobacteria. Facies 1992, 26, 81–101. [Google Scholar] [CrossRef]
  4. Arp, G.; Thiel, V.; Reimer, A.; Michaelis, W.; Reitner, J. Biofilm exopolymers control microbialite formation at thermal springs discharging into the alkaline Pyramid Lake, Nevada, USA. Sediment Geol. 1999, 126, 159–176. [Google Scholar] [CrossRef]
  5. Altermann, W.; Kazmierczak, J.; Oren, A.; Wright, D.T. Cyanobacterial calcification and its rock-building potential during 3.5 billion years of Earth history. Geobiology 2006, 4, 147–166. [Google Scholar] [CrossRef]
  6. Jansson, C.; Northen, T. Calcifying cyanobacteria-the potential of biomineralization for carbon capture and storage. Curr. Opin. Biotechnol. 2010, 21, 365–371. [Google Scholar] [CrossRef] [PubMed]
  7. Bundeleva, I.A.; Shirokova, L.S.; Pokrovsky, O.S.; Benezeth, P.; Menez, B.; Gerard, E.; Balor, S. Experimental modeling of calcium carbonate precipitation by cyanobacterium Gloeocapsa sp. Chem. Geol. 2014, 374, 44–60. [Google Scholar] [CrossRef]
  8. Freytet, P.; Verrecchia, E.P. Freshwater organisms that build stromatolites: A synopsis of biocrystallization by prokaryotic and eukaryotic algae. Sedimentology 1998, 45, 535–563. [Google Scholar] [CrossRef]
  9. Kupriyanova, E.V.; Pronina, N.A. Carbonic anhydrase: Enzyme that has transformed the biosphere. Russ. J. Plant Physiol. 2011, 58, 197–209. [Google Scholar] [CrossRef]
  10. Bosak, T.; Liang, B.; Wu, T.D.; Templer, S.P.; Evans, A.; Vali, H.; Guerquin-Kern, J.L.; Klepac-Ceraj, V.; Friedman, J.; Sim, M.S.; et al. Cyanobacterial diversity and activity in modern conical microbialites. Geobiology 2013, 11, 100–100. [Google Scholar] [CrossRef] [PubMed]
  11. Thompson, J.B.; Schultze-Lam, S.; Beveridge, T.J.; des Marais, D.J. Whiting events: Biogenic origin due to the photosynthetic activity of cyanobacterial picoplankton. Limnol. Oceanogr. 1997, 42, 133–141. [Google Scholar] [CrossRef] [PubMed]
  12. Kamennaya, N.; Ajo-Franklin, C.; Northen, T.; Jansson, C. Cyanobacteria as biocatalysts for carbonate mineralization. Minerals 2012, 2, 338–364. [Google Scholar] [CrossRef]
  13. Yasumoto, K.; Yasumoto-Hirose, M.; Yasumoto, J.; Murata, R.; Sato, S.; Baba, M.; Mori-Yasumoto, K.; Jimbo, M.; Oshima, Y.; Kusumi, T.; et al. Biogenic polyamines capture CO2 and accelerate extracellular bacterial CaCO3 formation. Mar. Biotechnol. 2014, 16, 465–474. [Google Scholar] [CrossRef] [PubMed]
  14. Schultze-Lam, S.; Fortin, D.; Davis, B.S.; Beveridge, T.J. Mineralization of bacterial surfaces. Chem. Geol. 1996, 132, 171–181. [Google Scholar] [CrossRef]
  15. Riding, R. Cyanobacterial calcification, carbon dioxide concentrating mechanisms, and Proterozoic-Cambrian changes in atmospheric composition. Geobiology 2006, 4, 299–316. [Google Scholar] [CrossRef]
  16. Dittrich, M.; Sibler, S. Calcium carbonate precipitation by cyanobacterial polysaccharides. Geol. Soc. Lond. Spec. Publ. 2010, 336, 51–63. [Google Scholar] [CrossRef]
  17. Lee, B.D.; Apel, W.A.; Walton, M.R. Calcium carbonate formation by Synechococcus sp. strain PCC 8806 and Synechococcus sp. strain PCC 8807. Bioresour. Technol. 2006, 97, 2427–2434. [Google Scholar] [CrossRef] [PubMed]
  18. Obst, M.; Wehrli, B.; Dittrich, M. CaCO3 nucleation by cyanobacteria: Laboratory evidence for a passive, surface-induced mechanism. Geobiology 2009, 7, 324–347. [Google Scholar] [CrossRef] [PubMed]
  19. Liang, A.Q.; Paulo, C.; Zhu, Y.; Dittrich, M. CaCO3 biomineralization on cyanobacterial surfaces: Insights from experiments with three Synechococcus strains. Colloid Surf. B 2013, 111, 600–608. [Google Scholar] [CrossRef] [PubMed]
  20. McConnaughey, T.A.; Whelan, J.F. Calcification generates protons for nutrient and bicarbonate uptake. Earth Sci. Rev. 1997, 42, 95–117. [Google Scholar] [CrossRef]
  21. Jiang, H.B.; Cheng, H.M.; Gao, K.S.; Qiu, B.S. Inactivation of Ca2+/H+ exchanger in Synechocystis sp. strain PCC 6803 promotes cyanobacterial calcification by upregulating CO2-concentrating mechanisms. Appl. Environ. Microb. 2013, 79, 4048–4055. [Google Scholar] [CrossRef] [PubMed]
  22. McCutcheon, J.; Power, I.M.; Harrison, A.L.; Dipple, G.M.; Southam, G. A Greenhouse-scale photosynthetic microbial bioreactor for carbon sequestration in magnesium carbonate minerals. Environ. Sci. Technol. 2014, 48, 9142–9151. [Google Scholar] [CrossRef] [PubMed]
  23. Spitzer, S.; Brinkmann, N.; Reimer, A.; Ionescu, D.; Friedl, T.; de Beer, D.; Arp, G. Effect of variable pCO2 on Ca2+ removal and potential calcification of cyanobacterial biofilms-an experimental microsensor study. Geomicrobiol. J. 2015, 32, 304–315. [Google Scholar] [CrossRef]
  24. Benzerara, K.; Menguy, N.; Guyot, F.; Skouri, F.; de Lucca, G.; Heulin, T. Biologically controlled precipitation of calcium phosphate by Ramlibacter tataouinensis. Earth Planet. Sci. Lett. 2004, 228, 439–449. [Google Scholar] [CrossRef]
  25. Couradeau, E.; Benzerara, K.; Gérard, E.; Moreira, D.; Bernard, S.; Brown, G.E.; López-García, P. An early-branching microbialite cyanobacterium forms intracellular carbonates. Science 2012, 336, 459–462. [Google Scholar] [CrossRef] [PubMed]
  26. Benzerara, K.; Skouri-Panet, F.; Li, J.H.; Ferard, C.; Gugger, M.; Laurent, T.; Couradeau, E.; Ragon, M.; Cosmidis, J.; Menguy, N.; et al. Intracellular Ca-carbonate biomineralization is widespread in cyanobacteria. Proc. Natl. Acad. Sci. USA 2014, 111, 10933–10938. [Google Scholar] [CrossRef] [PubMed]
  27. Ragon, M.; Benzerara, K.; Moreira, D.; Tavera, R.; Lopez-Garcia, P. 16S rDNA-based analysis reveals cosmopolitan occurrence but limited diversity of two cyanobacterial lineages with contrasted patterns of intracellular carbonate mineralization. Front. Microbiol. 2014, 5, 331. [Google Scholar] [CrossRef] [PubMed]
  28. Amarouche-Yala, S.; Benouadah, A.; el Ouahab Bentabet, A.; López-García, P. Morphological and phylogenetic diversity of thermophilic cyanobacteria in Algerian hot springs. Extremophiles 2014, 18, 1035–1047. [Google Scholar] [CrossRef] [PubMed]
  29. De Boer, W.E.; la Rivière, J.W.; Schmidt, K. Some properties of Achromatium oxaliferum. Antonie Van Leeuwenhoek 1971, 37, 553–563. [Google Scholar] [CrossRef] [PubMed]
  30. Gray, N.D. The unique role of intracellular calcification in the genus Achromatium. B. In Inclusions in Prokaryotes; Shively, J.M., Ed.; Springer: Berlin, Germany, 2006; pp. 299–309. [Google Scholar]
  31. Salman, V.; Yang, T.; Berben, T.; Klein, F.; Angert, E.; Teske, A. Calcite-accumulating large sulfur bacteria of the genus Achromatium in Sippewissett Salt Marsh. ISME J. 2015, 9, 2503–2514. [Google Scholar] [CrossRef] [PubMed]
  32. Mansor, M.; Hamilton, T.L.; Fantle, M.S.; Macalady, J. Metabolic diversity and ecological niches of Achromatium populations revealed with single-cell genomic sequencing. Front. Microbiol. 2015, 6, 822. [Google Scholar] [CrossRef] [PubMed]
  33. Cam, N.; Georgelin, T.; Jaber, M.; Lambert, J.F.; Benzerara, K. In vitro synthesis of amorphous Mg-, Ca-, Sr- and Ba-carbonates: What do we learn about intracellular calcification by cyanobacteria? Geochim. Cosmochim. Acta 2015, 161, 36–49. [Google Scholar] [CrossRef]
  34. Badger, M.R.; Andrews, T.J. Photosynthesis and Inorganic Carbon Usage by the Marine Cyanobacterium, Synechococcus Sp. Plant Physiol. 1982, 70, 517–523. [Google Scholar] [CrossRef] [PubMed]
  35. Barrán-Berdón, A.L.; Rodea-Palomares, I.; Leganes, F.; Fernandez-Pinas, F. Free Ca2+ as an early intracellular biomarker of exposure of cyanobacteria to environmental pollution. Anal. Bioanal. Chem. 2011, 400, 1015–1029. [Google Scholar] [CrossRef] [PubMed]
  36. Rippka, R.; Deruelles, J.; Waterbury, J.B.; Herdman, M.; Stanier, R.Y. Generic assignments, strain histories and properties of pure cultures of cyanobacteria. Microbiology 1979, 111, 1–61. [Google Scholar] [CrossRef]
  37. DIGIECT Software. Available online: http://www.digisens3-D.com/fr/logiciel-tomographie/soft/2-3-D_Electron_Tomography_Software.html (accessed on 1 February 2016).
  38. Nierzwicki-Bauer, S.A.; Balkwill, D.L.; Stevens, S.E., Jr. Use of a computer-aided reconstruction system to examine the three-dimensional architecture of cyanobacteria. J. Ultrastruct. Res. 1983, 84, 73–82. [Google Scholar] [CrossRef]
  39. aXis2000 Software. Available online: http://unicorn.mcmaster.ca/aXis2000.html (accessed on 1 February 2016).
  40. Cosmidis, J.; Benzerara, K.; Nassif, N.; Tyliszczak, T.; Bourdelle, F. Characterization of Ca-phosphate biomaterials by scanning transmission X-ray microscopy (STXM) at the Ca L2,3-, P L2,3- and C K-edges. Acta Biomater. 2015, 12, 260–269. [Google Scholar] [CrossRef] [PubMed] [Green Version]
  41. Yin, Z.F.; Kasrai, M.; Bancroft, G.M.; Tan, K.H.; Feng, X.H. X-ray-absorption spectroscopic studies of sodium polyphosphate glasses. Phys. Rev. B 1995, 51, 742–750. [Google Scholar] [CrossRef]
  42. Kruse, J.; Leinweber, P.; Eckhardt, K.-U.; Godlinski, F.; Hu, Y.; Zuin, L. Phosphorus L2,3-edge XANES: Overview of reference compounds. J. Synchrotron Radiat. 2009, 16, 247–259. [Google Scholar] [CrossRef] [PubMed]
  43. Fernandez-Martinez, A.; Kalkan, B.; Clark, S.M.; Waychunas, G.A. Pressure-induced polyamorphism and formation of “aragonitic” amorphous calcium carbonate. Angew. Chem. Int. Ed. 2013, 52, 8354–8357. [Google Scholar] [CrossRef] [PubMed]
  44. Li, J.H.; Pan, Y.X.; Chen, G.J.; Liu, Q.S.; Tian, L.X.; Lin, W. Magnetite magnetosome and fragmental chain formation of Magnetospirillum magneticum AMB-1: Transmission electron microscopy and magnetic observations. Geophys. J. Int. 2009, 177, 33–42. [Google Scholar] [CrossRef]
  45. Edelmann, L. Freeze-dried and resin-embedded biological material is well suited for ultrastructure research. J. Microsc. 2002, 207, 5–26. [Google Scholar] [CrossRef] [PubMed]
  46. Porta, D.; Rippka, R.; Hernandez-Marine, M. Unusual ultrastructural features in three strains of Cyanothece (cyanobacteria). Arch. Microbiol. 2000, 173, 154–163. [Google Scholar] [CrossRef] [PubMed]
  47. Blue, C.R.; Rimstidt, J.D.; Dove, P.M. A mixed flow reactor method to synthesize amorphous calcium carbonate under controlled chemical conditions. In Research Methods in Biomineralization Science; Yoreo, J.J.D., Ed.; Elsevier: San Diego, CA, USA, 2013; Volume 532, pp. 557–568. [Google Scholar]
  48. Reeder, R.J.; Tang, Y.; Schmidt, M.P.; Schmidt, M.P.; Kubista, L.M.; Cowan, D.F.; Phillips, B.L. Characterization of structure in biogenic amorphous calcium carbonate: Pair distribution function and nuclear magnetic resonance studies of lobster gastrolith. Cryst. Growth Des. 2013, 13, 1905–1914. [Google Scholar] [CrossRef]
  49. Kulaev, I.S.; Vagabov, V.; Kulakovskaya, T. The Biochemistry of Inorganic Polyphosphates; Wiley: Chichester, UK, 2004; pp. 9–12. [Google Scholar]
  50. Cartwright, J.H.E.; Checa, A.G.; Gale, J.D.; Gebauer, D.; Sainz-Díaz, C.I. Calcium carbonate polyamorphism and its role in biomineralization: How many amorphous calcium carbonates are there? Angew. Chem. 2012, 51, 11960–11970. [Google Scholar] [CrossRef] [PubMed]
  51. Keyser, D.; Walter, R. Calcification in Ostracodes. Rev. Esp. Micropaleontol. 2004, 36, 1–11. [Google Scholar]
  52. Hurbain, I.; Sachse, M. The future is cold: Cryo-preparation methods for transmission electron microscopy of cells. Biol. Cell 2011, 103, 405–420. [Google Scholar] [CrossRef] [PubMed]
  53. Miot, J.; MacLellan, K.; Boisset, N.; Benzerara, K. Preservation of protein globules and peptidoglycan in the mineralized cell wall of nitrate-reducing iron(II) oxidizing bacteria: A cryo-electron microscopy study. Geobiology 2011, 9, 459–470. [Google Scholar] [CrossRef] [PubMed]
  54. Komeili, A.; Vali, H.; Beveridge, T.J.; Newman, D.K. Magnetosome vesicles are present before magnetite formation, and MamA is required for their activation. Proc. Natl. Acad. Sci. USA 2004, 101, 3839–3844. [Google Scholar] [CrossRef] [PubMed]
  55. Eberl, D.D.; Drits, V.A.; Srodon, J. Deducing growth mechanisms for minerals from the shapes of crystal size distributions. Am. J. Sci. 1998, 298, 499–533. [Google Scholar] [CrossRef]
  56. Jandacka, P.; Alexa, P.; Pistora, J.; Li, J.H.; Vojtkova, H.; Hendrych, A. Size distributions of nanoparticles from magnetotactic bacteria as signatures of biologically controlled mineralization. Am. Mineral. 2013, 98, 2105–2114. [Google Scholar] [CrossRef]
  57. Head, I.M.; Gray, N.D.; Babenzien, H.D.; Glockner, F.O. Uncultured giant sulfur bacteria of the genus Achromatium. FEMS Microbiol. Ecol. 2000, 33, 171–180. [Google Scholar] [CrossRef] [PubMed]
  58. Head, I.M.; Gray, N.D.; Howarth, R.; Pickup, R.W.; Clarke, K.J.; Jones, J.G. Achromatium oxaliferum understanding the unmistakable. Adv. Microb. Ecol. 2000, 16, 1–40. [Google Scholar]
  59. Gray, N.; Head, I. The Family Achromatiaceae, B. In The Prokaryotes; Rosenberg, E., DeLong, E., Lory, S., Stackebrandt, E., Thompson, F., Eds.; Springer: Berlin, Germany; Heidelberg, Germany, 2014; pp. 1–14. [Google Scholar]
  60. Rae, B.D.; Long, B.M.; Badger, M.R.; Price, G.D. Functions, compositions, and evolution of the two types of carboxysomes: Polyhedral microcompartments that facilitate CO2 fixation in cyanobacteria and some proteobacteria. Mol. Biol. Rev. 2013, 77, 357–379. [Google Scholar] [CrossRef] [PubMed]
  61. Heinhorst, S.; Cannon, G.C.; Shively, J.M. Chapter 4: Carboxysomes and their structural organization in prokaryotes. In Nanomicrobiology: Physiological and Environmental Characteristics; Springer: New York, NY, USA, 2014. [Google Scholar]
  62. van de Meene, A.M.L.; Hohmann-Marriott, M.F.; Vermaas, W.F.J.; Roberson, R.W. The three-dimensional structure of the cyanobacterium Synechocystis sp. PCC 6803. Arch. Microbiol. 2006, 184, 259–270. [Google Scholar]
  63. Savage, D.F.; Afonso, B.; Chen, A.H.; Silver, P.A. Spatially ordered dynamics of the bacterial carbon fixation machinery. Science 2010, 327, 1258–1261. [Google Scholar] [CrossRef] [PubMed]
  64. Rae, B.D.; Long, B.M.; Whitehead, L.F.; Forster, B.; Badger, M.R.; Price, G.D. Cyanobacterial carboxysomes: Microcompartments that facilitate CO2 fixation. J. Mol. Microbiol. Biotechnol. 2013, 23, 300–307. [Google Scholar] [CrossRef] [PubMed]
  65. Cai, F.; Dou, Z.; Bernstein, S.L.; Leverenz, R.; Williams, E.; Heinhorst, S.; Shively, J.; Cannon, G.C.; Kerfeld, C.A. Advances in understanding carboxysome assembly in Prochlorococcus and Synechococcus implicate CsoS2 as a critical component. Life 2015, 5, 1141–1171. [Google Scholar] [CrossRef] [PubMed]
  66. Iancu, C.V.; Morris, D.M.; Dou, Z.; Heinhorst, S.; Cannon, G.C.; Jensen, G.J. Organization, structure, and assembly of α-carboxysomes determined by electron cryotomography of intact cells. J. Mol. Biol. 2010, 396, 105–117. [Google Scholar] [CrossRef] [PubMed]
  67. Liberton, M.; Austin, J.R., II; Berg, R.H.; Pakrasi, H.B. Unique thylakoid membrane architecture of a unicellular N2-fixing cyanobacterium revealed by electron tomography. Plant Physiol. 2011, 155, 1656–1666. [Google Scholar] [CrossRef] [PubMed]
  68. Tanaka, S.; Kerfeld, C.A.; Sawaya, M.R.; Cai, F.; Heinhorst, S.; Cannon, G.C.; Yeates, T.O. Atomic-level models of the bacterial carboxysome shell. Science 2008, 319, 1083–1086. [Google Scholar] [CrossRef] [PubMed]
  69. Adams, D.W.; Errington, J. Bacterial cell division: Assembly, maintenance and disassembly of the Z ring. Nat. Rev. Microbiol. 2009, 7, 642–653. [Google Scholar] [CrossRef] [PubMed]
  70. Gilson, P.R.; Beech, P.L. Cell division protein FtsZ: Running rings around bacteria, chloroplasts and mitochondria. Res. Microbiol. 2001, 152, 3–10. [Google Scholar] [CrossRef]
  71. Mazouni, K.; Domain, F.; Cassier-Chauvat, C.; Chauvat, F. Molecular analysis of the key cytokinetic components of cyanobacteria: FtsZ, ZipN and MinCDE. Mol. Microbiol. 2004, 52, 1145–1158. [Google Scholar] [CrossRef] [PubMed]
  72. Cassier-Chauvat, C.; Chauvat, F. Cell division in cyanobacteria. In The Biology of Cyanobacteria; Flores, E., Herrero, A., Eds.; Caister Academic Press: Norfolk, UK, 2014. [Google Scholar]
  73. Yu, X.C.; Margolin, W. Ca2+-mediated GTP-dependent dynamic assembly of bacterial cell division protein FtsZ into asters and polymer networks in vitro. EMBO J. 1997, 16, 5455–5463. [Google Scholar] [CrossRef] [PubMed]
  74. Mukherjee, A.; Lutkenhaus, J. Analysis of FtsZ assembly by light scattering and determination of the role of divalent metal cations. J. Bacteriol. 1999, 181, 823–832. [Google Scholar] [PubMed]
  75. Jaiswal, R.; Panda, D. Differential assembly properties of Escherichia coli FtsZ and Mycobacterium tuberculosis FtsZ: An analysis using divalent calcium. J. Biochem. 2009, 146, 733–742. [Google Scholar] [CrossRef] [PubMed]
  76. Miot, J.; Benzerara, K.; Morin, G.; Kapplerb, A.; Bernardc, S.; Obstd, M.; Férarda, C.; Skouri-Paneta, F.; Guignera, J.; Posth, N.; et al. Iron biomineralization by neutrophilic iron-oxidizing bacteria. Geochim. Cosmochim. Acta 2009, 73, 696–711. [Google Scholar] [CrossRef]
  77. Lindner, A.B.; Madden, R.; Demarez, A.; Stewart, E.J.; Taddei, F. Asymmetric segregation of protein aggregates is associated with cellular aging and rejuvenation. Proc. Natl. Acad. Sci. USA 2008, 105, 3076–3081. [Google Scholar] [CrossRef] [PubMed]

