Article

Coupling Effect of Intruding Water and Inherent Gas on Coal Strength Based on the Improved (Mohr-Coulomb) Failure Criterion

1
State Key Laboratory of Coal Mine Disaster Dynamics and Control, Chongqing University, Chongqing 400044, China
2
National & Local Joint Engineering Laboratory of Gas Drainage in Complex Coal Seam, Chongqing University, Chongqing 400044, China
*
Author to whom correspondence should be addressed.
Minerals 2016, 6(4), 118; https://doi.org/10.3390/min6040118
Submission received: 20 September 2016 / Revised: 20 October 2016 / Accepted: 28 October 2016 / Published: 2 November 2016

Abstract

:
When employing hydraulic processes to increase gas drainage efficiency in underground coal mines, coal seams become a three-phase medium, containing water intruding into the coal pores with the inherent occurrence of gas. This can change the stress state of the coal and cause instability. This work studied the mechanical properties of coal containing water and gas and derived an appropriate failure criterion. Based on mixture theory of unsaturated porous media, the effective stress of coal, considering the interaction of water and gas, was analyzed, and the failure criterion established by combining this with the Mohr–Coulomb criterion. By introducing the stress factor of matrix suction and using fitted curves of experimentally determined matrix suction and moisture content, the relationships between coal strength, gas pressure, and moisture content were determined. To verify the established strength theory, a series of triaxial compression strength tests of coal containing water and gas were carried out on samples taken from the Songzao, Pingdingshan, and Tashan mines in China. The experimental results correlated well with the theoretical predictions. The results showed a linear decrease in the peak strength of coal with increasing gas pressure and an exponential reduction in peak strength with increasing moisture content. The strength theory of coal containing water and gas can become an important part of multiphase medium damage theory.

1. Introduction

Occurrence of a methane disaster is an important factor restricting efficient and safe production in coal mines. Gas drainage is widely used in Chinese underground mines as a primary method of decreasing the likelihood of methane accidents [1,2,3]. As mine depths increase, the coal seams typically have a higher methane content and lower permeability [4], which increase the difficulties of gas drainage. To improve the efficiency of gas extraction, hydraulic measures that relieve coal seam pressure and increase permeability have developed rapidly in recent years. Hydraulic measures utilize high pressure water for power injecting into the coal seam, invading the original pores and fractures, and expanding the gas flow channels in order to achieve the goals of reservoir pressure relief and increasing permeability. These include hydraulic punching, hydraulic slotting, and hydraulic fracturing technologies in underground coal mines [5]. During these hydraulic processes, a lot of water enters the coal pores, forming a three-phase medium composed of intruding water, inherent gas, and coal. The water extension radius of previous hydraulic measures can reach 30–60 m [6], so that water is abundant in coal pores and fractures after hydraulic processes. This significantly changes the physical and mechanical properties of the coal.
A small increase in the moisture content of coal has a considerable effect on the stability of the seam and can cause a significant reduction in strength and increase in deformation [7,8]. In underground mines, this may lead to roadway instability and induce coal and gas outbursts. Several researchers have investigated the mechanism and influence of moisture content on the mechanical properties of coal and rocks [9]. Mechanical measurements of the uniaxial or triaxial strength of coal and rocks with different moisture contents have also been conducted [10,11]. Van Eeckhout [12] indicated several reasons why moisture content lowered the strength of rock, including those of fracture energy reduction, pore pressure increase, capillary tension reduction, chemical deterioration, and frictional decrease.
The storage and adsorption of gas in seams can also influence the mechanical properties of coal [13,14,15]. St. George et al. [16] established an effective stress calculation model for the two-phase medium of coal containing gas. They found that an increase of gas content and pressure could lead to an increase in pore pressure and decrease in effective stress, resulting in a reduction in coal strength. Gas in coal can exist either in an adsorbed state on the inner surface of coal or in a free state in pores and fractures [17]. During the mining process, the state of the gas occurrence and the pore pressure are in flux with the adsorption and desorption of gas [18]. Experimental research has also been carried out to study the deformation and strength characteristics of coal in a gas medium [19,20]. Changes in coal strength and elastic modulus have been studied by triaxial compression experiments under different gas pore pressures [21,22].
Previous studies have, however, only focused on the two-phase medium of coal containing water or gas. Their conclusions and mechanisms do not apply to the three-phase medium formed by coal during simultaneous gas drainage and hydraulic processes. The stress state of coal containing both water and gas is complex because of their interaction and the shrinkable interface film between water and gas, and cannot be determined by the superposition of the individual stress changes induced by gas and water alone.
This work studied the stress state and strength characteristics of coal containing both water and gas. Based on the mixture theory of unsaturated porous media and the principle of effective stress, the mechanical characteristics of coal containing water and gas were analyzed theoretically and the failure criterion was determined. Laboratory-scale conventional triaxial compression strength experiments under different moisture contents and gas pressures were conducted to verify the strength theory derived for the three-phase medium coal.

2. Development of the Theory

2.1. Effective Stress of Coal Containing Water and Gas

Coal is a porous medium containing a fracture network. Following implementation of hydraulic measures, the pores and fractures within a coal particle are filled with water and gas, forming a three-phase medium composed of the coal matrix, water, and gas, as shown in Figure 1. Water occurrence in coal has two kinds of phases. When the moisture content of coal is small (less than 0.1%), water exists in coal matrix in the form of vaporous water [23]. When the moisture in coal exceeds a critical level (balance moisture), vaporous water in the coal matrix reaches saturation, so other water exists in the form of liquid water. Because liquid water is unable to overcome the interfacial tension and go into micropores, liquid water can only invade the outer surface of the coal and the surface of mesopores and macropores [24]. Under the general geological conditions in Chinese coal mines, the moisture contents of coal reservoirs are about 1%–3%, which is sufficient to reach gas saturation. In the process of hydraulic measures implementation, a large amount of water invades the coal. The vaporous water and gas occurrence in the coal matrix and the liquid water and free gas existing in pores and fractures make coal a complex three phase medium.
The classic Biot model has been used to analyze two-phase saturated porous media and describe the strength characteristics of coal containing gas [25]. The three-phase medium of coal containing water and gas belongs to the class of typical unsaturated porous media, so this model is not applicable. With the development of the theory of mixtures in recent years [26], this theory can be used to describe three-phase field equations for unsaturated porous media and is very convenient for analyzing the three-phase medium strength characteristics of coal containing water and gas.
Mechanical damage to coal is a mutation process, so it can be assumed that: (1) the three components of coal, water, and gas are independent and cannot transform into each other; (2) these three components have the same temperature; (3) the coal matrix and water are incompressible, but the gas can be compressed. According to the mixture theory of unsaturated porous media [27], the field equations for motion of the three components are:
ρ g v g = ρ g grad ( Ψ I ρ g ) + div [ Θ 0 d g + Θ 0 ( w g w s ) ] + ρ g b g + ( P + Ψ I φ g ) grad φ g ρ g η g g Θ 0 ( v g v s )
ρ l v l = φ l grad ( Ψ I φ l ) + div [ Θ 0 d l + Θ 0 ( w l w s ) ] + ρ l b l φ l grad P ρ l η l g Θ 0 ( v l v s )
ρ s v s = div [ 2 F s Ψ I ( F s T F s ) F s T + Θ 0 d s f Θ 0 ( w f w s ) ] + ρ s b s φ s grad P + Ψ I ( F s T F s ) grad ( F s T F s ) ρ s η s g + f Θ 0 ( v f v s )
where ρ is the volume density; v is the particle velocity; ΨI is the total free energy per unit volume of the mixture; Θ0 is the mixture dissipation potential; d is the rate of deformation tensor; w is the spin tensor; b is the external body force; P is the Lagrange multiplier; φ is the volume fraction; η is the entropy density; g is the mixture temperature distribution gradient; F is the deformation gradient; the subscripts g, l, s respectively represent gas, water, and coal particles.
The three components are in equilibrium, so grad φa (a = s, l, g) (the volume fraction space gradient) of each component and grad ρg (the density space gradient of the gas component) can be ignored. φf (f = l, g) (the volume fraction of the water component) is no longer regarded as a state variable, but only a state parameter. Equations (1)–(3) can therefore be simplified to:
ρ g v g = φ g grad ( P g ) Θ 0 ( v g v s ) + ρ g b g
ρ l v l = φ l grad P l Θ 0 ( v l v s ) + ρ l b l
ρ s v s = 2 div [ F s ( Ψ I ( F s T F s ) ) F s T ] φ s grad ( P l Ψ I φ l ) + f Θ 0 ( v f v s ) + ρ s b s
where
P l = P + Ψ I φ l ,   P g = γ g Ψ I ρ g
Pg and Pl are respectively the true stresses of the gas and water components. Compressive stress is regarded as positive. Equations (4)−(6) are summed to:
a ρ a v a = div t T + ρ b
where
t T = 2 F s ( Ψ I ( F s T F s ) ) F s T [ φ g P g + ( φ l + φ s ) P l φ s Ψ I φ l ] I
is the total stress of coal containing water and gas.
From Equation (6), the stress related to the deformation of the solid component is:
t E = 2 F s ( Ψ I ( F s T F s ) ) F s T
Equation (9) can be transformed into:
( t E ) = [ ( t T ) P g I ] + ( 1 φ g ) ( P g P l ) I + φ s Ψ I φ l I
As mentioned above, φll = nS, where n is the porosity of coal and S is the water saturation) is a state parameter of coal containing water and gas, rather than a state variable, therefore
Ψ I φ l = 0
Equation (11) can be transformed into:
( t E ) = [ ( t T ) P g I ] + ( 1 φ g ) ( P g P l ) I
where (−tE) is the effective stress and (−tT) is the total stress of coal containing water and gas. In rock mechanics, stress is expressed by σ, so Equation (12) can be written as:
σ = σ P g + ( 1 φ g ) ( P g P l )

2.2. Failure Criterion for Coal Containing Water and Gas

Based on the Mohr–Coulomb failure criterion and the concept of effective stress, the shear strength of coal containing water and gas can be expressed as:
τ = c + σ tan φ
where c is the cohesive force; σ′ is the effective stress; ϕ is the angle of internal friction.
Substituting Equation (13) into Equation (14) yields Equation (15):
τ = c + ( σ P g ) tan φ + ( P g P l ) ( 1 φ g ) tan φ
Defining (1 − φg) tanϕ = tanϕ′, where ϕ′ expresses the effective internal friction angle and the value of ϕ′ is related to the coal porosity, the water saturation, and the angle of internal friction, Equation (15) can be written as:
τ = c + ( σ P g ) tan φ + ( P g P l ) tan φ
Equation (16) shows that the shear strength of coal containing water and gas comprises the cohesive force, the strength caused by stress variable (σ − Pg), and the strength caused by stress variable (PgPl). The strength caused by stress variable (σ − Pg) is related to the internal friction angle, and the strength caused by stress variable (PgPl) is related to the effective angle of internal friction.

3. Matrix Suction of Coal

In a capillary tube, the surface of the liquid is bent, and is usually called the meniscus. Due to the gas-liquid interface shrinkage, the fluid pressures on both sides of the meniscus are discrete, and the pressure difference is called capillary pressure. In soil science, the negative capillary pressure, namely pressure difference of gas and water (PgPl), is often called suction or matrix suction. Fredlund [28] introduced matrix suction as a stress factor into the constitutive equation of unsaturated soil, which has been well applied. This paper brings matrix suction into the calculation of coal strength for the first time, and the calculation results will be verified and compared with experimental measurement.
Matrix suction is the capillary part of the water free energy in multiphase porous media. Its value is related to the pore radius of the medium and the equilibrium relative humidity. For the same coal samples, the porosity and pore size distribution are the same, so the matrix suction is only related to moisture content.
In theory, if there are pores with diameter less than 10 nm in a porous medium, the matrix suction could exceed 14.56 MPa [29]. Most pores in coal are micropores of less than 10 nm, so matrix suction will have an important effect on the strength of coal containing water and gas.

3.1. Methods of Measuring Matrix Suction

There are many ways of measuring matrix suction, including the tension meter, filter paper, dialysis, pressure plate, centrifuge, and triaxial apparatus methods. Among them, the tension meter, dialysis, pressure plate, centrifuge, and triaxial apparatus methods are all easily influenced by the porosity of the measured medium, and their measuring ranges are all small and cannot cover the matrix suction values of coal containing water and gas. The filter paper method was first proposed by Gardner [30]. The method follows the principle of thermodynamic equilibrium and can realize full-range measurement. When the filter paper is in contact with the coal sample, moisture in the coal will move between the paper and sample until equilibrium is reached. Previous research showed that this method not only measures the total suction of coal, but is also able to test the matrix suction indirectly; it has a large range and high accuracy, combined with low cost and simple operation.
The filter paper method is based on the assumption that a filter paper will attain equilibrium (i.e., with respect to moisture flow) with a coal having a specific suction. Equilibrium can be reached by either liquid or vapor moisture exchange between the coal and the filter paper. When a dry filter paper is placed in direct contact with a coal specimen, it is assumed that water flows from the coal to the paper until equilibrium is achieved. Having established equilibrium conditions, the water content of the filter paper is measured. The water content of the filter paper corresponds to a suction value. Theoretically, the equilibrium water content of the filter paper corresponds to the matrix suction of the coal when the paper is placed in contact with the water in the coal.

3.2. Coal Samples

To study the general applicability of the failure criterion, three types of Chinese coal samples were used in these experiments, taken respectively from the No. 7 coal seam of Songzao mine in Chongqing, the No. 15 coal seam of Pingdingshan mine in Henan, and the No. 3–5 coal seam of Tashan mine in Shanxi, as shown in Figure 2. These coals have different hardnesses, ranging from soft to hard, respectively. The specifications of the samples, including porosity, pore size etc., are summarized in Table 1. Porosity was measured by an AP-608 automatic burdening pressure permeameter (Coretest, Morgan Hill, CA, USA) under 6.2 MPa circling pressure, and the average pore size was measured by an AutoPore IV 9500 type automatic mercury porosimeter (Micromeritic, Norcross, GA, USA). According to the standard recommended by the International Society for Rock Mechanics, the coals were processed as cylindrical samples of 50 mm diameter and 100 mm height.
The coal was dried in a 120 °C oven with vacuum for more than 24 h to remove the pre-existing moisture. Drying for 48 h was conducted for three types of samples followed by weighing the samples, which showed that the weight of the 48 h drying sample was the same as that of the 24 h drying sample for each kind of coal, so 24 h was enough to remove the liquid water in the pores and fissures of the specimens and some vapor water in the specimen matrix. The purpose of drying the specimens was to measure the dry weight of specimens and then to control the moisture content of specimens by soaking in water. Short time and vacuum was used to reduce the coal oxidation rate. Then the coal cores were soaked in water for periods of 1, 2, 4, and 8 days at 50 °C. After soaking in water, the sample was wrapped with plastic wrap and kept in a sealed cavity for two weeks, where NaCl aqueous solution was present to control the water vapor partial pressure within the air in the cavity at about 75% relative humidity at room temperature, to ensure that the cores were uniformly saturated with water. After each preset time, a set of coal samples was removed and weighed to calculate the moisture content of each specimen. The specific moisture contents are shown in Table 2, given as the average for each set of samples. The moisture content used in this work is defined as:
w % = m H 2 O m coal × 100 %
where w is the moisture content of coal; mH2O is the total mass of water uptake in coal; mcoal is the total mass of the dry coal.

3.3. Test Procedure

The calibration curve for a specific filter paper can be established by measuring the water content of filter paper in equilibrium with a salt solution having a known osmotic suction. The used filter paper in this work is the Whatman No. 42 type filter paper (Whatman, Maidstone, UK). The filter paper should be suspended above at least 50 cm3 of a salt solution, as shown in Figure 3a. The procedure for ensuring equilibration and measuring the water content is the same as those used during the measurements of coal suction. Various filter paper water contents can then be plotted against the differing osmotic suctions to give the calibration curve. This work used NaCl solution of different concentrations to calibrate the suction curve of filter paper, NaCl salt solution with distilled water according to Table 3 (25 °C, NaCl solution related parameters). The analysis on solute penetration by Lang shows that the total suction of 0.4–4.0 mol/L NaCl solution is about 9.75–12.5 MPa under the condition of 25 °C [31]. Because of the matrix suction of coal being greater than 10 MPa, the calibration for high matrix suction was used here (filter paper moisture content less than 20%).
The matrix suction measurement of the coal samples: Two samples, having been soaked for the same time, were placed one on top of the other with three layers of Whatman No. 42 filter paper between them: the middle filter-paper layer was 4 cm in diameter and used to test moisture content; the upper and lower layers were 5 cm in diameter and protected the middle layer from contamination. The seam between the two samples was taped with insulating tape and they were placed in a sealed tank at a constant temperature water (25 °C), as shown in Figure 3b, and allowed to stand for 10 days. The moisture content of the filter paper was then measured.
Considering the light weight and high water sensitivity of the filter paper, it was necessary to operate carefully, weigh quickly, and avoid direct contact of the filter paper with the hand during the experimental process, thereby avoiding contamination of the filter paper moisture content as far as possible.

3.4. Test Results

The measured moisture contents of filter paper are shown in Table 3. The filter paper moisture contents and the corresponding suction values of NaCl solution are drawn into the logarithmic coordinates for linear fitting. The calibration curve for Whatman No. 42 filter paper that is suitable for high suction values and filter paper moisture contents of less than 20% is shown in Figure 4, and the calibration results are consistent with the measurement results of Hamblin [32].
The moisture content of each filter paper for coal samples is shown in Figure 5a. Equation (18) gives the calibration curve for Whatman No. 42 filter paper that is suitable for measuring moisture contents of less than 20%. The matrix suction of the coal samples under different moisture contents was obtained by substituting the values of the moisture content of each filter paper into this calibration curve.
lg ( P g P l ) = 0.0779 w f + 2.327
where wf is the moisture content of filter paper.
Figure 5b shows the relationships between the matrix suction and the moisture contents of the coals containing water and gas. The curves were fitted using an exponential function, with the relationship expressed as follows:
( P g P l ) = a e b w
Figure 5b shows that the a and b values have a tendency to decrease with increasing hardness of the coal.
An expression for the failure criterion of coal as a function of the water and gas properties was obtained by substituting Equation (19) into Equation (16):
τ = c + ( σ P g ) tan φ + a e b w tan φ
Defining c′ = c + ae−bwtanϕ′, then when the moisture content is constant, c′ is a constant, known as the effective cohesive force. The failure criterion can then be written as:
τ = c + ( σ P g ) tan φ
This is the same as the failure criterion for coal containing only gas established by Li et al. [33]. The failure criterion of coal containing water and gas established in this work is therefore a special case of that for coal containing gas.

4. Triaxial Compression Strength

To validate the failure criterion for coal containing water and gas and study the relationship between coal strength, moisture content, and gas pressure, laboratory-scale triaxial compression strength experiments were conducted. The experiments reported here were all carried out on raw coal samples. For the preparation of coal samples refer to Section 3.2.

4.1. Experimental Methods

Experiments were performed using an in-house equipment design with a RLW-2000M microcomputer-controlled coal and rock rheometer (Chaoyang Instrument Factory, Changchun, China). The equipment comprised loading facilities, a control system, a triaxial pressure chamber, a confining pressure system, a pore water pressure system, temperature control, and an output printing device. The control system employed an EDC (Externe Digital Controller) all-digital servo control device (DOLI, Munich, Germany) (Figure 6a), which could separately control three independent closed-loop systems: those of axial compression, confining pressure, and pore pressure. The loading system used a servo motor and ball-screw loading system (Figure 6b), which could perform various deformation experiments for extended periods under load control or displacement and deformation control. The maximum axial load was 2000 kN; the load resolution was 20 N; the maximum gas seepage pressure was 20 MPa; the gas pressure precision was 2%. Axial and lateral strains were measured by extensometers (Figure 6c).
The gas used was methane of 99.99% purity. Based on the principle of the confining pressure being greater than the gas pressure, the confining pressure was set to a constant value of 3 MPa. Four moisture contents and three gas pressures were considered. Each strength experiment was repeated three times under the same conditions, so 36 samples were required from each coal mine. The experimental program is shown in Table 4.
Each coal sample was fixed on a metal base at each end and then sealed and placed in a triaxial pressure chamber. The metal bases had a permeable plate in contact with the sample and an airflow orifice with a metal tube connecting the air inlet or outlet of the equipment, as indicated in Figure 6c. During the experiment, a small axial compression was first exerted on the coal sample, and then the confining pressure and gas pressure were gradually loaded to the set value. These pressures were maintained for 24 h, allowing the coal sample to fully adsorb the gas. After adsorption saturation, the sample was loaded under triaxial pressure at a rate of 0.02 mm/s axial displacement until the sample was damaged.

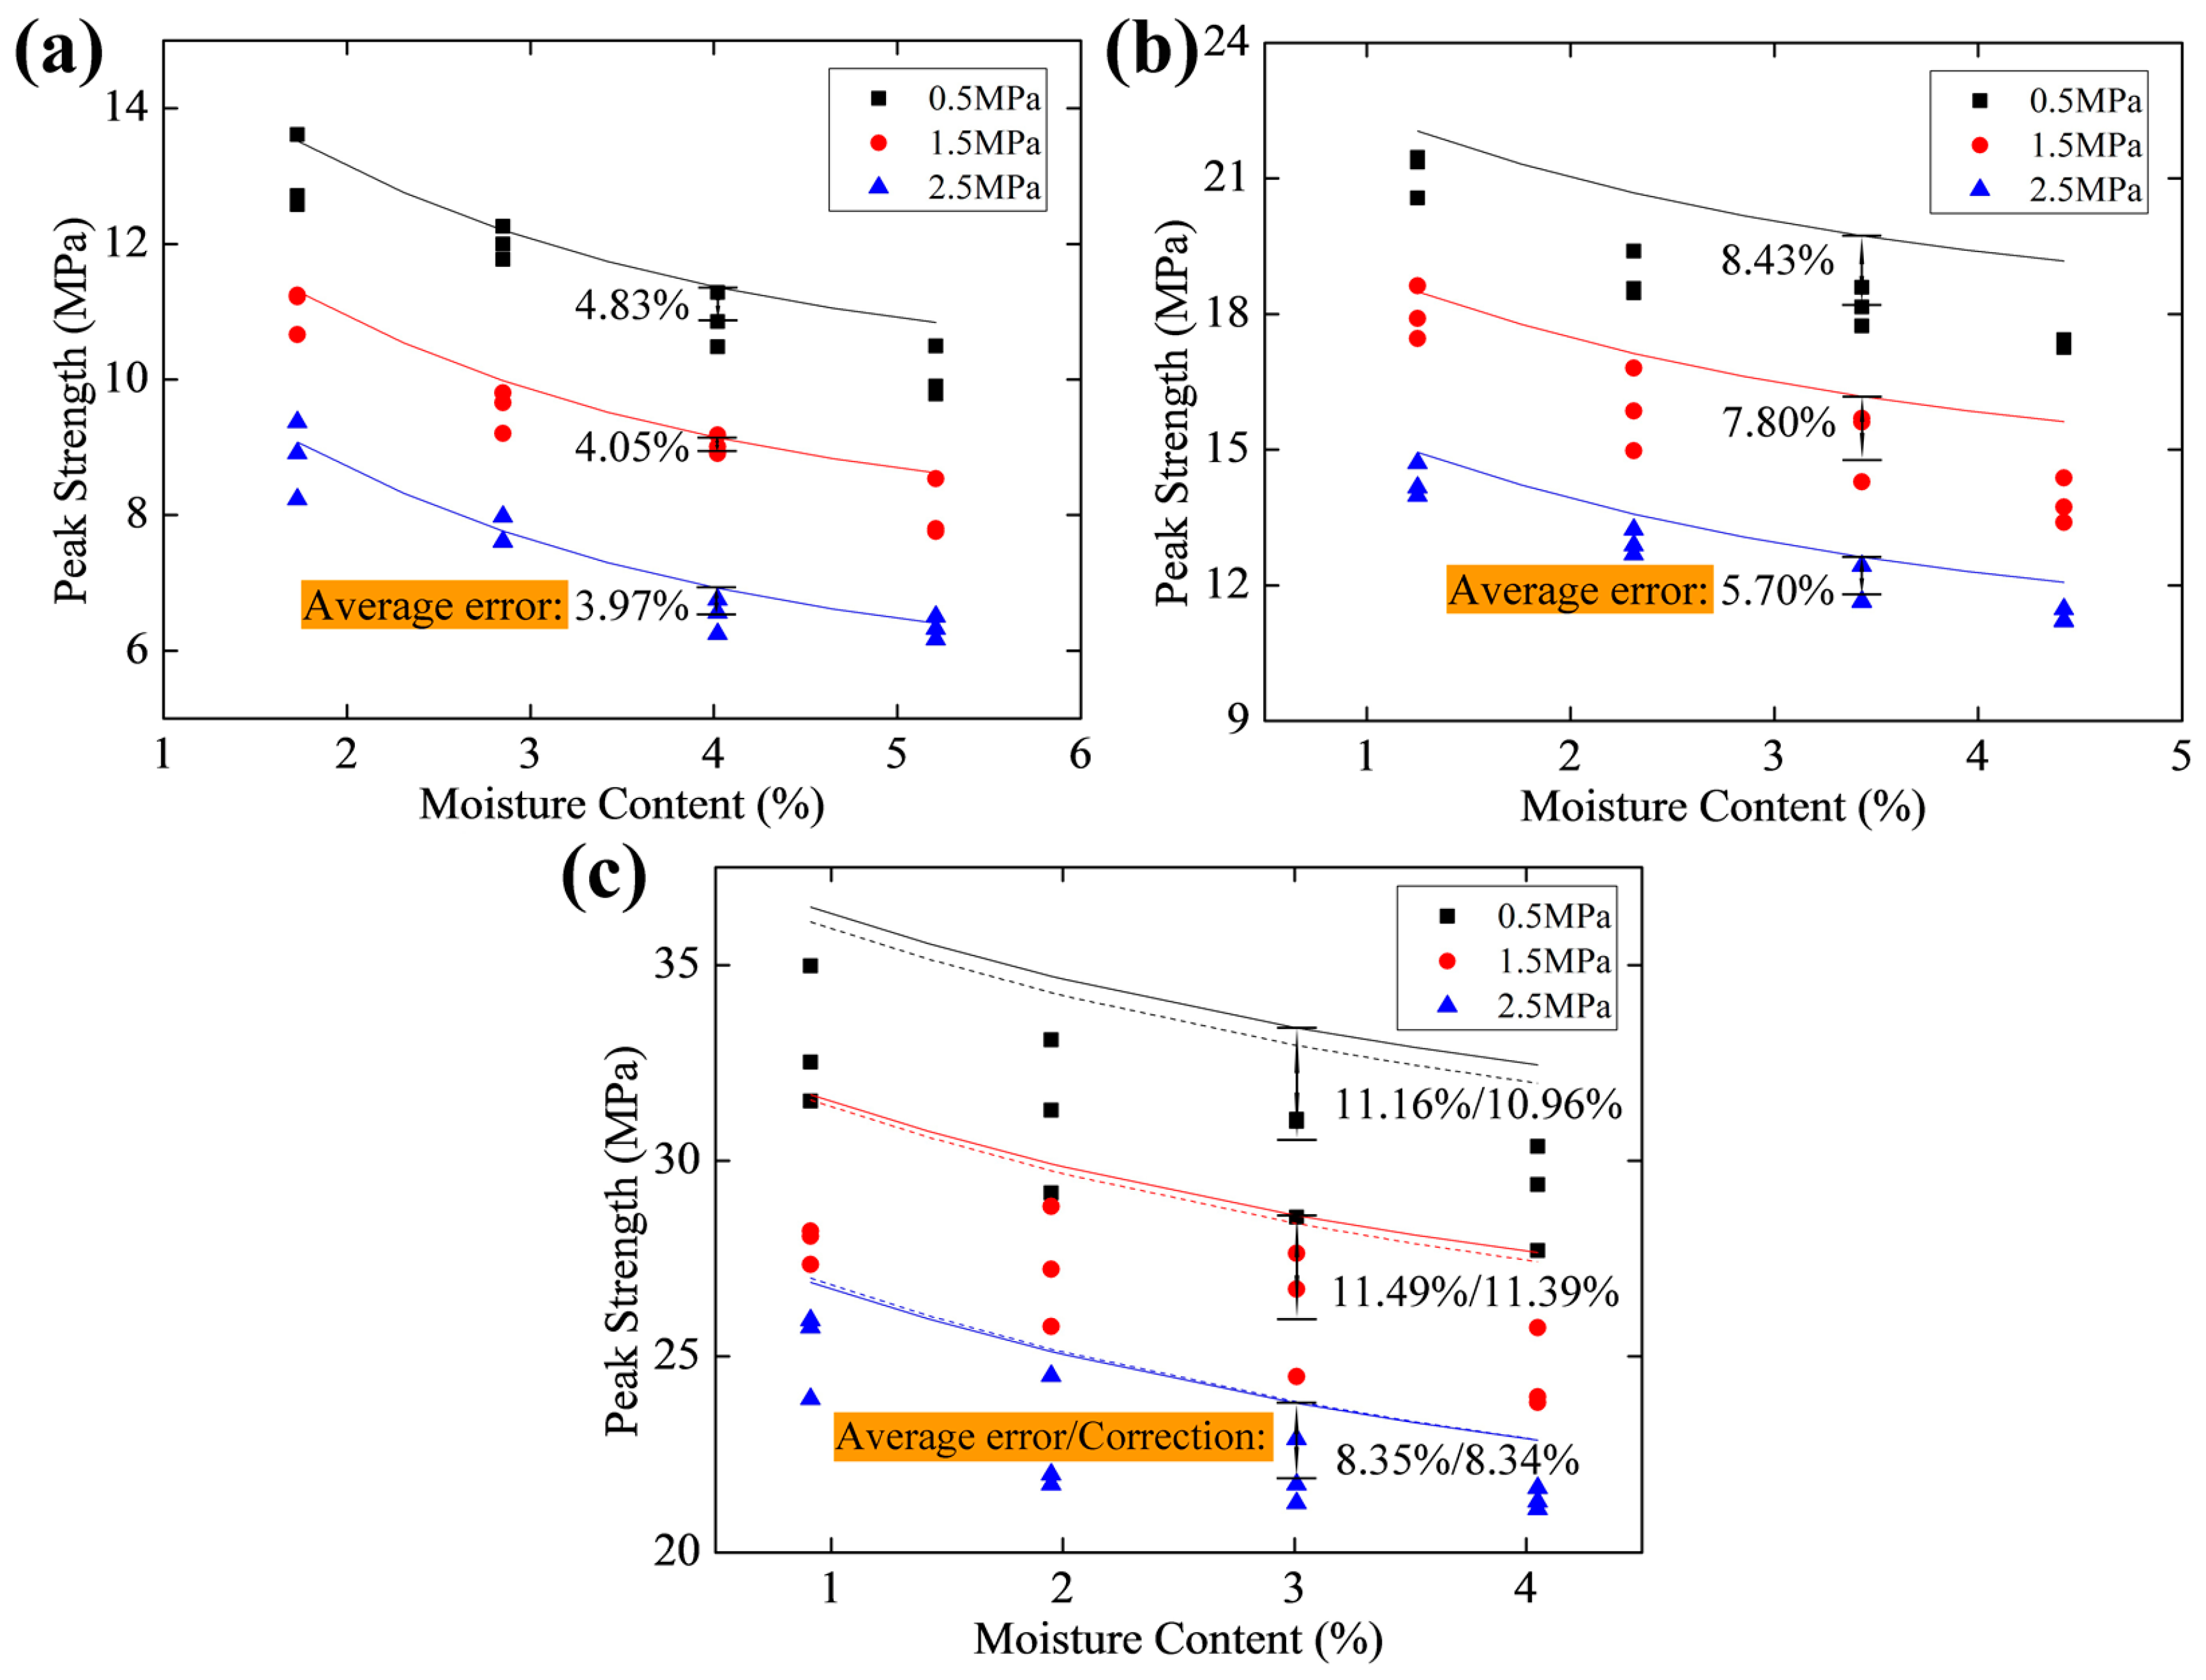
4.2. Experimental Results and Analysis

The failure criterion for coal containing water and gas can be visually expressed using a Mohr stress circle diagram, as shown in Figure 7. Equation (21) is represented by the line AL, of which the slope is f = tanϕ and the τ intercept is c′.
Under the stress state shown in Figure 7, the plane stresses (σ − Pg) and τ are determined by the stress circle based on stresses (σ1Pg) and (σ3Pg), and Equation (22) can be obtained:
sin φ = σ 1 σ 3 2 c cot φ + σ 1 + σ 3 2 P g
This can be rewritten as:
σ 1 P g = 1 + sin φ 1 sin φ ( σ 3 P g ) + 2 [ c + a e b w tan φ ] cos φ 1 sin φ
Arranging the difference between the confining pressure and the gas pressure (σ3Pg) as the abscissa and the difference between the strength and gas pressure (σ1Pg) as the ordinate, and applying a linear fit to data for the same moisture content gave the results as shown in Figure 8.
According to Equation (23), the internal friction angle and effective cohesive force for coal samples of the same moisture content can be calculated from the slope and intercept of these linear plots, as given by Equation (24).
{ φ = sin 1 ( m 1 m + 1 ) c = l ( 1 sin φ ) 2 cos φ
These calculations show that the internal friction angle hardly changes with moisture content, as shown in Figure 9. The coal samples from Songzao were softest and the internal friction angle was 31.74°; Pingdingshan coal, with an intermediate hardness, gave a value of 39.78°; the hardest coal from Tashan gave 44.89°.
The relationship between the effective cohesive force c′ and the matrix suction (PgPl) for coal samples of different moisture contents is shown in Figure 10. Using the formula c′ = c + (PgPl) tanϕ′, the cohesive forces c of the three coals were calculated as 0.42, 1.42, and 3.08 MPa, respectively, and the effective internal friction angles ϕ′ were calculated as 0.34°, 0.44°, and 1.22°, respectively.
To directly reflect the relationship between the coal strength and these various factors, Equation (23) was rewritten as:
σ 1 = 2 c cos φ 1 sin φ + 1 + sin φ 1 sin φ σ 3 2 sin φ 1 sin φ P g + 2 a cos φ tan φ 1 sin φ e b w
This shows that coal strength is linearly related to gas pressure and has a negative exponential relationship with moisture content. Figure 11 and Figure 12 show the coal strength as a function of gas pressure and moisture content, respectively, where the data points represent experimental values and the solid lines show the theoretical relationships. Theoretical curves showing the relationships between coal strength and water content or gas pressure were obtained by substituting the internal friction angle ϕ, the effective internal friction angle ϕ′, and cohesive forces c (obtained by proper fitting of the experimental data) into Equation (25).
Figure 11 and Figure 12 show that the experimental results agreed reasonably well with the theoretical derivation. Coal sample strength was affected by both gas pressure and moisture content, linearly decreasing with increasing gas pressure and exponentially decreasing with moisture content. The strength criteria of coal containing water and gas Equation (16) shows that coal strength is affected by two stress factors (σ − Pg) and (PgPl). In the three-phase mixture medium, methane in the gas phase determines the pore pressure Pg, and the interfacial surface tension of liquid water and gas phase causes the liquid pressure Pl to be less than the gas pore pressure Pg. (PgPl), namely the matrix suction, can be measured through experiments, and its value is only associated with the pore size of the porous media and the moisture content. Therefore, the stress factor (σ − Pg) is related to the change of gas pressure, and the stress factor (PgPl) is determined by moisture content. The experiment data show the effective internal friction angle of coal ϕ′ is far less than the internal friction angle ϕ, which makes it 0.34°–1.22° less than 31.74°–44.89°, so the influence of moisture content on coal strength is slightly smaller than that of gas pressure. Strength data obtained from the experiments also confirms this point. For Songzao coal samples, the coal strength reduced by 25.9% when the moisture content increased from 1.73% to 5.21% (close to saturated moisture content), while the strength reduced by 36.0% when gas pressure increased from 0.5 to 2.5 MPa. The strength decreased by 20.6% for Pingdingshan samples and 12.9% for Tashan samples within the increasing range of moisture content, and it reduced by 33.2% and 26.0% for two types of samples respectively within the increasing range of gas pressure. Therefore, the influence of gas pressure changes on coal strength is more significant than that of moisture content.
The strength of the soft coal was more strongly influenced by moisture content: compared with the natural moisture state, the reduction in strength of water-saturated samples exceeded 20%. The influence of moisture content on the strength of the hard coal was relatively small—about 10% for water-saturated conditions. This is mainly because a greater number of micropores occur in soft coals, so the matrix suction induced by water is greater, as can be seen from the a and b values in Equation (19). This causes a larger strength reduction of the coal sample, as reflected by Equation (25). The values of a and b can therefore reflect the degree of development of coal micropores and determine the extent of coal strength affected by moisture content.
Strictly speaking, there is a small deviation between theory and experimental results: this is mainly due to the heterogeneity of the coal material causing the calculation deviations of effective internal friction angle and cohesive force. Additionally, only three levels of gas pressures were considered, so there may be a deviation between the linear-fitted and measured values.

5. Discussion

The deviations are small for soft coal from Songzao and Pingdingshan, and the deviation is larger for Tashan hard coal, which illustrates this theory is more suitable for soft coal. The internal friction angle ϕ and effective cohesive force c′ are obtained by proper fitting of the experimental data. The data of the internal friction angle shown in Figure 9 is uniformly distributed on both sides of the fitting straight line, and the fitting result is good. However, the data linear fitting of effective cohesive force in Figure 10 shows a significant deviation, and it is due to the small matrix suction range of Tashan coal samples. In order to reduce the deviation resulting from limited experiment levels, additional experiments were conducted to increase the experiment levels of 1.41%, 2.45%, 3.52% moisture contents and carry on the data fitting again. The result is shown in Figure 10, and deviation is reduced slightly, as shown in Figure 11c and Figure 12c.
Another reason for deviation is that the assumption in the process of formula derivation does not apply to the Tashan hard coal. The matrix suction, an introduced important factor affecting coal strength in formula derivation, is directly related to the pore size. When using the mixture theory for derivation, the pore sizes of the porous medium are assumed to be uniform. In fact, the pore sizes of coal span a wide range, and the pores also have different forms [34]. When the differences of pore sizes and forms in a coal specimen are notable, the original assumption may cause a significant deviation. Therefore, pore size distributions of the three kinds of coal samples were measured by an automatic mercury porosimeter. The maximum working pressure of the mercury porosimeter is 413 MPa, and the measuring range of the pore diameter is 3–370 μm. The lump coal samples were dried for 12 h in a 60 °C oven before mercury injection experiments, and then tested in a vacuum dilatometer.
The mercury injection withdrawal curves during the experiments are shown in Figure 13a, and the curves reflect the opening degree of pores in the coal samples [35]. For the coal samples from Songzao and Pingdingshan, the difference between the mercury injection and withdrawal curves is apparent, and there are obvious mercury injection hysteresis loops in the whole pressure stage, indicating that the pores have openness and the pore connectivity is good. In contrast, the mercury injection and withdrawal curves of Tashan coal samples are overlapping, which shows that the coal contains a large number of semi-open pores and the pore connectivity is poor. Due to the poor pore connectivity, it is difficult for water to reach the internal center of the coal sample after soaking. Therefore, the water content of the specimen surface is high, so the measured matrix suction is smaller, causing the theoretical value of coal strength to be larger. For Tashan coal samples with lots of semi-open pores, it is necessary to increase the maintenance time after soaking in order to measure the real matrix suction.
The pore volume increment can react to pore size distribution [36], when the aperture of a large pore volume increment is illustrated by the aperture ratio of the total pore space. The relationship between the pore diameter and pore volume increment is shown in Figure 13b. For coal samples from Songzao and Pingdingshan, the proportions of macroporous (>1000 nm) are 8.32% and 10.25% respectively, mesoporous (100–1000 nm) proportions of 5.36% and 6.12%, transitional pore (10–100 nm) proportions of 19.31% and 21.34%, and the proportions of micropores (<10 nm) are 67.01% and 62.29% respectively. The pore size distributions of soft coal mainly concentrate on the microporous stage. The more concentrated pore size distribution is more consistent with assumptions of homogeneous pores in the theoretical model, so the theoretical deviations for coal samples from Songzao and Pingdingshan are smaller. However, for the Tashan coal sample, the macroporous proportion is 12.56%, the mesoporous proportion 28.35%, the transitional pore proportion 30.25%, and the proportion of micropore is 28.84%. The proportion of each type of pore is proportionable, and the pore size distribution is various. The matrix suction with different pore sizes varies greatly, so the theoretical expression in a single matrix suction directly results in the deviation of the theoretical and measured values. A subsequent study should add the parameters of pore size proportion into the theoretical model to improve the applicability of the theory.
In order to identify the applicability and the accuracy of the derived equation, the tri-axial strength tests for dry, dry + methane and only water saturated samples of Songzao were conducted in our laboratory, and the results are shown in Table 5. Based on the strength criterion Equation (20), when the sample is dry without methane, the strength criterion is namely traditional Mohr-coulomb criterion, and when the sample is dry with methane or water saturated, Equation (20) will change to the failure criterion Equation (21) for the two-phase coal medium. The experimental results, under the three conditions shown in Table 5, show good agreement with the theoretical calculations. In fact, the deviations between theory and experiment for single-phase or two-phase samples are smaller than that for three-phase samples, so the strength theory has wide applicability.
Although there are small deviations in the results of the Tashan coal sample, on the whole, the strength theory established in this paper is able to accurately predict the strength characteristics of coal containing water and gas. The strength theory of coal containing water and gas established in this paper can become an important part of multiphase medium damage theory and lay the foundation for a coupling model of coal multiphase seepage-stress-damage.

6. Conclusions

Mixture theory was used to describe the three-phase field equations of coal containing water and gas, and provides a method for the study of strength characteristics of three-phase unsaturated porous media. The effective stress state of coal containing water and gas was analyzed based on these equations. Using the Mohr–Coulomb criterion, the failure criterion for coal containing water and gas was obtained.
The strength criterion established in this work can intuitively be used to calculate and express the strength of coal containing water and gas using matrix suction measurements of coal samples of different moisture contents. The relationship between the matrix suction and moisture content allows the failure criterion to be directly expressed in terms of the gas pressure and moisture content.
By conducting triaxial compressive strength tests on three different types of Chinese coal samples, this failure criterion was proved to have general applicability. The experimental results for triaxial compression failure coincided with the theoretical values. Combining the experimental results and the failure criterion, expressions for the relationships between peak strength, moisture content, and gas pressure for the three coal samples were derived. The effective internal friction angle and effective cohesive force are two important parameters that can be used to represent the mechanical characteristics of different types of coals containing water and gas. By formula fitting for the three coal samples used in this work, the respective effective internal friction angles were calculated to be 0.34°, 0.44°, and 1.22°, and the respective effective cohesive forces were 0.42, 1.42, and 3.08 MPa. Under the combined effect of water and gas, the coal strengths linearly decreased with increasing gas pressure and exponentially decreased with increasing moisture content. The strength of soft coal was more strongly influenced by moisture content than hard coal, because the greater number of micropores present in soft coal induce larger matrix suction by water.

Acknowledgments

This study was financially supported by the National Natural Science Foundation of China (NSFC) under Grant Nos. 51374258 and 51504046, Program for Changjiang Scholars and Innovative Research Team in University of China under Grant No. IRT13043.

Author Contributions

Yiyu Lu, Zhe Zhou and Zhaolong Ge all contributed to developing the mathematical model, designing the experiments, and writing the paper; Xinwei Zhang and Qian Li performed the experiments.

Conflicts of Interest

The authors declare no conflict of interest.

References

  1. Tang, J.R.; Lu, Y.Y.; Ge, Z.L.; Xia, B.W.; Sun, H.J.; Du, P. A new method of combined rock drilling. Int. J. Min. Sci. Technol. 2014, 24, 1–6. [Google Scholar] [CrossRef]
  2. Fisne, A.; Esen, O. Coal and gas outburst hazard in Zonguldak Coal Basin of Turkey, and association with geological parameters. Nat. Hazards 2014, 74, 1363–1390. [Google Scholar] [CrossRef]
  3. Luo, Y.B.; Zheng, M.P. Origin of minerals and elements in the Late Permian coal seams of the Shiping mine, Sichuan, Southwestern China. Minerals 2016, 6, 74. [Google Scholar] [CrossRef]
  4. Lu, Y.Y.; Liu, Y.; Ge, Z.L.; Li, X.H.; Kang, Y. A new method of drilling long boreholes in low permeability coal by improving its permeability. Int. J. Coal Geol. 2010, 84, 94–102. [Google Scholar] [CrossRef]
  5. Zheng, Z.T.; Xu, Y.; Li, D.S.; Dong, J.H. Numerical analysis and experimental study of hard roofs in fully mechanized mining faces under sleeve fracturing. Minerals 2015, 5, 758–777. [Google Scholar] [CrossRef]
  6. Li, Q.G.; Lin, B.Q.; Zhai, C. The effect of pulse frequency on the fracture extension during hydraulic fracturing. J. Nat. Gas Sci. Eng. 2014, 21, 296–303. [Google Scholar] [CrossRef]
  7. Hawkins, A.B.; McConnell, B.J. Sensitivity of sandstone strength and deformability to changes in moisture content. Q. J. Eng. Geol. 1992, 25, 115–30. [Google Scholar] [CrossRef]
  8. Erguler, Z.A.; Ulusay, R. Water-induced variations in mechanical properties of clay-bearing rocks. Int. J. Rock Mech. Min. 2009, 46, 355–370. [Google Scholar] [CrossRef]
  9. Vasarhelyi, B. Statistical analysis of the influence of water content on the strength of the Miocene limestone. Rock. Mech. Rock. Eng. 2005, 38, 69–76. [Google Scholar] [CrossRef]
  10. Perera, M.S.A.; Ranjith, P.G.; Peter, M. Effects of saturation medium and pressure on strength parameters of Latrobe Valley brown coal: Carbon dioxide, water and nitrogen saturations. Energy 2011, 36, 6941–6947. [Google Scholar] [CrossRef]
  11. Poulsen, B.A.; Shen, B.; Williams, D.J.; Huddlestone-Holmes, C.; Erarslan, N.; Qin, J. Strength reduction on saturation of coal and coal measures rocks with implications for coal pillar strength. Int. J. Rock Mech. Min. 2014, 71, 41–52. [Google Scholar] [CrossRef]
  12. Van Eeckhout, E.M. The mechanisms of strength reduction due to moisture in coal mine shales. Int. J. Rock Mech. Min. 1976, 13, 61–67. [Google Scholar] [CrossRef]
  13. Aziz, N.I.; Ming-Li, W. The effect of sorbed gas on the strength of coal—An experimental study. Geotechnol. Geol. Eng. 1999, 17, 387–402. [Google Scholar] [CrossRef]
  14. Skoczylas, N.; Dutka, B.; Sobczyk, J. Mechanical and gaseous properties of coal briquettes in terms of outburst risk. Fuel 2014, 134, 45–52. [Google Scholar] [CrossRef]
  15. Perera, M.S.A.; Ranjith, P.G.; Choi, S.K.; Bouazza, A.; Kodikara, J.; Airey, D. A review of coal properties pertinent to carbon dioxide sequestration in coal seams: With special reference to Victorian brown coals. Environ. Earth Sci. 2011, 64, 223–235. [Google Scholar] [CrossRef]
  16. George, J.D.; Barakat, M.A. The change in effective stress associated with shrinkage from gas desorption in coal. Int. J. Coal Geol. 2001, 45, 105–113. [Google Scholar] [CrossRef]
  17. Chen, Z.W.; Pan, Z.J.; Liu, J.S.; Connell, L.D.; Elsworth, D. Effect of the effective stress coefficient and sorption-induced strain on the evolution of coal permeability: Experimental observations. Int. J. Greenh. Gas. Control 2011, 5, 1284–1293. [Google Scholar] [CrossRef]
  18. Vishal, V.; Ranjith, P.G.; Pradhan, S.P.; Singh, T.N. Permeability of sub-critical carbon dioxide in naturally fractured Indian bituminous coal at a range of down-hole stress conditions. Eng. Geol. 2013, 167, 148–156. [Google Scholar] [CrossRef]
  19. Vaziri, H.H.; Wang, X.; Palmer, I.D.; Khodaverdian, M.; Mclennan, J. Back analysis of coalbed strength properties from field measurements of wellbore cavitation and methane production. Int. J. Rock Mech. Min. 1997, 34, 963–978. [Google Scholar] [CrossRef]
  20. Ranjith, P.G.; Perera, M.S.A. Effects of cleat performance on strength reduction of coal in CO2 sequestration. Energy 2012, 45, 1069–1075. [Google Scholar] [CrossRef]
  21. Liang, B.; Zhang, M.T.; Pan, Y.S.; Wang, Y.J. The experimental research on the effect of gas on mechanical properties and mechanical response of coal. Chin. J. Geotechnol. Eng. 1995, 17, 12–18. [Google Scholar]
  22. Vasarhelyi, B.; Kovacs, L.; Torok, A. Analysing the modified Hoek–Brown failure criteria using Hungarian granitic rocks. Geomech. Geophys. Geo-Energy Geo-Resour. 2016, 2, 131–136. [Google Scholar] [CrossRef]
  23. Joubert, J.I.; Grein, C.T. Sorption of methane in moist coal. Fuel 1973, 52, 181–185. [Google Scholar] [CrossRef]
  24. Laxminarayana, C.; Crosdale, P.J. Controls on methane sorption capacity of Indian coals. AAPG Bull. 2002, 86, 201–212. [Google Scholar]
  25. Biot, M.A. Theory of propagation of elastic waves in a fluid saturated porous solid. J. Acoust. Soc. Am. 1956, 28, 168–191. [Google Scholar] [CrossRef]
  26. Chen, W.Y.; Xia, T.D.; Hu, W.T. A mixture theory analysis for the surface-wave propagation in an unsaturated porous medium. Int. J. Solids Struct. 2011, 48, 2402–2412. [Google Scholar] [CrossRef]
  27. Hu, Y.; Zhang, Y.K. Constitutive relation of unsaturated soil by use of the mixture theory (I)-nonlinear constitutive equations and field equations. Appl. Math. Mech. Engl. 2003, 24, 123–137. [Google Scholar]
  28. Fredlund, D.G.; Houston, S.L. Protocol for the assessment of unsaturated soil properties in geotechnical engineering practice. Can. Geotechnol. J. 2009, 46, 694–707. [Google Scholar] [CrossRef]
  29. Houston, S.L.; Houston, W.N.; Wagner, M. Laboratory filter paper suction measurements. Geotechnol. Test. J. 1994, 17, 1209–1217. [Google Scholar]
  30. Gardner, R. A method of measuring the capillary tension of soil moisture over a wide moisture range. Soil Sci. 1937, 43, 277–284. [Google Scholar] [CrossRef]
  31. Lang, A.R.G. Osmotic coefficient and water potentials of sodium chloride solutions from 0 to 40 °C. Aust. J. Chem. 1967, 20, 2017–2023. [Google Scholar] [CrossRef]
  32. Hamblin, A.P. Filter-paper method for routine measurement of field water potential. J. Hydrol. 1981, 53, 355–360. [Google Scholar] [CrossRef]
  33. Li, X.S.; Yin, G.Z.; Zhao, H.B.; Wang, W.Z.; Jing, X.F. Experimental study of mechanical properties of outburst coal containing gas under triaxial compression. Chin. J. Rock. Mech. Eng. 2010, 29, 3350–3358. [Google Scholar]
  34. Gamson, P.; Beamish, B.; Johnson, D. Coal microstructure and secondary mineralization: Their effect on methane recovery. J. Geol. Soc. 1996, 199, 165–179. [Google Scholar] [CrossRef]
  35. Okolo, G.N.; Everson, R.C.; Neomagus, H.W.J.P.; Roberts, M.J.; Sakurovs, R. Comparing the porosity and surface areas of coal as measured by gas adsorption, mercury intrusion and SAXS techniques. Fuel 2015, 141, 293–304. [Google Scholar] [CrossRef]
  36. Akbarzadeh, H.; Chalaturnyk, R.J. Structural changes in coal at elevated temperature pertinent to underground coal gasification: A review. Int. J. Coal Geol. 2014, 131, 126–146. [Google Scholar] [CrossRef]
Figure 1. Three-phase structure of coal containing water and gas.
Minerals 06 00118 g001
Figure 2. Coal samples from Songzao, Pingdingshan, and Tashan mine.
Minerals 06 00118 g002
Figure 3. (a) Sketch of suction calibration test; (b) Illustration of filter paper test.
Minerals 06 00118 g003
Figure 4. Calibration curve for Whatman No. 42 filter paper (wf < 20%).
Minerals 06 00118 g004
Figure 5. (a) Moisture contents of filter papers; (b) Fitted relationship curves of matrix suction and moisture content.
Minerals 06 00118 g005
Figure 6. RLW-2000M rock mechanical testing system (Chaoyang Instrument Factory, Changchun, China) and deformeter (Teratech, Burlington, MA, USA).
Minerals 06 00118 g006
Figure 7. Strength criterion shown in ((σ − Pg), τ) coordinates.
Minerals 06 00118 g007
Figure 8. Relationship between (σ1Pg) and (σ3Pg): (a) Songzao; (b) Pingdingshan; and (c) Tashan.
Minerals 06 00118 g008
Figure 9. Relationship between internal friction angle and moisture content.
Minerals 06 00118 g009
Figure 10. Relationship between effective cohesion and matrix suction.
Minerals 06 00118 g010
Figure 11. Relationship between peak strength and gas pressure: (a) Songzao; (b) Pingdingshan; and (c) Tashan.
Minerals 06 00118 g011
Figure 12. Relationship between peak strength and moisture content: (a) Songzao; (b) Pingdingshan; and (c) Tashan.
Minerals 06 00118 g012
Figure 13. (a) Mercury intrusion experiment curves; (b) Distribution curves of pore volume of coal samples.
Minerals 06 00118 g013
Table 1. The specifications of the samples.
LocationCoal TypeFixed CarbonVolatile Matter ContentPorosityAverage Pore Size
SongzaoMeagre coal66.4%13.2%5.88%4.08 nm
PingdingshanFat coal57.1%17.7%5.16%8.60 nm
Tashan1/3 Coking coal57.8%28.1%4.23%14.65 nm
Table 2. Moisture content controls.
No.Soaking Time (Day)Moisture Content
SongzaoPingdingshanTashan
111.73%1.25%0.91%
222.85%2.31%1.95%
344.02%3.43%3.01%
485.21%4.42%4.05%
Table 3. Results of suction calibration test for “Whatman No. 42” filter paper.
No.25 °C, NaCl Solution, Related ParametersMoisture Content of Filter Paper
Molarity (mol/L)Suction (MPa)
10.49.7517.05%
20.512.5615.36%
3125.4311.66%
4251.477.75%
5377.505.46%
64103.533.87%
Table 4. Experimental scheme and recorded data for triaxial compression strength tests.
LocationMoisture ContentStrength (MPa)
Gas Pressure = 0.5 MPaGas Pressure = 1.5 MPaGas Pressure = 2.5 MPa
Songzao1.73%12.5713.6112.7111.2411.2210.669.378.238.91
2.85%11.7711.9912.259.659.209.807.977.607.61
4.02%11.2810.8510.489.008.909.176.566.246.75
5.21%9.909.7810.497.798.537.756.326.506.16
Pingdingshan1.25%21.4621.3620.5717.4517.8918.6214.1613.9814.70
2.31%19.3918.4718.5615.8514.9716.8012.8812.6813.23
3.43%18.1517.7318.5915.6915.6114.2811.6312.4211.64
4.42%17.4317.3117.2513.3913.7214.3711.1911.4711.21
Tashan0.91%34.9731.5232.5127.3528.0628.0923.9125.7425.92
1.95%31.2933.0829.1727.2228.8325.7624.5021.7221.97
3.01%31.0031.0528.5524.4826.7127.6221.7321.2422.88
4.05%30.3627.7029.3823.8223.9625.7221.1021.6421.28
Table 5. Experimental results of triaxial compression strength test for dry, dry + methane and only water saturated samples of Songzao.
LocationSample ConditionMoisture ContentGas Pressure (MPa)Experimental Strength (MPa)Theoretical Value (MPa)Deviation
Songzaodry0%017.9118.422.85%
dry + methane0%2.512.1912.875.58%
water saturated5.21%011.3611.955.19%

