
A New Experimental Approach to Improve the Quality of Low Grade Silica; The Combination of Indirect Ultrasound Irradiation with Reverse Flotation and Magnetic Separation


Abstract
:
1. Introduction
- Quartz veins: These deposits are extremely high-grade containing white silica crystals.
- Quartzite: This is metamorphosed sandstone made up chiefly of quartz sand united by siliceous cement, forming low-porosity rock. Quartzite varies from white to gray in color and sometimes brown, red, or yellow due to the presence of small amounts of impurities. Some quartzite deposits may contain up to 99% SiO2.
- Sandstone deposits: These deposits contain significant amounts of impurities and may contain clay, in the range of 5%–10%. The origin of these deposits is Paleozoic sediment.
1.1. Enrichment of Silica Used in the Glass Industry
1.2. Application of Ultrasound Irradiation in Mineral Processing
2. Materials and Methods
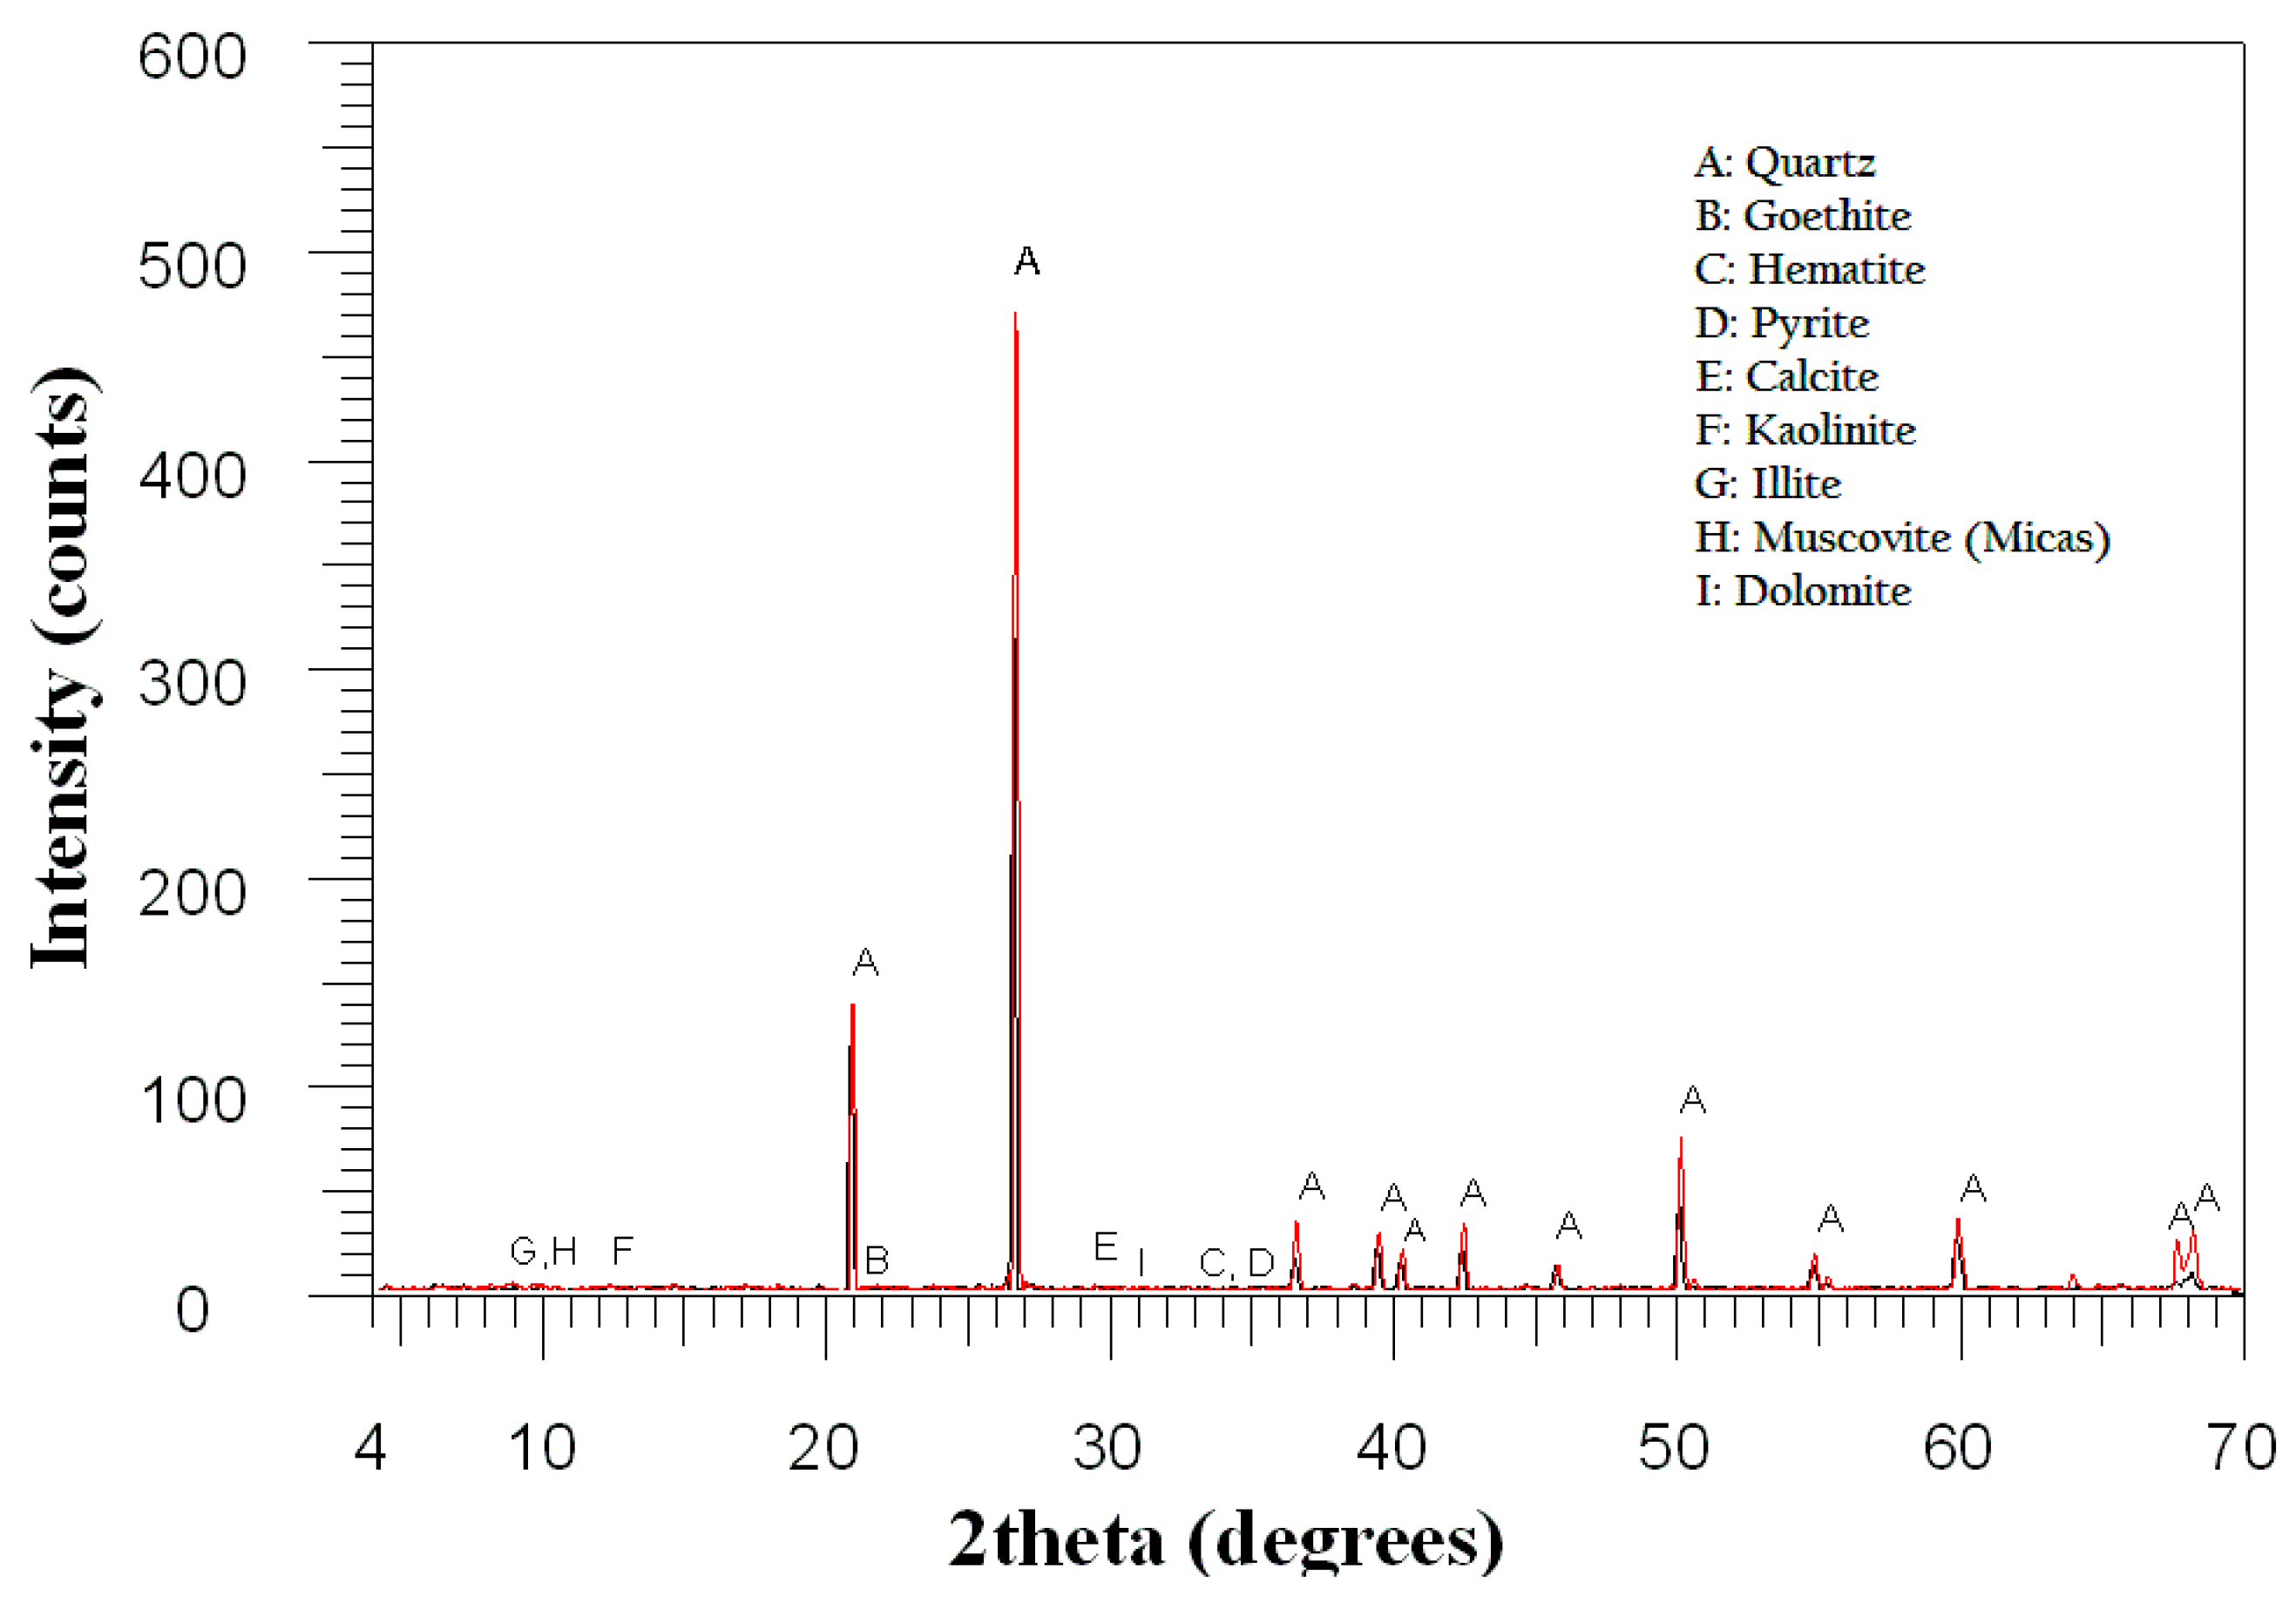
2.1. Sample Recognition and Mineralogical Study
- Goethite and hematite altered from primitive pyrite, and liberated from quartz crystals; it is easy to separate these types of impurities from silica utilizing spiral concentration, reverse flotation or magnetic separation.
- Surface staining and coating of silica particles with iron hydroxides (goethite, hematite and limonite); attrition scrubbing and ultrasound irradiation when using chemical reagents can separate these impurities from silica.
- Filled voids, cracks and fractures with carbonates and iron impurities; acidic leaching and washing or carbonates flotation can separate these two impurities from silica particles.
- Ultra-fine iron impurities (even finer than 10 μm) in the form of unchanged pyrite as inclusions inside quartz particles; this is the worst type of iron impurities in this sample and it is difficult to separate them from quartz.
- Clay minerals including kaolinite and illite mostly attached to quartz particles with poor liberation degree, including silica particle sizes below 100 μm; therefore, the average liberation degree was low and around 40% (Table 4).
- Carbonates, mainly calcite and rarely dolomite, were mostly liberated from quartz particles and the average liberation degree was around 78% (Table 4).
- Other minor non-metallic impurities were feldspars (mostly microcline and sanidine) and micas (muscovite, biotite and sericite) while tourmaline and zircon were identified as trace non-metallic impurities.
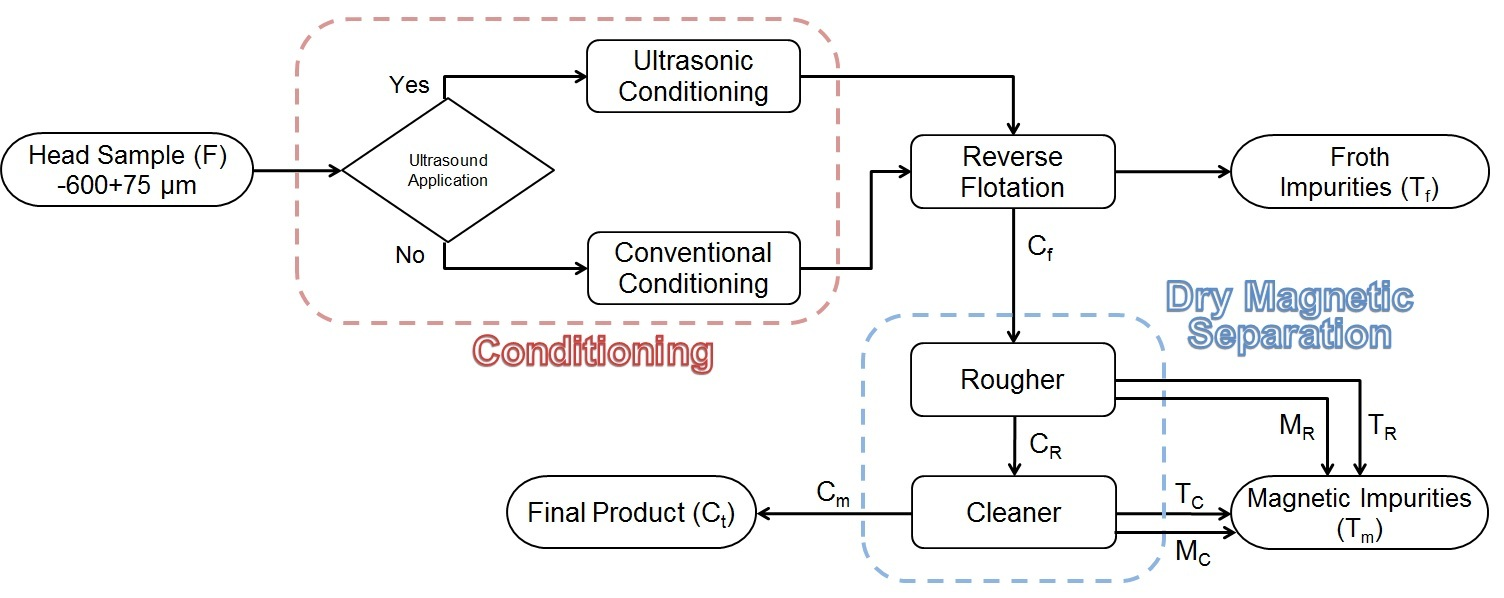
2.2. Experimental Procedure
2.2.1. Ultrasound Irradiation
2.2.2. Reverse Flotation
- Rotor speed: 1400 rpm (it is fixed for the conditioning and flotation phases)
- Acidic pH modifier: H2SO4
- Average solids percent in the reactor during ultrasound irradiation: 30.6% (by weight)
- Average solids percent in the flotation cell after dilution, prior to flotation: 23.4% (by weight)
- Mixing of diluted slurry prior to flotation in a two liter flotation cell: 2.5 min
- Frother conditioning time prior to flotation: 2 min
- Frother Type: MIBC/Pine Oil (1:1)
- Flotation time: 5 min
- One collector (C1): Sodium oleate
- Two collectors (C2): Aero 801/Aero 825 (1:1)
- Three collectors (C3): Aero 801+ Aero 825/Oleic acid (1:1)
- Four Collectors (C4): Aero 801/Aero 825/Oleic acid/Sodium oleate (1:4)
- Five collectors (C5): Aero 801/Aero 825/Oleic acid/Sodium oleate (5:24) + Aero 845 (4:24)
2.2.3. Magnetic Separation
- (1)
- When silica is used for the glass industry, it should contain below five percent moisture. If the silica contains more moisture, it should be dried prior to melting in a glass furnace.
- (2)
- The silica product should be transported by truck from the processing line to the glass manufacturing plant; therefore, the existence of moisture will significantly increase the transportation cost per ton.
2.3. Measurements and Calculations
2.3.1. Calculation of Absorbed Ultrasound Power by the Slurry
- and : Available mass of solids and liquid in the sonication reactor;
- and : Specific heat capacity of solids and liquid;
- and : Temperature change and duration of conditioning;
- and : Absorbed heat by solids and liquid in the sonication reactor;
- and : Absorbed power by solids and liquid in the sonication reactor;
- : Average absorbed power by the slurry due to rotor agitation;
- and : Pure absorbed ultrasound power in the conditioning reactor and tank; and
- : Ratio of transferred power to the reactor versus the total produced power in the ultrasonic bath.
2.3.2. Chemical Analysis and Calculation of Selectivity Index (S.I.)
- : Recovery of silica in the concentrate;
- : Recovery of impurities (iron, alumina, titanium, calcium and so on) in the tailings;
- C and F: Weight of concentrate and feed respectively;
- and : Silica grade in the concentrate and feed respectively; and
- and : Impurity grades (iron, alumina, titanium, calcium and so on) in the concentrate and feed, respectively.
- : Selectivity Index in a process;
- No selectivity: or , then ;
- Ideal selectivity: or , then ;
- No preferred selectivity: , e.g.,, then ; and
- Poor selectivity: , especially when then .
3. Results and Discussions
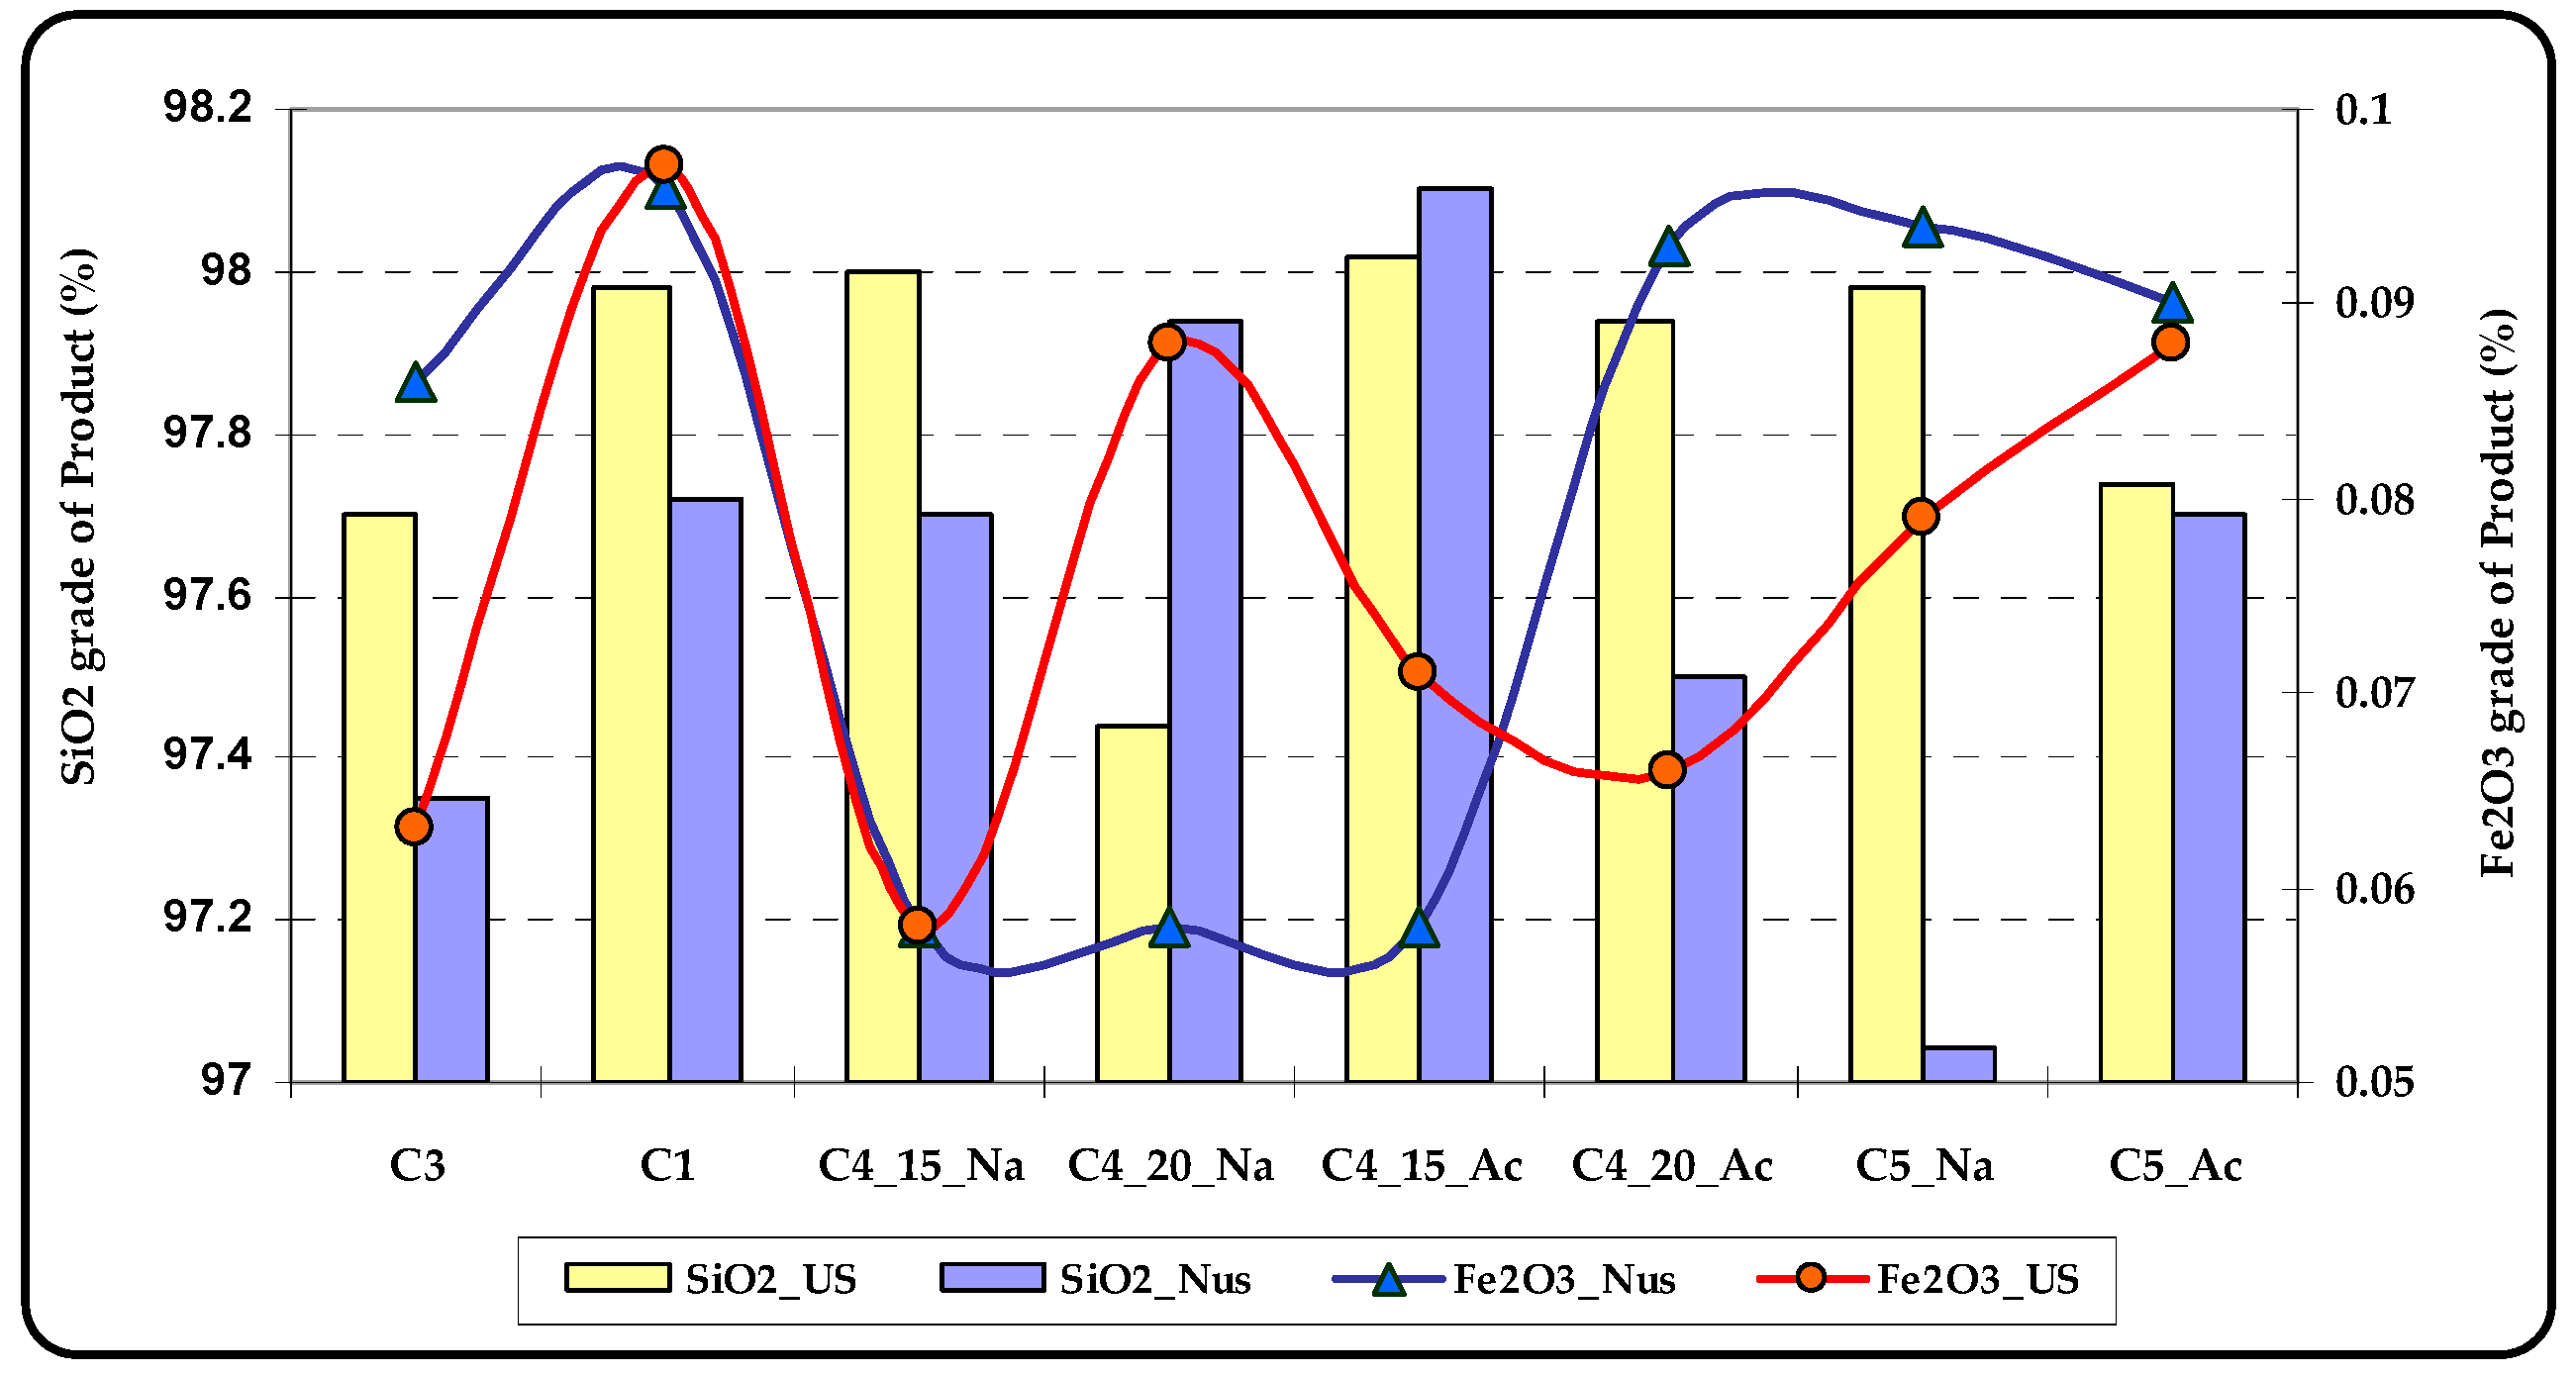
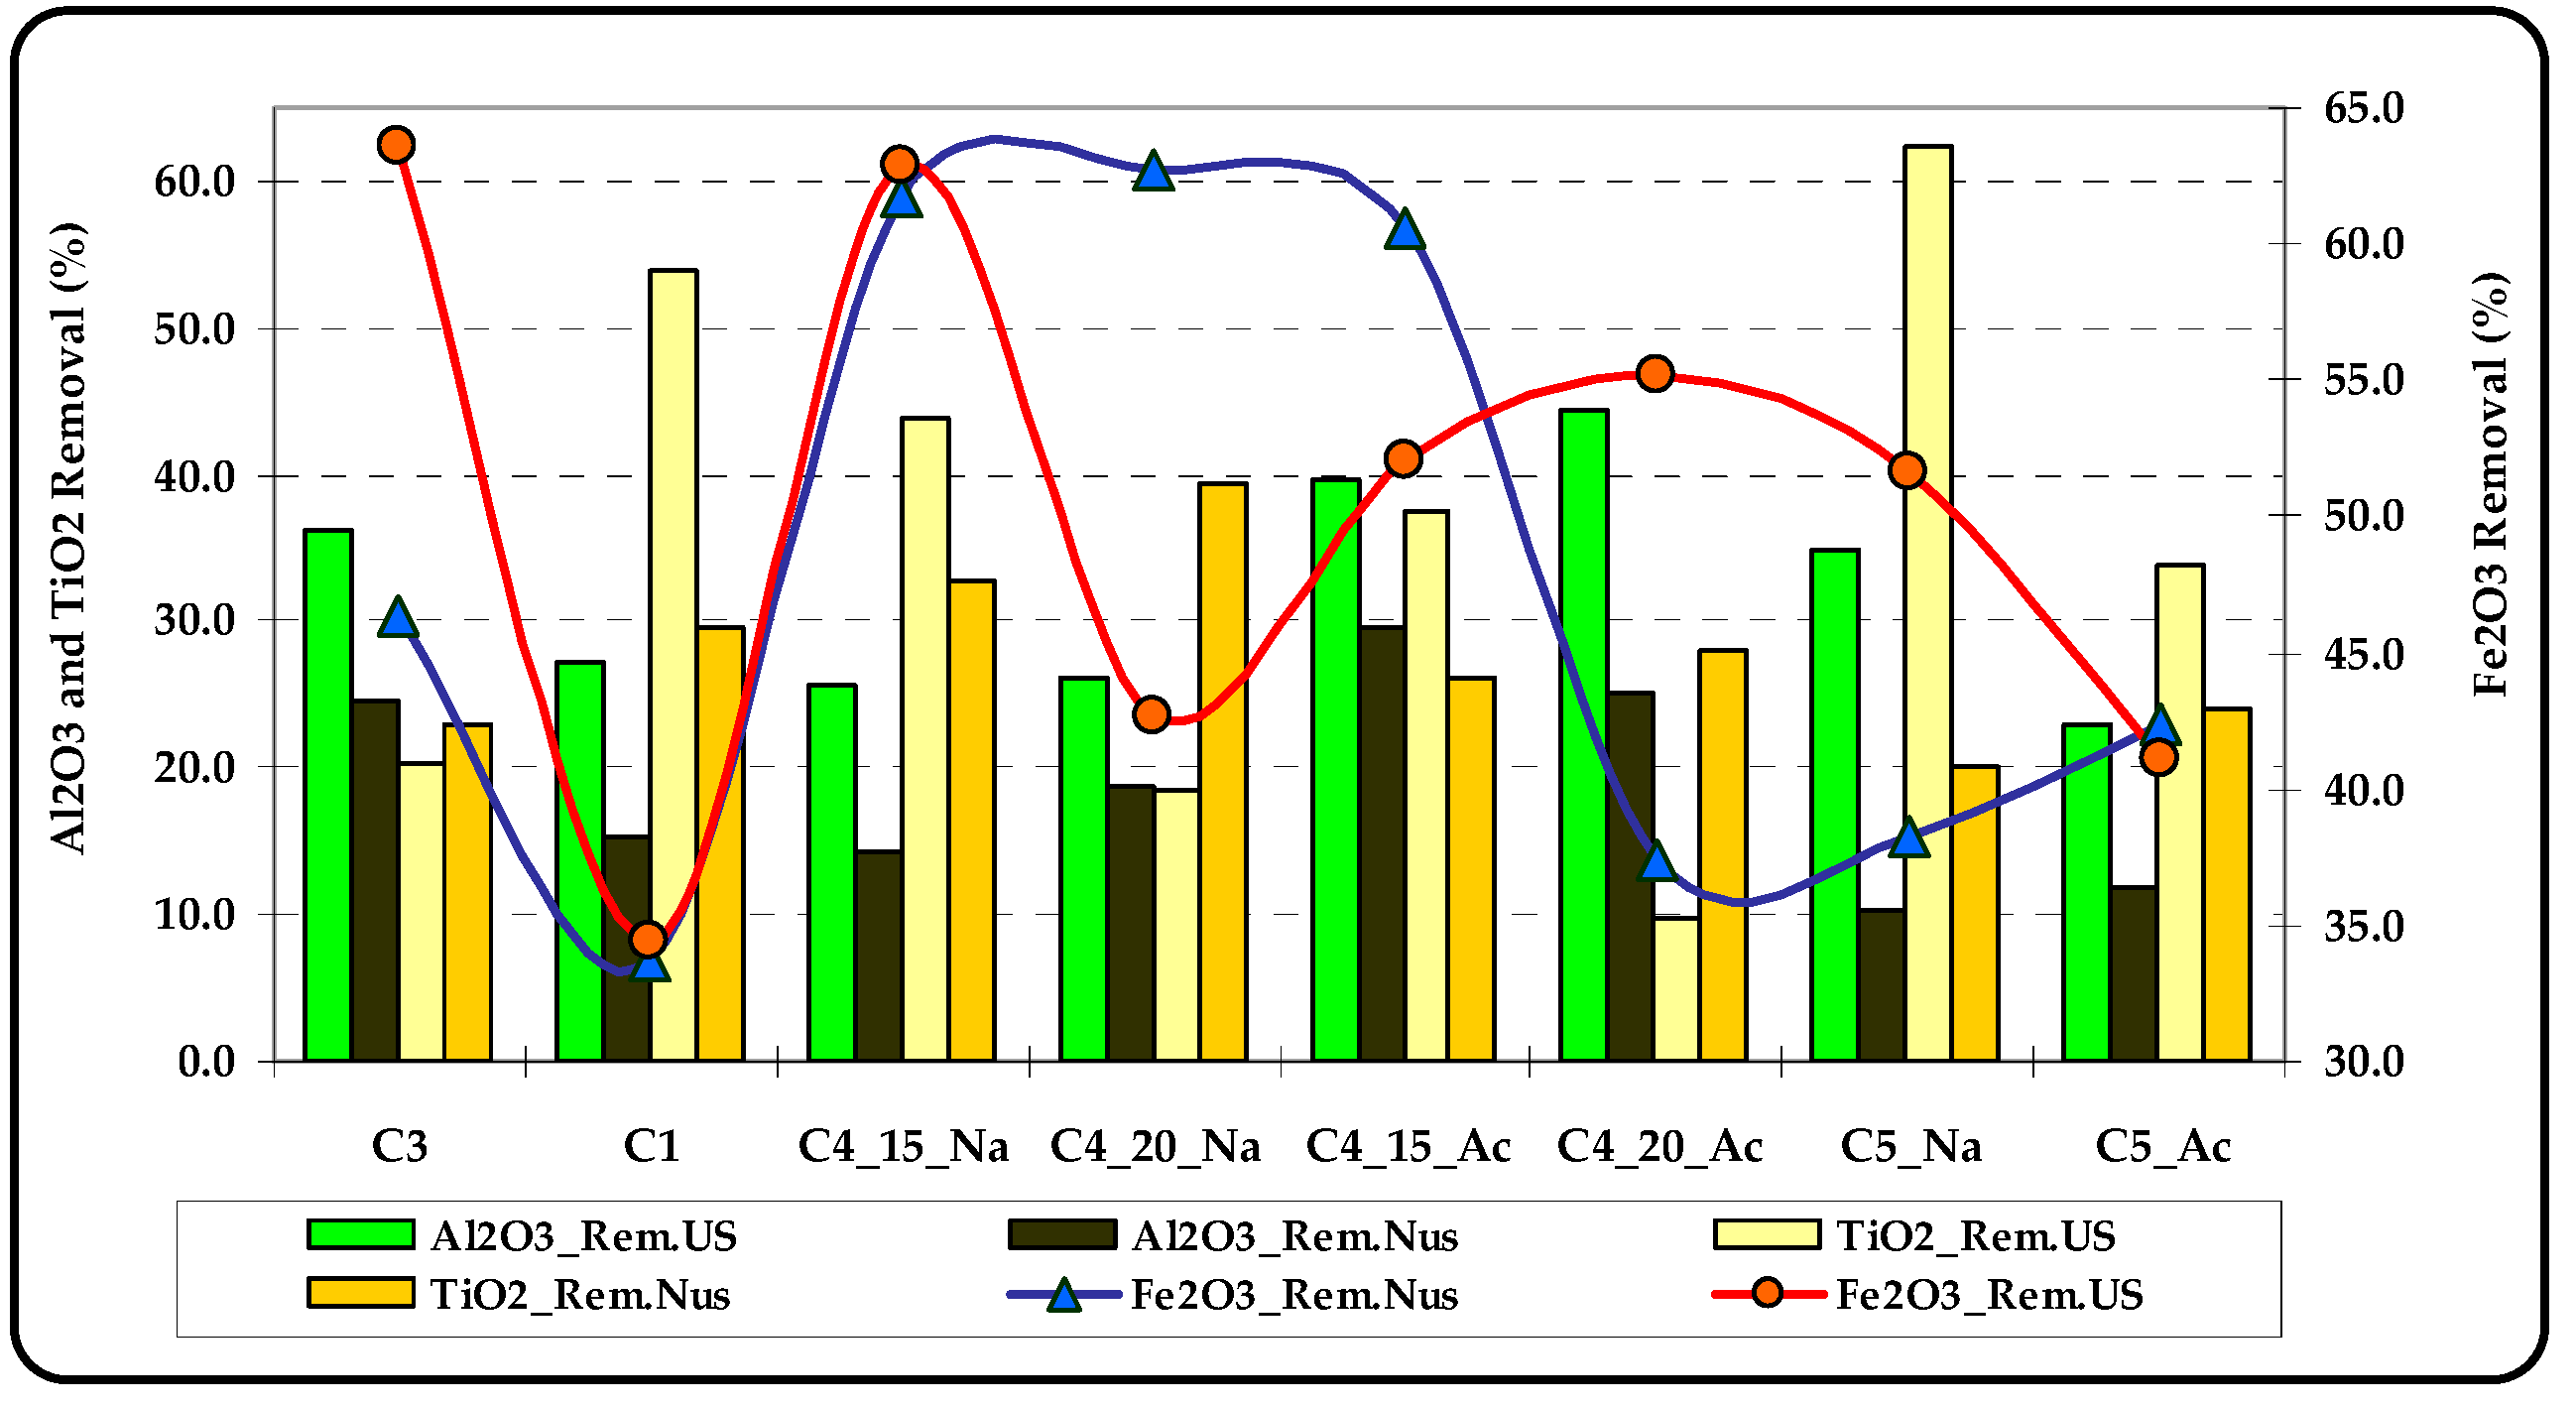
3.1. Reverse Flotation
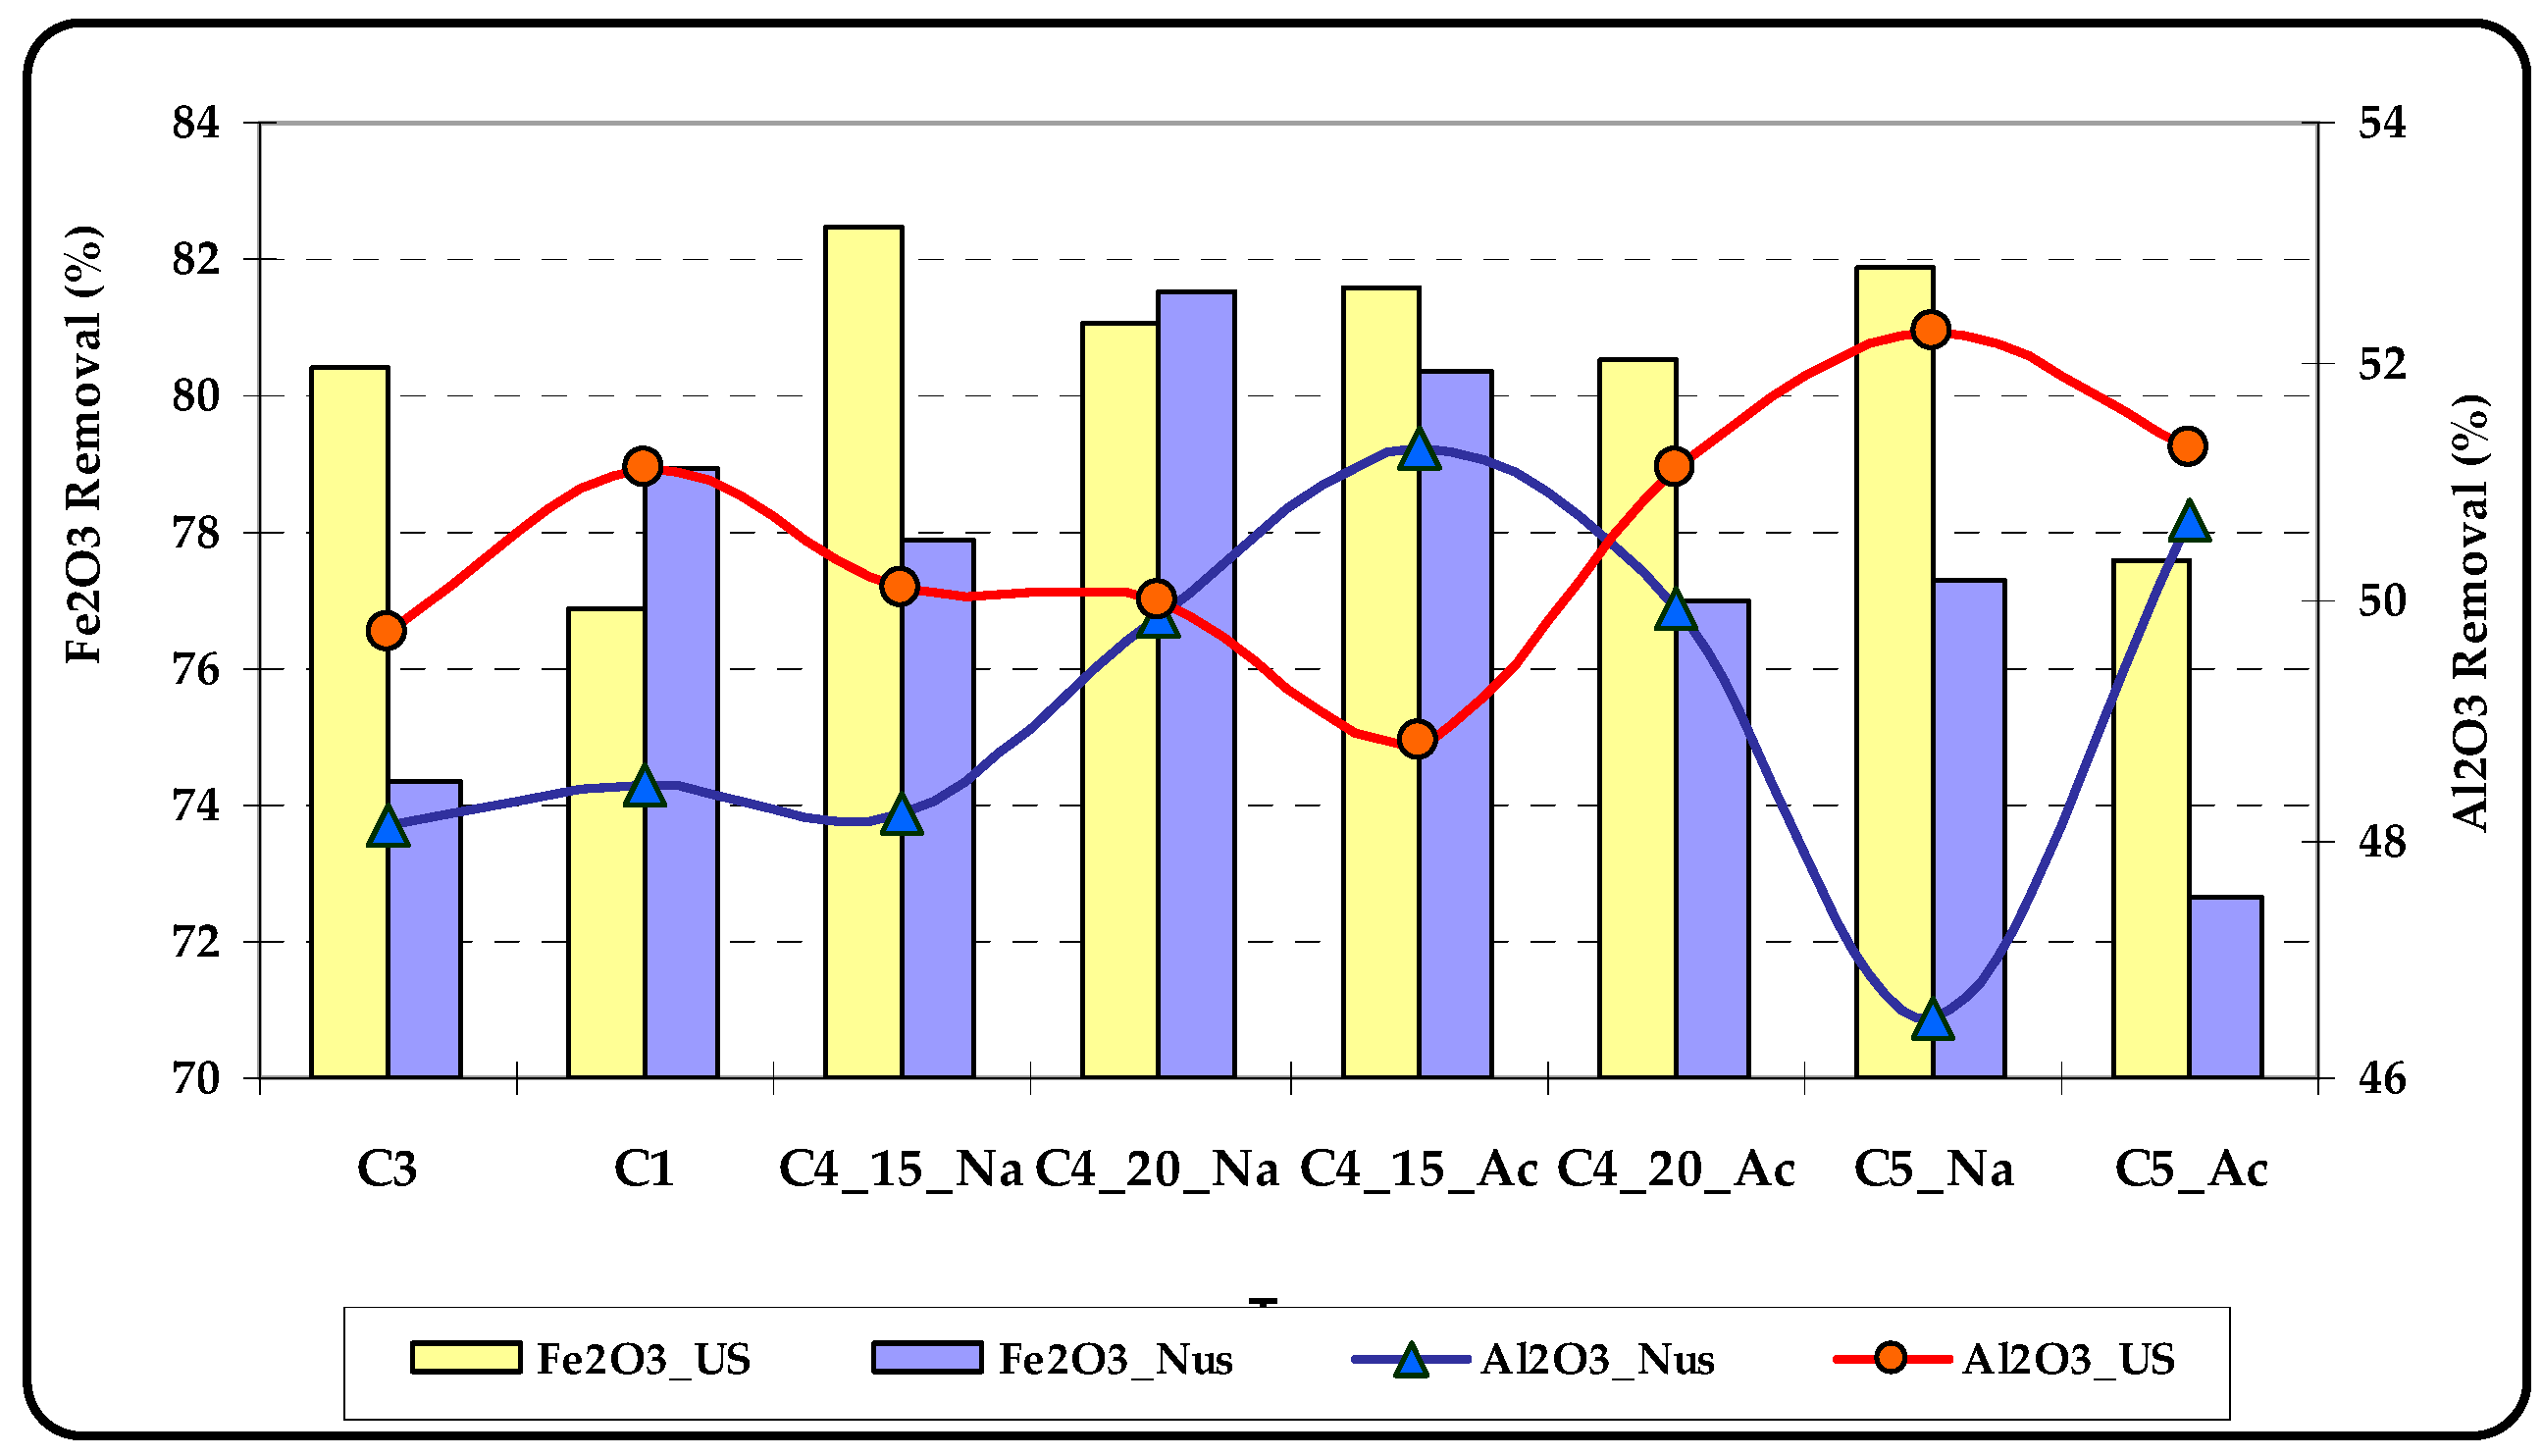
- C4_15_Na: Using C4 at neutral pH with 15 min of conditioning
- C4_20_Na: Using C4 at neutral pH with 20 min of conditioning
- C4_15_Ac: Using C4 in an acidic environment with 15 min of conditioning
- C4_20_Ac: Using C4 in an acidic environment with 20 min of conditioning
- C5_Na: Using C5 at neutral pH with 30 min of conditioning
- C5_Ac: Using C5 in an acidic environment with 30 min of conditioning
- US: Ultrasound Irradiation
- Nus: Non-ultrasound (Conventional)
- (1)
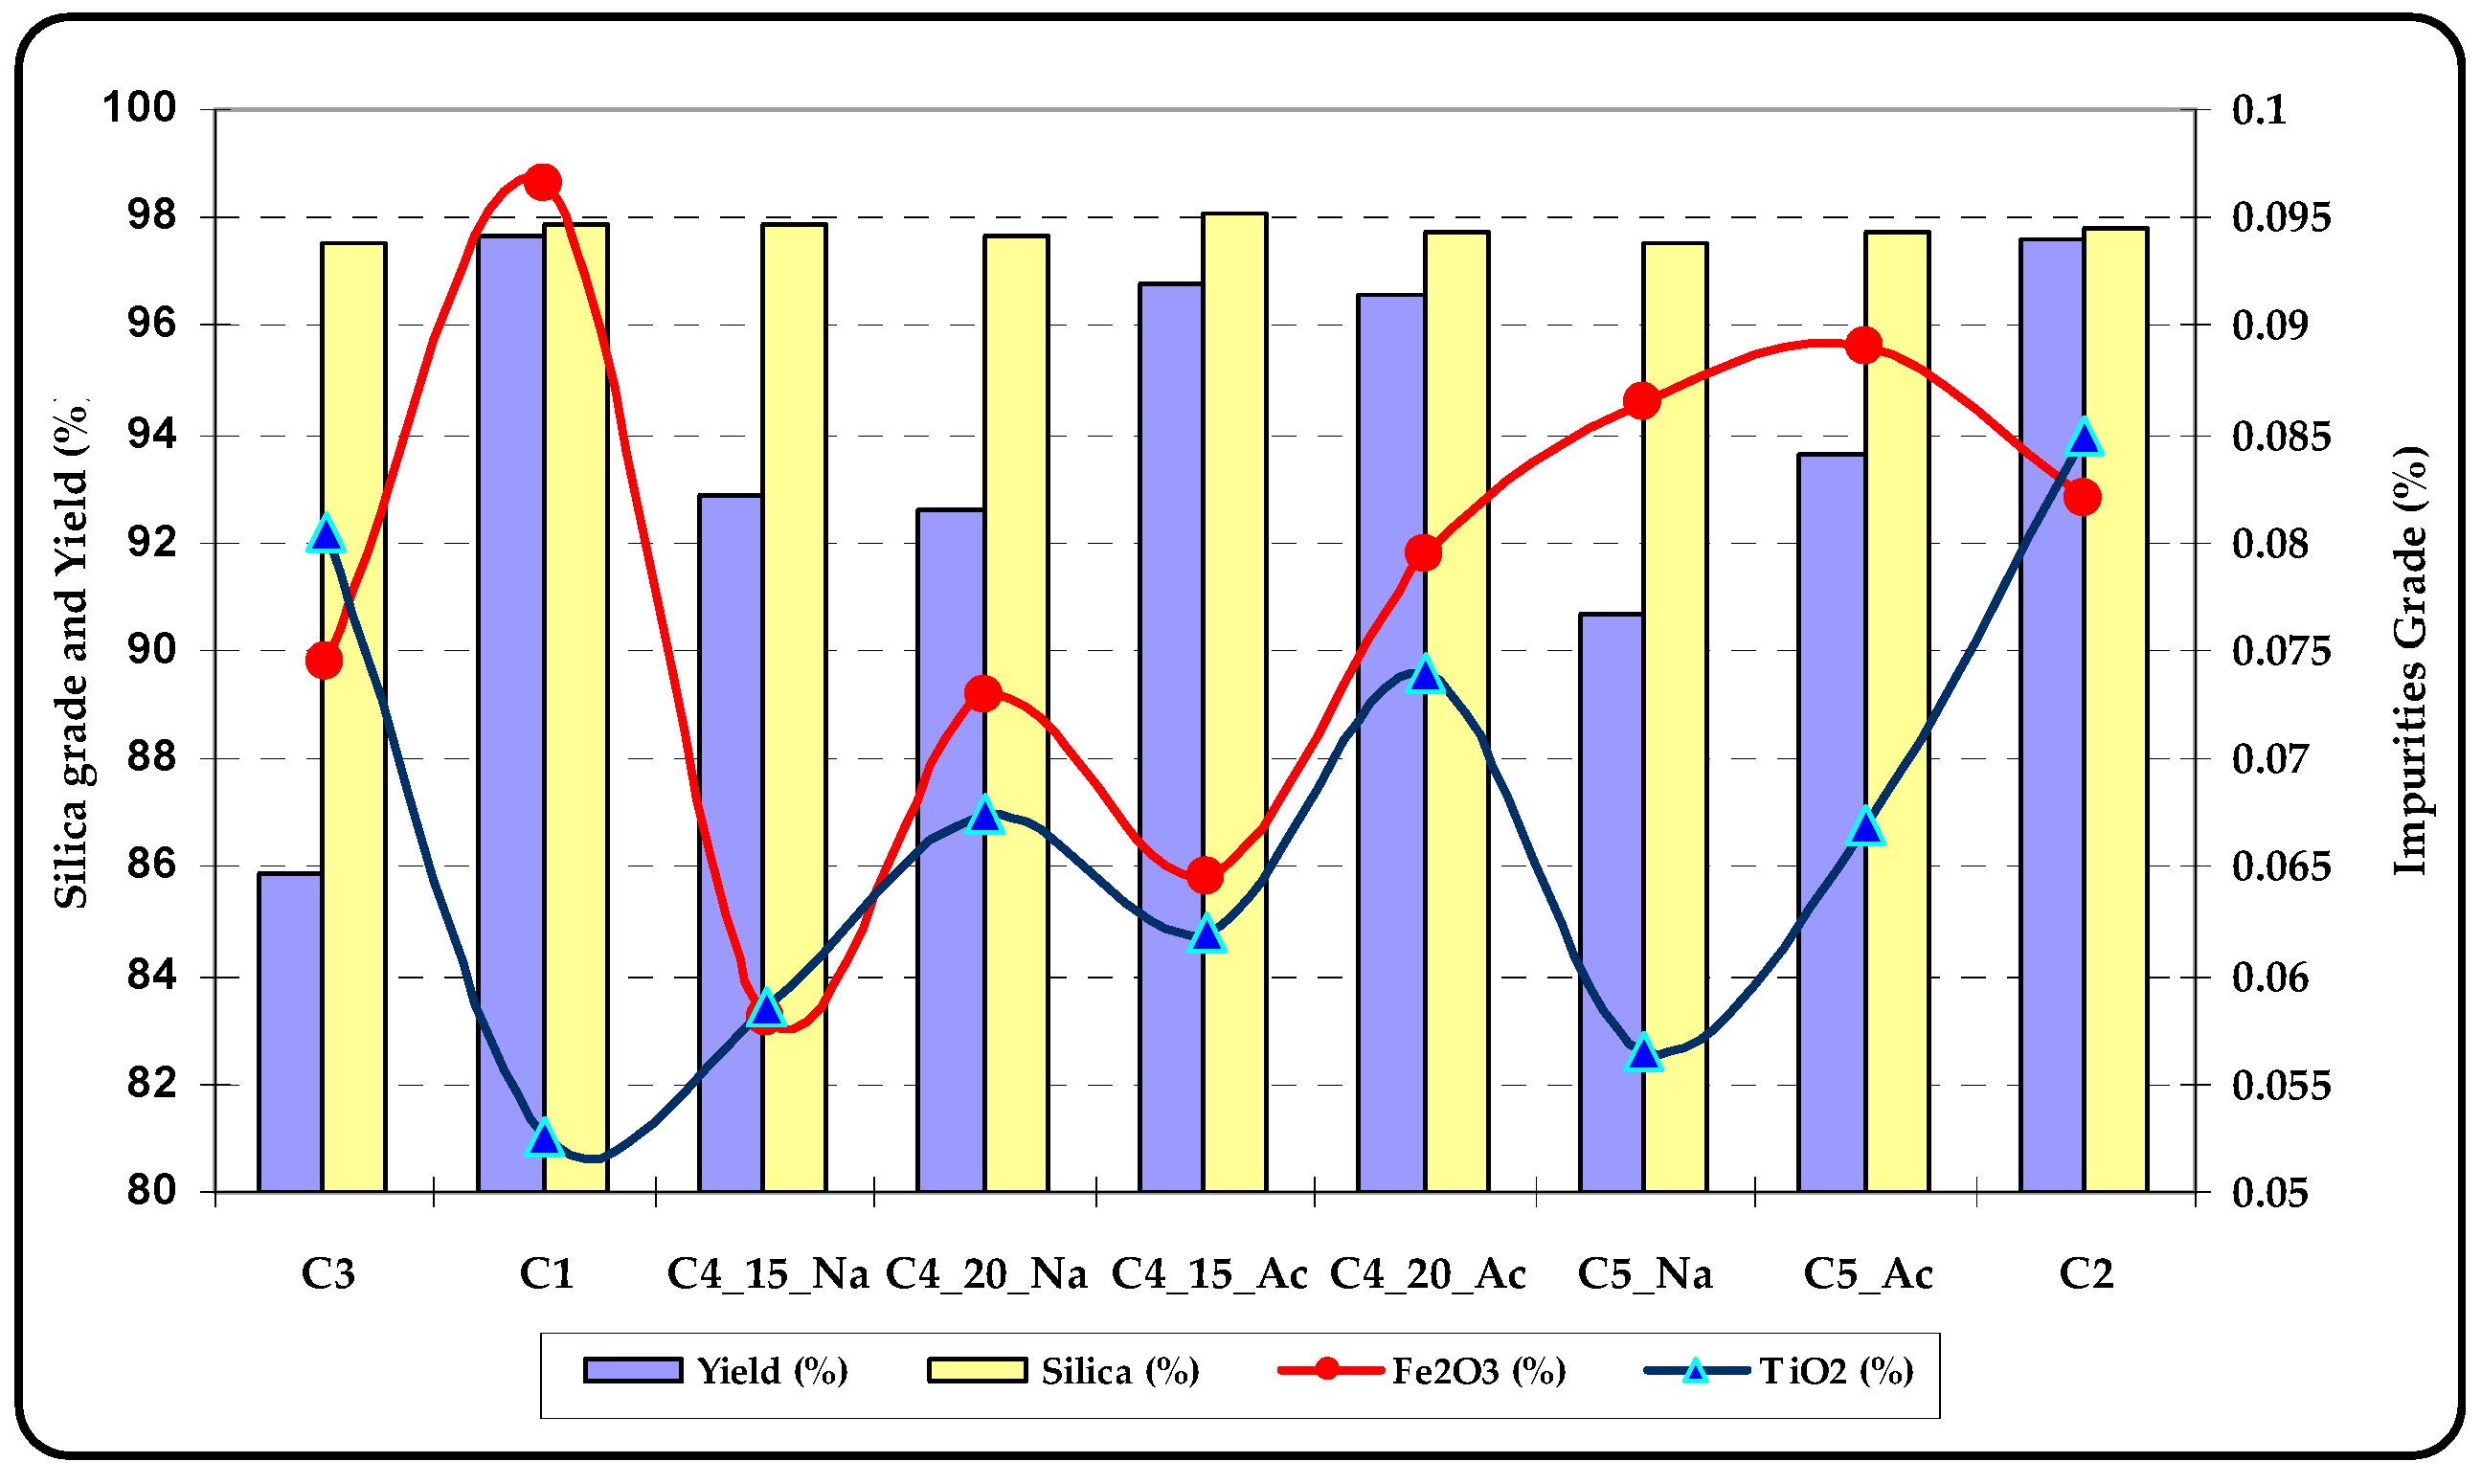
- As can be seen in most of these tests (6 pairs out of 8), ultrasound irradiation increased the silica grades and the highest grade was in the range of 98%–98.1%, which was achieved by using C4 as the collector. Unlike the other two pairs, ultrasound irradiation during conditioning improved the removal of iron impurities compared to conventional conditioning.
- (2)
- The lowest Fe2O3 grade of the silica concentrate at 0.058% and maximum iron removal was achieved by using C4 as the collector with a total dosage of 2000 g/t. Collectors C2 and C3 were less effective while C1 (sodium oleate) was the worst. Decreasing the collector dosage from 2000 g/t to 1200 g/t was not satisfactory for C5.
- (3)
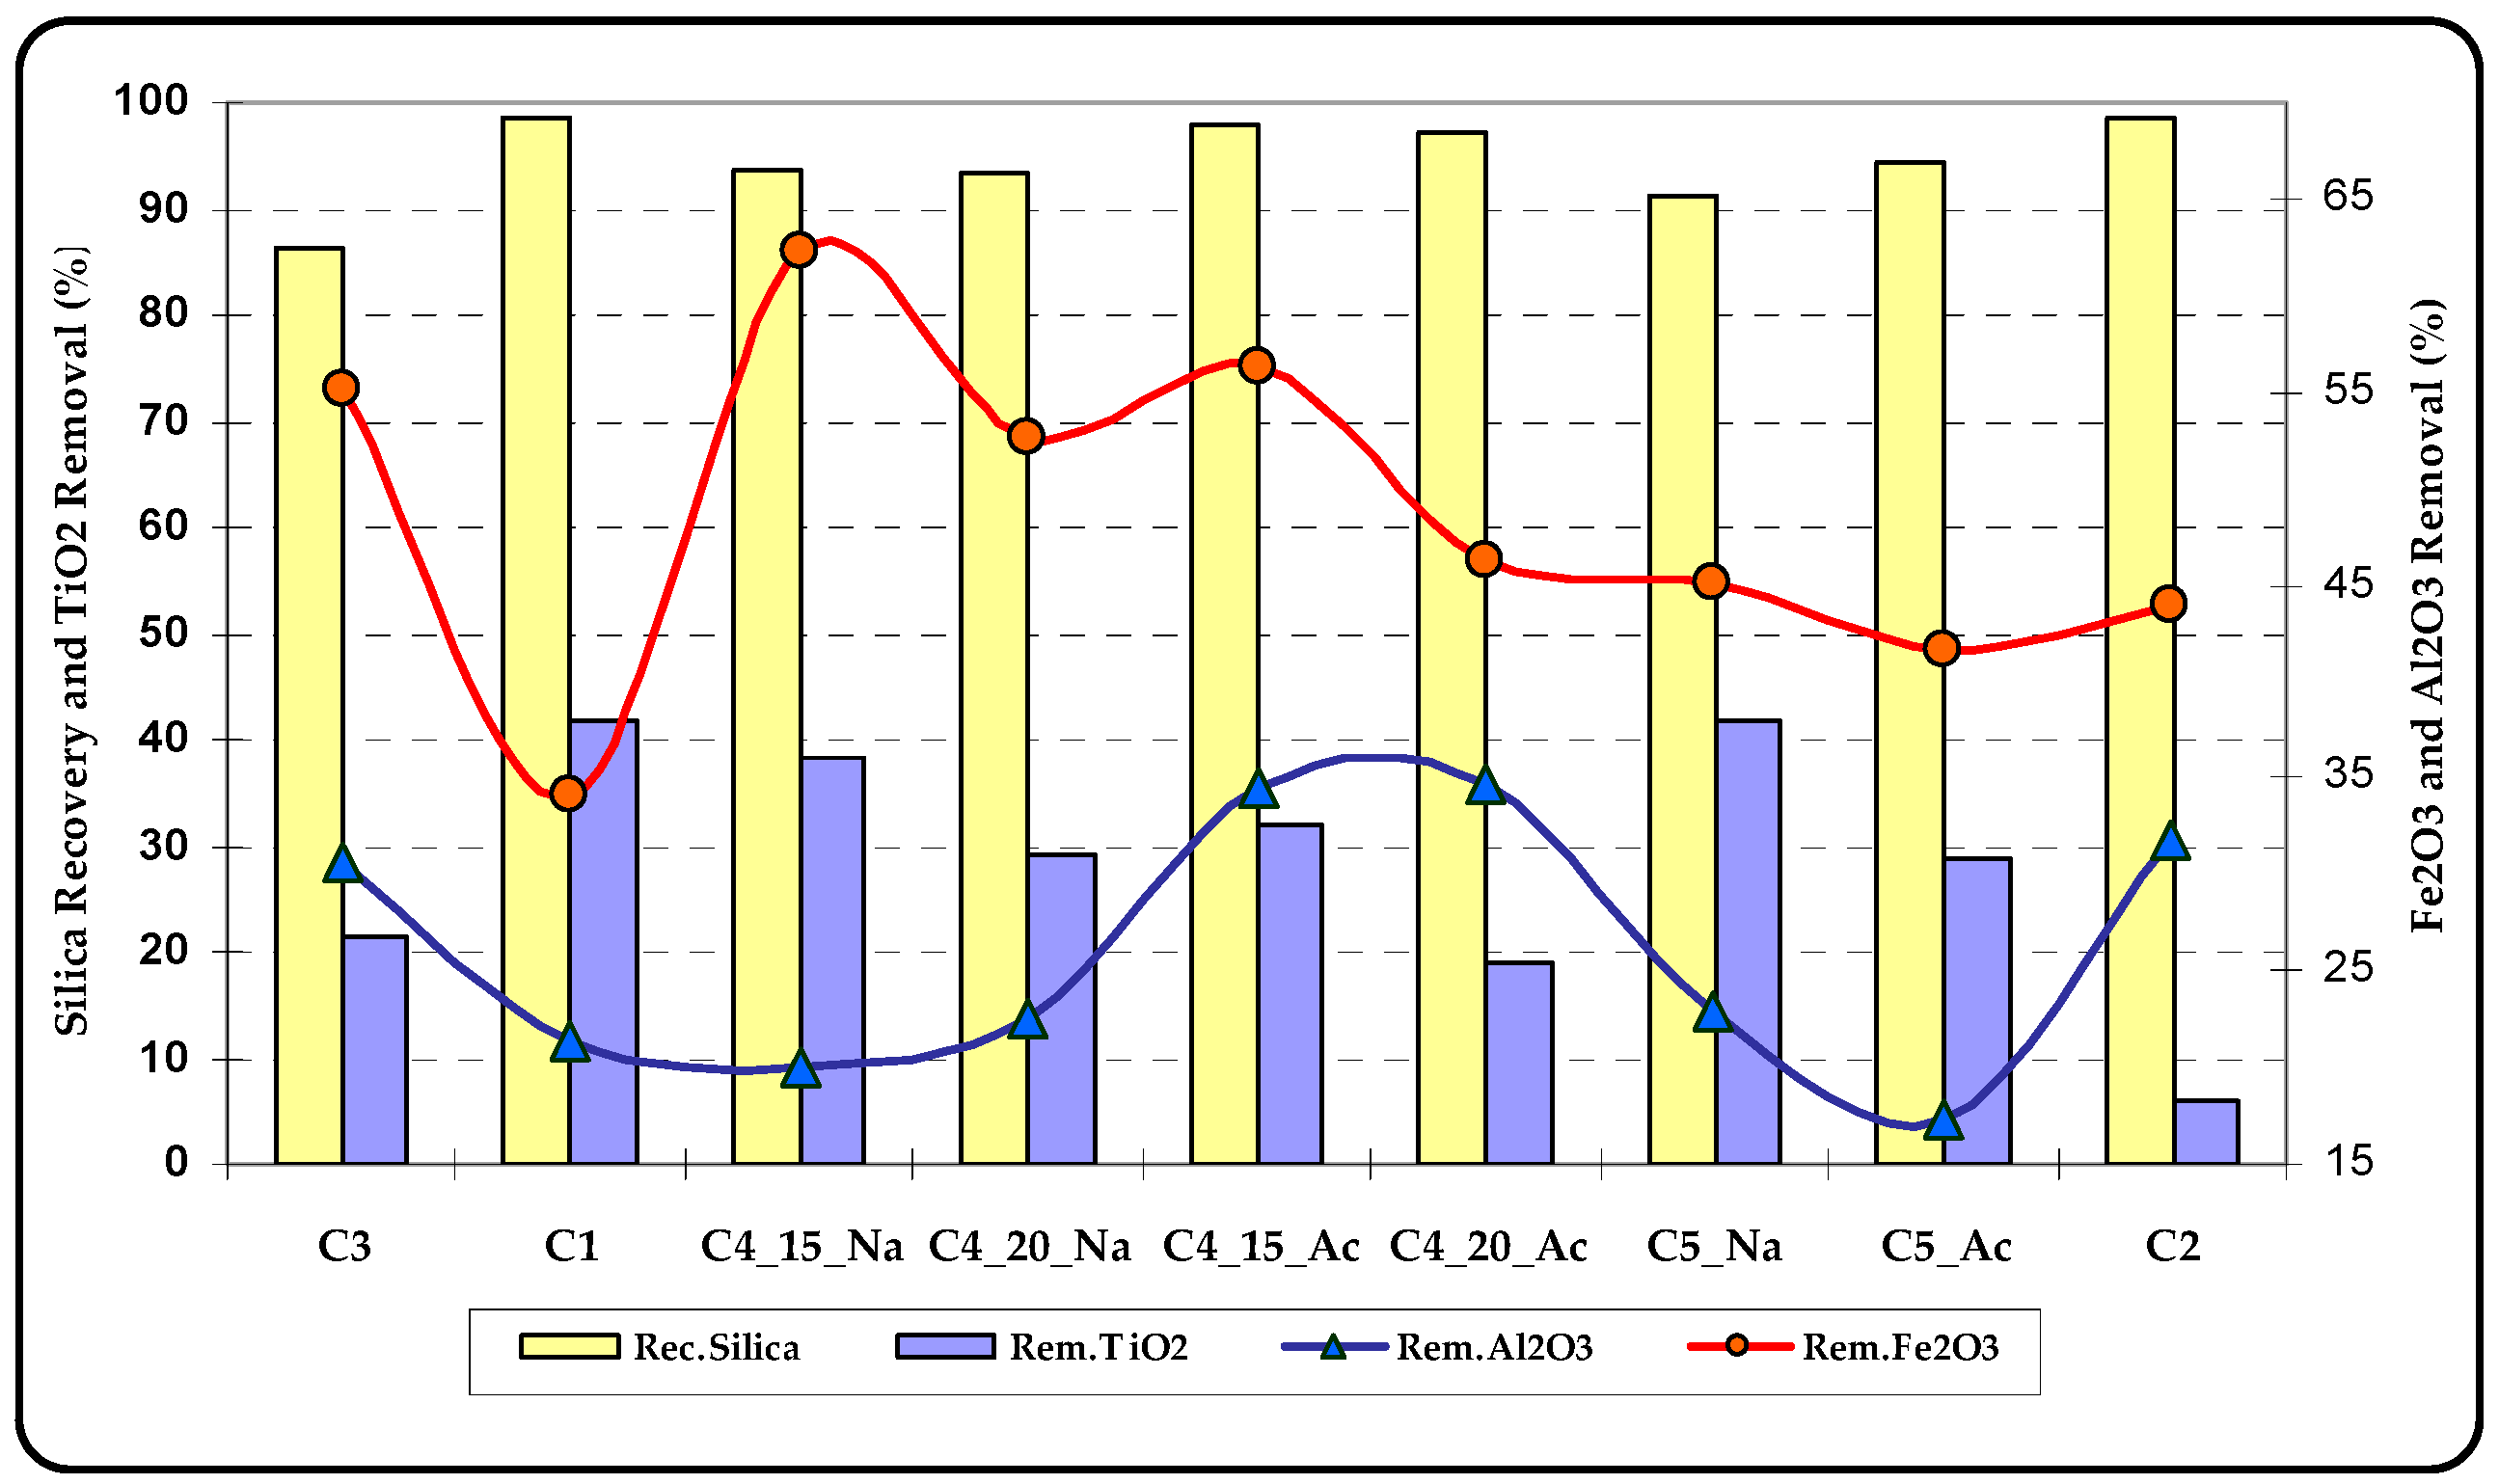
- In all tests, when ultrasound irradiation was available, the Al2O3 grade of the concentrate was decreased; more specifically, the alumina removal increased from an average of 18.75% up to 32.1%. This phenomenon was due to detaching the clays from the surfaces of silica particles and flowing of the clays to the froth zone as entrainment.
- (4)
- Application of C1 or C5 at neutral pH plus ultrasound irradiation during conditioning can be useful to decrease the TiO2 grade of the concentrate down to below 0.05%.
- (5)
- The best selectivity index for iron removal in reverse flotation was found in experiments 10 (C4_Ac_15.Nus) and 13 (C4_Ac_20.US), but only when the process finished with reverse flotation. The micro-attrition effect of ultrasound irradiation within the conditioning process resulted in better selectivity indices for Al2O3 and K2O in experiment 13.
- To reduce TiO2 in the silica concentrate, the best collector was sodium oleate. In addition, this collector showed strong performance for removing carbonates and a weak efficiency for iron removal.
- The best collector for iron removal was C4. However, iron removal was higher in neutral pH than acidic pH. As a result of higher silica loss, optionally, acidic pH can be selected over neutral pH. In addition, the conditioning time of 15 min was better than 20 min in both neutral and acidic pH. It should be noted that the maximum Al2O3 removal was achieved with this collector and a conditioning of 15 min in an acidic environment.
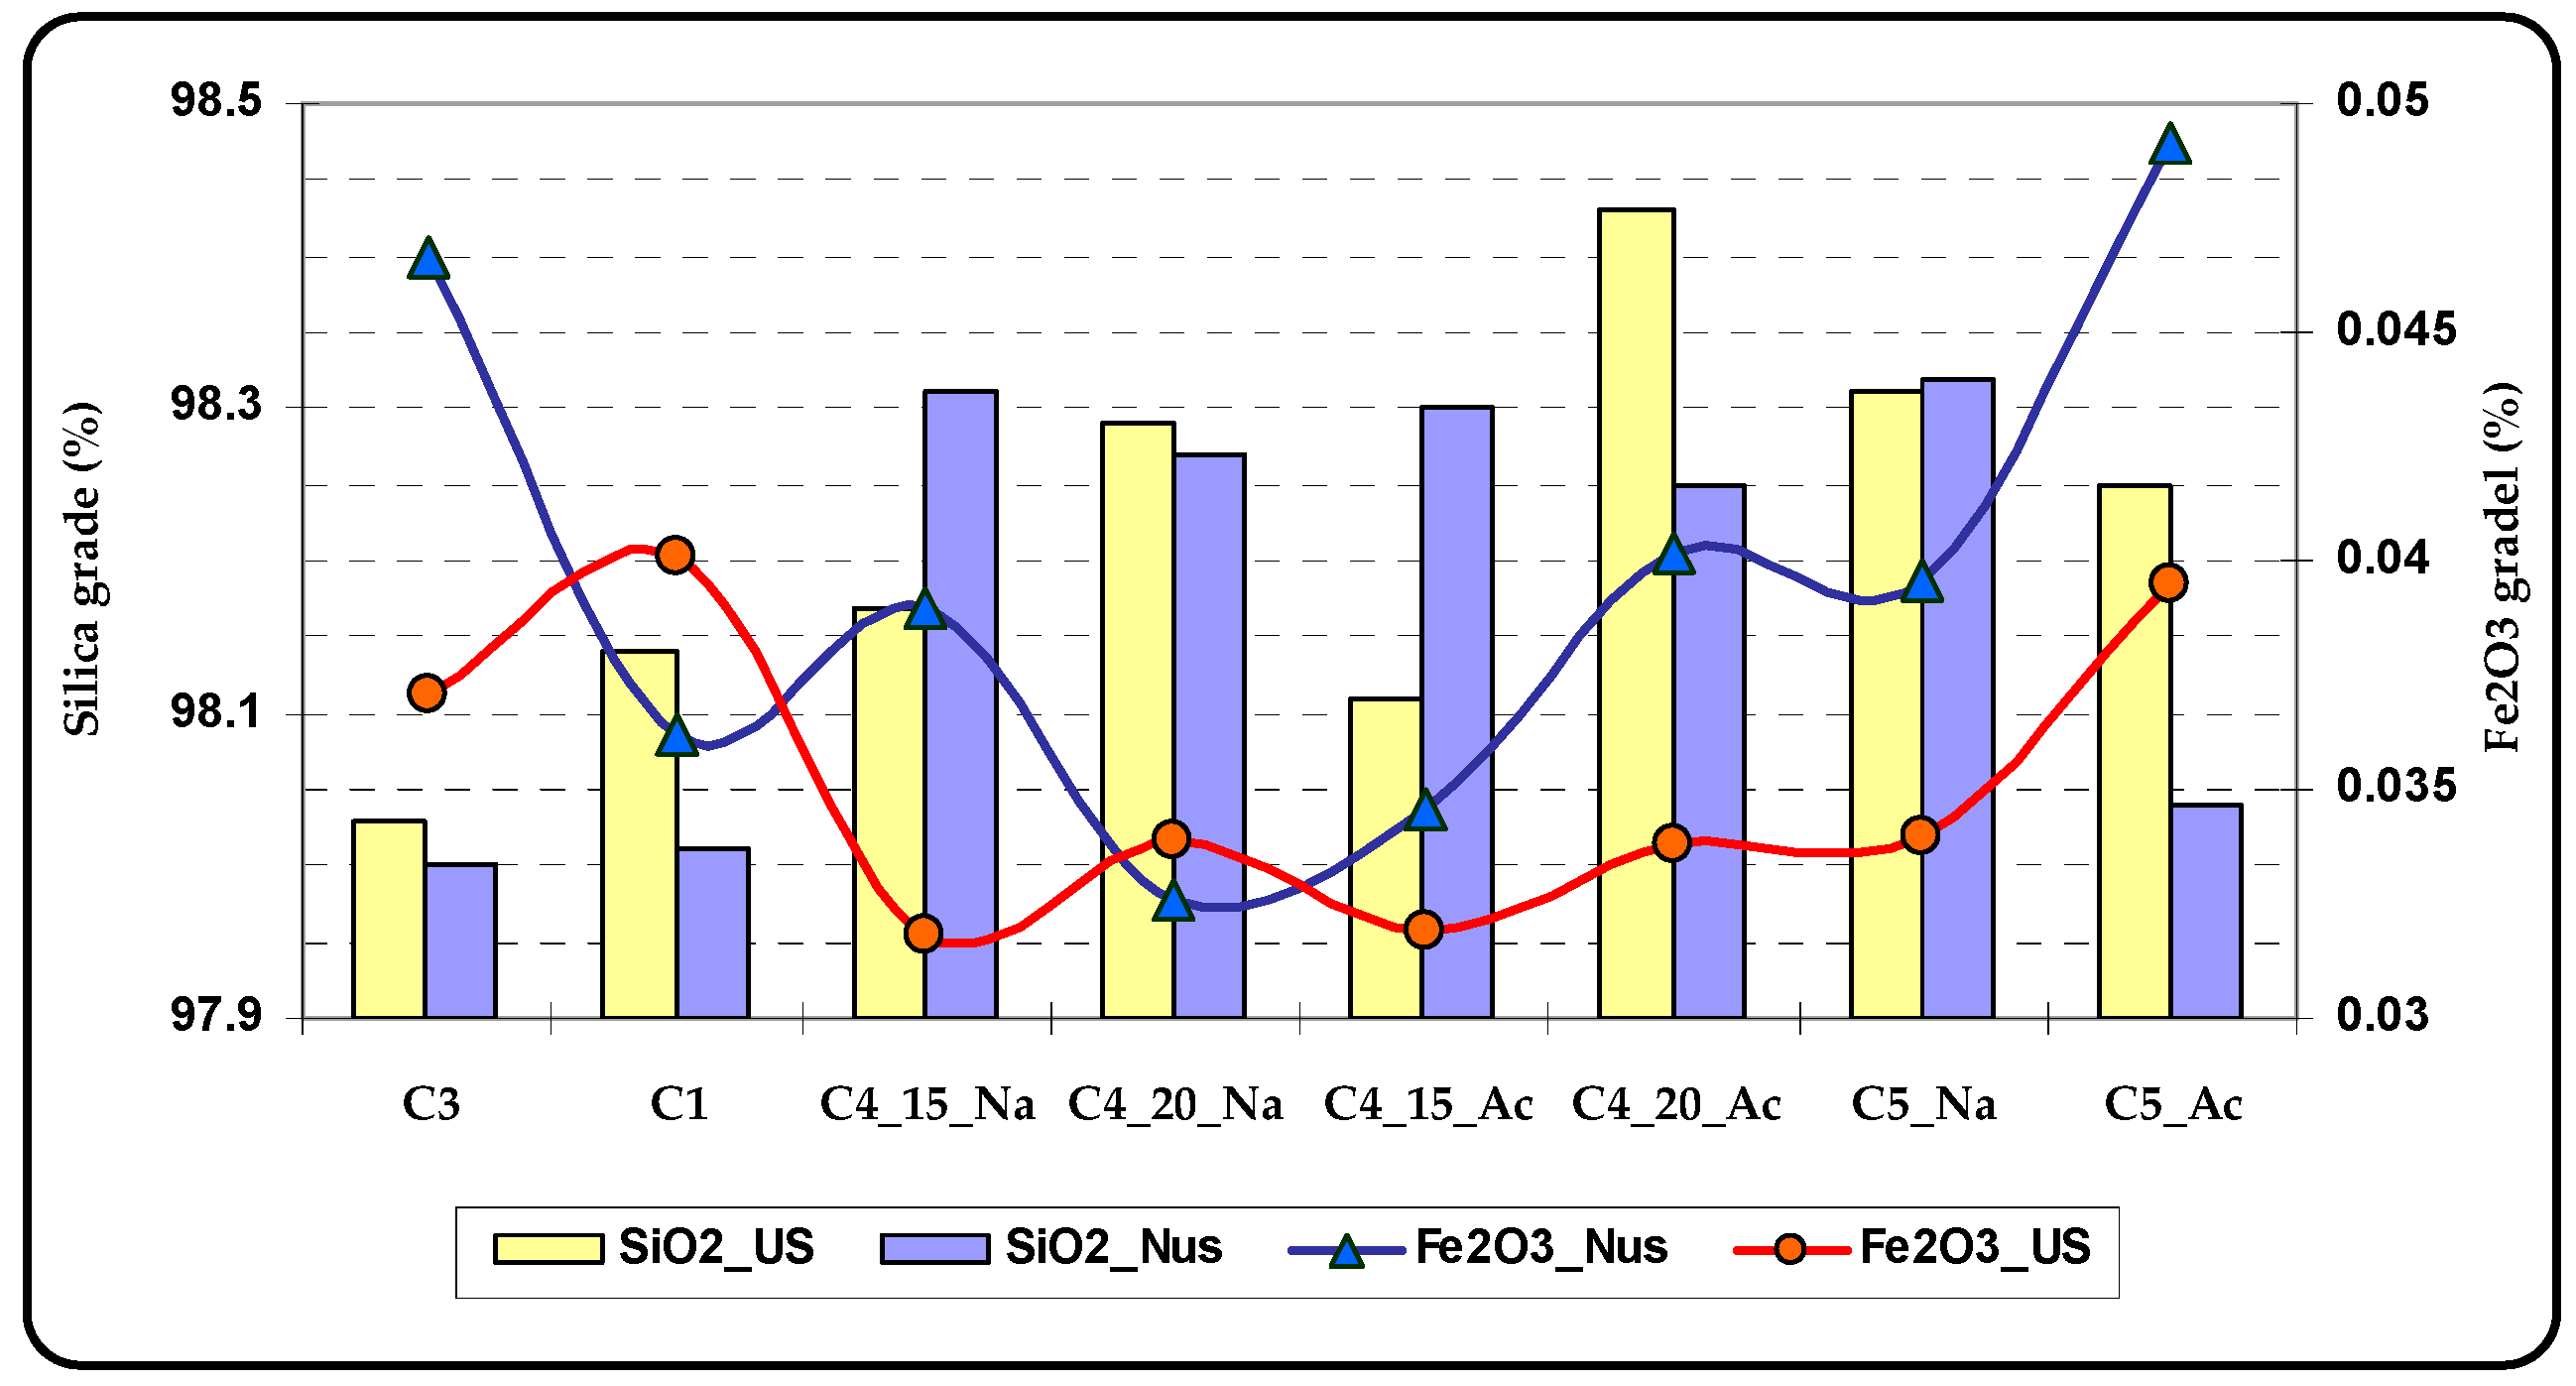
- The best collector to improve silica grade was C4 with 15 min of conditioning at an acidic pH; the average SiO2 grade reached 98.06%.
3.2. The Effect of Ultrasound Irradiation on Efficiency of Magnetic Separation
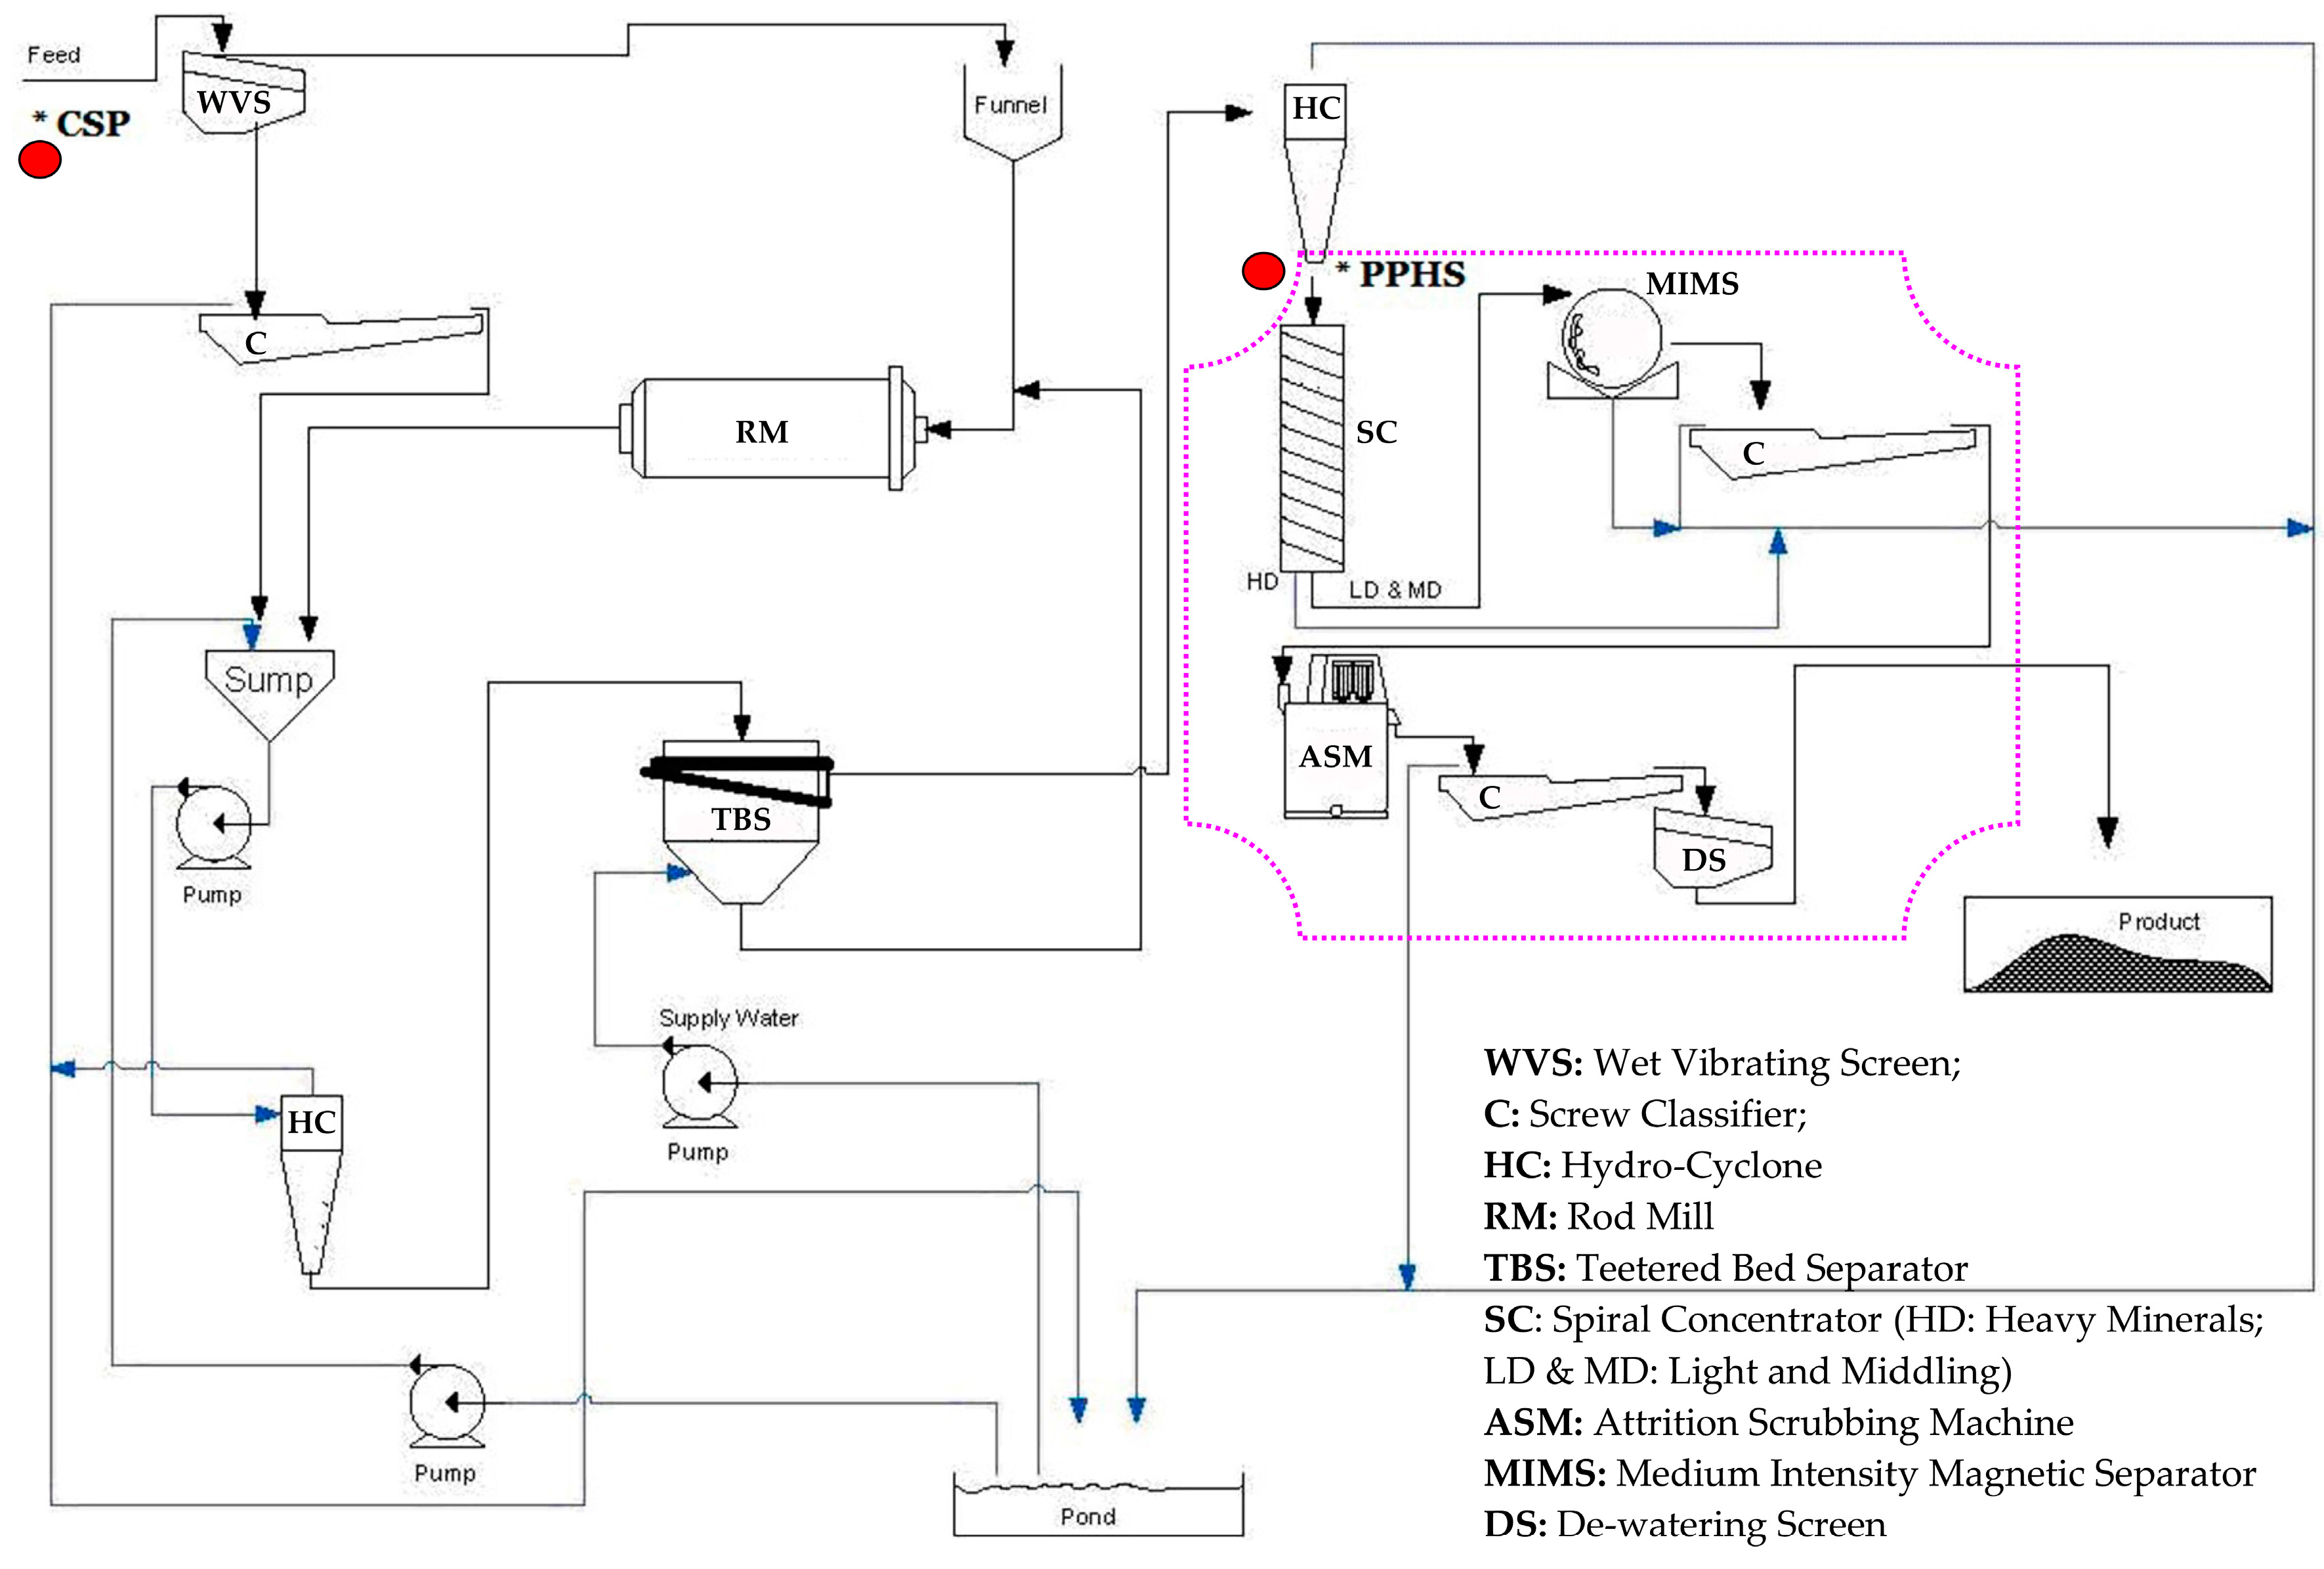
3.3. The Effect of Ultrasound Irradiation on Efficency of the Silica Purification Flowsheet
3.4. Modeling and Optimization of Reverse Flotation Using C4
- Non-quantified parameter: with/without ultrasound irradiation;
- Application of total absorbed power in the sonication reactor;
- Application of total absorbed power intensity (Watt/liter of slurry) in the sonication reactor.
- : Response (i.e., silica and impurity grades, recovery and impurities removal); and
- : Coefficients for predicted coded or actual models.
- The positive effect of interaction between conditioning time and absorbed power, including the negative effect of pH, is described as two influencing factors on flotation yield. One was that the quartz loss in the froth zone increases significantly with pH increase; and the other was increasing the flotation yield by increasing the conditioning time with indirect ultrasound irradiation.
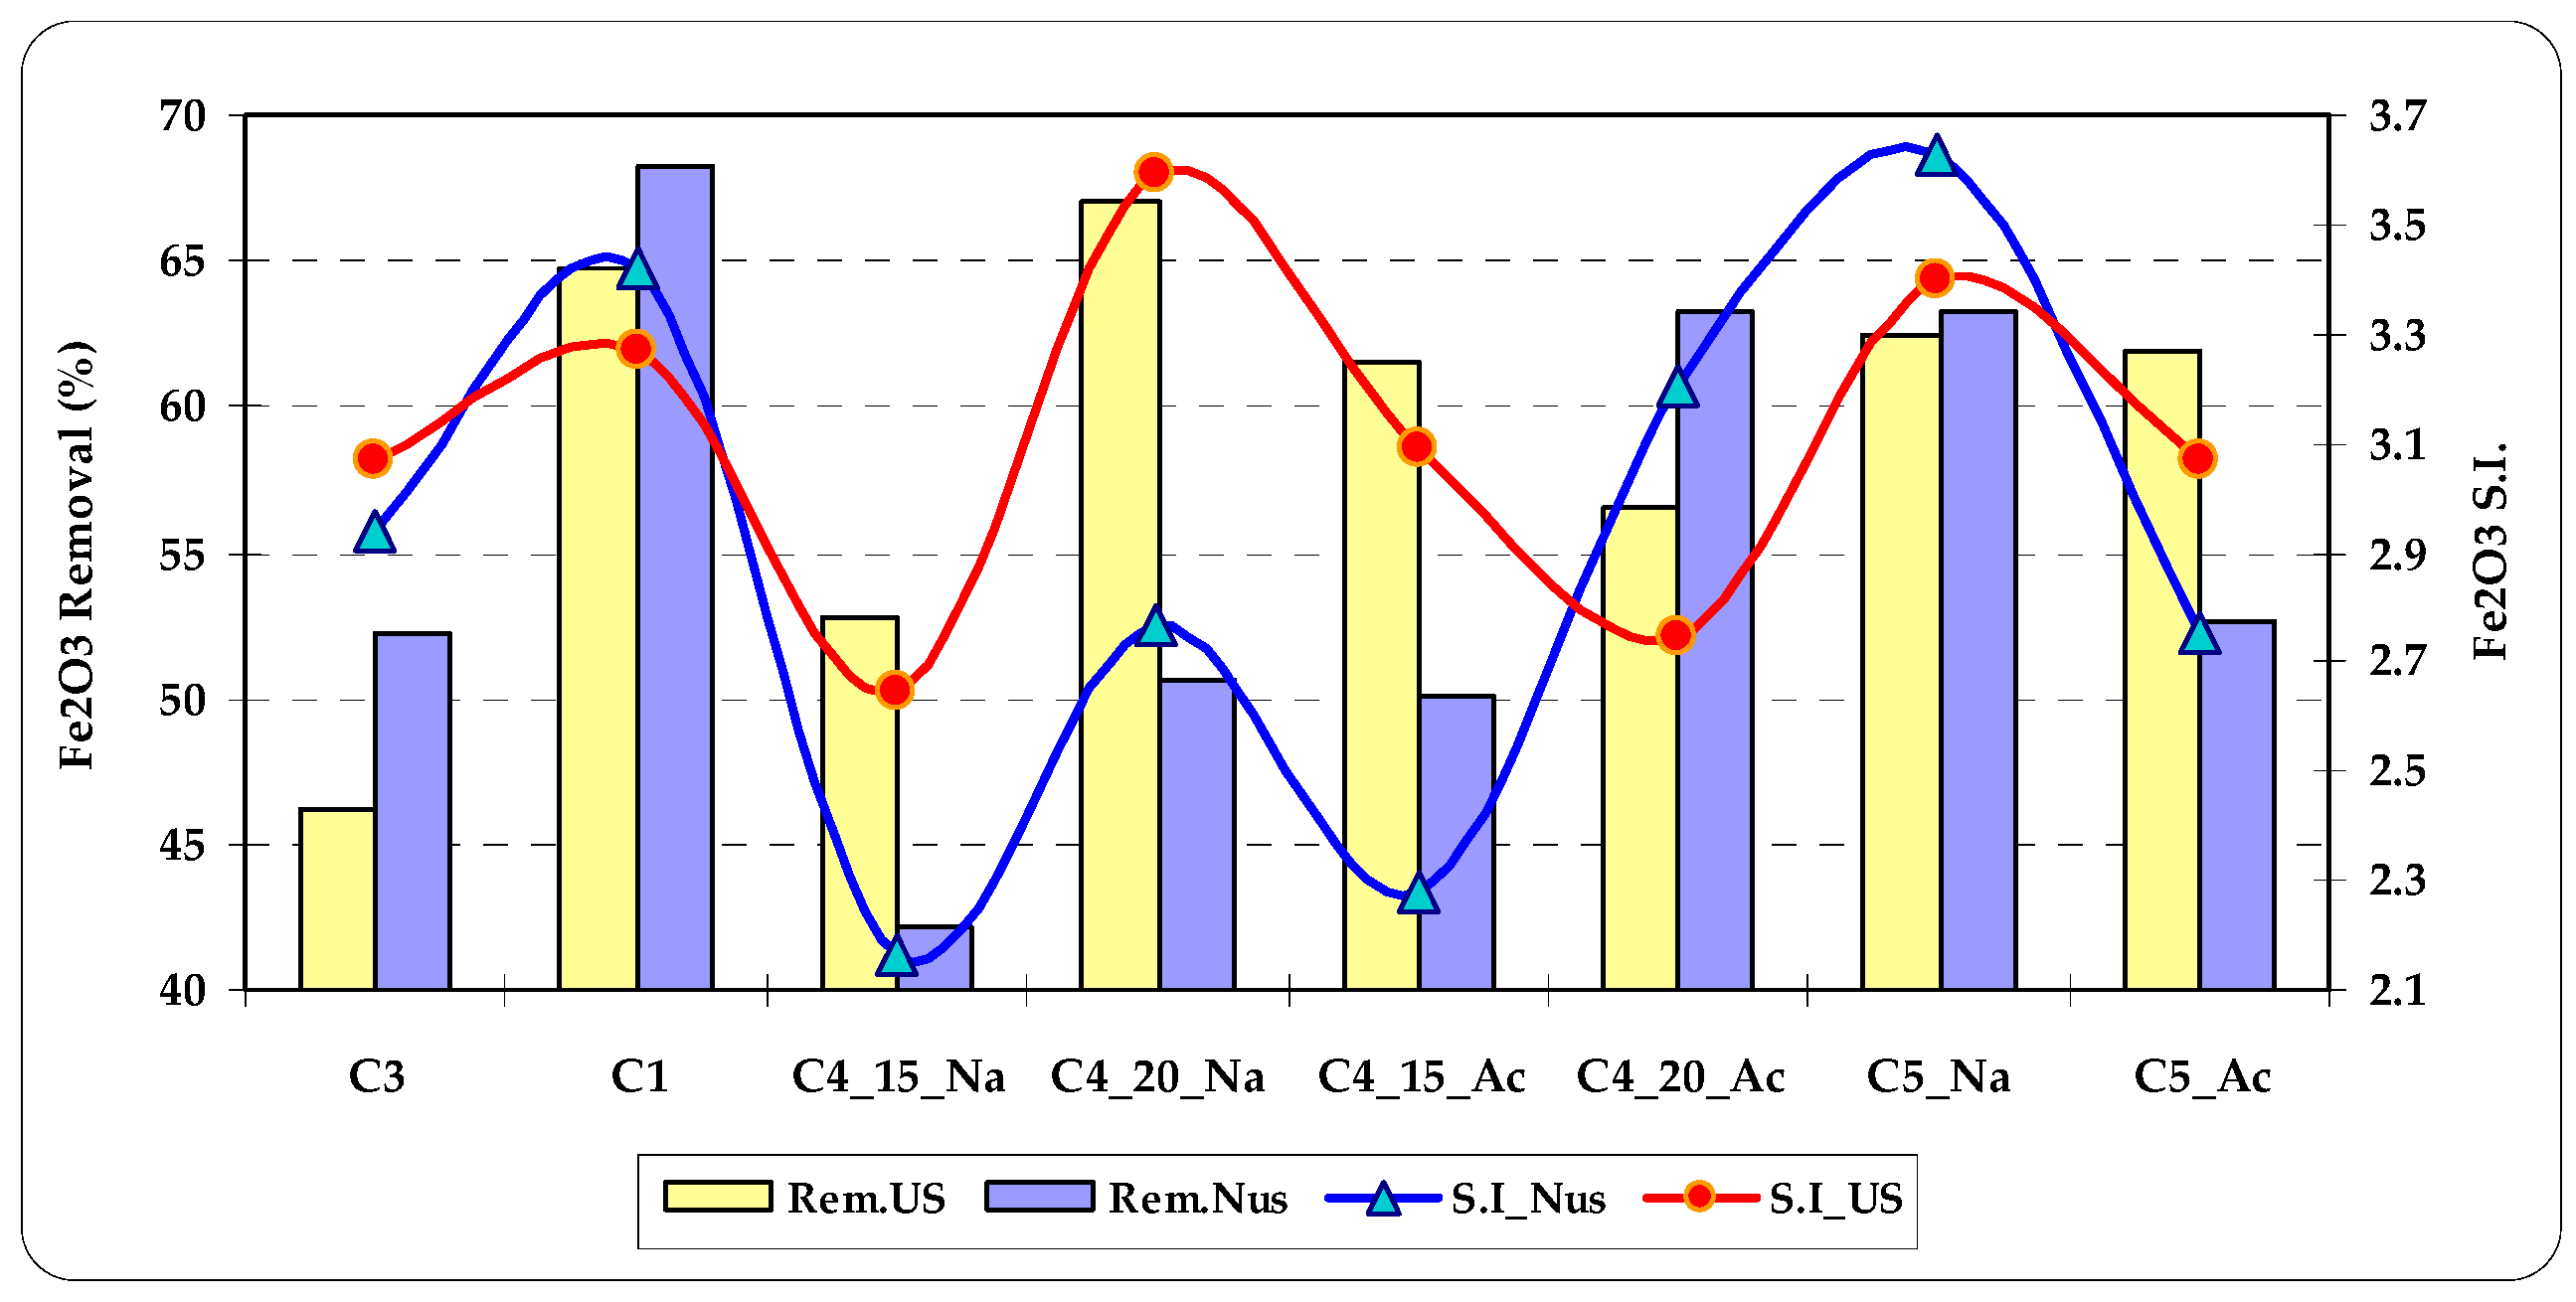
- The most important factor for prediction of the Fe2O3 grade in the flotation yield was a quadratic effect of pH. The other notable factors were the main effects (B and C) and interactions (AC and BC) which showed results of being less effective.
- The quadratic effect of pH was the most important and effective factor in Fe2O3 removal. The efficiency of removing iron impurities was decreased in the pH range of 3.5–5 while it increased in the pH range of 5–7.5. In conclusion, the C4 collector had the weakest capability in removing iron impurities at pH = 5.
- The interaction between pH and absorbed power had a negative effect on Fe2O3 removal. Thus utilizing indirect ultrasound irradiation with 20 min of conditioning at neutral pH resulted in the lowest Fe2O3 removal (see Figure 3).
- The most important factor influencing the silica grade of the flotation yield was the quadratic effect of pH. In contrast, the interaction between pH and absorbed power had a negative effect on silica grade in the flotation product. Consequently, it is better to carry out conditioning at neutral pH when ultrasound irradiation is not employed. However, there was a considerable positive effect of ultrasound irradiation on improving SiO2 grade.
- The interaction between conditioning time and absorbed power had a negative effect on TiO2 grade in the flotation product. Therefore, in the presence of ultrasound irradiation and increase of conditioning time, the TiO2 grade in the flotation product will consequently be increased.
3.5. Validation Tests and Discussion of Error in Reverse Flotation Using C4
3.6. Discussion about pH Effect in Reverse Flotation Using Anionic Collectors
4. Conclusions
- Ultrasound irradiation has a significant effect on the conditioning phase of flotation. Neutral pH is affected by ultrasonic waves caused by collapse of cavitation bubbles and generation of free radicals by changing the pH which mainly depends on the types of consumed reagents and increasing temperature in the sonication reactor. In the presence of ultrasound irradiation, during conditioning, the average rate of increasing temperature was 0.46 °C per minute and just slightly 2.5 times more than conventional conditioning. The average rate of increasing temperature was 0.19 °C per minute in conventional conditioning.
- When the experiment was carried out using ultrasound irradiation, silica grade increased. The yield and alumina grade of the concentrate decreased compared to the same conditions without ultrasound irradiation. This phenomenon was due to detaching clays from the surfaces of silica particles and the clays flowed to the froth zone as entrainment. It was concluded that ultrasound irradiation acts like a micro-attrition scrubber and was a powerful tool, not only for resolving clays problems in flotation but also for improving the selectivity of downstream processes.
- Excessive ultrasound irradiation during conditioning was harmful to iron impurities removal from silica in reverse flotation. However, this excessive sonication (longer than 20 min), improved the removal of Al2O3 and K2O by detachment of clays from silica particles.
- Ultrasound irradiation plays an important role in the selectivity of impurity removal (especially iron and clays) from silica in reverse flotation, including downstream processes.
- The lowest Fe2O3 grade of the flotation product was 0.058% and this was achieved using 2000 g/t of C4 as the collector. C4 consisted of Aero 801, Aero 825, oleic acid and sodium oleate at equal dosage. It should be noted that the mixture of these collectors had promising results, which were better at neutral pH than acidic pH. Therefore, reverse flotation using C4 at neutral pH can be a cost effective approach to avoid acid usage and all the relevant environmental problems in wastewater neutralization.
Acknowledgments
Author Contributions
Conflicts of Interest
Appendix A

| No. | Concentrate Weight and Grades (%) | Silica Recovery & Impurities Removal (%) | |||||||||||
|---|---|---|---|---|---|---|---|---|---|---|---|---|---|
| Cf | SiO2 | Fe2O3 | Al2O3 | TiO2 | CaO | K2O | SiO2 | Fe2O3 | Al2O3 | TiO2 | CaO | K2O | |
| 1 | 89.19 | 97.35 | 0.086 | 1.28 | 0.076 | 0.54 | 0.17 | 89.5 | 46.3 | 24.7 | 23.1 | - | 62.3 |
| 2 | 82.65 | 97.7 | 0.063 | 1.17 | 0.085 | 0.66 | 0.1 | 83.3 | 63.6 | 36.2 | 20.3 | - | 79.4 |
| 3 | 97.60 | 97.83 | 0.082 | 1.06 | 0.085 | 0.49 | 0.12 | 98.5 | 44.0 | 31.8 | 5.9 | - | 70.9 |
| 4 | 96.68 | 97.98 | 0.097 | 1.14 | 0.042 | 0.02 | 0.41 | 97.7 | 34.4 | 27.3 | 53.9 | 95.9 | 1.4 |
| 5 | 98.65 | 97.72 | 0.096 | 1.3 | 0.063 | 0.1 | 0.39 | 99.4 | 33.7 | 15.4 | 29.5 | 78.9 | 4.3 |
| 6 | 91.60 | 98.0 | 0.058 | 1.23 | 0.054 | 0.02 | 0.33 | 92.6 | 62.8 | 25.7 | 43.9 | 96.1 | 24.8 |
| 7 | 94.15 | 97.7 | 0.058 | 1.38 | 0.063 | 0.04 | 0.39 | 94.8 | 61.8 | 14.3 | 32.7 | 91.9 | 8.7 |
| 8 | 93.17 | 97.44 | 0.088 | 1.2 | 0.077 | 0.04 | 0.42 | 93.6 | 42.6 | 26.3 | 18.6 | 92.0 | 2.7 |
| 9 | 92.00 | 97.94 | 0.058 | 1.34 | 0.058 | 0.02 | 0.37 | 92.9 | 62.7 | 18.7 | 39.5 | 96.1 | 15.3 |
| 10 | 97.09 | 98.1 | 0.058 | 1.1 | 0.067 | 0.05 | 0.35 | 98.2 | 60.6 | 29.6 | 26.2 | 89.6 | 15.5 |
| 11 | 96.09 | 97.5 | 0.093 | 1.18 | 0.066 | 0.47 | 0.085 | 96.6 | 37.5 | 25.2 | 28.0 | 3.2 | 79.7 |
| 12 | 96.47 | 98.02 | 0.071 | 0.95 | 0.057 | 0.35 | 0.075 | 97.5 | 52.1 | 39.6 | 37.6 | 27.6 | 82.0 |
| 13 | 97.01 | 97.94 | 0.066 | 0.87 | 0.082 | 0.3 | 0.089 | 98.0 | 55.2 | 44.3 | 9.7 | 37.6 | 78.5 |
| 14 | 93.86 | 97.04 | 0.094 | 1.45 | 0.075 | 0.01 | 0.1 | 93.9 | 38.3 | 10.2 | 20.1 | 98.0 | 76.7 |
| 15 | 87.52 | 97.98 | 0.079 | 1.13 | 0.038 | 0.17 | 0.072 | 88.4 | 51.6 | 34.8 | 62.3 | 68.1 | 84.3 |
| 16 | 91.53 | 97.7 | 0.09 | 1.46 | 0.073 | 0.17 | 0.074 | 92.2 | 42.3 | 11.9 | 24.2 | 66.7 | 83.2 |
| 17 | 95.70 | 97.74 | 0.088 | 1.22 | 0.061 | 0.41 | 0.076 | 96.4 | 41.1 | 23.0 | 33.8 | 15.9 | 81.9 |
| NU | 94.07 | 97.63 | 0.079 | 1.31 | 0.068 | 0.12 | 0.24 | 94.7 | 47.9 | 18.8 | 27.9 | 74.9 | 43.2 |
| S.D. | 3.13 | 0.33 | 0.018 | 0.13 | 0.006 | 0.16 | 0.15 | 3.3 | 12.0 | 7.0 | 6.1 | 33.4 | 35.2 |
| US | 93.16 | 97.85 | 0.077 | 1.11 | 0.065 | 0.15 | 0.19 | 94.0 | 49.7 | 32.1 | 31.8 | 61.9 | 56.2 |
| S.D. | 5.24 | 0.20 | 0.013 | 0.09 | 0.018 | 0.17 | 0.16 | 5.3 | 10.4 | 5.9 | 19.0 | 35.9 | 37.2 |
| No. | CT | Grades (%) | Recovery & Impurities Removal | Selectivity Index | |||||||||
|---|---|---|---|---|---|---|---|---|---|---|---|---|---|
| SiO2 | Fe2O3 | Al2O3 | TiO2 | SiO2 | Fe2O3 | Al2O3 | TiO2 | Fe2O3 | Al2O3 | TiO2 | |||
| 1 | 78.67 | 98.00 | 0.047 | 1.00 | 0.050 | 79.5 | 74.3 | 48.1 | 55.4 | 3.35 | 1.90 | 2.19 | |
| 2 | 75.46 | 98.03 | 0.037 | 1.01 | 0.050 | 76.3 | 80.4 | 49.7 | 57.2 | 3.63 | 1.78 | 2.07 | |
| 3 | 82.57 | 98.07 | 0.037 | 0.89 | 0.050 | 83.5 | 78.5 | 51.5 | 53.2 | 4.30 | 2.32 | 2.40 | |
| 4 | 82.37 | 98.14 | 0.040 | 0.90 | 0.040 | 83.4 | 76.9 | 51.1 | 62.6 | 4.08 | 2.29 | 2.90 | |
| 5 | 83.13 | 98.01 | 0.036 | 0.94 | 0.050 | 84.0 | 78.9 | 48.5 | 52.8 | 4.44 | 2.22 | 2.43 | |
| 6 | 78.82 | 98.17 | 0.032 | 0.96 | 0.050 | 79.8 | 82.5 | 50.1 | 55.3 | 4.31 | 1.99 | 2.21 | |
| 7 | 80.97 | 98.31 | 0.039 | 0.97 | 0.050 | 82.1 | 77.9 | 48.2 | 54.1 | 4.02 | 2.06 | 2.32 | |
| 8 | 79.79 | 98.29 | 0.034 | 0.95 | 0.050 | 80.9 | 81.1 | 50.0 | 54.7 | 4.25 | 2.06 | 2.26 | |
| 9 | 80.86 | 98.27 | 0.033 | 0.94 | 0.040 | 81.9 | 81.6 | 49.9 | 63.3 | 4.48 | 2.12 | 2.80 | |
| 10 | 81.16 | 98.30 | 0.035 | 0.91 | 0.050 | 82.3 | 80.4 | 51.3 | 54.0 | 4.35 | 2.21 | 2.33 | |
| 11 | 81.65 | 98.25 | 0.040 | 0.93 | 0.041 | 82.7 | 77.0 | 49.9 | 62.0 | 4.01 | 2.18 | 2.80 | |
| 12 | 82.54 | 98.11 | 0.032 | 0.94 | 0.051 | 83.5 | 81.6 | 48.8 | 52.2 | 4.73 | 2.20 | 2.35 | |
| 13 | 82.36 | 98.43 | 0.034 | 0.90 | 0.051 | 83.6 | 80.5 | 51.1 | 52.3 | 4.59 | 2.31 | 2.37 | |
| 14 | 81.92 | 98.32 | 0.040 | 0.99 | 0.050 | 83.1 | 77.3 | 46.5 | 53.5 | 4.08 | 2.06 | 2.38 | |
| 15 | 76.21 | 98.31 | 0.034 | 0.95 | 0.035 | 77.3 | 81.9 | 52.3 | 69.7 | 3.92 | 1.93 | 2.80 | |
| 16 | 79.55 | 98.04 | 0.049 | 0.94 | 0.041 | 80.4 | 72.7 | 50.7 | 63.0 | 3.30 | 2.05 | 2.64 | |
| 17 | 81.17 | 98.25 | 0.040 | 0.91 | 0.049 | 82.2 | 77.6 | 51.3 | 54.9 | 4.00 | 2.21 | 2.37 | |
| NU | Avg. | 80.99 | 98.19 | 0.040 | 0.95 | 0.047 | 82.0 | 77.5 | 49.1 | 57.3 | 3.96 | 2.10 | 2.47 |
| S.D. | 1.38 | 0.14 | 0.006 | 0.03 | 0.005 | 1.44 | 2.94 | 1.58 | 4.63 | 0.46 | 0.11 | 0.23 | |
| US | Avg. | 80.14 | 98.20 | 0.035 | 0.93 | 0.047 | 81.2 | 80.1 | 50.7 | 56.9 | 4.16 | 2.10 | 2.38 |
| S.D | 2.78 | 0.13 | 0.003 | 0.04 | 0.006 | 2.83 | 1.98 | 1.06 | 5.76 | 0.34 | 0.19 | 0.27 | |

References
- Bulatovic, S.M. Beneficiation of Silica Sand. In Handbook of Flotation Reagents: Chemistry Theory and Practice, 1st ed.; Elsevier: Amsterdam, The Netherlands, 2015; Volume 3, pp. 121–127. [Google Scholar]
- BSI. Methods for Sampling and Analysis of Glass-Making Sands; BS 2975:1988; BSI: London, UK, 1988. [Google Scholar]
- Shevrini, M.; Haghi, H. Modification of classifying unit in a silica plant using replacement of trommel screens with Teetered Bed Separator. In Proceedings of the XV Balkan Mineral Processing Congress, Sozopol, Bulgaria, 12–16 June 2013; Volume 1, pp. 524–529.
- Shevrini, M.; Haghi, H. Improvement in product of silica plant by modification of size classifying unit and application of attrition scrubber. In Proceedings of the XXVII International Mineral Processing Congress, Santiago, Chile, 20–24 October 2014; pp. 147–158.
- Raghu Kumar, C.; Tripathy, S.K.; Mohanan, S.; Venugopalan, T.; Suresh, N. Evaluation of floatex density separator performance using silica sand. In Proceedings of the XI International Seminar on Mineral Processing Technology, NML Jamshedpur, India, 15–17 December 2010; pp. 701–706.
- Haghi, H.; Noaparast, M. Application of hot acidic scrubbing and hot agitated leaching for iron removal from Shenin silica mine (used in glass Industry). In Proceedings of the 13th Conference on Environment and Mineral Processing, Ostrava, Czech Republic, 4–6 June 2009; Volume IV, pp. 121–130.
- Haghi, H.; Noaparast, M.; Ghorbani, A. Reduction of iron content from silica sand by scrubbing process. In Proceedings of the 11th International Mineral Processing Symposium, Belek-Antalya, Turkey, 21–23 October 2008; pp. 259–265.
- Hearn, S.; Sadowski, J. Advances in the application of spiral concentrators for production of glass sand. In Advances in Gravity Concentration, 1st ed.; Honaker, R.Q., Forrest, W.R., Eds.; Society of Mining, Metallurgy, and Exploration, Inc. (SME): Englewood, CO, USA, 2003; pp. 179–187. [Google Scholar]
- Ibrahim, S.S.; Selim, A.Q.; Hagrassc, A.A. Gravity separation of silica sands for value addition. Part. Sci. Technol. 2013, 31, 590–559. [Google Scholar] [CrossRef]
- Al-Maghrabi, M.N.N.H. Improvement of low grade silica sand deposits in Jeddah area. JKAU: Eng. Sci. 2004, 15, 113–128. [Google Scholar] [CrossRef]
- Haghi, H.; Noaparast, M. Iron removal from relatively low grade silica using magnetic separation. In Proceedings of the XXVII International Mineral Processing Congress, Santiago, Chile, 20–24 October 2014; pp. 84–93.
- Andrews, P.R.A.; Collings, R.K. Canadian silica resources for glass and foundry sand production: Processing studies at CANMET. Int. J. Miner. Process. 1989, 25, 311–317. [Google Scholar] [CrossRef]
- Goktepe, F.; Ipek, H.; Goktepe, M. Beneficiation of quartz waste by flotation and by ultrasonic treatment. Physicochem. Probl. Miner. Process. 2011, 47, 41–50. [Google Scholar]
- Haghi, H.; Noaparast, M.; Ghadyani, A.; Ghorbani, A. Reduction of iron content from Shenin silica mine by reverse flotation. In Proceedings of the XII International Mineral Processing Symposium, Nevsehir, Turkey, 6–8 October 2010; pp. 465–474.
- Hacifazlioglu, H. Enrichment of silica sand ore by cyclojet flotation cell. Sep. Sci. Technol. 2014, 49, 1623–1632. [Google Scholar] [CrossRef]
- Teodorescu, E.; Sarachie, I.; Prida, T.; Ivan, I.; Popa, T. Glass sand production by flotation and magnetic separation technology. In Proceedings of the 7th International Mineral Processing Symposium (Innovations in Mineral and Coal Processing), Istanbul, Turkey, 15–17 September 1998; pp. 339–341.
- Taxiarchou, M.; Panias, D.; Douni, I.; Paspaliaris, I.; Kontopoulos, A. Removal of iron from silica sand by leaching with oxalic acid. Hydrometallurgy 1997, 46, 215–227. [Google Scholar] [CrossRef]
- Veglió, F.; Passariello, B.; Barbaro, M.; Plescia, P.; Marabini, A.M. Drum leaching tests in iron removal from quartz using oxalic and sulphuric acids. Int. J. Miner. Process. 1998, 54, 183–200. [Google Scholar] [CrossRef]
- Veglió, F.; Passariello, B.; Abbruzzese, C. Iron removal process for high purity silica sands production by oxalic acid leaching. Ind. Eng. Chem. Res. 1999, 38, 4443–4448. [Google Scholar] [CrossRef]
- Tarasova, I.I.; Dudeney, A.W.L.; Pilurzu, S. Glass sand processing by oxalic acid leaching and photocatalytic effluent treatment. Miner. Eng. 2001, 14, 639–646. [Google Scholar] [CrossRef]
- Banza, A.N.; Quindt, J.; Gock, E. Improvement of the quartz sand processing at Hohenbocka. Int. J. Miner. Process. 2006, 79, 76–82. [Google Scholar] [CrossRef]
- Haghi, H.; Noaparast, M.; Ghadyani, A.; AmiriParian, A. Investigation of the various processes of acidic leaching for iron removal from silica with statistical methods. In Proceedings of the XIIIth Balkan Mineral Processing Congress, Bucharest, Romania, 14–17 June 2009; Volume 1, pp. 297–305.
- Haghi, H.; Ghadyani, A.; Faramarzi, M. Application of agitated leaching for iron removal from silica using sulfuric and hydrochloric acid. In Proceedings of the XXV International Mineral Processing Congress, Brisbane, Australia, 6–10 September 2010; pp. 325–334.
- Farmer, A.D.; Collings, A.F.; Jameson, G.J. Effect of ultrasound on surface cleaning of silica particles. Int. J. Miner. Process. 2000, 60, 101–113. [Google Scholar] [CrossRef]
- Collings, A.F.; Farmer, A.D. Enhanced leaching through the use of power ultrasound. In Proceedings of the 7th Mill Operators’ Conference, Kalgoorlie, WA, Australia, 12–14 October 2000; pp. 273–276.
- Collings, A.F.; Farmer, A.D.; Struthers, A.A. The effect of power ultrasound in the production of synthetic rutile by the becher process. In Proceedings of the 3rd International Heavy Minerals Conference, Fremantle, WA, Australia, 18–19 June 2001; pp. 235–240.
- Aldrich, C.; Feng, D. Effect of ultrasonic preconditioning of pulp on the flotation of sulphide ores. Miner. Eng. 1999, 12, 701–707. [Google Scholar] [CrossRef]
- Ozkan, S.G. Beneficiation of magnesite slimes with ultrasonic treatment. Miner. Eng. 2002, 15, 99–101. [Google Scholar] [CrossRef]
- Ozkan, S.G.; Kuyumcu, H.Z. Investigation of mechanism of ultrasound on coal flotation. Int. J. Miner. Process. 2006, 81, 201–203. [Google Scholar] [CrossRef]
- Ozkan, S.G.; Kuyumcu, H.Z. Design of a flotation cell equipped with ultrasound transducers to enhance coal flotation. Ultrason. Sonochem. 2007, 14, 639–645. [Google Scholar] [CrossRef] [PubMed]
- Ozkan, S.G. Effects of simultaneous ultrasonic treatment on flotation of hard coal slimes. Fuel 2012, 93, 576–580. [Google Scholar] [CrossRef]
- Cilek, E.C.; Ozgen, S. Effect of ultrasound on separation selectivity and efficiency of flotation. Miner. Eng. 2009, 22, 1209–1217. [Google Scholar] [CrossRef]
- Celik, M.S. Effect of ultrasonic treatment on the floatability of coal and galena. Sep. Sci. Technol. 1989, 24, 1159–1166. [Google Scholar] [CrossRef]
- Ambedkar, B.; Nagarajan, R.; Jayanti, S. Ultrasonic coal-wash for de-sulfurization. Ultrason. Sonochem. 2011, 18, 718–726. [Google Scholar] [CrossRef] [PubMed]
- Farmer, A.D.; Collings, A.F.; Jameson, G.J. The application of power ultrasound to the surface cleaning of silica and heavy mineral sands. Ultrason. Sonochem. 2000, 7, 243–247. [Google Scholar] [CrossRef]
- Zhao, H.L.; Wang, D.X.; Cai, Y.X.; Zhang, F.C. Removal of iron from silica sand by surface cleaning using power ultrasound. Miner. Eng. 2007, 20, 816–818. [Google Scholar] [CrossRef]
- Mills, H.N. Glass raw materials. In Industrial Minerals and Rocks, 5th ed.; Lefond, S.J., Ed.; Society of Mining Engineers: New York, NY, USA, 1983; pp. 339–351. [Google Scholar]
- Krukowski, S.T. Specialty Silica Materials. In Industrial Minerals and Rocks, Commodities, Markets and Uses, 7th ed.; Kogel, J.E., Trivedi, N.C., Barker, J.M., Krukowski, S.T., Eds.; Society of Mining, Metallurgy, and Exploration, Inc. (SME): Englewood, CO, USA, 2006; p. 842. [Google Scholar]
- Chammas, E.; Panias, D.; Taxiarchou, D.; Anastassakis, G.N.; Paspaliaris, I. Removal of iron impurities and other major impurities from silica sand for the production of high added value materials. In Proceedings of the 9th Balkan Mineral Processing Congress, Istanbul, Turkey, 11–13 September 2001.
- Bouabdallah, S.; Bounouala, M.; Chaib, A.S. Removal of iron from sandstone by magnetic separation and leaching: Case of El-Aouana. J. Min. Sci. 2015, 22, 33–44. [Google Scholar]
- ASTM International. Standard Test Methods for Chemical Analysis of Glass Sand; ASTM C146-94a; ASTM International: West Conshohocken, PA, USA, 2014. [Google Scholar]
- BSI. Sampling and Analysis of Glass-Making Sands, Part 2: Methods for Chemical Analysis; BS 2975-2:2008; BSI: London, UK, 2008. [Google Scholar]
- Bureau of Indian Standards. Chemical Analysis of Quartzite and High Silica Sand; IS.1917 (7 Parts; 1991-2); Bureau of Indian Standards: New Delhi, India.
- Vasanthakumar, B.; Ravishankar, H.; Subramanian, S. A novel property of DNA—As a bioflotation reagent in mineral processing. PLoS ONE 2012, 7, e39316. [Google Scholar] [CrossRef] [PubMed]
- Fuerstenau, M.C.; Jameson, G.; Yoon, R.H. Froth flotation: A Century of Innovation; Society for Mining, Metallurgy, and Exploration: Littleton, CO, USA, 2007. [Google Scholar]
- Somasundaran, P.; Moudgil, B.M. Reagents in Mineral Technology; Marcel Dekker Inc.: New York, NY, USA, 1989; Volume 27. [Google Scholar]
- Ghorbani, A.; Haghi, H. Iron removal from Choghaie feldspar mine by flotation. In Proceedings of the 7th International Industrial Minerals Symposium and Exhibition, Kusadasi, Turkey, 25–27 February 2009.
- Xie, X.Z.; Wang, Y.H. Effective collectors for limonite flotation and mechanism there in. Min. Metall. Eng. 2011, 31, 49–52. [Google Scholar]


| Application & Description | Chemical Composition (%) | |||
|---|---|---|---|---|
| SiO2 | Al2O3 | Fe2O3 | Cr2O3 | |
| Optical & ophthalmic glass | >99.7 | <0.2 | <0.013 | <0.00015 |
| Tableware & lead crystal glasses | 99.6 ± 0.1 | 0.2 ± 0.1 | ≤0.01 | <0.0002 |
| Borosilicate glasses | 99.6 ± 0.1 | 0.2 ± 0.1 | ≤0.010 | 0.0002 |
| Colorless glass containers | 98.8 ± 0.2 | Nominal ± 0.1 | ≤0.03 ± 0.003 | 0.0005 |
| Clear flat glass | 99.0 ± 0.2 | 0.5 ± 0.15 | 0.10 ± 0.005 | - |
| Colored glass containers | 97.0 ± 0.3 | Nominal ± 0.1 | 0.25 ± 0.03 | - |
| Glass for insulating fibers | 94.5 ± 0.5 | 3.0 ± 0.5 | 0.3 ± 0.05 | - |
| Type/Description | SiO2 | Fe2O3 | Al2O3 | TiO2 | K2O | CaO | MgO | LOI | Na2O | P2O5 | SO3 | |
|---|---|---|---|---|---|---|---|---|---|---|---|---|
| White Sand a | 99.7 | 0.025 | 0.08 | 0.02 | 0.005 | 0.01 | 0.01 | 0.126 | 0.004 | - | - | |
| Yellow Sand a | 99.1 | 0.15 | 0.25 | 0.05 | 0.05 | 0.01 | 0.01 | 0.365 | 0.015 | - | - | |
| Badgeley Island b | 98.5 | 0.04 | 0.8 | 0.02 | 0.14 | 0 | 0.03 | 0.16 | 0.01 | 0.01 | - | |
| Shequiandah b | 97.90 | 0.08 | 0.8 | 0.05 | 0.3 | 0.04 | 0.07 | 0.24 | 0.1 | 0.03 | - | |
| Grenville Quartzite b | 96.90 | 0.22 | 0.68 | 0.06 | 0.09 | 0 | 0.03 | 0.12 | 0.01 | 0.01 | - | |
| Aydin-Cine, Turkey c | 94.81 | 0.137 | 2.94 | 0.035 | 0.62 | 0.09 | 0.06 | 0.54 | 0.77 | - | - | |
| Florinas quarry, Italy d | 98.95 | 0.011 | 0.40 | - | 0.33 | 0.18 | - | - | 0.13 | - | - | |
| Greece e | 98.01 | 0.066 | 0.37 | 0.48 | 0.037 | 0.097 | 0.018 | 0.883 | 0.032 | - | - | |
| Greece e | 96.85 | 0.189 | 0.62 | 0.41 | 0.07 | 0.038 | 0.039 | 1.72 | 0.058 | - | - | |
| Sandstone, Algeria f | 97.20 | 0.62 | 1.04 | 0.22 | 0.01 | 0.09 | 0.1 | 0.44 | 0.26 | - | 0.02 | |
| White Sand, Egypt g | 99.44 | 0.046 | 0.044 | 0.030 | 0.01 | 0.060 | 0.020 | 0.30 | 0.01 | 0.01 | 0.01 | |
| Aghires, Romania h | 97.77 | 0.18 | 1.29 | 0.28 | - | - | - | 0.45 | - | - | - | |
| CSP 1 | ICP-OES 3 | 95.58 | 0.27 | 2.37 | 0.1 | 0.53 | 0.22 | 0.1 | 0.72 | 0.02 | 0.02 | 0.07 * |
| PPHS 2 | XRF 4 | 97.28 | 0.123 | 1.17 | 0.09 | 0.392 | 0.203 | 0.052 | 0.673 | - | 0.015 | 0.002 |
| ICP-OES | 97.43 | 0.134 | 1.20 | 0.07 | 0.416 | 0.213 | 0.070 | 0.450 | - | 0.010 | 0 | |
| CA 5 | 96.98 | 0.143 | 1.52 | 0.088 | 0.402 | 0.467 | - | 0.40 | - | - | - | |
| Size Range (μm) | Average Size (μm) | wt % | Major Components | ||||||
|---|---|---|---|---|---|---|---|---|---|
| SiO2 | Fe2O3 | Al2O3 | TiO2 | K2O | CaO | LOI * | |||
| 420–600 | 502.0 | 15.75 | 96.97 | 0.088 | 1.68 | 0.060 | 0.33 | 0.41 | 0.51 |
| 300–420 | 355.0 | 28.33 | 97.20 | 0.088 | 1.13 | 0.071 | 0.33 | 0.42 | 0.65 |
| 212–300 | 252.2 | 18.62 | 96.96 | 0.104 | 1.45 | 0.105 | 0.35 | 0.39 | 0.55 |
| 150–212 | 178.3 | 23.89 | 96.81 | 0.127 | 1.74 | 0.122 | 0.36 | 0.44 | 0.67 |
| 106–150 | 126.1 | 9.88 | 96.64 | 0.133 | 1.90 | 0.089 | 0.43 | 0.50 | 0.60 |
| 75–106 | 89.2 | 3.52 | 94.40 | 0.365 | 2.30 | 0.176 | 0.41 | 0.56 | 0.98 |
| Head ** | 284.8 | 100 | 96.87 | 0.114 | 1.54 | 0.093 | 0.35 | 0.43 | 0.60 |
| Size Range (μm) | wt. % | Major Iron Minerals | Major Nonmetallic Impurities | Average Liberation Degree from Silica Particles | ||
|---|---|---|---|---|---|---|
| Iron Impurities | Clays | Carbonates | ||||
| 420–600 | 15.75 | Gt > Hem >> Py | Ill ≈ Kln > Cal >> Fsp | 25 | 17.5 | 57.5 |
| 300–420 | 28.33 | Gt > Lm >> Hem >> Py | Ill ≈ Kln > Cal > Mca >> Fsp | 45 | 35 | 75 |
| 212–300 | 18.62 | Gt ≈ Lm > Hem >> Py | Ill ≈ Kln > Cal > Mca >> Fsp | 57.5 | 40 | 80 |
| 150–212 | 23.89 | Gt > Lm > Hem >> Py | Kln > Ill > Cal >> Fsp | 80 | 50 | 85 |
| 106–150 | 9.88 | Gt > Hem >> Py | Kln > Ill > Cal > Fsp >> Mca | 85 | 52.5 | 90 |
| 75–106 | 3.52 | Gt > Hem >> Py | Kln > Ill > Cal > Fsp >> Mca | 87.5 | 57.5 | 95 |
| Average liberation degree of head sample | 57.99 | 39.28 | 77.75 | |||
| No. | pH 1 | Collector | Frother Dosage (g/t) | Absorbed Power (W) * | E (%) | |||||||
|---|---|---|---|---|---|---|---|---|---|---|---|---|
| Type | Dosage (kg/t) | Conditioning | Reactor | PTank | PPAU | |||||||
| USI 2 | Duration (min) | ∆T (°C) | Liquid | Solid | ||||||||
| 1 | 8.72 | C3 | 2.0 | No | 10 | 74 | 1.9 | 20.70 | 1.89 | - | - | - |
| 2 | 8.49 | C3 | 2.0 | Yes | 10 | 74 | 6.5 | 51.57 | 4.67 | 65.84 | 42.59 | 39.28 |
| 3 | 4.62 | C2 | 2.0 | Yes | 12 | 74 | 3.8 | 23.79 | 2.16 | 79.11 | 12.30 | 13.45 |
| 4 | 7.92 | C1 | 2.0 | Yes | 15 | 74 | 8 | 42.26 | 3.73 | 77.82 | 32.34 | 29.36 |
| 5 | 8.09 | C1 | 2.0 | No | 15 | 74 | 2.7 | 35.66 | 1.26 | - | - | - |
| 6 | 7.54 | C4 | 2.0 | Yes | 15 | 74 | 6.5 | 34.31 | 3.03 | 91.76 | 23.69 | 20.52 |
| 7 | 7.03 | C4 | 2.0 | No | 15 | 74 | 2.5 | 13.05 | 1.12 | - | - | - |
| 8 | 7.52 | C4 | 2.0 | Yes | 20 | 74 | 8 | 38.36 | 3.58 | 83.57 | 28.29 | 25.29 |
| 9 | 7.10 | C4 | 2.0 | No | 20 | 74 | 3.8 | 15.58 | 1.33 | - | - | - |
| 10 | 3.41 | C4 | 2.0 | No | 15 | 74 | 1.8 | 9.15 | 0.84 | - | - | - |
| 11 | 3.52 | C4 | 2.0 | No | 20 | 74 | 3.7 | 14.36 | 1.30 | - | - | - |
| 12 | 3.52 | C4 | 2.0 | Yes | 15 | 74 | 7.6 | 39.88 | 3.55 | 77.82 | 29.78 | 27.67 |
| 13 | 3.51 | C4 | 2.0 | Yes | 20 | 74 | 7.7 | 30.26 | 2.70 | 70.56 | 19.31 | 21.49 |
| 14 | 7.5 | C5 | 1.2 | No | 30 | 37 | 8 | 21.56 | 1.87 | - | - | - |
| 15 | 7.5 | C5 | 1.2 | Yes | 30 | 37 | 13.4 | 40.69 | 3.52 | 87.11 | 30.56 | 25.97 |
| 16 | 3.52 | C5 | 1.2 | No | 30 | 37 | 7.6 | 20.57 | 1.77 | - | - | - |
| 17 | 3.60 | C5 | 1.2 | Yes | 30 | 37 | 13.4 | 38.34 | 3.30 | 78.40 | 27.99 | 26.31 |
| Average amount for all tests without ultrasound irradiation | 0.19 ** | 19.38 | 1.50 | - | - | - | ||||||
| Average amount for all tests with ultrasound irradiation | 0.46 ** | 39.46 | 3.51 | 79.32 | 27.43 | 25.45 | ||||||
| Stage | SSA 1 | IMFI 2 (Tesla) | FR 3 (g/min) | RSIR 4 (rpm) | Consumed Power 5 | Weight (%) 6 | ||||
|---|---|---|---|---|---|---|---|---|---|---|
| U | L | V | A | C | M | T | ||||
| Rougher | 70 | 84 | 1.5 | 95.1 | 86 | 98.4 | 4.9 | 91.40 | 6.14 | 2.46 |
| Cleaner | 70 | 83 | 1.7 | 75 | 94.24 | 4.73 | 1.02 | |||
| Variable Name | Unit | Symbol | Levels | Statistics | ||||
|---|---|---|---|---|---|---|---|---|
| Low | High | Avg. | Min. | Max. | S.D. | |||
| pH | - | A | 3.4 | 7.6 | 5.39 | 3.41 | 7.54 | 2.04 |
| Conditioning Time 1 | min | B | 15 | 20 | 17.50 | 15.00 | 20.00 | 2.67 |
| Absorbed power 2 | Watt | C | 5 | 45 | 26.55 | 9.99 | 43.42 | 13.72 |
| Response | I i | Main Effects | Interactions and Curvature | Model | |||||||
|---|---|---|---|---|---|---|---|---|---|---|---|
| A | B | C | AB | AC | BC | A2 | |||||
| Coefficients | R2 | AP ii | |||||||||
| X0 | X1 | X2 | X3 | X4 | X5 | X6 | X7 | ||||
| Yield | 94.57 | −2.25 | 0 | 0 | 0 | 0 | 0.89 | 0 | 0.961 | 17.45 | |
| G iii | SiO2 | 92.50 | 0.79 | 0 | −1.05 | 0 | −1.46 | 0 | 6.72 | 0.926 | 8.28 |
| Fe2O3 | 0.40 | −0.058 | −0.002 | 0.071 | 0 | 0.097 | −0.008 | −0.42 | 0.999 | 72.59 | |
| Al2O3 | 2.12 | 0 | −0.028 | 0 | 0 | 0.27 | −0.072 | −1.18 | 0.980 | 15.91 | |
| TiO2 | 0.065 | −0.004 | 0.0042 | 0.0053 | −0.002 | 0 | 0.012 | 0 | 0.997 | 29.09 | |
| CaO | 2.27 | −0.48 | 0 | 0.45 | −0.048 | 0.55 | −0.11 | −2.67 | 0.999 | 31.74 | |
| K2O | 0.27 | 0.12 | 0 | 0 | 0 | 0 | 0.093 | 0 | 0.797 | 7.79 | |
| R iv | SiO2 | 97.42 | −2.62 | −0.34 | 0.56 | 0 | 0 | 1.07 | −2.52 | 0.999 | 75.54 |
| Fe2O3 | −170.46 | 39.91 | 1.18 | −47.59 | 0 | −65.34 | 5.08 | 284.47 | 0.999 | 44.20 | |
| Al2O3 | −25.71 | 0 | 1.81 | 0 | 0 | −14.89 | 3.30 | 66.14 | 0.974 | 13.92 | |
| TiO2 | 30.47 | 6.06 | −4.39 | −5.81 | 2.30 | 0 | −13.23 | 0 | 0.995 | 24.86 | |
| CaO | −366.71 | 98.02 | 0 | −92.86 | 9.96 | −111.95 | 22.29 | 548.1 | 0.999 | 33.92 | |
| K2O | 37.43 | −25.80 | 0 | 0 | 0 | 0 | −22.92 | 0 | 0.782 | 7.55 | |
| Description | Concentrate Weight and Grades (%) | Silica Recovery and Impurities Removal (%) | |||||||||
|---|---|---|---|---|---|---|---|---|---|---|---|
| wt. | SiO2 | Fe2O3 | Al2O3 | TiO2 | SiO2 | Fe2O3 | Al2O3 | TiO2 | |||
| Validation Tests | US | Ex. 6 | 91.60 | 98.00 | 0.058 | 1.23 | 0.054 | 92.56 | 62.82 | 25.69 | 43.87 |
| Ex.6-Rep.1 | 89.40 | 97.92 | 0.057 | 1.27 | 0.045 | 90.26 | 64.33 | 25.12 | 54.35 | ||
| Ex.6-Rep.2 | 91.20 | 98.10 | 0.056 | 1.19 | 0.049 | 92.25 | 64.25 | 28.42 | 49.29 | ||
| Avg. | 90.73 | 98.01 | 0.057 | 1.23 | 0.0493 | 91.69 | 63.80 | 26.41 | 49.17 | ||
| S.D. | 1.172 | 0.090 | 0.001 | 0.040 | 0.0045 | 1.25 | 0.85 | 1.77 | 5.24 | ||
| 95% PI-L | 88.44 | 97.83 | 0.055 | 1.15 | 0.0405 | 89.25 | 62.13 | 22.95 | 38.90 | ||
| 95% PI-H | 93.03 | 98.18 | 0.059 | 1.31 | 0.0582 | 94.13 | 65.48 | 29.87 | 59.44 | ||
| Nus | Ex. 7 | 94.15 | 97.7 | 0.058 | 1.38 | 0.063 | 94.85 | 61.78 | 14.31 | 32.69 | |
| Ex.7-Rep.1 | 91 | 97.55 | 0.062 | 1.35 | 0.075 | 91.53 | 60.51 | 18.98 | 22.55 | ||
| Ex.7-Rep.2 | 92.9 | 97.62 | 0.06 | 1.4 | 0.062 | 93.51 | 60.99 | 14.22 | 34.64 | ||
| Avg. | 92.68 | 97.62 | 0.06 | 1.38 | 0.067 | 93.30 | 61.09 | 15.84 | 29.96 | ||
| S.D. | 1.586 | 0.075 | 0.002 | 0.0252 | 0.0072 | 1.67 | 0.64 | 2.72 | 6.49 | ||
| 95% PI-L | 89.57 | 97.48 | 0.056 | 1.33 | 0.0525 | 90.03 | 59.84 | 10.50 | 17.24 | ||
| 95% PI-H | 95.79 | 97.77 | 0.064 | 1.43 | 0.0808 | 96.56 | 62.35 | 21.17 | 42.68 | ||
| Predicted Values | US | Ex.6-Pred. | 91.83 | 98.07 | 0.0578 | 1.24 | 0.0545 | 92.54 | 63.03 | 23.74 | 43.08 |
| 95% CI-L | 90.94 | 97.78 | 0.0517 | 1.14 | 0.0507 | 92.20 | 55.76 | 17.65 | 37.64 | ||
| 95% CI-H | 92.73 | 98.36 | 0.0639 | 1.33 | 0.0584 | 92.87 | 70.30 | 29.83 | 48.52 | ||
| 95% PI-L | 90.21 | 97.63 | 0.0489 | 1.09 | 0.0485 | 92.03 | 52.36 | 13.79 | 34.61 | ||
| 95% PI-H | 93.46 | 98.51 | 0.0668 | 1.39 | 0.0605 | 93.04 | 73.70 | 33.68 | 51.55 | ||
| Nus | Ex.7-Pred. | 93.41 | 97.79 | 0.0567 | 1.37 | 0.0624 | 94.78 | 62.73 | 15.24 | 33.59 | |
| 95% CI-L | 92.68 | 97.54 | 0.0506 | 1.26 | 0.0588 | 94.45 | 55.46 | 8.16 | 28.45 | ||
| 95% CI-H | 94.13 | 98.03 | 0.0628 | 1.48 | 0.0660 | 95.12 | 70.01 | 22.32 | 38.72 | ||
| 95% PI-L | 91.87 | 97.37 | 0.0478 | 1.21 | 0.0566 | 94.28 | 52.06 | 4.66 | 25.31 | ||
| 95% PI-H | 94.94 | 98.20 | 0.0657 | 1.53 | 0.0683 | 95.29 | 73.41 | 25.82 | 41.86 | ||
© 2016 by the authors; licensee MDPI, Basel, Switzerland. This article is an open access article distributed under the terms and conditions of the Creative Commons Attribution (CC-BY) license (http://creativecommons.org/licenses/by/4.0/).
Share and Cite
Haghi, H.; Noaparast, M.; Shafaei Tonkaboni, S.Z.; Mirmohammadi, M. A New Experimental Approach to Improve the Quality of Low Grade Silica; The Combination of Indirect Ultrasound Irradiation with Reverse Flotation and Magnetic Separation. Minerals 2016, 6, 121. https://doi.org/10.3390/min6040121
Haghi H, Noaparast M, Shafaei Tonkaboni SZ, Mirmohammadi M. A New Experimental Approach to Improve the Quality of Low Grade Silica; The Combination of Indirect Ultrasound Irradiation with Reverse Flotation and Magnetic Separation. Minerals. 2016; 6(4):121. https://doi.org/10.3390/min6040121
Chicago/Turabian StyleHaghi, Hamed, Mohammad Noaparast, Sied Ziaedin Shafaei Tonkaboni, and Mirsaleh Mirmohammadi. 2016. "A New Experimental Approach to Improve the Quality of Low Grade Silica; The Combination of Indirect Ultrasound Irradiation with Reverse Flotation and Magnetic Separation" Minerals 6, no. 4: 121. https://doi.org/10.3390/min6040121