Heap Leaching of Caliche Ore. Modeling of a Multicomponent System with Particle Size Distribution


1
Mining Technological and Scientific Research Center (CICITEM), Antofagasta 1240000, Chile
2
Department of Chemical and Mineral Process Engineering, Universidad de Antofagasta, Antofagasta 1240000, Chile
3
Department of Chemical Engineering, Royal Institute of Technology, SE-100 44 Stockholm, Sweden
*
Author to whom correspondence should be addressed.
Minerals 2017, 7(10), 180; https://doi.org/10.3390/min7100180
Submission received: 3 August 2017
/
Revised: 10 September 2017
/
Accepted: 20 September 2017
/
Published: 26 September 2017
(This article belongs to the Special Issue Heap Leaching: The State-of-the-Art)
Abstract
:Caliche is a mineral exploited in northern Chile, from which iodine and Nitrate salts (saltpeter) are obtained. This ore is the most important source of iodine in the world and is processed mainly by heap leaching using water as a leaching agent. Heap leaching of caliche ore is carried out by the stacking of ROM (Run-Of-Mine) material, where the particle size distribution covers a wide range, from a few millimeters up to several decimeters, even diameters about 1 m. During the leaching, the multiple soluble species of caliche, which can reach total fractions larger than 40%, are dissolved at different rates, mainly controlled by their solubilities. When it occurs and unlike most other leachable ores, the particle size diminishes. The leaching modeling of several soluble species of caliche has been recently addressed; however, one of the main assumptions is the idealization that the heap is composed of particles of the same size. The present work aims to complement the previously formulated phenomenological models for caliche ore leaching, through a model that considers the simultaneous dissolution of two species from caliche with three different particle sizes. These two water-soluble species have different solubilities and dissolution rates and the conceptual model considers that both species are dissolved at the particle surface. When the most soluble species is being depleted, the particle collapses, leaving a remaining fraction of the less soluble species together with insoluble material. The less soluble species is now being dissolved from the collapsed material. This article also includes the experimental verification of the conceptual model using data obtained from column leaching tests conducted for this purpose, focusing on the dissolution of two soluble species: Nitrate and Magnesium.
1. Introduction
Caliche is a general term used for several sedimentary rocks impregnated with soluble salts, which are found worldwide, such as Australia, USA, Saudi Arabia and Chile [1,2]. The Chilean caliche has a particular soluble composition: Gypsum, Halite, Nitrates (saltpeter) and Iodate; Nitrates are used in the elaboration of fertilizers and iodate in industrial additives and medical supplies [3,4]. In Chile, the caliche ore is exploited exclusively in the northern regions (Figure 1), extracting the ore from an intermediate mineral layer located at about 1 m deep, which is removed by blasting or mechanical means [5,6,7].
Heap leaching is a process that has allowed the extraction of many valuable minerals (metals and non-metals) around the world, maintaining the economic sustainability of mining operations since it is a hydrometallurgical technique that can process large amounts of low ore grades [8,9,10]. Depending on the mineral characteristics, the ore may be crushed or ROM (Run-of-mine, i.e., without comminution) and piled in heaps. Subsequently, the bed is irrigated with leaching agents (acid, water, intermediary solutions) that dissolve solids contained in the ore, carrying to a liquid phase named as leached or pregnant solution [11]. In the case of caliche, the ore processing is conducted in ROM heaps of about 10 m height and leached with water (fresh or seawater) during long periods of time. At present, the concentration of the soluble species in the caliche is low if compared with the concentration found several years ago. The concentration of valuable species iodine and Nitrate, is low (Iodine: 0.3 kg/t and Nitrate: 80–100 kg/t) [5]. This means that a large volume of caliche must be processed, in which heap leaching is a very good alternative. In addition, energy requirements are reduced by using this process; all take place at ambient temperature and, for recovering of the Nitrate salts, solar evaporation is used. Due to the high number of soluble species that caliche has, the dissolution occurs simultaneously for more than one species, which are usually dissolved at different rates, governed by their solubilities [12]. Depletion of the abundant species influences the releasing of another species, which produce physical changes in the particles that can result in an increase of the porosity that finally causes the breakdown of the particles. Moreover, chemical interactions may occur by the common ion effect, provoking the precipitation of some salts within the heap [13].
As heap leaching is a process that involves many physical and chemical aspects (dissolution, diffusion, convective and dispersive transport, chemical reactions, among others), it is difficult to understand integrally; therefore, its analysis has not been traditionally addressed by a scientific approach [9,14]. However, the use of mathematical models has allowed the systematic study of the heap leaching, which is used for simulating, designing and optimizing the process [15,16,17,18,19]. The modeling of heap leaching has focused mainly on the processing of metallic ores, but recently efforts have been conducted to represent the leaching of non-metallic ores. Specifically, for caliche, the first modeling approach was proposed by Valencia et al. [12], who modeled independently the recovery of Nitrate and Magnesium by empirical kinetic expressions that were fitted through column experiments. Gálvez et al. [20] described and compared two models: a phenomenological and hybrid one (also known as empirical knowledge-based models), based on expressions described previously [12,16]. Subsequently, Ordóñez et al. [13] conducted experiments of column leaching and provided data used to validate the earlier proposed models.
The representation of the heap leaching by modeling is a hard task and, usually, several assumptions are required. In the literature, some of the frequent approximations that can be reviewed are the homogeneity of the physical and chemical properties of the ore, as: particle shape and size, particle and bed porosity, mineral density, chemical and mineralogical composition, among others [18,21,22]. Generally, the leaching models are described for a single species dissolution, since the process is focused on a target species, which is adequately valid for metallic ores; however, in the processing of several ores, and strongly evident in the case of non-metallic minerals like caliche, the leachable species are multiple, which dissolve at different dissolution rates and have different solubilities, so the assumption of single-species particles is not appropriate for the leaching of this type of minerals. In this sense, ultimately, Moreno et al. [23] developed improvements on the phenomenological model formulated and validated in previous works, surpassing the assumption of a single-species dissolution and allowing for representing the simultaneous leaching of two soluble species from caliche.
The leaching of caliche ores is in ROM heaps, which means that very little comminution is performed on the mineral before its stacking. Leaching of ROM material results in a wide range of particle sizes within the heap and, therefore, the recovery of target species would be influenced by the particle size [24]. No water flow takes place within the particle, and leaching is occurring mainly at the particle surface; the water is transported into the particle preferentially by capillary transport. The heap leaching modeling frequently considers an average value for the particle size, in order to simplify the model formulation. However, regardless of the averaging procedure (volumetric or superficial based radius), the level of representation of the particle size will be not acceptable [25], and this will be very critical if ROM heaps are modeled since the particle sizes vary in a wide interval.
The objective of the present work is to develop a general phenomenological model that allows understanding in a better way some of the processes that occur in the leaching of soluble ores, under a more realistic view. This is done considering the simultaneous dissolution of multi-species that have different dissolution rates and solubilities and assuming that the ore is composed of particles of several sizes. In order to keep the modeling within reasonable levels, only two soluble species and three particle sizes are considered. Additional to the modeling approach and with the objective to demonstrate the applicability of the model, the simultaneous dissolution of Nitrate and Magnesium during caliche heap leaching is validated, addressing the experimental data obtained from column leaching experiments, which are loaded with known particle size distributions.
2. Materials and Methods
2.1. Caliche Ore and Leaching Solution
The experimental tests were carried out using caliche ore obtained from Northern Chile (Tarapacá region), which has a soluble fraction around 50% and whose chemical and mineral compositions are shown in Table 1. The most abundant soluble species forming caliche are sulfate, sodium, chloride and Nitrate. Sulfate and Sodium are present as many water-soluble minerals, while chloride is only in the form of Halite and Nitrate shared as Nitratine and Humberstonite. Iodine is the most valuable species of caliche, but it does not appear in the mineralogical profile due to its low relative quantity, only 0.03%. It has been reported that iodine speciation in caliche is in the form of Calcium iodates and double salts with Sulfate, such as: Lautarite (Ca2(IO3)2), Bruggenite (Ca2(IO3)2·H2O) and Hectorfloresite (Na9(IO3)(SO4)4) [26]. Regarding the insoluble fraction, it is mainly composed of Quartz and other silicates, such as: Albite and Orthoclase. The mineralogical composition was determined by X-ray diffraction (Siemens D5000, Siemens Corporation, New York, NY, USA).
By a Backscattered Electron Image (BSE) and Energy-Dispersive X-ray Spectroscopy (EDX) (Tescan LYRA 3, Tescan Systems, Brno, Czech Republic), the mineral was studied, visualizing the soluble species that are present in caliche prior to leaching. In the EDX profiles (Figure A1 and Figure A2, shown in Appendix A), nitrogen does not appear because it is outside of the equipment detection limit, but, crosschecking the information, the same samples were specifically analyzed by X-Ray Diffraction (XRD), where the presence of Nitrate species were confirmed. The main mineral species present in of the rocks are Quartz, Halite and Nitratine—in smaller proportions, Glauberite, Bloedite, Loeweite and Anhydrite. From the BSE-EDX analysis, the dominant species were Quartz, Plagioclase, K-feldspar and Clays. Sulfates and Nitrates are present as Nitratine, Loeweite-Bloedite, Glauberite, Polyhalite and Darapskite. Figure 2 shows the visualization of the soluble species in caliche by a backscattered electro image, which has not been reported in the literature before, and gives a useful idea of how the minerals are naturally spread in the ore. It was possible to confirm that several species tend to be arranged in associations. Among the most common mineral associations, Nitratine is associated with Halite (Figure 2a), while Loeweite with Bloedite/Darapskite (Figure 2) and Glauberite with Nitratine/Anhydrite.
The leaching agent used in the experiment was seawater, obtained from the coast of Northern Chile (Antofagasta region) through a submarine outfall. The water was filtered using a 0.2 μm pore-diameter membrane and irradiated with UV light to avoid the algae growth. The main constituents of the used seawater are shown in Table 2, where Sodium and Chloride are the most abundant species.
Density was estimated by picnometry. Sodium, Magnesium and Potassium were determined by atomic absorption spectroscopy (Varian 220 FS), Chloride and Iodate were quantified by volumetry, Sulfate by gravimetry and Nitrate by UV molecular absorption spectroscopy (Unicam UV2).
2.2. Granulometry and Composites
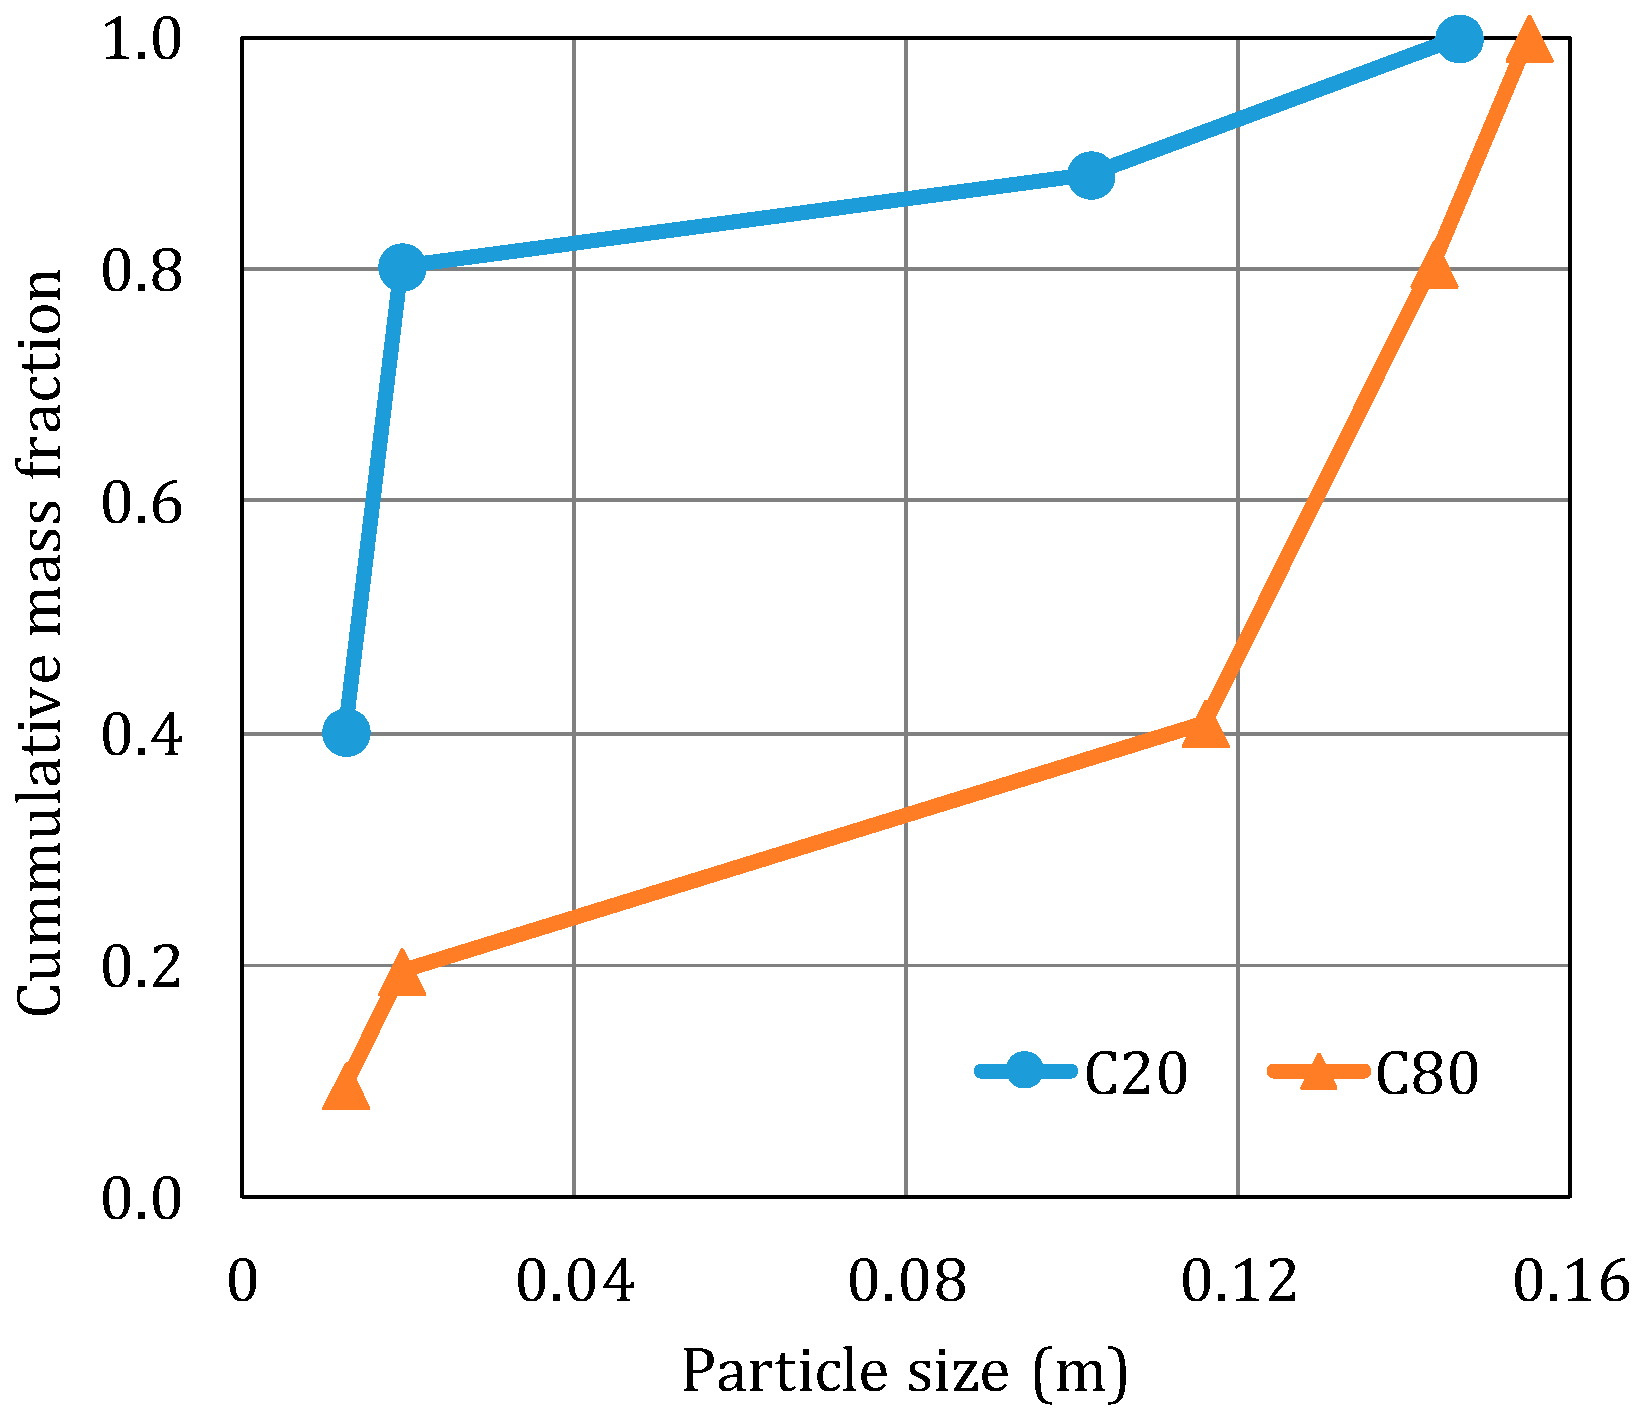
The granulometry used for each column was different; one of them was prepared mixing 20% of coarse and 80% of fine caliche (C20, coarse material in 20%) and the other prepared inversely, with 80% of coarse and 20% of fine mineral (C80, coarse material in 80%). The granulometry of the resulting composites that are loaded in the columns is shown in Figure 3.
The distribution of particle size in a column experiment would be expected to be between the frames denoted by the distributions tested in this work. The proportions 80/20 and 20/80 were chosen to give a good contrast for the leaching of fine and coarse materials. Since in a real heap of caliche ROM material is used, it is then expected that the difference between the fractions would be larger.
2.3. Leaching Tests
Two leaching experiments were performed in columns of 0.2 m in diameter, for 20 days. Seawater was fed continuously by a peristaltic pump with an irrigation rate of 4 L/h/m2. To keep the seawater free of algae, the leachant container was covered with a black cover.
The different composites of caliche were loaded in batches to avoid its stratification; the coarse material was first distributed along the column and then the fines were loaded in the surroundings. The C20 column had more fine particles, thus the loading was more homogeneously distributed. On the contrary, the C80 column used a lesser fraction of fine particles, resulting in a bed with many voids (higher porosity). Detailed information about the column loading is shown in Table 3.
The outlet solution was collected at the column bottom and the cumulated liquid was removed every 12 h for the first five days; then, the interval of sampling was increased to 24 h until the end of the experiments. Additionally, solid samples of caliche before loading and from the residues obtained from the drained columns were taken and analyzed for both mineral and chemical composition, the latter by dissolution of the solids in distilled water.
Some parameters used in the model as porosity and water fraction were determined experimentally. For determining the water fraction in the column during leaching, once the irrigation was started, the delay time between the start of wetting and the moment of the arrival of the first leachate was measured and used to calculate the volume of seawater that is retained in the column (). The initial apparent porosity () was estimated measuring the total volume of the column occupied by the caliche including the voids (area × height). The volume of the caliche is determined assuming a mineral density equal to 2300 kg/m3, according to previous physical characterization studies [27].
2.4. Phenomenological Model
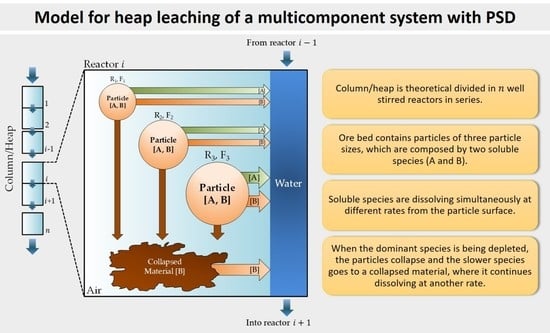
The proposed model considers a material composed of three particles sizes (small, intermediate and large particles). Therefore, the raw material is described by three radii: , , and and three mass fractions: , , and . It is also assumed that the ore is composed only by two soluble species: A and B, which have different solubilities: and , different dissolution rates: and , and mass fractions in the ore: and . A third component that is insoluble is also included with a mass fraction of ). It is considered that when the species with the highest solubility and dissolution rate, i.e., A-species, dissolves from the particle surface, the outer part of the particle simultaneously collapses. The collapsed material is composed of the fraction of the less soluble species, B-species, which has not been dissolved in the particle surface and the insoluble fraction. The dissolution of the B-species continues in the collapsed material simultaneously with the dissolution from the particle surface, but with another rate that is controlled by the coefficient .
The dissolution rates are defined in an intrinsic way; this implies that the coefficients are independent of the contact area between the dissolving agent and the amount of species on the particle surface. A-species is more soluble () and has a higher dissolution rate () than B-species.
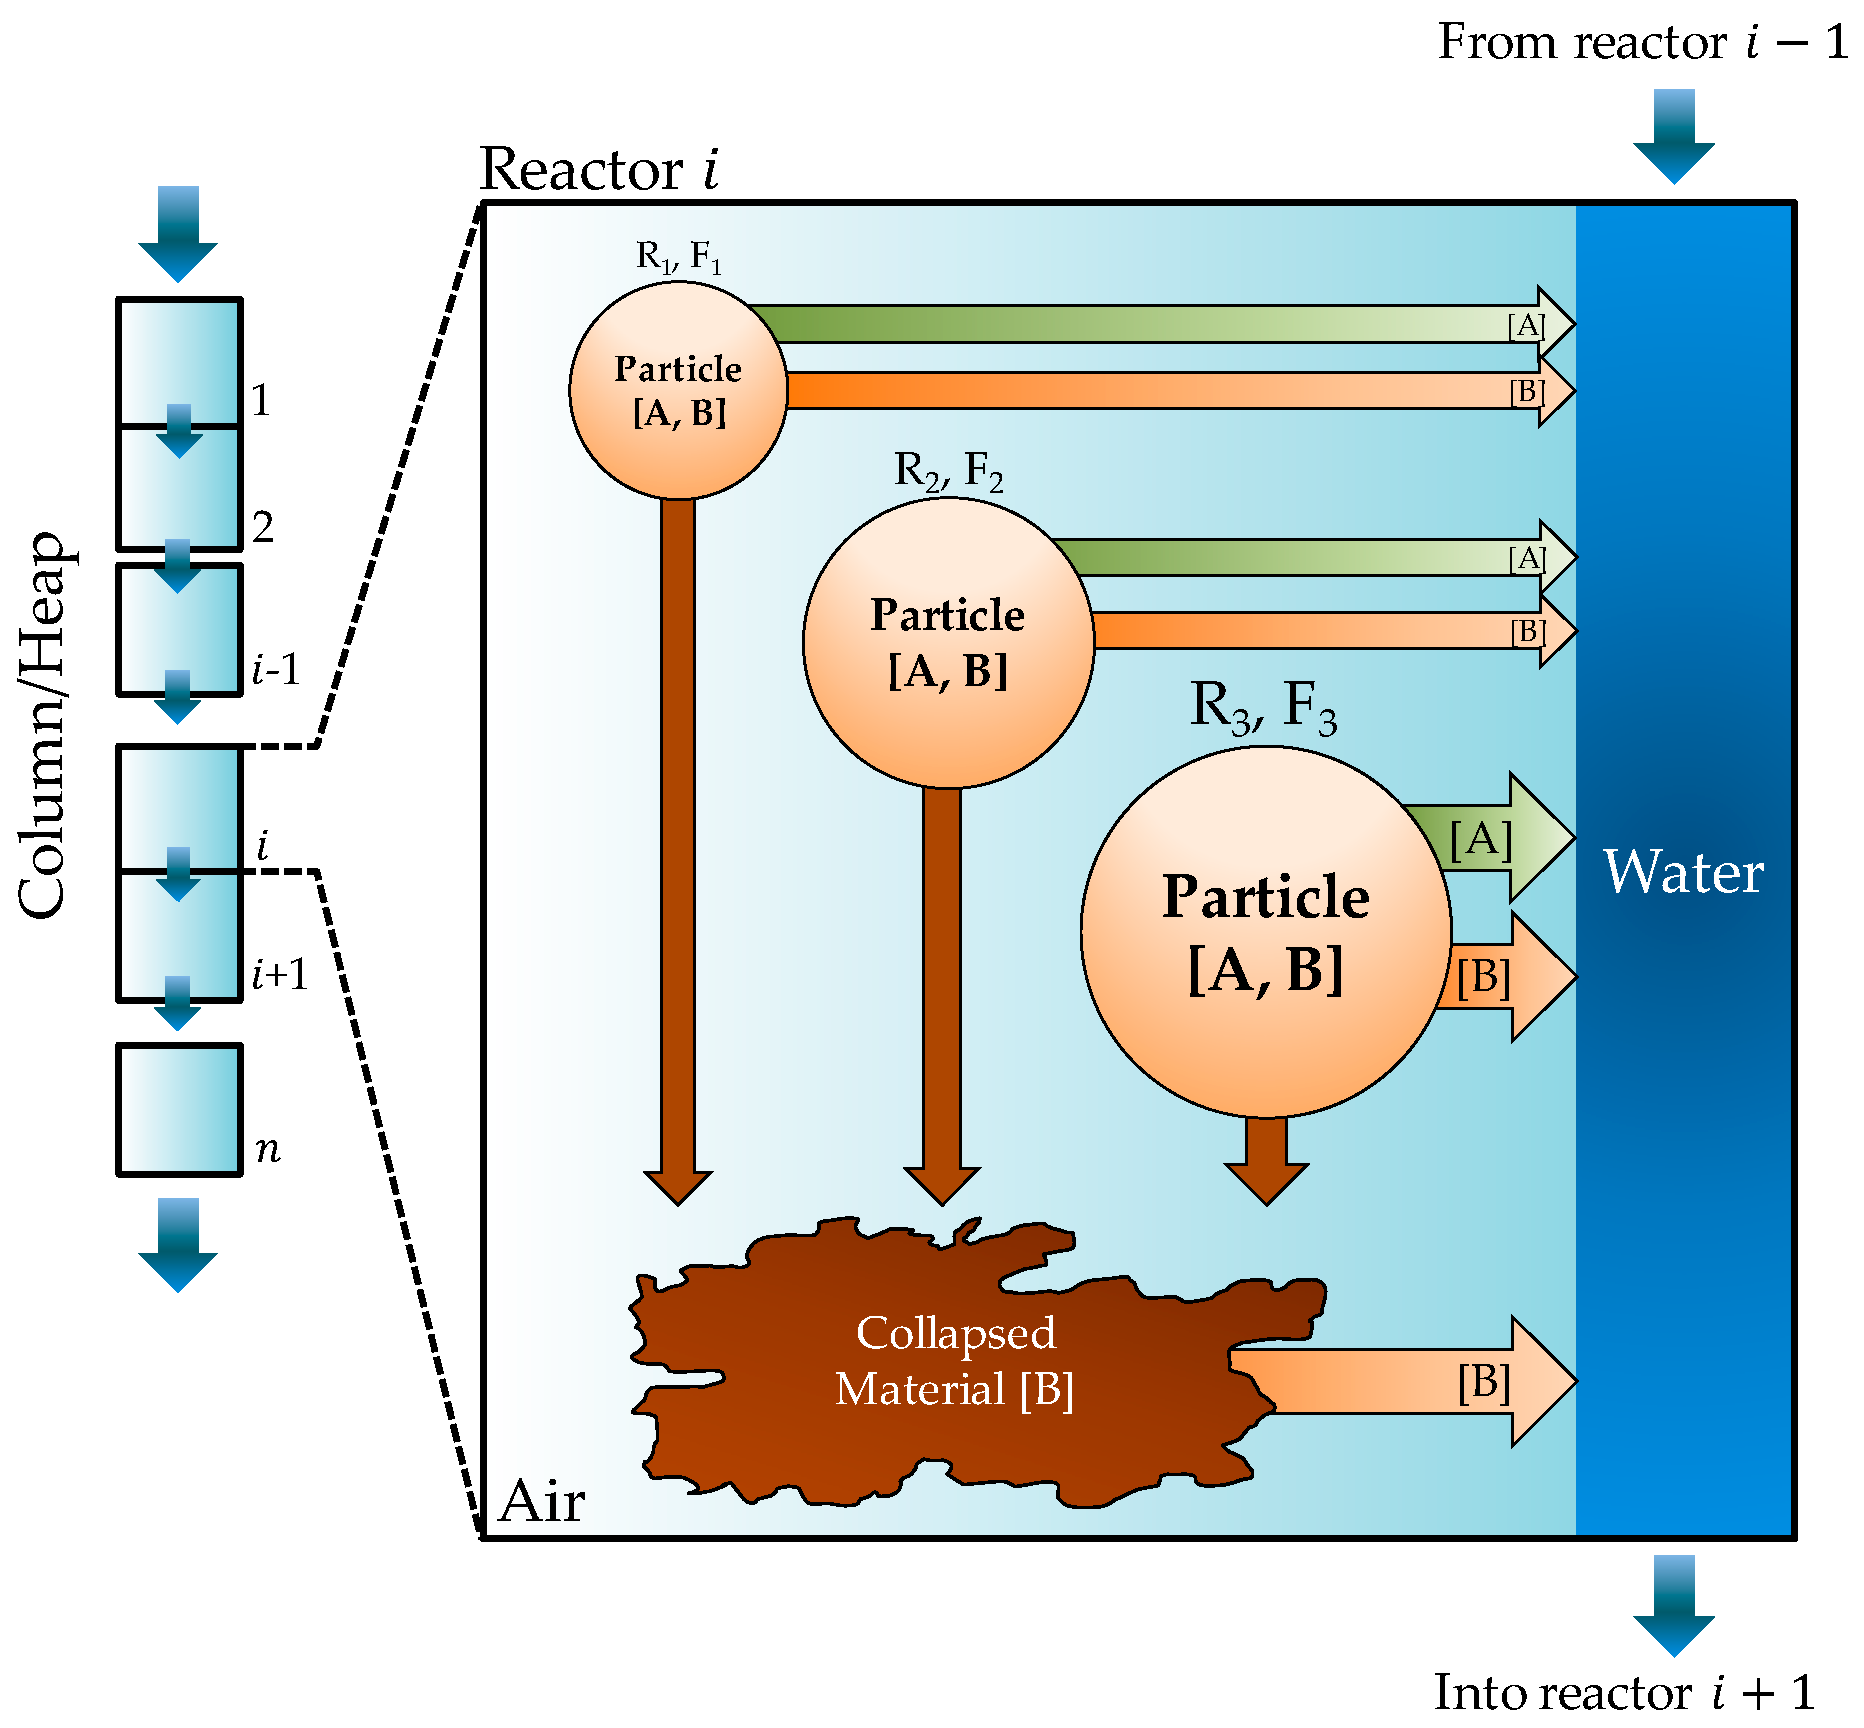
For calculation purposes, the column is divided in well stirred reactors in series filled with spherical particles of the three different sizes with its respective mass fractions. Figure 4 represents schematically the process of ore leaching carried out in a given reactor (reactor ), following the mechanisms defined in the proposed phenomenological model. Vertical arrows at the top and the bottom of the reactor indicate the flow of solution from the upstream reactor and the flow to the downstream reactor, respectively. From each particle type, A- and B-species are dissolving into the flowing fluid, denoted by the horizontal arrows. When A-species is dissolving at the particle surface, the undissolved fraction of the B-species and the inert material are removed and collapsed material is formed in the reactor. This is indicated by the dark vertical arrows between particles and collapsed material. Finally, the horizontal arrow at the bottom shows the dissolution of the B-species from the collapsed material into the flowing fluid.
The dissolution process of the soluble species is conceived in two stages: (i) wetting of bed and (ii) leaching. In the first part, the leaching agent contacts the dry material and a fraction of the porosity of the reactor starts to fill with leachant from the upper reactor and flow into the lower reactor along the column. Once solution containing dissolved species goes out of the reactor, the leaching is considered started.
The variation of the particle size with time in the reactor for each particle type (denoted in general form with the subscript ) is based on a mass balance for the rapidly soluble A-species. Since the dissolution rate of the A-species is proportional to its abundance, , the decreasing rate of the particle radius, , is independent of the fraction of the rapidly soluble species. Therefore, the variation of the particle radius in the small reactor is given by Equation (1), where mineral density, , and bed porosity, , are assumed constant:
An important condition to produce the particle collapsing at those zones where the A-species has been depleted is that its mass fraction was sufficiently large. The variation of the A-species concentration in the solution is determined by a mass balance in each of the small reactors, represented by Equation (2). The first term of the right-hand side represents the transport by flow from the reactor into the reactor and the transport by flow from the reactor into the reactor downward and the second one is the source term, i.e., the material that is dissolved from the particles of that reactor. represents the theoretical number of particles contained in the reactor and is calculated as the quotient between the initial total volume of the particles with a size in the reactor and the initial volume of the particle . In addition, is the mass fraction of each particle type:
In the same way, the concentration of the B-species is calculated in the same way as for the A-species, by the mass balance, presented in Equation (3), where, as in Equation (2), there is a first convective and a second source term. However, in this case, the source term requires the consideration of two components: the B-species dissolving from the particle surface, similar to the source term in Equation (2) and the B-species dissolving from the collapsed material. represents the collapsed mass of B per unit of area in the reactor :
In Equation (3), is the dissolution rate for the B-species contained in the collapsed material, and it is expressed as the mass fraction dissolved by unit of time. A mass balance of the B-species in the collapsed material is also needed, which is determined by Equation (4). In this expression, the first right-hand side term considers the B-species that is in the particle before its collapse, and the second one is the B-species that is dissolving from the particle. The difference of both terms gives the input rate of the B-species into the collapsed material. If the concentration of the B-species in the solution reaches its solubility, no dissolution takes place and the total mass of the B-species remaining in the particle is added to the collapsed material. The last term corresponds to the B-species that is dissolving from the collapsed material. Note that is the mass of B-species in the collapsed material per unit of area:
The heap height decreases when the A- and B-species are dissolving and transported away from the reactor. Through a mass balance, and assuming that the porosity of the column does not change with time, the height of the reactor is calculated, taking into account the initial reactor height, , the mass fractions of the A and B-species, and the material that collapsed (Equation (5)):
In the model, the particle radius is an important parameter that varies along leaching. When the particles totally collapse, the value of the radius is zero. In the case of the reactor height, when all soluble material is dissolved, including from the collapsed material, the final value is given by the volume of the insoluble fraction (). Regarding the programing task, the system of ordinary differential equations [1,2,3,4] was solved in Matlab® software (Matlab 2017a, Mathworks Inc., Natick, MA, USA) by using the ordinary differential equation package. In order to get stability in the calculation program, conditional statements were included, where negative values for the particle radii and concentrations are not allowed. The initial conditions declared to solve the equations are , , and .
3. Results
The results were arranged in three subsections: (i) column leaching results, which addresses the dissolution behavior of the most soluble species and contributes with experimental data for the the next subsection; and (ii) model simulation and verification, where the experimental outlet concentrations are compared with the simulations, obtaining fitted kinetic parameters. Finally, (iii) comparison between the use of particle size distribution (PSD) or some average particle radius in the model performance.
3.1. Column Leaching Experiment
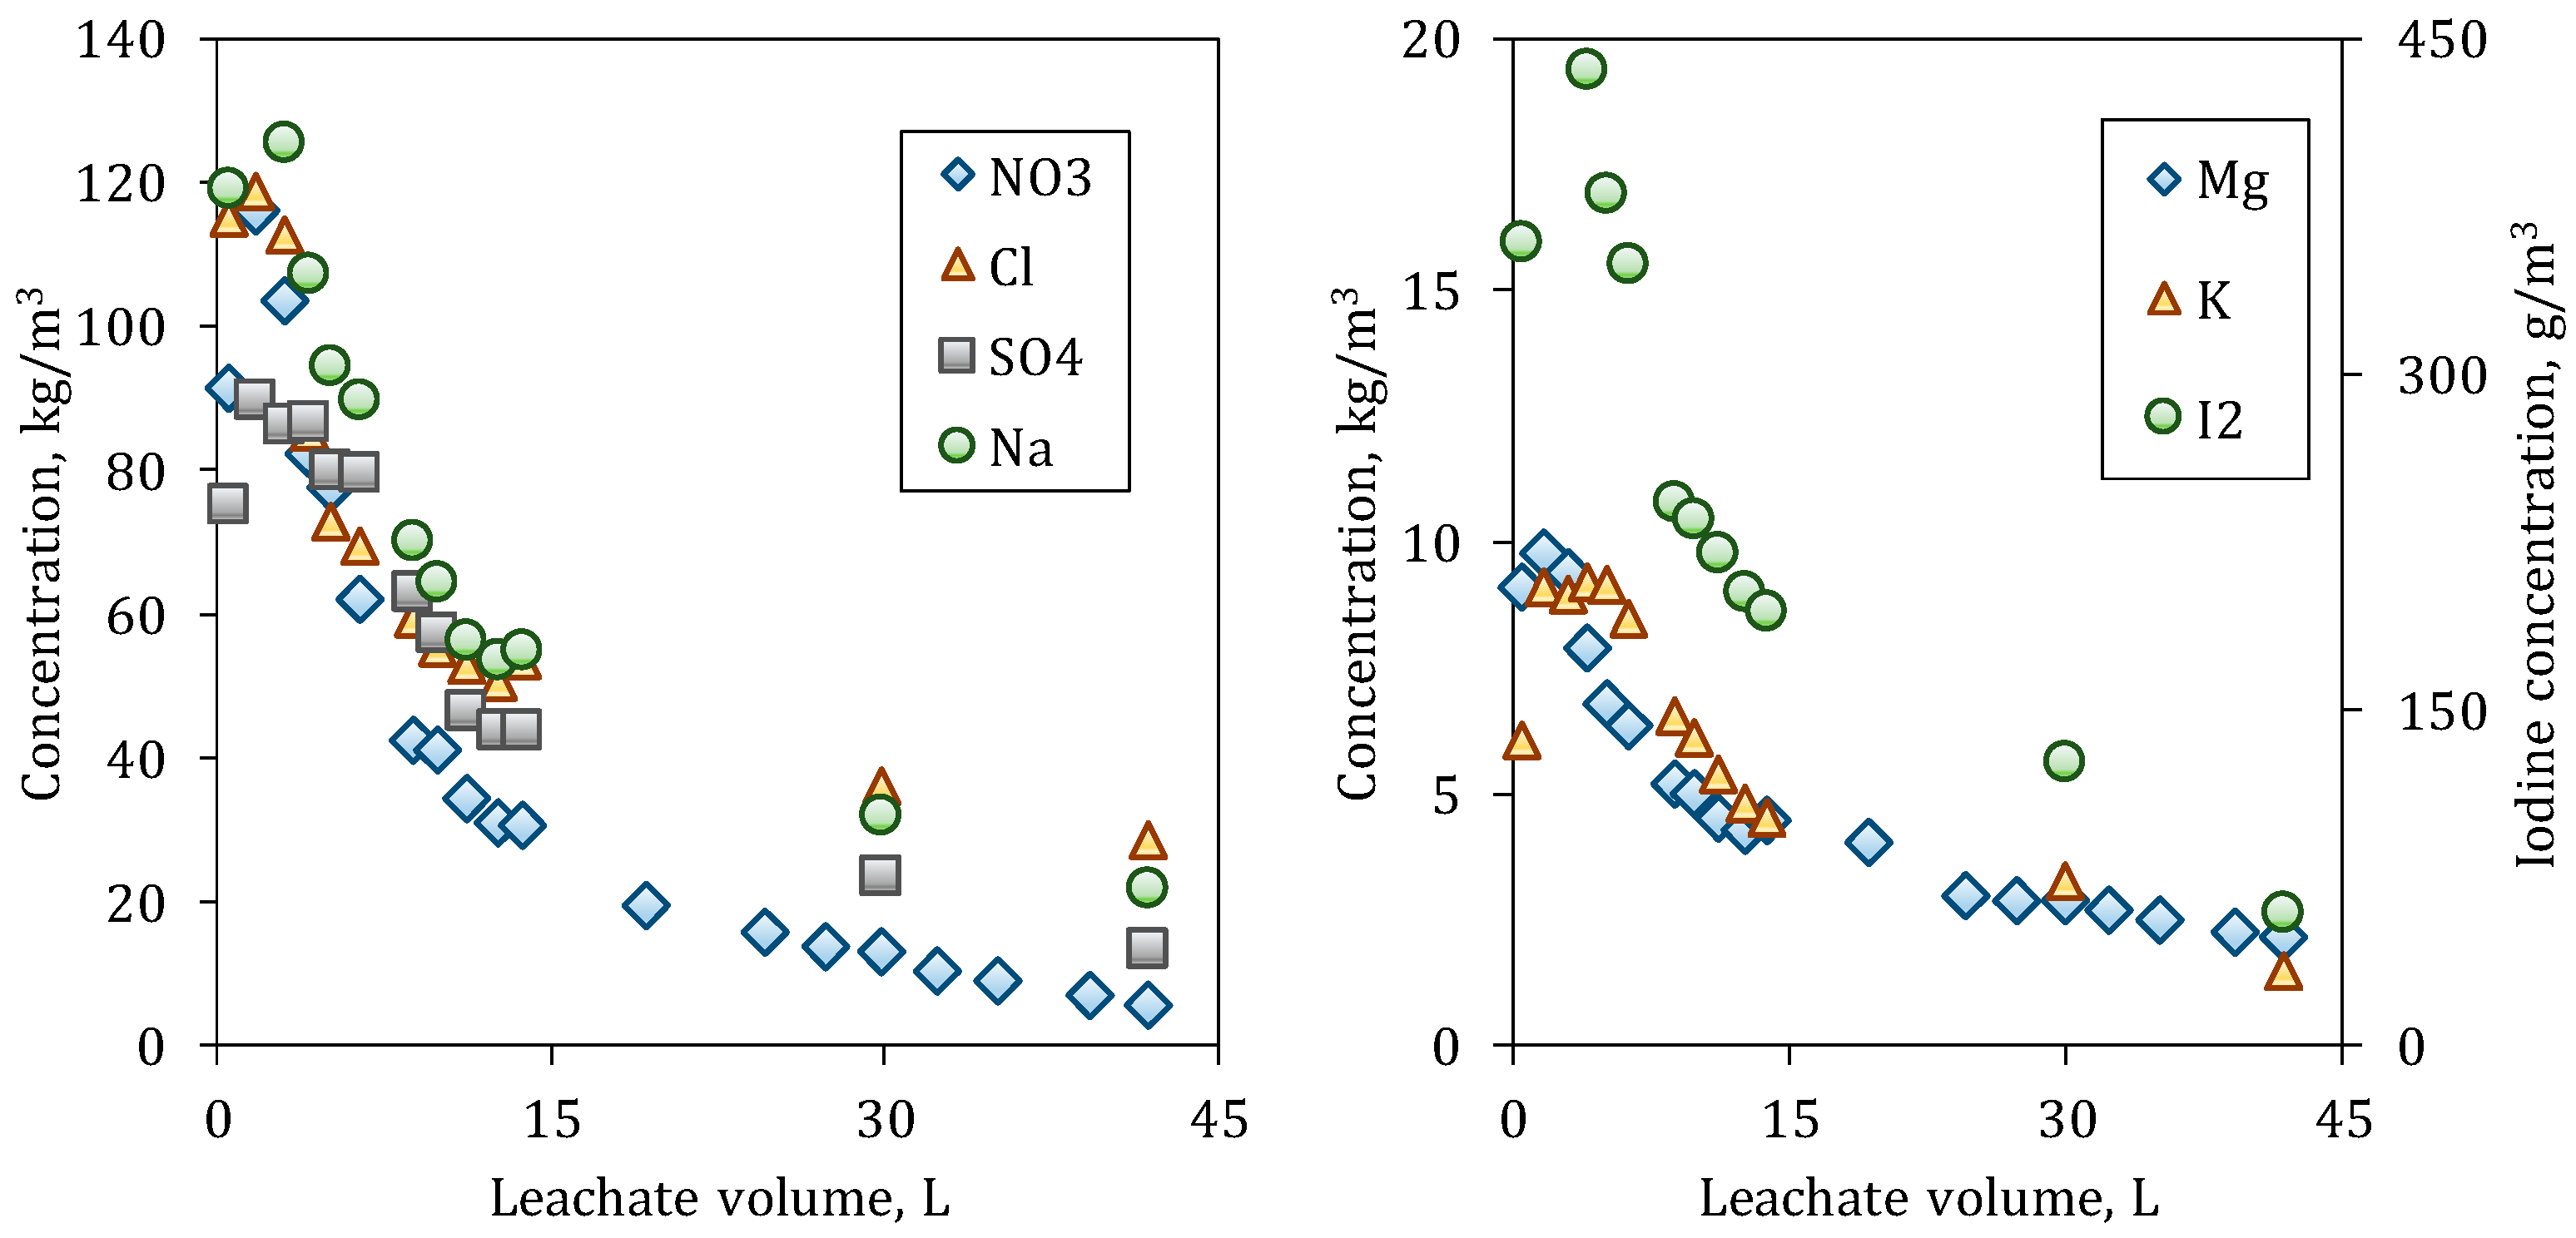
The outlet concentration of different soluble species was followed during the leaching period, which was represented as the cumulative volume of percolate that was received at the bottom of the column during a given time. This interval was initially 12 h and later was increased to 24 h. However, the number of samples analyzed was different for the different species. The larger number of analyzed samples was for Nitrate and Magnesium; for the other species, the analysis was scarcer.
As can be observed in Figure 5 and Figure 6, the species with the largest dissolution are Nitrate and Sodium. The initial outlet concentration for all the species from the C80 column is less than those values from C20. During the dissolution of the species at C20, a more abrupt drop in concentrations is observed than at C80. This occurs because of the particle size distribution of the bed, since C20 has initially a larger particle surface caused by the greater number of fine particles, which are dissolved/depleted at short times.
Most species in C20 reach the levels of the seawater (leachant) at the end of the experiment, while, in C80, the ion concentrations are still decreasing, even Nitrate, which is the most soluble species. For Sulfate, the outlet concentrations are similar at the beginning in both columns, since it is less soluble and saturation may exist in the interior of the columns; therefore, the particle size does have a smaller influence.
3.2. Model Verification
To obtain simulated data from the model, the bed was divided into 11 small and equal reactors, which are initially loaded with the same mass of caliche and leached with seawater, whose composition is shown in Table 2. In order to simulate the leaching of the A- and the B-species in a wide scenario, the granulometries (particle sizes and mass fractions) were the same as those used in the experiments (Figure 3). Other input parameters, such as the irrigation rate, initial column height and solubilities, used in the simulations are listed in Table 4.
The outlet concentrations of A- and B-species at three different depths into the column, , were considered, where the output of the eleventh reactor corresponds to the bottom of the column. In real situations, the viability of tracking species at different depths of the heap is difficult and usually depends on the use of high-tech devices. However, by using a validated expression, it is easier to give an idea about the leaching progress, considering also that the particle radius of each particle type, the column height and the mass of collapsed material can be also theoretically followed. The model is a useful tool to understand the processes that are taking place within the heap.
As shown in Figure 7, if the interior of the column is considered, the concentrations of both species at the top are higher because the dissolution progresses from top to bottom, limited by the dissolution rate of each species. The solubility of the species is not by itself important for Nitrate and Magnesium, due to that both species are highly soluble. In the first reactor, the depletion grade is at the maximum, and increasingly less important in the subsequent reactors; the differences between the A- and B-species are notorious.
Due to the dissolution of the A-species being carried out exclusively on the particle surface, its concentration at the bottom of the column is high in the first part of the leaching, since the A material is always available to be leached. The concentration decreases relatively fast given its high solubility, especially in the upper part of the column, where the levels fall at the seawater concentration before 150 h for a fine material bed and 450 h for a coarser bed. In the other way, the dissolution behavior of the B-species is notoriously different than for the A-species, its dissolution rate being slower than A.
Although the granulometry apparently has an important effect on the dissolution behavior, it is different for each species. Thus, the dissolution of the B species is less sensitive to the particle size than the A-species; this may be attributed to the fact that B-species is dissolved simultaneously from the particle but also from the collapsed material.
The model considers three adjustable parameters that are related to the dissolution kinetics of each species from the particle surface and from collapsed material (in case of B-species); these kinetic parameters are: , and . In the simulations, values of the , and were fitted by the least squares method, minimizing the difference between the experimental concentrations observed for Nitrate and Magnesium in the samples of each column and the simulated concentrations obtained by the integration of Equations (2) and (3). The abundance of the species in the loaded caliche and a factor of scale that is related to the liquid transport into the columns were also considered.
Table 5 shows the kinetic constants adjusted to the experimental data of this work, which are related to properties of the fluid and the solid such as viscosity, diffusivity, irrigation rate and particle size. Comparing the values of the C20 column with those obtained in [23], which are operated under comparable conditions and similar granulometry, the orders of magnitude resulted similarly, despite the fact that the reference model did not include the PSD component. Differences between the values are expected, due to the heterogeneous characteristics of the mineral and the experimental fluctuations that happen in pilot experiments.
On the other hand, by increasing the mean particle size of 1.4 cm for C20 to 12.2 cm in C80, it can be seen in the fitting of the kinetic constants that both and increase almost three times, which would indirectly be realized for the abundance of the species in the particles of the mineral. On the other hand, does not behave in the same way, decreasing 10 times for the column loaded with more coarse particles. This difference can be attributed to a compensatory effect of increasing the and values, which are the most influential constants of the model, so, if the rate of dissolution of the species increases from the particle, less material would be available to be leached from the collapsed material.
To validate the model and obtain the fitted value of the kinetic parameters, the general species A- and B- were assigned to Nitrate and Magnesium, respectively. The simulated outlet concentrations from the reactors for both ions were then compared with their experimental results at the bottom column. In general, the fitting process was acceptable, and only small differences were observed. In the case of Nitrate, the concentration drop is well captured at the initial times (Figure 8a); however, for Magnesium, the fitting is less adequate (Figure 8b). It can be explained by the multiple mineralogical sources of Magnesium, which have dissimilar solubilities. The model cannot address this situation since it supposes a single source of each ion. Moreover, the dissolution of B-species is determined by two sources: from the particle surface and from the collapsed material.
Due to the central focus of the model being the determination of concentrations of soluble species, the assumptions for the calculation of the column height were very simplified (Equation (5)). For this, its approximation by the model could only be observed at the end of the test and not during its course. One of the empirical observations that makes the monitoring of height in the column tests difficult is the non-traceable variation of the bed porosity, since voids formed upon dissolution of the particles are not immediately filled by the collapsed material or by smaller particles, due to a temporary entrapment effect on the bed; a large void is present at the initial times. On the other hand, both and cannot be measured experimentally, and, due to an actual leaching, the particles do not keep their structures and collapse when a part of the soluble species has been depleted. No particles can be clearly observed after a moderate progress of the leaching. Therefore, the quantification of the collapsed material is impossible, since no differentiation between early-destroyed particles and collapsed material is feasible to achieve. For this reason, we highlighted that the model requires an idealization of the system.
3.3. Comparison of Actual PSD and Average Radii
In this section, we try to find a unique average radius that could adequately represent the dissolution process. Two different average radii were tested: (a) the Sauter radius, based on the surface area of the particles (R32), which increases the contribution of the small particles since they have a high specific area and (b) the De Broukere radius, based on the volume of the particles (R43), which increases the contribution of the large particles since they have a large volume. The values used in these simulations are shown in Table 6.
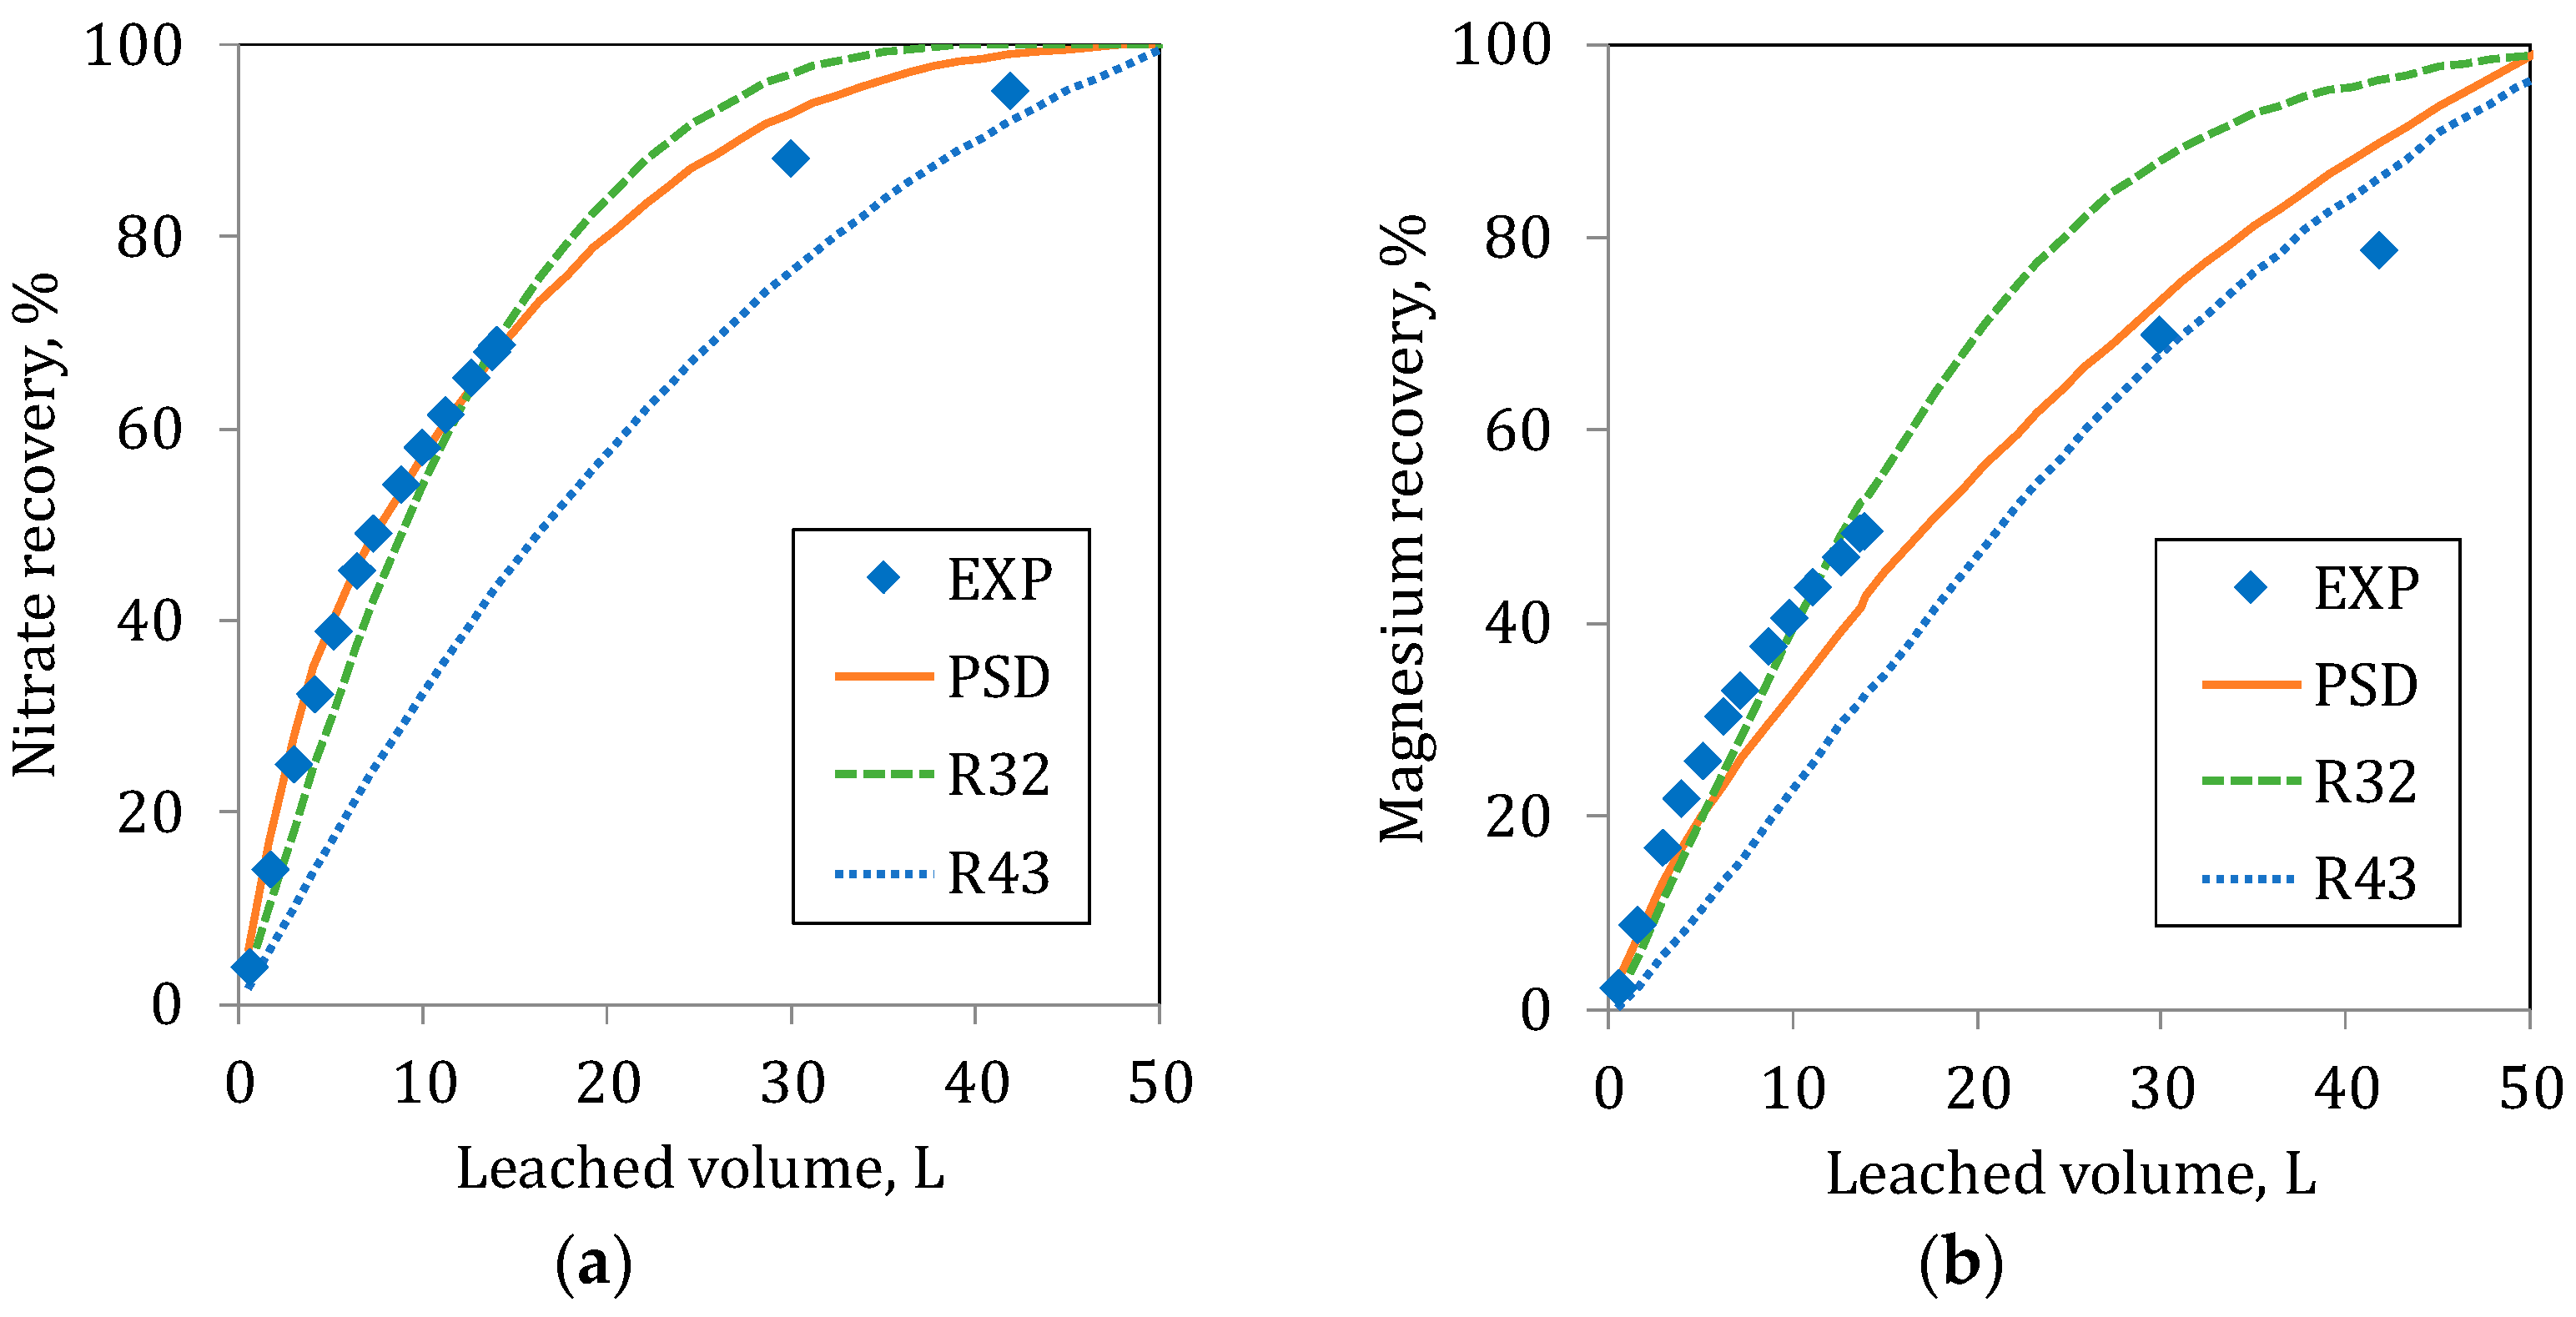
At the initial part of the leaching in C20 and C80, the estimated recoveries with the Sauter radius (R32) represent the experimental responses for both ions (Figure 9 and Figure 10) accurately. Moreover, in C80 in the initial step of the leaching of Nitrate, the simulations using the PSD and the R32 were similar to the experimental values. For Magnesium, the agreement between experimental data and R32 prediction is good. In the long term, a rather good agreement is observed between R43 and the experimental results. In general terms, the use of the Sauter radius, (R32) is adequate for the estimation of the recoveries at the initial period of the leaching process. This is due to the fact that at the initial time, the dissolution is controlled by the particle surface; with time, the small particle despair and the process starts to be controlled by the particle volume, i.e., represented by De Broukere mean radius (R43).
The results show that, at the beginning, the leaching follows the paths determined by the small particles (the curve R32), but when the leaching progresses and the importance of the fine particles decreases due to the diminution of its surface area, leaching is controlled by the larger particles when the smaller particles are depleted. The recovery at long periods goes closer to the path determined by the largest particle (the curve R43).
The effect of the particle radius is easily observed in the Nitrate recovery, where the leaching occurs exclusively on the particle surface. However, as mentioned before, for the leaching of Magnesium, the effect is more difficult to observe, since it depends on a double kinetic (particles and collapsed material).
As observed in the figures, none of the mean particle radii can represent the overall process for both ions adequately. However, the better responses to the experimental results are obtained when the PSD curve compared. The PSD describes in detail the particle size distribution really found in the respective columns.
4. Discussion
In many cases in the mining processes, leaching is applied for the exploitation of minerals containing several soluble species and the raw material is formed by particles in a wide interval. Despite this, models considering only one soluble species and only one particle size are commonly used. Therefore, the principal aim of the manuscript is to develop a model for describing the leaching of a mineral composed of several soluble species and with a wide particle size distribution. In our case, the model addresses two soluble species and three sizes. The extension to more soluble species and particle size is possible. The model was developed to describe in the best form the leaching of the soluble species contained in the caliche and applied to a system formed by particles of different sizes; i.e., multi-species and multi-size distribution. A novel and more comprehensive model was formulated, which, on the basis of its characteristics allows it to be used in different processes where multiple species are dissolved from a complex particulate system, like the heap leaching of caliche ores.
The verification of the model through column leaching experiments of caliche ore is a difficult task. For the A-species, the validation is rather simple, but, for the B-species, the situation is more complicated, since the dissolution of this species is determined by the dissolution of the A-species and its own dissolution, which takes place in the particle and within the collapsed material. In addition, the simulations and experimental data provide complementary information about the dissolution behavior under different ore granulometries, bringing the modeling task closer to what happens in the caliche exploitation operations. Regarding the fitting of kinetic parameters, the orders of magnitude are related to previous observations made by other models for the caliche system [23], which would indicate consistency in the simulations performed by the new model. The similarity between the experimental outlet concentrations of Magnesium and Potassium in both columns suggests that, as the model has been validated for Nitrate and Magnesium, other species could also be included in new studies.
In an actual process, the heap leaching is performed using a particle size distribution of the ore. In that situation, the leaching of smaller particles dominates the process at the beginning, but, in the long term, the dissolution of large particles is more influential. Therefore, none of the averaged radii (based on surface or volume) represent the whole process accurately. Thus, the inclusion of the PSD in the model allows for addressing the leaching in an integral way. To improve the prediction of the model, in a future activity, experiments at an industrial scale; e.g., gabions or intermediary heaps, would be performed. By this method, larger differences in the particle size distributions could be evaluated.
As indicated, the objective of the model is to increase the understanding of the processes occurring in heap leaching, by considering two soluble species and, with an aspect that is the most important, to model the dissolution of caliche described for three particles sizes, being the first model for heap leaching with these properties. A more detailed description of the particle size distribution is possible and straightforward to perform; however, the use of four or more sizes is not recommended due to the existence of several other error sources; e.g., particles that are not spherical and the non-homogeneous material. On the other hand, the extension to more than three species involves an increment of the equations (two equations for each new added species); in addition, the interpretation of the results may be more complicated.
5. Conclusions
A general phenomenological model was developed that represents in a more realistic way the leaching of soluble ores, like caliche. The model allows to understand the main processes occurring in heap leaching, taking into account the heterogeneity in the mineral composition (different soluble species) and in the size of the particles that compose the bed. The performance of the model was verified through column leaching experiments of caliche ore with different granulometry. The outlet concentrations and recoveries of nitrate and magnesium were followed and adequately simulated, despite of the important assumptions that were defined.
Acknowledgments
The authors thank National Commission of Scientific and Technological Research (CONICYT) and the Regional Government of Antofagasta for their funding through the Associative Research Program (PIA), Project Anillo ACT 1201. J.I.O. thanks CONICYT and its Attraction and Insertion Program (PAI) for its support through the financing of the insertion project in the productive sector folio I7816020003.
Author Contributions
J.I.O. and A.C. performed the leaching experiments; J.I.O. and L.M. formulated and solved the model in a program interface; J.I.O., L.M., and L.A.C. analyzed the data and wrote the paper.
Conflicts of Interest
The authors declare no conflict of interest.
Nomenclature
| Cross-sectional area of reactor, m2 | |
| Solubility concentration of -species, kg/m3 | |
| Concentration of -species in reactor , kg/m3 | |
| Concentration of -species in previous reactor, kg/m3 | |
| Mass fraction of the particle type | |
| Initial reactor height, m | |
| Height of reactor , m | |
| Mass transfer rate coefficient of -species, m/h | |
| Dissolution rate of collapsed material, 1/h | |
| Mass of B in the collapsed material per area in reactor , kg/m2 | |
| Number of particles of the particle type | |
| Irrigation rate, m3/m2/h | |
| Initial particle radius of particle type, m | |
| Particle radius of particle type in reactor , m | |
| Time, h | |
| Volume of solution in reactor , m3 | |
| Mass fraction of -species in caliche, kg of /kg mineral | |
| Mineral porosity | |
| Water fraction | |
| Mineral density, kg/m3 |
Appendix A. Spectrograms of Caliche
Figure A1.
Spectrogram analysis of (a) Nitratine and (b) Halite.
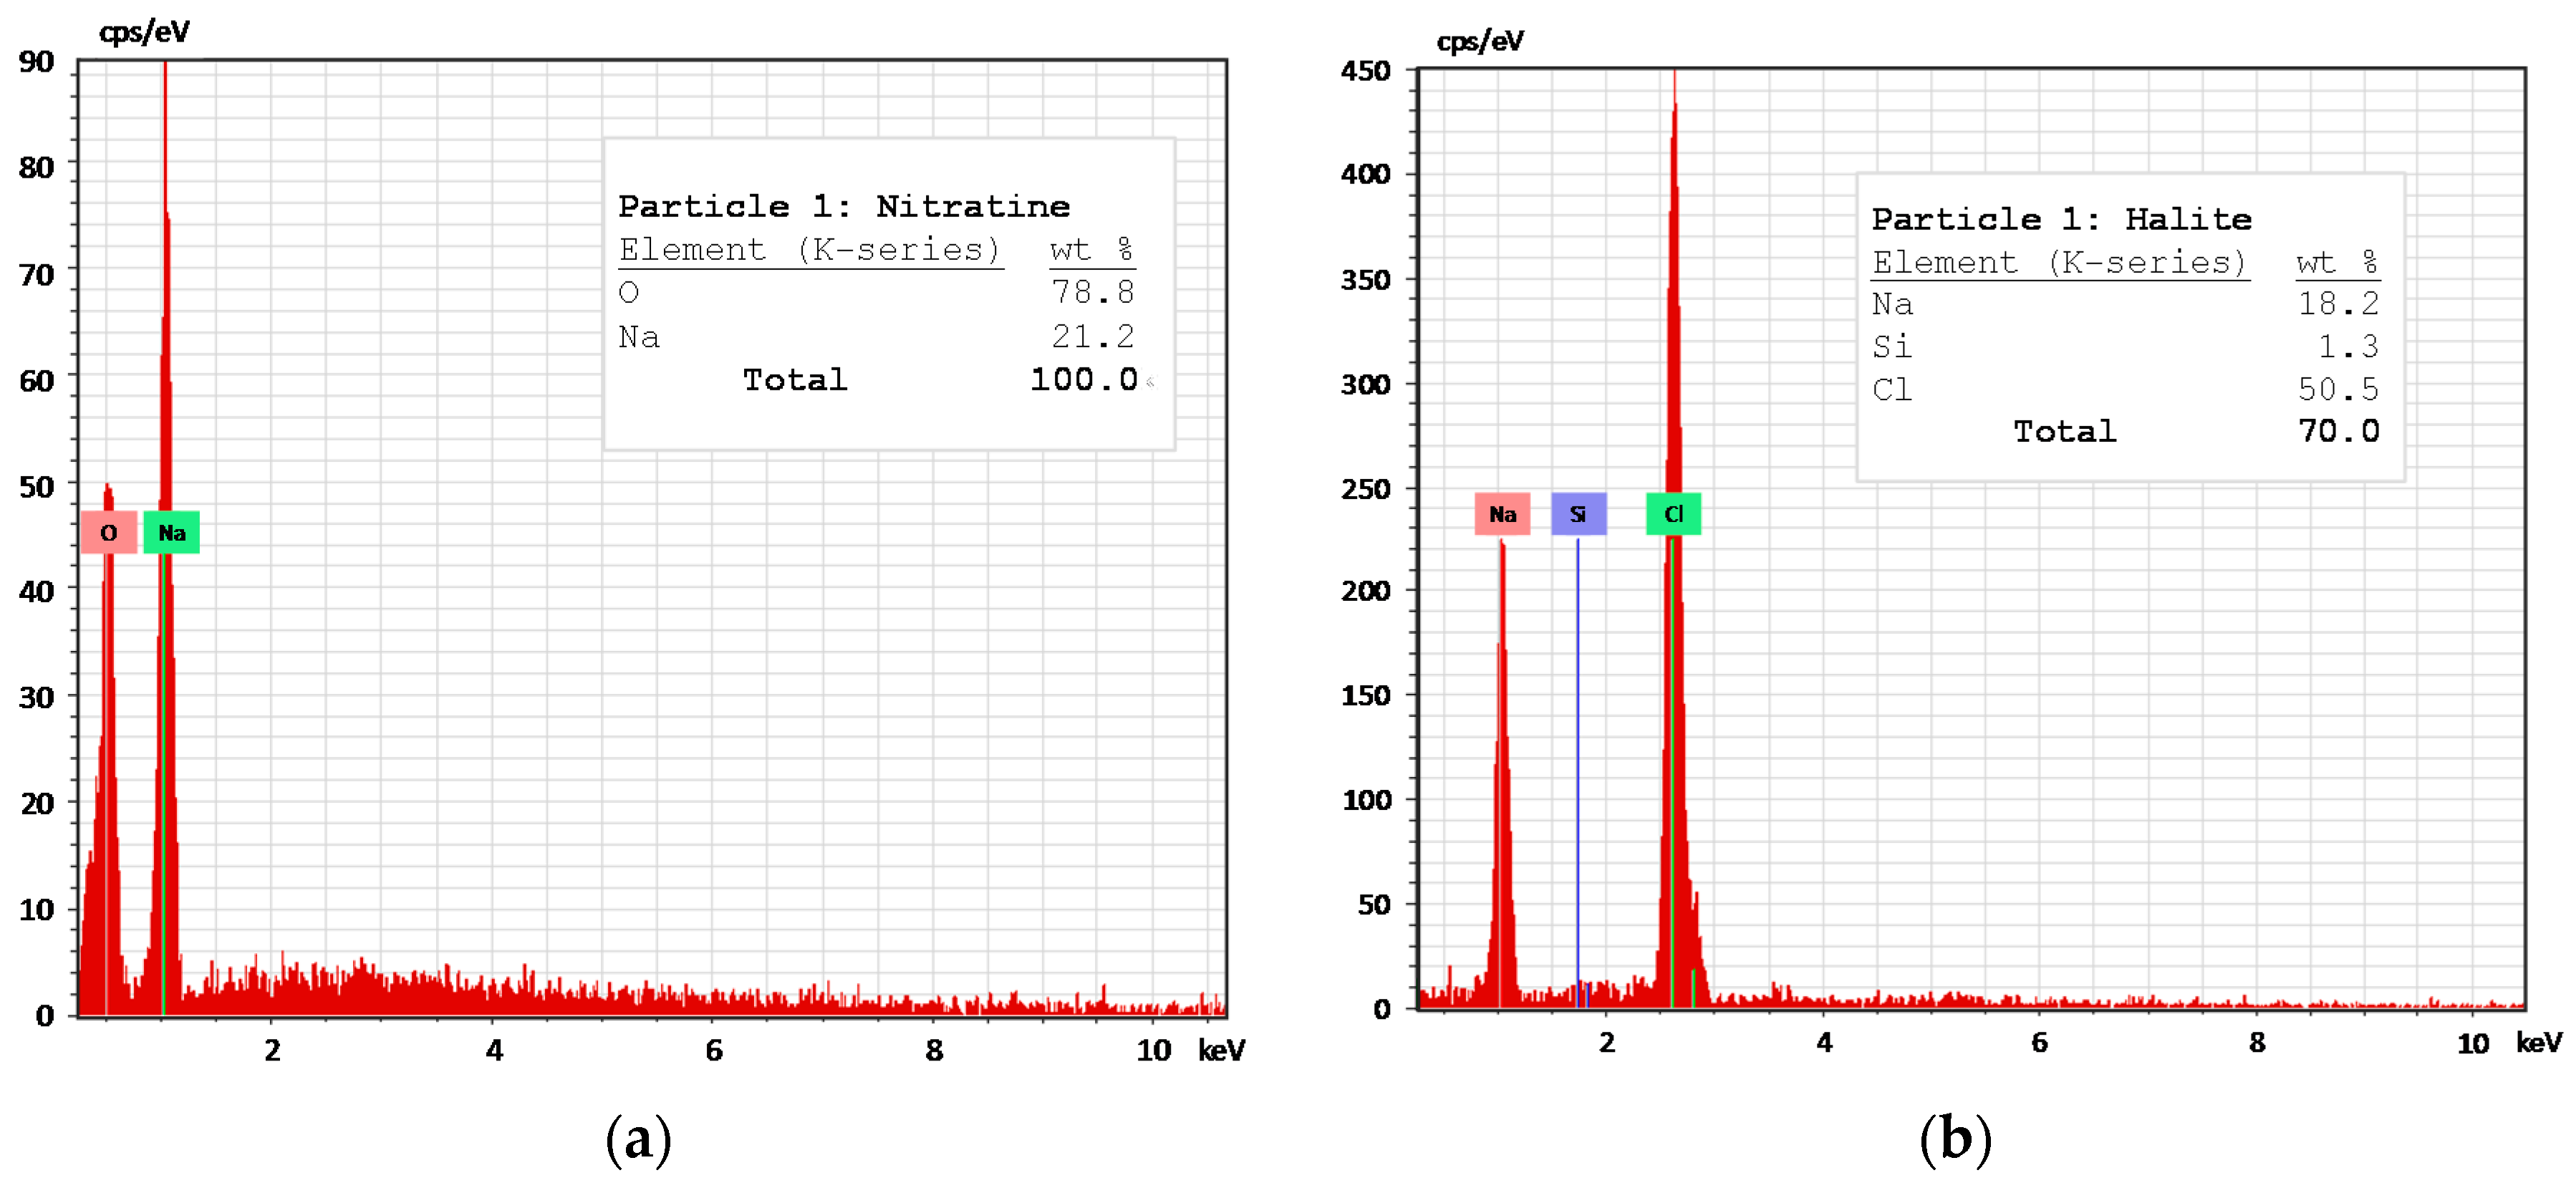
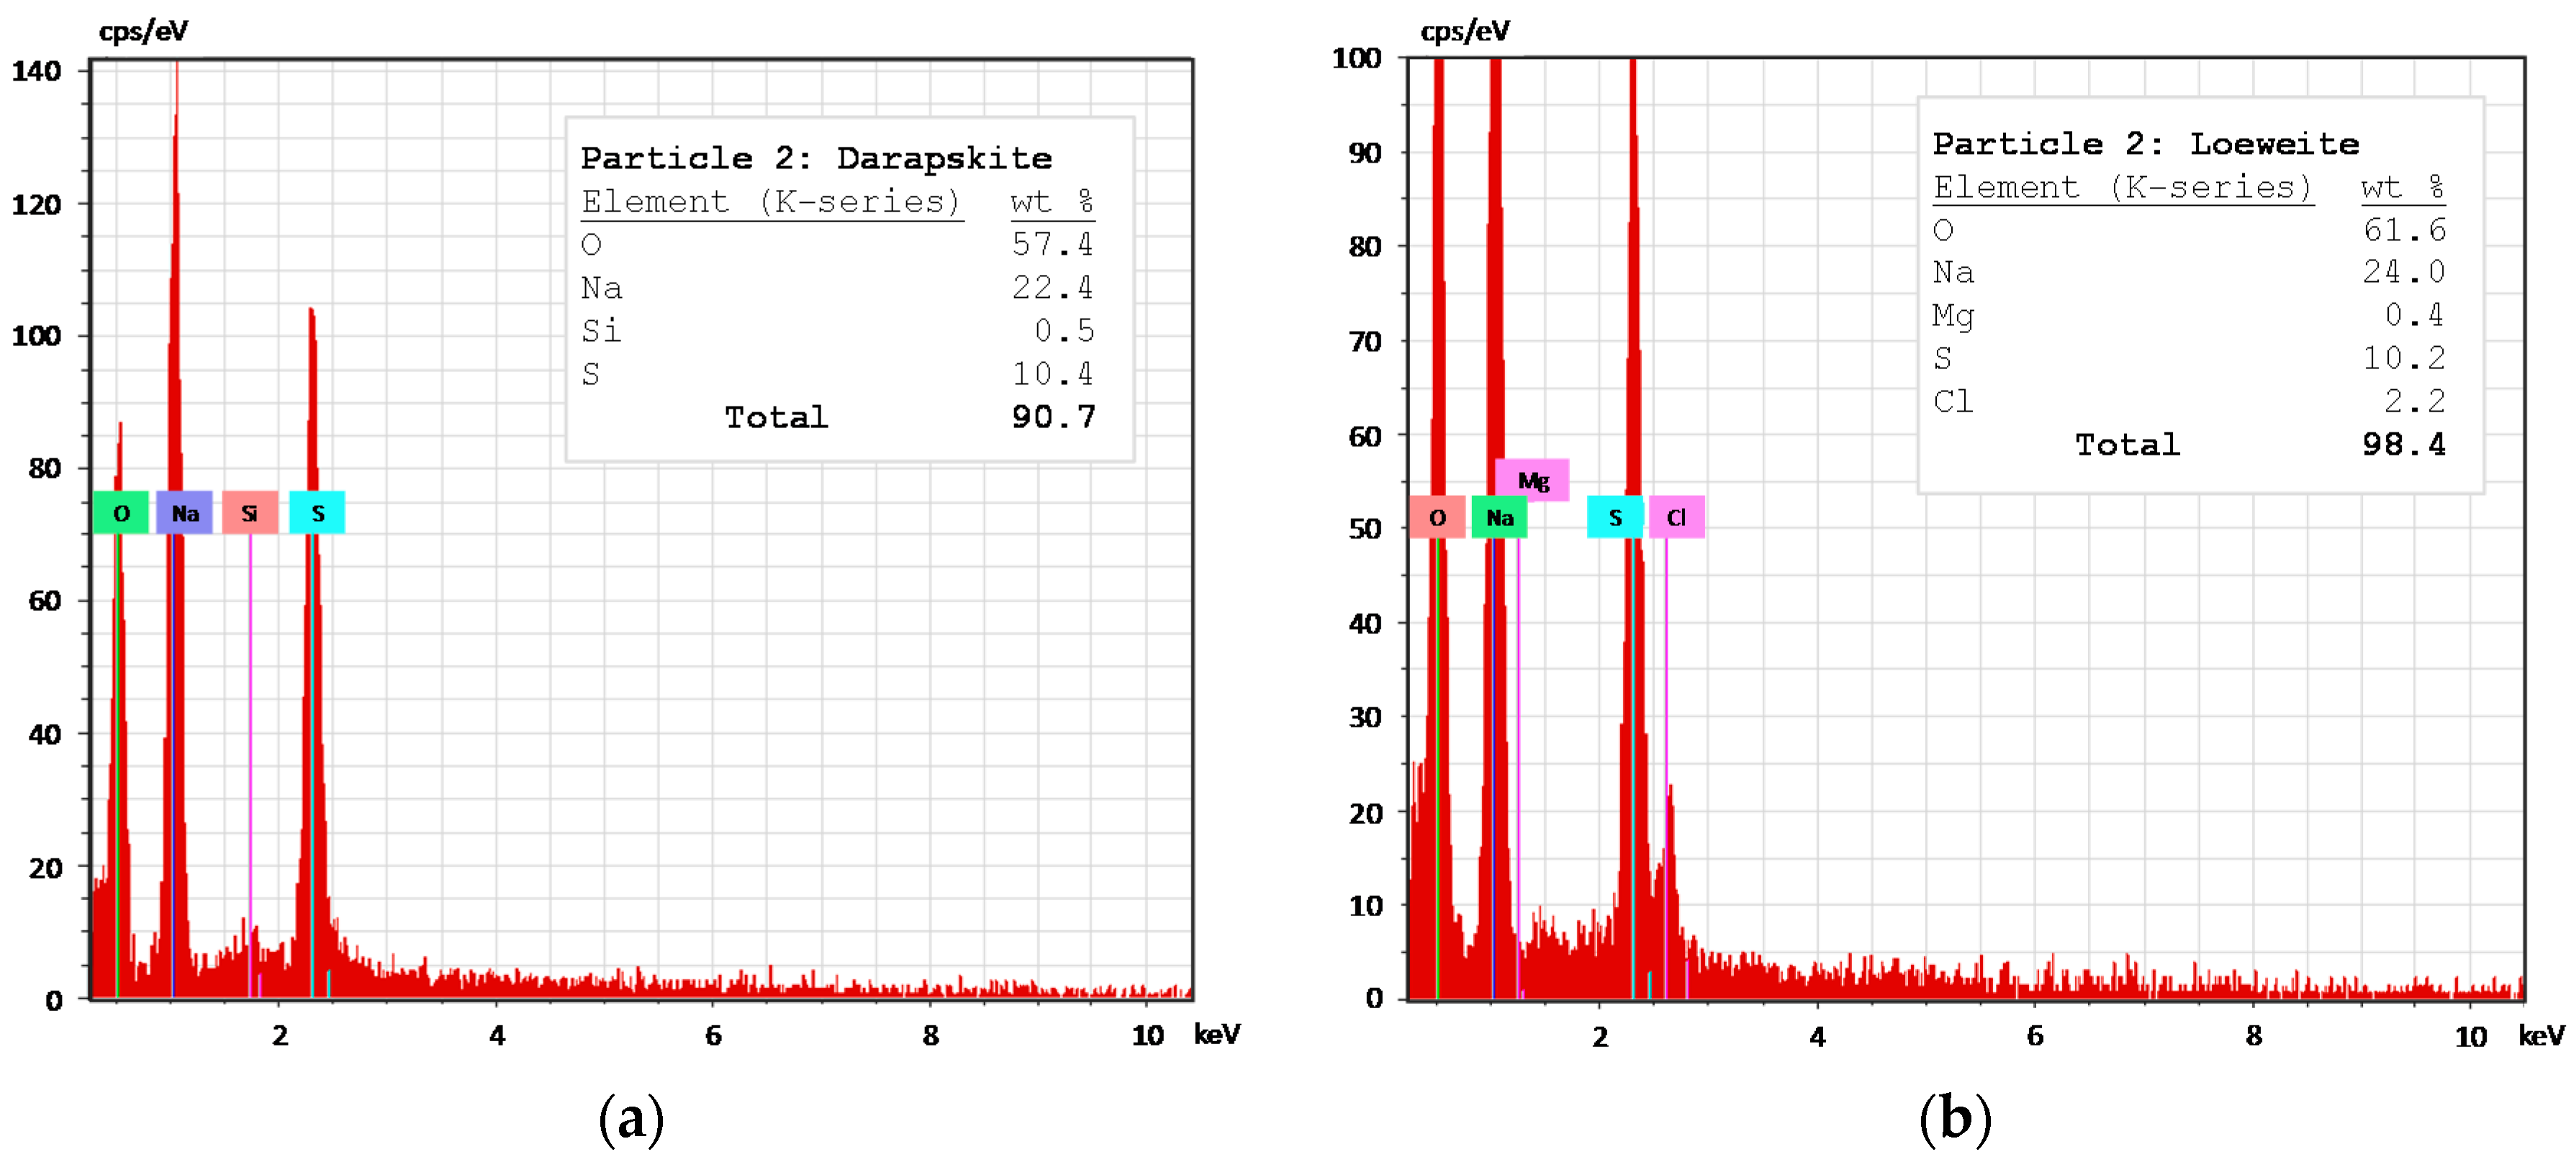
Figure A2.
Spectrogram of (a) Darapskite and (b) Loeweite.
References
- Ericksen, G.E.; Hosterman, J.W.; Amand, P.S. Chemistry, mineralogy and origin of the clay-hill nitrate deposits, Amargosa River valley, Death Valley region, California, USA. Chem. Geol. 1988, 67, 85–102. [Google Scholar] [CrossRef]
- Ericksen, G.E. The Chilean Nitrate Deposits: The origin of the Chilean nitrate deposits, which contain a unique group of saline minerals, has provoked lively discussion for more than 100 years. Am. Sci. 1983, 71, 366–374. [Google Scholar]
- Pokorny, L.; Maturana, I.; Bortle, W.H. Sodium Nitrate and Nitrite. In Kirk-Othmer Encyclopedia of Chemical Technology; John Wiley & Sons, Inc.: Hoboken, NJ, USA, 2006; pp. 1–22. ISBN 9780471238966. [Google Scholar]
- US Geological Survey (USGS). Mineral Commodities Summaries 2016; USGS: Reston, VA, USA, 2015; pp. 1–102. [CrossRef]
- Lauterbach, A. Reduction of Perchlorate Levels of Sodium and Potassium Nitrates Derived from Natural Caliche Ore. In Environmental Impact of Fertilizer on Soil and Water; Hall, W.L., Robarge, W.P., Eds.; American Chemical Society: Washington, DC, USA, 2004; pp. 45–57. ISBN 9780841238114. [Google Scholar]
- Wheeler, A. Technical report on the Aguas Blancas property, Chile. Intern. Rep. 2010, 1–57. [Google Scholar]
- Ordóñez, J.I.; Moreno, L.; Mellado, M.E.; Cisternas, L.A. Modeling validation of caliche ore leaching using seawater. Int. J. Miner. Process. 2014, 126, 10–17. [Google Scholar] [CrossRef]
- Ghorbani, Y.; Becker, M.; Mainza, A.; Franzidis, J.-P.; Petersen, J. Large particle effects in chemical/biochemical heap leach processes—A review. Miner. Eng. 2011, 24, 1172–1184. [Google Scholar] [CrossRef]
- Petersen, J. Heap leaching as a key technology for recovery of values from low-grade ores—A brief overview. Hydrometallurgy 2016, 165, 206–212. [Google Scholar] [CrossRef]
- Ordóñez, J.I.; Moreno, L.; González, J.F.; Cisternas, L.A. Use of discharged brine from reverse osmosis plant in heap leaching: Opportunity for caliche mining industry. Hydrometallurgy 2015, 155, 61–68. [Google Scholar] [CrossRef]
- Ghorbani, Y.; Franzidis, J.-P.; Petersen, J. Heap leaching technology—Current state, innovations and future directions: A review. Miner. Process. Extr. Metall. Rev. 2016, 37, 73–119. [Google Scholar] [CrossRef] [Green Version]
- Valencia, J.A.; Méndez, D.A.; Cueto, J.Y.; Cisternas, L.A. Saltpeter extraction and modelling of caliche mineral heap leaching. Hydrometallurgy 2008, 90, 103–114. [Google Scholar] [CrossRef]
- Ordóñez, J.I.; Moreno, L.; Gálvez, E.D.; Cisternas, L.A. Seawater leaching of caliche mineral in column experiments. Hydrometallurgy 2013, 139, 79–87. [Google Scholar] [CrossRef]
- Bennett, C.R.; McBride, D.; Cross, M.; Gebhardt, J.E. A comprehensive model for copper sulphide heap leaching: Part 1 Basic formulation and validation through column test simulation. Hydrometallurgy 2012, 127, 150–161. [Google Scholar] [CrossRef]
- McBride, D.; Gebhardt, J.E.; Cross, M. A comprehensive gold oxide heap leach model: Development and validation. Hydrometallurgy 2012, 113, 98–108. [Google Scholar] [CrossRef]
- Mellado, M.E.; Cisternas, L.A.; Gálvez, E.D. An analytical model approach to heap leaching. Hydrometallurgy 2009, 95, 33–38. [Google Scholar] [CrossRef]
- Hernández, I.F.; Ordóñez, J.I.; Robles, P.A.; Gálvez, E.D.; Cisternas, L.A. A Methodology For Design And Operation Of Heap Leaching Systems. Miner. Process. Extr. Metall. Rev. 2017, 38, 180–192. [Google Scholar] [CrossRef]
- Mellado, M.E.; Casanova, M.P.; Cisternas, L.A.; Gálvez, E.D. On scalable analytical models for heap leaching. Comput. Chem. Eng. 2011, 35, 220–225. [Google Scholar] [CrossRef]
- García, S.; Ramón, C.; Esplin, A.; Gebhardt, J.E.; Hernández, A.; McBride, D.; Cross, M. Gold heap leach simulation and optimization using a multiphysics model. Miner. Metall. Process. 2010, 27, 196–204. [Google Scholar]
- Gálvez, E.D.; Moreno, L.; Mellado, M.E.; Ordóñez, J.I.; Cisternas, L.A. Heap leaching of caliche minerals: Phenomenological and analytical models—Some comparisons. Miner. Eng. 2012, 33, 46–53. [Google Scholar] [CrossRef]
- Padilla, G.A.; Cisternas, L.A.; Cueto, J.Y. On the optimization of heap leaching. Miner. Eng. 2008, 21, 673–678. [Google Scholar] [CrossRef]
- Trujillo, J.Y.; Cisternas, L.A.; Gálvez, E.D.; Mellado, M.E. Optimal design and planning of heap leaching process. Application to copper oxide leaching. Chem. Eng. Res. Des. 2014, 92, 308–317. [Google Scholar] [CrossRef]
- Moreno, L.; Ordóñez, J.I.; Cisternas, L.A. Dissolution Model of Multiple Species: Leaching of Highly Soluble Minerals. Metall. Mater. Trans. B 2017, 48, 1817–1826. [Google Scholar] [CrossRef]
- Bouffard, S.C.; West-Sells, P.G. Hydrodynamic behavior of heap leach piles: Influence of testing scale and material properties. Hydrometallurgy 2009, 98, 136–142. [Google Scholar] [CrossRef]
- Reyes, O.; Moreno, L.; Parada, F.; Sánchez, M. Modelling of bacterial leaching in heap with forced aeration. IFAC Proc. Vol. 2007, 40, 81–86. [Google Scholar] [CrossRef]
- Jackson, J.C.; Ericksen, G.E. An X-ray diffraction method for semiquantitative mineralogical analysis of Chilean nitrate ore. Rev. Geol. Chile 1997, 24, 45–54. [Google Scholar] [CrossRef]
- Valdez, S.; Ordóñez, J.I.; Cisternas, L.A.; Moreno, L. Leaching of coarse caliche ore. Experiment and modelling. Braz. J. Chem. Eng. 2016, 33, 105–114. [Google Scholar] [CrossRef]
Figure 1.
Chilean operations of caliche exploitation in Northern Chile and their annual production.
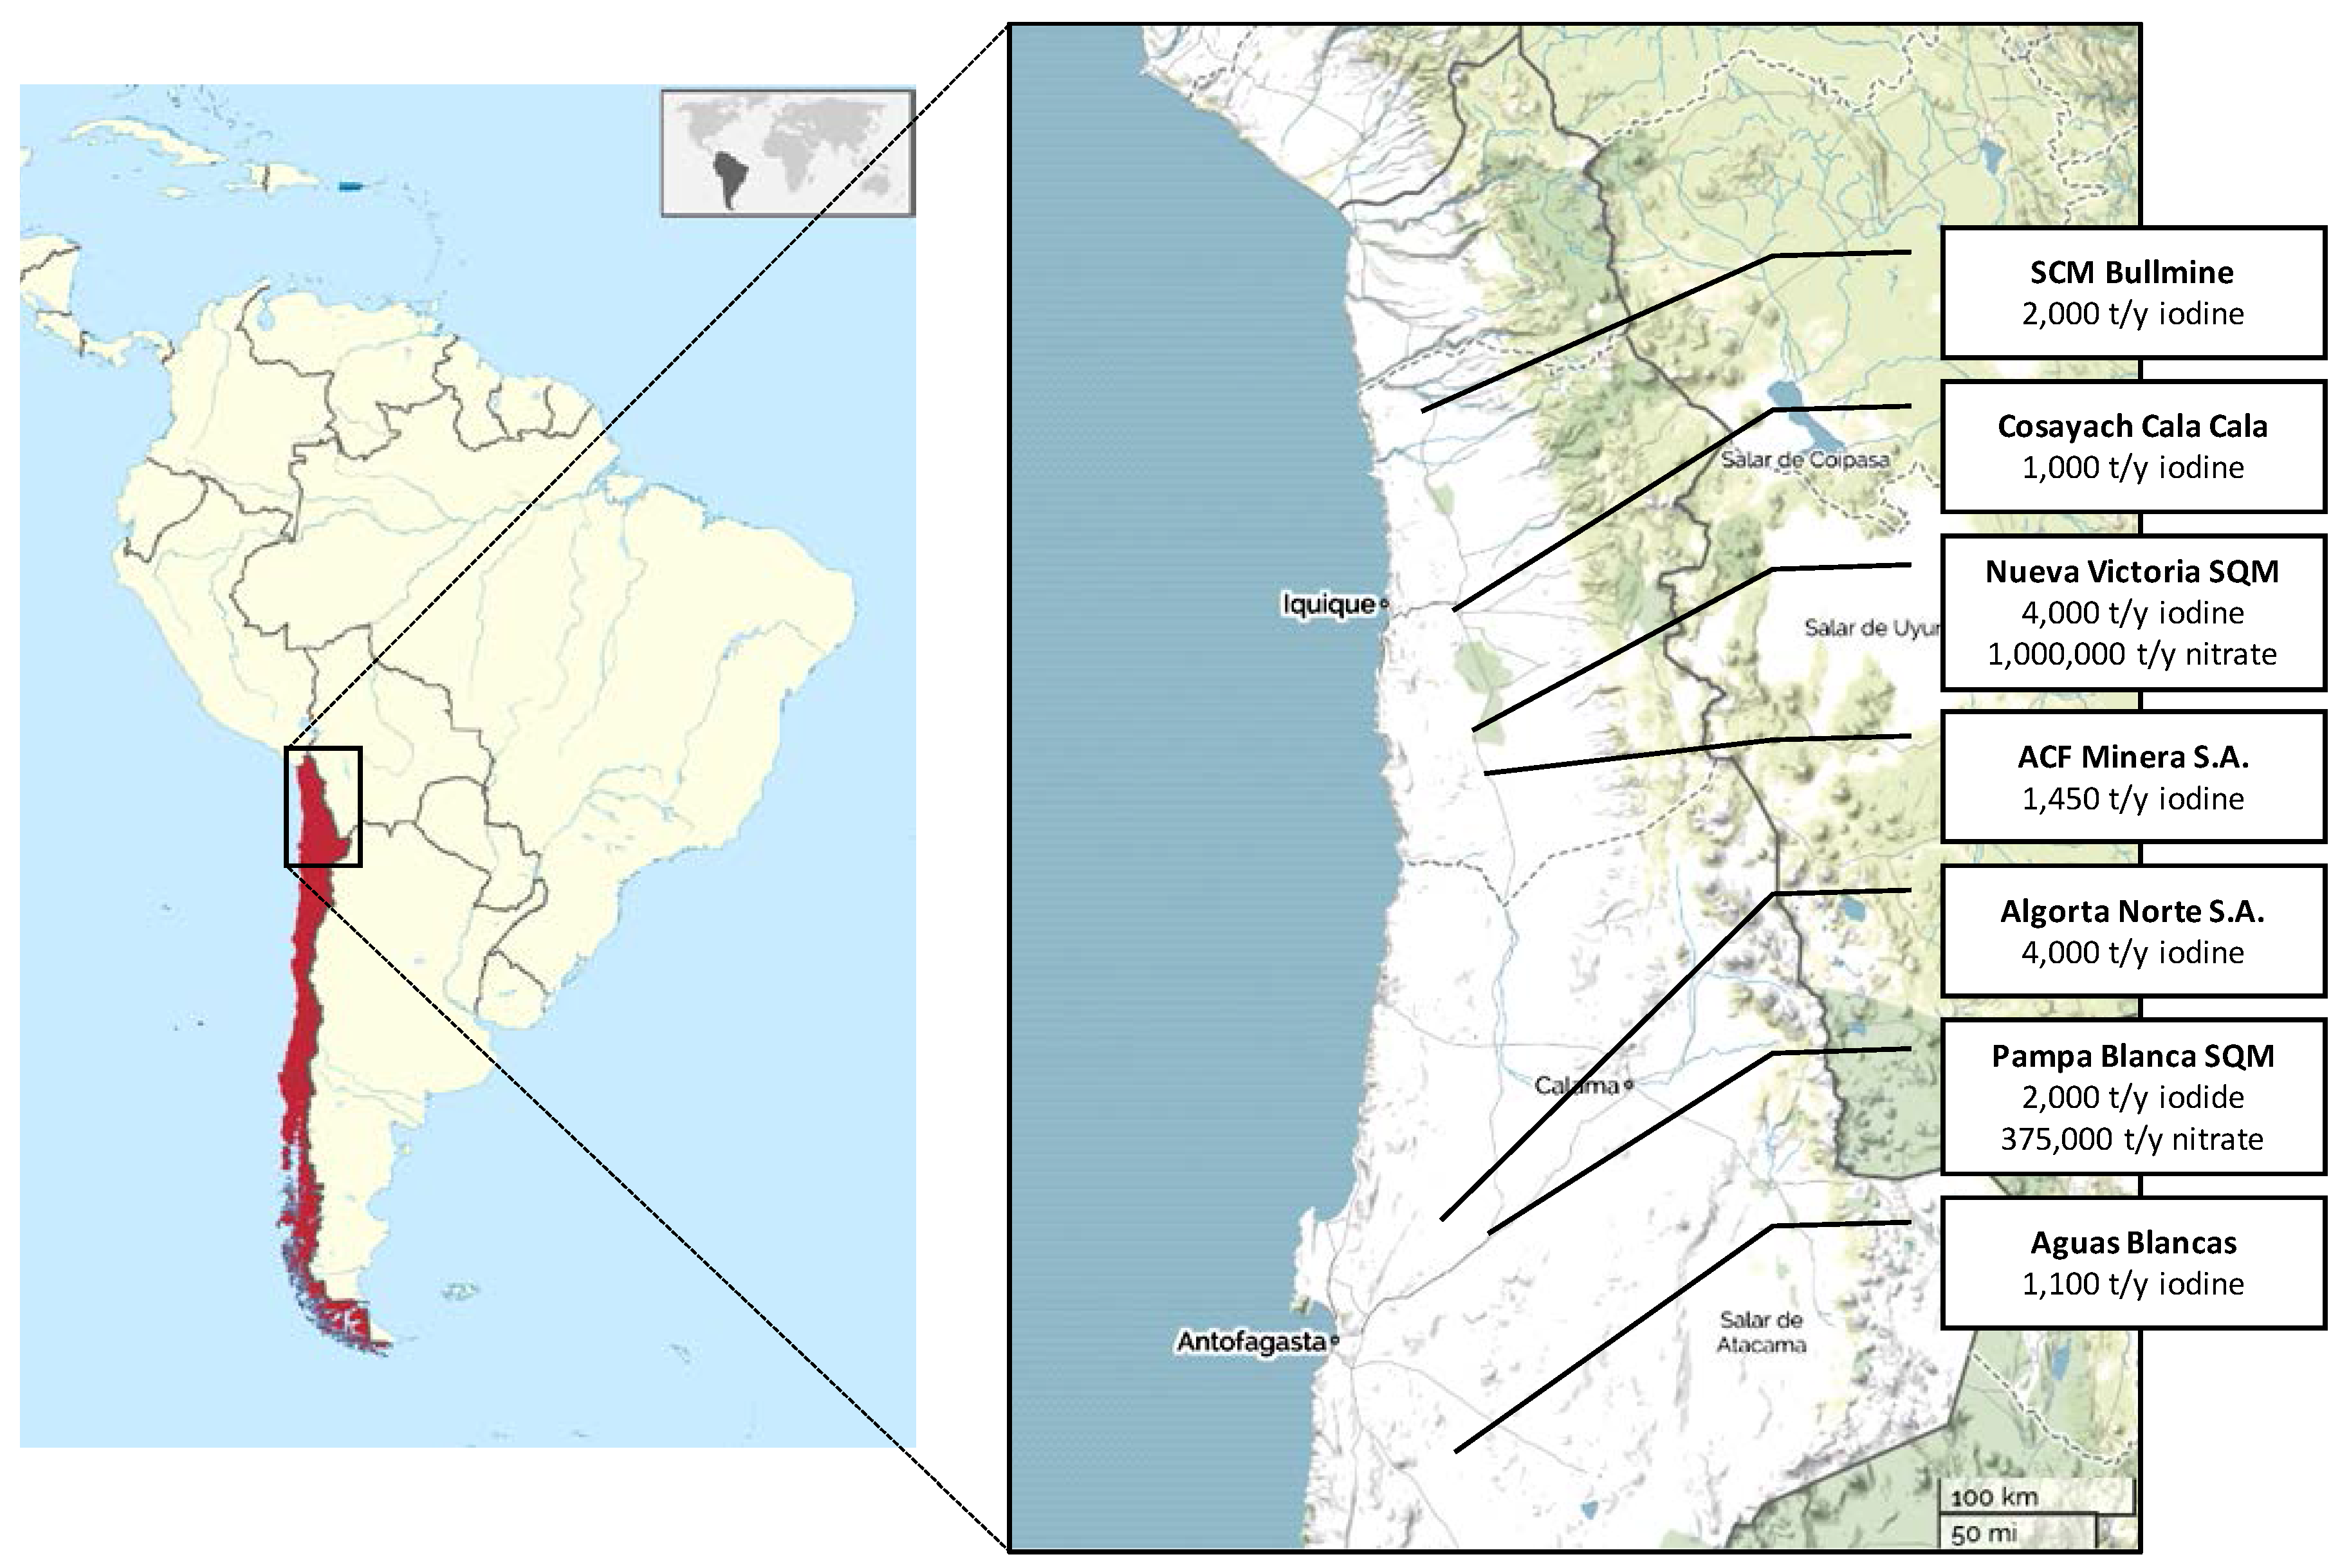
Figure 2.
Backscattered electron image (BSE) of samples with (a) Nitratine–Halite and (b) Darapskite–Loeweite associations. Spectrograms of the species are presented in Figure A1 and Figure A2 (Appendix A) and the measure points of figures are denoted in the figure as dots.
Figure 2.
Backscattered electron image (BSE) of samples with (a) Nitratine–Halite and (b) Darapskite–Loeweite associations. Spectrograms of the species are presented in Figure A1 and Figure A2 (Appendix A) and the measure points of figures are denoted in the figure as dots.
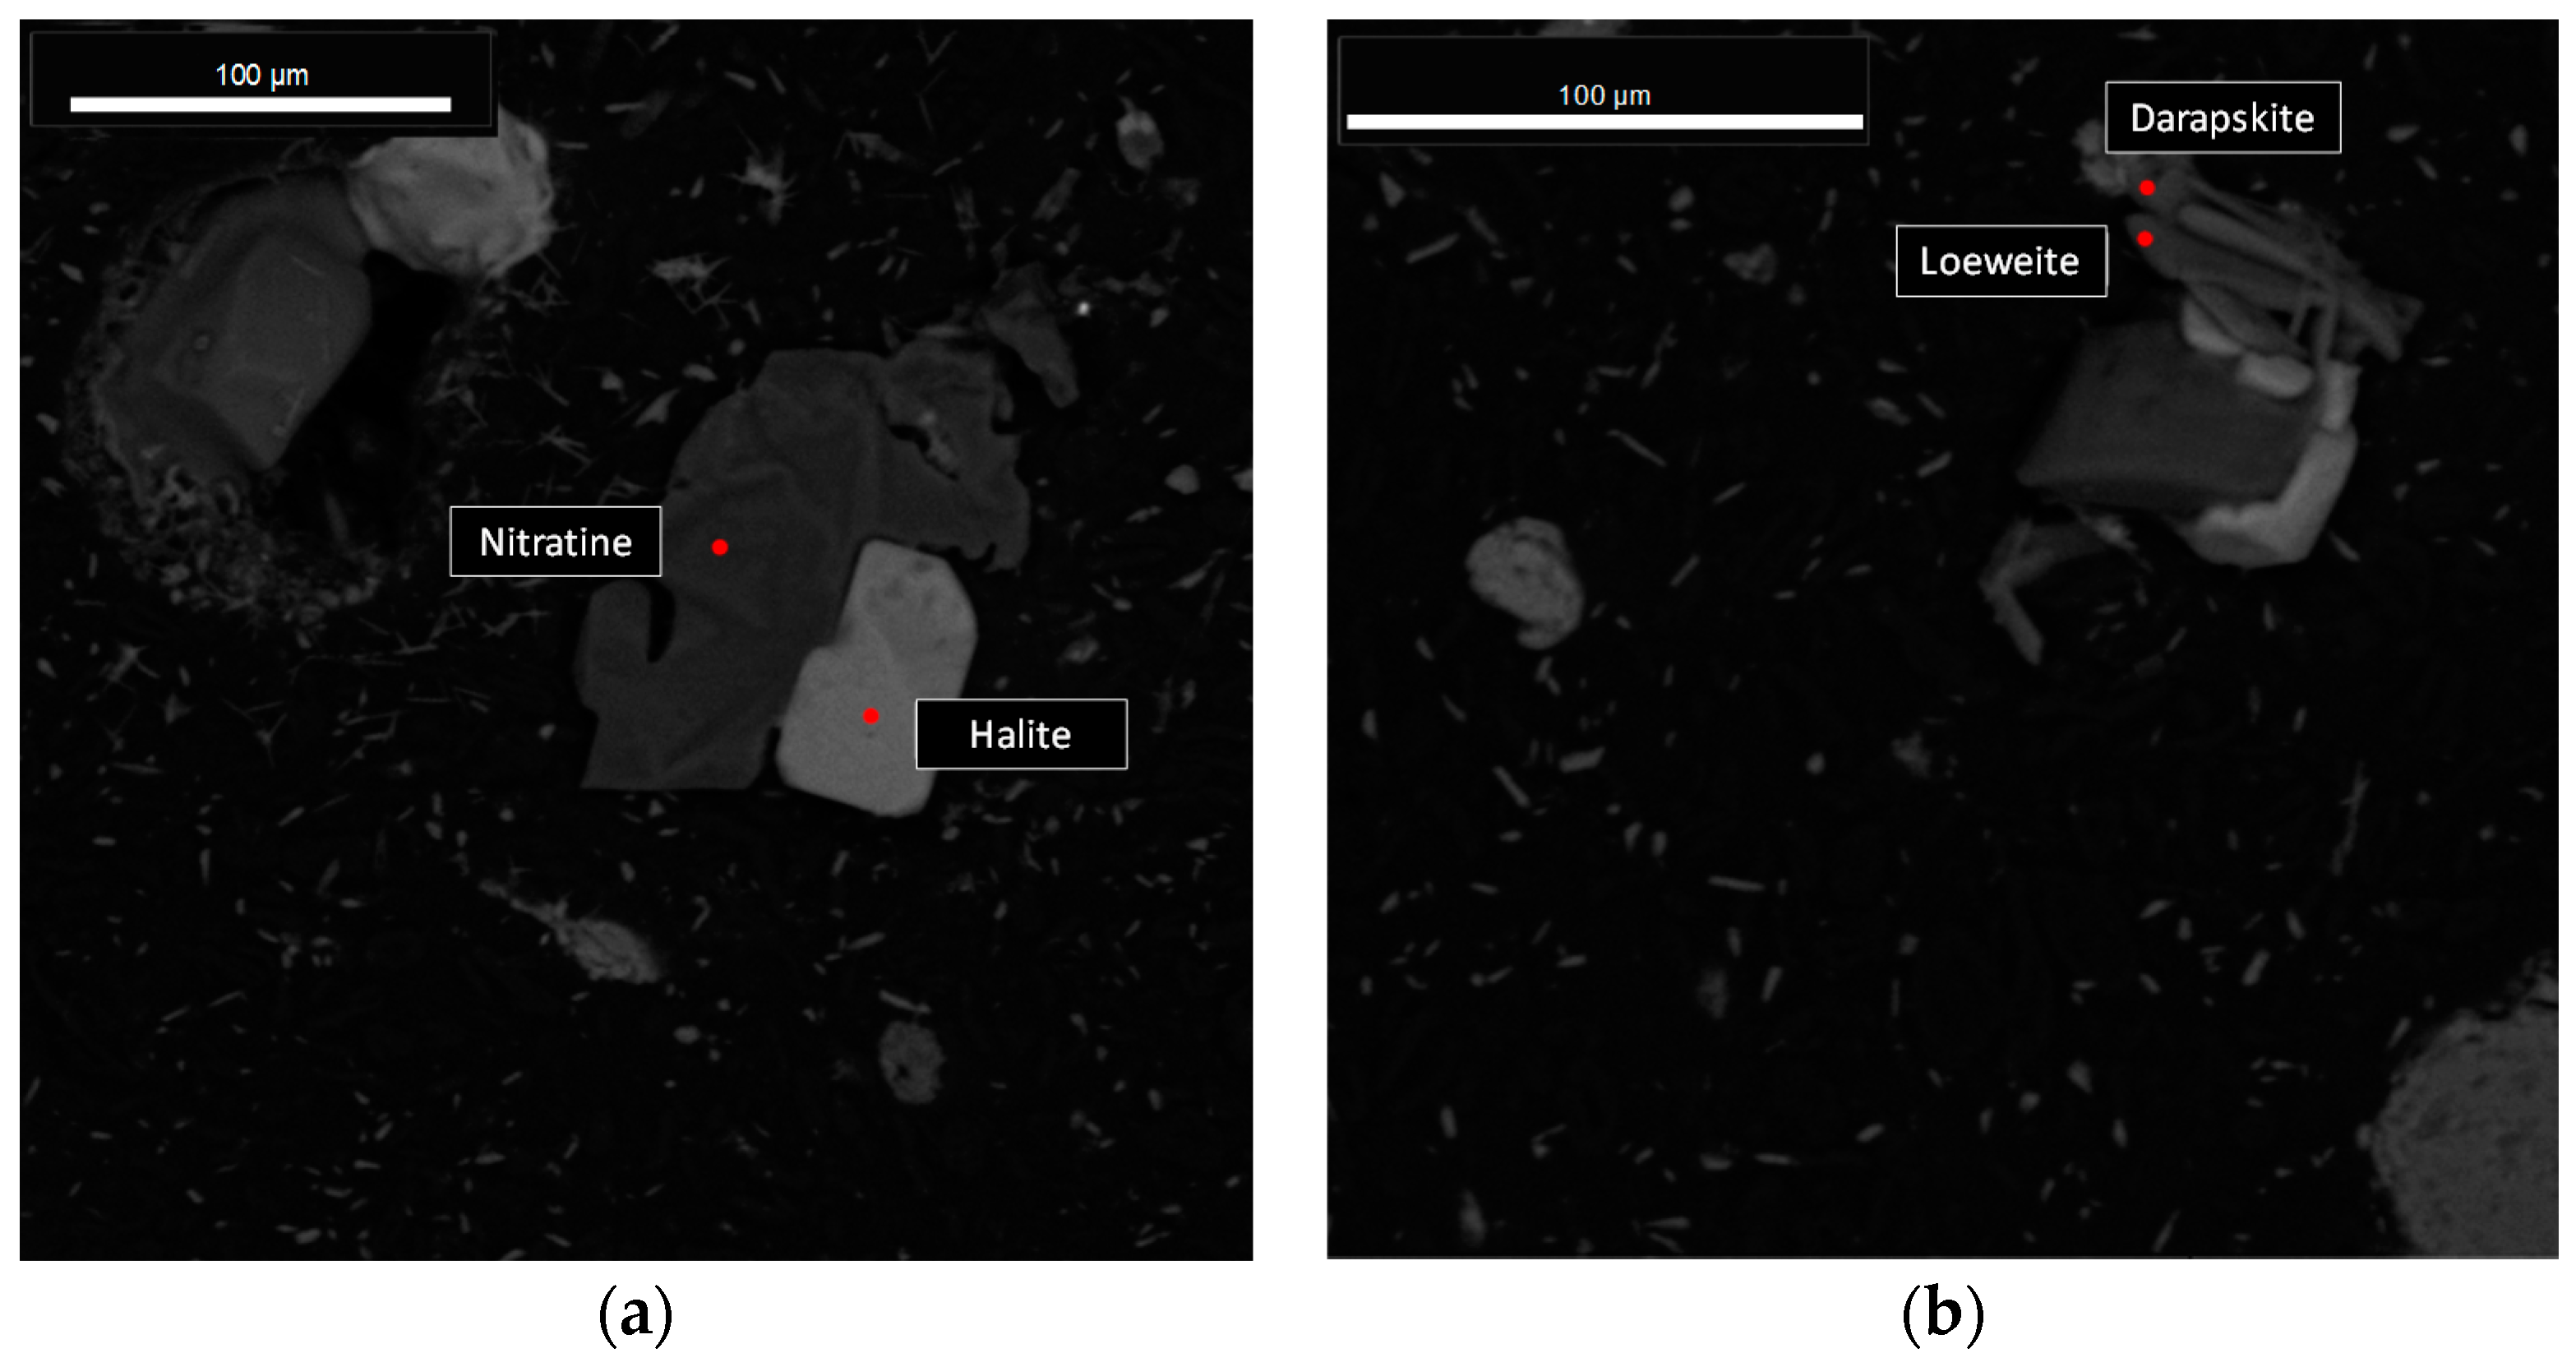
Figure 3.
Particle size distribution of the composites used in the leaching experiments.

Figure 4.
Schematic representation of the material flow that occurs in the small reactor . Three radii: , and , and mass fractions: , and are considered. The particles are spheres and composed homogeneously by two soluble species: A and B.
Figure 4.
Schematic representation of the material flow that occurs in the small reactor . Three radii: , and , and mass fractions: , and are considered. The particles are spheres and composed homogeneously by two soluble species: A and B.

Figure 5.
Outlet concentrations of the soluble species during leaching of the C20 column.
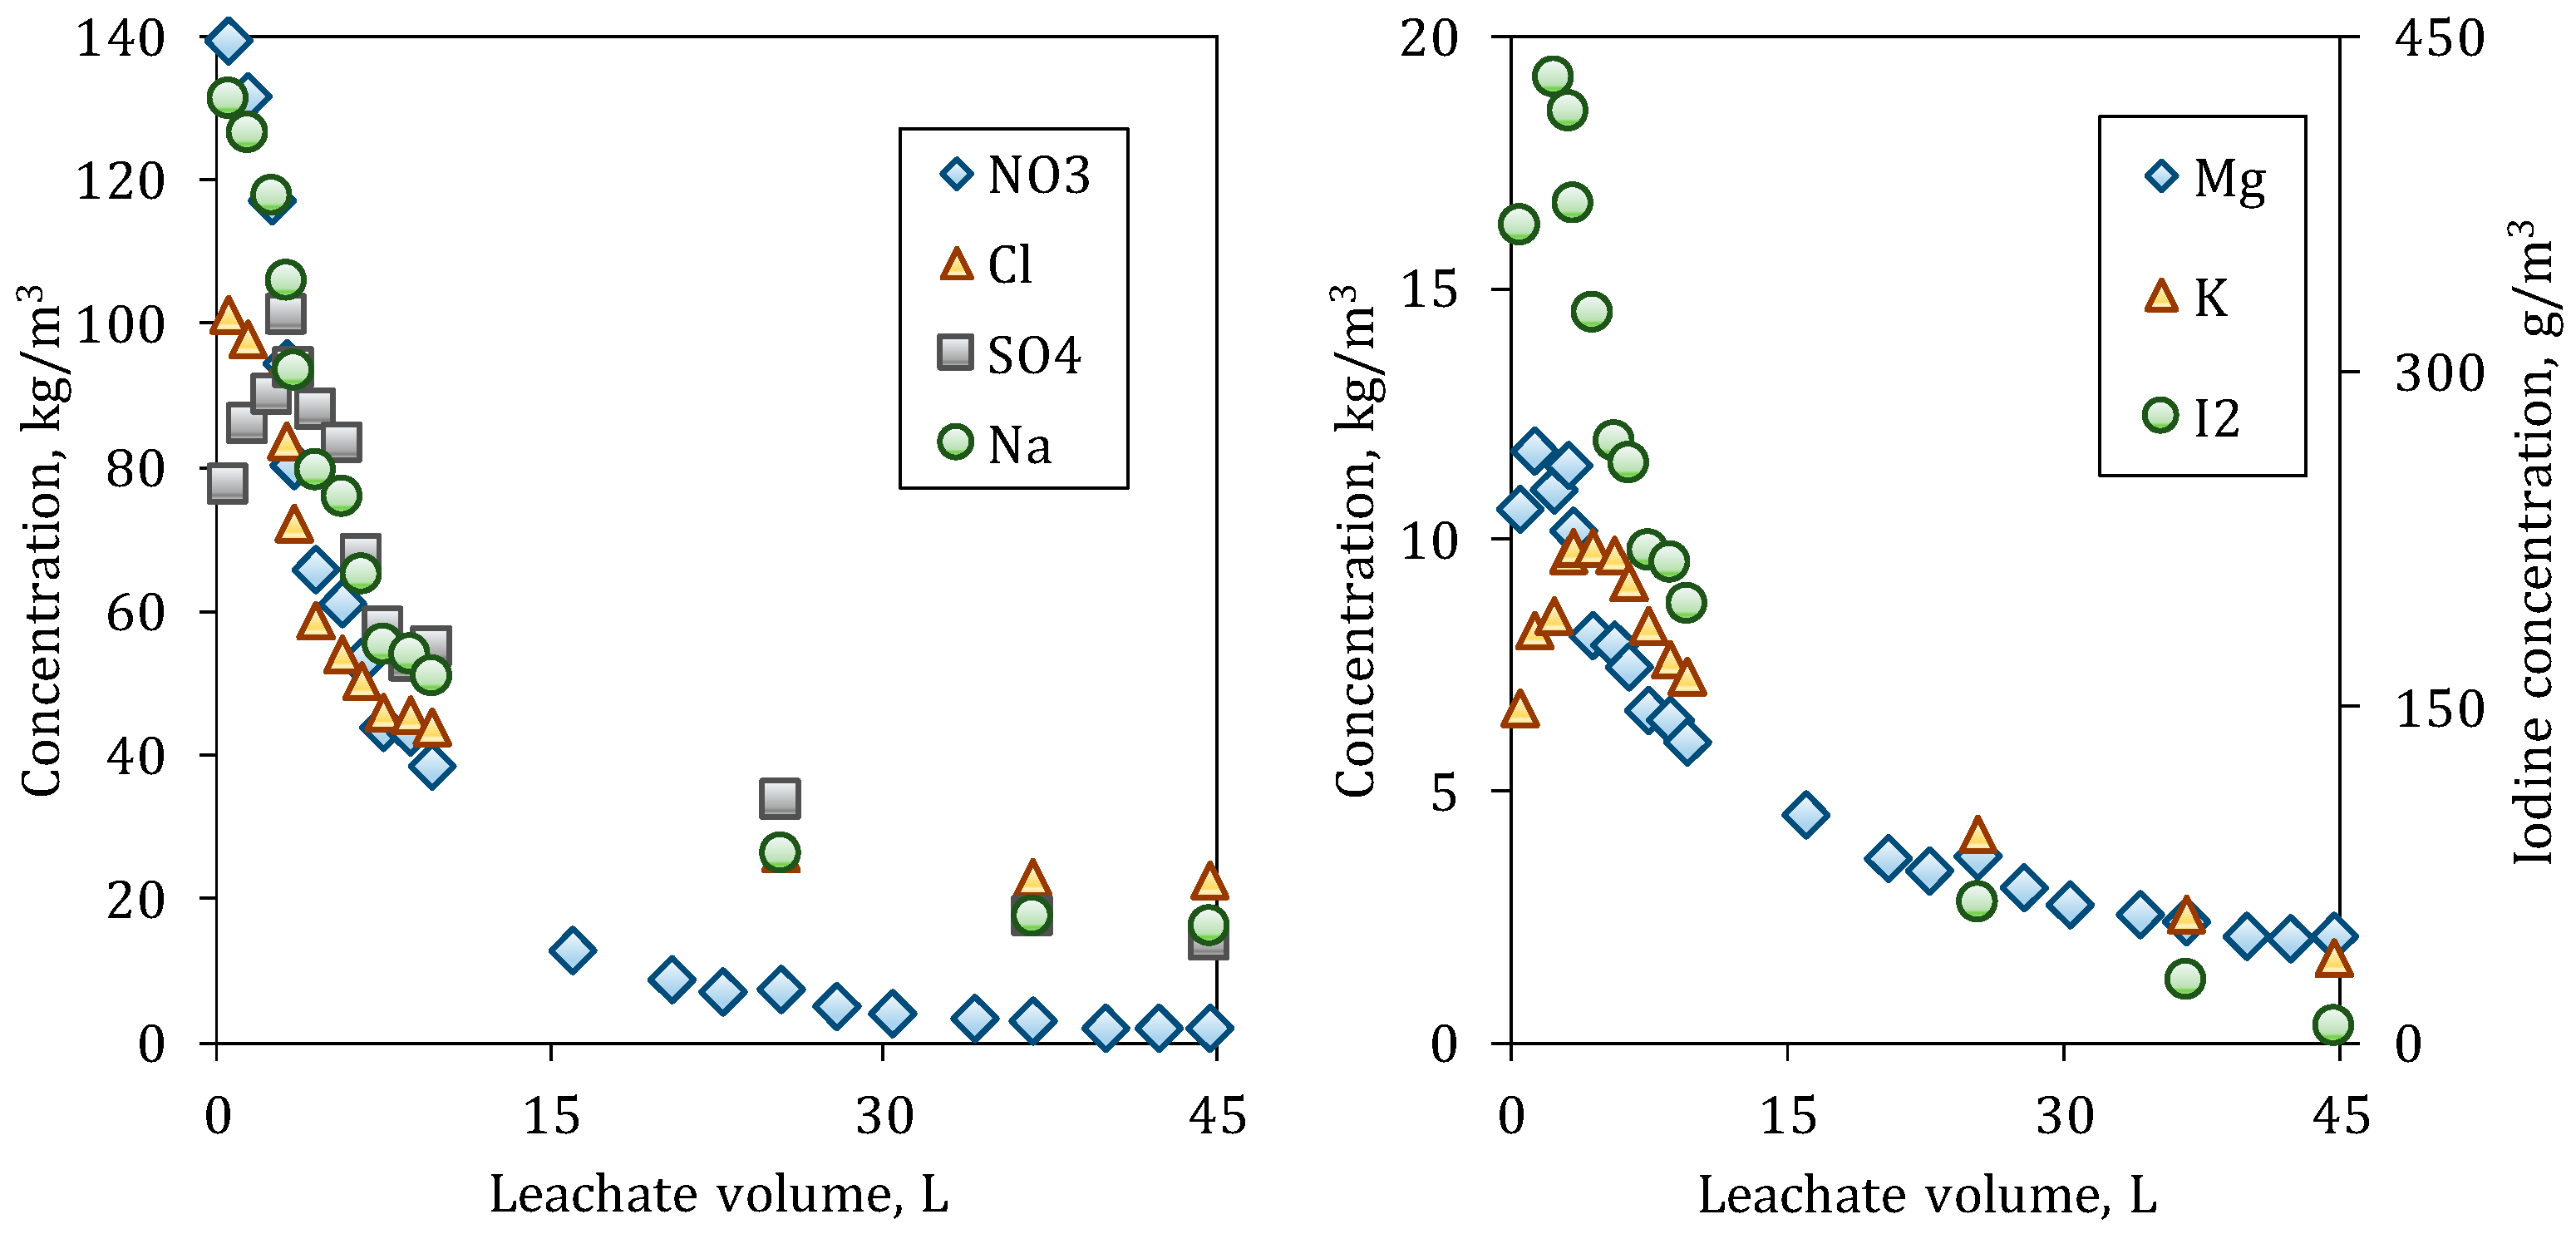
Figure 6.
Outlet concentrations of the soluble species during leaching of the C80 column.

Figure 7.
Simulated concentrations as a function of time at three different depths into the column for both species with different granulometry (a) C20 column and (b) C80 column. Solid lines describe A-species and dashed lines B-species. Wider lines indicate deeper reactors and = 11 denotes the last reactor and the outlet concentration from column.
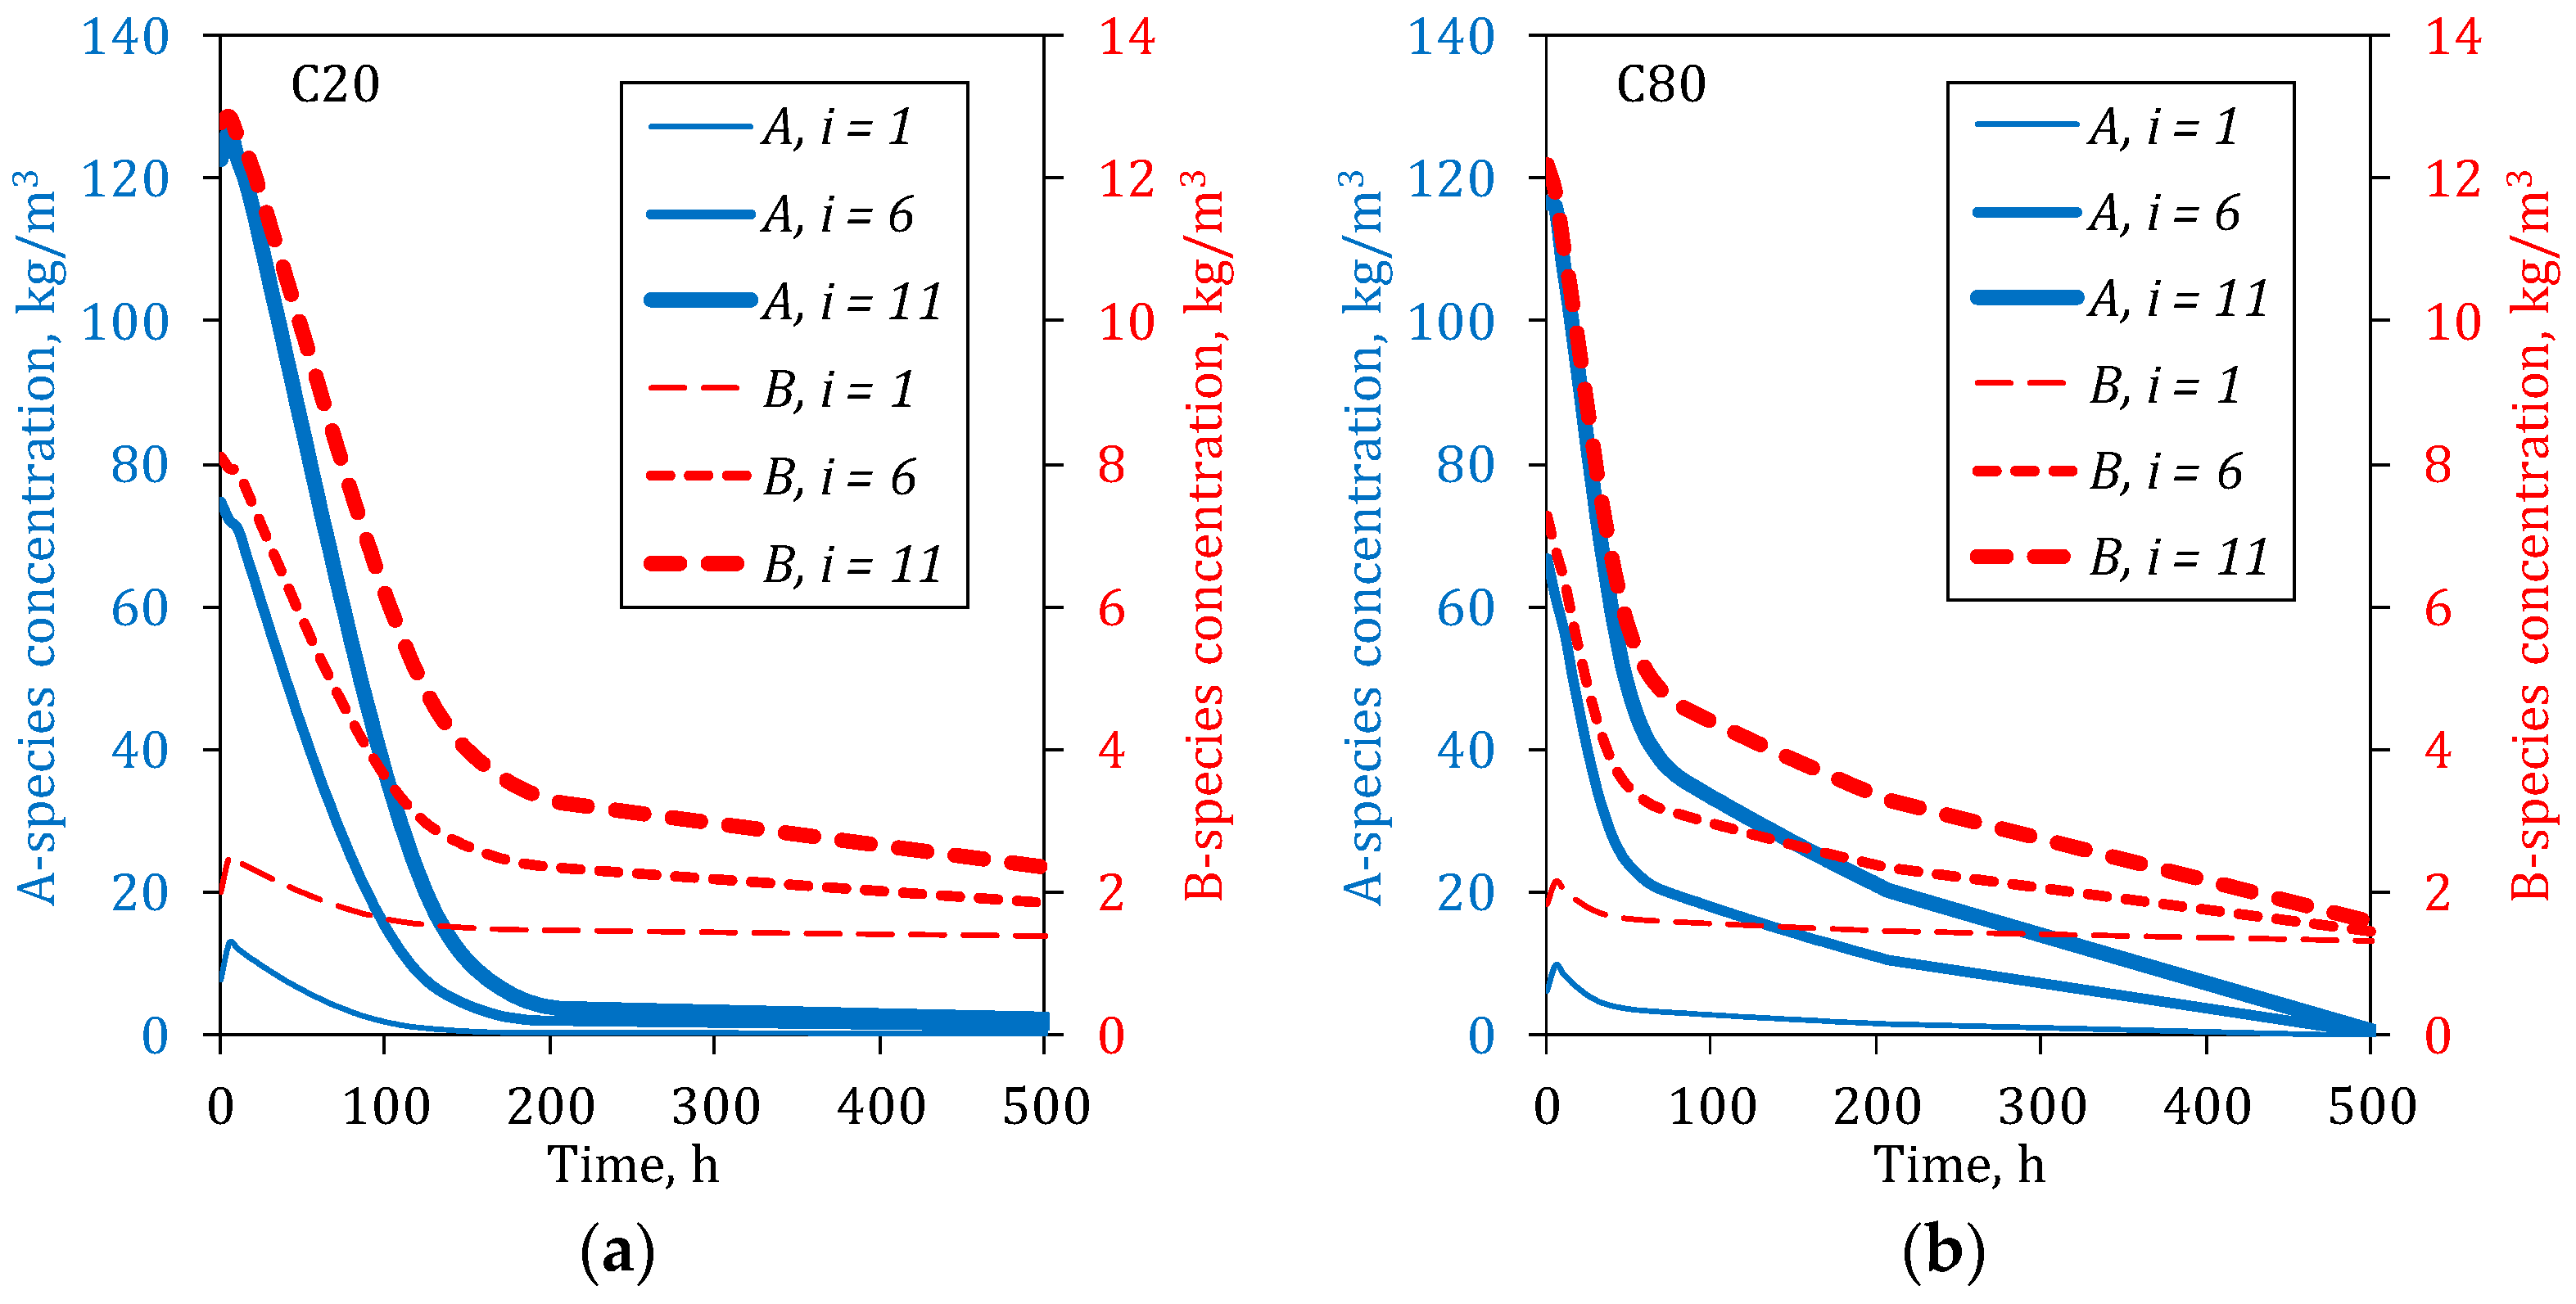
Figure 8.
Comparison between simulated (lines) and experimental data (dots) for Nitrate (A-species) and Magnesium (B-species) for the columns: (a) C20 and (b) C80.
Figure 8.
Comparison between simulated (lines) and experimental data (dots) for Nitrate (A-species) and Magnesium (B-species) for the columns: (a) C20 and (b) C80.
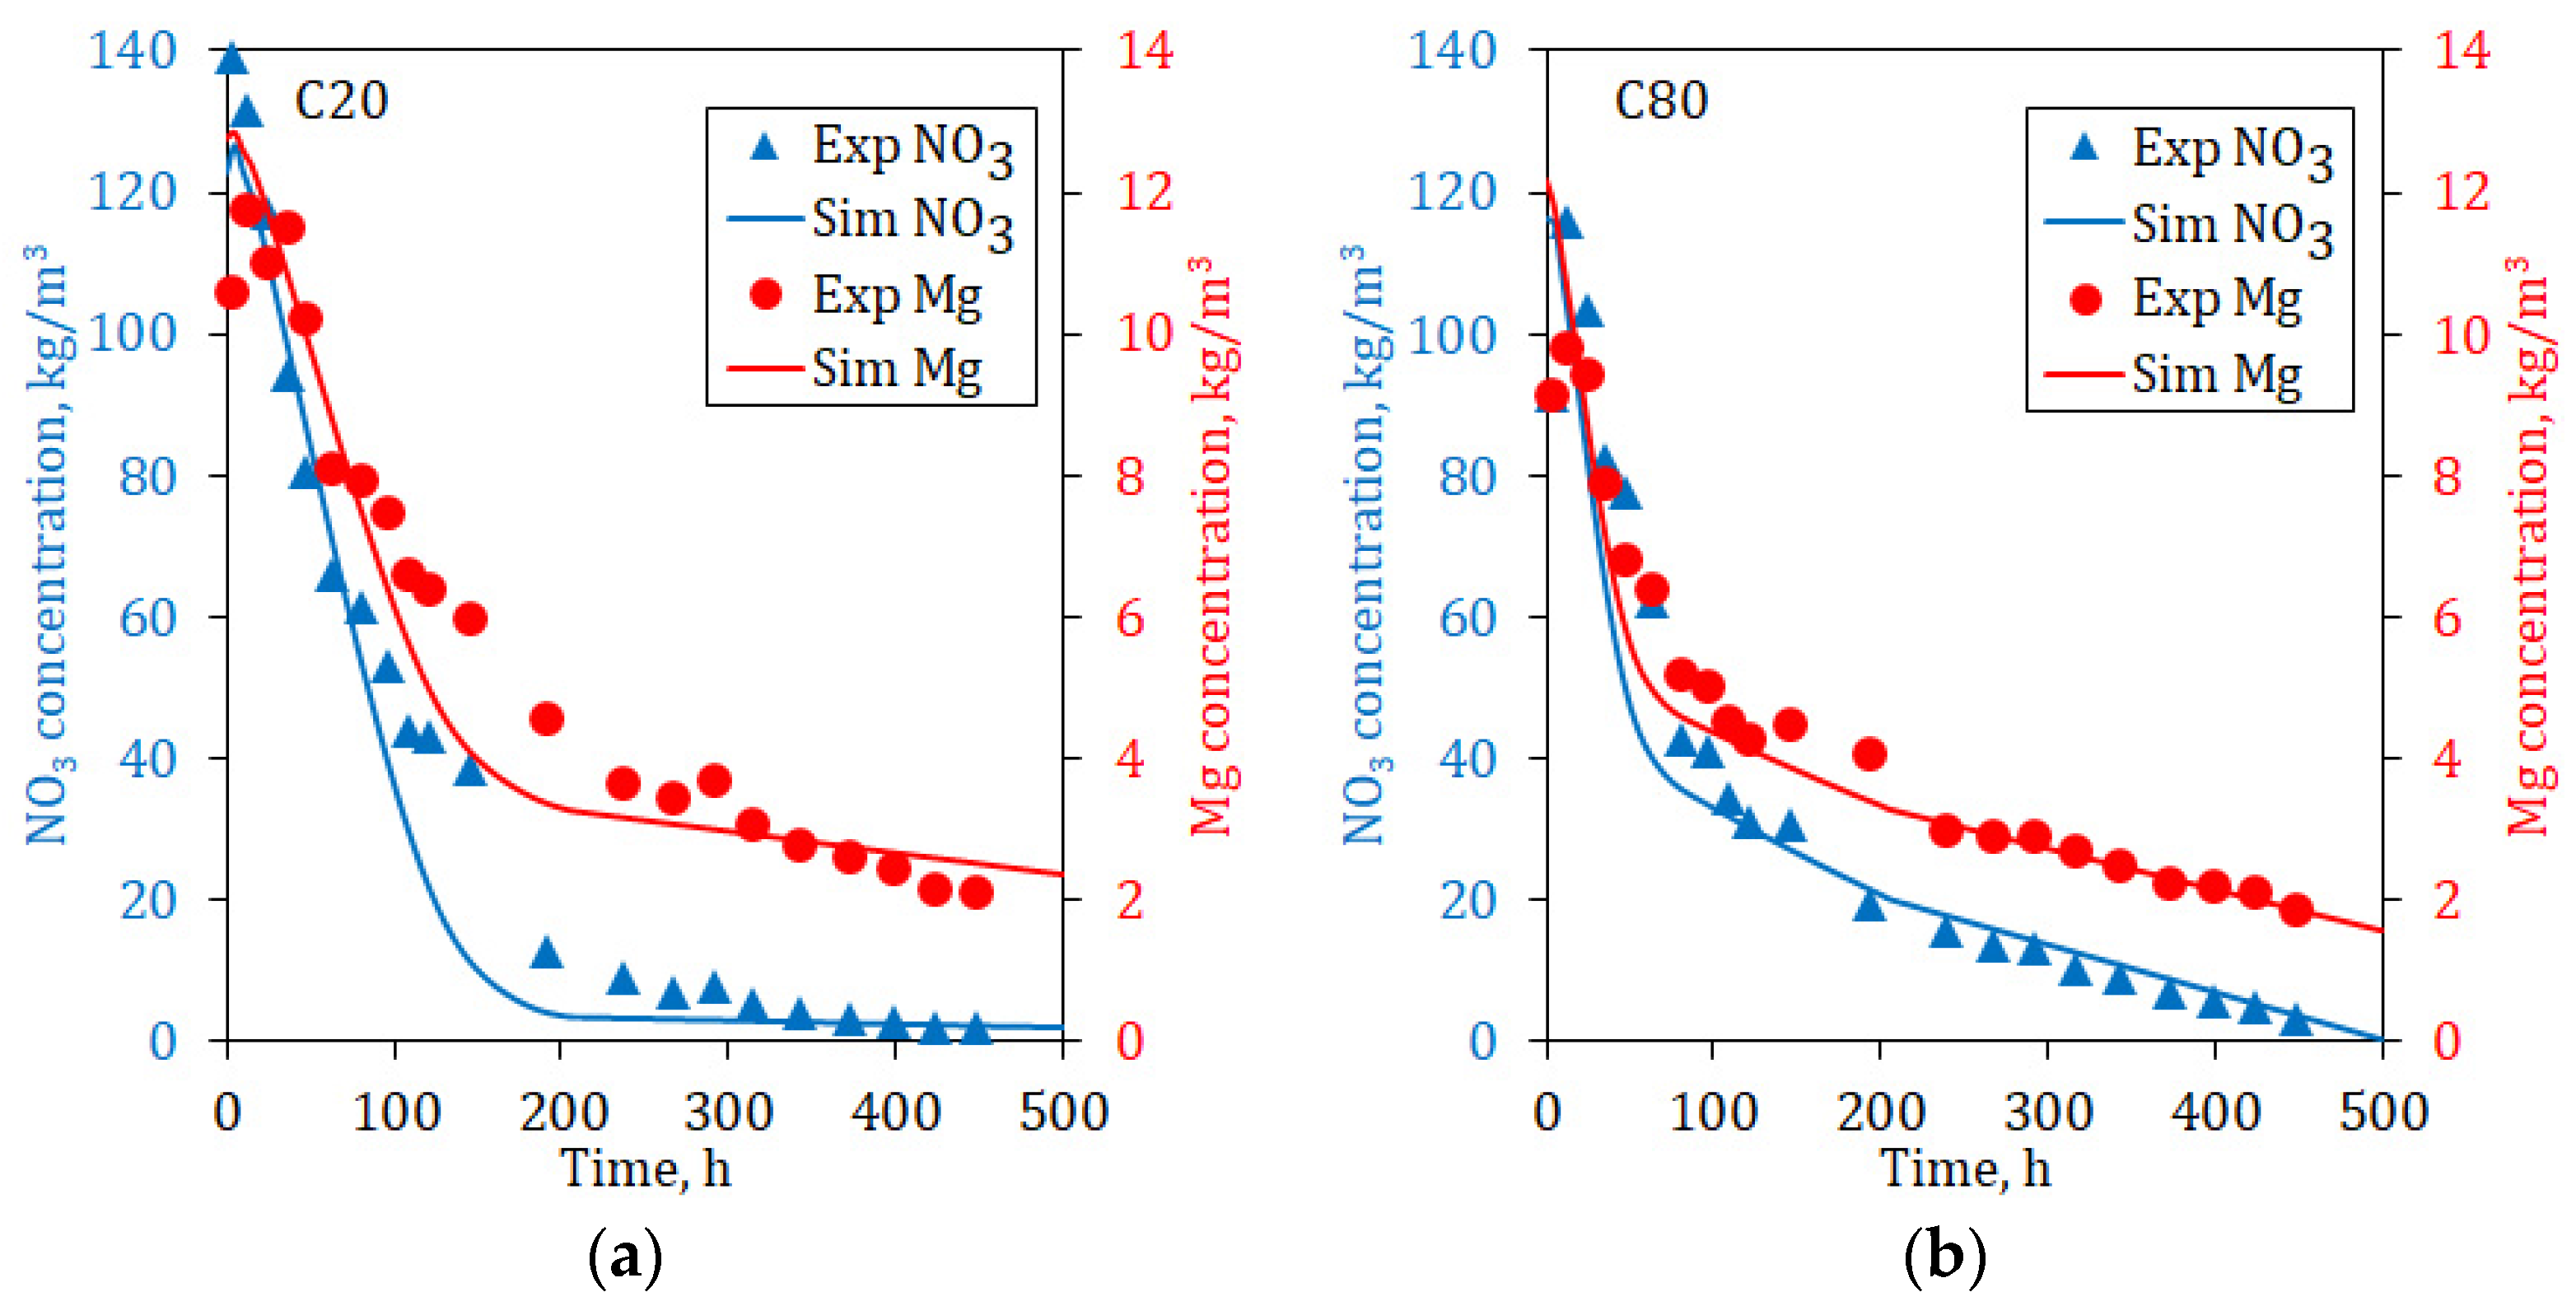
Figure 9.
Simulated recoveries for column C20. (a) Nitrate and (b) Magnesium, using the radii of Table 6. Markers represent the experimental data, the solid line is the Particle Size Distribution (PSD), the dashed line is R32 and the dotted line is R43.
Figure 9.
Simulated recoveries for column C20. (a) Nitrate and (b) Magnesium, using the radii of Table 6. Markers represent the experimental data, the solid line is the Particle Size Distribution (PSD), the dashed line is R32 and the dotted line is R43.
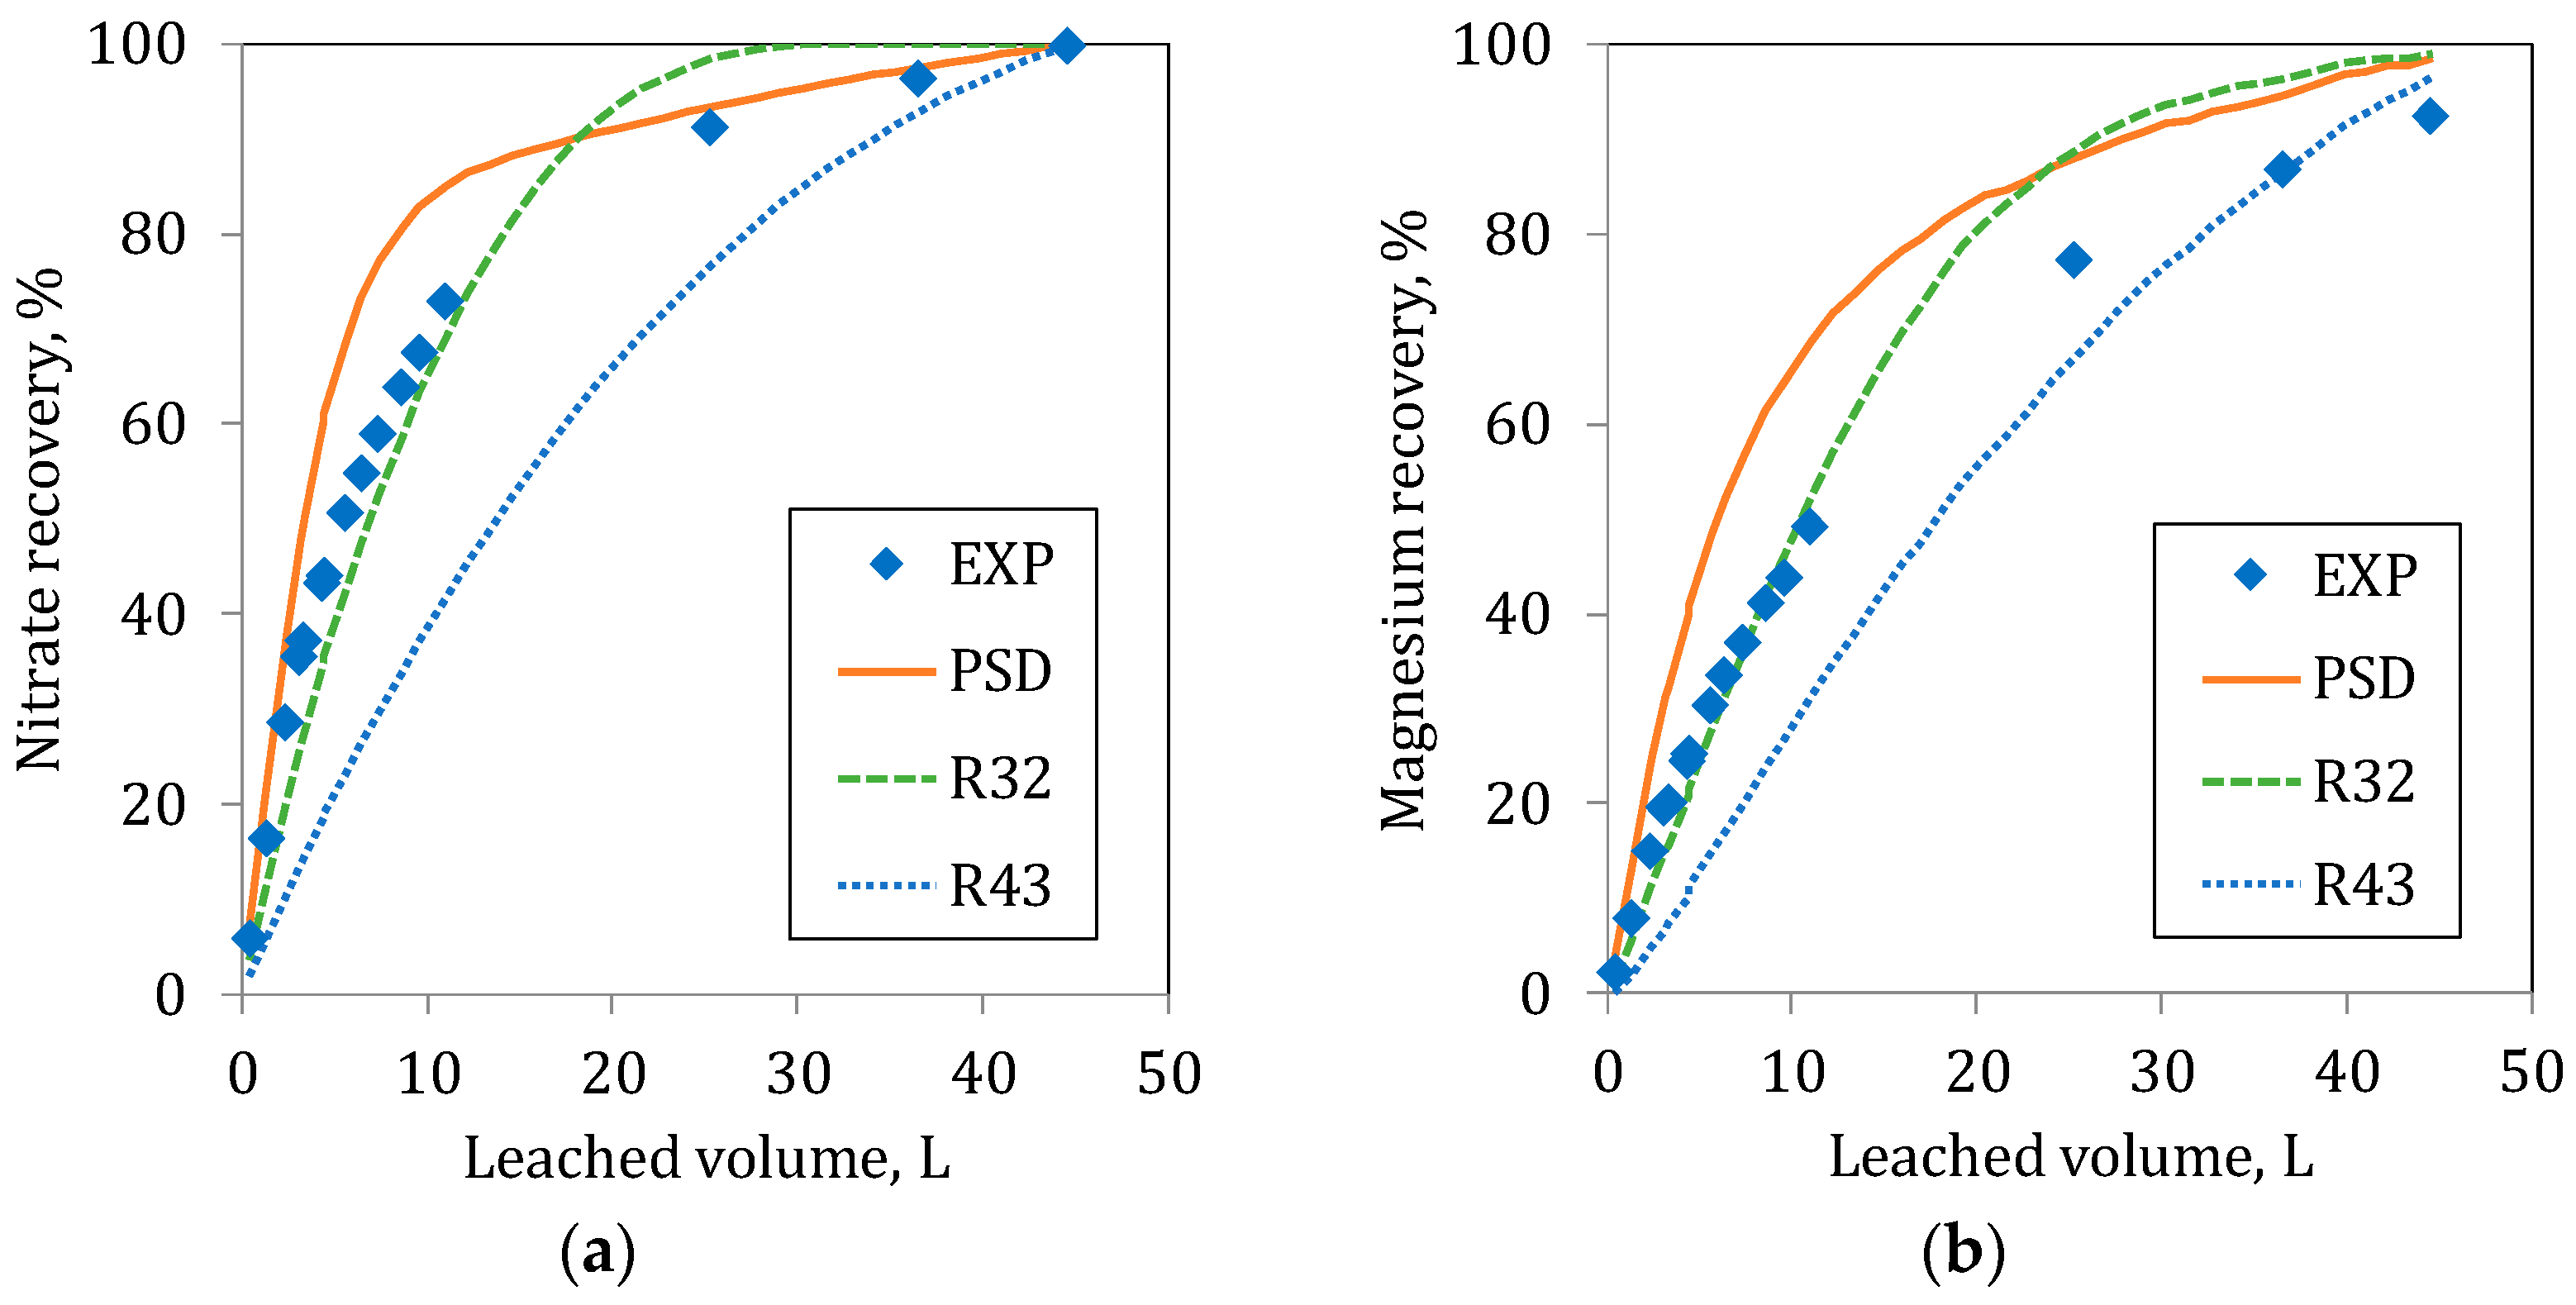
Figure 10.
Simulated recoveries for column C80. (a) Nitrate and (b) Magnesium, using the radii of Table 6. Markers represent the experimental data, the solid line is the Particle Size Distribution (PSD), the dashed line is R32 and the dotted line is R43.
Figure 10.
Simulated recoveries for column C80. (a) Nitrate and (b) Magnesium, using the radii of Table 6. Markers represent the experimental data, the solid line is the Particle Size Distribution (PSD), the dashed line is R32 and the dotted line is R43.


Table 1.
Chemical and mineral composition of the soluble fraction of caliche ore used in the leaching experiments.
Table 1.
Chemical and mineral composition of the soluble fraction of caliche ore used in the leaching experiments.
| Name | Formula | SO4 | Na | Cl | NO3 | Ca | K | Mg | Mineral, % |
|---|---|---|---|---|---|---|---|---|---|
| Halite | NaCl | X | X | 18.2 | |||||
| Nitratine | NaNO3 | X | X | 8.1 | |||||
| Glauberite | Na2Ca(SO4)2 | X | X | X | 8.0 | ||||
| Humberstonite | K3Na7Mg2(SO4)6(NO3)2·6H2O | X | X | X | X | X | 6.7 | ||
| Loeweite | Na12Mg7(SO4)13·15H2O | X | X | X | 5.1 | ||||
| Polyhalite | K2Ca2Mg(SO4)4·2H2O | X | X | X | X | 3.5 | |||
| Bloedite | Na2Mg(SO4)2·4H2O | X | X | X | 2.0 | ||||
| Kieserite | MgSO4·H2O | X | X | 0.5 | |||||
| Average content in Caliche, % | 15.9 | 12.6 | 11.0 | 6.6 | 1.6 | 1.2 | 1.1 | ||
Table 2.
Main constituents of seawater (kg/m3) used in the leaching experiments.
| SO4 | Na | Cl | NO3 | K | Ca | Mg | Density |
|---|---|---|---|---|---|---|---|
| 2.66 | 11.12 | 19.71 | 0.21 | 0.36 | 0.17 | 1.58 | 1020 |
Table 3.
Composition of fine material and coarse material in both columns.
| Column Test | Mass of Fine Particles, kg, (%) | Mass of Coarse Particles, kg, (%) | Initial Height (m) | Apparent Porosity |
|---|---|---|---|---|
| C20 | 14.6 (80) | 3.6 (20) | 0.57 | 0.55 |
| C80 | 3.6 (19) | 14.8 (81) | 0.68 | 0.63 |
Table 4.
Input data for the model simulation.
| Parameter | , m/h | , m | , g/g | , g/g | , kg/m3 | , kg/m3 |
|---|---|---|---|---|---|---|
| Value | 0.004 | 0.6 | 0.072 | 0.013 | 300 | 30 |
Table 5.
Fitted kinetic parameters obtained for both column experiments.
| Kinetic Coefficient | Column C20 | Column C80 |
|---|---|---|
| , m/h | 3.2 × 10⁻⁴ | 8.8 × 10⁻⁴ |
| , m/h | 1.7 × 10⁻³ | 4.5 × 10⁻³ |
| , 1/h | 3.0 × 10⁻³ | 3.0 × 10⁻⁴ |
Table 6.
Particle size distribution (PSD) and mean radii used in the simulations. The values in parenthesis indicate the mass fraction of the size.
Table 6.
Particle size distribution (PSD) and mean radii used in the simulations. The values in parenthesis indicate the mass fraction of the size.
| Radius | C20. Mean Radius, m (Mass Fraction) | C80. Mean Radius, m (Mass Fraction) |
|---|---|---|
| PSD | 6.50 × 10⁻³ (0.4) | 6.50 × 10⁻³ (0.1) |
| 9.50 × 10⁻³ (0.4) | 9.50 × 10⁻³ (0.1) | |
| 6.25 × 10⁻² (0.2) | 6.25 × 10⁻² (0.8) | |
| R32 | 1.87 × 10⁻² (1.0) | 5.23 × 10⁻² (1.0) |
| R43 | 3.78 × 10⁻² (1.0) | 1.07 × 10⁻¹ (1.0) |
© 2017 by the authors. Licensee MDPI, Basel, Switzerland. This article is an open access article distributed under the terms and conditions of the Creative Commons Attribution (CC BY) license (http://creativecommons.org/licenses/by/4.0/).
Share and Cite
MDPI and ACS Style
Ordóñez, J.I.; Condori, A.; Moreno, L.; Cisternas, L.A. Heap Leaching of Caliche Ore. Modeling of a Multicomponent System with Particle Size Distribution. Minerals 2017, 7, 180. https://doi.org/10.3390/min7100180
AMA Style
Ordóñez JI, Condori A, Moreno L, Cisternas LA. Heap Leaching of Caliche Ore. Modeling of a Multicomponent System with Particle Size Distribution. Minerals. 2017; 7(10):180. https://doi.org/10.3390/min7100180
Chicago/Turabian StyleOrdóñez, Javier I., Alicia Condori, Luis Moreno, and Luis A. Cisternas. 2017. "Heap Leaching of Caliche Ore. Modeling of a Multicomponent System with Particle Size Distribution" Minerals 7, no. 10: 180. https://doi.org/10.3390/min7100180
Note that from the first issue of 2016, this journal uses article numbers instead of page numbers. See further details here.