Article

Effect of Heating Rate on Pyrolysis Behavior and Kinetic Characteristics of Siderite

College of Resources and Civil Engineering, Northeastern University, Shenyang 110819, China
*
Authors to whom correspondence should be addressed.
Minerals 2017, 7(11), 211; https://doi.org/10.3390/min7110211
Submission received: 10 October 2017 / Revised: 29 October 2017 / Accepted: 1 November 2017 / Published: 3 November 2017

Abstract

:
The pyrolysis characteristics of siderite at different heating rates under the neutral atmosphere were investigated using various tools, including comprehensive thermal analyzer, tube furnace, X-ray diffraction (XRD), scanning electron microscope (SEM), energy-dispersive spectrometry (EDS) and vibrating specimen magnetometer (VSM) measurements. The reaction of siderite pyrolysis followed the one-step reaction under the neutral atmosphere: FeCO3 → Fe3O4 + CO2 + CO. As the increasing of heating rate, the start and end pyrolysis temperatures and temperate where maximum weight loss rate occurred increased, while the total mass loss were essentially the same. Increasing heating rate within a certain range was in favor of shortening the time of each reaction stage, and the maximum conversion rate could be reached with a short time. The most probable mechanism function for non-isothermal pyrolysis of siderite at different heating rates was A1/2 reaction model (nucleation and growth reaction). With increasing heating rate, the corresponding activation energies and the pre-exponential factors increased, from 446.13 to 505.19 kJ∙mol−1, and from 6.67 × 10⁻¹⁸ to 2.40 × 10⁻²¹, respectively. All siderite was transformed into magnetite with a porous structure after pyrolysis, and some micro-cracks were formed into the particles. The magnetization intensity and specific susceptibility increased significantly, which created favorable conditions for the further effective concentration of iron ore.

1. Introduction

China is rich in siderite resources, which are difficult to exploit by traditional beneficiation methods. The development of efficient utilization technology for siderite can increase the reserves of available iron ore, improve the tight situation of iron ore supply, and ensure the iron ore security of China. Magnetization roasting followed by magnetic separation was the most effective technology for the exploitation and utilization of siderite resources [1,2,3,4]. During the process, the siderite could be transformed to a highly magnetic mineral phase, while the magnetism of gangue minerals was barely changed, benefiting magnetic separation of the iron minerals and gangue minerals effectively [5,6,7,8,9]. The pyrolysis behavior and kinetic characteristics are important to better understand and further improve the magnetization roasting for siderite.
Many studies have focused on the pyrolysis mechanism, including the conversion process, pyrolysis product characteristics and pyrolysis kinetics in the process of siderite magnetization roasting. It was found that the phase transformation process in weak oxidizing atmosphere followed the steps as: FeCO3 → Fe3O4 → γ-Fe2O3 at 550 °C, and FeCO3 → FeO + Fe3O4 → Fe3O4 → γ-Fe2O3 → α-Fe2O3 at 800 °C. In inert atmosphere, the decomposition pathway was: FeCO3 → Fe3O4 below 733 °C, and FeCO3 → FeO + Fe3O4 above 733 °C [10]. The final product was α-Fe2O3 under the oxygen flow, and it was Fe3O4 in a CO2 atmosphere, while the FeO and Fe3O4 were only observed in an inert atmosphere [11,12,13]. Geva et al. [14] concluded the potassium markedly increased the reduction rate of wustite and changed the iron properties in subsequent reduction. Mn and Mg impurities existed in natural siderite as isomorphism state with iron and thereby influenced the decomposition process [15]. The chemical and physical characteristics of siderite before and after decomposition change tremendously. The phase transformation and microstructure were extremely complex related to atmosphere, temperature, heating rate, and its characteristics [16,17,18,19]. However, there has been little systematic and theoretical research on the influence of the heating rate on siderite decomposition.
The pyrolysis kinetics of siderite ore was studied that the mechanism of siderite pyrolysis process was applicable to each particle size interval, while the pyrolysis kinetics differed under different atmospheres [20]. The pyrolysis mechanism for magnesium-manganese siderite was investigated, it was demonstrated the mechanism function was F1, with activation energy of 192 kJ·mol−1 [21]. In air atmosphere, the Avrami–Erofe’ev reaction mechanism could explicate the pyrolysis kinetics of siderite, where the isothermal pyrolysis kinetics of siderite obeyed the nucleation and growth mechanism (n = 1), and the activation energy and the pre-exponential factor (lnA) were 46.17 kJ·mol−1 and 23.02 min−1, respectively [22]. The pyrolysis kinetics of siderite in suspended state from Wangjiatan of Shanxi Province in China was conducted by Feng et al. [23] under different isothermal conditions. The result indicated that the mechanism function was R3 (phase boundary reaction), and the pyrolysis process was accelerated with increasing temperature. Most researchers have studied the pyrolysis kinetics of siderite by an isothermal approach, not verified by a non-isothermal method. Moreover, the isothermal method is difficult to implement completely in the laboratory, especially at the beginning of the reaction.
Consequently, it is necessary to study the pyrolysis mechanism and kinetic characteristics of siderite at different heating rates to further understand siderite pyrolysis behavior, and may have implication for exploitation of Fe-bearing carbonates as a source of iron ore.

2. Experimental

2.1. Materials

The bulky iron ore rich in siderite from Hunan Province of China was used in this study. The sample was crushed through a roller crusher and ground to 85% passing 0.074 mm, then the pure siderite minerals was obtained via the gravity process using a shaking table and a low-intensity magnetic separator. The chemical composition (Table 1) indicated that the most valuable element was iron, with iron grade of 44.21% and FeO content up to 58.05%. It also contained 1.19% MgO and 2.53% MnO. Harmful elements such as sulfur, phosphorus and sodium were minor. The iron mineral analysis results (Table 2) showed that iron mainly existed in form of carbonate iron (96.23%), indicating that siderite was the major mineral in the sample. The sample belonged to high-quality pure siderite, which could satisfy the experiments well.

2.2. Methods

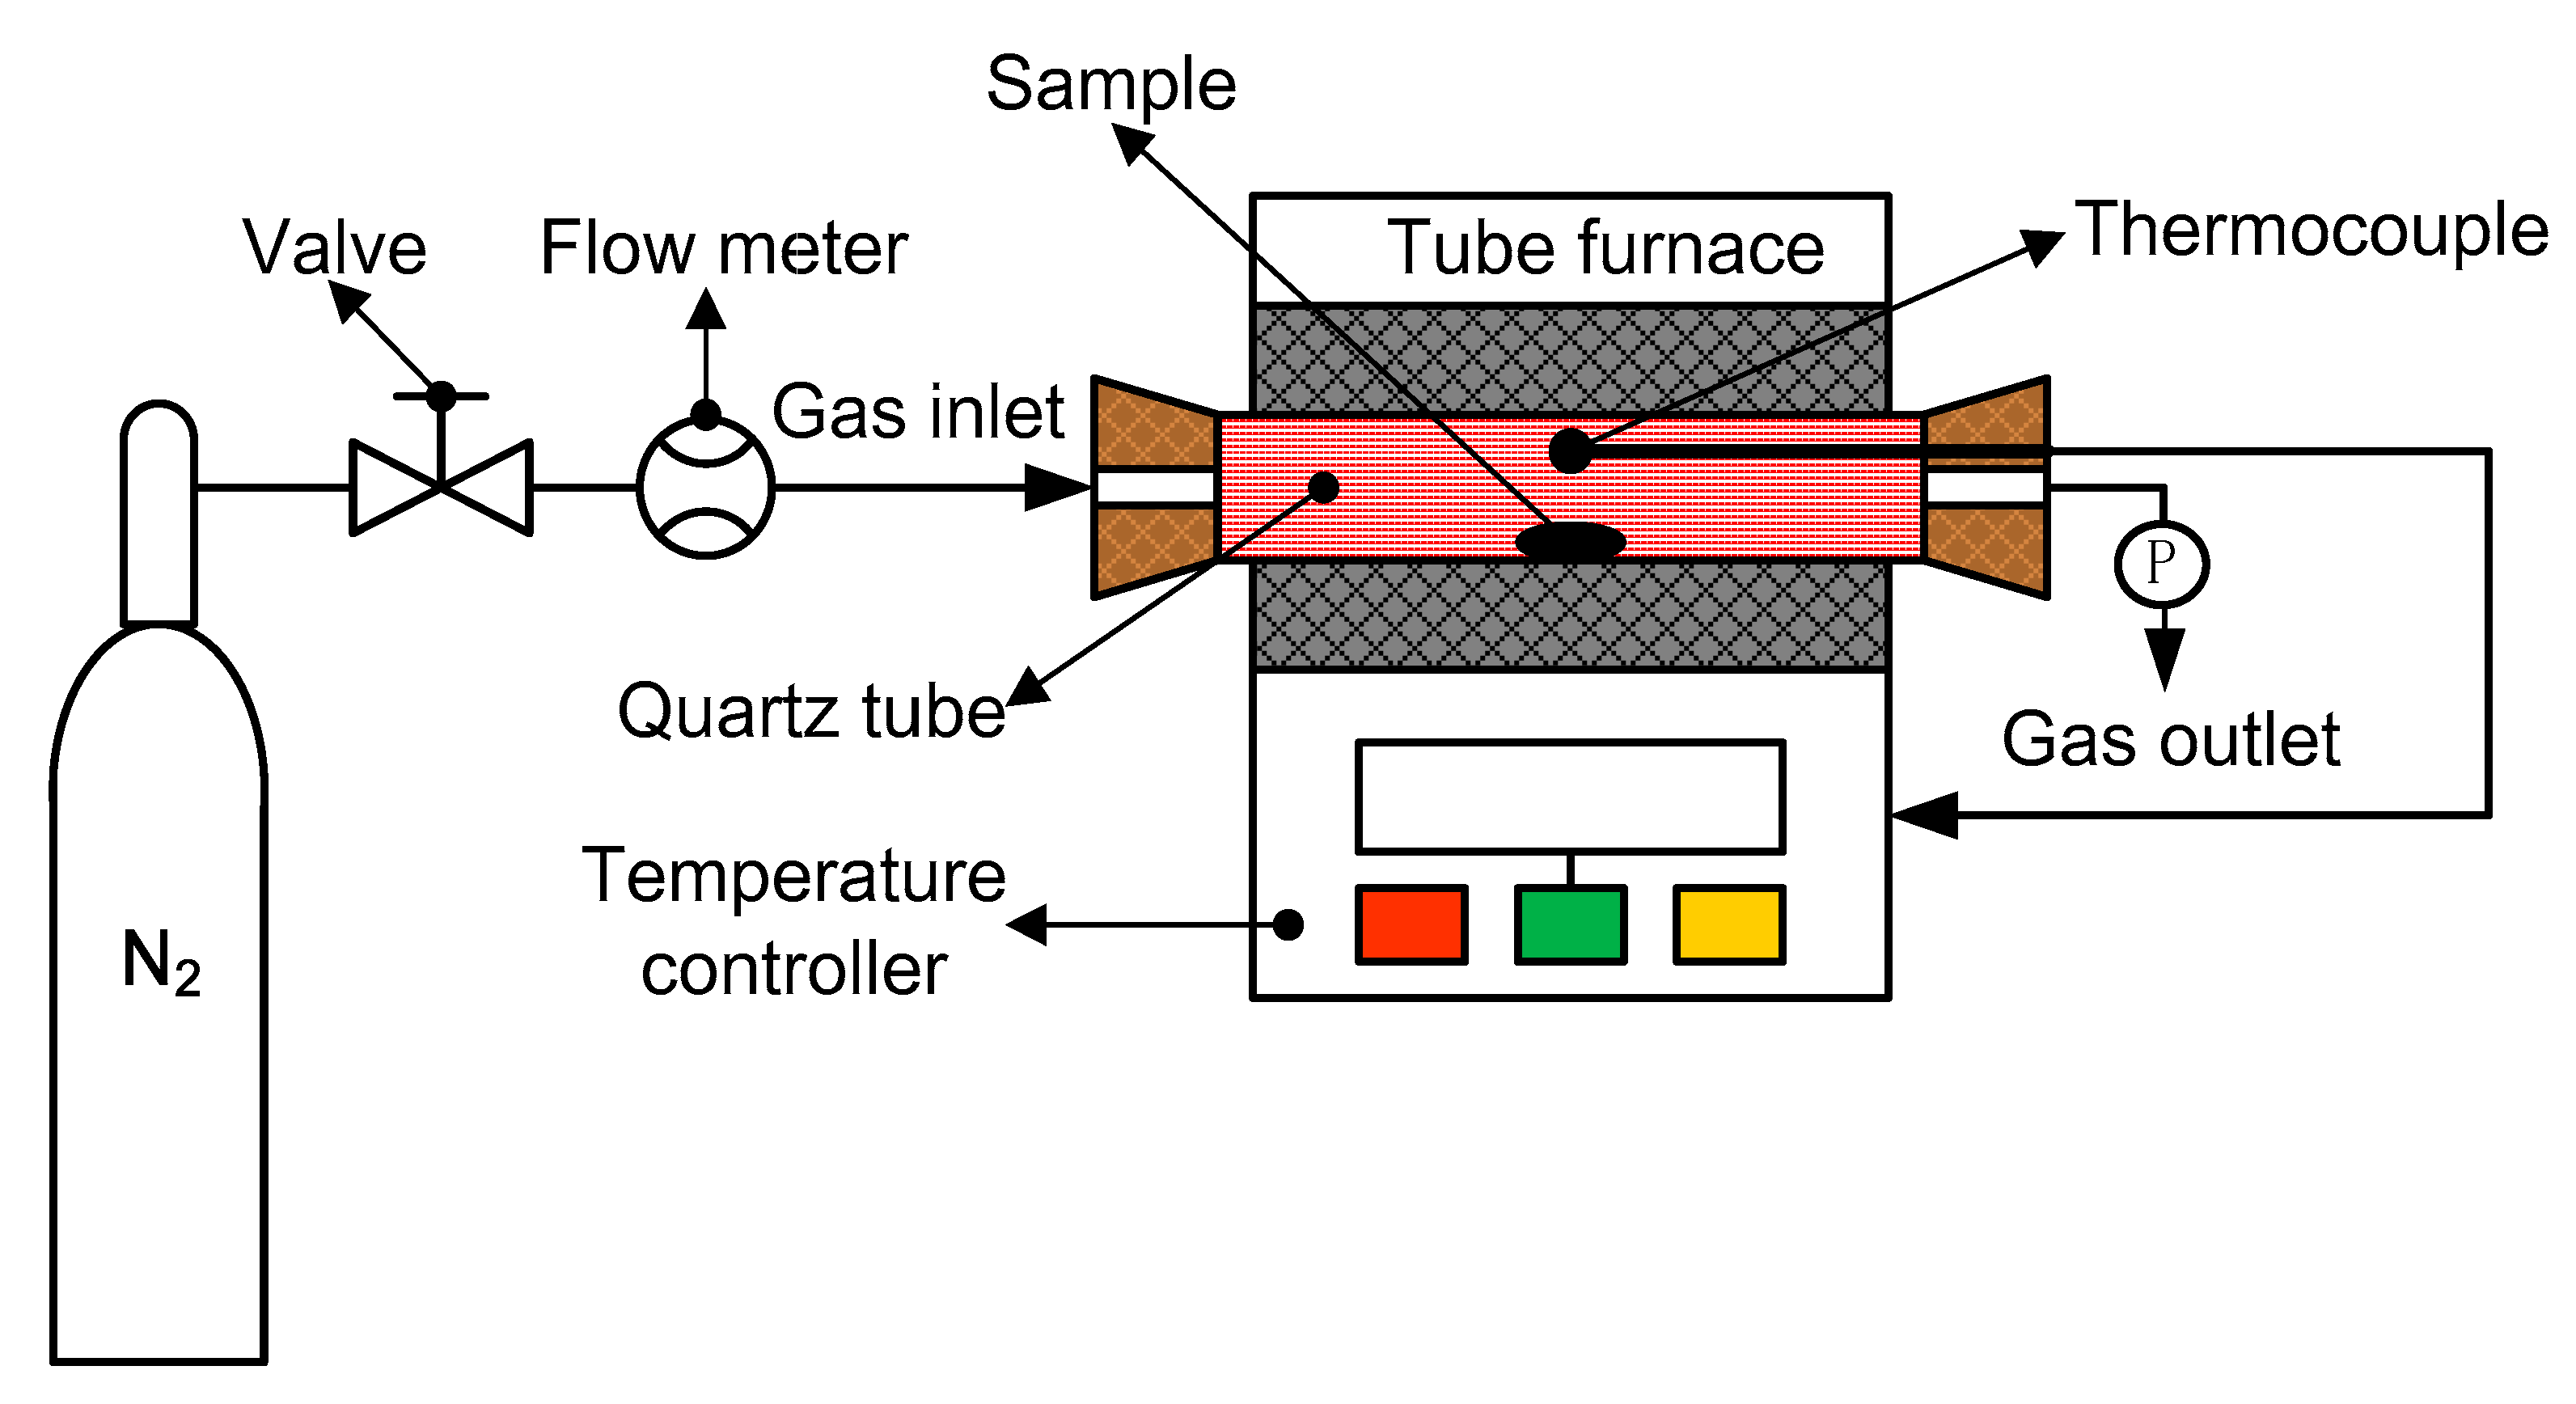
2.2.1. Pyrolysis Behavior Analysis of Siderite

The thermal decomposition was conducted by non-isothermal pyrolysis analysis using a comprehensive thermal analyzer (STA449-F3, Netzsch, Hamburg, Germany). Nitrogen (99.99%) was used as protection gas, which could restrain the diffusion effect of carbon dioxide from siderite pyrolysis. A 30 mg sample was used for each experiment at a nitrogen flow rate of 30 mL/min. The heating rates studied were 5, 10, 20 and 30 °C·min−1. The temperature range was from room temperature to 900 °C, and the thermogravimetry (TG), derivative thermogravimetry (DTG), and differential scanning calorimetry (DSC) analysis results were obtained from computer processor.

2.2.2. Pyrolysis Kinetics Characteristics of Siderite at Different Heating Rates

The conversion fraction α based on the TG analysis results can be expressed as:
α = m 0 m t m 0 m
where m0 is the initial sample mass (g), mt is the sample mass at a particular time (g), and m is the theoretical weight loss (g).
The conversion rate r can be calculated:
r = d α d t = α t
where ∆α is the weight loss in a short span of time (g), and ∆t is the short time interval (min).
Non-isothermal study of pyrolysis kinetics has great advantages compared with isothermal one. A non-isothermal thermal analysis curve often contains more information and function than isothermal analysis curves, which can make the analysis quickly and comprehensive. The differential isothermal kinetics equation of solid-state decomposition can be described by the following well-known general equation [24,25,26,27,28,29]:
d α d t = A exp E / R T · f ( α )
where E is the activation energy (kJ·mol−1), A is the pre-exponential factor, T is the temperature (Kelvin, K), t is the time (min), R is the gas constant (8.314 J·(mol·K)−1), and f(α) is the differential conversion function.
Some modifications are adopted in the non-isothermal kinetics compared with isothermal one. Introducing the heating rate (β = dT/dt, where β is heating rate, °C·min−1), the reaction rate for a heterogeneous reaction are presented by the following well-known general equation [30]:
d α d t = β d α d T = A exp E / R T · f ( α )  
By rearranging and integrating Equation (4), the integral form of mechanism function (G(α)) can be obtained:
G ( α ) = 0 T ( A β ) exp E / R T d T
Kinetic analysis is expected to obtain an adequate kinetic description of the process in terms of kinetic parameters (the reaction model, the activation energy, and the pre-exponential factor) [31]. Many methods have been established to evaluate these parameters. The Flynn–Wall–Ozawa (FWO) method based on integral isoconversional methods has been widely used to lucubrate thermodynamics [32]. By the application of Doyle’s method [33,34], the activation energy (E) can be determined as a function of the temperatures corresponding to fixed values from experiments at different heating rates:
lg ( β ) = lg ( A E R G ( α ) ) 2.315 0.4567 E R T
The most probable mechanism function can be determined by Šatava–Šesták integral method, which is given as follow [35]:
lgG ( α ) = lg ( A E S R β ) 2.315 0.4567 E S R T
The most probable mechanism function can be determined by analyzing the linear relationship between lg(G(α)) and 1/T. If only one G(α) meets the linear relationship, the G(α) is exactly the mechanism function. However, if several G(α) meet the linear relationship, the G(α), whose activation energy (Es) is approximately equal to the activation energy (E) estimated by FWO method, is the most probable mechanism function [31]. The activation energy E and the pre-exponential factor A, and correlation coefficient R can be derived from the linear least-squares plot of lg(G(α)) versus 1/T.
Siderite pyrolysis reaction is the typical gas-solid reaction. Based on previous studies, the most frequently-used reaction mechanism models of gas-solid reaction are listed in Table 3 [36,37,38,39].

2.2.3. The Characteristics of Siderite both before and after Pyrolysis

The pyrolysis products of siderite derived from comprehensive thermal analyzer were only tiny amounts, which was not available for further detection and analysis. The laboratory type tube furnace (Figure 1) was employed for the study of pyrolysis test. The tests were conducted on the temperature range from room temperature to 600 °C (based on TG/DTG/DSC analysis results), with the heating rate at 10 °C·min−1 and the flow rate of nitrogen gas was 500 mL·min−1. The phases, microstructures and magnetic properties analysis of siderite both before and after pyrolysis were investigated by X-ray diffraction (XRD, PW3040, PANalytical B.V., Almero, The Netherlands), scanning electron microscope (SEM, SSX-550, SHIMADZU, Kyoto, Japan), energy-dispersive spectrometry (EDS, SSX-550, SHIMADZU, Kyoto, Japan) and vibrating specimen magnetometer (VSM, JDAW-2000D, YingPu Magnetic Technology Development, Changchun, China) measurements.

3. Results and Discussion

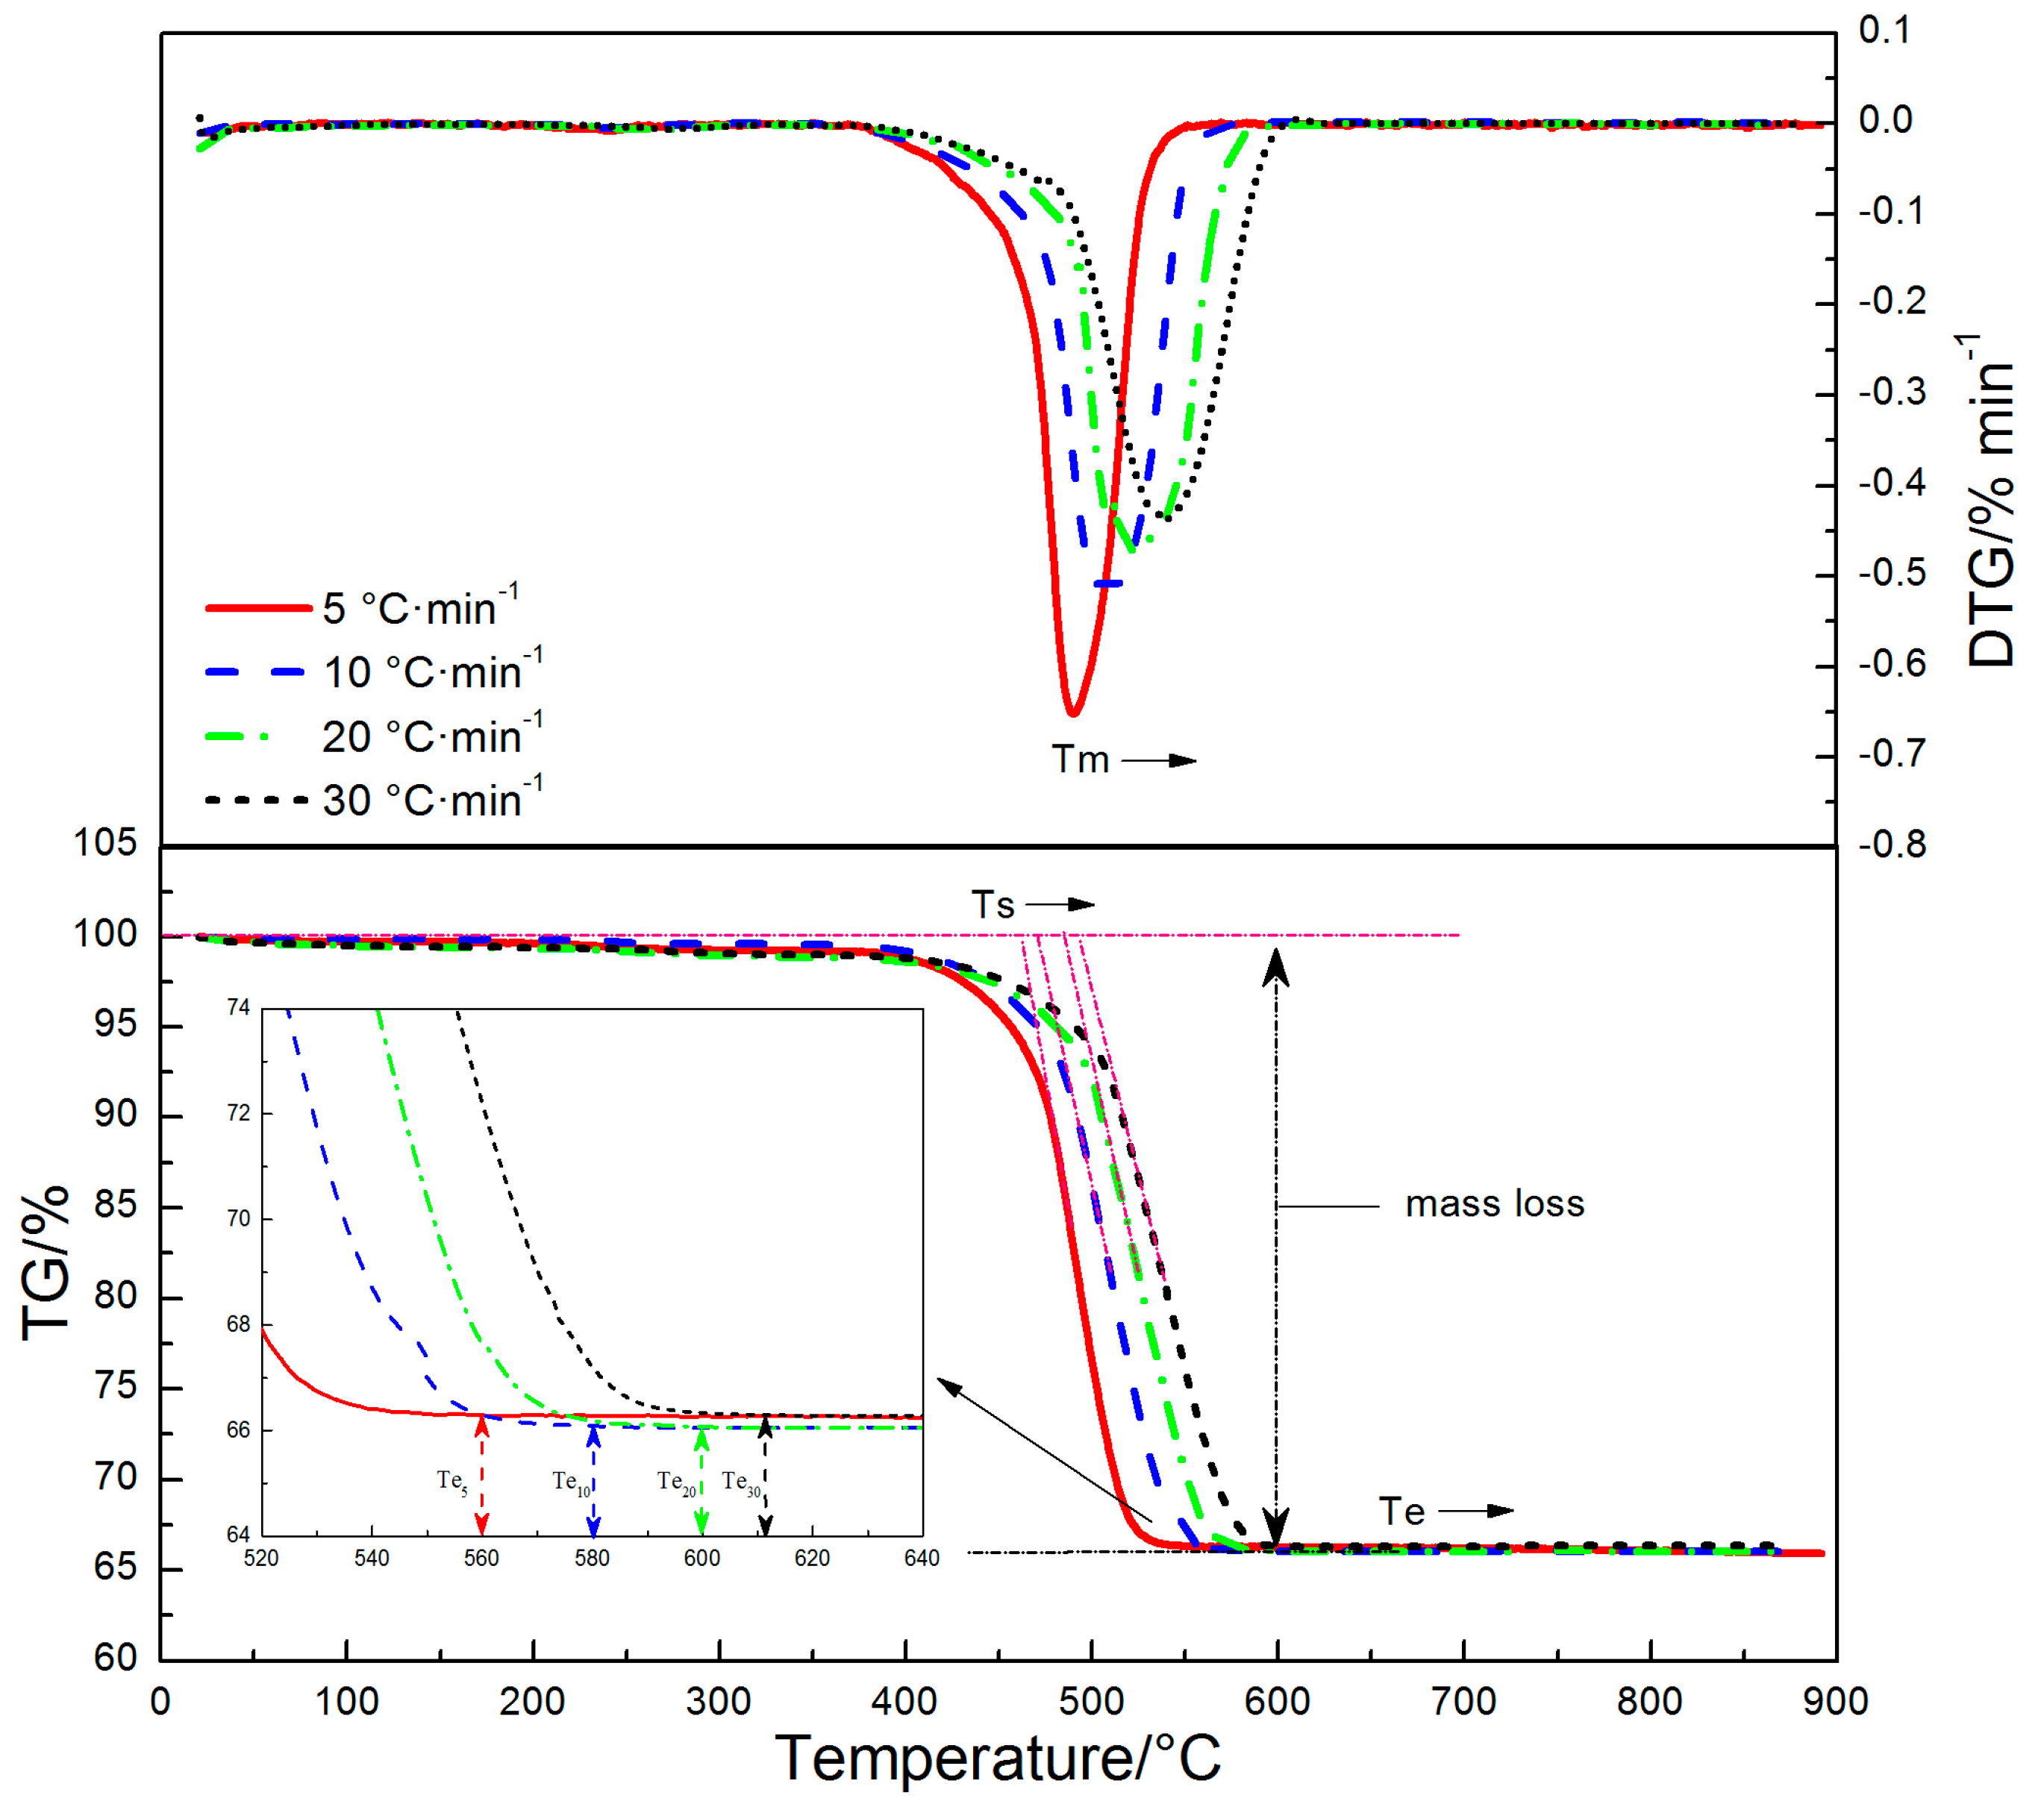
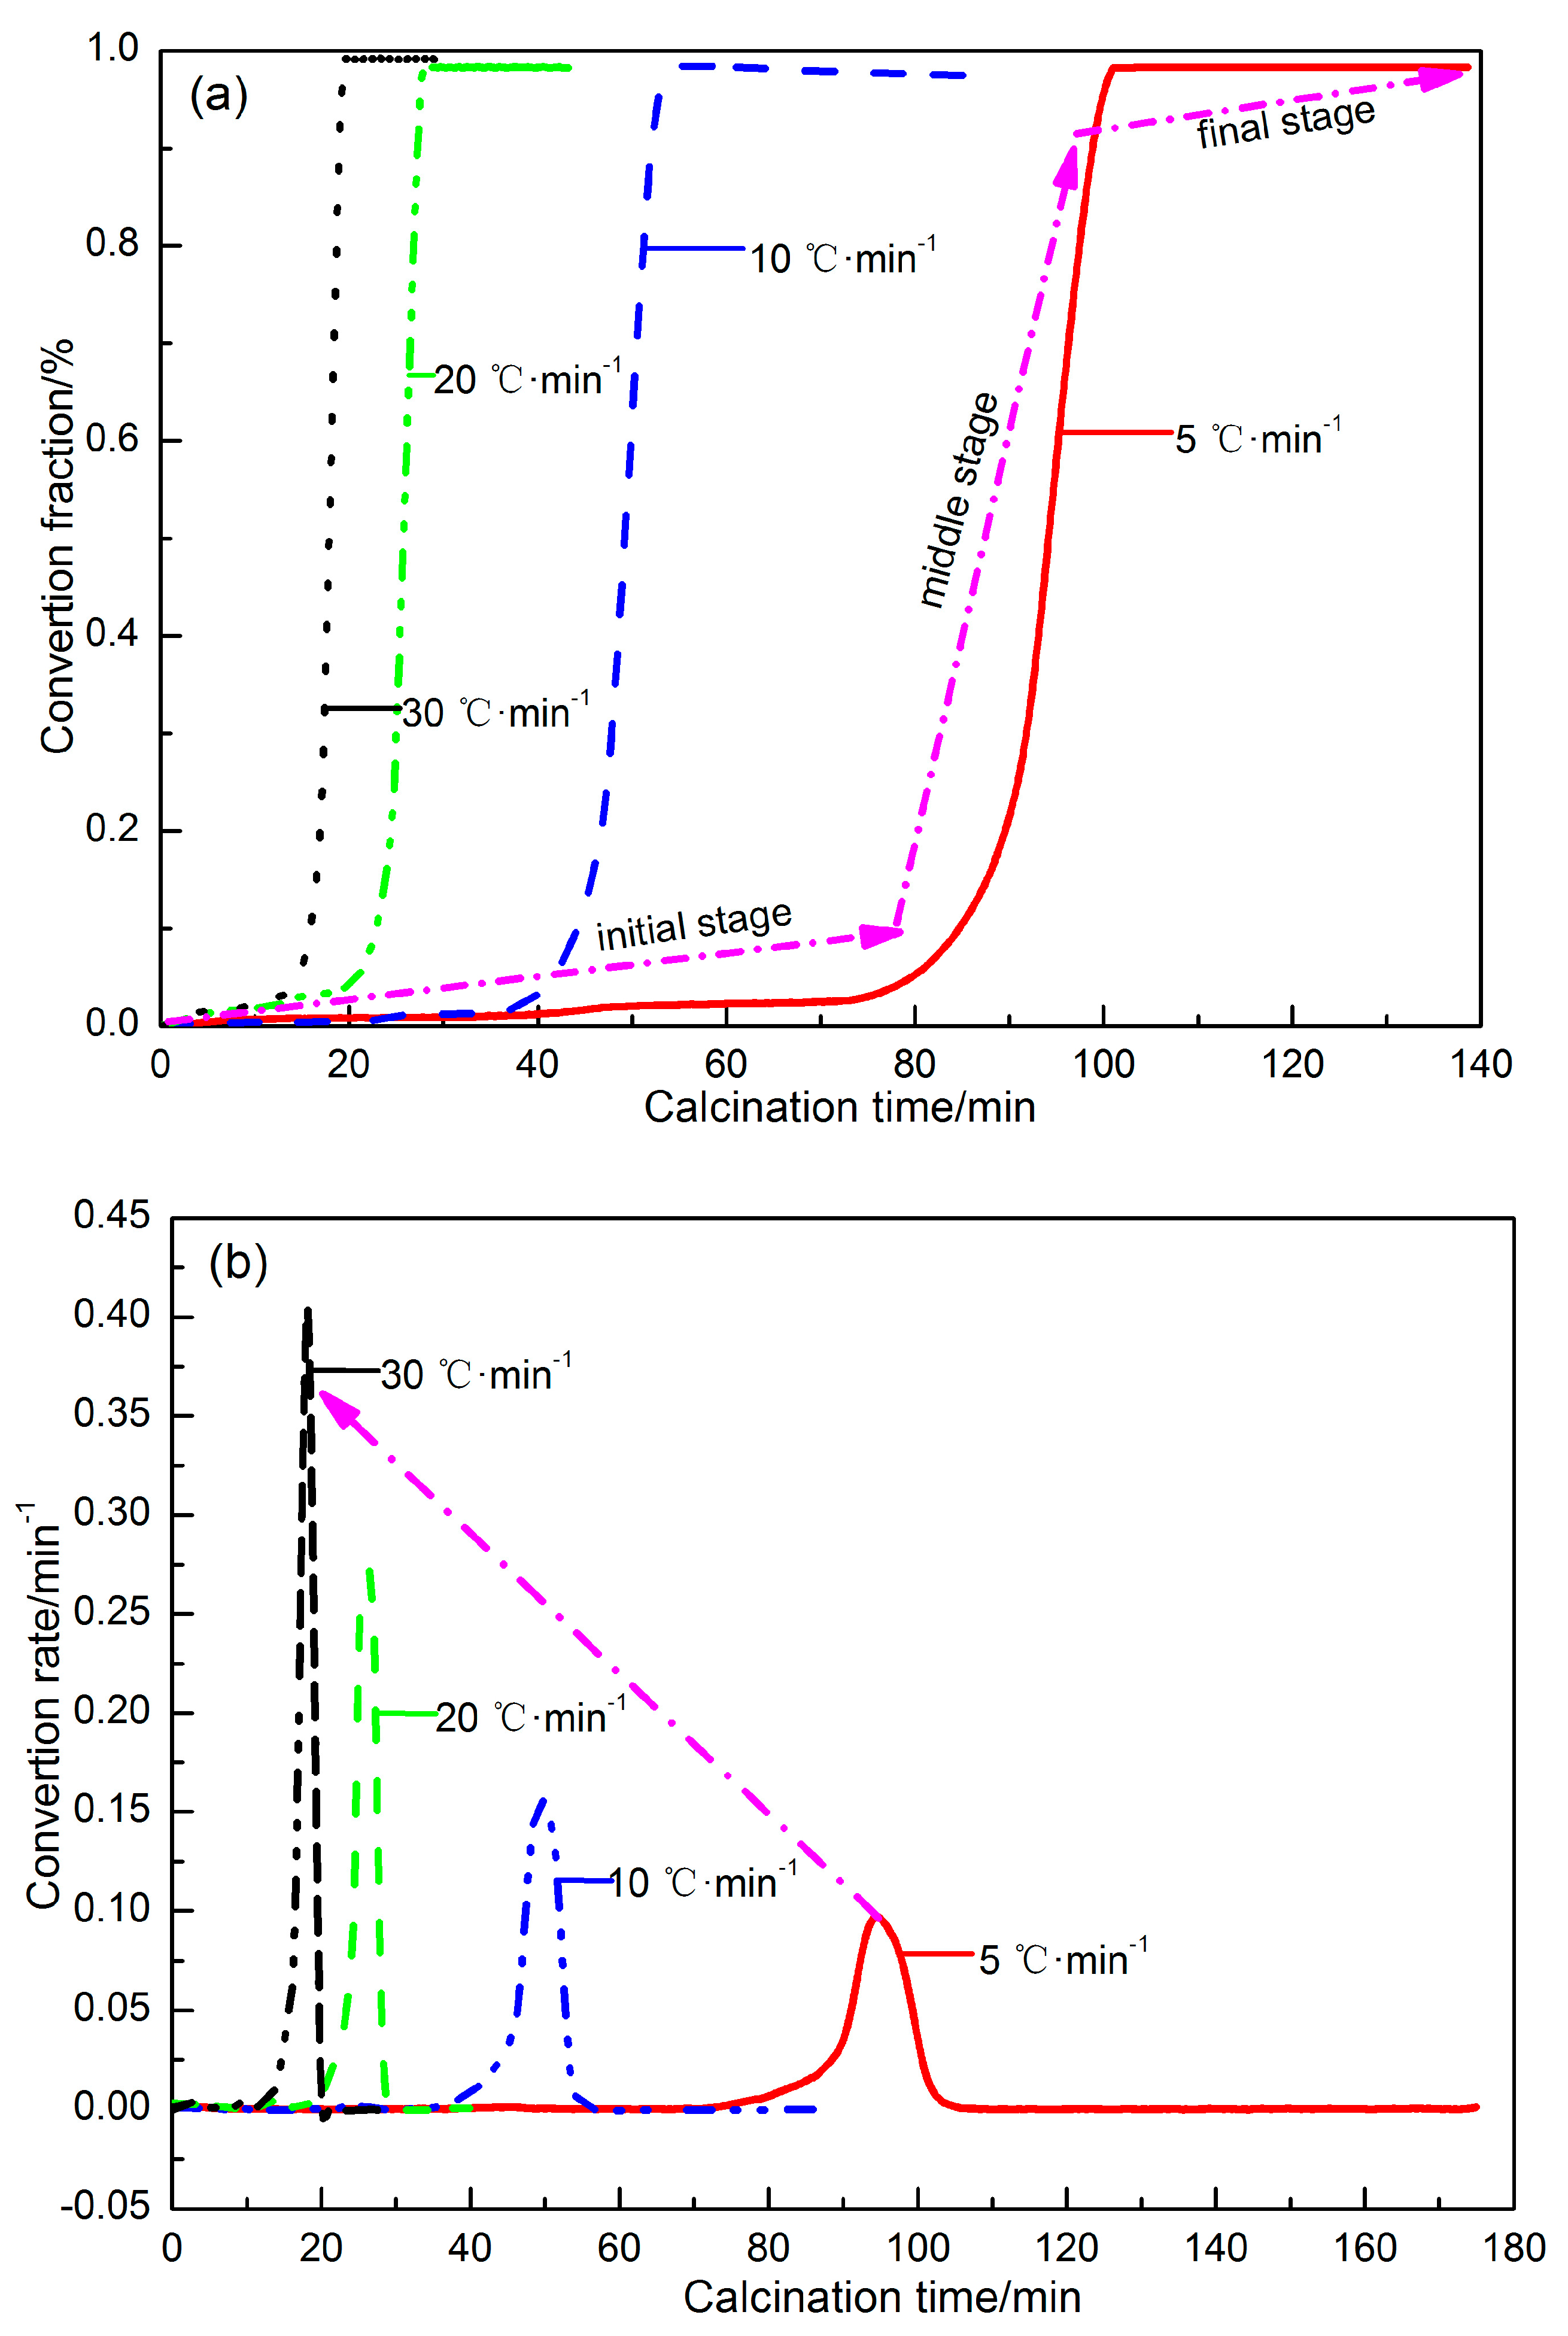
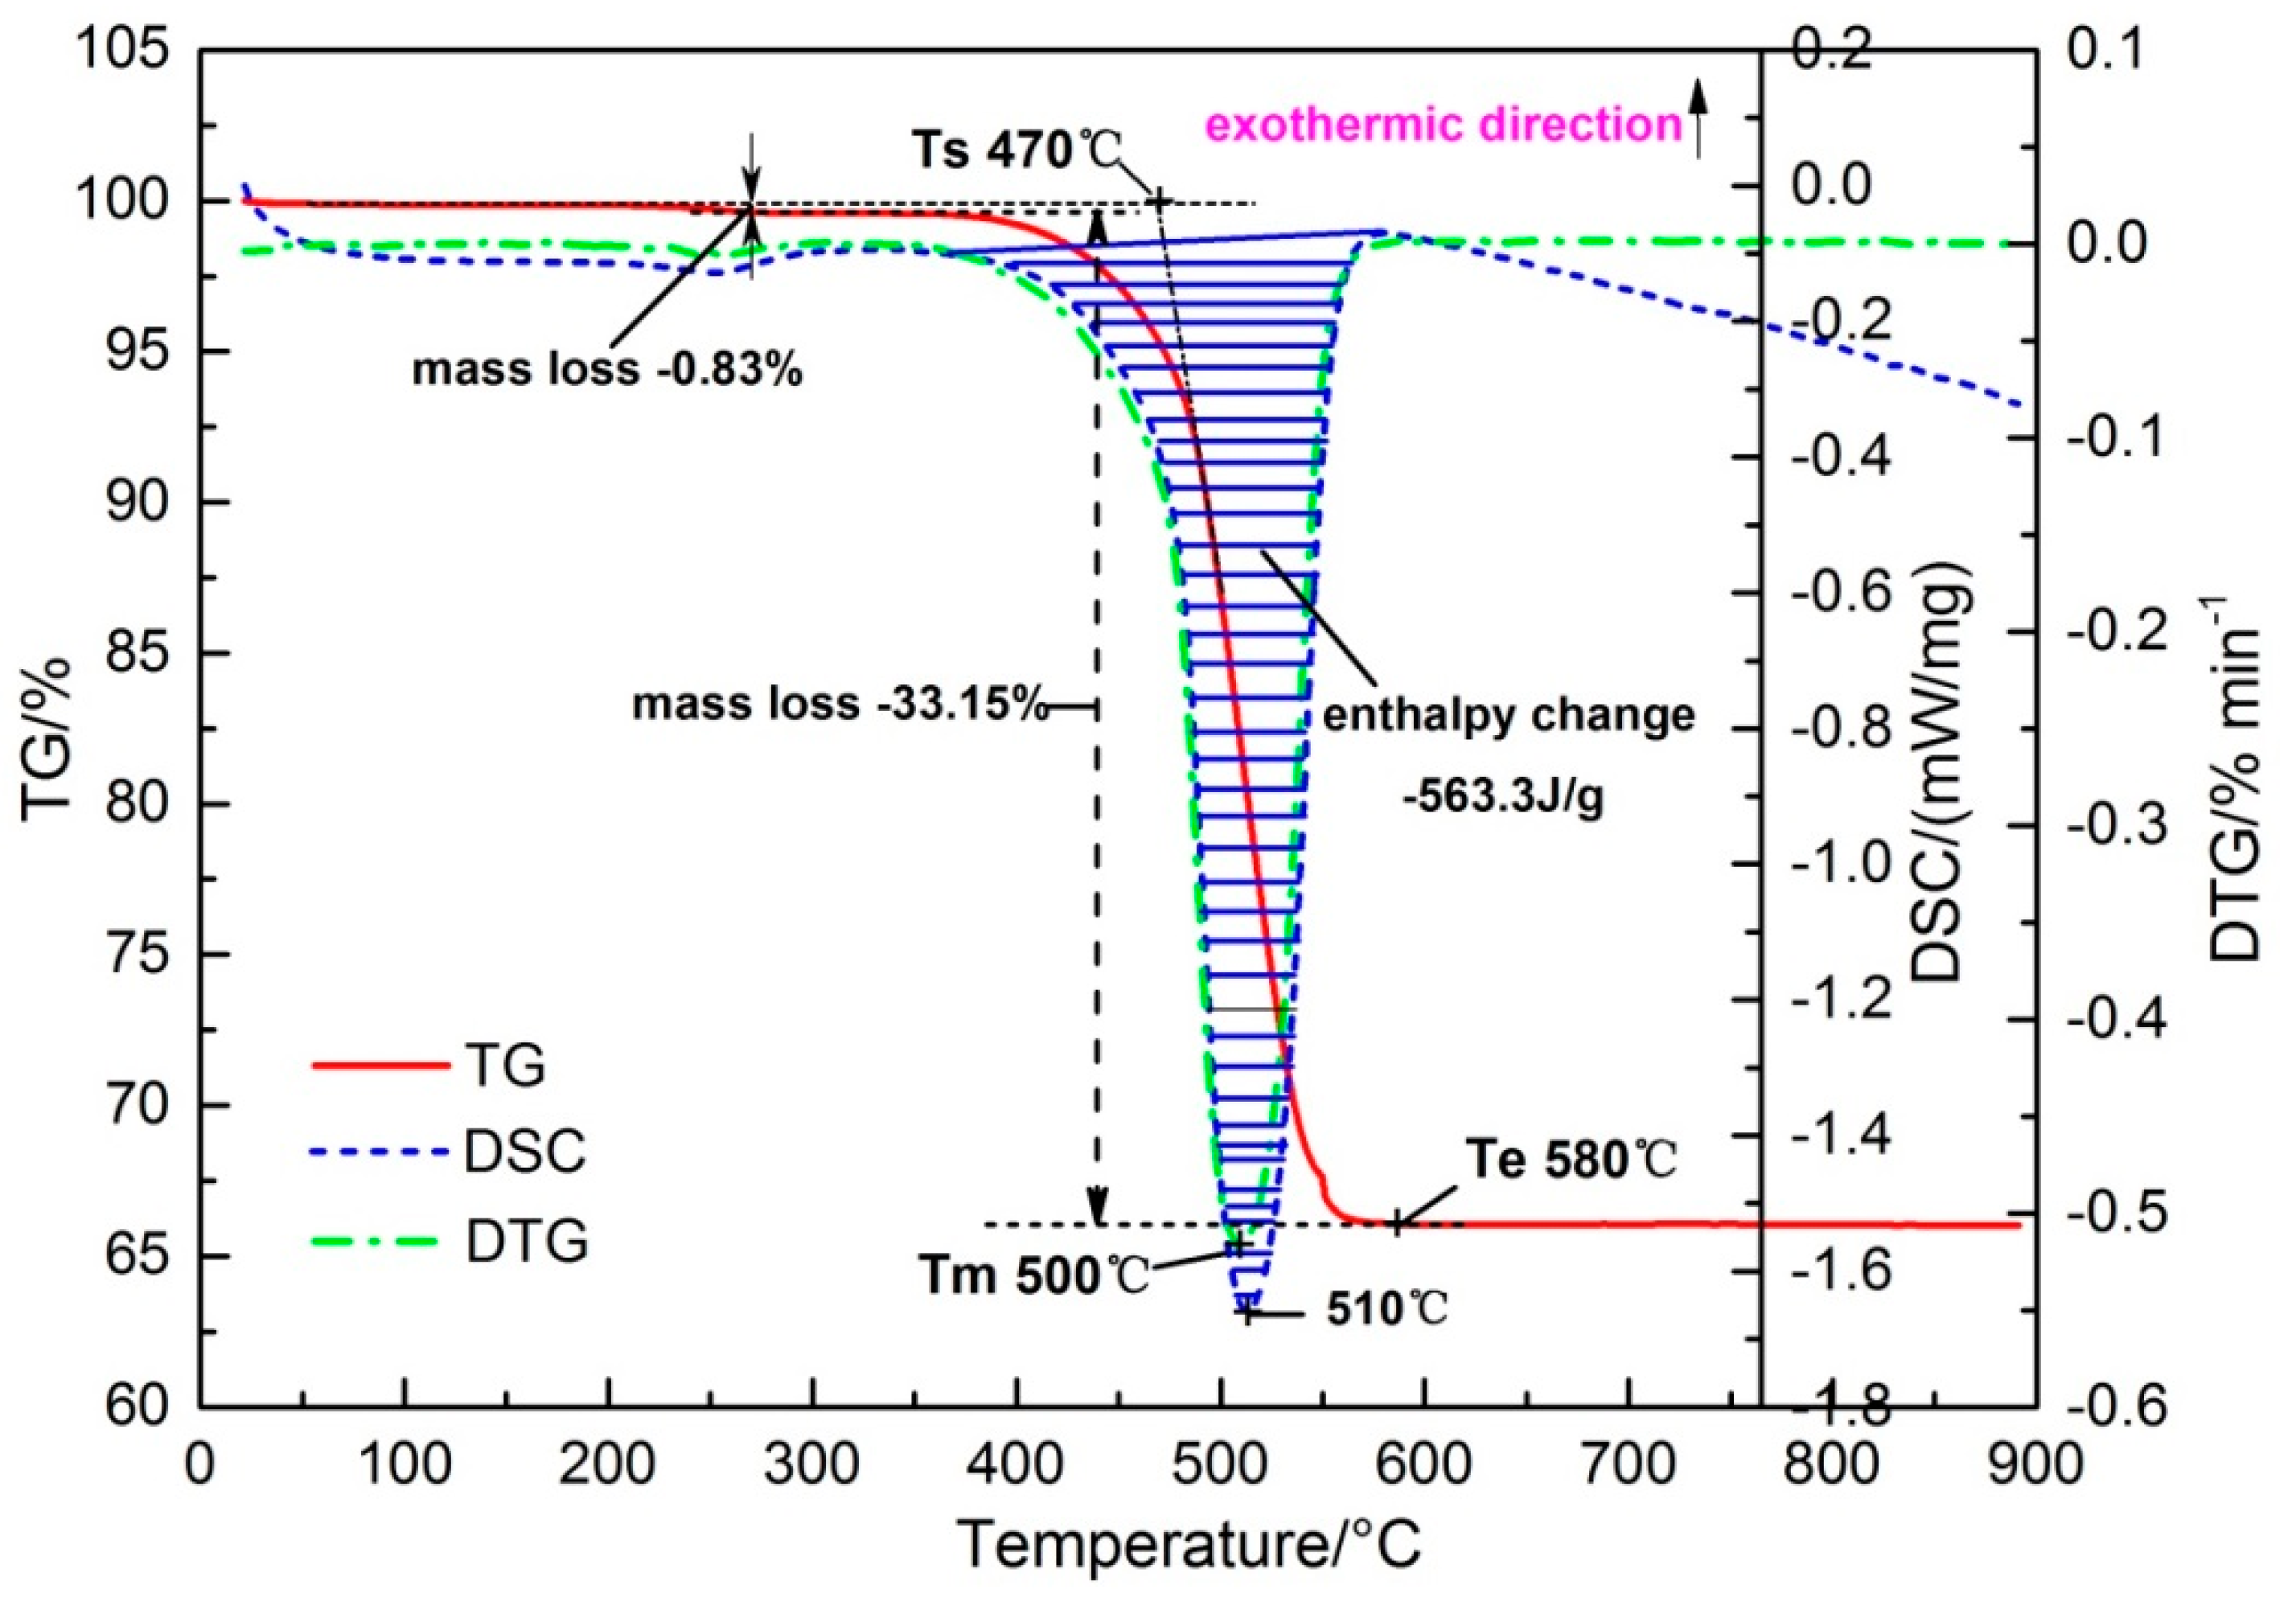
3.1. Decomposition Behavior of Siderite

In the neutral atmosphere of pyrolysis, FeO emerged immediately during the decomposition of siderite, but the FeO, as an intermediate phase, would transform to Fe3O4 easily in a short period of time. The reactions can be represented as:
FeCO3 → FeO + CO2 ΔGTθ = 74893 − 180.77T, J·mol−1
FeO + 1/3CO2 → 1/3 Fe3O4 + 1/3CO ΔGTθ = −35380 + 40.16T, J·mol−1
According to Equations (8) and (9), the pyrolysis process of siderite in the neutral atmosphere can be expressed with the following equation:
FeCO3 → 1/3Fe3O4 + 2/3 CO2 + 1/3CO ΔGTθ = 68995 − 164.79T, J·mol−1
The results of the TG/DTG/DSC analyses in the neutral atmosphere with the heating rate of 10 °C·min−1 are shown in Figure 2. Throughout the decomposition process of siderite, a minute mass loss (−0.83%) appeared at about 250 °C, corresponding to a tiny endothermic peak, which was most likely due to the moisture evaporation in the sample. The pyrolysis of siderite started at about 470 °C (Ts) with a maximum pyrolysis rate at about 500 °C (Tm). A significant endothermic peak was observed at 510 °C indicating that the pyrolytic reaction of siderite was an intense endothermic process, and the enthalpy change was −563.3 J·g−1. The mass remained unchanged basically at about 580 °C (Te), which suggested the completion of the pyrolytic reaction of siderite, with the total mass loss was 33.15%. The steps of mass loss on the TG curve corresponding to the peaks of the DTG/DSC curves belonged to the single and overlap-free peaks, indicating that the pyrolytic of siderite was one-step reaction (Reaction (9)).
The results of TG/DTG analysis at different heating rates are illustrated in Figure 3. It can be seen that both TG and DTG profiles shifted toward the direction of higher temperature based on the increase in thermal lag. Furthermore, the TG curves inosculated with DTG curves, and the mass loss steps of the TG curves corresponded to the peaks of the DTG curves. The starting temperature (Ts), maximum weight loss rate (Tm) and ending temperature (Te) increased with the increasing of heating rate, and the pyrolysis temperature range became wider. However, heating rate had little effect on the total mass loss.

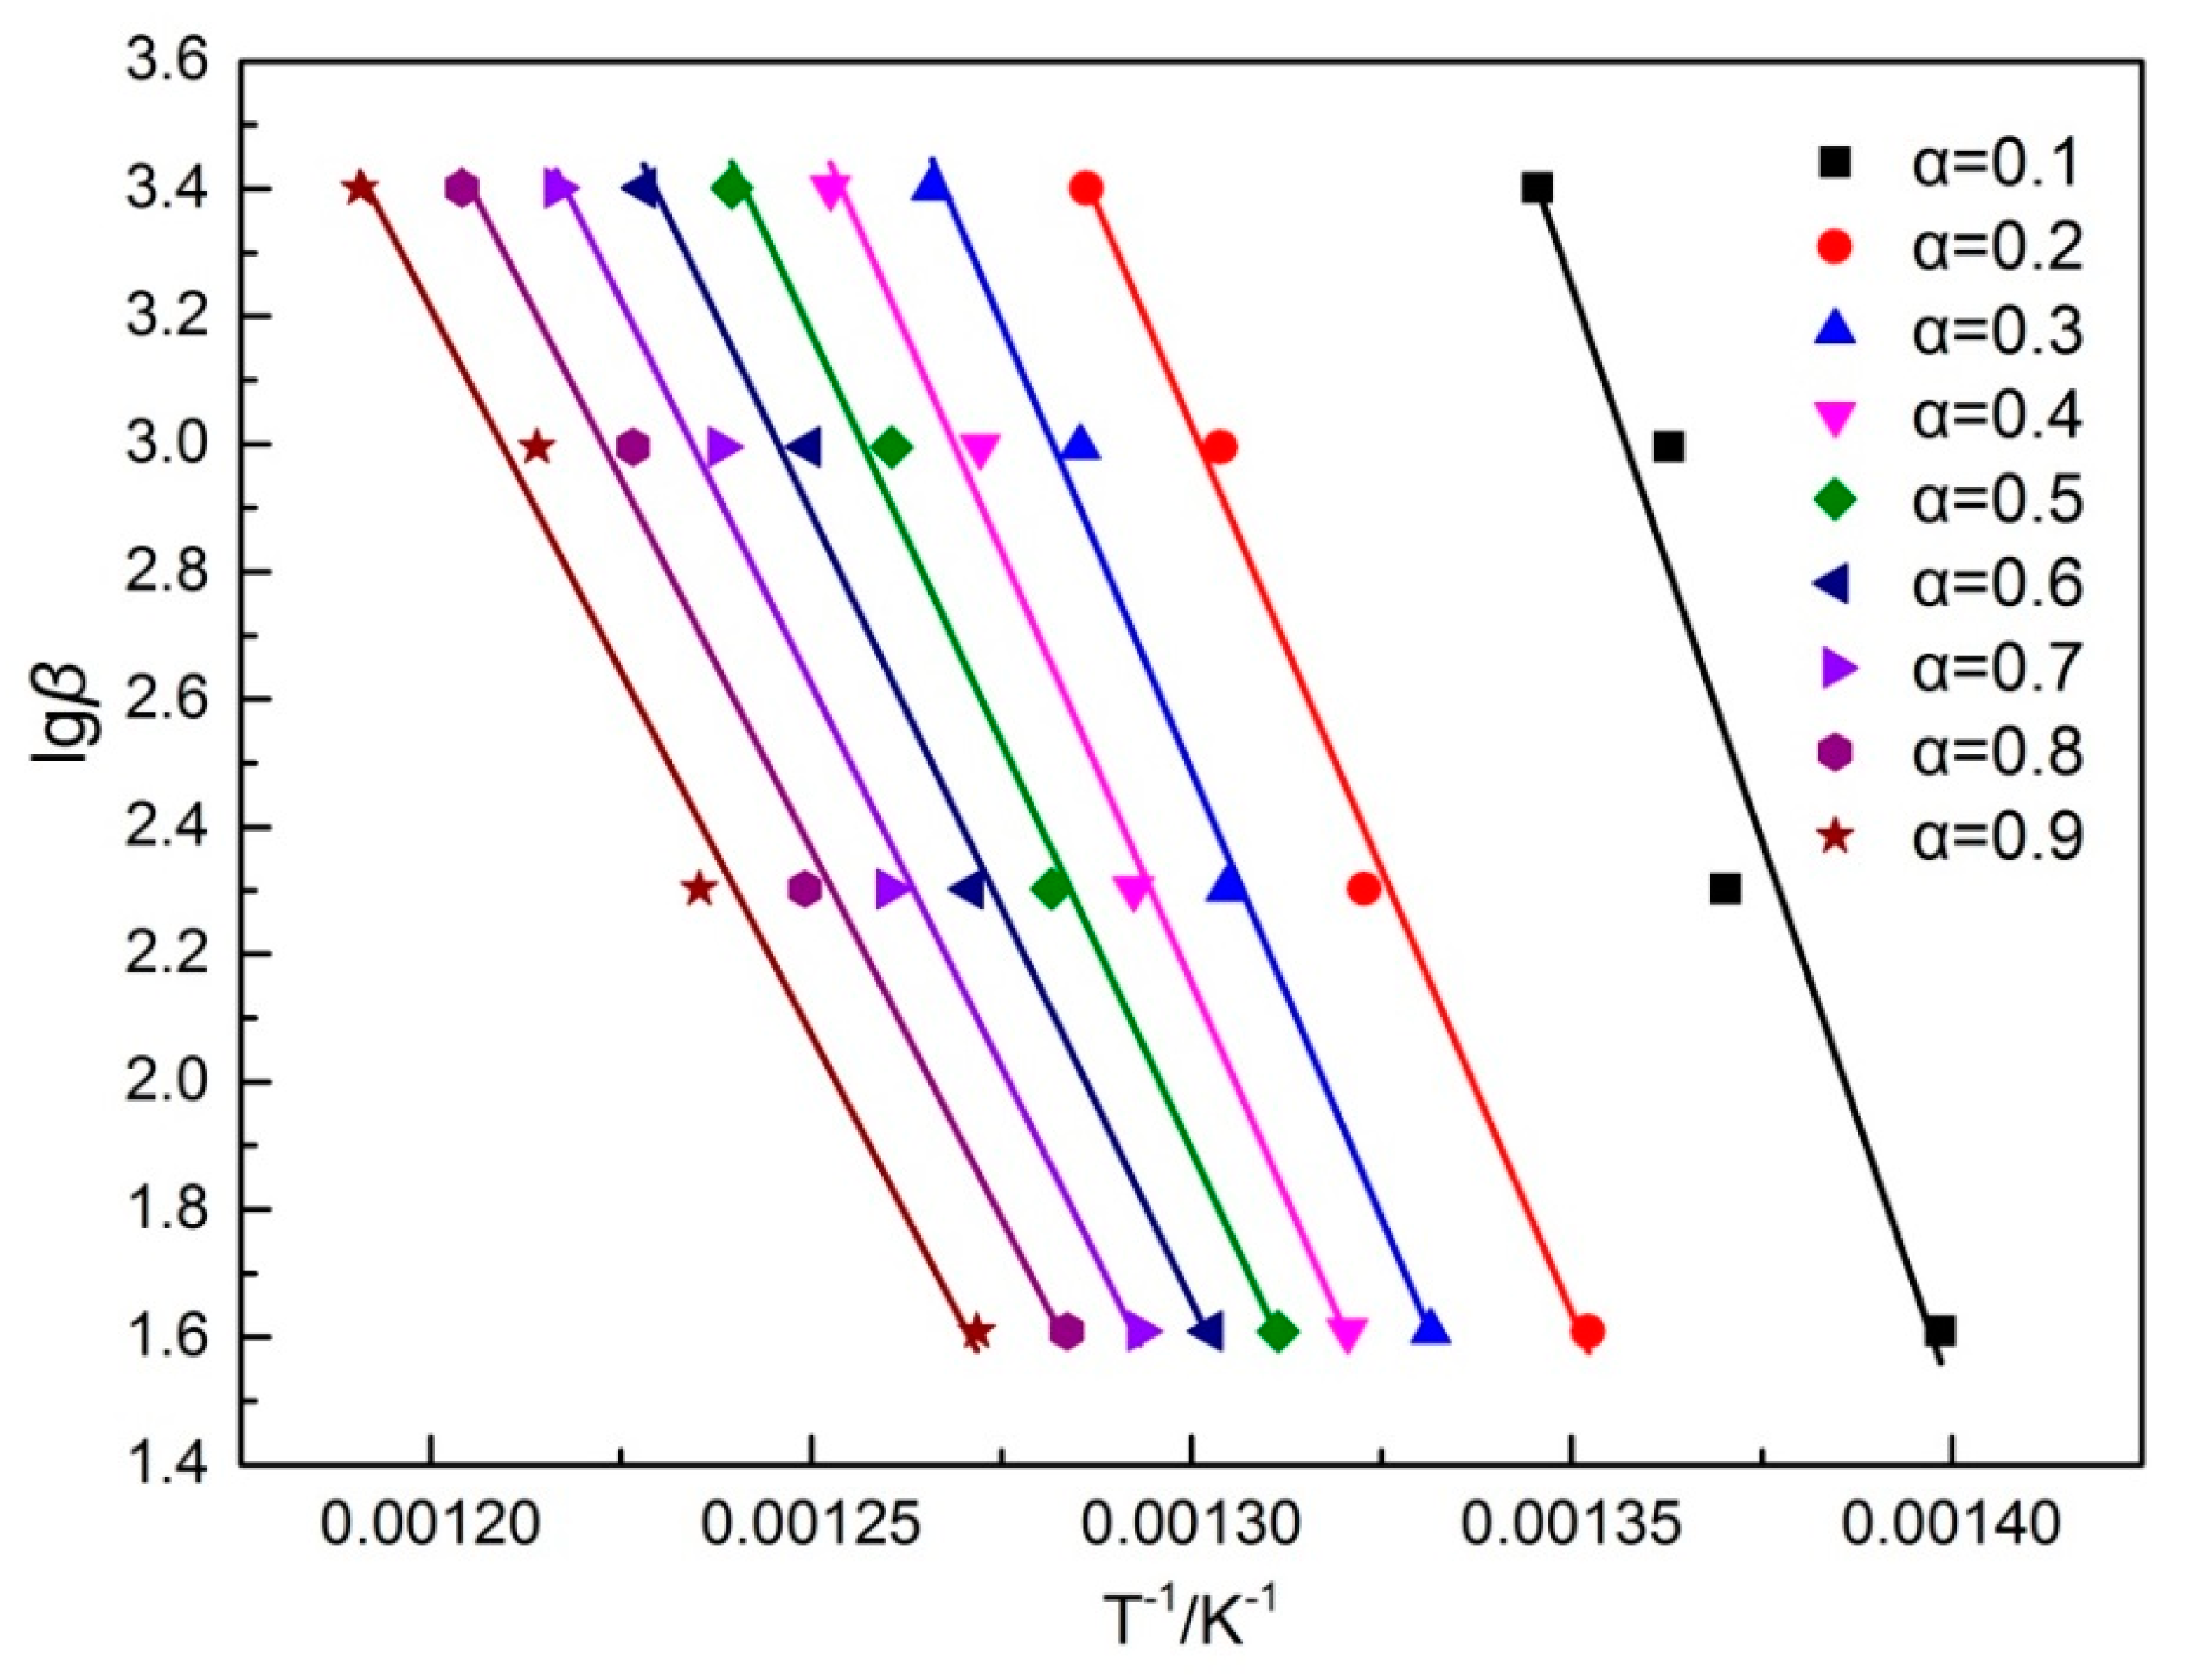
3.2. Pyrolysis Kinetics Characteristics of Siderite at Different Heating Rates

The conversion fraction (α) and conversion rate (r) at the different heating rates are shown in Figure 4. At the different heating rates, all conversion fractions (α) of siderite exhibited three stages, i.e., initial stage, middle stage and final stage. The curves of conversion fractions at the different heating rates did not changed significantly when α ranged from 0 to 0.1, which showed the stage was the initial stage of the reaction. When α was between 0.1 and 0.9, the profiles rose linearly, indicating that the stage was the main reaction period of siderite pyrolysis with a great significance on the pyrolysis process of siderite. Thus the following study of pyrolysis kinetics parameters was determined for this stage. When α ranged from 0.9 to 1.0, the value of conversion fractions converged to 1.0, meaning that the stage was the end of the reaction (Figure 4a).
At different heating rates, all conversion rate (γ) curves reached a peak value from 0, and then dropped to 0 in the end. The peak value was increased significantly with an increasing heating rate. Consequently, the heating rate had a great impact on the conversion rate. The times to reach the peak conversion rate were 95, 50, 26 and 18 min, at the different heating rates of 5, 10, 20 and 30 °C·min−1, respectively. It was found that increasing heating rate within a certain range was in favor of siderite conversion, and the peak conversion rate could be obtained in a short time (Figure 4b).
At each heating rate, conversion fraction (α) selected from 0.1 to 0.9 with an increment of 0.1 were used to calculate the activation energy using Equation (6). The lg(β) versus 1/T plots calculated for the different heating rates are presented in Figure 5. From the slope of these lines in Figure 5, the E value can be determined at various conversion fraction α, as presented in Table 4.
As seen in Table 4, unmistakably, there was good linearity between lg(β) and 1/T at the different conversion fraction. The activation energy (E) of the siderite pyrolysis could be calculated from the corresponding slopes according to the FWO kinetic method. The average activation energy (E) was 471.27 kJ mol−1.
The linear fitting results and relate kinetic parameters are summarized by Šatava–Šesták method. The calculated correlation coefficients (R) using mechanism function (Table 3) indicated that the linearity of G(α) for A1/2 reaction model versus 1/T was excellent (Table 5); meanwhile, the activation energies of A1/2 reaction model were approximately equal to those (Table 4) estimated by FWO method. Therefore it was concluded that A1/2 reaction model, namely, G(α)= [−ln(1 − α)]−2 and f(α) = 1/2(1 − α)[−ln(1 − α)]−1, was the most probable mechanism function of non-isothermal pyrolysis of siderite, and the corresponding mechanism was nucleation and growth. It was found that the activation energy (E) and pre-exponential factor (A) increased with increasing heating rate. For instance, the activation energy (E) and pre-exponential factor (A) increased from 446.13 kJ·mol−1 to 6.67 × 10⁻¹⁸ to 505.19 kJ·mol−1 and 2.40 × 10⁻²¹, respectively, as heating rate increased from 5 to 30 °C·min−1. More generally, the A value reflects the degree of collisions of a reaction per minute. Therefore, the higher A value connotes the easier occurrence of siderite pyrolysis reaction, indicating that heating rate plays a positive role in the pyrolysis process of siderite.

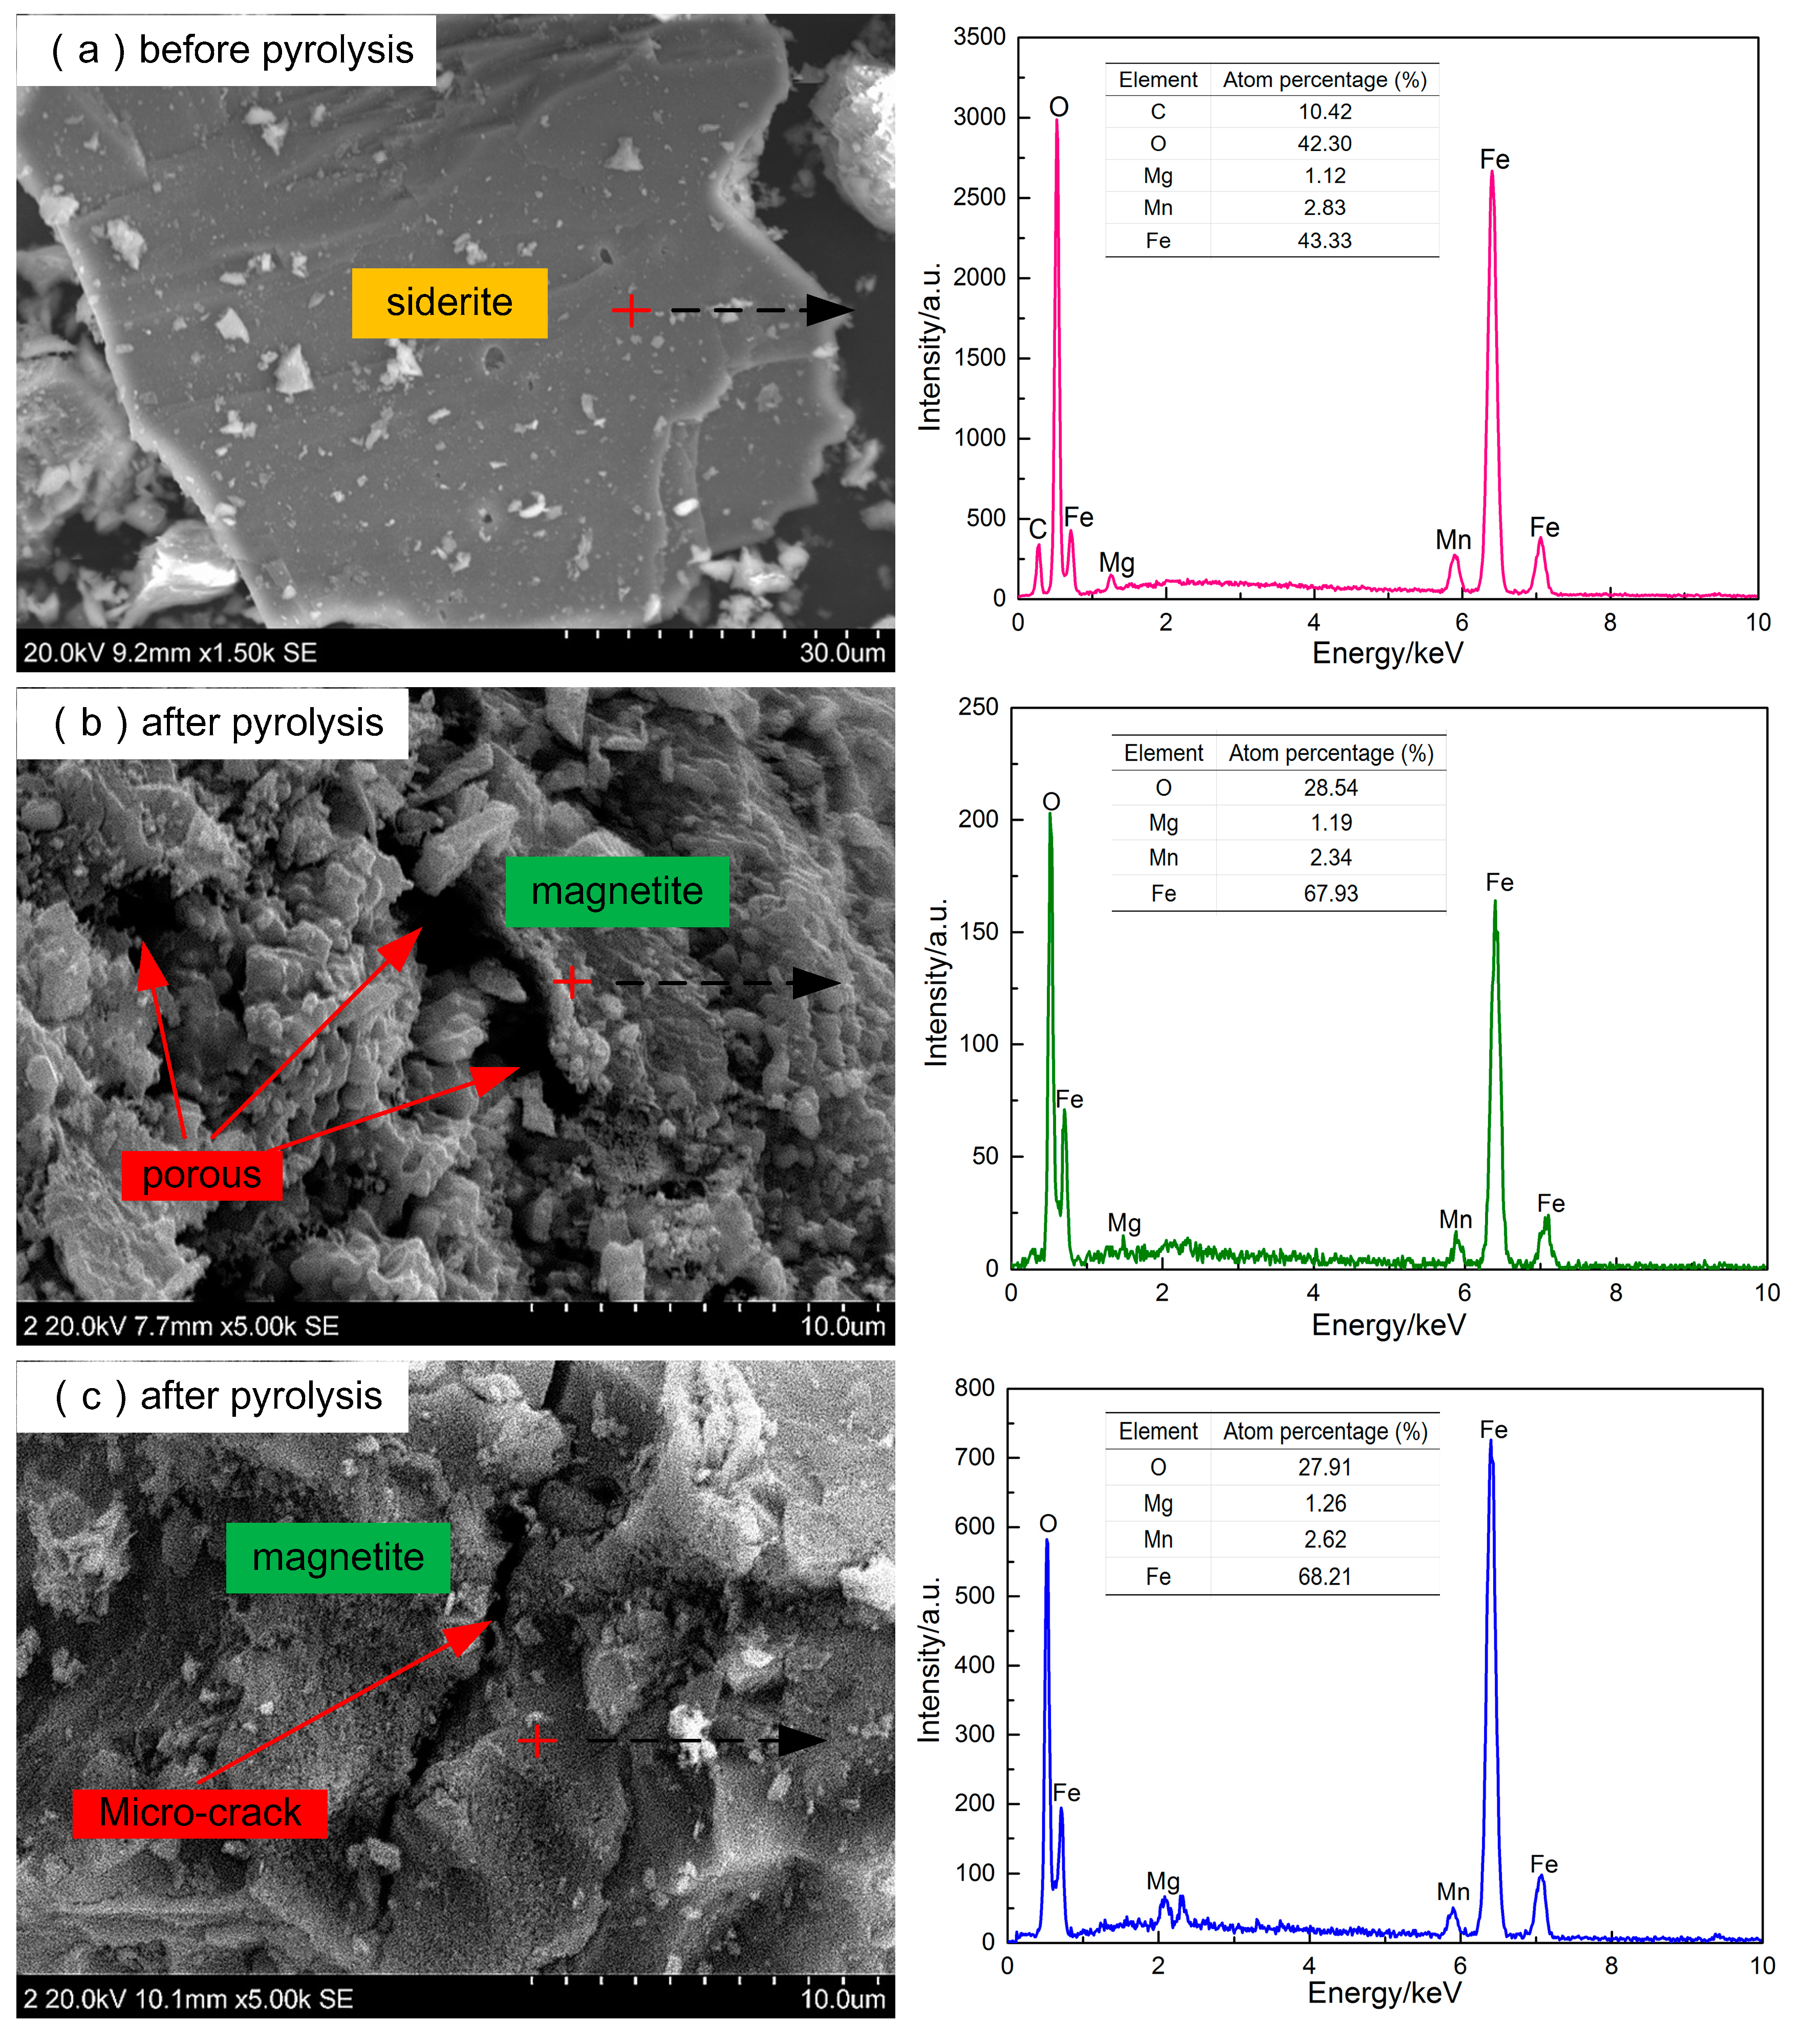
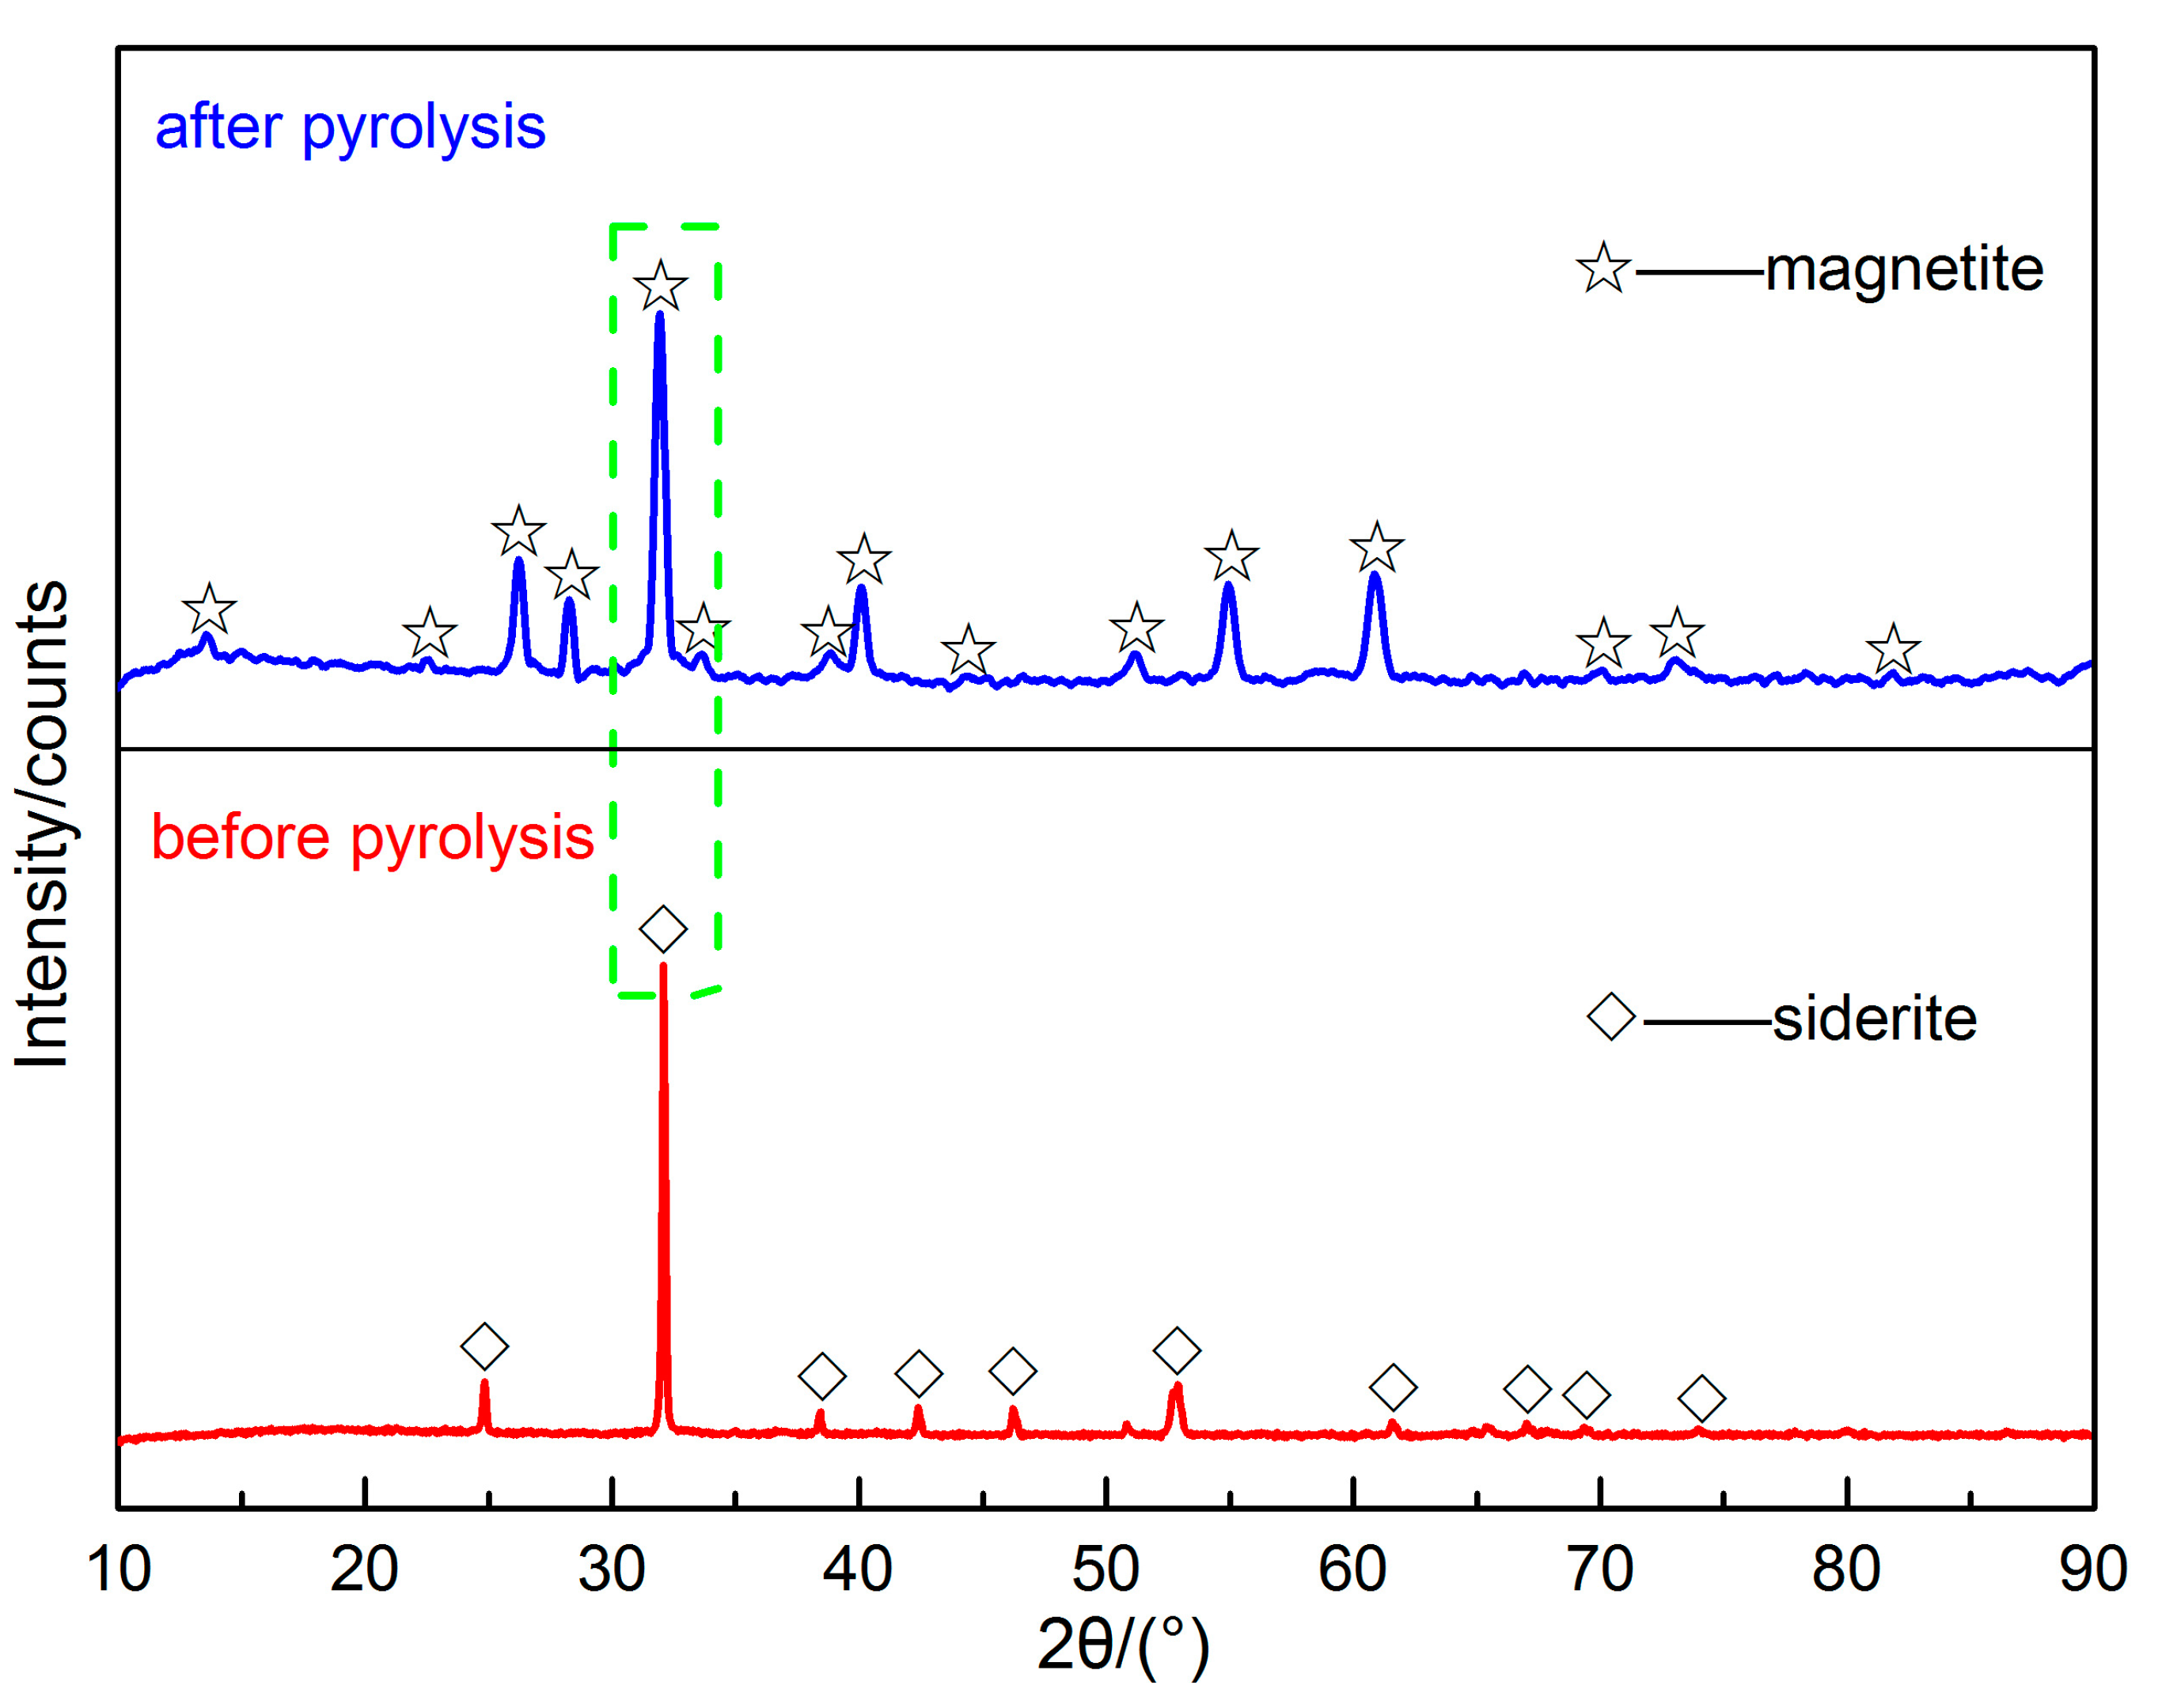
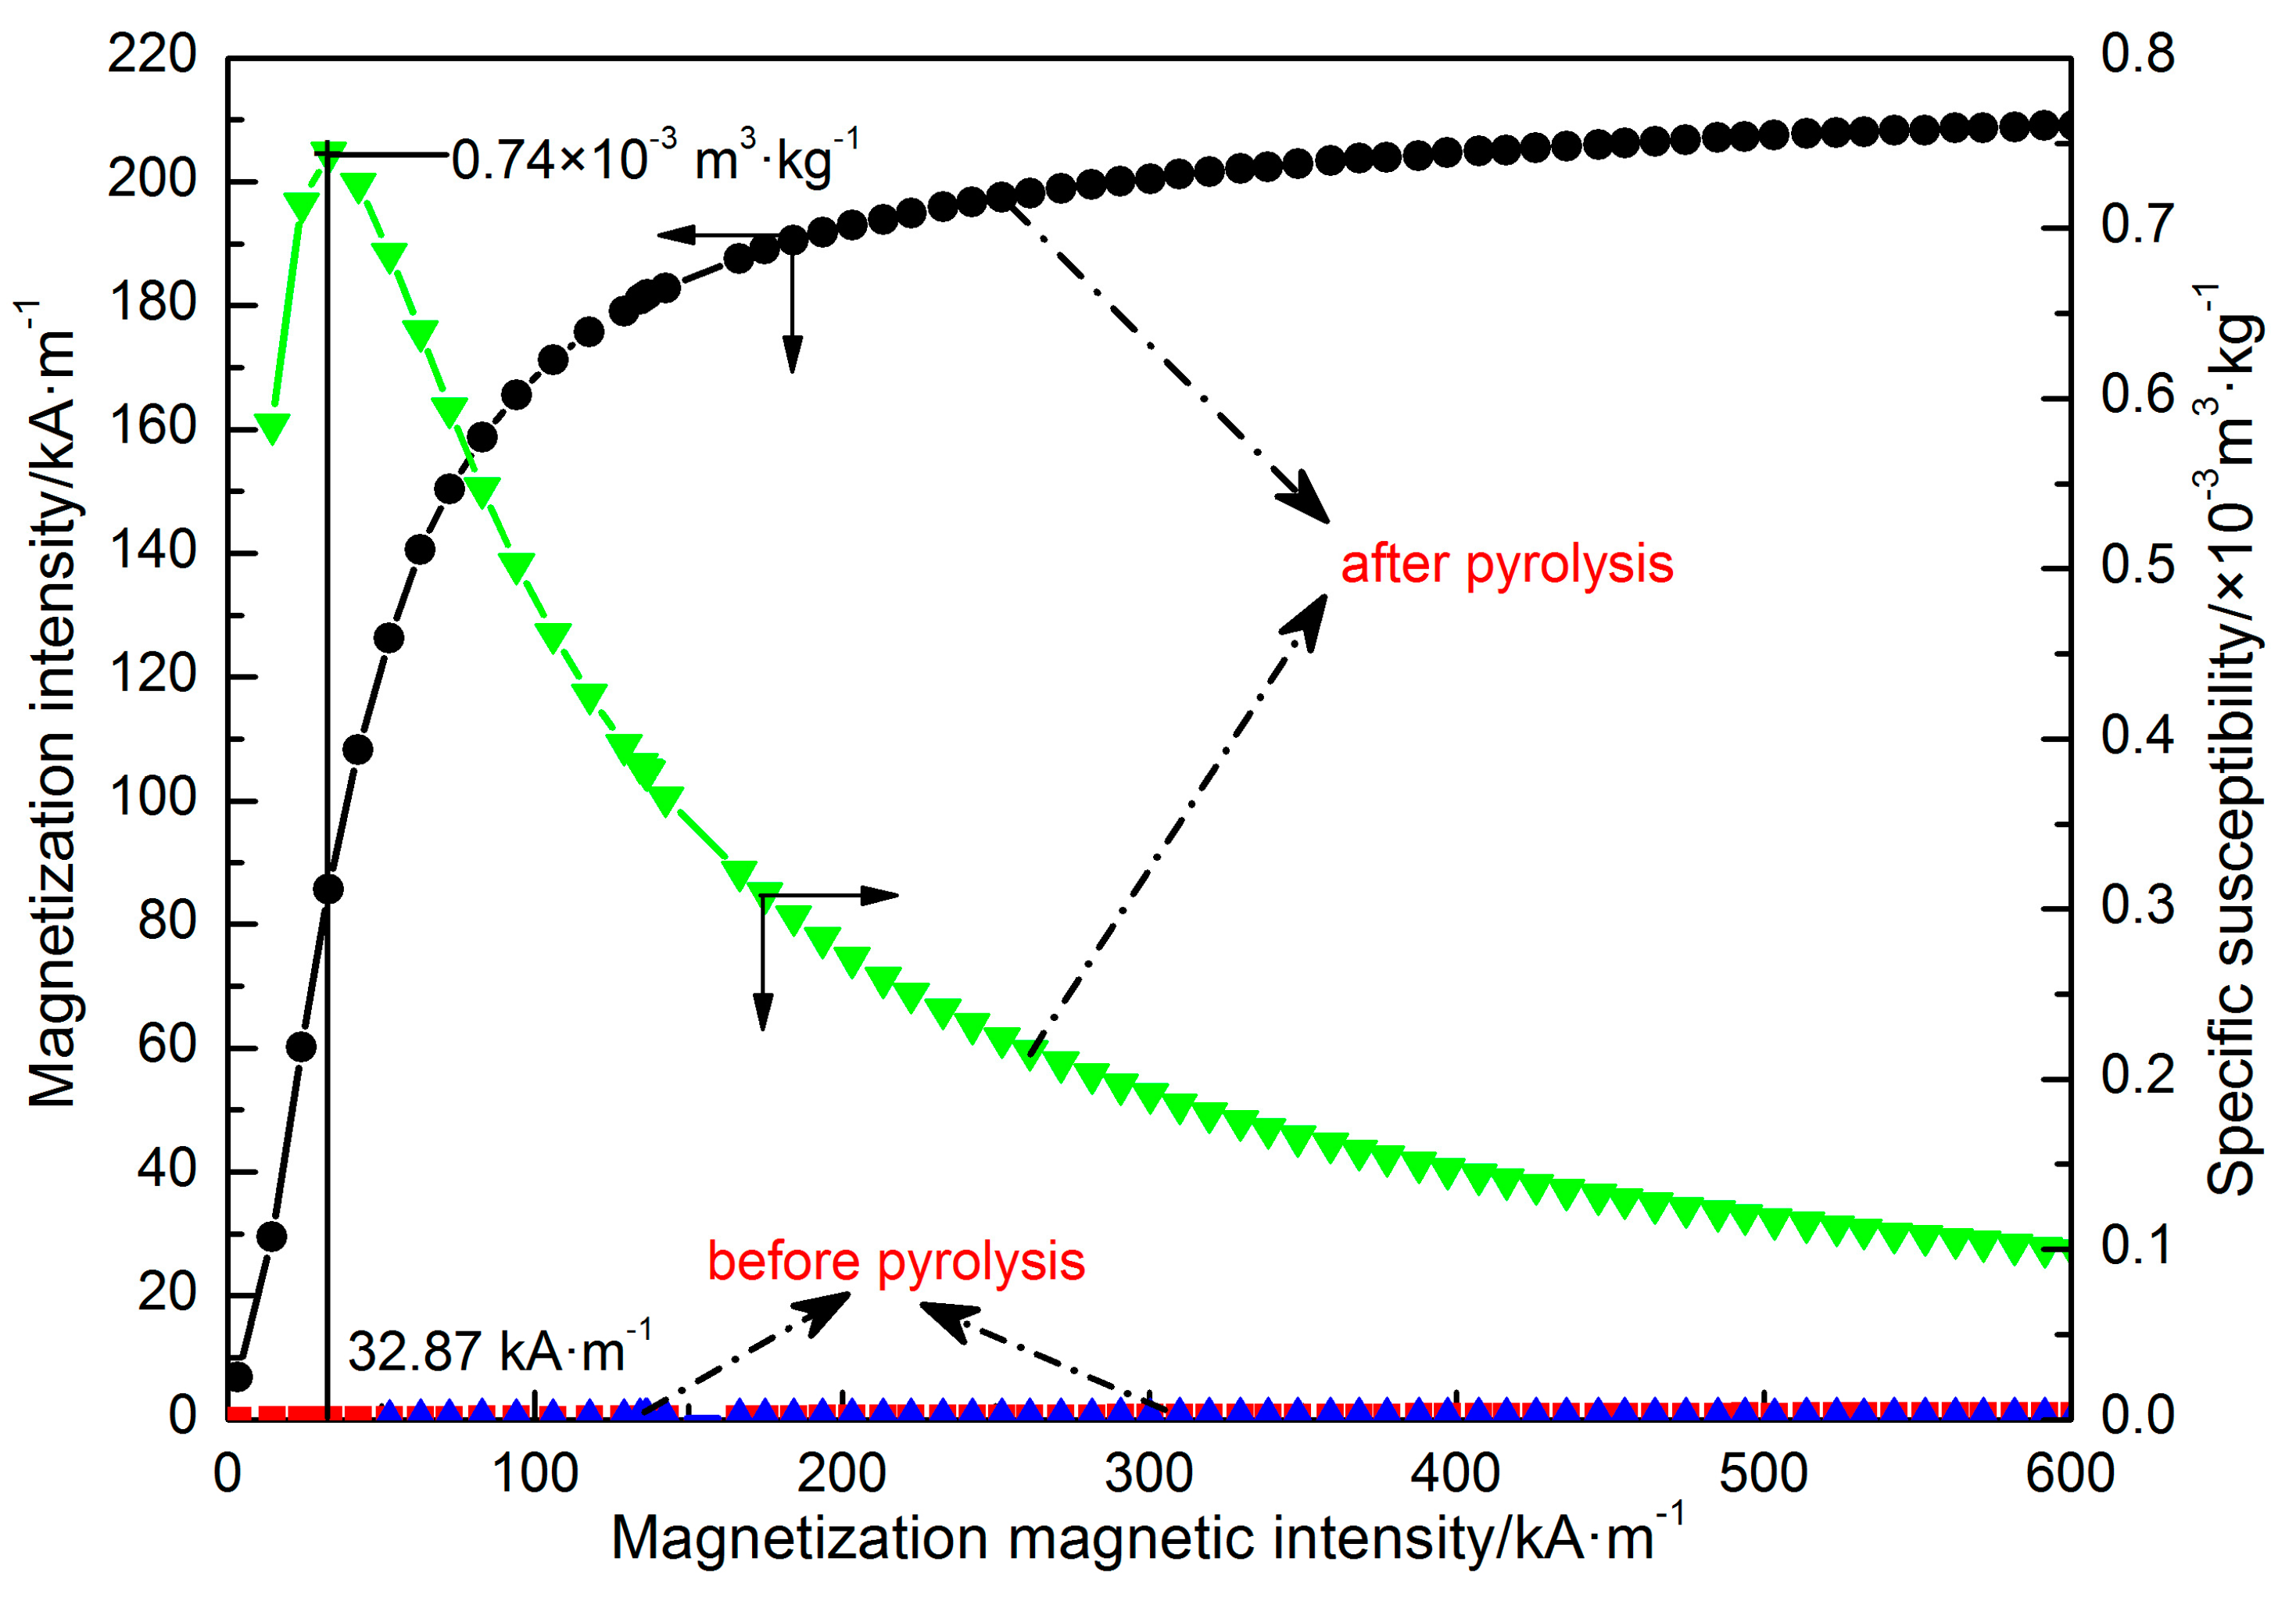
3.3. The Characteristics of Siderite both before and after Pyrolysis

The XRD pattern of the product obtained from the tube furnace test is shown in Figure 6. All siderite was transformed into magnetite after pyrolysis, and no other mineral phases were observed.
The morphologic features of the pyrolysis product from SEM and EDS analyses are shown in Figure 7. Before pyrolysis, the siderite samples were mostly chunky, with relatively even and smooth surfaces. Fe, C, O, Mn and Mg were also found on the surfaces (Figure 7a), which is in a good agreement with chemical analysis in Table 1. After pyrolysis, the surface of the newly generated magnetite appeared porous (Figure 7b), and micro-cracks were formed into the particles (Figure 7c). The carbon composition disappeared, which was most likely due to the CO2 evaporated from the samples in the process of pyrolysis. The magnetite particles with structures of pores and micro-cracks were easy to break, which could improve the grinding efficiency drastically. On the other hand, Mn and Mg remained in samples after pyrolysis, which could lower the iron grade of the concentrate.
As illustrated in Figure 8, before pyrolysis, with the increase of magnetization magnetic intensity (MMI), magnetization intensity (MI) and specific susceptibility (SS) remained extremely low values; basically, it is suggested that the siderite exhibited a weakly magnetic mineral. After pyrolysis, as the MMI increased, the MI increased rapidly and then plateaued, reaching the magnetic saturation. Meanwhile, the SS briefly increased initially but decreased subsequently. A maximum of SS of 0.74 × 10⁻³ m3·kg−1 was observed at the MMI of 32.87 kA·m−1. Because the MMI was lowered, magnetic domain wall in magnetite shifted rapidly with the increase of MMI, and magnetic moment turned to the magnetic field, until it reached magnetic saturation. When MMI increased further, the SS decreased gradually because the magnetic moment was essentially constraint. Therefore, the weakly magnetic siderite was transformed into strongly magnetic magnetite by pyrolysis, and the SS of sample improved significantly. In other words, the pyrolysis process expanded the difference of magnetic properties between iron mineral and gangue minerals, facilitating their effective separation in the subsequent low intensity magnetic separation.

4. Conclusions

The pyrolysis behavior and kinetics of siderite at different heating rates were investigated using thermogravimetry technique and laboratory type tube furnace.
(1) With the increase of heating rate, the TG and DTG curves shifted to higher temperatures. The starting temperatures, maximum weight loss rate and ending temperature increased, and the pyrolysis temperature range became wider. However, heating rate had little effect on the total mass loss. The siderite pyrolysis was one-step reaction and an intense endothermic process. A higher pyrolysis rate could be achieved in a relatively short period of time by increasing of heating rate in a certain range.
(2) At heating rates of 5, 10, 20 and 30 °C·min−1, the pyrolysis kinetics of siderite in neutral atmosphere was consistent with A1/2 (nucleation and growth) mechanism function. The forms of integral and differential mechanism functions were G(α)= [−ln(1 − α)]−2 and f(α) = 1/2(1 − α)[−ln(1 − α)]−1, respectively. The corresponding activation energies were 446.13, 469.10, 487.89, and 505.19 kJ·mol−1 and the pre-exponential factors were 6.67 × 10⁻¹⁸, 1.75 × 10⁻¹⁹, 1.80 × 10⁻²⁰, and 2.40 × 10⁻²¹ min−1, indicating an increasing trend with heating rate increase. The heating rate plays a vital role in controlling siderite pyrolysis.
(3) The weakly magnetic siderite was transformed into ferromagnetic magnetite after pyrolysis. The surface of the newly formed magnetite was porous with micro-cracks. Mn and Mg remained in the samples during pyrolysis. The magnetization intensity and specific susceptibility enhanced significantly, which was beneficial to further enrichment and utilization of iron minerals.

Acknowledgments

The authors are grateful for the financial support provided by the National Natural Science Foundation of China (No. 51674064) and the Fundamental Research Funds for the Central Universities of China (No. N160104007).

Author Contributions

Xiaolong Zhang and Yuexin Han conceived and designed the experiments; Xiaolong Zhang and Yongsheng Sun performed the experiments; Xiao long Zhang and Yanjun Li analyzed the data; and Xiaolong Zhang wrote the paper.

Conflicts of Interest

The authors declare no conflict of interest.

References

  1. Ponomar, V.P.; Dudchenko, N.O.; Brik, A.B. Phase transformations of siderite ore by the thermomagnetic analysis data. J. Magn. Magn. Mater. 2017, 423, 373–378. [Google Scholar] [CrossRef]
  2. Zhu, D.; Zhao, Q.; Qiu, G. Magnetizing roasting magnetic separation of limonite ores from Anhui province in east China. J. Univ. Sci. Technol. B 2010, 32, 713–718. [Google Scholar]
  3. Li, C.; Sun, H.; Bai, J.; Li, L. Innovative methodology for comprehensive utilization of iron ore tailings: Part 1. The recovery of iron from iron ore tailings using magnetic separation after magnetizing roasting. J. Hazard. Mater. 2010, 174, 71–77. [Google Scholar] [CrossRef] [PubMed]
  4. Srivastava, U.; Kawatra, S.K. Strategies for processing low-grade iron ore minerals. Miner. Process. Extr. Metall. Rev. 2009, 30, 361–371. [Google Scholar] [CrossRef]
  5. Lin, G.; Zhang, L.; Peng, J.; Hu, T.; Yang, L. Microwave roasting of siderite and the catalytic combustion effects on anthracite. Appl. Therm. Eng. 2017, 117, 668–674. [Google Scholar] [CrossRef]
  6. Xing, B.; Chen, T.; Cheng, S.; Liu, H.; Xie, Q.; Xie, J. Structural characteristic of natural siderite during thermal treatment. J. Chin. Ceram. Soc. 2016, 44, 1207–1212. [Google Scholar]
  7. Vusikhis, A.S.; Leont’Ev, L.I.; Kudinov, D.Z.; Gulyakov, V.S. Metallization of siderite ore in reducing roasting. Russ. Metall. 2016, 2016, 404–408. [Google Scholar] [CrossRef]
  8. Zhu, D.; Zhou, X.; Pan, J.; Luo, Y. Direct reduction and beneficiation of a refractory siderite lump. Miner. Process. Extr. Metall. Rev. 2014, 123, 246–250. [Google Scholar] [CrossRef]
  9. Bai, S.J.; Meng, W.; Chao, L.; Wen, S.M. Microstructure Characteristic and Phase Evolution of Refractory Siderite Ore during Sodium-carbonate-added Catalyzing Carbothermic Reduction. J. Iron Steel Res. 2016, 23, 891–899. [Google Scholar] [CrossRef]
  10. Luo, Y.H.; Zhu, D.Q.; Pan, J.; Zhou, X.L. Thermal decomposition behaviour and kinetics of Xinjiang siderite ore. Miner. Process. Extr. Metall. Rev. 2016, 125, 17–25. [Google Scholar] [CrossRef]
  11. Gallagher, P.K.; West, K.W.; Warne, S.S.J. Use of the Mössbauer effect to study the thermal decomposition of sidewire. Therm. Acta 1981, 50, 41–47. [Google Scholar] [CrossRef]
  12. Chang, Y.A.; Ahmad, N. Thermodynamic data on metal carbonates and related oxides. Metall. Soc. AIME 1982, 21, 94–100. [Google Scholar]
  13. Dhupe, A.P.; Gokarn, A.N. Studies in the thermal decomposition of natural siderites in the presence of air. Int. J. Miner. Process. 1990, 28, 209–220. [Google Scholar] [CrossRef]
  14. Geva, S.; Farren, M.; John, D.H.S.; Hayes, P.C. The effects of impurity elements on the reduction of wustite and magnetite to iron in CO/CO2, and H2/H2O gas mixtures. Metall. Mater. Trans. B 1990, 21, 743–751. [Google Scholar] [CrossRef]
  15. Goldin, D.M.; Kulikova, G.V. On the dissociation mechanism of carbonates and their isomorphous mixture. J. Therm. Anal. Calorim. 1984, 29, 139–145. [Google Scholar] [CrossRef]
  16. Pan, Y.X.; Lin, M.; Hao, J.Q. Rock-magnetic properties related to thermal mineral alterations in siderite samples. Chin. J. Geophys. 1999, 42, 756–763. [Google Scholar]
  17. Chen, C.; Zhang, Y.S.; Yang, Q. Thermokinetic study on magnetic roasting of refractory iron ore. Conserv. Util. Miner. Resour. 2013, 23, 31–34. [Google Scholar]
  18. Dubrawski, J.V. Thermal decomposition of some siderite-magnesite minerals using DSC. J. Therm. Anal. Calorim. 1991, 37, 1213–1221. [Google Scholar] [CrossRef]
  19. Gallagher, P.K.; Warne, S.S.J. Application of thermomagnetometry to the study of siderite. Mater. Res. Bull. 1981, 16, 141–144. [Google Scholar] [CrossRef]
  20. Jagtap, S.B.; Pande, A.R.; Gokarn, A.N. Kinetics of thermal decomposition of siderite: Effect of particle size. Int. J. Miner. Process. 1992, 36, 113–124. [Google Scholar] [CrossRef]
  21. Gotor, F.J.; Macías, M.; Ortega, A.; Criado, J.M. Comparative study of the kinetics of the thermal decomposition of synthetic and natural siderite samples. Phys. Chem. Miner. 2000, 27, 495–503. [Google Scholar] [CrossRef]
  22. He, W. The Basic Research on Magnetizing Roasting-Magnetic Separation of Siderite. Ph.D. Thesis, Central South University, Changsha, China, 2012. [Google Scholar]
  23. Feng, Z.L.; Yu, Y.F.; Liu, G.F.; Chen, W.; Lv, G. Thermal decomposition kinetics of siderite ore in suspension condition. Chin. J. Process. Eng. 2012, 12, 427–432. [Google Scholar]
  24. Huang, M.X.; Zhou, C.R.; Han, X.W. Investigation of thermal decomposition kinetics of taurine. J. Therm. Anal. Calorim. 2013, 113, 589–593. [Google Scholar] [CrossRef]
  25. Otero, M.; Calvo, L.F.; Gil, M.V.; Garc´ıa, A.I.; Mora´n, A. Co-combustion of different sewage sludge and coal: A non-isothermal thermogravimetric kinetic analysis. Bioresour. Technol. 2008, 99, 6311–6319. [Google Scholar] [CrossRef] [PubMed]
  26. Janković, B.; Adnađević, B.; Mentus, S. The kinetic analysis of non-isothermal nickel oxide reduction in hydrogen atmosphere using the invariant kinetic parameters method. Thermochim. Acta 2007, 456, 48–55. [Google Scholar] [CrossRef]
  27. Vyazovkin, S.; Burnham, A.K.; Criado, J.M.; Pérez-Maqueda, L.A.; Popescu, C.; Sbirrazzuoli, N. ICTAC Kinetics Committee recommendations for performing kinetic computations on thermal analysis data. Thermochim. Acta 2011, 520, 1–19. [Google Scholar] [CrossRef]
  28. Guinesi, L.S.; Ribeiro, C.A.; Crespi, M.S.; Veronezi, A.M. Tin(II) EDTA complex: Kinetic of thermal decomposition by non-isothermal procedures. Thermochim. Acta 2004, 414, 35–42. [Google Scholar] [CrossRef]
  29. Jankovic, B.; Mentus, S. Model-fitting and model-free analysis of thermal decomposition of palladium acetylacetonate [Pd (acac)2]. J. Therm. Anal. Calorim. 2008, 94, 395–403. [Google Scholar] [CrossRef]
  30. Wu, D.; Liu, G.; Chen, S.; Sun, R. An experimental investigation on heating rate effect in the thermal behavior of perhydrous bituminous coal during pyrolysis. J. Therm. Anal. Calorim. 2015, 119, 2195–2203. [Google Scholar] [CrossRef]
  31. Sun, Y.; Han, Y.; Wei, X.; Gao, P. Non-isothermal reduction kinetics of oolitic iron ore in ore/coal mixture. J. Therm. Anal. Calorim. 2016, 123, 703–715. [Google Scholar] [CrossRef]
  32. Polli, H.; Pontes, L.A.M.; Araujo, A.S. Application of model-free kinetics to the study of thermal degradation of polycarbonate. J. Therm. Anal. Calorim. 2005, 79, 383–387. [Google Scholar] [CrossRef]
  33. Lin, Y.K.; Li, Q.S.; Li, X.F.; Ji, K.; Zhang, H.P.; Yu, Y.M.; Song, Y.H.; Fu, Y.; Sun, L.Y. Pyrolysates distribution and kinetics of Shenmu long flame coal. Energy Convers. Manag. 2014, 86, 428–434. [Google Scholar] [CrossRef]
  34. Doyle, C.D. Series approximations to the equations of thermogravimetric data. Nature 1965, 207, 290–291. [Google Scholar] [CrossRef]
  35. Škvára, F.; Šesták, J. Computer calculation of the mechanism and associated kinetic data using a non-isothermal integral method. J. Therm. Anal. 1975, 8, 477–489. [Google Scholar] [CrossRef]
  36. Hu, R.Z.; Shi, Q.Z. Thermal Analysis Kinetics, 2nd ed.; Science Press: Beijing, China, 2008. [Google Scholar]
  37. Li, P.; Yu, Q.B.; Xie, H.Q.; Qin, Q.; Wang, K. CO2 gasification rate analysis of Datong coal using slag granules as heat carrier for heat recovery from blast furnace slag by using a chemical reaction. Energy Fuels 2013, 27, 4810–4817. [Google Scholar] [CrossRef]
  38. Vlaev, L.T.; Markovska, I.G.; Lyubchev, L.A. Non-isothermal kinetics of pyrolysis of rice husk. Thermochim. Acta 2003, 406, 1–7. [Google Scholar] [CrossRef]
  39. Li, P.; Yu, Q.B.; Qin, Q.; Lei, W. Kinetics of CO2/coal gasification in molten blast furnace slag. Ind. Eng. Chem. Res. 2012, 51, 15872–15883. [Google Scholar] [CrossRef]
Figure 1. Schematic experimental apparatus.
Minerals 07 00211 g001
Figure 2. TG-DTG-DSC profiles of siderite sample in the neutral atmosphere.
Minerals 07 00211 g002
Figure 3. TG/DTG profiles of the siderite sample at different heating rates.
Minerals 07 00211 g003
Figure 4. The conversion fraction (a) and conversion rate (b) profiles of siderite pyrolysis at different heating rates.
Minerals 07 00211 g004
Figure 5. Regression lines for various conversion fraction based on FWO method.
Minerals 07 00211 g005
Figure 6. XRD patterns of the siderite before and after pyrolysis.
Minerals 07 00211 g006
Figure 7. SEM and EDS analysis results of siderite before (a) and after (b,c) pyrolysis.
Minerals 07 00211 g007
Figure 8. Magnetic analysis of the siderite before and after pyrolysis.
Minerals 07 00211 g008
Table 1. Chemical composition of pure siderite mineral (in mass %).
FetotalFeOSiO2Al2O3CaOMgONaMnOPSLoss of Ignition
44.2158.050.550.130.301.190.012.53undetected0.3436.04
Table 2. Iron mineral analysis of pure siderite mineral (in mass %).
Iron PhasesIron CarbonateMagnetiteHematiteIron SulfideFerrosilite
Iron %39.450.123.690.850.10
Mineral %96.230.272.350.920.23
Table 3. Gas–solid reaction models with corresponding mechanism and function [36,37,38,39].
CodeReaction ModelMechanismIntegral G(α)Differential f(α)
A1/3Avrami–Erofeev (n = 1/3)Nucleation and growth[−ln(1 − α)]31/3(1 − α)[−ln(1 − α)]−2
A1/2Avrami–Erofeev (n = 1/2)[−ln(1 − α)]21/2(1 − α)[−ln(1 − α)]−1
A2/3Avrami–Erofeev (n = 2/3)[−ln(1 − α)]3/22/3(1 − α)[−ln(1 − α)]−1/2
A1Avrami–Erofeev (n = 1)−ln(1 − α)1 − α
A4/3Avrami–Erofeev (n = 4/3)[−ln(1 − α)]3/44/3(1 − α)[−ln(1 − α)]1/4
A3/2Avrami–Erofeev (n = 3/2)[−ln(1 − α)]2/33/2(1 − α)[−ln(1 − α)]1/3
A2Avrami–Erofeev (n = 2)[−ln(1 − α)]1/22(1 − α)[−ln(1 − α)]1/2
A5/2Avrami–Erofeev (n = 5/2)[−ln(1 − α)]2/55/2(1 − α)[−ln(1 − α)]3/5
A3Avrami–Erofeev (n = 3)[−ln(1 − α)]1/33(1 − α)[−ln(1 − α)]2/3
A4Avrami–Erofeev (n = 4)[−ln(1 − α)]1/44(1 − α)[−ln(1 − α)]3/4
D1One-dimensional diffusionα21/2α−1
D2ValensiTwo-dimensional diffusionα + (1 − α) ln(1 − α)[−ln(1 − α)]−1
D3JanderThree-dimensional diffusion[1 − (1 − α)1/2]2(1 − α)1/2[1 − (1 − α)1/2]−1
D4Jander (n = 2)[1 − (1 − α)1/3]23/2(1 − α)2/3[1 − (1 − α)1/3]−1
D5Jander (n = 1/2)[1 − (1 − α)1/3]1/26(1 − α)2/3[1 − (1 − α)1/3]1/2
D6anti-Jander[(1 + α)1/3 − 1]23/2(1 + α)2/3[(1 + α)1/3 − 1]−1
D7Z-L-T[(1 − α)−1/3 − 1]23/2(1 − α)4/3[(1 − α)−1/3 − 1]−1
D8Ginstling–Brounshtein1 − 2α/3 − (1 − α)2/33/2[(1 − α)−1/3 − 1]−1
R1/2Contraction sphere (n = 1/2)Phase boundary reaction1 − (1 − α)21/2(1 − α)−1
R1/3Contraction sphere (n = 1/3)1 − (1 − α)31/3(1 − α)−2
R1/4Contraction sphere (n = 1/4)1 − (1 − α)41/4(1 − α)−3
R2Contraction sphere (n = 2)1 − (1 − α)1/22(1 − α)1/2
R3Contraction sphere (n = 3)1 − (1 − α)1/33(1 − α)2/3
R4Contraction sphere (n = 4)1 − (1 − α)1/44(1 − α)3/4
P2/3Mampel power law (n = 2/3)α3/22/3α−1/2
P1Mampel power law (n = 1)α1
P2Mampel power law (n = 2)α1/21/2
P3Mampel power law (n = 3)α1/32/3
P4Mampel power law (n = 4)α1/43/4
C1Reaction order (n = 2)Chemical reaction(1 − α)−1 − 1(1 − α)2
C2Reaction order (n = 3/2)(1 − α)−1/22(1 − α)3/2
C3Reaction order (n = 3)(1 − α)−21/2(1 − α)3
Table 4. Activation energies estimated by FWO method at different conversion fraction.
Conversion Fraction/αE/kJ·mol−1 aR b
0.1532.650.978
0.2516.050.988
0.3510.970.989
0.4492.930.990
0.5466.630.989
0.6450.200.988
0.7436.790.989
0.8421.320.987
0.9413.920.982
Average471.270.987
a E-activation energy, calculated by Equation (6); b R-correlation coefficient.
Table 5. Kinetic parameters to most probable mechanism function at different heating rate.
Heating Rate (°C·min−1)CodeInterceptSlopeRActivation Energy Es a (kJ·mol−1)Pre-Exponential Factor A b (min−1)
5A1/2−24506.7120.540.9980446.136.67 × 10−18
10−25768.3020.980.9993469.101.75 × 10−19
20−26800.5122.010.9990487.891.80 × 10−20
30−27750.8723.150.9995505.192.40 × 10−21
a Es-activation energy, calculated by Equation (7); b A- pre-exponential factor, calculated by Equation (7).

