
Numerical Investigation of Caved Rock Mass Friction and Fragmentation Change Influence on Gravity Flow Formation in Sublevel Caving


Faculty of Mining and Geology, University of Belgrade, Belgrade 59714, Serbia
*
Author to whom correspondence should be addressed.
†
Current address: Đušina 7, 11000 Belgrade, Serbia.
Minerals 2017, 7(4), 56; https://doi.org/10.3390/min7040056
Submission received: 13 February 2017
/
Revised: 5 April 2017
/
Accepted: 5 April 2017
/
Published: 11 April 2017
Abstract
:Metal grade dilution is the main production disadvantage of the sublevel caving method, and overcoming this problem has been investigated over the years using different methodologies. Herein, numerical simulation using the discrete element method is used to analyze the influence of friction and fragmentation change in caved rock mass on ore dilution and recovery. The individual and mutual change of each parameter is analyzed. It is considered that at the beginning, the friction angle can be lower or higher than the basic friction angle, and after a certain moment, it will come close to the basic friction value, while fragmentation always decreases. The results showed that both friction and fragmentation, when decreasing, are influencing the higher dilution due to smaller kinematic resistance in the caved mass. If lower friction than the basic one is considered, with the drop of fragmentation, the decrease of dilution occurs. Once the basic friction angle is reached, the fragmentation of the caved mass becomes the dominant influencing factor, and its decrease will continuously increase the dilution until the end of production. However, identifying periods when these changes occur, the possibility for better production planning opens at the design stage, as well as the application of different sublevel designs.
1. Introduction
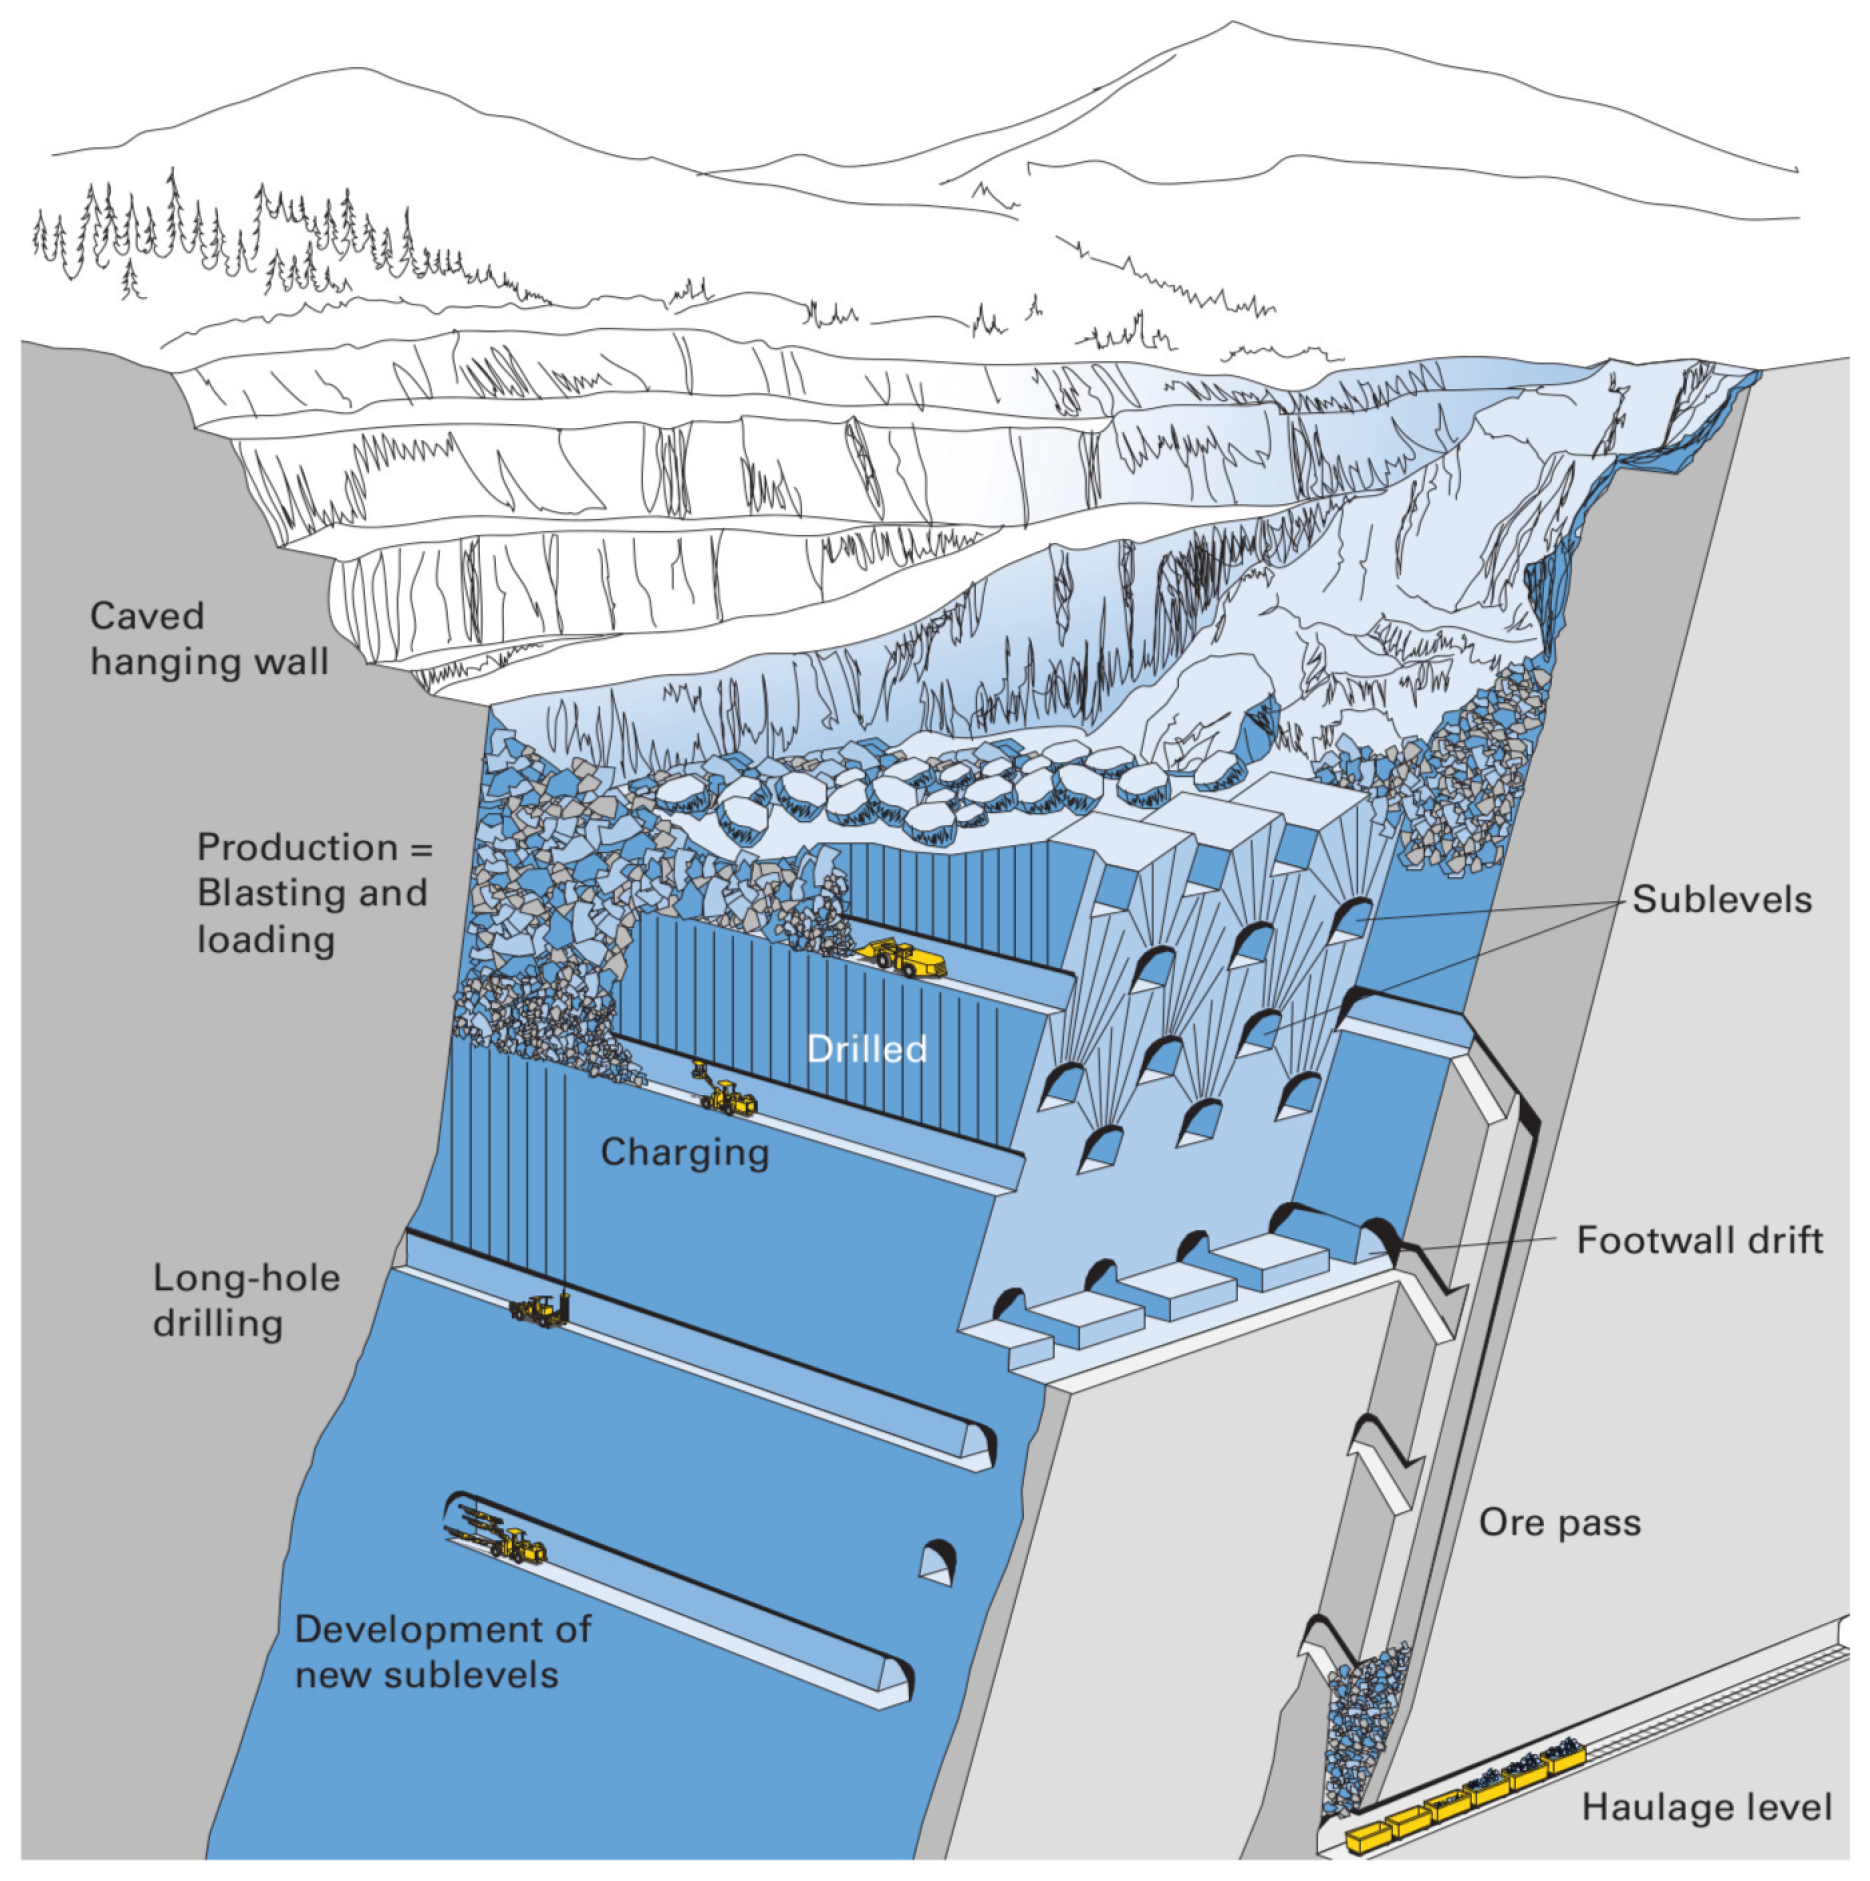
Sublevel caving (Figure 1) is an underground mining method in which ore is blasted from the sublevel drifts using explosive charges in a ring (fan) pattern, while the surrounding rock mass in the hanging wall is being spontaneously caved by the influence of gravity. Blasted ore is loaded from the sublevel drifts, and during this process, gravity the flow of broken rock is formed. Gravity flow consists of blasted ore and caved waste material. At the beginning, ore without waste material is loaded, and as extraction of material continues, waste content in extracted ore is increased. In this manner, metal grade is being diluted, and eventually, dilution becomes high enough that further extraction is not profitable. Therefore, the main objective in sublevel caving is to achieve reasonable ore recovery with an acceptable amount of dilution.
Gravity flow of broken rock in sublevel caving depends on several factors. Ore is blasted using explosive charges in a ring pattern. This blasting method determines not only the fragmentation of the blasted ore, but also the spatial size distribution of the fragments. In general, finer fragments travel faster, and vice versa. Furthermore, fragmentation of the ore by blasting assumes that fragments are created through the tensile failure in rock material, and the surfaces of such fragments are very rough. Blasted ore fragmentation is identified as one of the main influencing parameters on gravity flow formation since early observations were made [2,3,4]. Furthermore, novel computer applications confirm that blasting has a large influence on the production outcome [5,6]. Fragmentation of the blasted ore is the result of the designed blasting pattern and its properties. Many researchers have investigated different properties of blasting patterns, such as the powder factor, ring geometry, the properties of the explosives used, primer positions, ring burdens and their influence on gravity flow [7,8,9,10,11].
On the other side, the properties of the caved waste material are determined by the size of the primary blocks in the rock mass and the quality of joints’ surfaces. Since the sublevel caving method assumes that ore is excavated from the top of the ore body and continues with depth, waste material is subjected to vertical movement, and the size and friction of those rock blocks are changed through space and time.
Modeling of the gravity flow in sublevel caving has a long history. Kvapil proposed the ellipsoid theory [12] and created the foundation for the gravity flow modeling. The theory was a result of physical modeling and its mathematical formulation. In general, theory describes the gravity flow by the concept of “motion ellipsoids”. Since it is the idealization of the gravity flow, many problems with this approach were recognized through a variety of experiments [3,8]. Other modeling approaches include stochastic methods [13,14], cellular automata [15,16], small-scale [4,7,17,18] and full-scale [8,10,19,20,21,22] experiments, but also some modifications of caving methods are considered [23,24,25]. When it comes to the full-scale in situ experiments, it is hard to distinguish between the partial influences of some parameters, since all of them are incorporated with the results. It is also difficult to quantify the mechanical properties of blasted and caved material. Since the real situation encompasses all governing factors, the obtained results may be in some cases confusing and lead to different conclusions about the influence of particular factors, even if tests were made in the same mine in similar conditions [22,26].
The discrete element method [27] modeling of gravity flow provides the possibilities of better insight into the gravity flow mechanisms. The main advantage is that DEM models provide the possibility to study the influence of different parameters relatively quickly and at low cost if compared to physical experiments. In general, DEM assumes the creation of the models with different element shapes that are subjected to Newton’s law of motion and with appropriate constitutive models at their contacts. This method is widely used for the modeling of problems related to granular materials [28,29,30], coal mining [31] and different rock and soil mechanics problems [32,33,34,35,36]. DEM modeling of sublevel caving was demonstrated by Hustrulid, Sellden, DeGagne and Bobadilla [5,37,38,39,40]. Herein, DEM is used to simulate gravity flow in sublevel caving in order to analyze the influence of fragmentation and friction change in caved mass on ore dilution. Main similarities with gravity flow behavior in block caving are explained and used as the foundation for this research. The main disadvantage of DEM modeling is that models have to be limited in their size to one or a few isolated sublevels. This is due to the high computational requirements. Therefore, it is hard to match the real situations that exist in some mines, and only approximations can be made. However, using DEM, it is possible to create “plain” models, where it is possible to observe the influence of some particular rock mass properties and their changes without their interference with other factors. For example, we are able to distinguish between fragment size and shape and to observe only the desired parameter. Conclusions obtained from such analyses are general and provide a foundation for further, more complex investigations, but eventually, it will be possible to give confident estimates of the production outcomes for specific designs of the mining method.
2. Fragmentation and Friction Change in Caved Waste Material
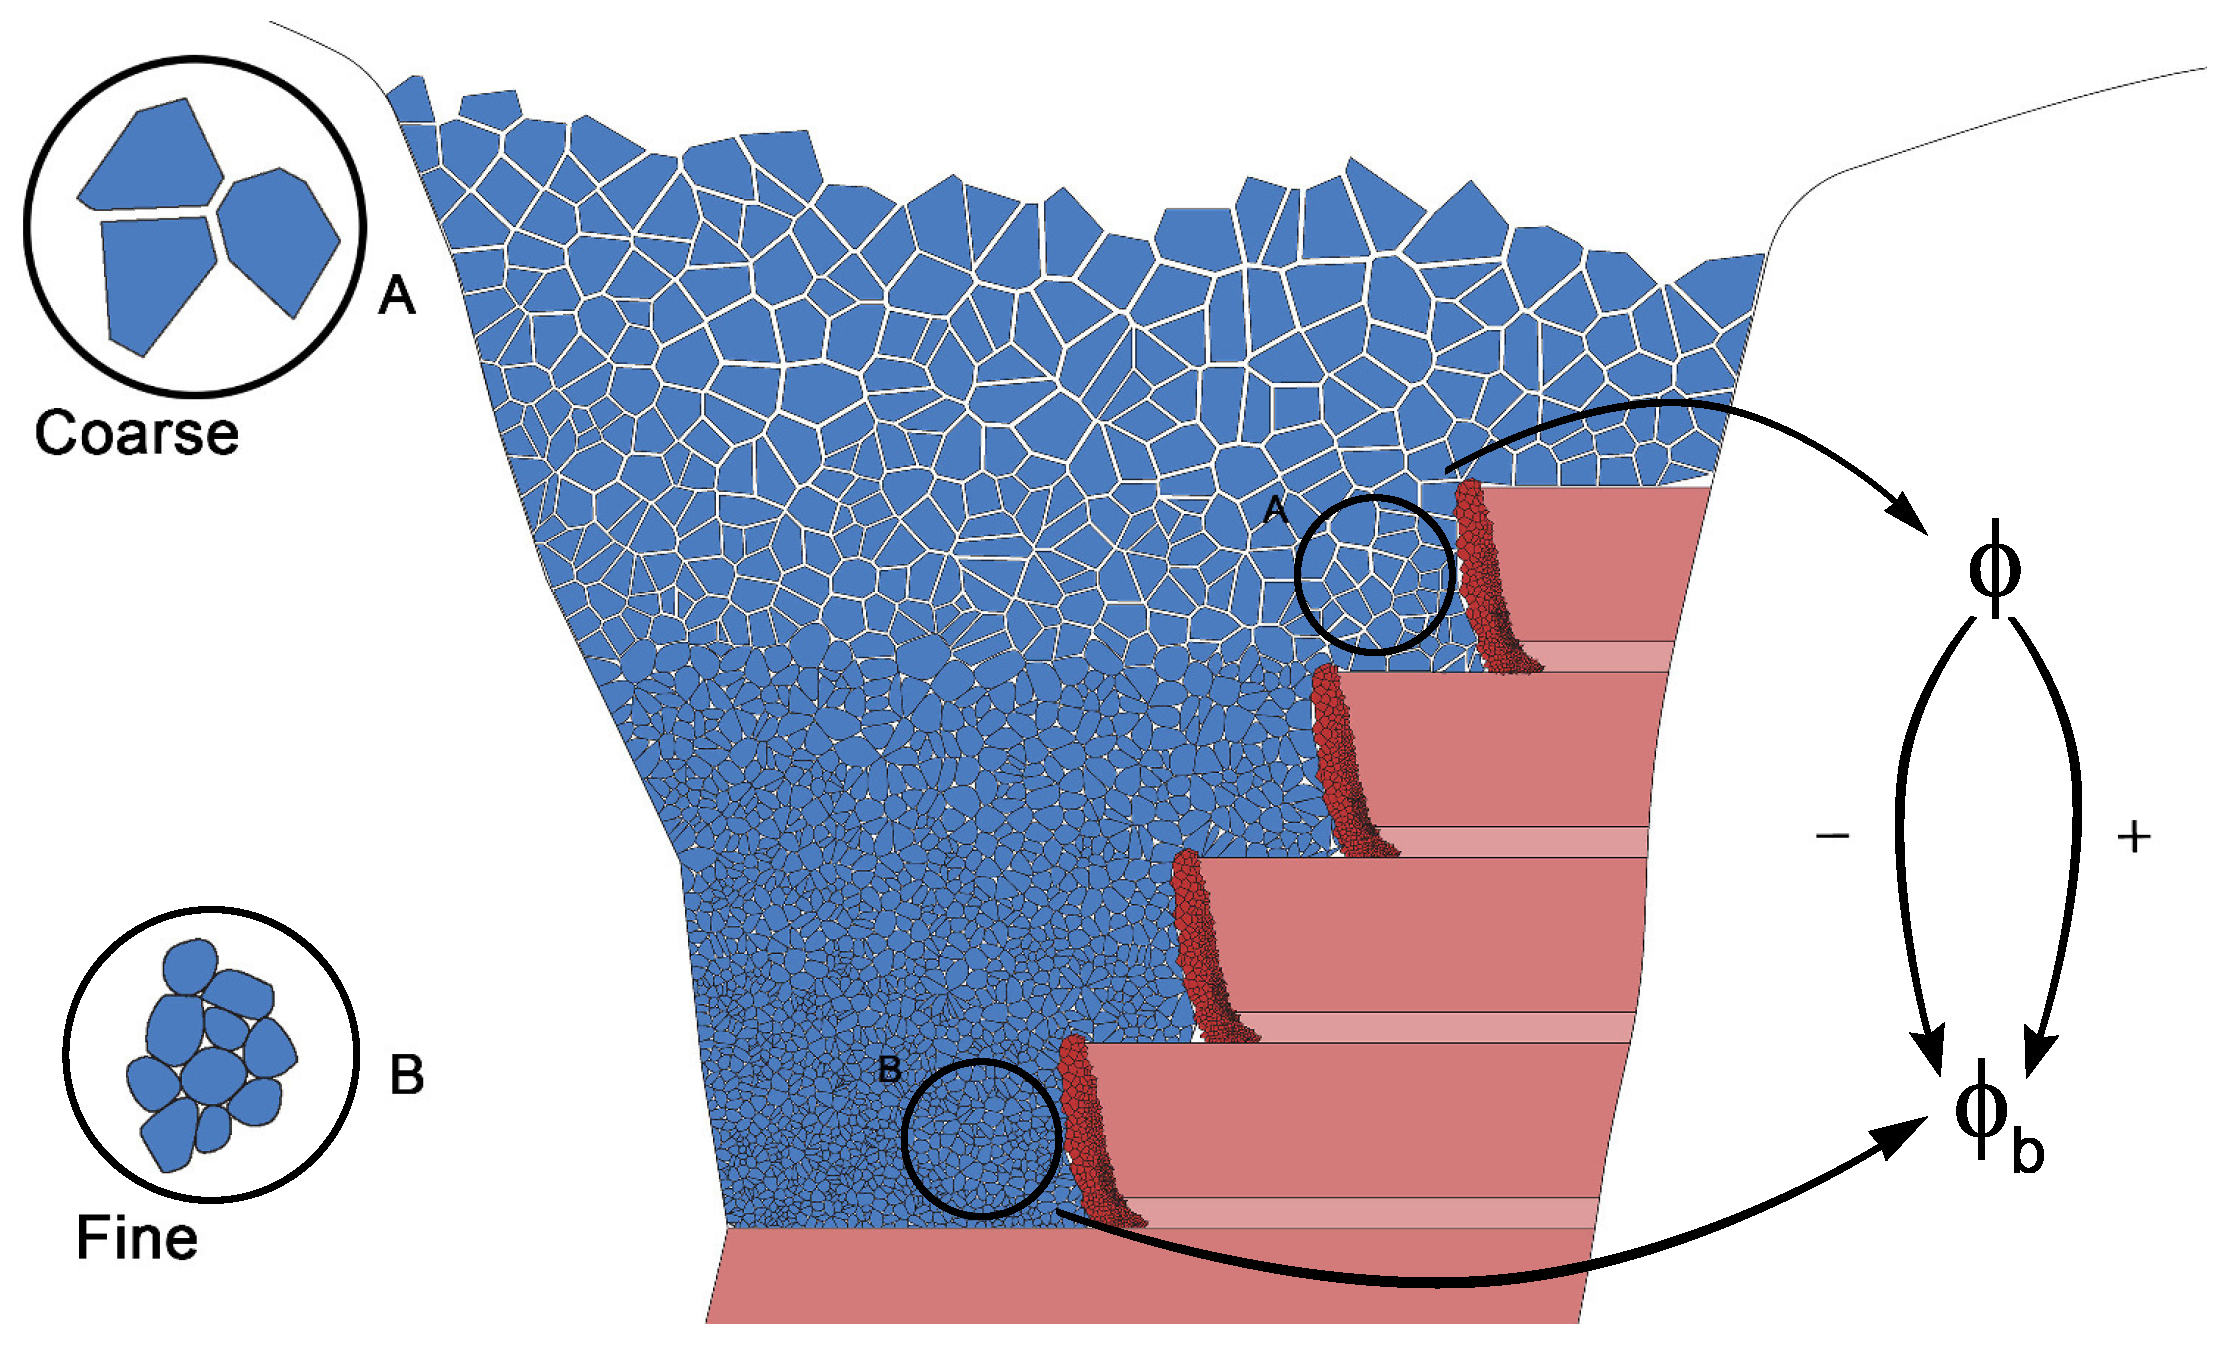
It is very important to notice the similarity between block and sublevel caving. In block caving, high ore columns are being caved, and the drawing of caved material takes place at the bottom of the block. During this process, caved rock fragments are subjected to the gravity flow, and their size is changed as a function of the length of the distance traveled. Proper design of the drawing points inside the block caving mines requires proper determination of the secondary rock fragmentation in order to avoid the draw point jamming and loss. The key point here is to notice that during the caving and gravity flow of the broken rock, the size of the rock fragments is changed, as well as the frictional properties of their surfaces. Secondary fragmentation in block caving is identified as one of the most influential parameters on gravity flow formation [41,42,43]. While in block caving mines, caved rock mass is subjected to the gravity flow inside the geometry of one column, and this takes place until the production is finished, the sublevel caving mines situation is slightly different. Ore is blasted and loaded from the sublevel drifts in slices that advance along the sublevel drift. During the ore loading, the gravity flow of broken ore and caved waste material is formed, and after the finishing of the production at one sublevel, production continues at the next, lower one. In this manner, caved rock mass is traveling just in smaller portions, but in the end, it is subjected to the same process as the caved mass in block caving mines. This means that upper sublevels will face the caved waste rock that has coarser fragmentation, while lower sublevels will have different states of the caved rock mass, which has finer fragmentation and different frictional properties. During the gravity flow, those rock blocks are rubbed against each other, and their surfaces become smoother; their friction angle is closer to the basic friction angle [44] for that rock type. This means that those rock fragments will have smaller kinematic resistance and may easily come to the loading point and mix with the ore, producing its dilution. These changes are illustrated in Figure 2. However, friction and the size of the rock fragments are changed simultaneously, and those changes should be analyzed together. The real situation in sublevel mines depends on the actual geological conditions that are present in a certain mine. Primary block sizes and their frictional properties are determined by the jointing of the rock mass. This should be the starting point for the research of sublevel gravity flow. It is well known that rock mass that is caved is subjected to the tensile failure, and the surfaces of the rock blocks that are created in this manner are very rough [45,46,47]. However, other surfaces of the caved rock fragments are determined by the quality of the joint walls that created those surfaces. This means that on some occasions, those surfaces may have a lower friction angle than the basic friction angle. Due to the rubbing with other blocks and the removal of low strength infill or weathered layers, the friction angle of those surfaces may rise closer to the basic friction angle. This process is not linear, and friction variations occur; however, the general trend is that the friction angle is closer to its basic value. Friction variations occur when smoothed fragments are downsized and newly created surfaces have slightly higher frictional resistance due to their roughness. Herein, the influence of the described changeability of the caved rock mass properties and its influence on the gravity flow in sublevel caving are analyzed through the numerical discrete element models. The idea is to explain the fundamental process that undoubtedly occurs in caved rock mass and to provide the foundation for further and more complex research. Coupling such research with experimental data would be a great benefit, but this is the privilege of a few, and reconstruction of the current state in active sublevel cave mines would be almost impossible due to its complexity and related uncertainties.
3. Numerical Model Setup and Simulation Results
3.1. Initial DEM Model Setup
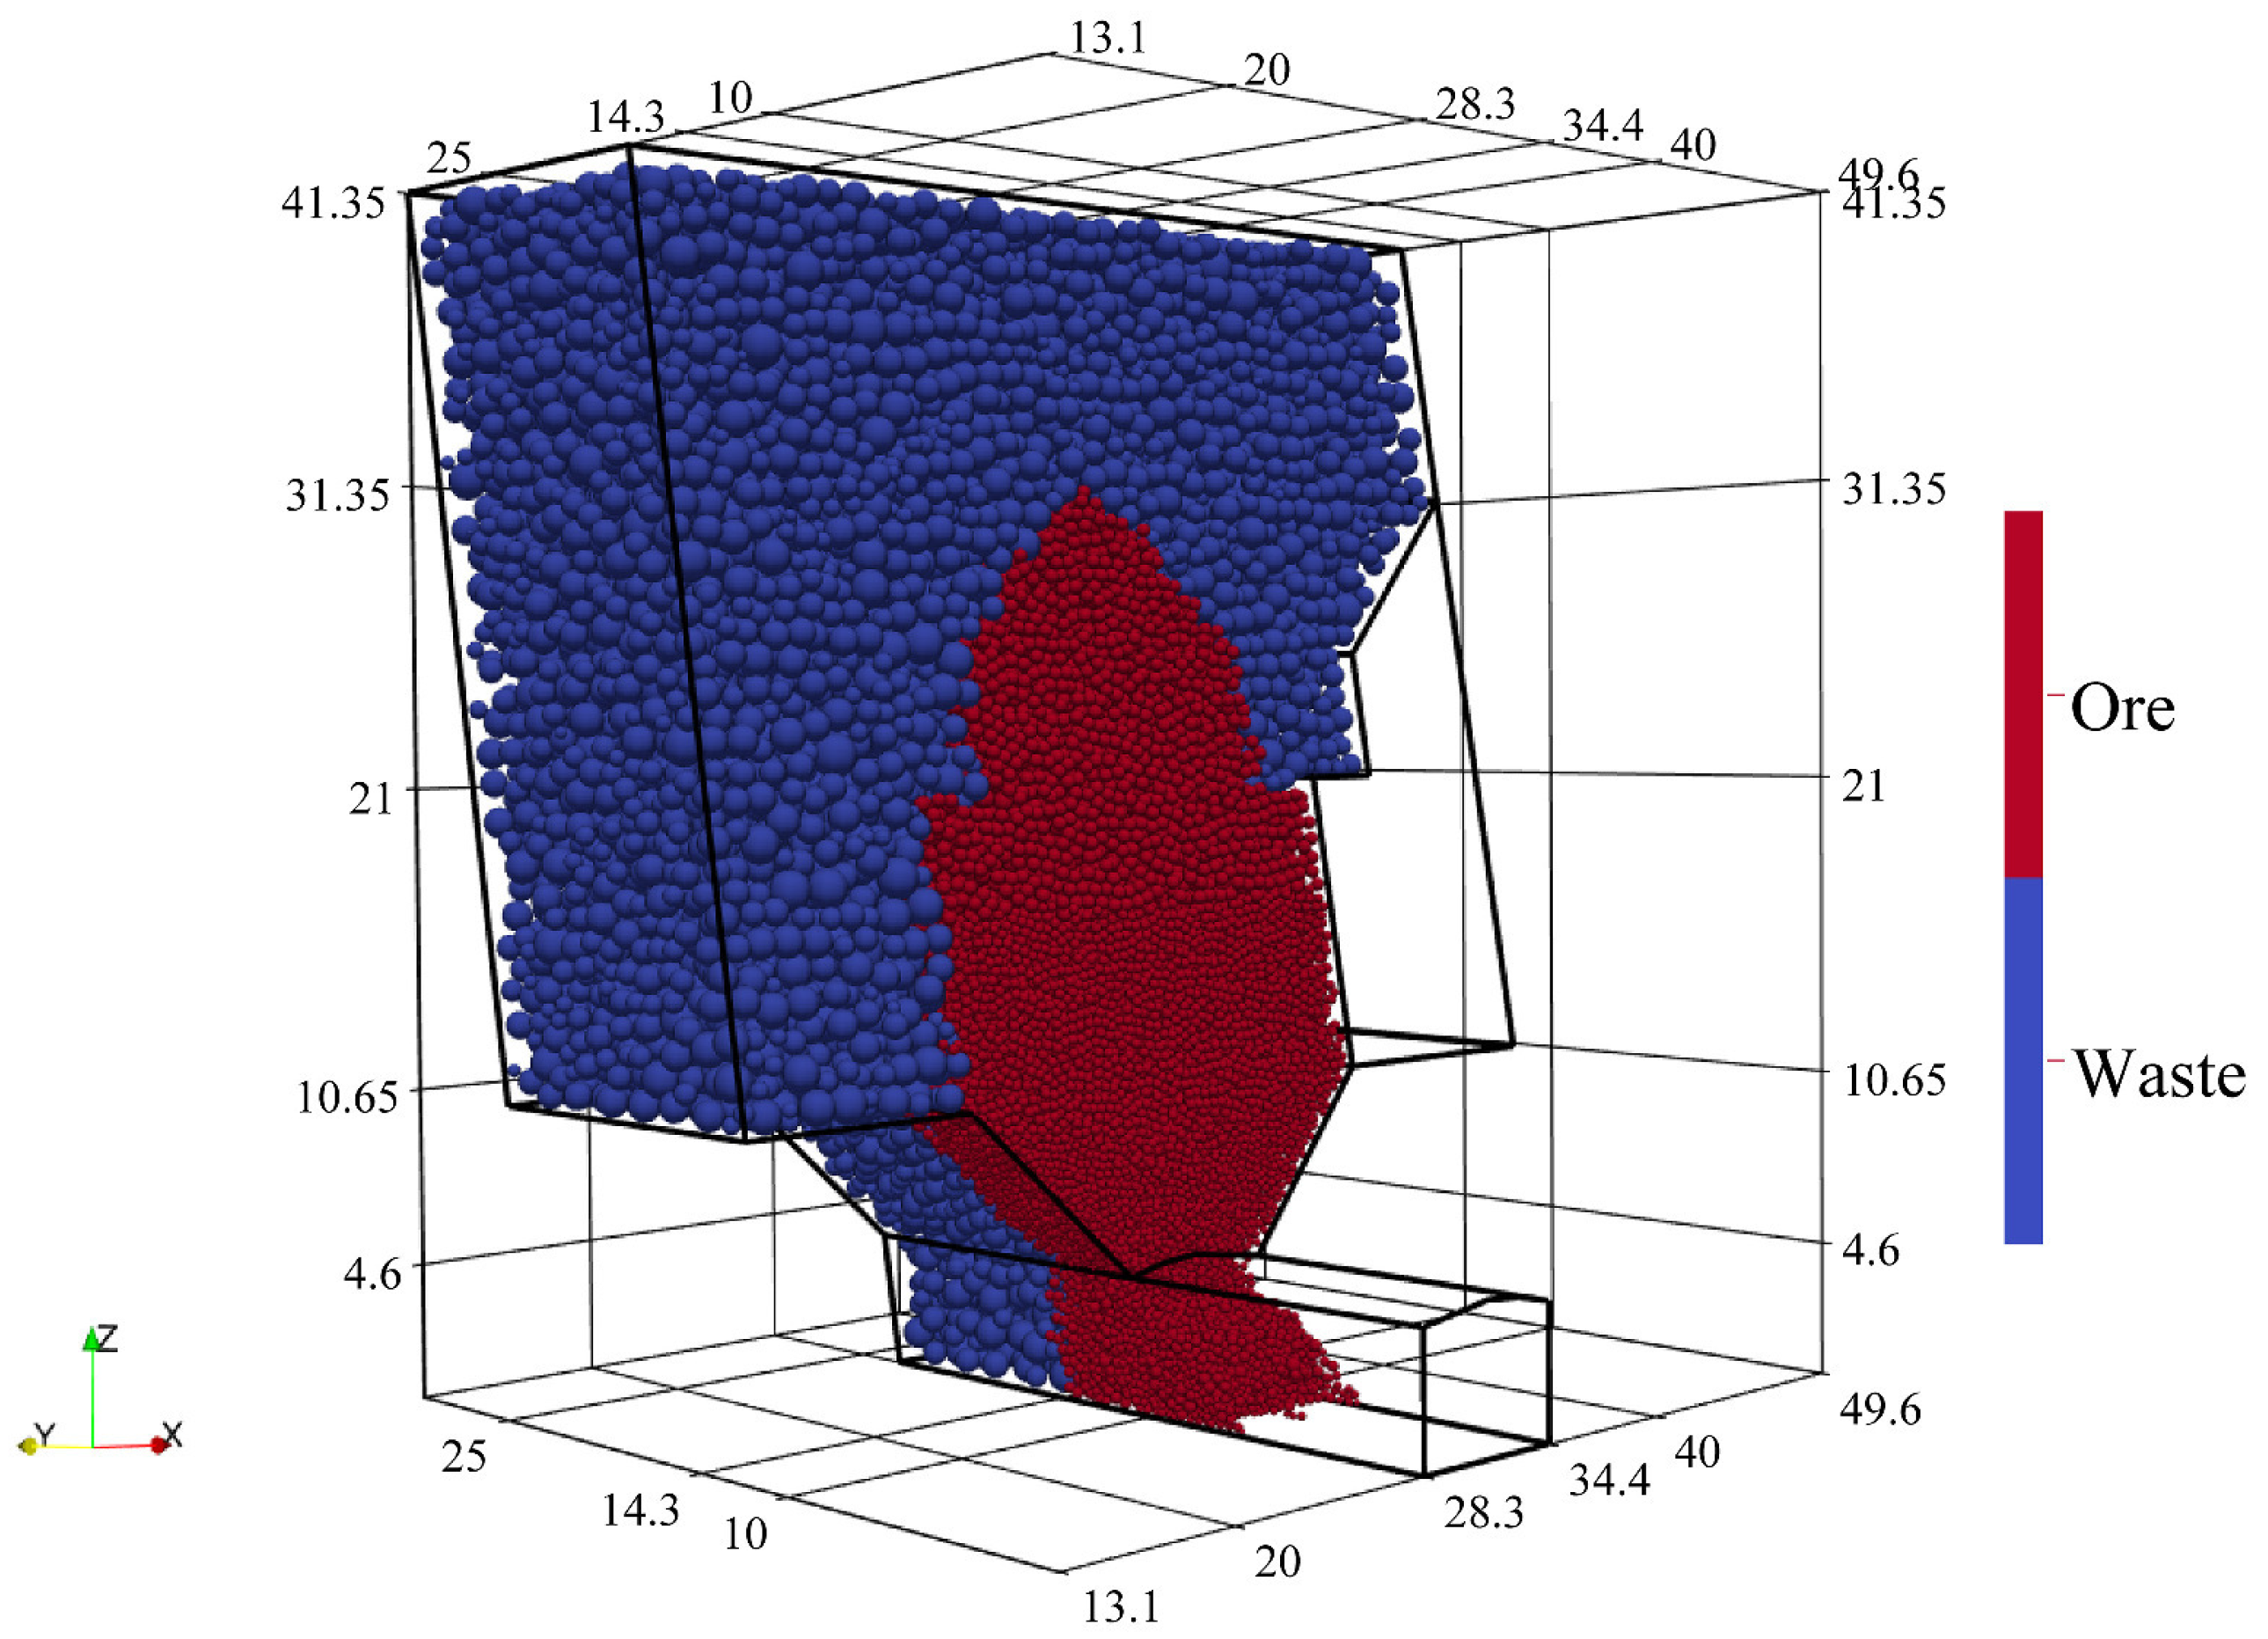
As the starting point for the parametric research of the change in caved mass properties, it is necessary to create as representative a model as possible. This means that the model will encompass the most influential properties of the process. DEM models are created using Yade [48] with frictional, spherical discrete elements. Yade is an open source DEM code that has extensive application for the modeling of a variety of problems [49,50,51,52]. The results that are obtained from the models are post-processed using Paraview [53] and Gnuplot [54]. This is the reduction of the rock fragments’ shape, and a more appropriate shape representation would be through the polyhedral discrete elements or clumps that are also implemented in Yade. However, it is necessary to emphasize that the shape of non-spherical discrete elements, their roundness and elongation would have the typical influence on the simulation behavior. In this manner, the “plain” model is created making it possible to distinguish how friction and size in general influence the outcome. Sublevel geometry is displayed in Figure 3 and consists of 6.1 m-wide and 4.6 m-high drift with an 18.3-m span between adjacent drifts. The height of the sublevel is 21.3 m. Loading is simulated by deleting the elements at the drawing point inside the sublevel drift. The loader’s bucket is simulated by an ∼5 m prism at the loading point. The model consists of a double-wide ore ring surrounded by waste material. This is the only the initial state model that is processed in order to determine the amount at the location of the deferred ore that remains after the drawing of the each ring. In this manner, the tendency is to observe the recovery and the influence of the deferred ore on the formation of the gravity flow and the dilution of the metal. As can be seen from Figure 3, the model geometry is asymmetrical. Production organization in the sublevel caving mines assumes that most of the time, an asymmetrical situation exists. Symmetrical conditions for the drawing are rare and occur in the cases where excavation advances in the shape of the wedge, and only sublevels in the middle are symmetrical. However, the initial comparison between symmetrical and asymmetrical models for the given geometry showed no difference in the results. Since the asymmetrical model contains less elements, it was chosen for the simulation due to the lower computational time and representativity.
The main attribute of the sublevel caving mining method is that the ore is blasted using a ring (fan) blasting pattern. Blasting in this manner creates different spatial fragment size distributions. Fragments with smaller sizes are created where blastholes are closest to each other, while larger fragments are created as the spacing between blastholes increases. Furthermore, there is differentiation between fragment sizes along the axis of the sublevel drift. This division is modeled and is shown in Figure 4. It is common practice that in sublevel mines, two subsequent rings are blasted and then extracted, since it has been shown that ore recovery and dilution are optimized in this manner [5,39]. Therefore, DEM models are created using two rings for extraction, and in this manner, six different spatial fragment size zones are created. The fragment size and spatial distribution of blasted ore fragments remains the same in all models. The size the distribution of the waste material is changed in different models and is shown accordingly.
The frictional constitutive model [31,48,55] for particle contacts is used, while particle movement is induced by the vertical gravitational stress field. DeGagne [39] used the approach where contacts between particles are both frictional and cohesive. This would be reasonable in situations where rock mass has a certain amount of clay infill inside the joints that may generate the cohesion at the contact of two rock blocks. Particle material properties are given in Table 1. The outer boundary of the model is rigid, and its size is large enough that the boundary effect has no influence on the flow formation.
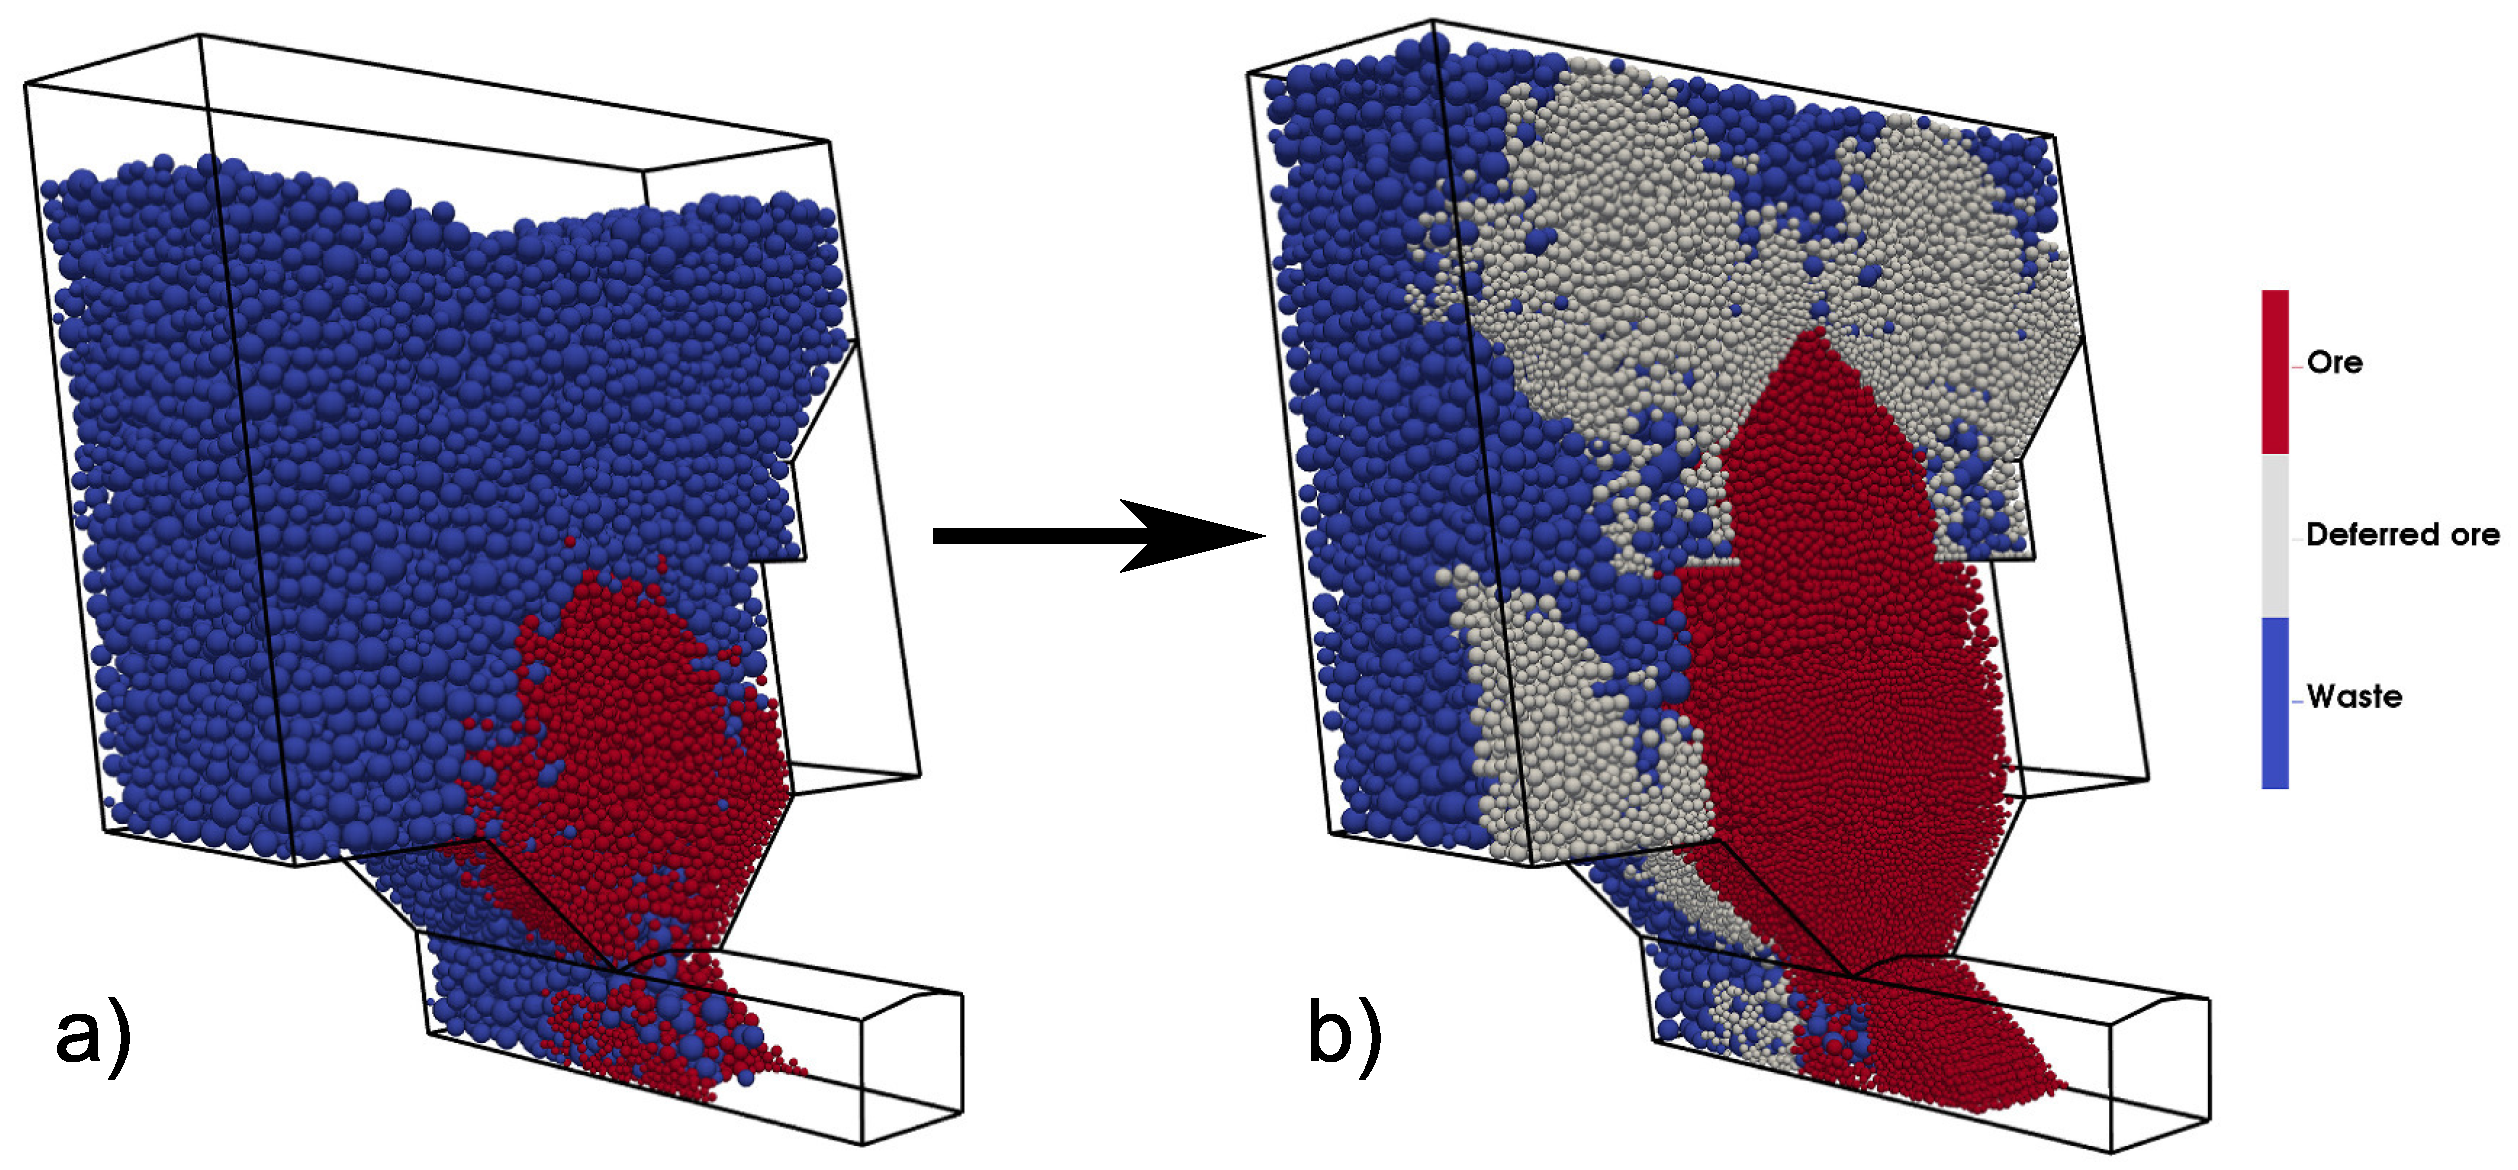
After the processing of the initial model, its final state is saved, and ore that represents the loss (Figure 5a) is used for the new model (Figure 5b). It is left in the space of the previous rings. In this manner, ore dilution and recovery are analyzed in a more representative way. Convergence criteria for the models are set as 120% extraction of the ring mass.
During the simulation using representative models, several parameters are monitored:
Ore recovery from the ring:
where:
- , extracted ore mass from the ring
- , mass of ore in the ring
Deferred ore recovery is expressed as:
where:
- , extracted mass of deferred ore
- , total mass of deferred ore
Total ore recovery:
Dilution of the ore from the ring:
where:
- , mass of extracted waste
Assuming that there is constant metal content in ore and deferred ore and that the metal content in the waste is zero, metal dilution may be expressed as:
3.2. Influence of the Friction Change in the Caved Waste Material
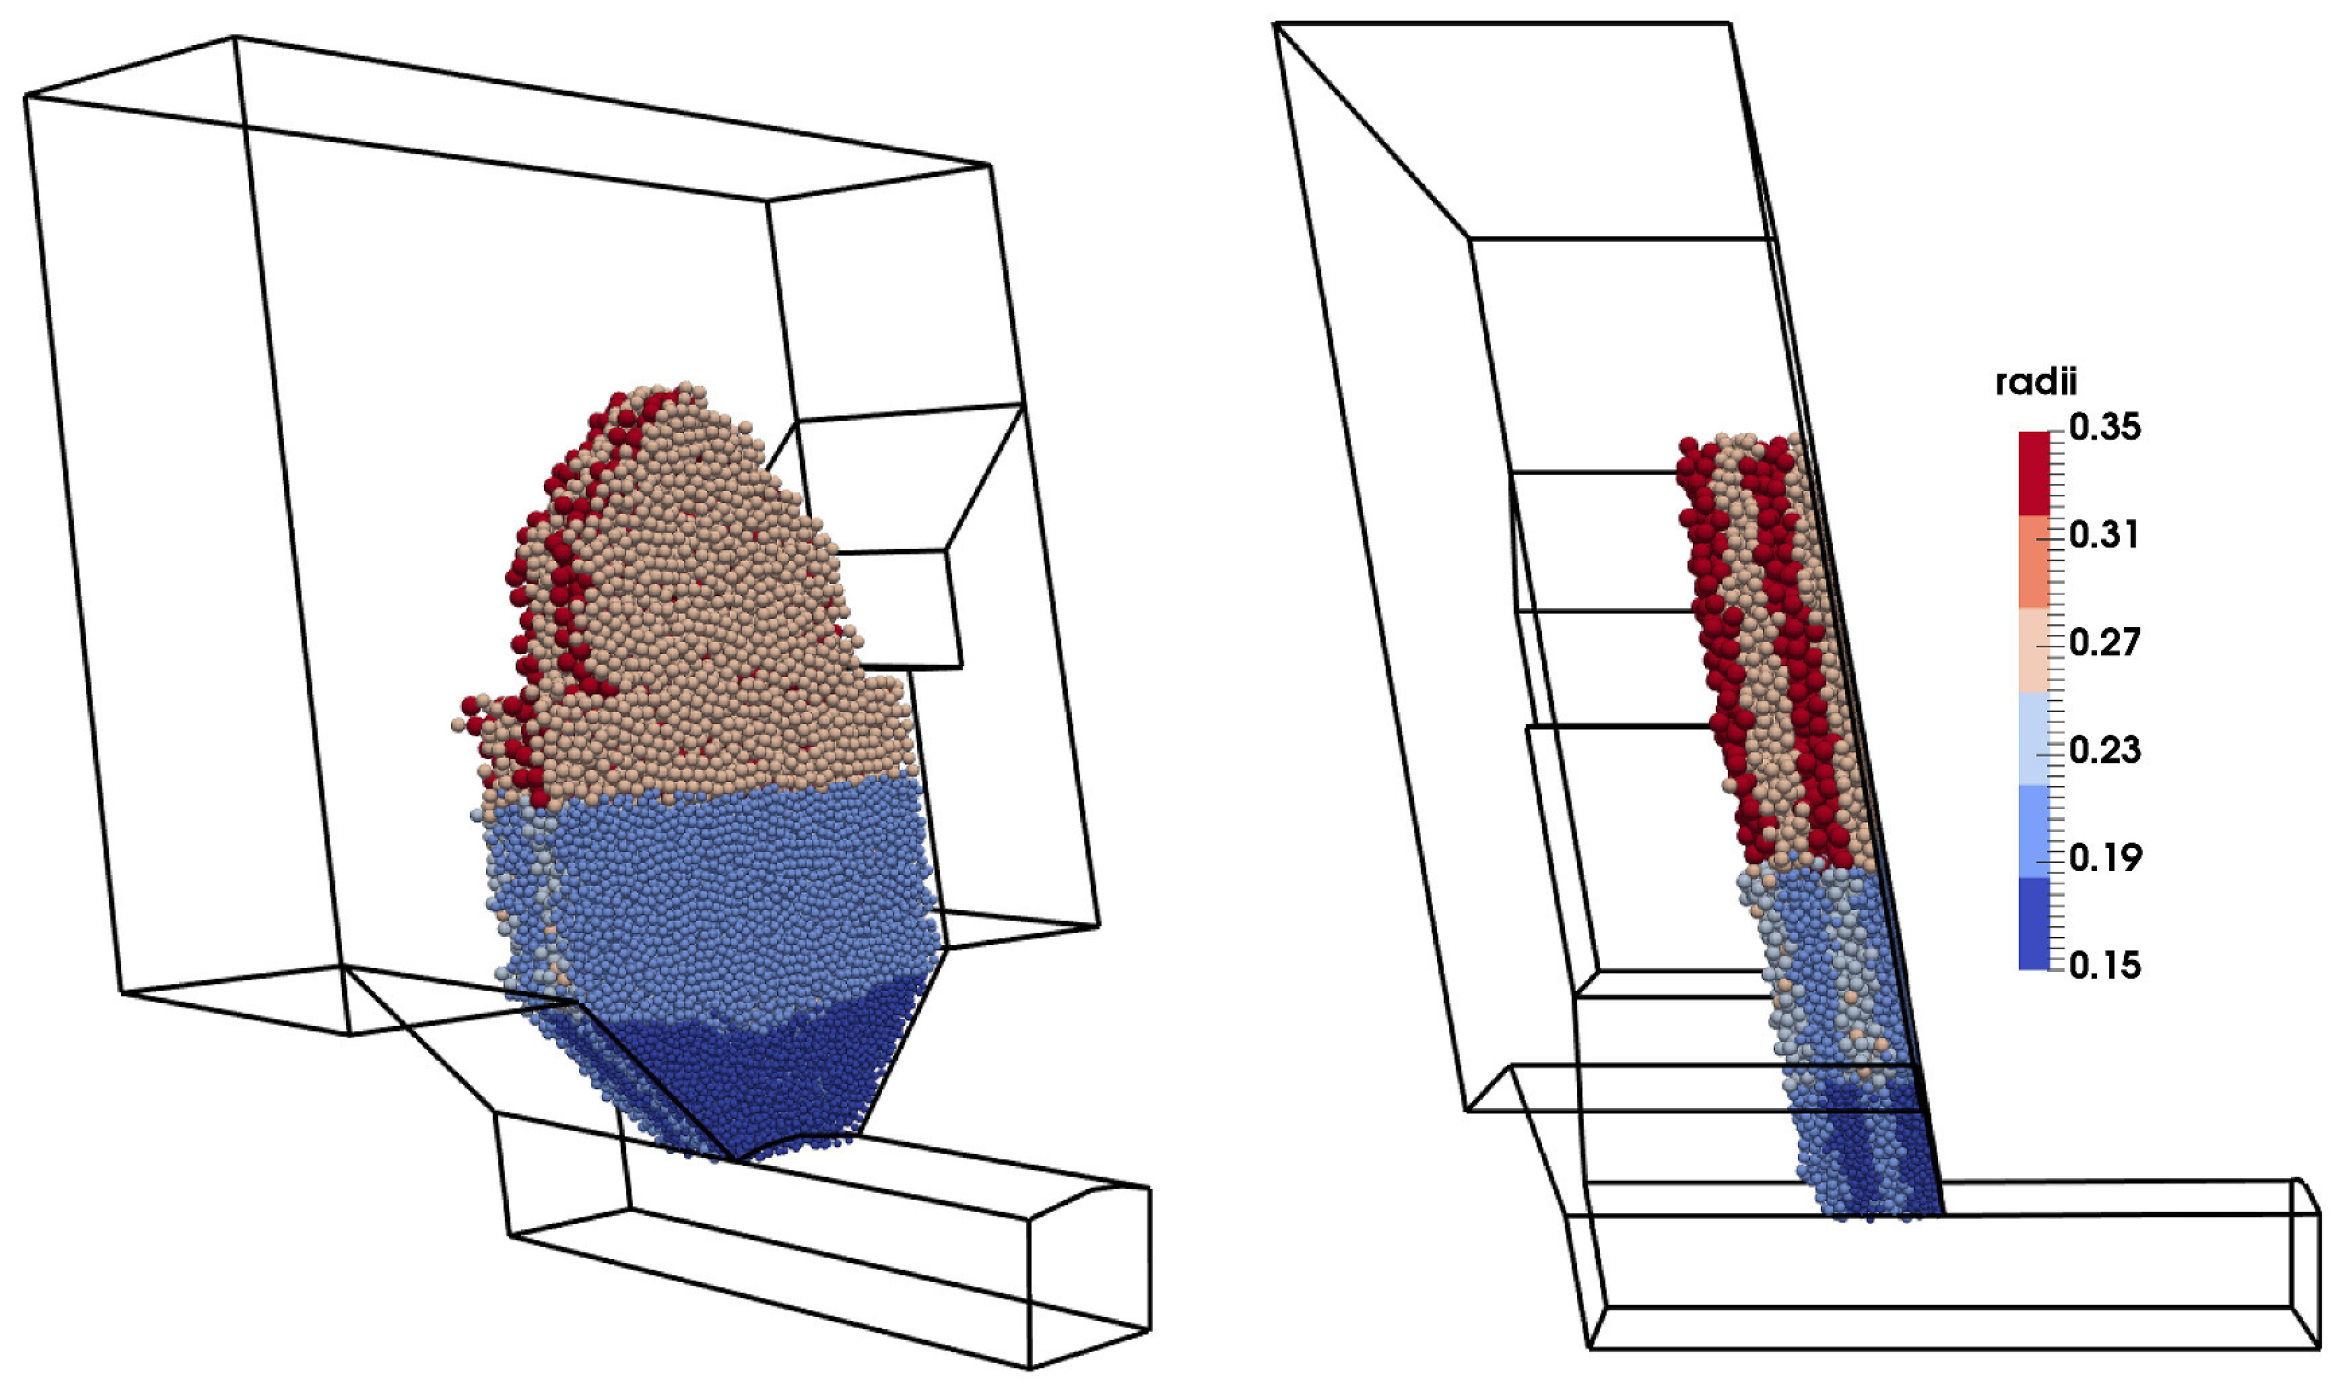
In Section 2, it was explained that during the excavation, caved waste material is being vertically moved and subjected to the additional fragmentation. Therefore, at each lower sublevel, finer waste material may be expected. During this process, the friction of the waste surfaces is also changed. Those two processes are taking place simultaneously, but with the benefit of DEM models, it is possible to examine each of these separately. Herein, only change in the friction of the surfaces is analyzed for the given situation. The model with the same initial conditions is processed for the different friction angle values of the waste material ( = 35°, 30°, 25°). Figure 6 presents the model results where friction change influence was analyzed.
It can be seen that decreasing the friction of the waste material influences its greater inflow into the sublevel drift, diluting the ore and metal content. If we take a closer look at the ring dilution curves, it may be noted that the drop in the friction for 5° induces cumulative ring dilution between 2% and 3%. Furthermore, the drop in the cumulative recovery corresponds to the greater inflow of the waste material, and a clear difference between the curves of total and ring ore recoveries for different friction values is obvious. On the other side, recovery of deferred ore for each of the cases is almost the same and is around 25% of total deferred ore in the model. This is the ore that remains behind the ring. Furthermore, and this is well known, finer deferred ore (particles) is traveling faster [56] through the coarser ore in the ring and the waste material. However, deferred ore from other locations does not reach the extraction point during the model execution. Figure 7 and Figure 8 illustrates gravity flows for each of the analyzed models. It can be seen that there is an obvious increase in the quantity of the waste as the friction drops down. Furthermore, the height of the extraction zone (EZ) decreases, which means that ore recovery drops, as previous graphs suggest. Decreasing the height of EZ results in its depth increase since more waste inflows during the model execution.
3.3. Fragmentation Change and Its Influence on Ore Dilution and Recovery
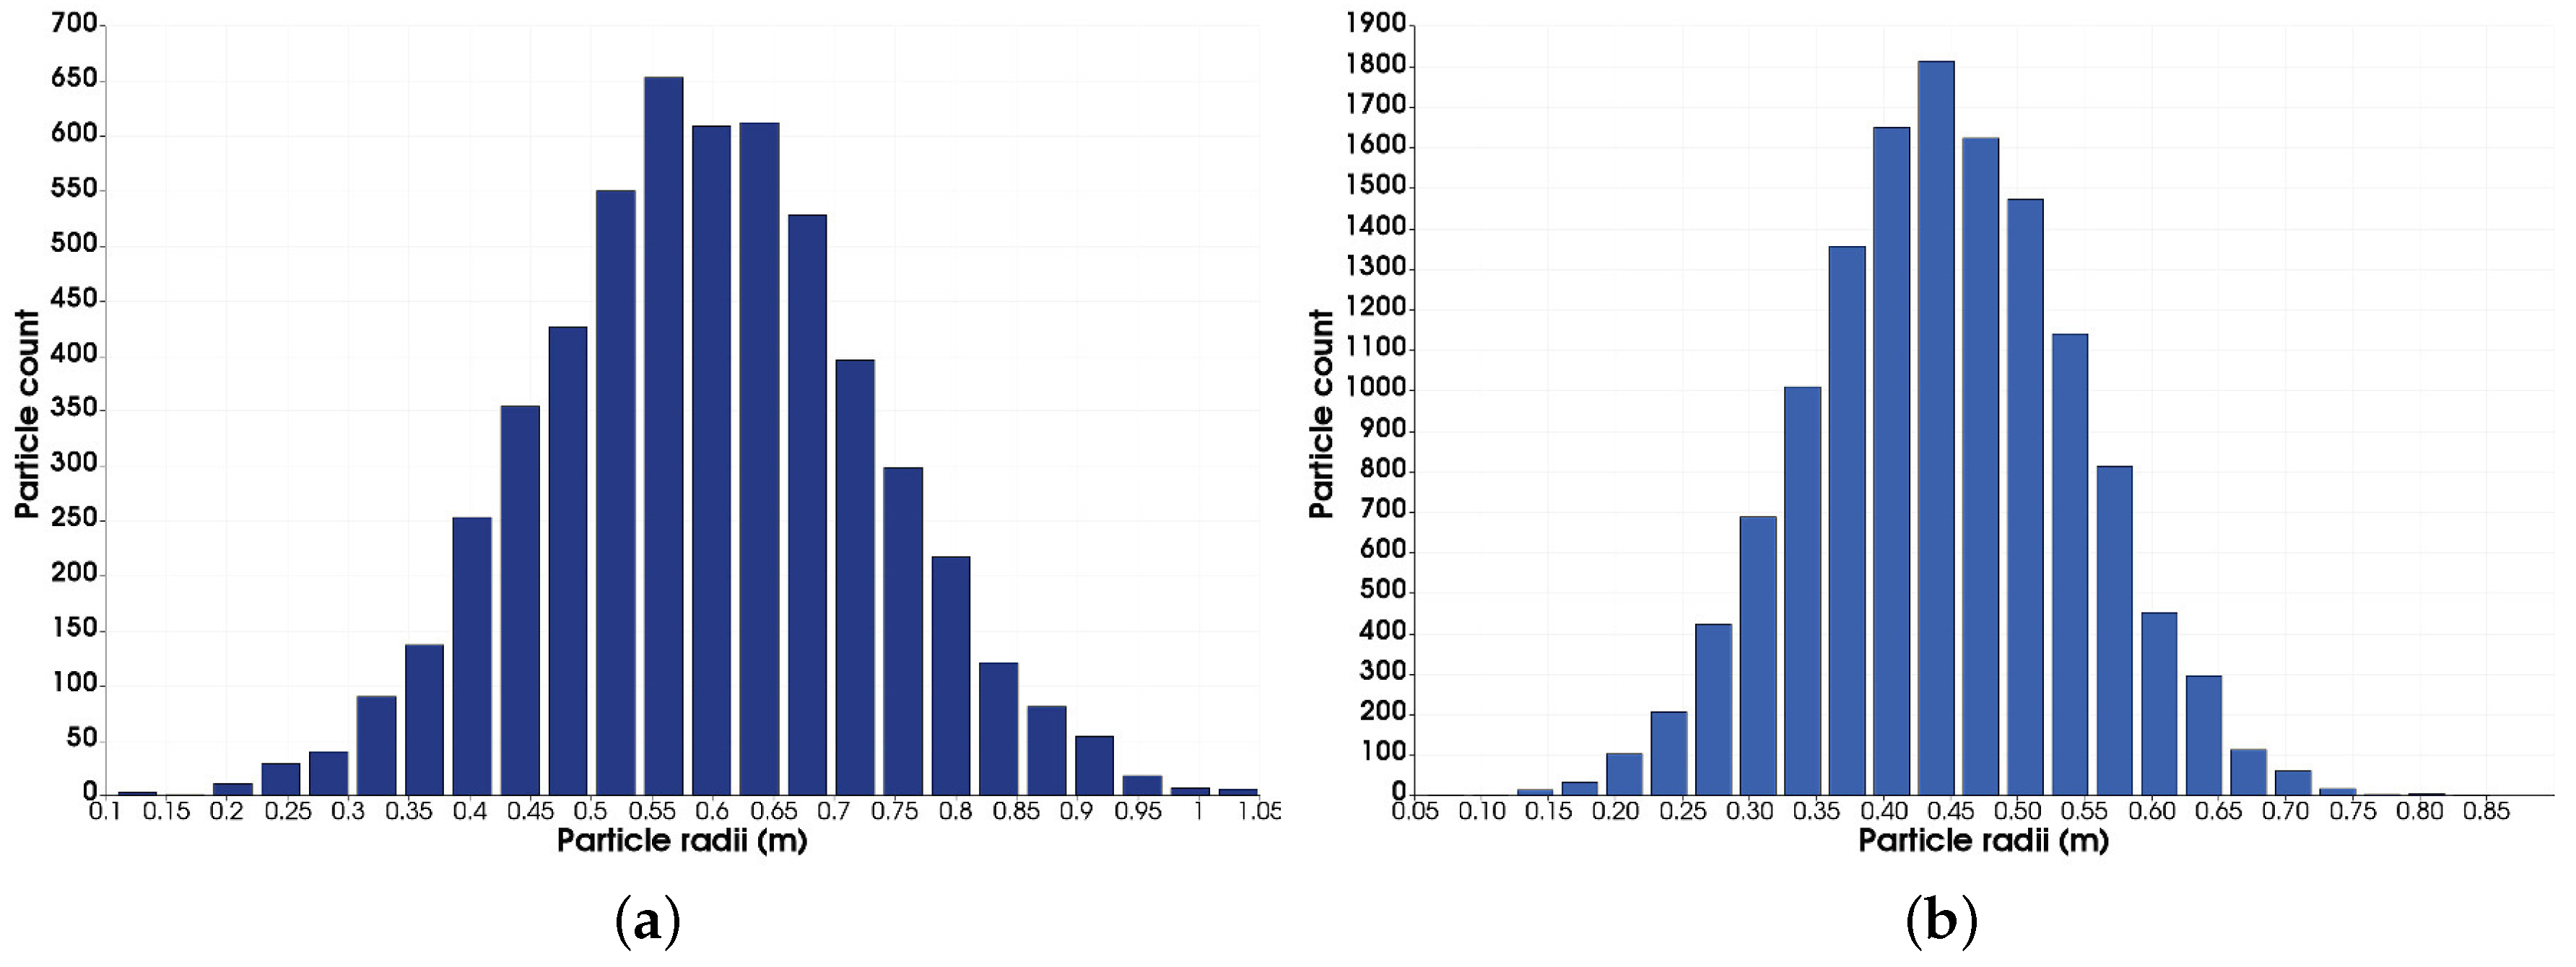
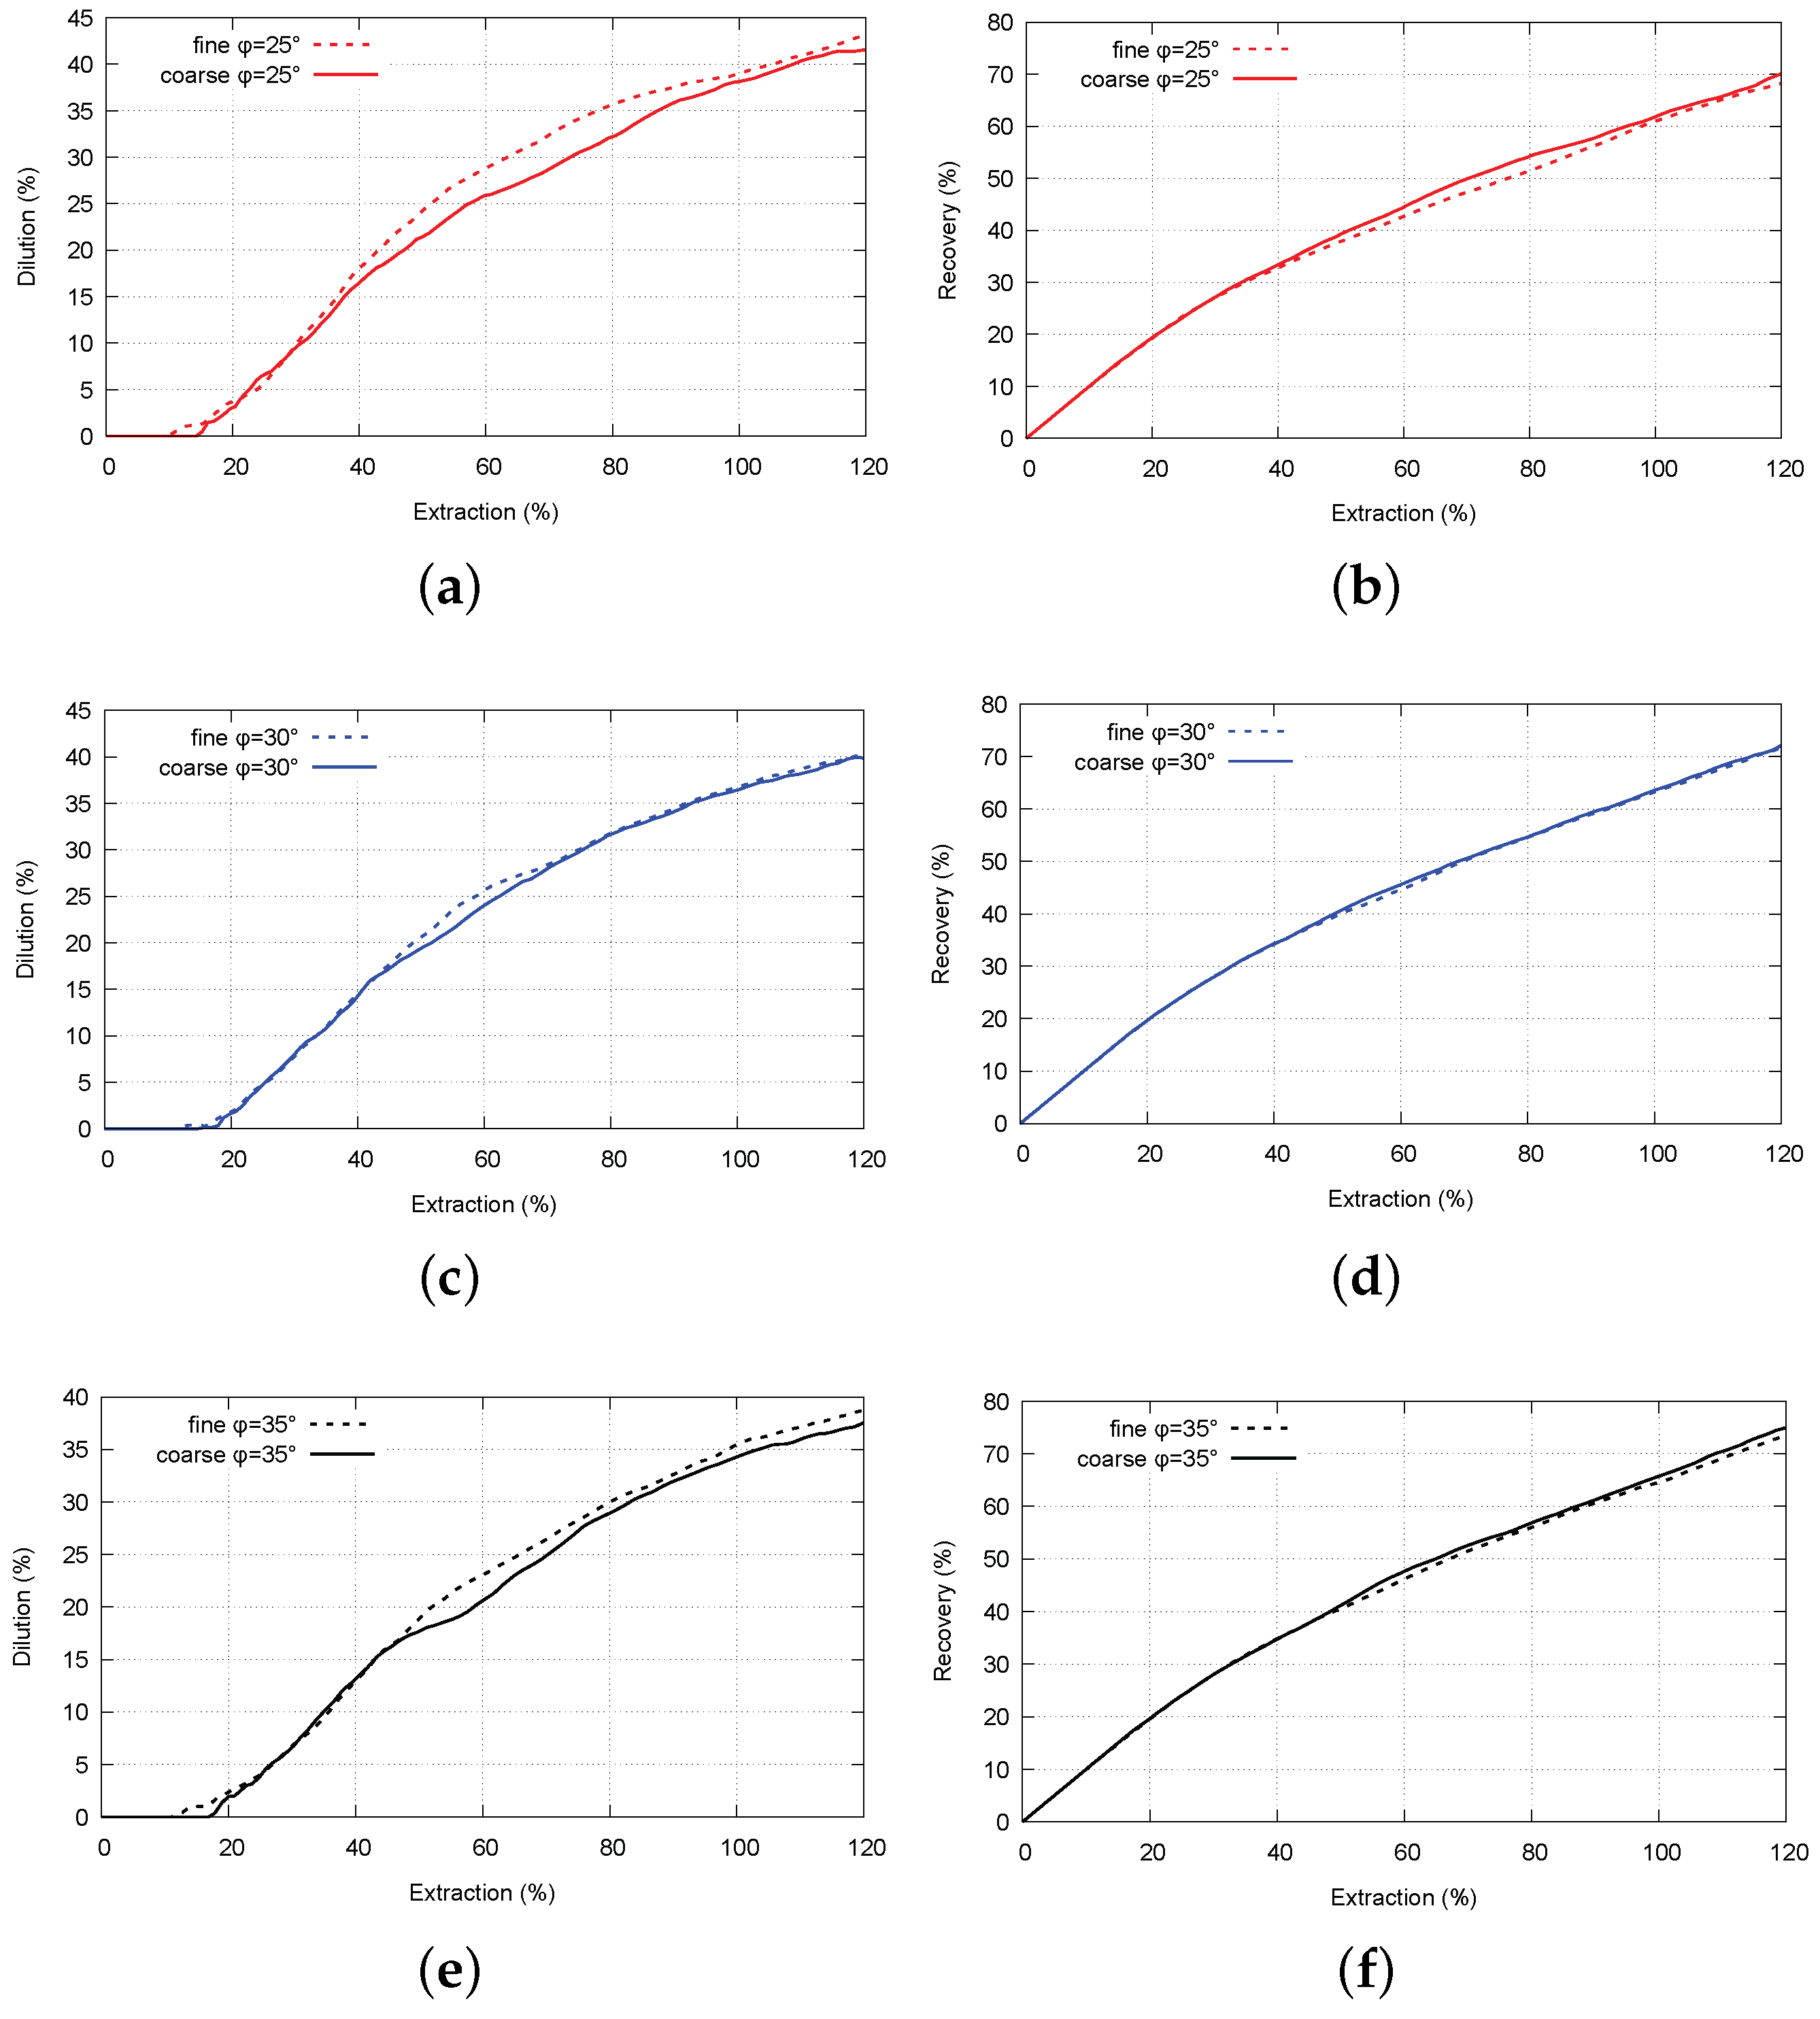
Since caved waste is subjected to vertical movement as the production advances, there is inevitable change of its fragmentation. This is a well-known and important factor in block caving mines, since it impacts the draw point spacing. In sublevel caving mines, this process occurs, and it is important to understand its influence on the formation of the gravity flow. The difference between gravity flows in block and sublevel caving come from fundamental differences in those mining methods. In block caving, one set of high rock mass columns is caved, and gravity flow forms along the whole height of drawing columns. In sublevel caving, the gravity flow of caved waste forms in numerous discrete stages where caved waste forms gravity flow between each of the two sublevels, until the bottom of the ore body is reached. Therefore, in steep ore bodies, caved waste is transformed similarly as in block caving. In order to demonstrate the influence of fragmentation change, two cases are analyzed, one with the coarser and one with the finer waste material. The size distribution for both cases is presented in Figure 9. For each case, three friction values of the waste material were simulated ( = 35°, 30°, 25°).
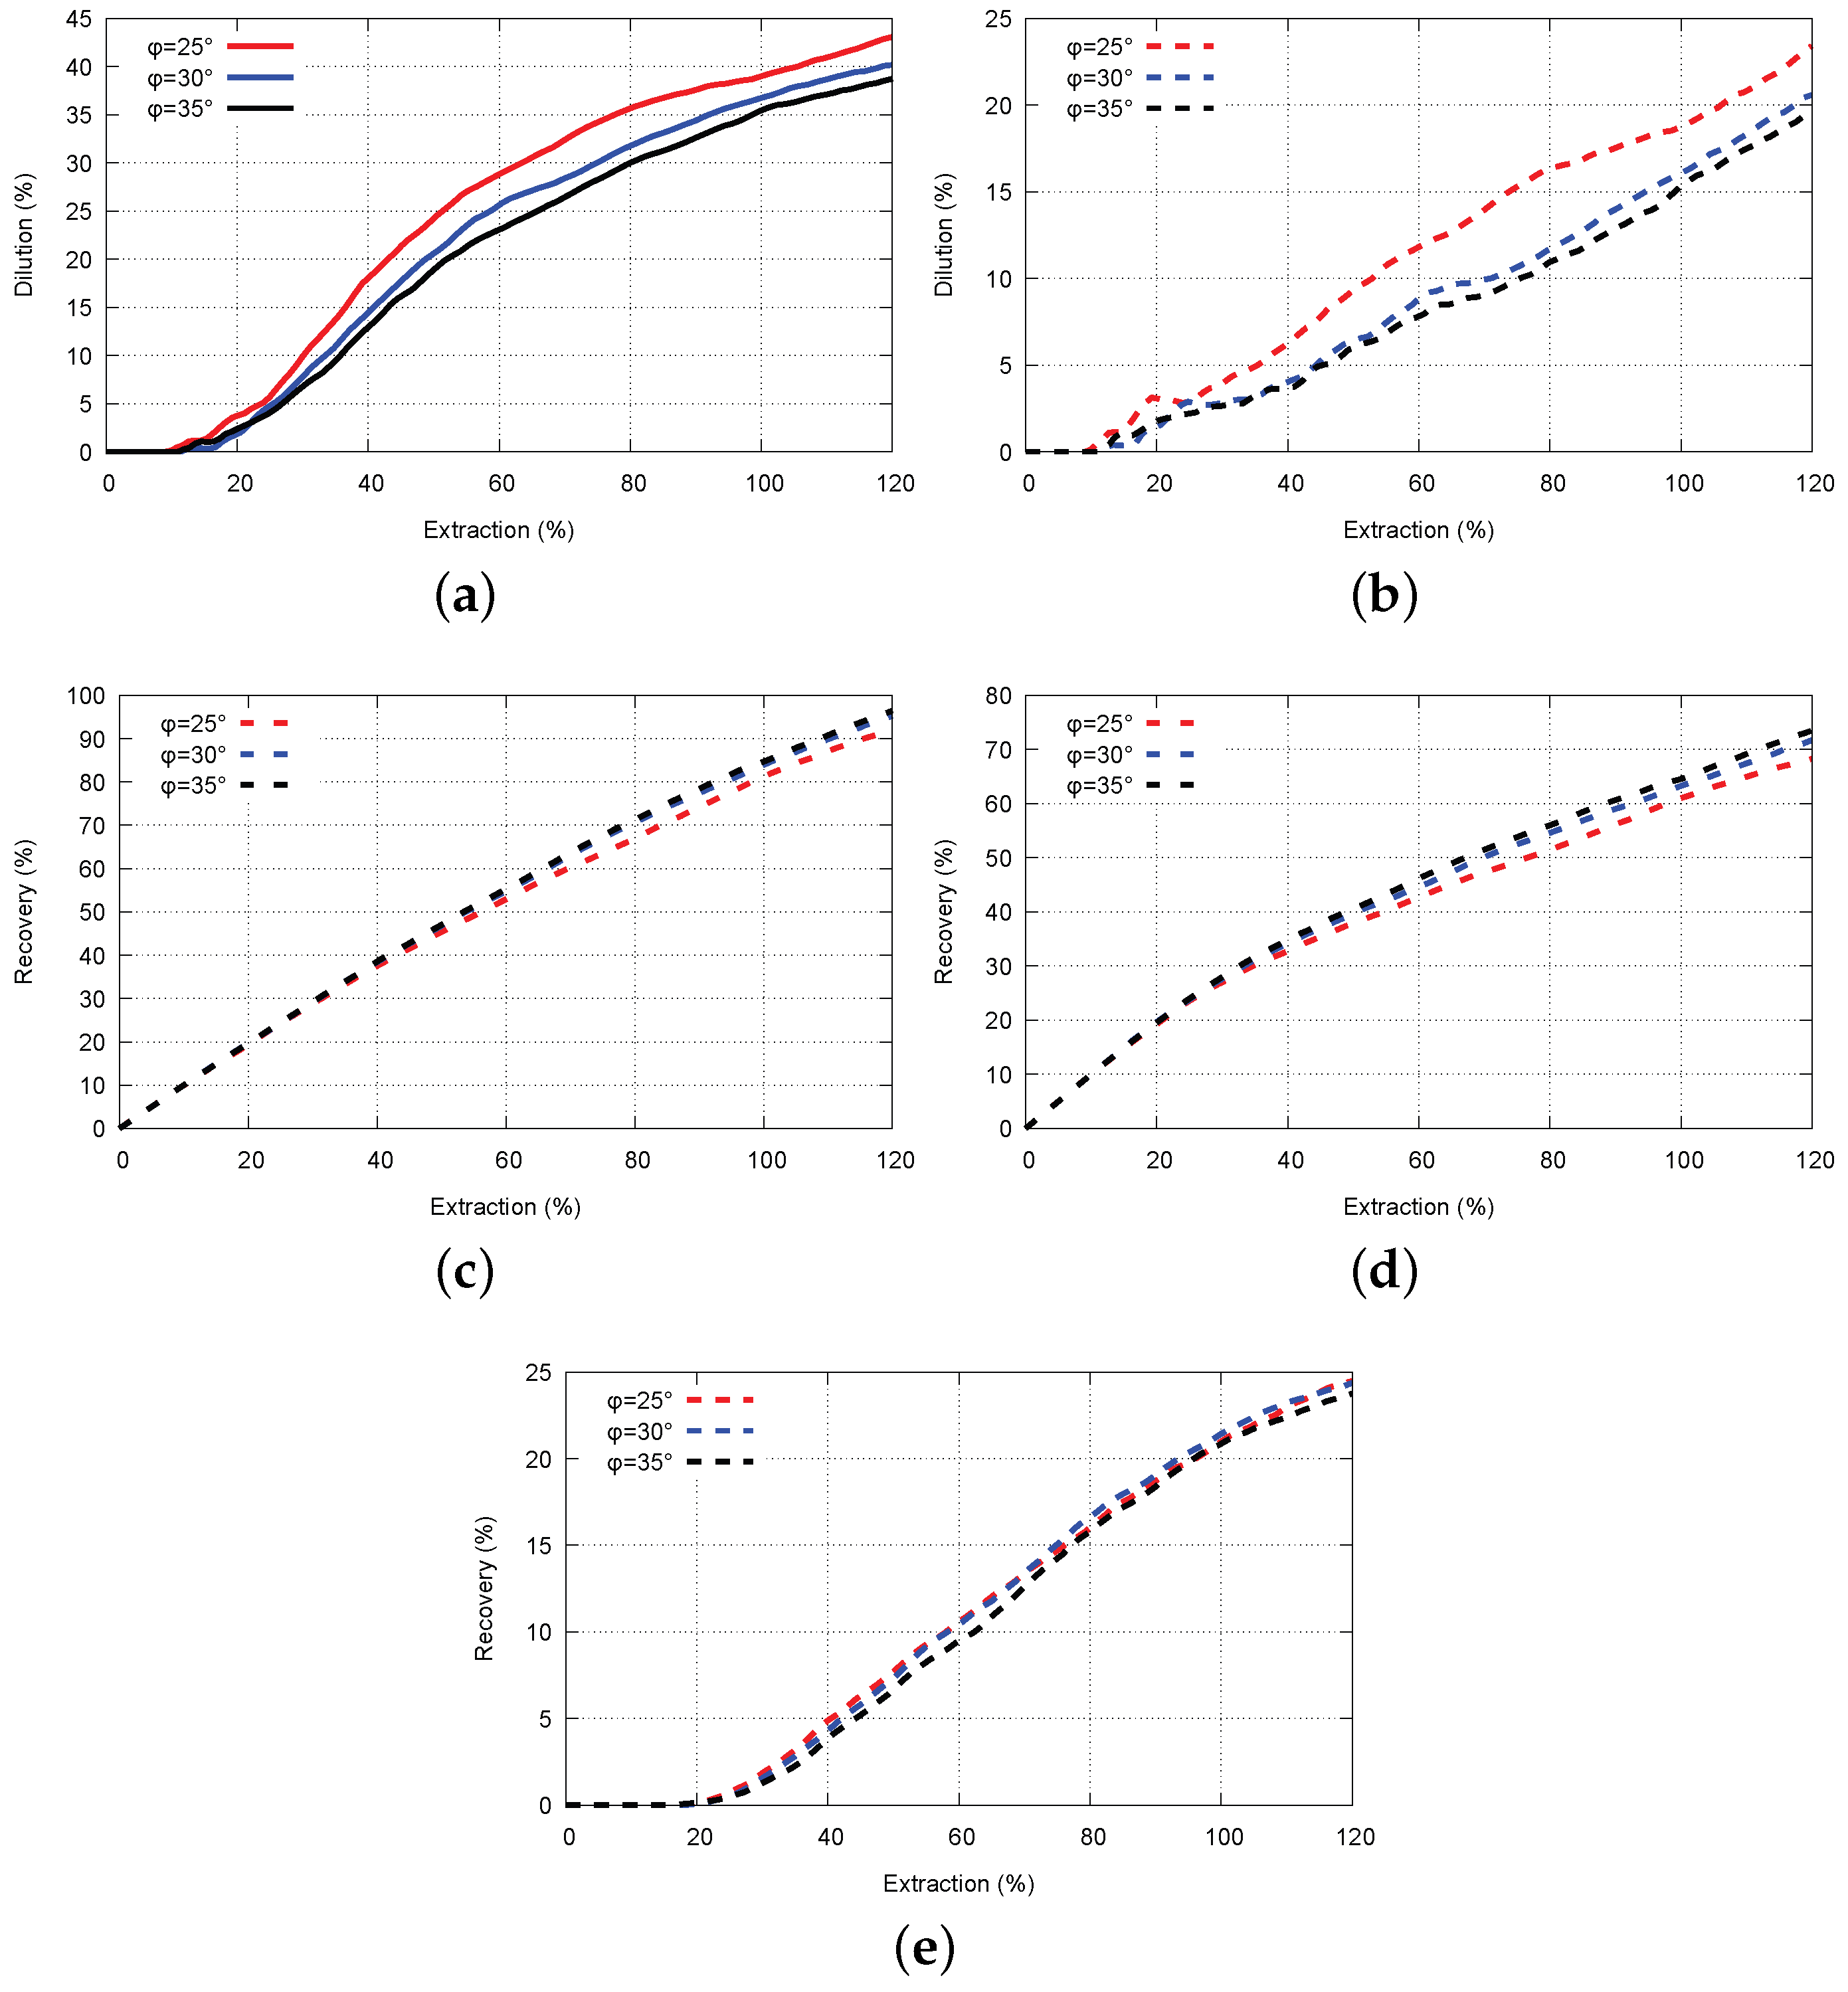
Fragmentation change influence is presented through the change in the dilution of the blasted ore (Figure 10). It is a known fact that finer granular material is flowing faster than coarser. Results displayed in Figure 10a,c,e show that with decreasing fragmentation of the caved waste, its inflow and mixing with blasted ore are greater, which results in higher dilution of the blasted ore. Corresponding graphs in Figure 10b,d,f show that for the same extraction level, recovery of the blasted ore is decreasing with the finer waste.
However, the results show that changes caused by the fragmentation are not the same for every value of the friction angle. The greatest increase of dilution is displayed for the lowest value of the friction angle (Figure 10a). In the case of the highest friction angle value (Figure 10e), the cumulative dilution increase is smaller, but there is a clear difference between finer and coarser material. For the case where = 30°, curves for the finer and coarser material are close, and only in one part (40%–70% of extraction), there is a clear increase (temporal) in dilution caused by the finer waste. This leads to the conclusion that there is a relation between the actual friction angle of the surfaces of waste rock fragments and the size distribution of the waste material. This correlation is not further investigated in this research.
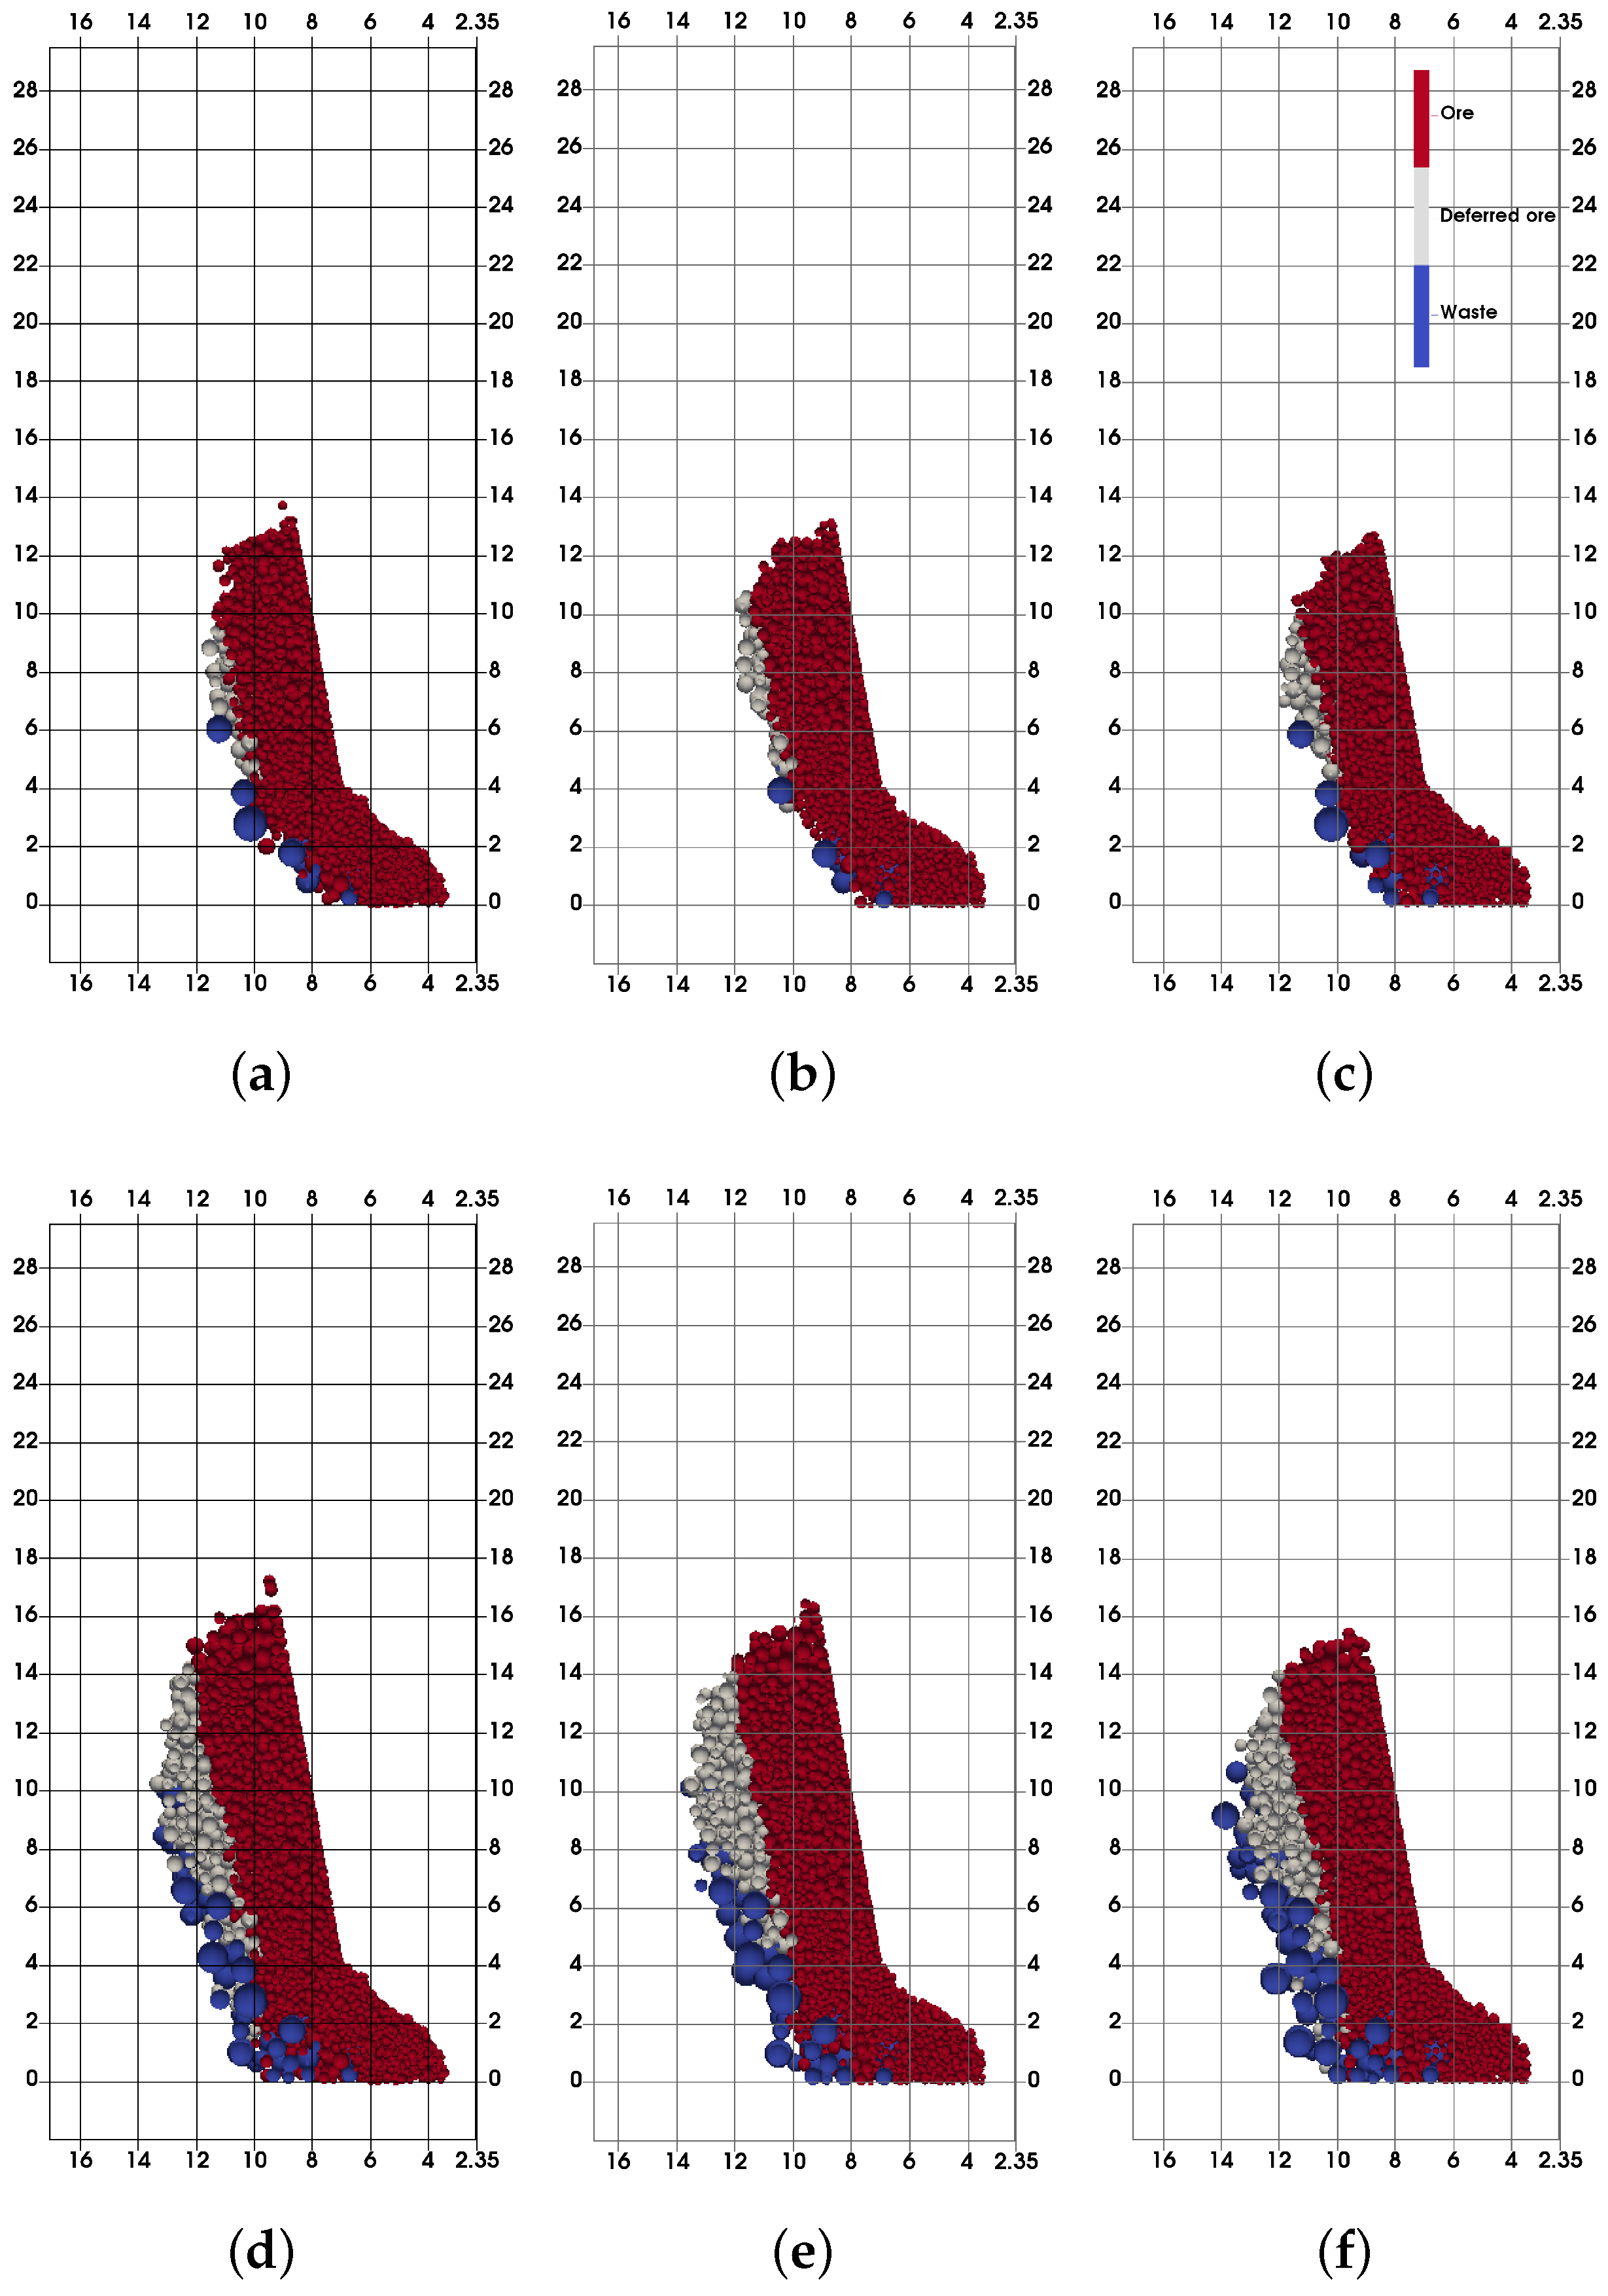
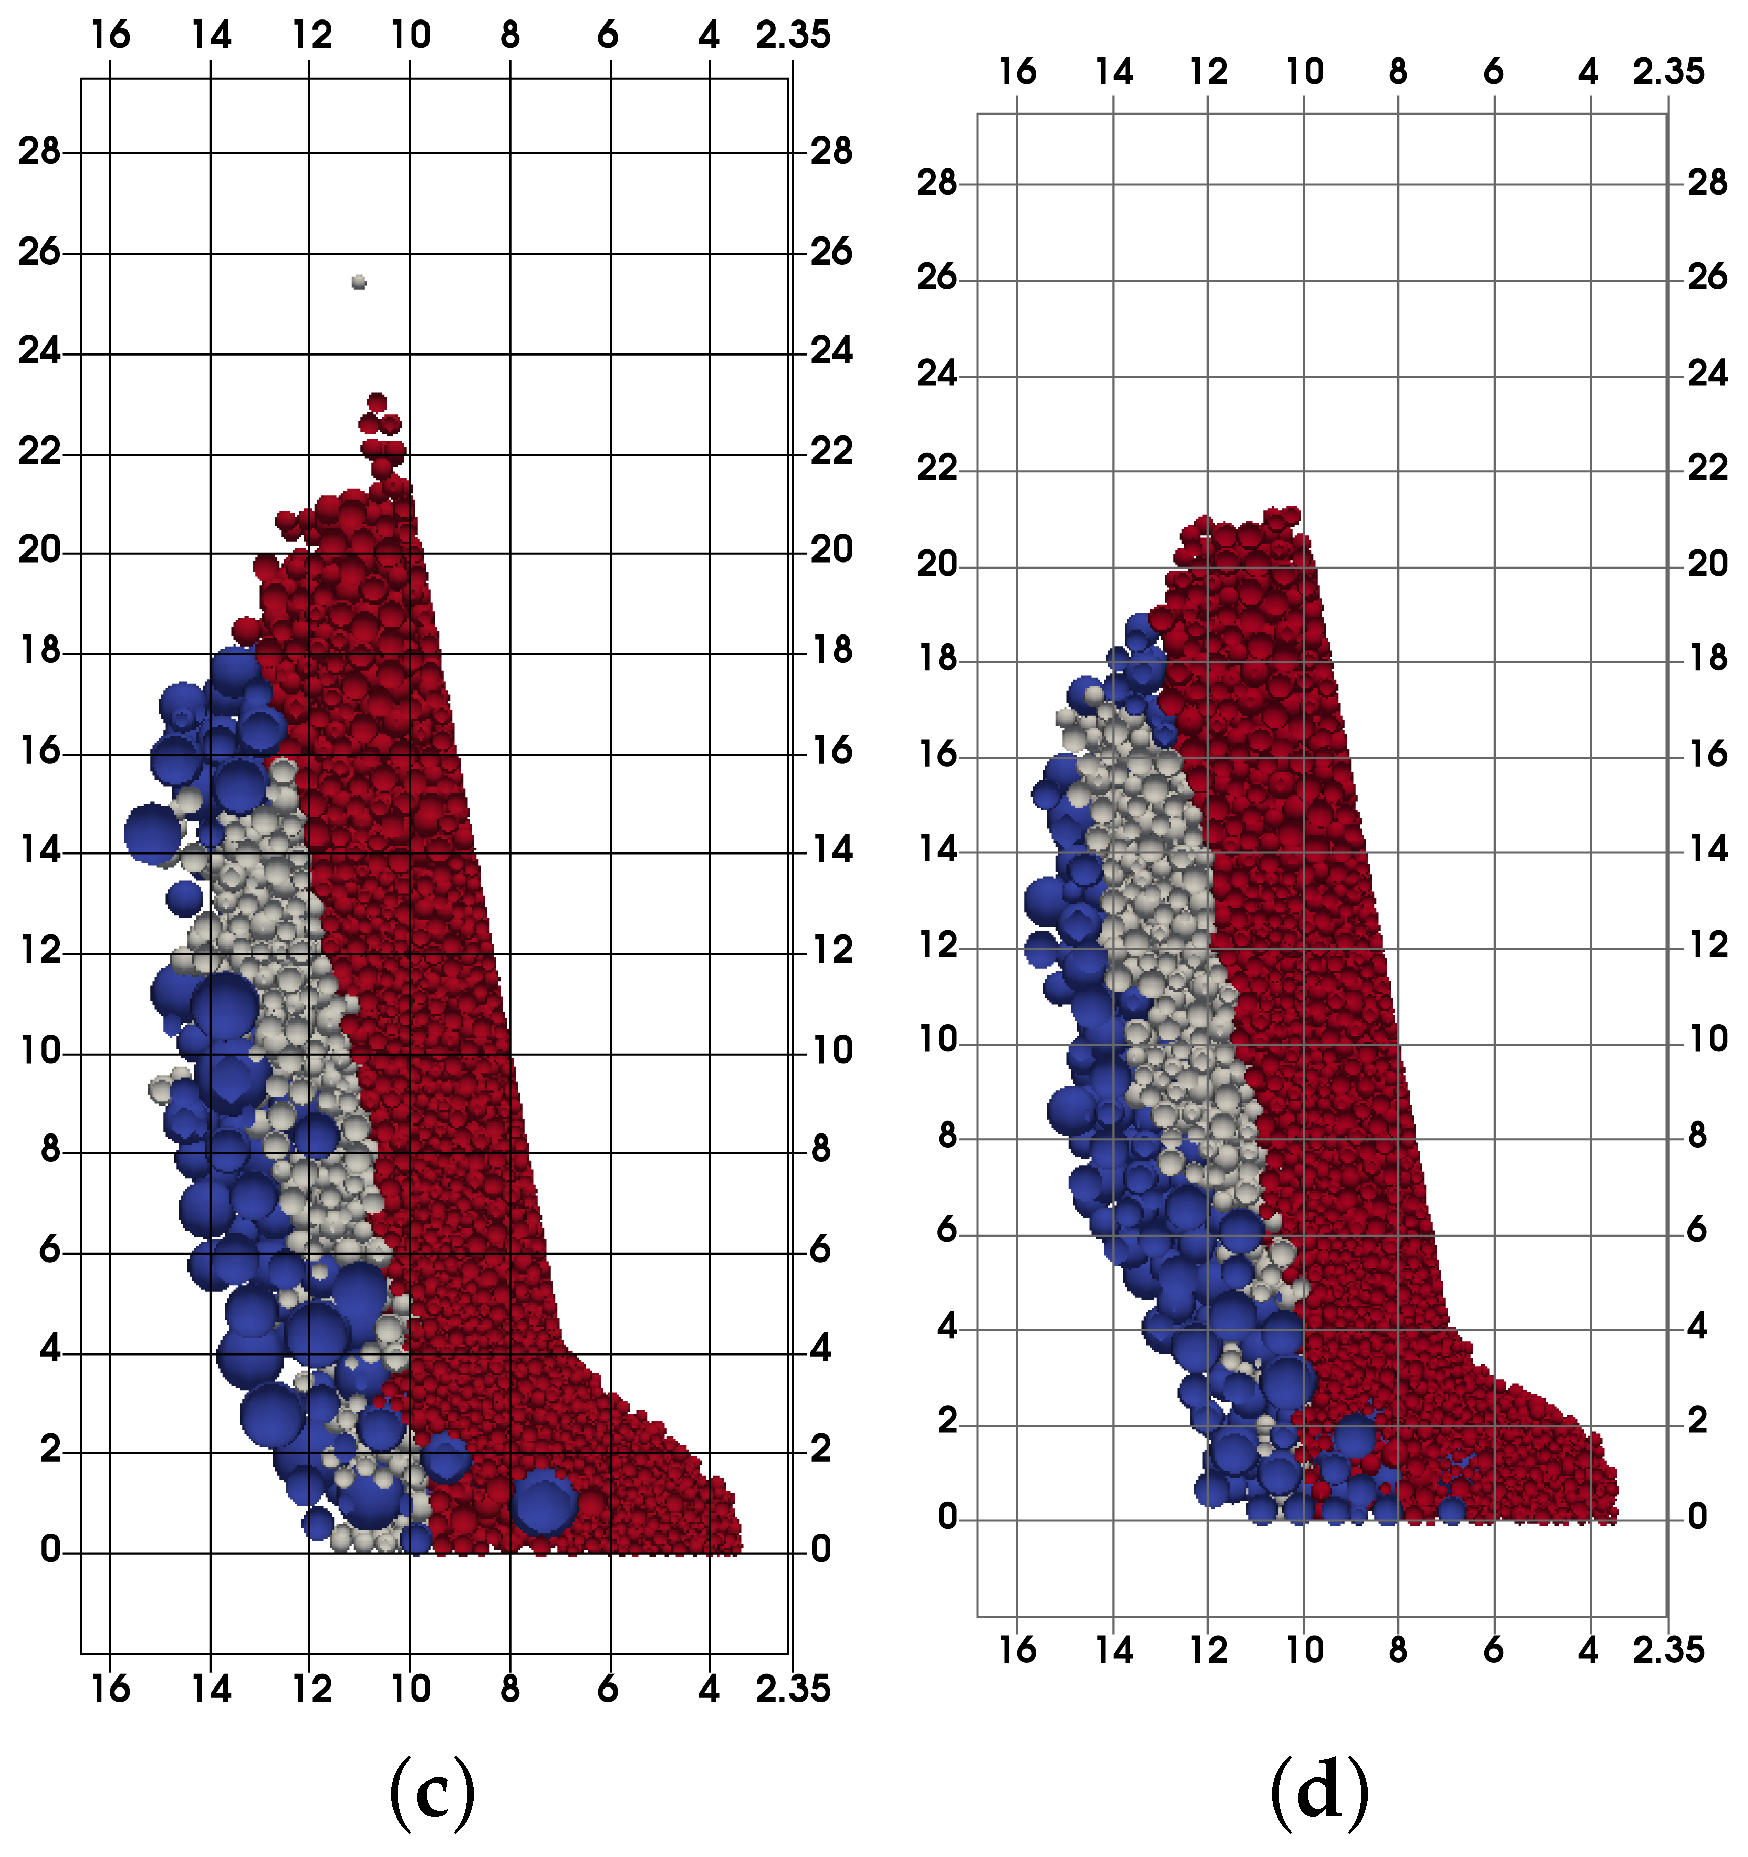
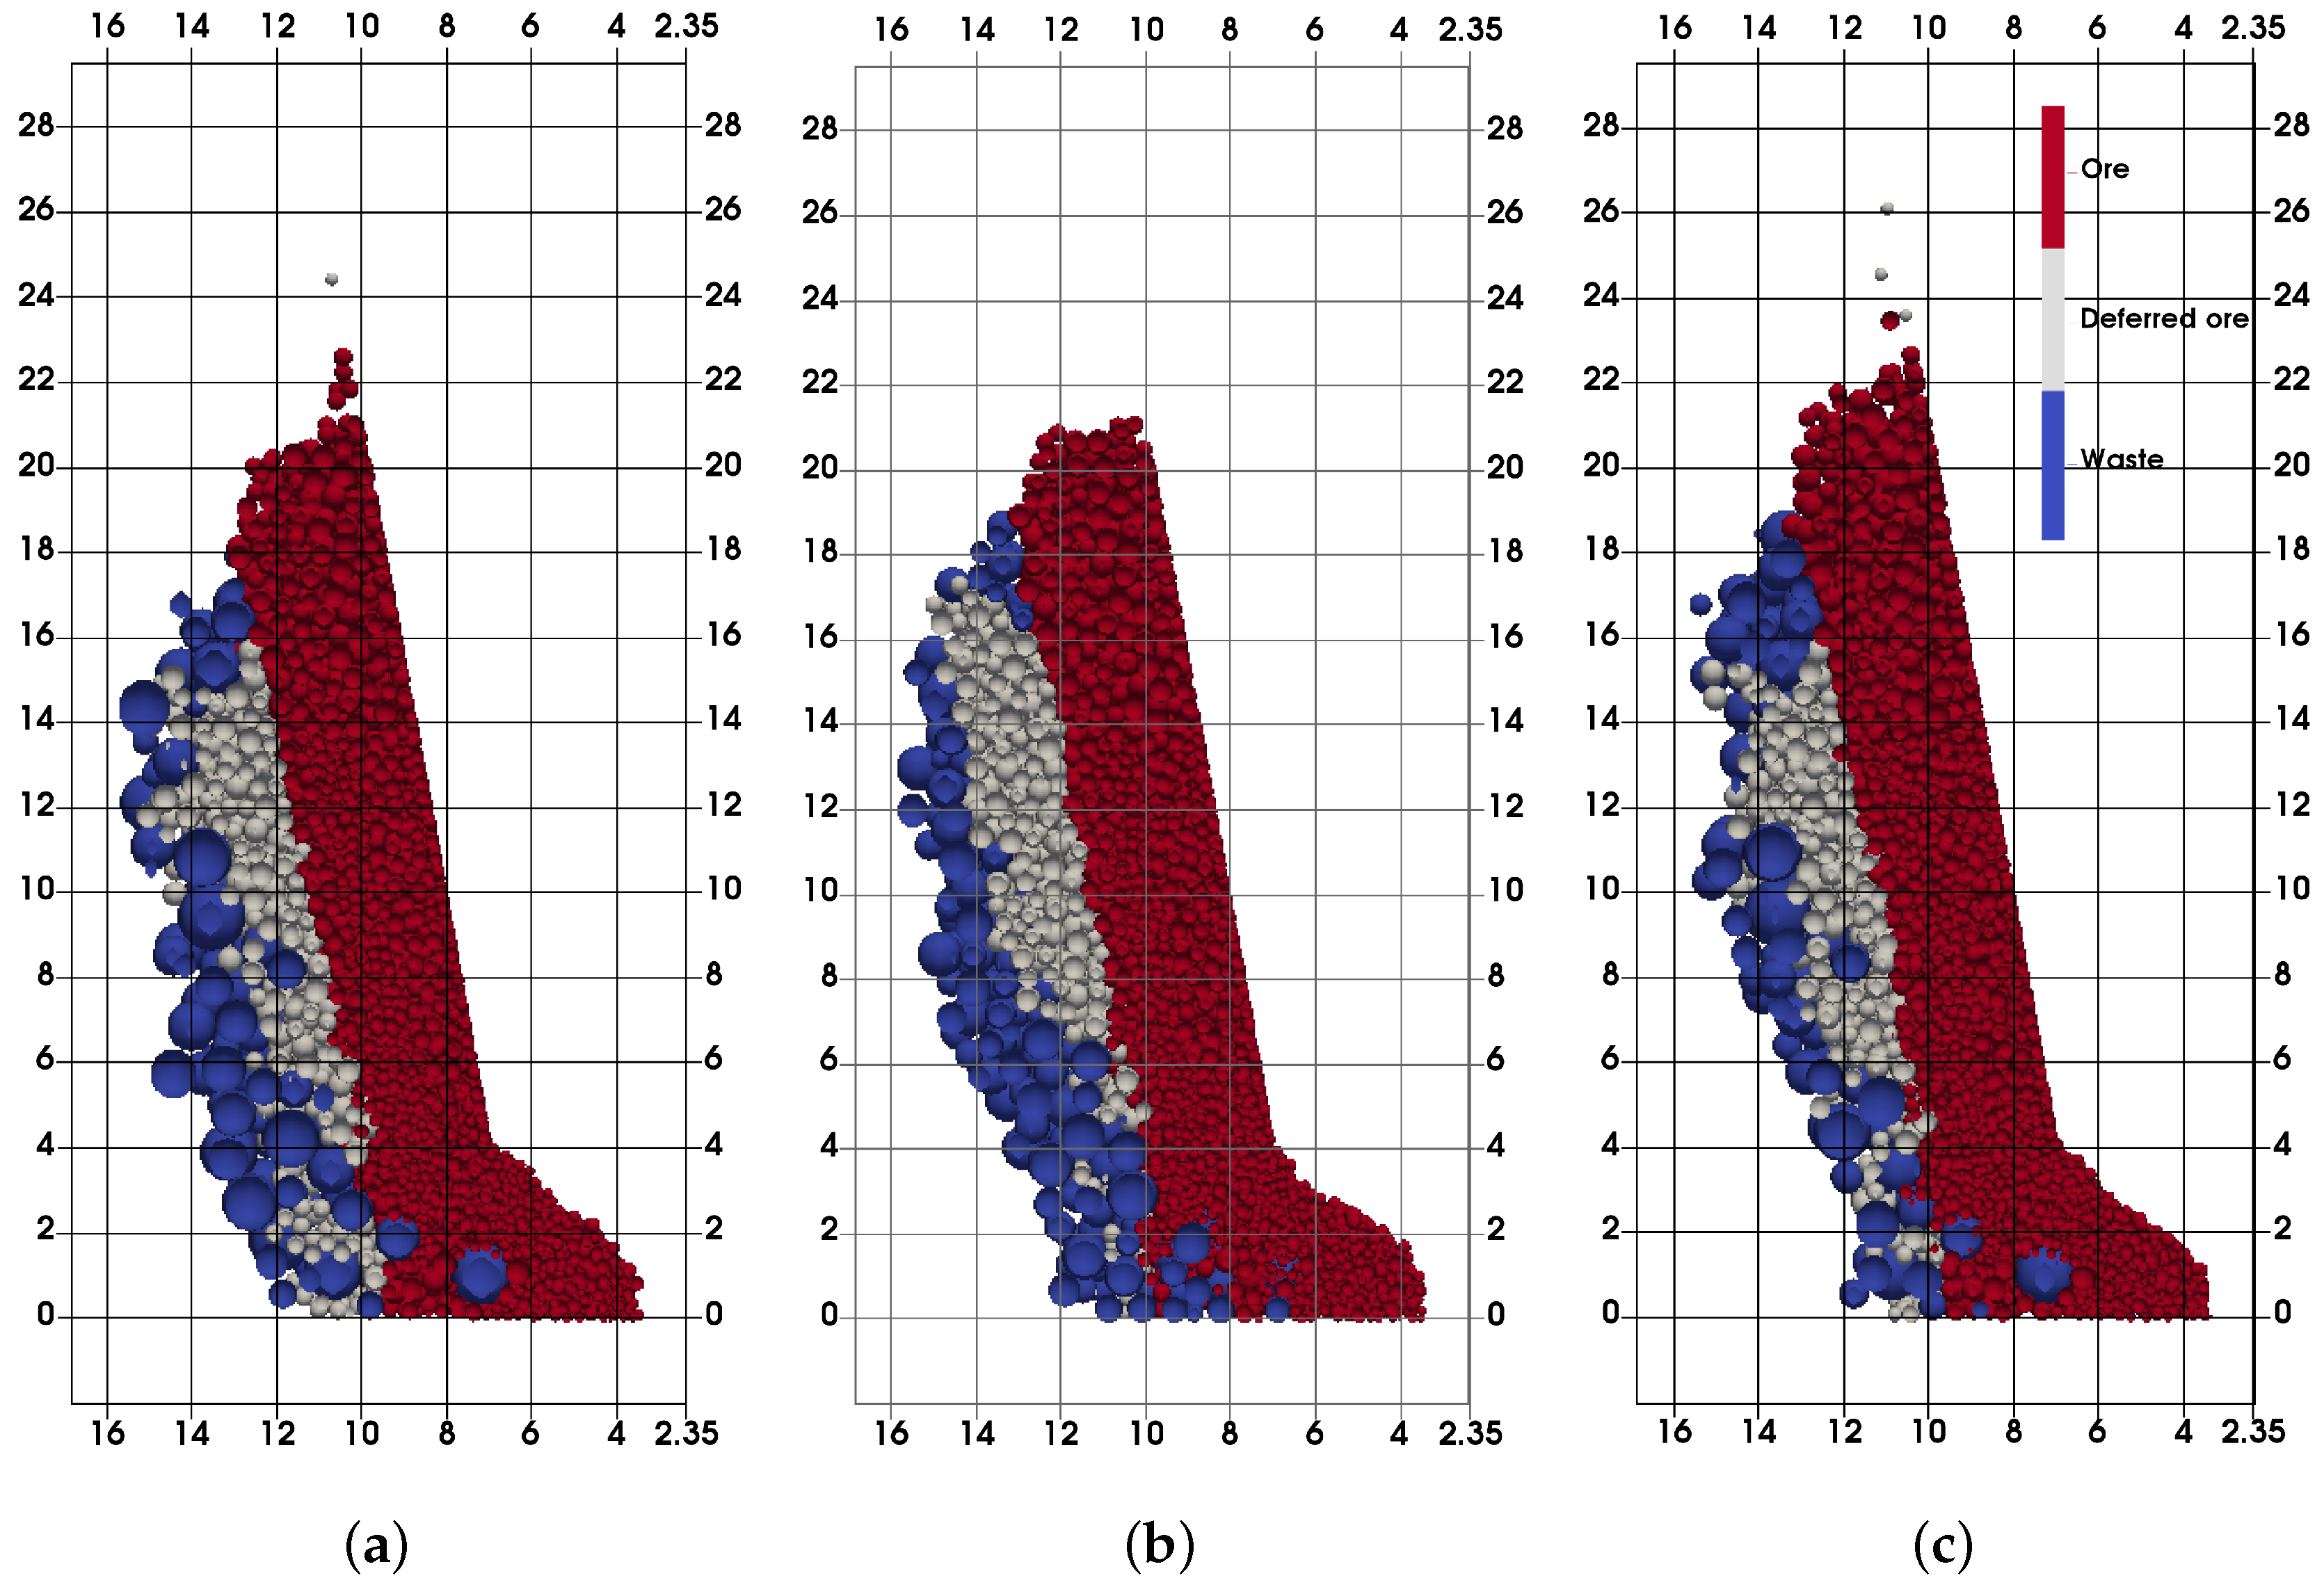
Figure 11 and Figure 12 illustrate the final extraction zones between finer and coarser waste for different friction values. In each of the presented cases, the waste inflow is greater with finer fragmentation. Coarser waste produces higher EZ, while finer waste produces deeper EZ. This undoubtedly illustrates the influence of the secondary fragmentation on the gravity flow formation. As a conclusion, it can be said that the decreasing fragmentation dominantly influences the increase of dilution; but this increase is dependent on the friction of the waste material, and dilution may remain the same on some occasions, as Figure 10c suggests. Depending on the real change of the fragmentation, the production plan could be adjusted to the expected metal grade for each sublevel or set of sublevels, resulting in optimal production costs.
3.4. Mutual Change of Fragmentation and Friction in Waste Material and Its Influence on Ore Dilution and Recovery
It is possible to distinguish between two major starting points regarding the initial state of the rock block surfaces. At the beginning, the caving friction of the caved mass may be higher or lower than the basic friction angle for that rock type. With the increasing movement, the caved mass friction angle becomes closer to the basic friction angle due to smoothing of the surfaces of the rock fragments. This process is followed by the additional fragmentation, and inevitably, rock fragments become smaller. The friction decrease is not a linear process, while some surfaces are smoother, and fragmentation forms new surfaces that may be slightly rougher, leading to constant fluctuations of friction. However, the general trend remains.
Those two processes were analyzed separately in Section 3.2 and Section 3.3. Herein, the mutual change of those parameters is analyzed. Previously discussed situations are considered, where the caved mass friction angle is equal to the basic friction angle ( = 30°) in the final stage, and the size of the fragments is finer than in the beginning stage. Two starting conditions are considered, each with a coarser size of the caved fragments and with a friction angle higher ( = 35°) and lower ( = 25°) than the basic friction angle. Figure 13 illustrates the results, showing the mutual influence of the friction and the size change in caved waste.
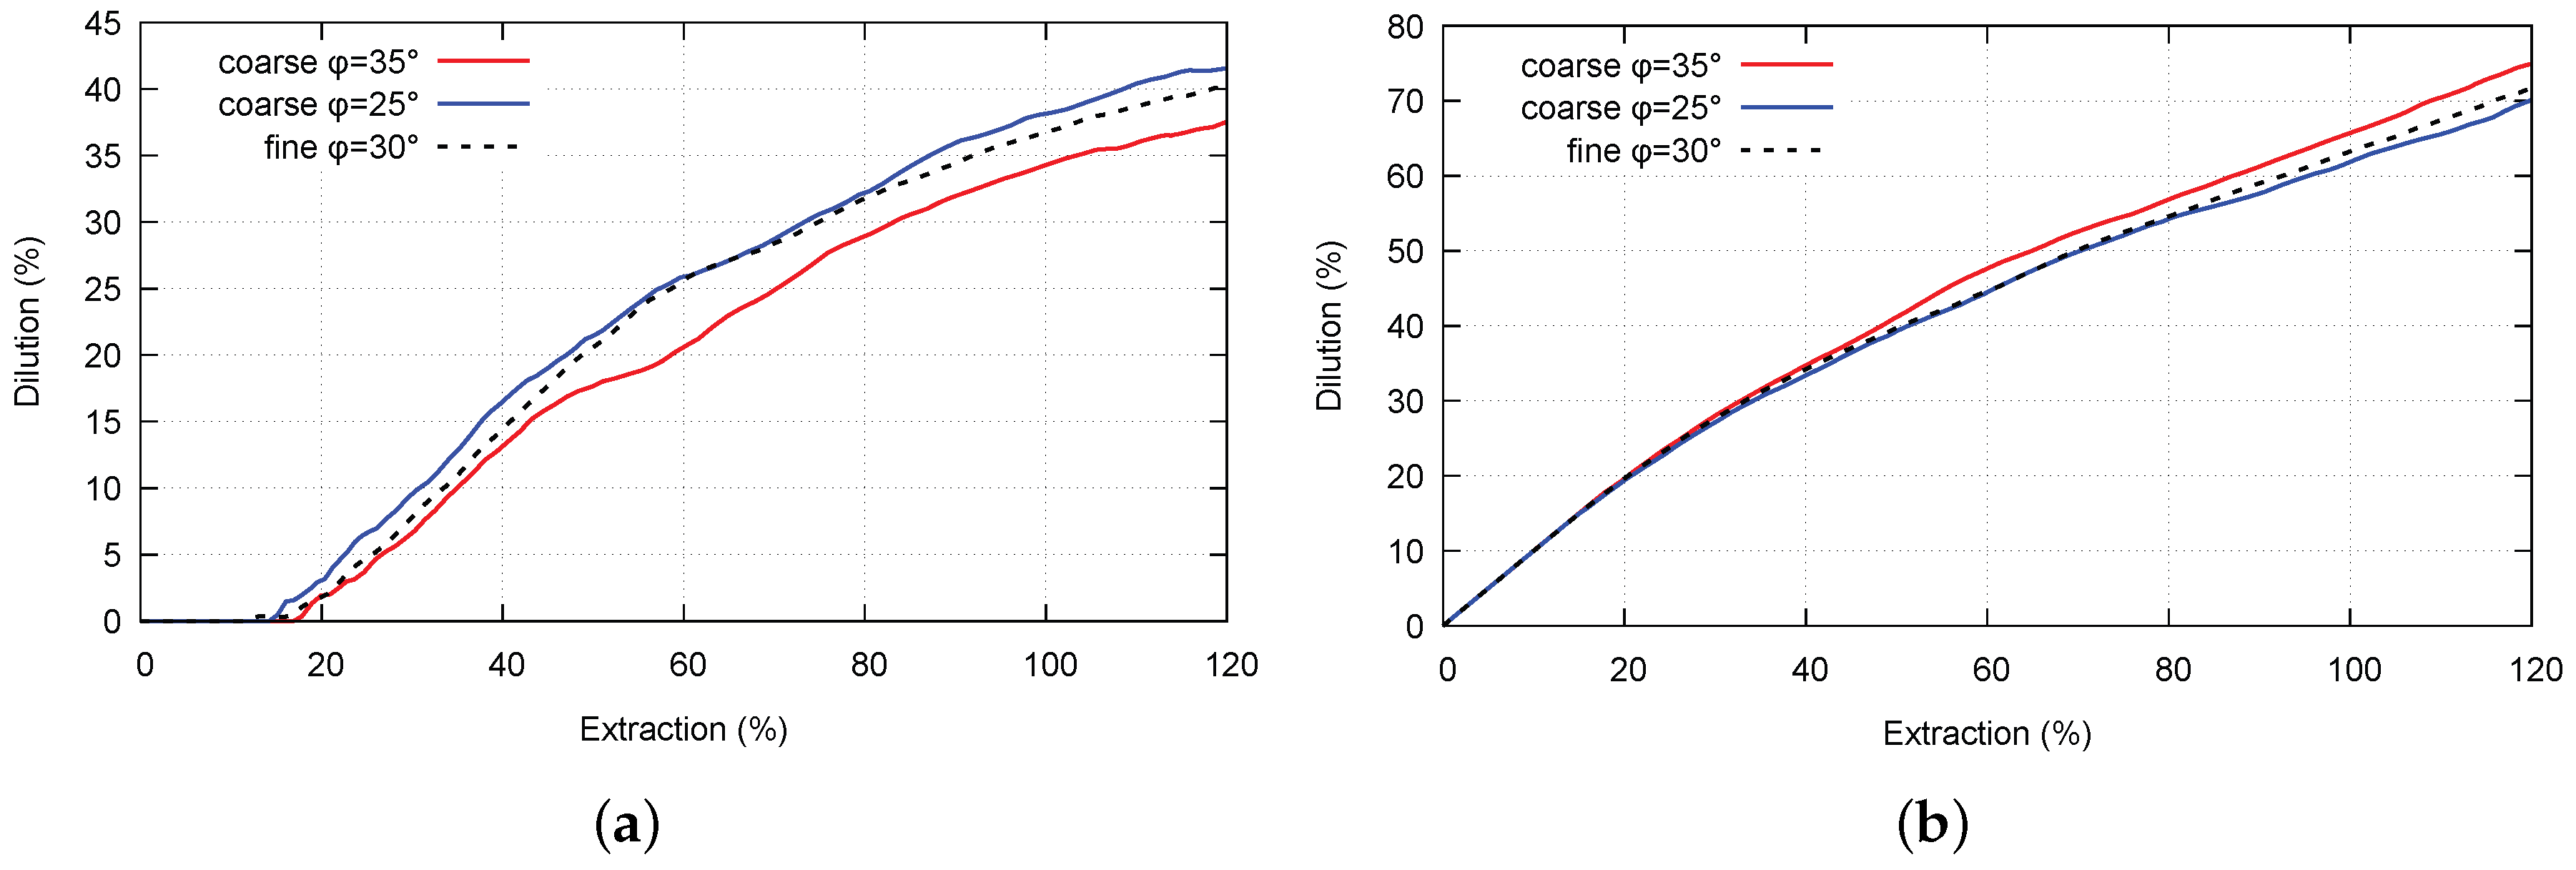
Decreasing friction and fragmentation produce higher dilution, both separately and mutually, as was expected and as is shown in Figure 13a. On the other side, increasing friction with decreasing fragmentation produces lower dilution. This drop of dilution is smaller than its increase in the previous case, since the analyzed changes have the opposite influences here. At the point when the basic friction is reached, fragmentation becomes the most influential parameter, since its change will produce further dilution increase.
Figure 14 illustrates the final extraction zones for two possible situations. Figure 14b presents the extraction zone for the final stage where the friction angle is equal to the basic friction angle, and fragmentation is finer compared with the initial state. In the case with higher initial friction (Figure 14c), it is clear that the extraction zone in the final stage will be shorter and deeper, which corresponds with the previous findings and increased dilution. However, if lower initial friction is considered, there is a slight change in extraction zone shape and size, but undoubtedly, there is a dilution decrease that depends on actual friction and fragmentation. Two paths may be defined as the conclusion: (1) in the initial state, fragmentation is coarser, and friction is higher; and in this case, both changes will influence the increase of dilution until the end of production; (2) in the initial state, fragmentation is coarser, and friction is lower than the basic friction angle; and at first, dilution will be decreased due to the friction increase, but after reaching this limit, dilution will continue to increase, since from here, only fragmentation is changed.
4. Discussion
Cave mining methods such as block and sublevel caving have several common points regarding the behavior of the caved mass. During production, caved rock mass fragmentation becomes finer, and rock fragments become smoother. Finer fragmentation results in less resistant gravity flow, since finer fragments move much more easily. In parallel with this process, the friction angle of the surfaces of rock fragments comes closer to the basic friction angle for that rock type. In block caving, the gravity flow of broken rock is formed along the height of the extraction block, while in sublevel caving, it is formed between each of the two sublevels. However, in sublevel caving, caved rock mass will travel the complete height between the top-most and bottom sublevels, but only in discrete steps between each of the sublevels. Therefore, this rock mass will go through both changes during the production period. Since sublevel caving is a more flexible mining method than block caving, by identifying the influence of these changes, we could control the outcome, especially the dilution of the ore. That was the main aim of this paper, to analyze the influence of each of these changes by themselves, as well as the influence of their mutual change.
Two possible starting conditions are identified regarding the friction of the caved rock mass. First, where the friction of the caved mass is greater than the basic friction angle of caved rock. This assumes that there is a small number of preexisting joints with high alteration, low roughness and with clay content, and therefore, the surfaces of caved rock fragments are mainly formed by tensile failure. The described situation results in higher friction of the fragment surfaces. During the caving process, fragment surfaces will become smoother, and their friction angle will be decreased and eventually will come close to the basic friction angle.
Another possibility is that the initial state of the rock mass is dominantly determined by the high number of preexisting joints that are highly altered and possibly have a high amount of low strength infill, such as clay. In this case, the friction angle of fragment surfaces is lower than the basic friction angle. In this case, during the caving process, the friction angle will be increased, and after a certain time (distance traveled), it will come close to the basic friction angle.
The influence of the friction angle change is presented in Section 3.2, and from there, it is obvious that the drop of the friction angle will result in lower resistance in the caved mass, which results in higher dilution of the ore.
Fragmentation change is the second inevitable process that occurs in caved waste mass. Since caved mass travels between each of the two sublevels, its fragmentation becomes finer with each deeper sublevel. In Section 3.3, it was shown that finer waste will result in higher dilution of the blasted ore. The results were presented for three different friction angle values where finer and coarser waste was considered. It is obvious that finer fragmentation induces more dilution, but differences between dilution quantities for different friction values are not the same. This leads to the conclusion that there is a correlation between actual fragmentation and the friction angle of waste mass. This correlation is not examined in this research.
However, the changes of fragmentation and friction in caved waste occur simultaneously. Rock fragments become finer with each deeper sublevel, and the friction angle may at the beginning decrease or increase, but at one point of time, it will come close to the basic friction angle and remain at this value. In the case when the friction angle is higher than the basic friction angle, decreasing friction and fragmentation will result in increasing ore dilution. If lower initial friction is considered, increasing friction and decreasing fragmentation will result in some reduction in ore dilution as friction comes closer to the basic friction value. However, after this point is reached, fragmentation may become even finer, and further increase of dilution may be expected.
5. Conclusions
The changeability of fragmentation and the friction of caved mass in sublevel caving was simulated using the discrete element method. Several models were set up to analyze the change of each property separately, and according to the results, the mutual change of fragmentation and friction was analyzed. The trend of decreasing friction in caved waste, with temporal fluctuations, undoubtedly produces higher metal grade dilution. This increase occurs until the basic friction of caved mass is reached, and after this, fragmentation becomes the main influential factor. Faster migration of finer particles will produce greater inflow of waste in loaded ore mass and increase dilution accordingly. However, the results showed that this may not be the case every time, since dilution curves for finer and coarser waste with = 30° are almost identical. This implies a relation between friction and fragmentation, which has to be examined in detail. The mutual drop of friction and fragmentation will influence higher dilution, as in the case of the separate influence of these factors. Friction increase with the drop of fragmentation showed lower dilution, since the parameter changes here have opposite influences. Having in mind these changes in the stages of mine design, production plans can be adjusted for expected dilution variations, and therefore, overall cost, energy consumptions and machinery utilization control can be established.
Author Contributions
Veljko Lapčević and Slavko Torbica have created the concept of the research, developed the models and performed the interpretation of the results.
Conflicts of Interest
The authors declare no conflict of interest.
References
- Atlas Copco. Mining Methods in Underground Mining; Atlas Copco: Nacka, Sweden, 2007. [Google Scholar]
- Janelid, I. Sublevel caving: How to use it; what are advantages, problems. World Min. 1968, 21, 76–78. [Google Scholar] [CrossRef]
- Kvapil, R. The mechanics and design of sublevel caving systems. In Underground Mining Methods Handbook; Society of Mining Engineers of AIME: New York, NY, USA, 1982; pp. 880–897. [Google Scholar]
- Stazhevskii, S. Features of flow of broken rock in extraction of ores with sublevel caving. J. Min. Sci. 1996, 32, 403–416. [Google Scholar] [CrossRef]
- DeGagne, D. The Influence of Blasting Fragmentation on Ore Recovery in Sublevel Cave Mines. In Proceedings of the 40th US Symposium on Rock Mechanics (USRMS), Anchorage, AK, USA, 25–29 June 2005; American Rock Mechanics Association: Alexandria, VA, USA, 2005. [Google Scholar]
- Minchinton, A.; Dare-Bryan, P. The application of computer modelling for blasting and flow in sublevel caving operations. In Proceedings of the 9th AusIMM Underground Operators’ Conference, Perth, Australia, 7–9 March 2005; pp. 65–73. [Google Scholar]
- Kosowan, M.I. Design and Operational Issues for Increasing Sublevel Cave Intervals at Stobie Mine; Laurentian University: Sudbury, ON, Canada, 2001. [Google Scholar]
- Power, G. Full scale SLC draw trials at Ridgeway gold mine. In Proceedings of the MassMin, Santiago, Chile, 22–25 August 2004; pp. 225–230. [Google Scholar]
- Zhang, G. Behaviour of caved ore mass in sublevel caving and its effect on ore dilution. In Proceedings of the 4th International Conference & Exhibition on Mass Mining, Santiago, Chile, 22–25 August 2004; pp. 238–242. [Google Scholar]
- Brunton, I.; Fraser, S.; Hodgkinson, J.; Stewart, P. Parameters influencing full scale sublevel caving material recovery at the Ridgeway gold mine. Int. J. Rock Mech. Min. Sci. 2010, 47, 647–656. [Google Scholar] [CrossRef]
- Zhang, Z. Effect of double-primer placement on rock fracture and ore recovery. Int. J. Rock Mech. Min. Sci. 2014, 71, 208–216. [Google Scholar] [CrossRef]
- Kvapil, R. Gravity flow of granular materials in Hoppers and bins in mines—II. Coarse material. Int. J. Rock Mech. Min. Sci. Geomech. Abstr. 1965, 2, 277–292. [Google Scholar] [CrossRef]
- Gustafsson, P. Waste rock content variations during gravity flow in sublevel caving: Analysis of full-scale experiments and numerical simulations. Ph.D. Thesis, Luleå University of Technology, Luleå, Sweden, 1998. [Google Scholar]
- Chen, G. Stochastic modeling of rock fragment flow under gravity. Int. J. Rock Mech. Min. Sci. 1997, 34, 323–331. [Google Scholar] [CrossRef]
- Alfaro, M.; Saavedra, J. Predictive models for gravitational flow. In Proceedings of the MassMin 2004, Santiago, Chile, 22–25 August 2004; pp. 179–184. [Google Scholar]
- Castro, R.; Gonzalez, F.; Arancibia, E. Development of a gravity flow numerical model for the evaluation of drawpoint spacing for block/panel caving. J. S. Afr. Inst. Min. Metall. 2009, 109, 393–400. [Google Scholar]
- Janelid, I.; Kvapil, R. Sublevel caving. Int. J. Rock Mech. Min. Sci. Geomech. Abstr. 1966, 3, 129–132. [Google Scholar] [CrossRef]
- Janelid, I. Study of the gravity flow process in sublevel caving. In Proceedings of the International Sublevel Caving Symposium, Stockholm, Sweden, 25–27 September 1972; Atlas Copco: Stockholm, Sweden, 1972. [Google Scholar]
- Rustan, A. Gravity flow of broken rock What is known and unknown. In Proceedings of the MassMin 2000, Brisbane, Australia, 29 October–2 November 2000. [Google Scholar]
- Power, G.R. Modelling Granular Flow in Caving Mines: Large Scale Physical Modelling and Full Scale Experiments; University of Queensland: Brisbane, Australia, 2004. [Google Scholar]
- Wimmer, M.; Ouchterlony, F.; Moser, P.; Nordqvist, A.; Lenz, G. Referenced 3D images from inside cavities and behind rings in sublevel caving. In Proceedings of the Fragblast 9 Conference—Rock Fragmentation by Blasting, Granada, Spain, 13–17 September 2009; CRC Press: Boca Raton, FL, USA, 2009. [Google Scholar]
- Brunton, I. The Impact of Blasting on Sublevel Caving Flow Behaviour And Recovery. Ph.D. Thesis, University of Queensland, Brisbane, Australia, 2009. [Google Scholar]
- Tao, G.Q.; Ren, Q.Y.; Luo, H.; Liu, Z.D. Stability analysis of stope in pillarless sublevel caving. Rock Soil Mech. 2011, 32, 3768–3772. [Google Scholar]
- Chang-jun, F. Application of combined shrinkage stoping and pillarless sublevel caving mining method to a uranium deposit. Uranium Min. Metall. 2012, 31, 19–21. [Google Scholar]
- Milić, V.; Svrkota, I.; Petrović, D.; Đukanović, D. Research results on application of semi-level induced caving with lateral loading in ore body Borska Reka. Podzemn. Rad. 2014, 22, 1–9. [Google Scholar] [CrossRef]
- Clout, J. The continuation of full scale sublevel caving experiments—Cadia Valley operation–underground (Ridgeway gold mine). Eng. Proj. A 2004, 4, 41. [Google Scholar]
- Cundall, P.A.; Strack, O.D. A discrete numerical model for granular assemblies. Geotechnique 1979, 29, 47–65. [Google Scholar] [CrossRef]
- Van Baars, S. Discrete element modelling of granular materials. Heron 1996, 41, 139–157. [Google Scholar]
- Cleary, P.W.; Sawley, M.L. DEM modelling of industrial granular flows: 3D case studies and the effect of particle shape on hopper discharge. Appl. Math. Modell. 2002, 26, 89–111. [Google Scholar] [CrossRef]
- Irazábal, J.; Salazar, F.; Oñate, E. Numerical modelling of granular materials with spherical discrete particles and the bounded rolling friction model. Application to railway ballast. Comput. Geotech. 2017, 85, 220–229. [Google Scholar] [CrossRef]
- Gao, K.; Du, C.; Dong, J.; Zeng, Q. Influence of the Drum Position Parameters and the Ranging Arm Thickness on the Coal Loading Performance. Minerals 2015, 5, 723–736. [Google Scholar] [CrossRef]
- Pierce, M.; Cundall, P.; Van Hout, G.; Lorig, L. PFC3D modeling of caved rock under draw. In Proceedings of the 1st International PFC Symposium, Gelsenkirchen, Germany, 6–8 November 2002; pp. 211–217. [Google Scholar]
- Zhao, T.; Crosta, G.B.; Utili, S.; De Blasio, F.V. Investigation of rock fragmentation during rockfalls and rock avalanches via 3-D discrete element analyses. J. Geophys. Res. Earth Surf. 2017. [Google Scholar] [CrossRef]
- Wu, L.; Yang, F.; Wang, J.; Wang, G. 3D Discrete Element Model for TBM Cutter Breaking Rock and Dynamic Loads Analysis. In Proceedings of the 7th International Conference on Discrete Element Methods, Dalian, China, 1–4 August 2016; Springer: Berlin, Germany, 2017; pp. 927–934. [Google Scholar]
- Aboul Hosn, R.; Sibille, L.; Benahmed, N.; Chareyre, B. Discrete numerical modeling of loose soil with spherical particles and interparticle rolling friction. Granul. Matter 2017, 19, 1–12. [Google Scholar] [CrossRef]
- Bonilla-Sierra, V.; Elmouttie, M.; Donzé, F.V.; Scholtès, L. Composite wedge failure using photogrammetric measurements and DFN-DEM modelling. J. Rock Mech. Geotech. Eng. 2017, 9, 41–53. [Google Scholar] [CrossRef]
- Hustrulid, A.I. A Computational Methodology for Modeling Large Scale Sublevel Caving with a Three-Dimensional Discrete Element Method. Ph.D. Thesis, Colorado School of Mines, Golden, CO, USA, 2016. [Google Scholar]
- Selldén, H.; Pierce, M. PFC3D modelling of flow behaviour in sublevel caving. In Proceedings of the MassMin 2004, Santiago, Chile, 22–25 August 2004; pp. 22–25. [Google Scholar]
- DeGagne, D.; McKinnon, S. The influence of cave mass properties on discrete sublevel cave models. In Proceedings of the Golden Rocks 2006, The 41st US Symposium on Rock Mechanics (USRMS), Golden, CO, USA, 17–21 June 2006. [Google Scholar]
- Bobadilla, J.R.J.; Junior, E.D.A.V.; de Figueiredo, R.P. Uma Modelagem Computacional do Método de Sublevel Caving com Elementos Discretos. Procceedings of the Mecánica das Rochas para Recursos Naturais e Infraestrutura SBMR 2014—Conferéncia Especializada ISRM, Goiania, Brazil, 9–13 September 2014. [Google Scholar]
- Laubscher, D. Cave mining—The state of the art. J. S. Afr. Inst. Mini. Metall. 1994, 94, 279–293. [Google Scholar]
- Dorador, L.; Eberhardt, E.; Elmo, D.; Aguayo, A. Influence of secondary fragmentation and column height on block size distribution and fines migration reaching drawpoints. In Proceedings of the 3rd International Symposium on Block and Sublevel Caving, Santiago, Chile, 5–6 June 2014. [Google Scholar]
- Pierce, M.E. A Model for Gravity Flow of Fragmented Rock in Block Caving Mines; University of Queensland: Brisbane, Australia, 2010. [Google Scholar]
- Coulson, J.H. Shear strength of flat surfaces in rock. In Stability of Rock Slopes; ASCE: Reston, VA, USA, 1972; pp. 77–105. [Google Scholar]
- Barton, N. Review of a new shear-strength criterion for rock joints. Eng. Geol. 1973, 7, 287–332. [Google Scholar] [CrossRef]
- Bandis, S.; Lumsden, A.; Barton, N. Experimental studies of scale effects on the shear behaviour of rock joints. Int. J. Rock Mech. Min. Sci. Geomech. Abstr. 1981, 18, 1–21. [Google Scholar] [CrossRef]
- Palmström, A.; Sharma, V.; Saxena, K. In-Situ Characterization of Rocks; A A Balkema Publishers: Rotterdam, The Netherlands, 2001; pp. 1–40. [Google Scholar]
- Šmilauer, V.; Catalano, E.; Chareyre, B.; Dorofeenko, S.; Duriez, J.; Dyck, N.; Elias, J.; Er, B.; Eulitz, A.; Gladky, A.; et al. Yade Documentation, 2nd ed. The Yade Project. 2015. Available online: http://yade-dem.org/doc/ (accessed on 1 July 2016).
- Thoeni, K.; Giacomini, A.; Lambert, C.; Sloan, S.W.; Carter, J.P. A 3D discrete element modelling approach for rockfall analysis with drapery systems. Int. J. Rock Mech. Min. Sci. 2014, 68, 107–119. [Google Scholar] [CrossRef]
- Bonilla-Sierra, V.; Scholtes, L.; Donzé, F.; Elmouttie, M. Rock slope stability analysis using photogrammetric data and DFN–DEM modelling. Acta Geotech. 2015, 10, 497–511. [Google Scholar] [CrossRef]
- Duriez, J.; Darve, F.; Donze, F.V. A discrete modeling-based constitutive relation for infilled rock joints. Int. J. Rock Mech. Min. Sci. 2011, 48, 458–468. [Google Scholar] [CrossRef]
- Donzé, F.V.; Bernasconi, P. Simulation of the blasting patterns in shaft sinking using a discrete element method. Electron. J. Geotech. Eng. 2004, 9, 1–44. [Google Scholar]
- Henderson, A. The ParaView Guide: A Parallel Visualization Application; Kitware: Clifton Park, NY, USA, 2004; p. 340. [Google Scholar]
- Williams, T.; Kelley, C.; Bröker, H.; Campbell, J.; Cunningham, R.; Denholm, D.; Elber, G.; Fearick, R.; Grammes, C.; Hart, L.; et al. Gnuplot 4.4: An Interactive Plotting Program. Available online: http://gnuplot.sourceforge.net/ (accessed on 1 July 2016).
- Pfc3d Theory and Background Manual, version 4.0; Itasca Consulting Group: Minneapolis, MN, USA, 2008.
- Bridgwater, J.; Cooke, M.; Scott, A. Interparticle percolation: Equipment development and mean percolation velocities. Trans. Inst. Chem. Eng. 1978, 56, 157–167. [Google Scholar]
Figure 1.
Sublevel caving method layout [1].
Figure 1.
Sublevel caving method layout [1].

Figure 2.
Schematic illustration of the spatial size and friction change in caved waste material.

Figure 3.
Initial DEM model setup.

Figure 4.
Ore fragment size distribution.

Figure 5.
(a) Final state of initial model. (b) Initial state for the representative model.

Figure 6.
Results showing the influence of the friction change in caved waste. (a) Ore dilution; (b) metal dilution; (c) overall ore recovery; (d) ring recovery; (e) deferred ore recovery.
Figure 6.
Results showing the influence of the friction change in caved waste. (a) Ore dilution; (b) metal dilution; (c) overall ore recovery; (d) ring recovery; (e) deferred ore recovery.

Figure 7.
Extraction zone comparison regarding the friction change in caved waste (Extraction = 30%–60%). (a) Extr. = 30%, = 35°; (b) Extr. = 30%, = 30°; (c) Extr. = 30%, = 25°; (d) Extr. = 60%, = 35°; (e) Extr. = 60%, = 30°; (f) Extr. = 60%, = 25°.
Figure 7.
Extraction zone comparison regarding the friction change in caved waste (Extraction = 30%–60%). (a) Extr. = 30%, = 35°; (b) Extr. = 30%, = 30°; (c) Extr. = 30%, = 25°; (d) Extr. = 60%, = 35°; (e) Extr. = 60%, = 30°; (f) Extr. = 60%, = 25°.

Figure 8.
Extraction zone comparison regarding the friction change in caved waste (Extraction = 90%–120%). (a) Extr. = 90%, = 35°; (b) Extr. = 90%, = 30°; (c) Extr. = 90%, = 25°; (d) Extr. = 120%, = 35°; (e) Extr. = 120%, = 30°; (f) Extr. = 120%, = 25°.
Figure 8.
Extraction zone comparison regarding the friction change in caved waste (Extraction = 90%–120%). (a) Extr. = 90%, = 35°; (b) Extr. = 90%, = 30°; (c) Extr. = 90%, = 25°; (d) Extr. = 120%, = 35°; (e) Extr. = 120%, = 30°; (f) Extr. = 120%, = 25°.
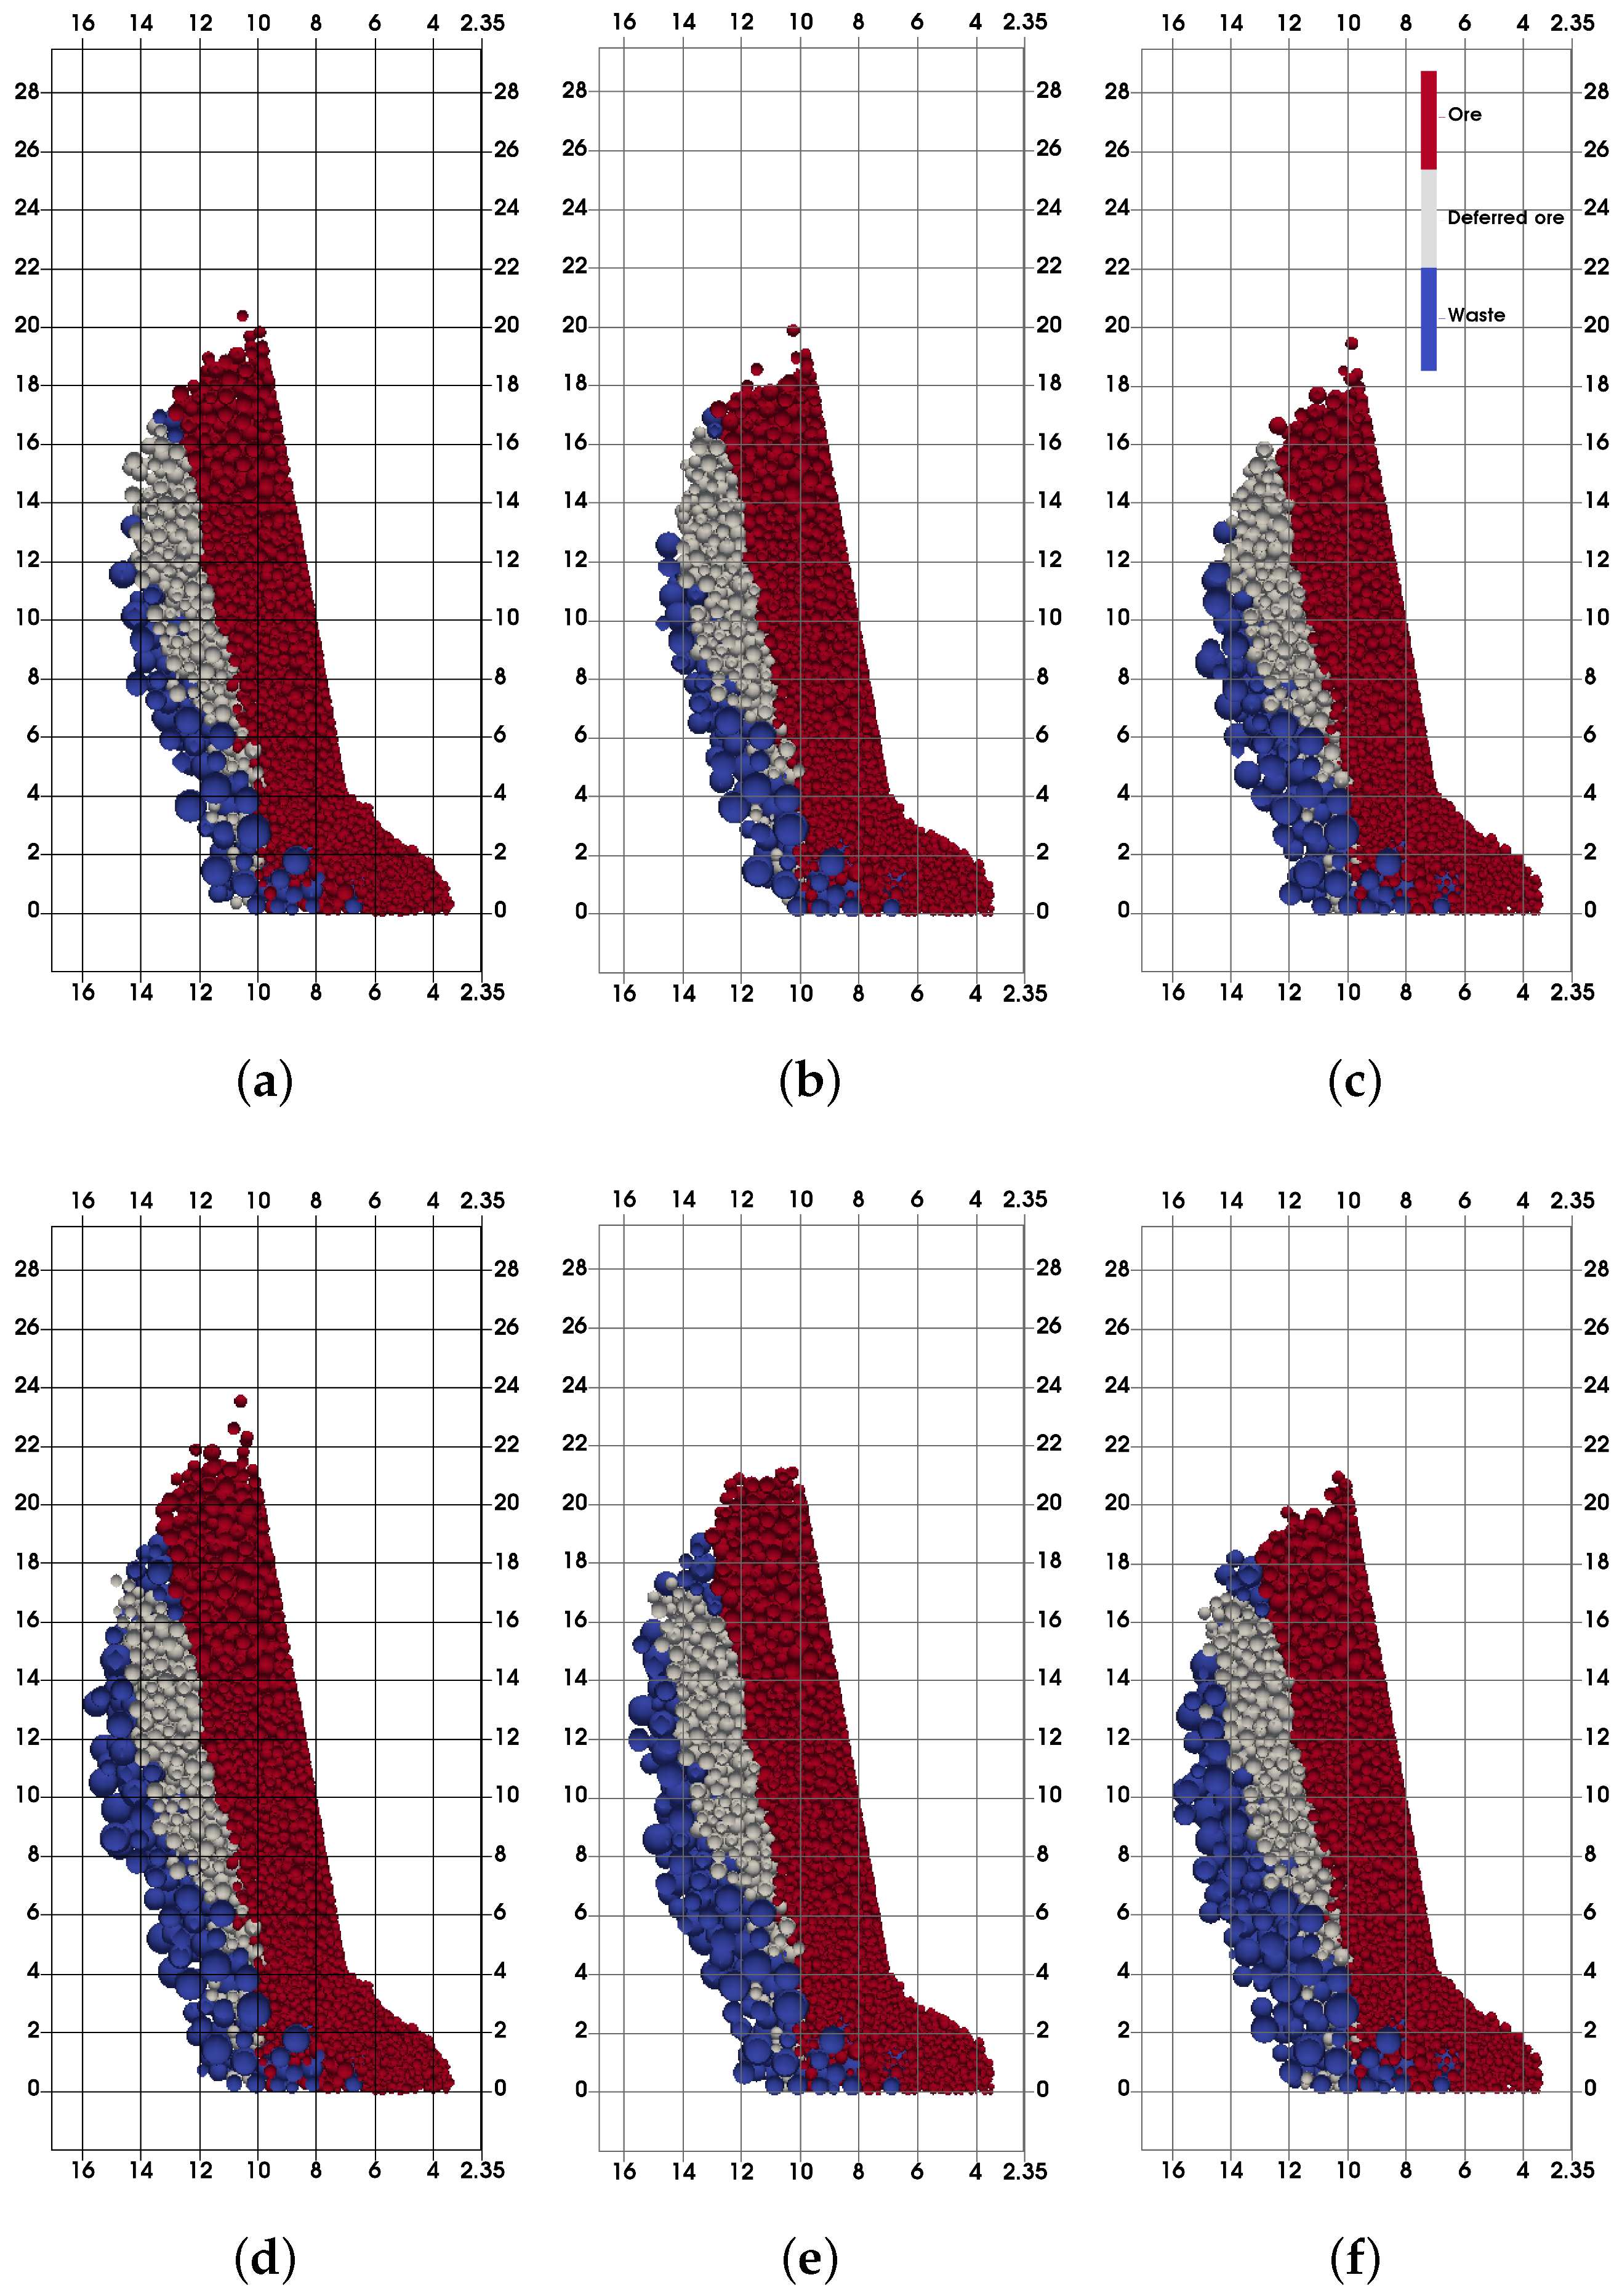
Figure 9.
Waste material particle size distribution. (a) Coarser waste. (b) Finer waste.

Figure 10.
Influence of the fragmentation change in caved waste on ore dilution. (a) Ore dilution, = 25°; (b) ore recovery, = 25°; (c) ore dilution, = 30°; (d) ore recovery, = 30°; (e) ore dilution, = 35°; (f) ore recovery, = 35°.
Figure 10.
Influence of the fragmentation change in caved waste on ore dilution. (a) Ore dilution, = 25°; (b) ore recovery, = 25°; (c) ore dilution, = 30°; (d) ore recovery, = 30°; (e) ore dilution, = 35°; (f) ore recovery, = 35°.

Figure 11.
Extraction zone comparison between coarser and finer waste ( = 25°, 30°). (a) Coarser, = 25°; (b) finer, = 25°; (c) coarser, = 30°; (d) finer, = 30°.
Figure 11.
Extraction zone comparison between coarser and finer waste ( = 25°, 30°). (a) Coarser, = 25°; (b) finer, = 25°; (c) coarser, = 30°; (d) finer, = 30°.
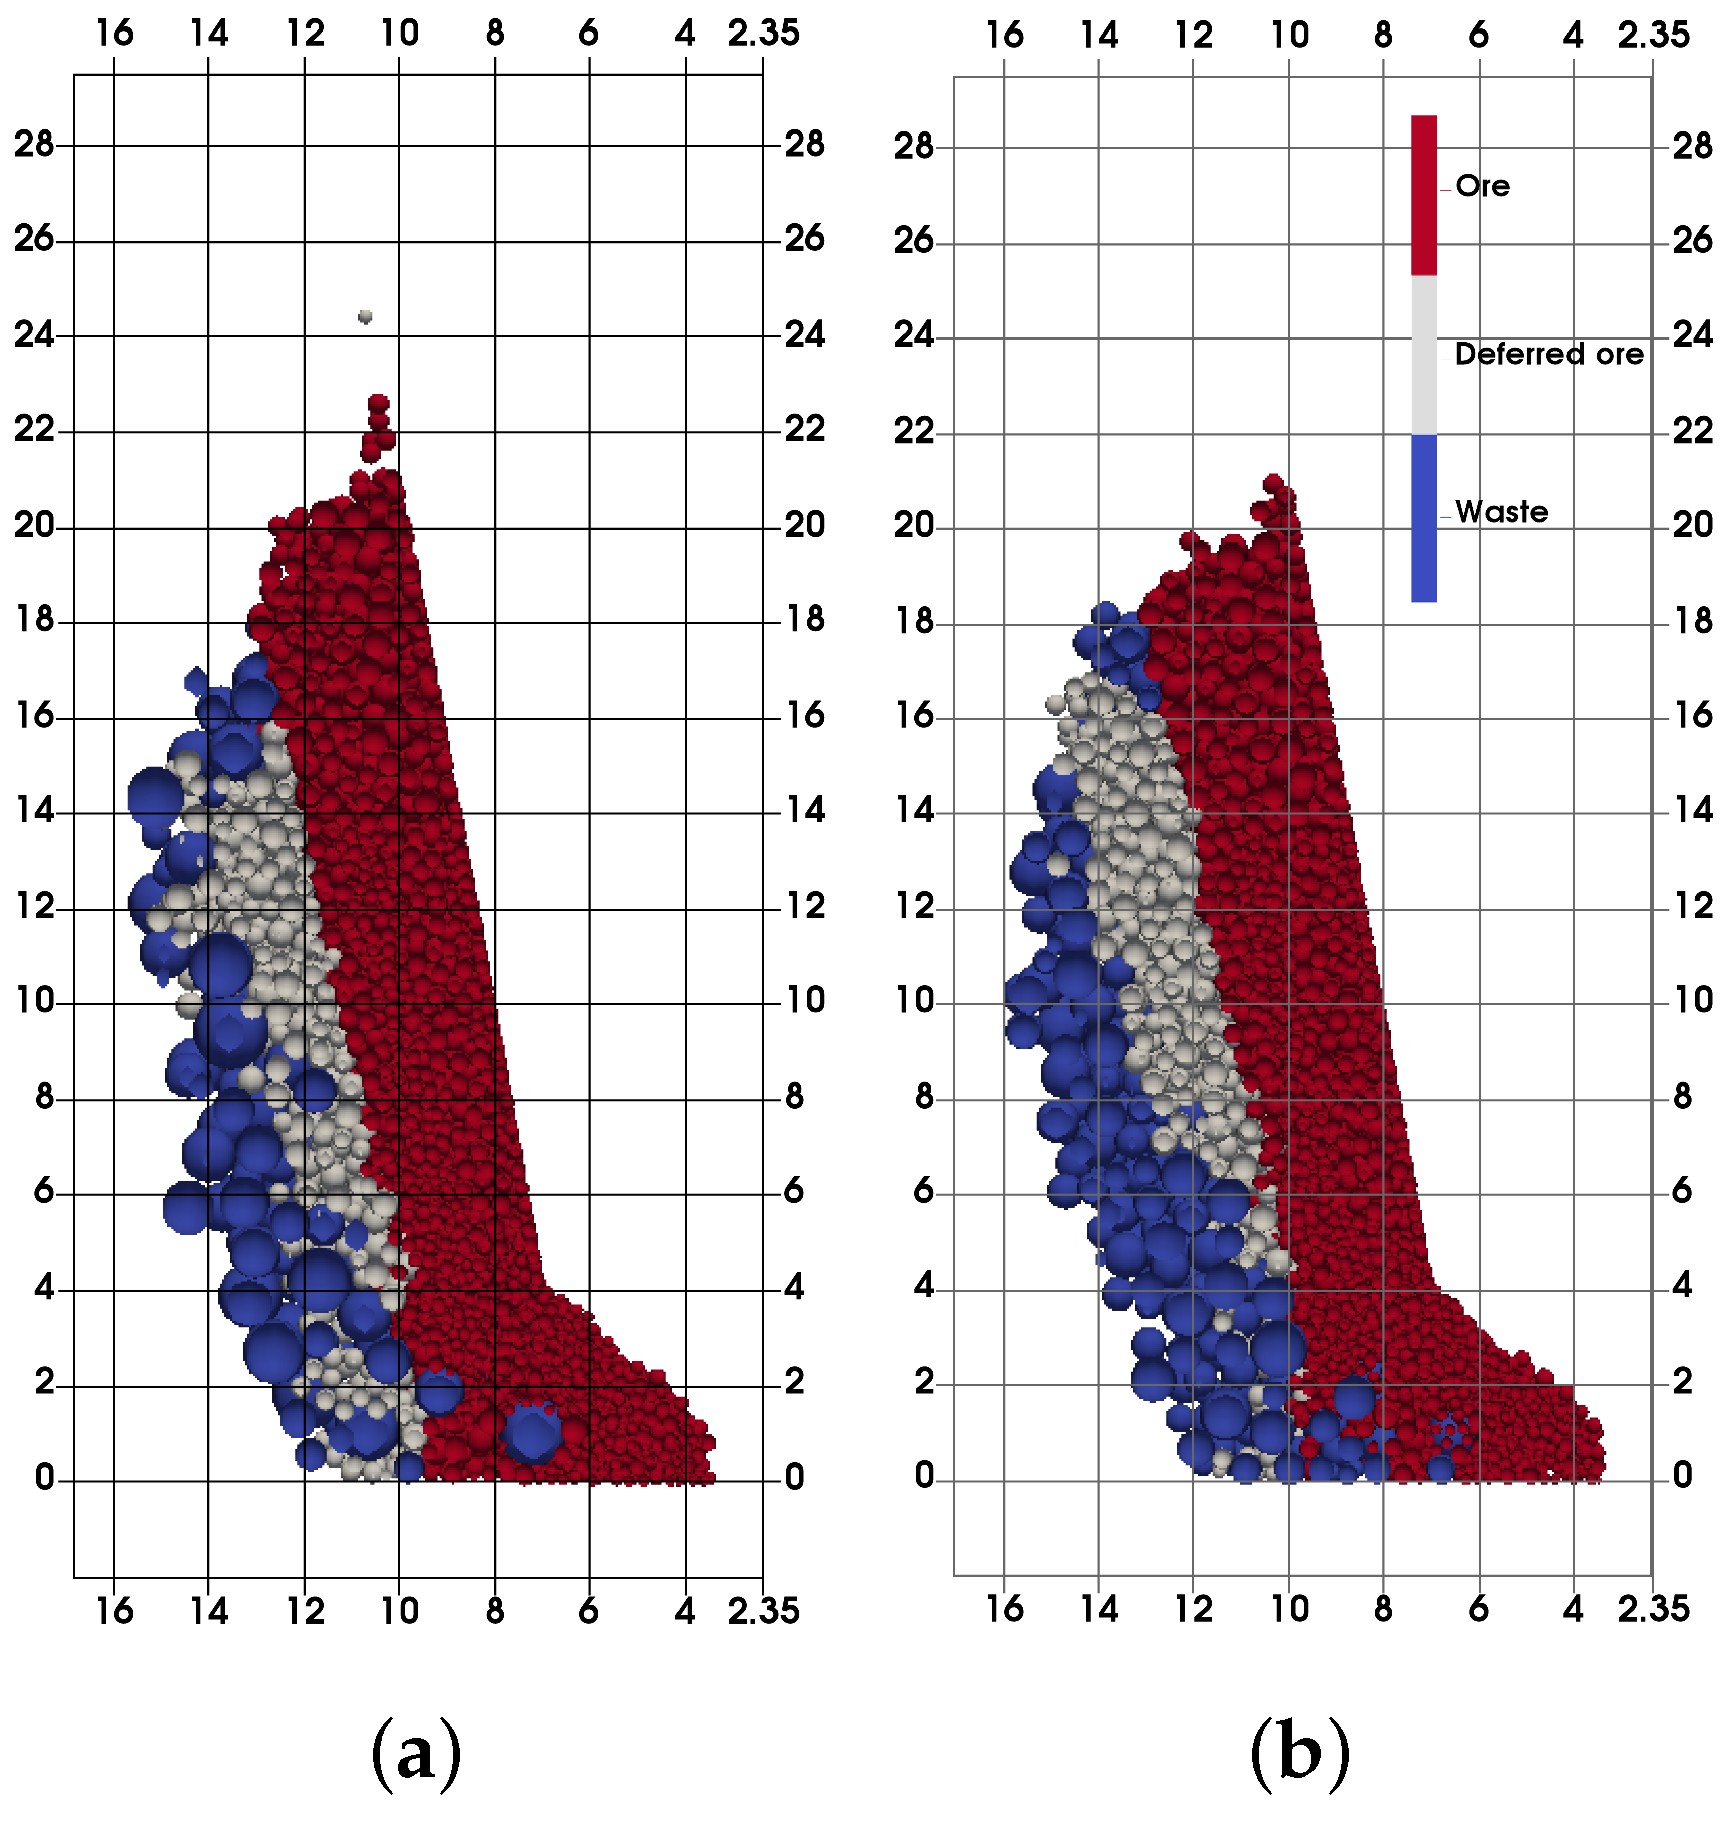

Figure 12.
Extraction zone comparison between coarser and finer waste ( = 35°). (a) Coarser, = 35°; (b) finer, = 35°.
Figure 12.
Extraction zone comparison between coarser and finer waste ( = 35°). (a) Coarser, = 35°; (b) finer, = 35°.
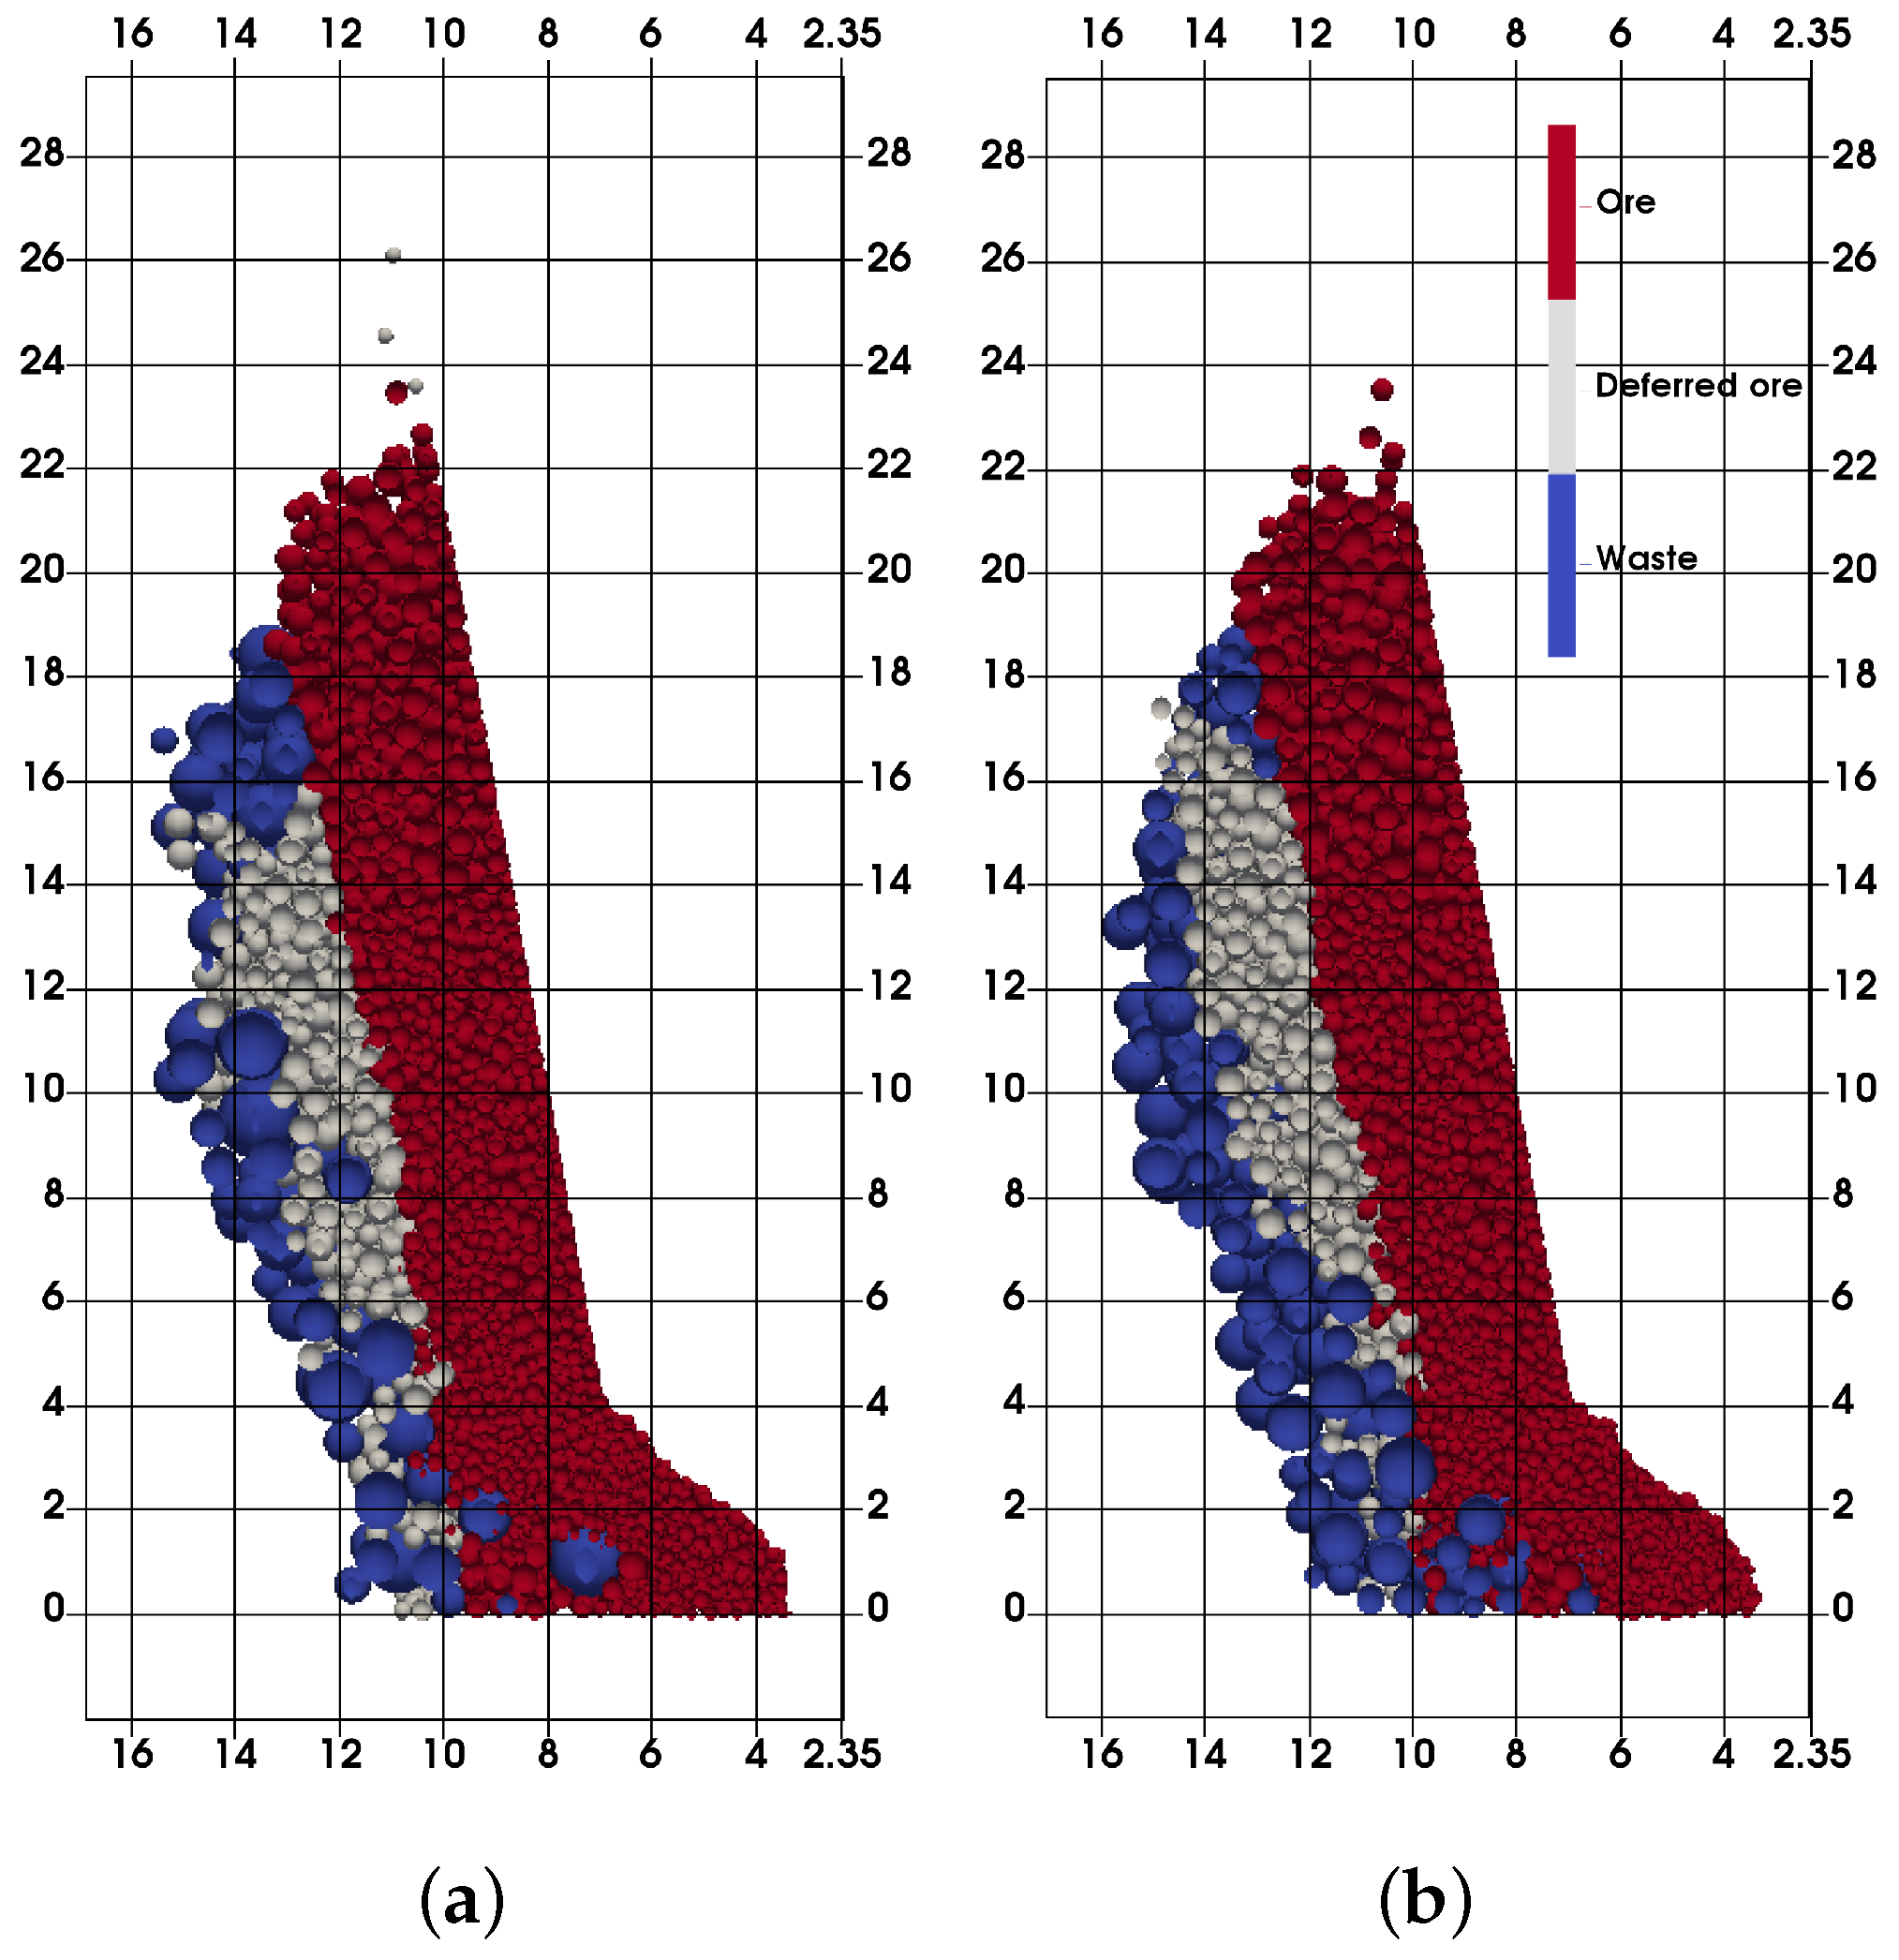
Figure 13.
Influence of the mutual change of fragmentation and friction in waste material. (a) Ore dilution; (b) blasted ore recovery.
Figure 13.
Influence of the mutual change of fragmentation and friction in waste material. (a) Ore dilution; (b) blasted ore recovery.

Figure 14.
Final extraction zones encompassing the mutual change of fragmentation and friction. (a) Coarse, = 25°; (b) fine, = 30°; (c) coarse, = 35°.
Figure 14.
Final extraction zones encompassing the mutual change of fragmentation and friction. (a) Coarse, = 25°; (b) fine, = 30°; (c) coarse, = 35°.


Table 1.
Material properties used for the initial DEM model.
| Material | Young’s Modulus (Pa) | Friction Angle (°) | Density (Mg/m) |
|---|---|---|---|
| Ore | 35 | 3.2 | |
| Waste | 25, 30, 35 | 2.7 | |
| Outer boundary | 35 | 2.7 |
© 2017 by the authors. Licensee MDPI, Basel, Switzerland. This article is an open access article distributed under the terms and conditions of the Creative Commons Attribution (CC BY) license (http://creativecommons.org/licenses/by/4.0/).
Share and Cite
MDPI and ACS Style
Lapčević, V.; Torbica, S. Numerical Investigation of Caved Rock Mass Friction and Fragmentation Change Influence on Gravity Flow Formation in Sublevel Caving. Minerals 2017, 7, 56. https://doi.org/10.3390/min7040056
AMA Style
Lapčević V, Torbica S. Numerical Investigation of Caved Rock Mass Friction and Fragmentation Change Influence on Gravity Flow Formation in Sublevel Caving. Minerals. 2017; 7(4):56. https://doi.org/10.3390/min7040056
Chicago/Turabian StyleLapčević, Veljko, and Slavko Torbica. 2017. "Numerical Investigation of Caved Rock Mass Friction and Fragmentation Change Influence on Gravity Flow Formation in Sublevel Caving" Minerals 7, no. 4: 56. https://doi.org/10.3390/min7040056
Note that from the first issue of 2016, this journal uses article numbers instead of page numbers. See further details here.