Article

Characterization of Germanium Speciation in Sphalerite (ZnS) from Central and Eastern Tennessee, USA, by X-ray Absorption Spectroscopy

1
Laboratoire GeoRessources, Université de Lorraine-CNRS-CREGU, Boulevard des Aiguillettes, BP 239, F-54506 Vandœuvre-lès-Nancy, France
2
BRGM, DGR/MIN, 3, Av. Claude Guillemin, BP 6009, 45100 Orléans, France
3
Institut NEEL, CNRS, Université Grenoble Alpes, F-38042 Grenoble, France
4
FAME Beamline at ESRF, 38000 Grenoble, France
*
Author to whom correspondence should be addressed.
Minerals 2017, 7(5), 79; https://doi.org/10.3390/min7050079
Submission received: 1 February 2017 / Revised: 10 May 2017 / Accepted: 11 May 2017 / Published: 16 May 2017

Abstract

:
X-ray absorption near edge structure (XANES) spectroscopy was used on zoned sphalerites (ZnS) from two world-class Mississippi Valley Type deposits, the Central and Eastern Tennessee Mining district, USA, in order to investigate germanium oxidation states. Due to the low germanium concentrations of these samples, it was necessary to perform the X-ray absorption spectroscopy (XAS) in fluorescence mode. The overlapping of the Zn Kβ and Ge Kα emission lines meant that a high energy-resolution was required. This was achieved using crystal analysers and allowed a bandwidth of 1.3 eV to be obtained. Experimental spectra were compared to XANES calculations and three configurations of germanium incorporation into sphalerite were identified. The first two, the most prevalent, show germanium (II) and (IV) surrounded by sulphur atoms in tetrahedral coordination, suggesting the replacement of Zn by Ge. In the third configuration, germanium (IV) is surrounded by oxygen atoms. This third configuration is unexpected for a zinc sulphide mineral and it resembles that of argutite (GeO2).

1. Introduction

Germanium is a high technology metal used in the green energy sector, especially in the photovoltaic industry for the manufacture of solar cells. Currently, this element is mined from two main sources: coal ash (mostly in China) and zinc sulphides, with 30% of the production coming from recycling [1,2]. Germanium rarely forms its own minerals and usually substitutes other elements in more common minerals. It can be enriched in silicates (in which it substitutes for Si), sulphides, oxides, hydroxides, and coal [3]. A number of authors have conducted systematic analyses of all trace elements in sphalerite from various types of zinc deposits (volcanogenic massive sulphide (VMS), Mississippi Valley Type deposits (MVT), sedimentary exhalative deposits (Sedex), etc.) [4,5]. Amongst sphalerite ores, Mississippi Valley Type (MVT) deposits are a major source of Zn. Sphalerite is targeted due to its tendency to preferentially incorporate Ge, even in the presence of other sulphides such as galena and chalcopyrite [6].
Sphalerite crystallises in the cubic system ( 4 ¯ 3 m ), and can incorporate many trace elements (Fe, Cd, Mn, Co, etc.) in its structure. This zinc sulphide may contain germanium as a trace element in concentrations of hundreds to thousands ppm [5,7,8]. The substitution mechanisms that lead to the incorporation of germanium in the crystal structure of sphalerite are poorly constrained. Reference [9] studied the incorporation of Ag, Sb, and Cu; Reference [10] studied the distribution of Mn, Fe, and Cd; and Reference [11] studied the distribution of numerous trace elements, including Ag, As, Cd, Fe, Tl, Sb, Cu, and Mn. Reference [12] proposed an equation to explain the substitution mechanisms in sphalerite: 2M+ + M2+ + Ge4+ ↔ 4Zn2+, where Ge substitutes for Zn. The study, based on EPMA data, was later extended by Reference [4], who, using LA-ICP-MS quantification, suggested a simple Ge2+ ↔ Zn2+ substitution in sphalerites from the Tres Marias deposit, Mexico.
Germanium can be found in more than one oxidation state and in nature, its most common states are 2+ and 4+. Defining a substitution mechanism therefore relies on knowledge of its valency, so that charge compensations can be taken into account. Previous studies of germanium speciation and/or the chemical environment have used synchrotron radiation for analyses. Reference [13] determined the atomic environment of Ge(IV) in aqueous solution as a function of pH, Reference [14] determined the amorphous state of Ge in nanostructures, Reference [15,16] studied germanium configuration in synthetic glass, and Reference [16,17] studied its configuration in alloys. Studies of natural samples are very scarce in the literature [18] used X-ray absorption spectroscopy to study germanium in hematite and goethite from the Apex Mine, Utah; Reference [19] investigated germanium in coal and roll-front deposits; Reference [20] investigated germanium speciation in natural Ge-rich sphalerites from the Tres Maria deposit, Mexico; and the recent study of Reference [21] used µ-XANES (X-ray Absorption Near Edge Structure) to investigate the germanium oxidation state in sphalerites from Saint Salvy, France. However, the sphalerites studied by References [20,21] were Fe-rich; the present study extends the available data to Fe-poor sphalerites. As a general rule, Ge incorporation into sphalerite seems to be linked with temperature [22], but this empirical rule based on data from various types of deposits does not explain Ge-content variations within specific districts where the temperature remains quite stable, such as the Tennessee MVT’s. Understanding Ge speciation and its substitution mechanisms are of both scientific significance and high economic interest. From an economic point of view, the formation of Ge-rich deposits needs to be compared to Ge-poor deposit formation in order to identify the parameters that control Ge-enrichment. In addition, germanium, due to its sensitivity to Eh conditions, can provide information on the conditions under which sphalerite forms—information which is both scientifically important in itself and will also be significant for defining exploration models for the mining industry.

2. Materials and Methods
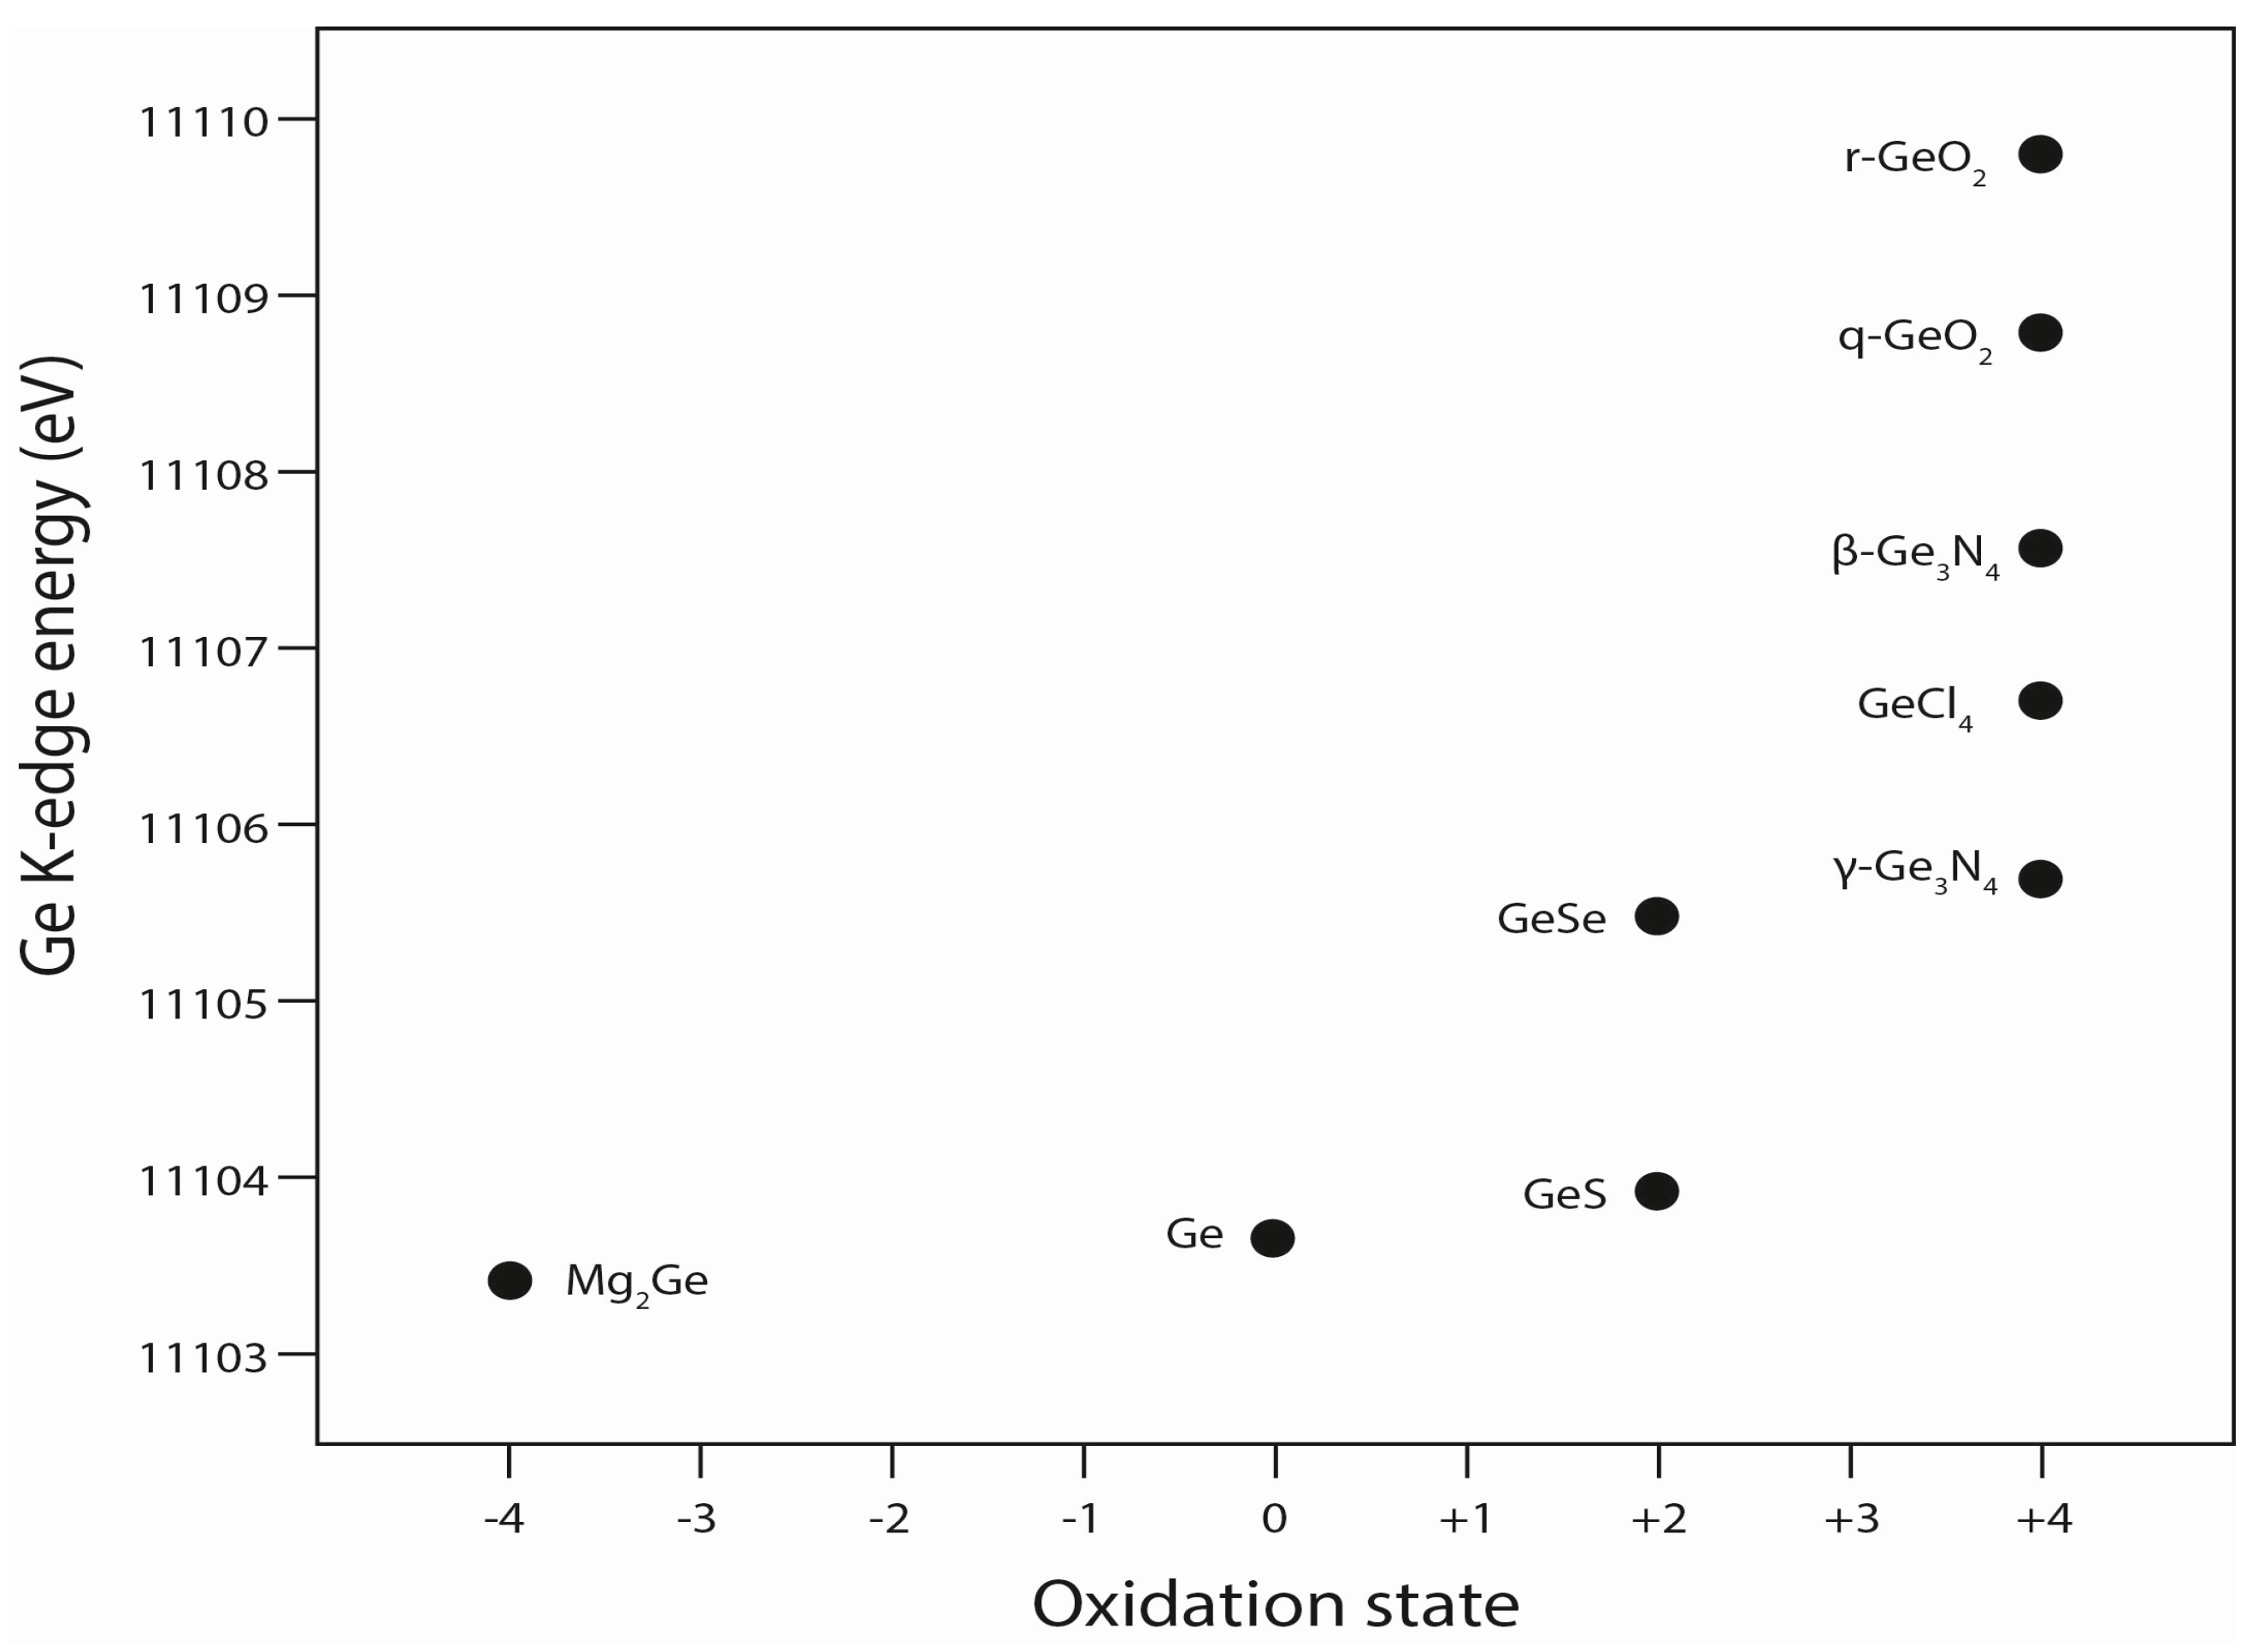
2.1. Standards

In X-ray absorption experiments, the spectra of targeted samples are usually compared to those of standards covering the expected possible configurations (neighbour distances, number, and geometry). Applied to the present study, this would require the use of sphalerite standards doped with germanium 2+ and germanium 4+, the two main forms of germanium. However, to our knowledge, no sphalerite standard with a known content and speciation of germanium exists. It was therefore necessary to find other standards for germanium in its 0, 2+, and 4+ oxidation states.
Reference [23] showed that for any one germanium oxidation state, the absorption edge moves to higher energies with an increasing electronegativity of its ligand (Figure 1). Reference [20] also concluded that a large shift in the absorption edge position between two Ge4+ species can be observed and that this shift was linked to the nature of the ligand (e.g., GeS and GeSe; Figure 1). Thus, the standards for this study were chosen by selecting compounds in which germanium is surrounded by atoms that have an electronegativity close to that of sulphur. Several Ge standards consisting of either pure compounds or natural minerals were used: germanium metal (oxidation state 0), GeI2 (oxidation state 2+), GeO2, and renierite (natural sulphide, oxidation state 4+). The latter two were chosen as oxygen and sulphur were the two ligands we expected to find in natural samples. The iodide standard was selected because iodine has an electronegativity close to—but higher than—sulphur.
The Ge(0) (coordination number 4) metal, Ge(II)I2, and Ge(IV)O2 (coordination number 6) standards consisted of high purity mineral powders (99.999%) (Alfa Aesar). Powders were held between two pieces of Kapton sticky tape and sealed in a glove box under argon to prevent oxidation. However, the technical grade of argon gas used contained enough oxygen (1000 ppm) to partially oxidize Ge(II)I2 (coordination number 3) into Ge(IV)I4 (coordination number 6) and GeO2, as revealed by later XRD (X-ray Diffraction) analysis. The renierite ((Cu,Zn)11(Ge,As)2Fe4S16) standard was a natural mineral sample (given by The Royal Museum for Central Africa in Tervuren, Belgium). Renierite is a copper sulphide from the tennantite–tetrahedrite family and contains 7% Ge (Ge content determined by an electron microprobe). Massive natural renierite was prepared as a polished section of 100 µm thickness. The renierite formula, determined by an electron microprobe, is Cu+11(Cu2+0.5,Zn2+0.5)(Fe3+)3.5(As5+)0.5(Ge4+)1.5S16, in agreement with Reference [24]. By extrapolation from this formula, germanium is considered to be under its Ge(IV) form and is surrounded by four sulphur atoms in tetrahedral coordination [24].

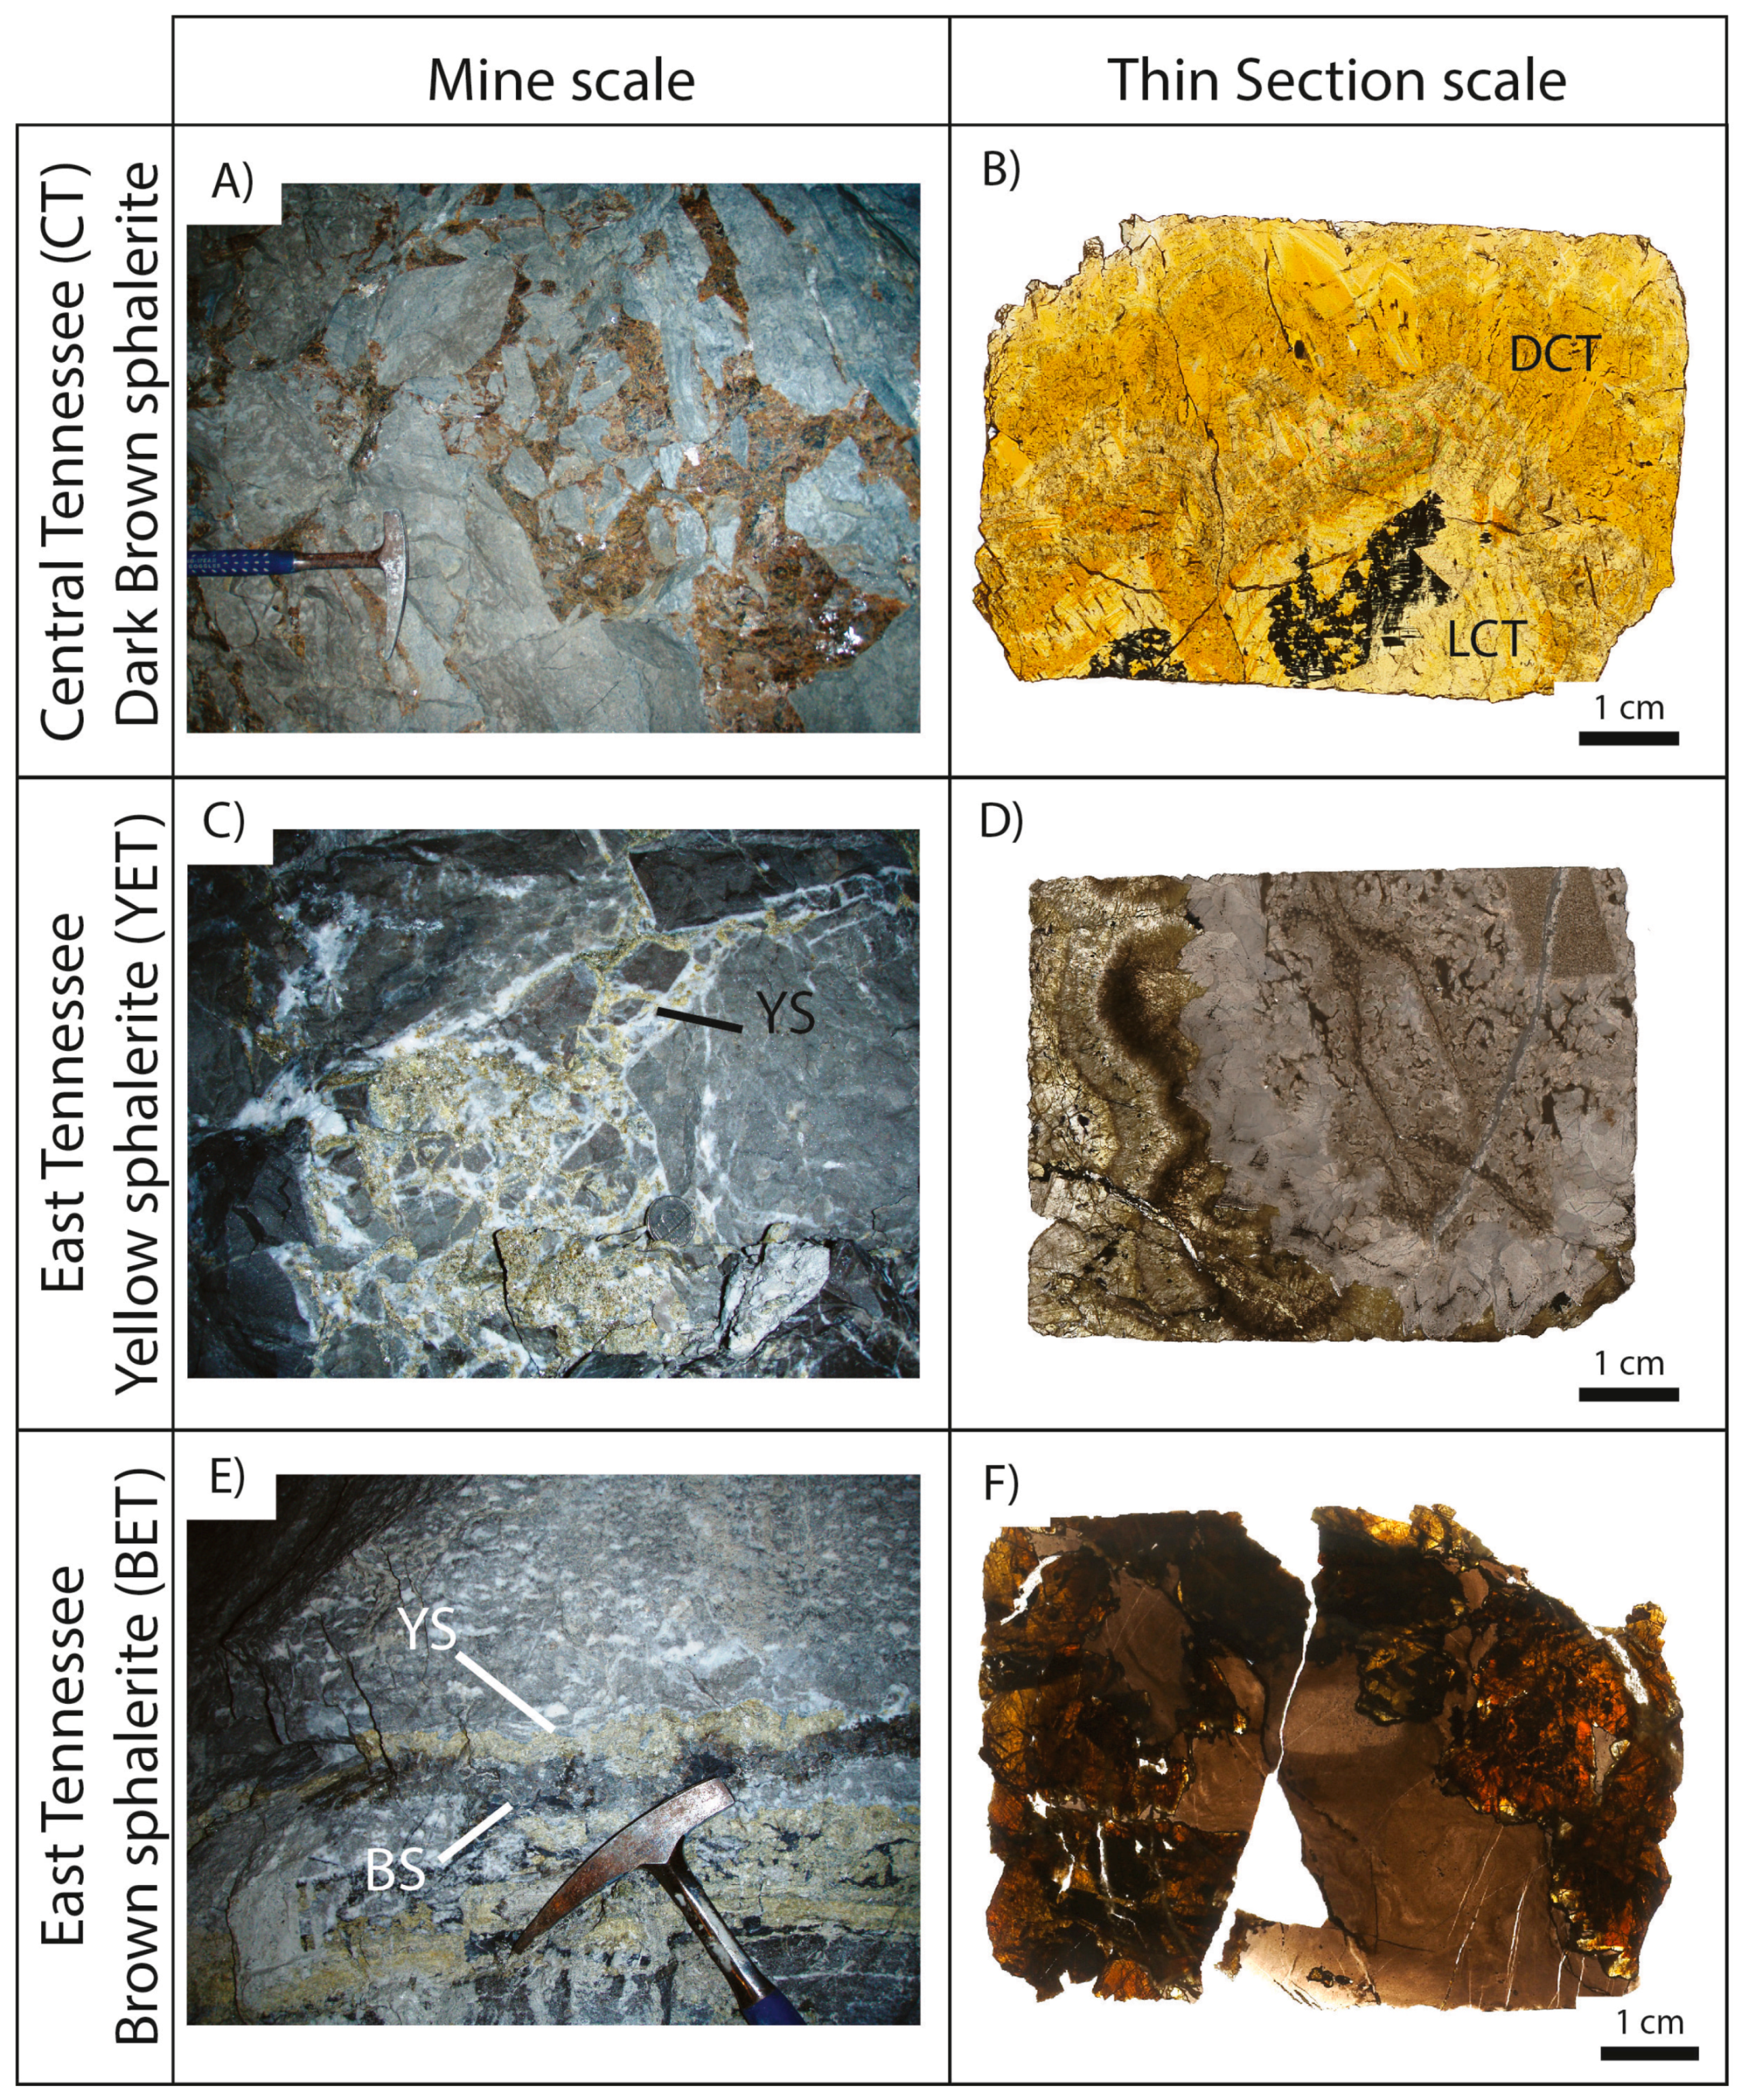
2.2. Sphalerite Samples

The sphalerite samples (four samples from Cumberland Mine (CT) (CU50S#2; CU51S#4; CU12S#6B; CU45S#10), one from Elmwood (CT) (ELM2W#19) mine, and two from Coy mine (ET) (CY3068B for brown sphalerite and CY3068C for brown and yellow sphalerite) and collected in 2012) consisted of polished thin sections (30 µm thickness) from the Tennessee MVT District. Samples consisted of massive sphalerite in a thin section, but at a microscopic scale, they consisted of micro crystalline sphalerite. A more detailed description of the samples is available in Reference [25]. The Tennessee mining province is divided into two mining districts: Central Tennessee (CT) and East Tennessee (ET). Central Tennessee sphalerites are macroscopically reddish-brown (Figure 2A) and exhibit alternating light and dark bands that are visible in a polished thin section (LCT and DCT, respectively; Figure 2B). The width of the LCT and DCT banding is between 100 and 200 µm. Light bands are enriched in iron and cadmium and contain some copper, gallium, and germanium. Dark bands have lower concentrations in iron and cadmium, but are enriched in germanium (Table 1). Sphalerites from ET have no apparent colour banding, but two types of sphalerite coexist in this district: a light-yellow sphalerite (YET) (Figure 2C,D), containing some traces of cadmium and iron, and a very low germanium content (Table 1); and a brown sphalerite (BET) (Figure 2E,F) containing a high grade of iron and cadmium, and germanium in a higher concentration than in the YET, but in a lower concentration than in the LCT and DCT (Table 1). A more detailed description of the samples is available in the supplementary material, with the different area analysed by XANES spectroscopy, and an example of an X-ray fluorescence map showing the trace elements distribution in one sample.

2.3. Method

XANES spectra were analysed using the Athena-Artemis Package [26] based on the IFEFFIT [27] and AUTOBK [28] programs. The spectra were normalised using Athena software (pre-edge line, post-edge line, E0 position). The background was removed using the AUTOBK algorithm, the k-weight parameter was between one and three, and the k-range was defined from 1.5 to 12 Å−1.
The structures of the standards were used in the XANES calculations to validate the position of the main peak. The XANES calculation is not yet accurate enough to reproduce the first oscillation, but it reproduces the position of the main peak, thus enabling a direct observation of the absorption edge position that could be related to a specific set of Ge oxidation states and ligand types (Figure 1). The XANES calculations are reported in Figure 3. The positions of the main peak determined by the XANES calculations were the same as those of the experimental spectra: 11,106.5 eV for Ge metal, 11,107.5 eV for GeI2, 11,109 eV for renierite, and 11,112 eV for GeO2.
The methods for LA-ICP-MS (Agilent Technologies, Santa Clara, UT, USA) and EMPA (Cameca, Gennevilliers, France) are described in [25]. SEM images were performed using a JEOL J7600F scanning electron microscope (SEM, JEOL, Akishima, Japan) equipped with an SDD-type EDS spectrometer coupled to an Oxford Wave WDS spectrometer. Backscattered electron (BSE) images were obtained with an acceleration voltage of 30 kV.
Germanium metal corresponds to germanium under the oxidation state 0 surrounded by germanium atoms. Germanium oxide corresponds to germanium under the form 4+ surrounded by oxygen atoms. Renierite is composed of germanium in its 4+ form surrounded by sulphur atoms. GeI2 is composed of GeI2, GeI4, and GeO2, which correspond to germanium +2 and +4 surrounded by iodine atoms and germanium 4+ surrounded by oxygen, respectively.

2.4. Beamline Configuration
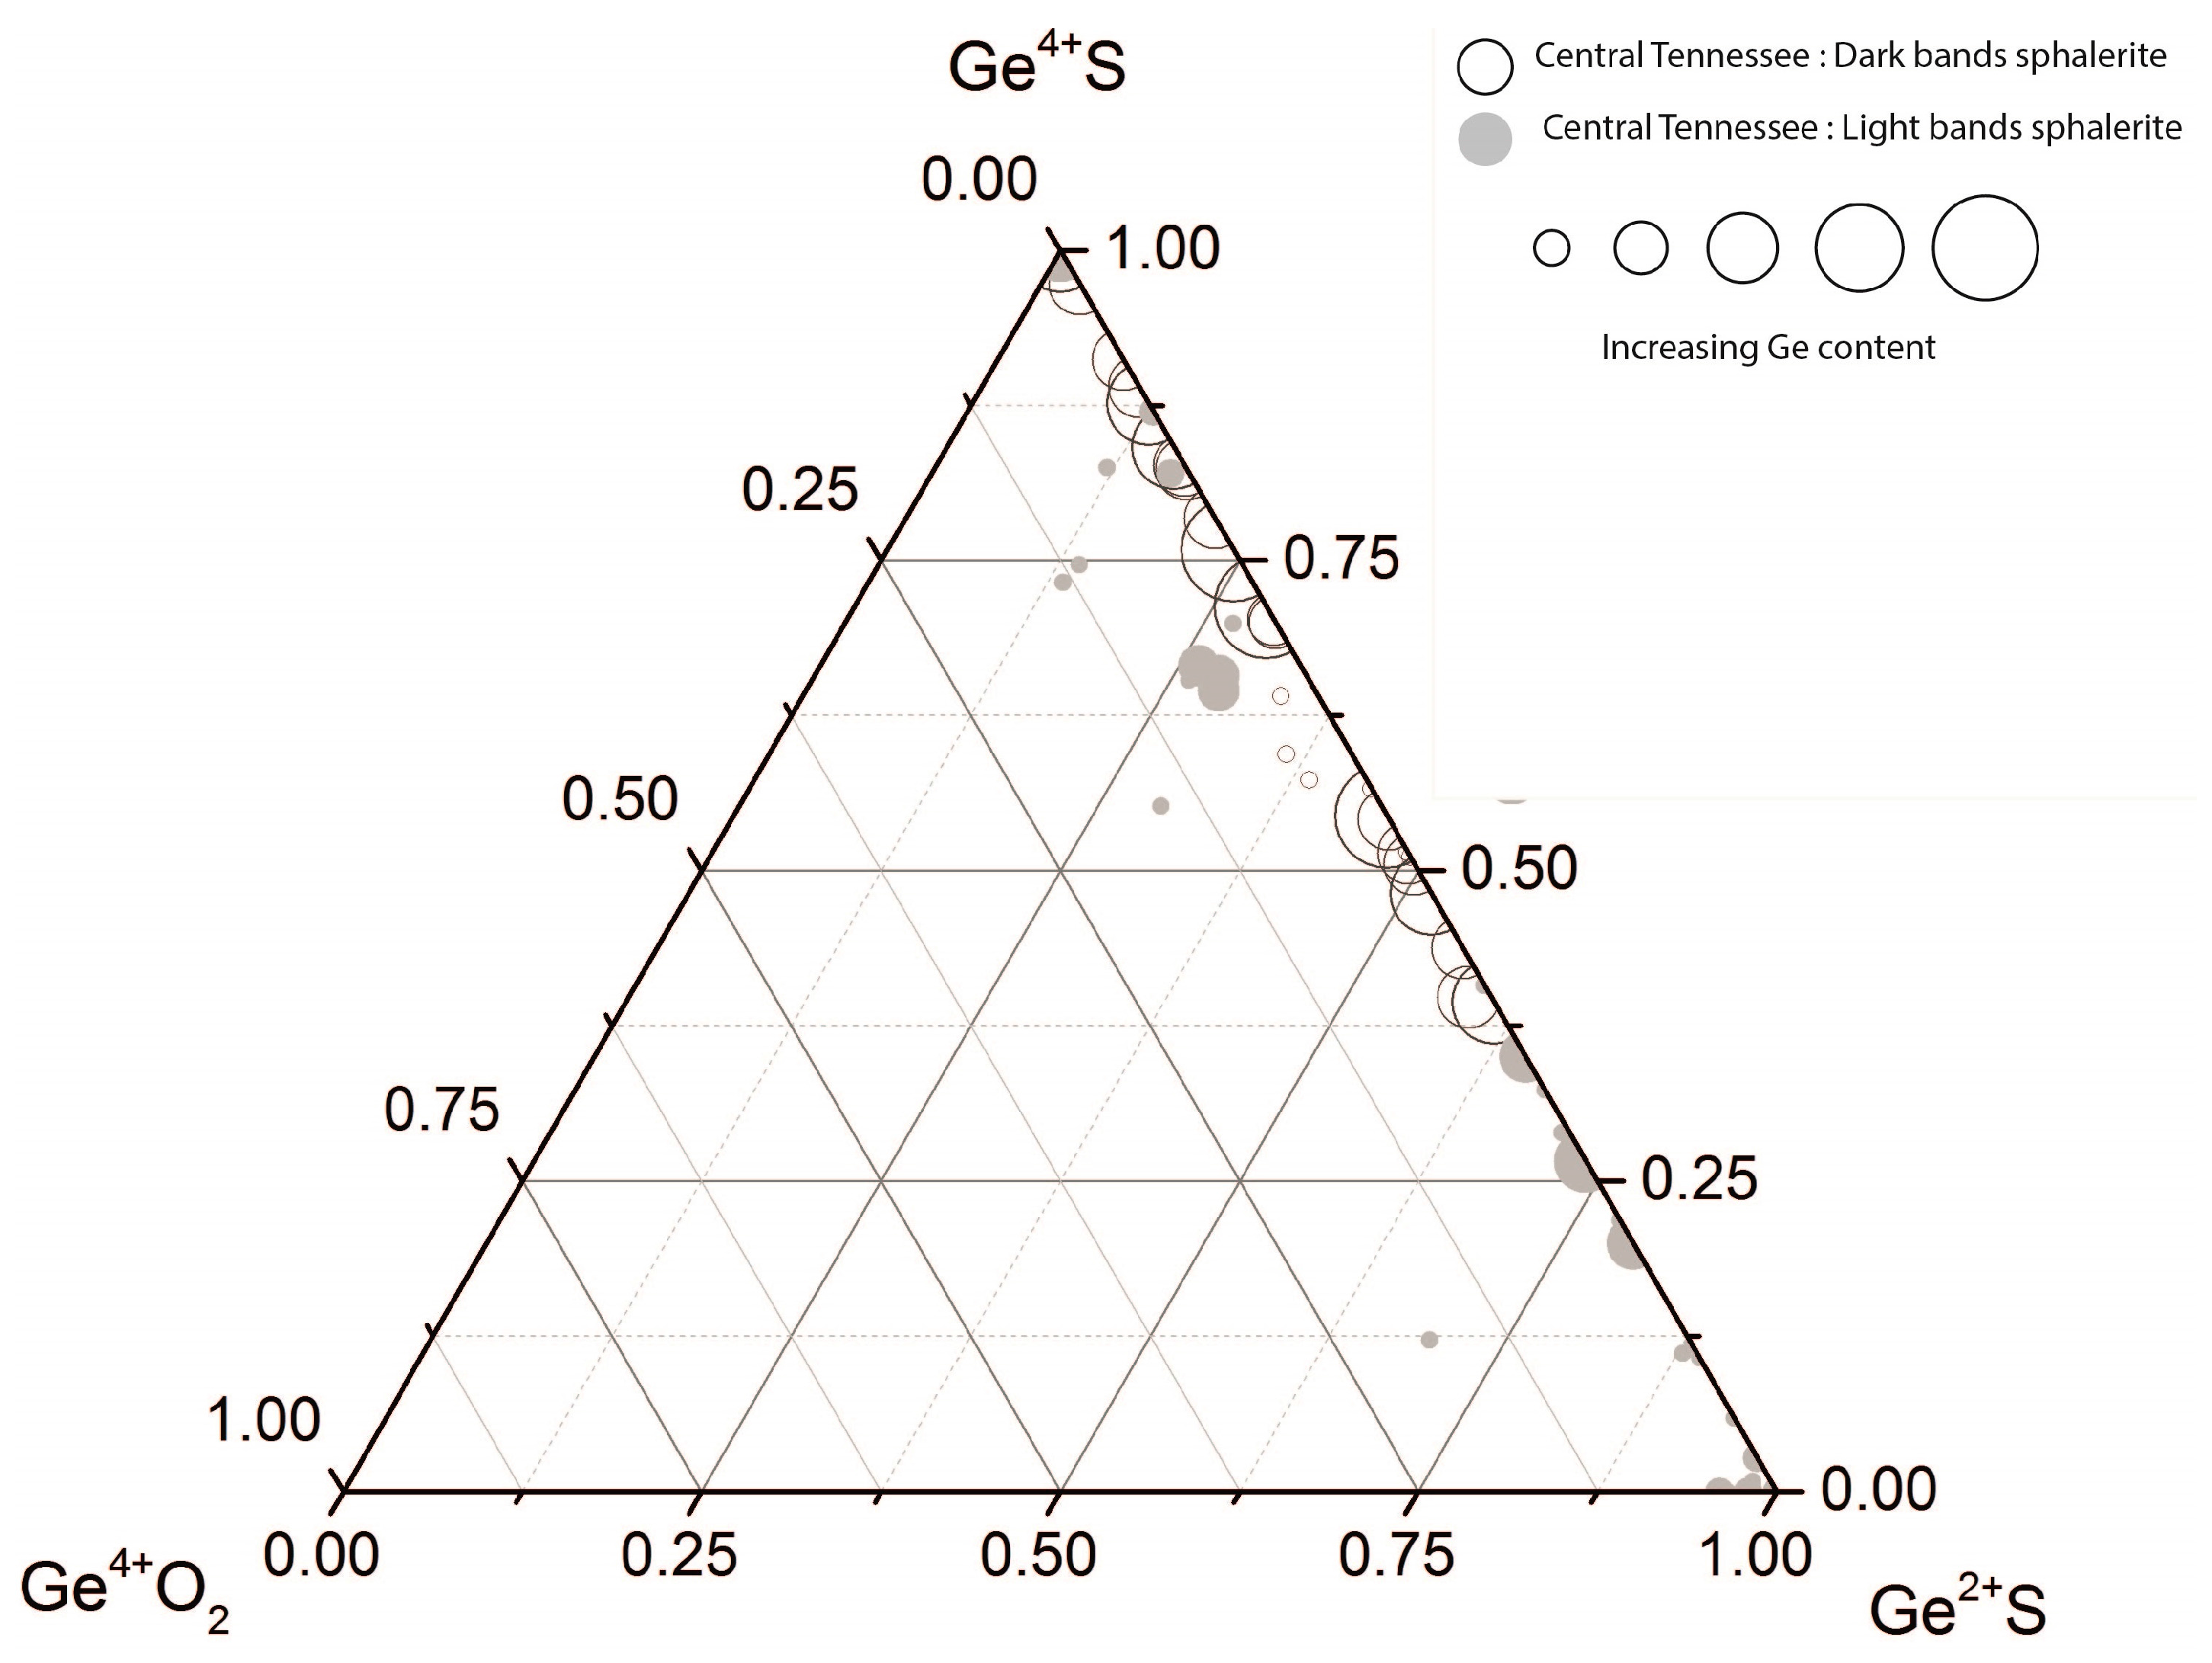
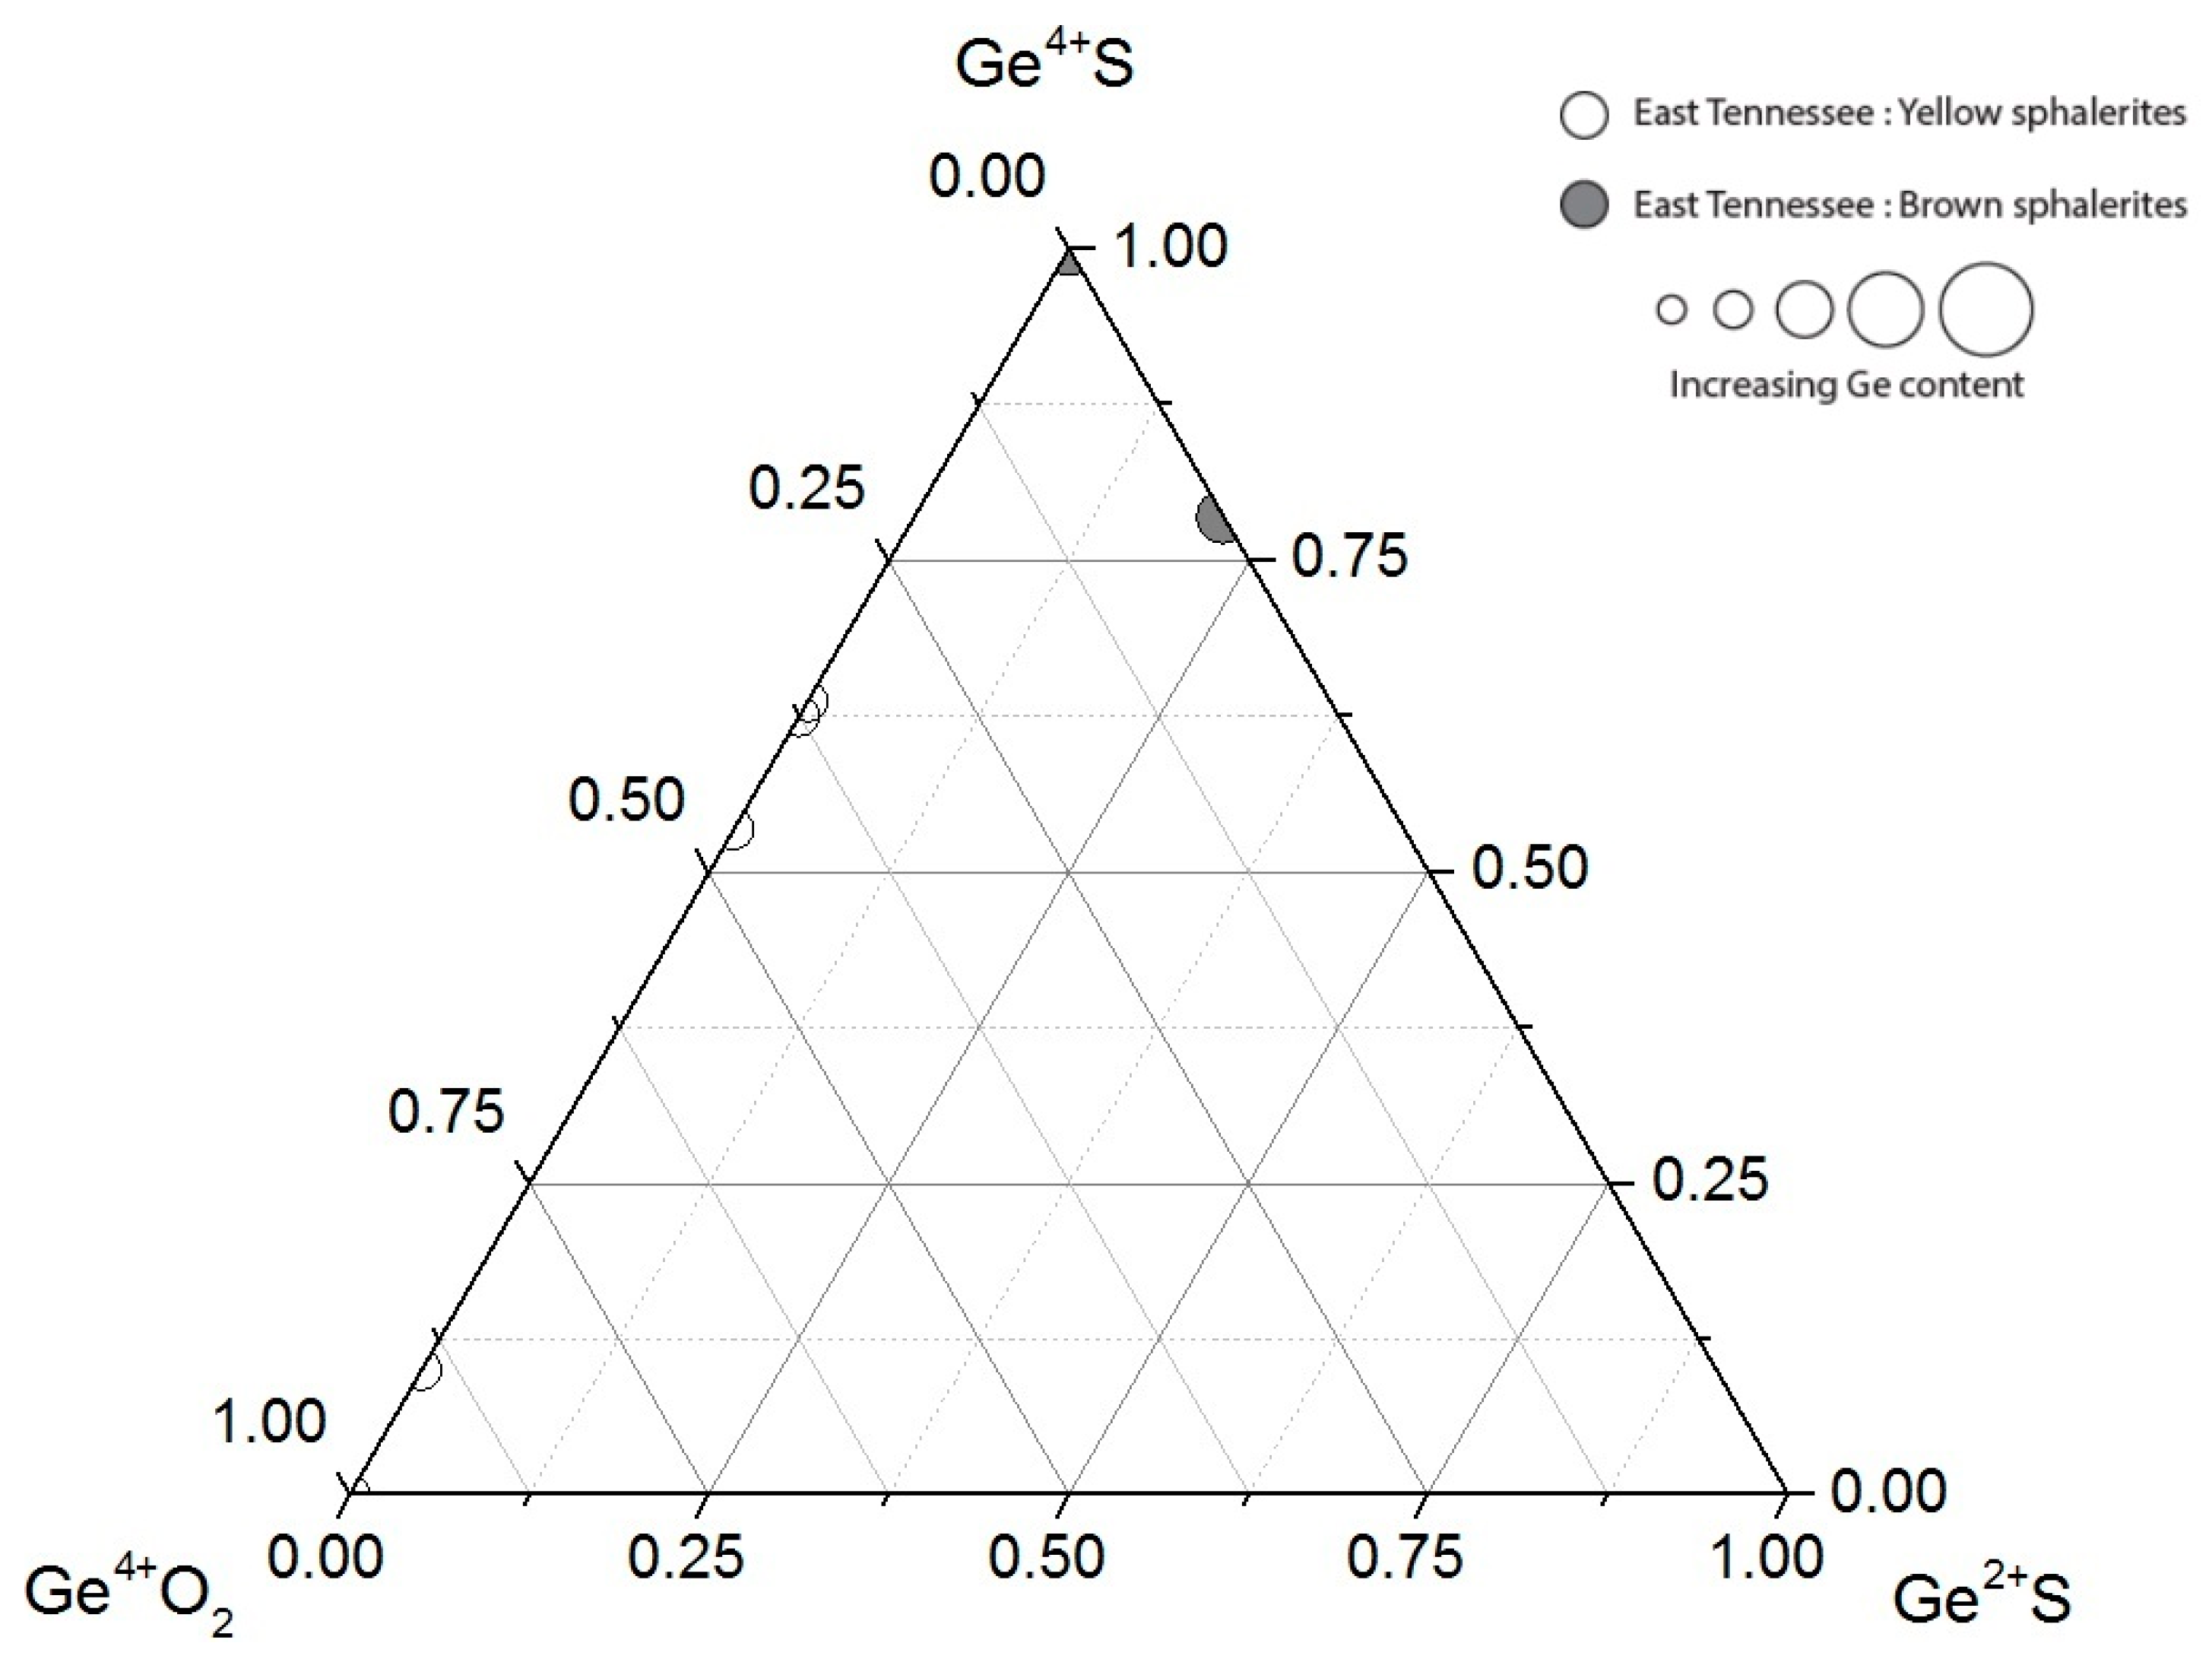
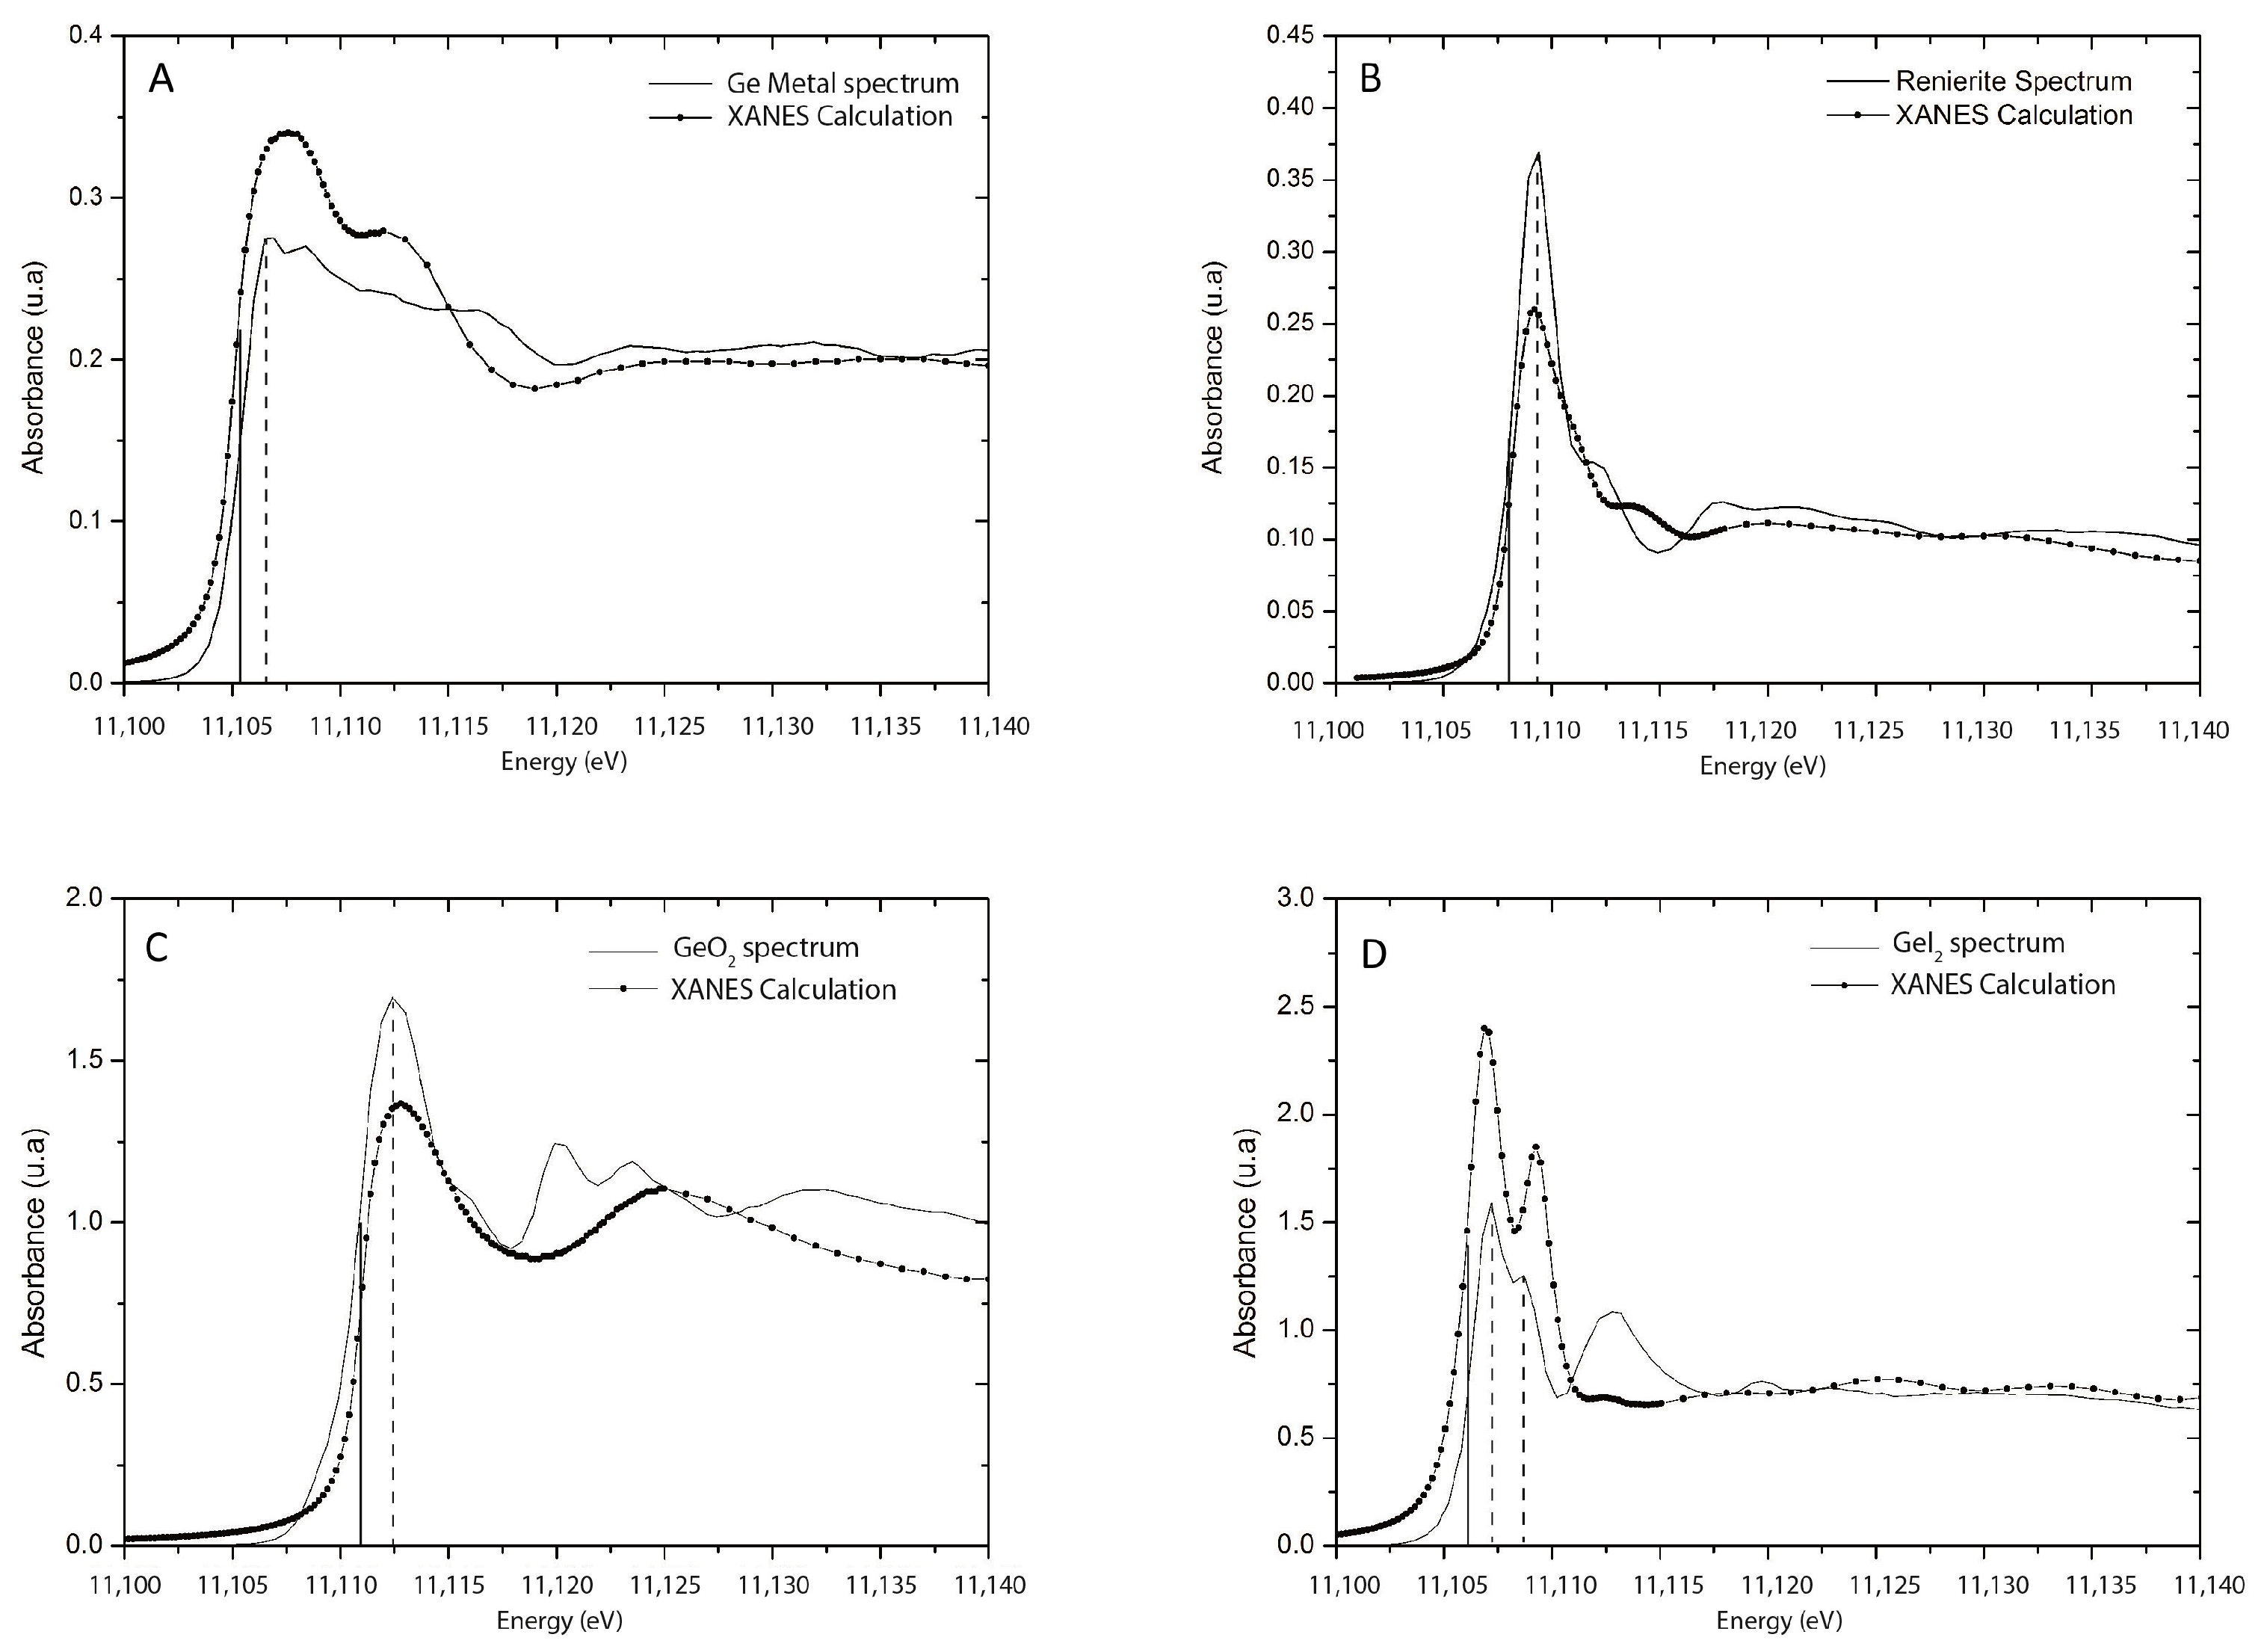
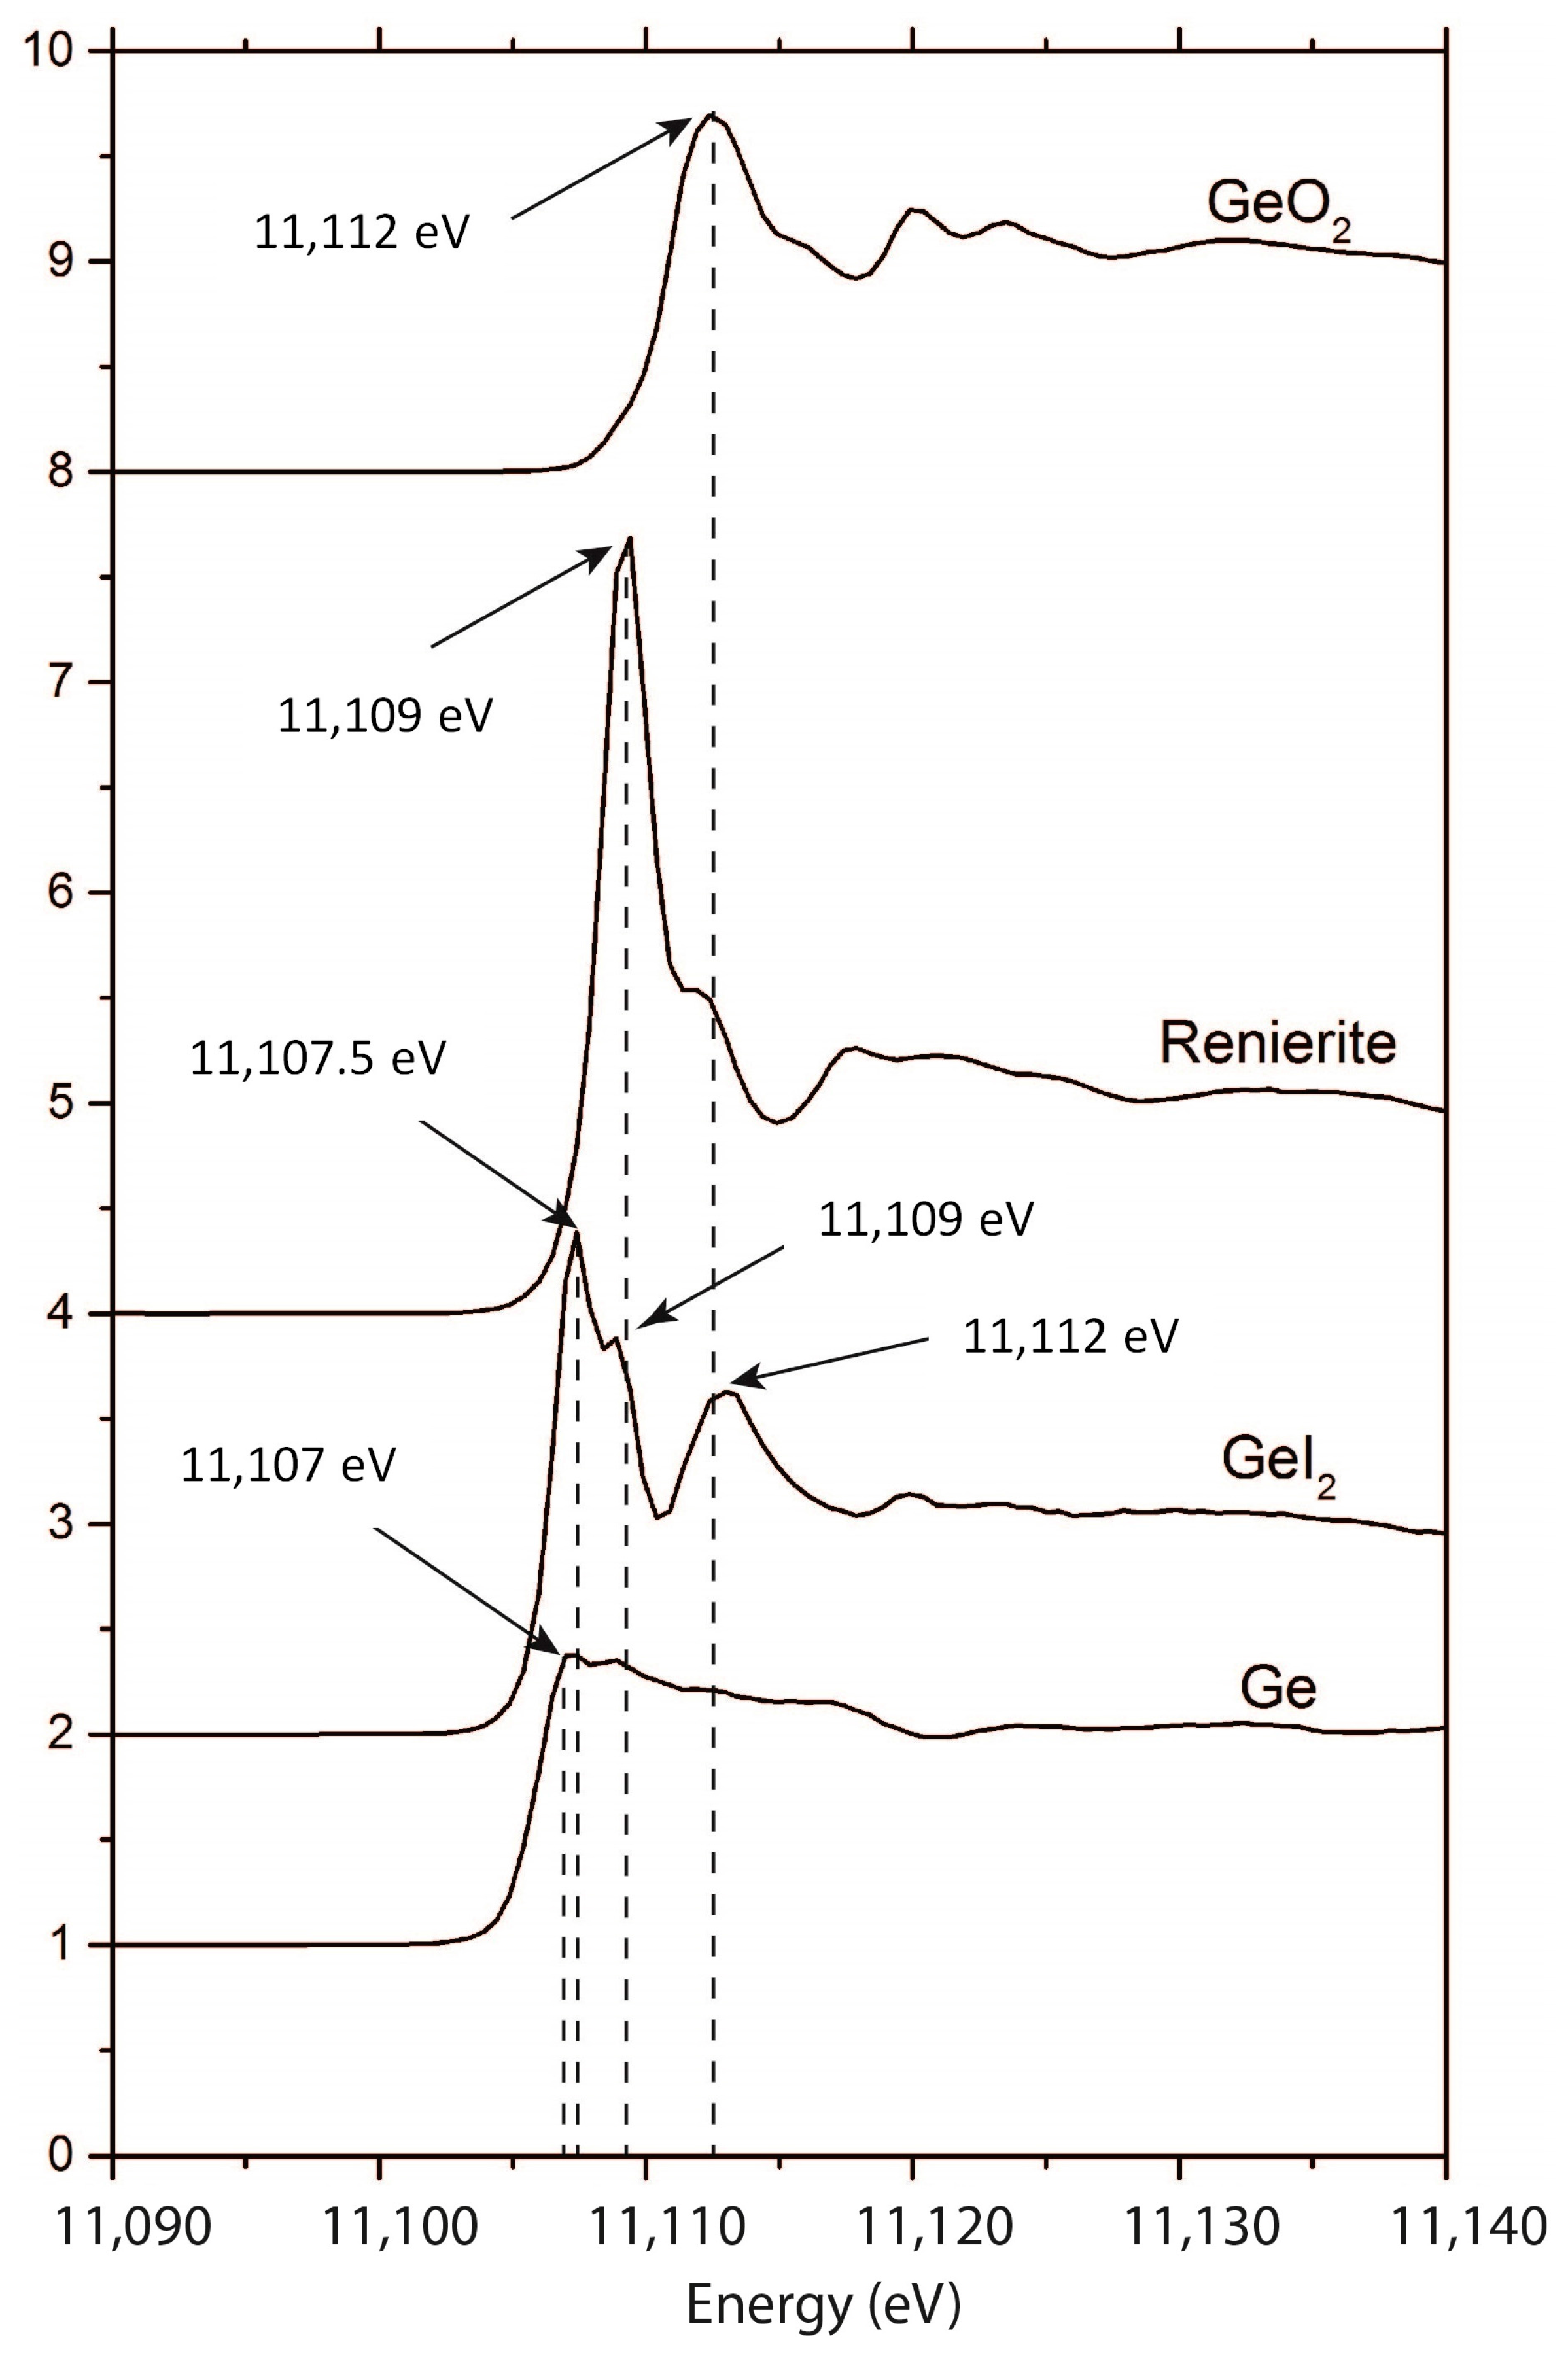
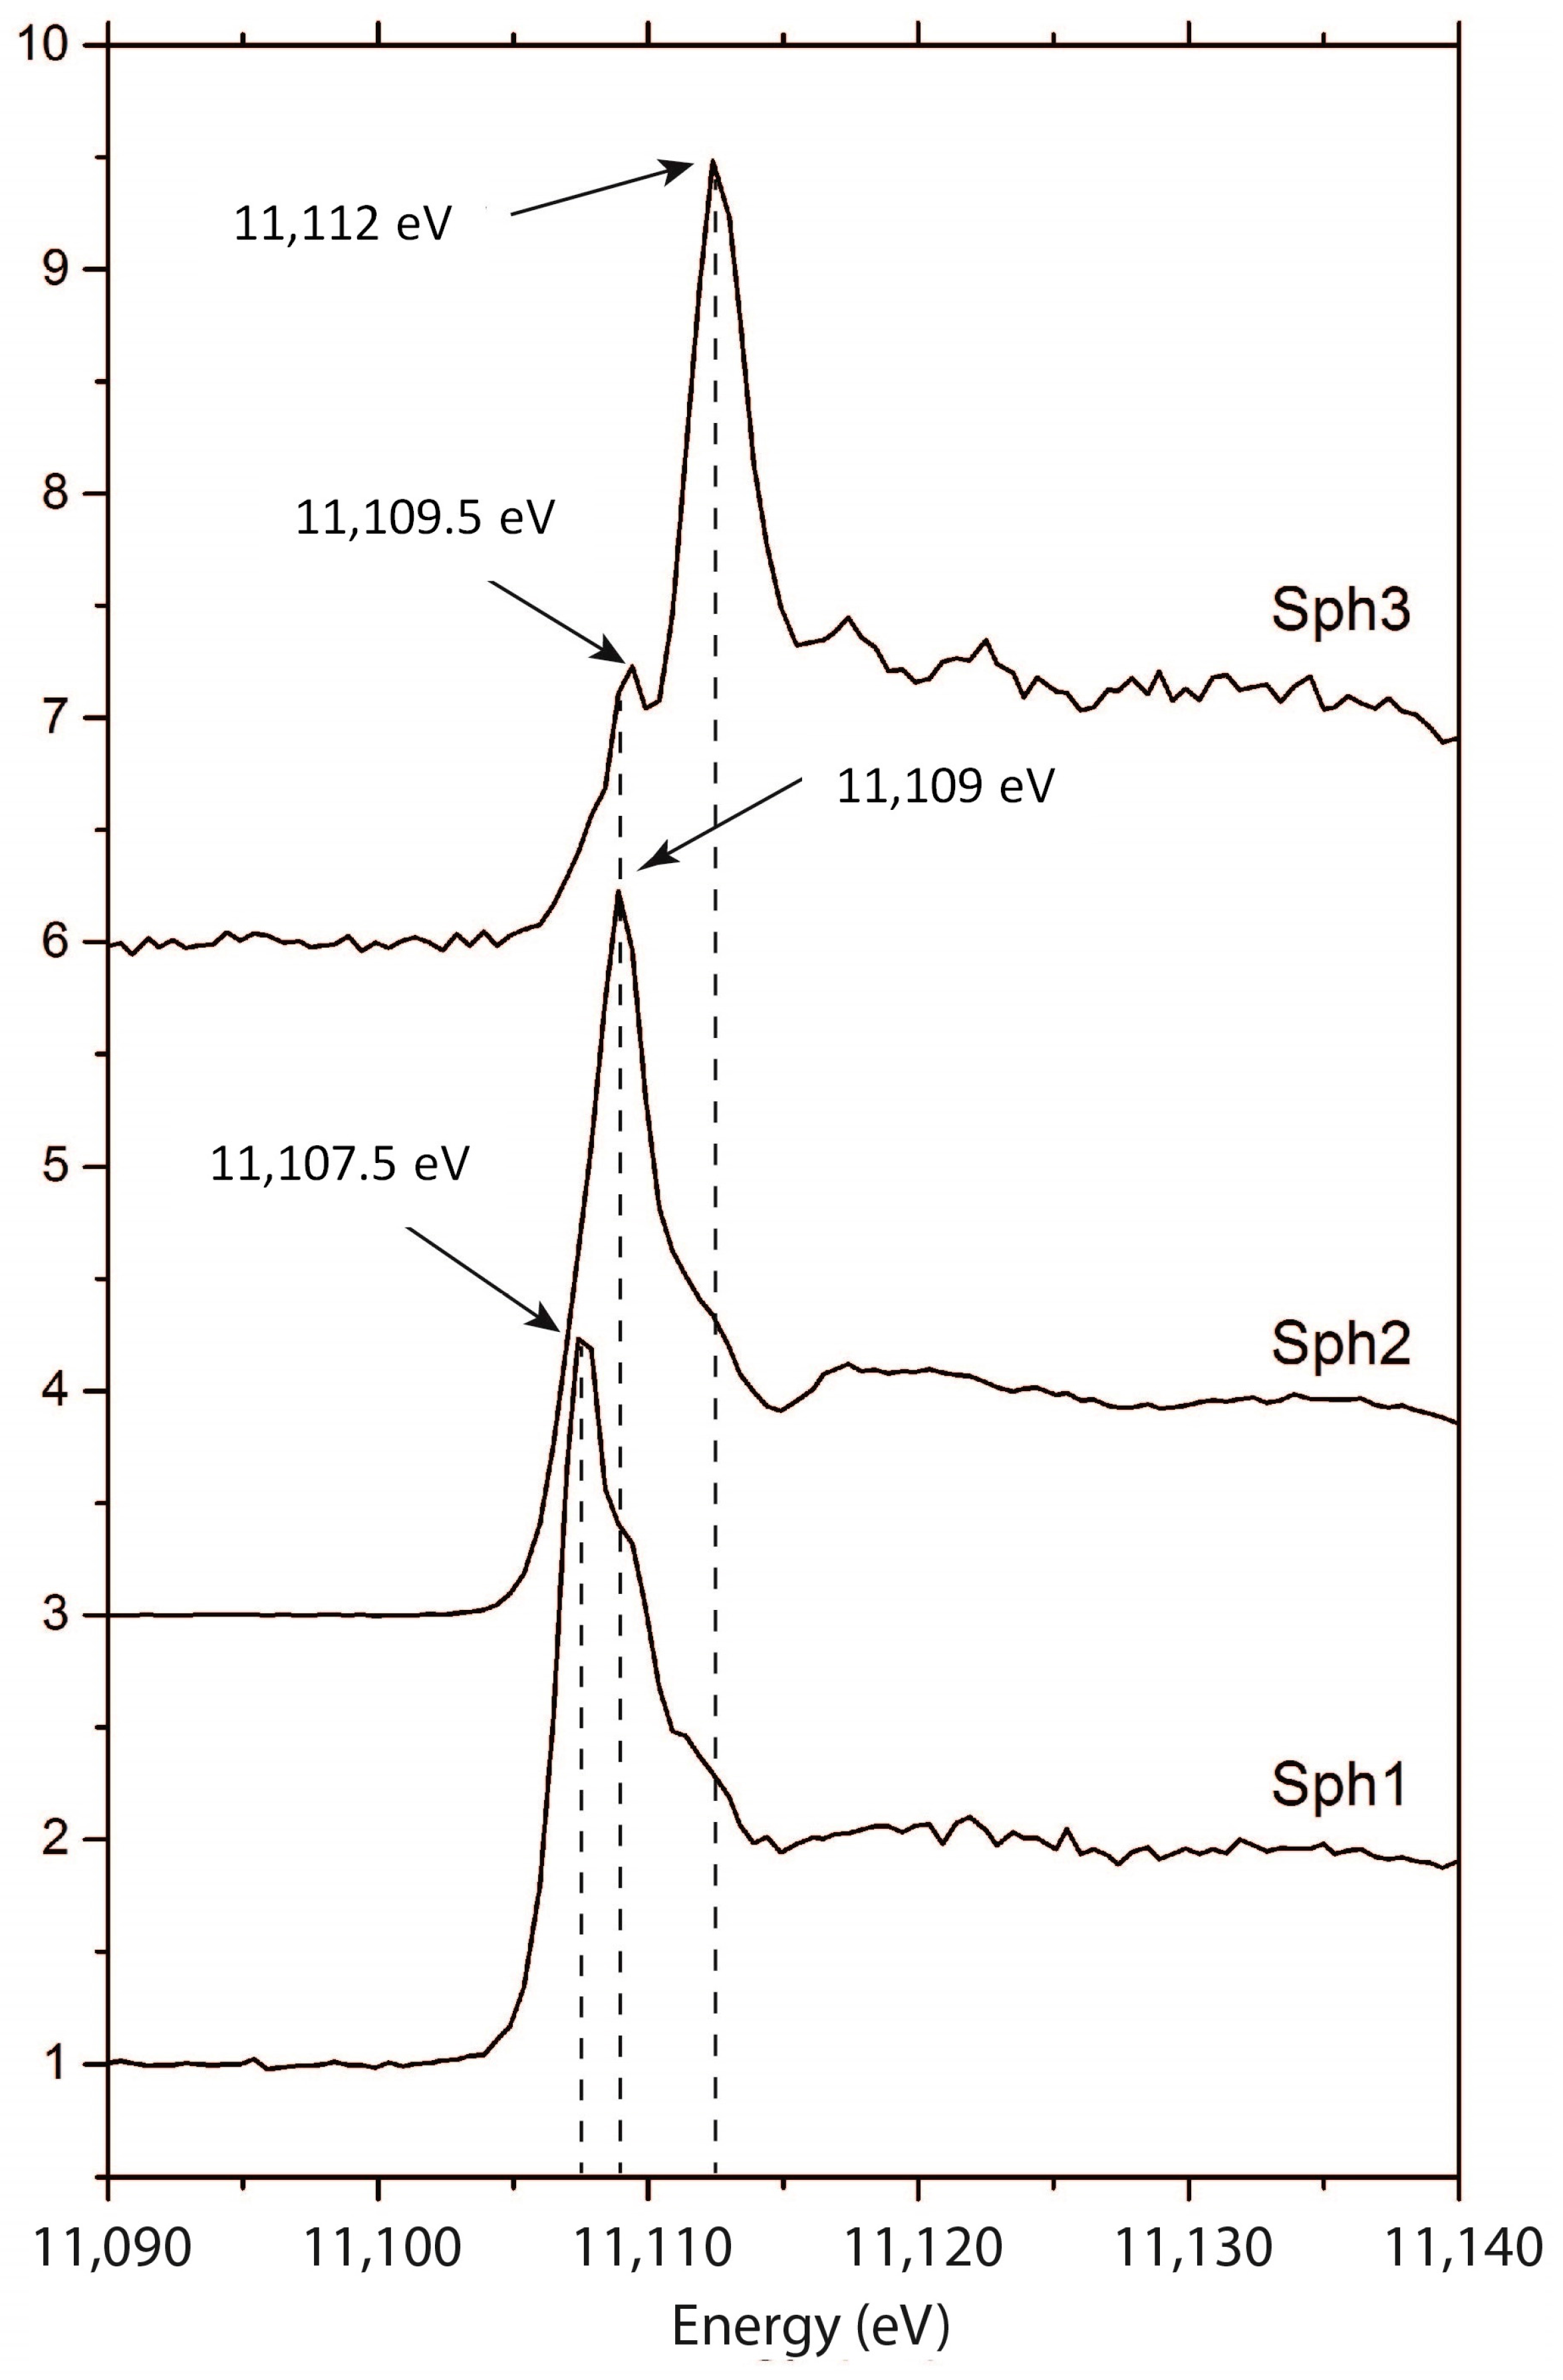
Given the quite low Ge content of sphalerite, the use of X-ray Absorption Spectroscopy (XAS, ESRF, Grenoble, France) detection in fluorescence mode was required. Due to the overlapping of the Zn Kβ and Ge Kα lines, crystal analysers were used to select the Ge emission only.
The XAS experiments were performed at the FAME beamline (BM30B) at the European Synchrotron Radiation Facility in Grenoble [29], operated in 7/8 + 1 bunch mode (200 mA) at 6 GeV. Spectra were recorded in fluorescence mode at the Ge K-edge (11.103 KeV). The beamline is equipped with a double-crystal Si(220) monochromator [30]. The beam size, around 300 × 100 µm² (HxV FWHM), is greater than the width of natural sphalerite banding (100–200 µm). The position of the X-ray spot on the sample was kept constant during acquisition.
The full fan delivered by the bending magnet source was focused in the horizontal plane by the second crystal of the monochromator and by the second Rh-coated mirror in the vertical plane. Finally, a feedback system was used to maximize the output of the two-crystal X-ray monochromator. Fluorescence detection was achieved using two spherically bent crystal analysers (Si660, 1 m bending radius) in Johann-type geometry [31,32]. A silicon drift detector (Vortex) was used for the detection of the signal reflected by the two analysers. The total energy resolution of the spectrometer (beamline optics and crystal analyser), determined by recording the quasi-elastic peak of the incident beam from the sample, was 1.3 eV.
Reference spectra were collected over the 10.948–12.329 KeV energy range and sphalerite spectra were collected over the 10.948–11.649 KeV energy range.

3. Results

Because GeI2 displays three peaks in the samples due to its partial oxidation to GeI4, in this study, the spectra were identified using the position of the white line instead of using the edge of the spectra.
The spectra of the standards are presented in Figure 4. GeO2 is characterized by a main peak at 11,112 eV. The renierite spectrum is characterized by a main peak at 11,109 eV. The GeI2 standard, which is a mix of GeI2, GeI4, and GeO2, has three characteristic peaks: one at 11,107.5 eV, corresponding to GeI2; another at 11,109 eV, corresponding to GeI4; and one at 11,112 eV, corresponding to GeO2. These values differ to those found by References [20,23] (Figure 1); however, even though the energy positions are different, the distances in energy between the configurations remain the same, i.e., 1 eV between Ge(0) and Ge(II)I2, 2 eV between Ge(II)I2 and Ge(IV)I4, and 3 eV between Ge(IV)I4 and Ge(IV)O2.
A total of 162 X-ray absorption spectra were measured on natural sphalerites from Tennessee: 126 spectra on sphalerites from Central Tennessee covering both LCT and DCT bands, 15 on yellow sphalerites from East Tennessee, and 21 on brown sphalerites from East Tennessee.
Regardless of the district from which the sphalerites originated, the spectra all seem to be a linear combination of three types of spectra which appear as three potential end members. The end members are reported in Figure 5. Each of these end members is an experimental spectrum measured on a natural sphalerite. Each end member is the experimental spectrum that displays the lowest amount of the other two end members. The three end members are Sph1 with a peak at 11,107.5 eV, Sph2 with a peak at 11,109 eV, and Sph3 with a peak at 11,112 eV. The latter (Sph3) also displays a peak at 11,109.5 eV. Although the very low Ge-content of this sample has resulted in a poor signal to noise ratio, this small peak is statistically significant. This peak might correspond to the same germanium configuration as Sph2, but shifted to slightly higher energies as it is built on a strongly rising baseline due to the peak at 11,112 eV.
The first spectrum (Sph1) has its main 11,107.5 eV peak at the same position as the first peak of the GeI2 standard. This first configuration can be interpreted as germanium under the form 2+ and, as iodine and sulphur have similar electronegativity, Sph1 can be interpreted as germanium 2+ in a sulphur environment. The second spectrum (Sph2) has its main peak at 11,109 eV, which is identical to that of the GeI4 peak of the “GeI2 standard”, but is also at the same position as the renierite peak. This configuration can be interpreted as germanium 4+ in a sulphur environment. The last spectrum (Sph3) has its main peak at 11,112 eV, corresponding to the peak acquired on the GeO2 standard. This configuration can be interpreted as germanium 4+ in an oxygen environment.
The Athena software was used to decompose each of the spectra acquired on the natural sphalerite samples as a linear combination of Sph1, Sph2, and Sph3 spectra. The results for the samples from Central and East Tennessee are presented in ternary diagrams in Figure 6 and Figure 7, respectively. In these diagrams, the circle radius is proportional to the germanium concentration. Germanium concentrations were estimated qualitatively from the height of the absorption edge. The poles in the ternary diagram are labelled Ge2+S (Sph1), Ge4+S (Sph2), and Ge4+O (Sph3), as defined above (Figure 5 and preceding paragraph).
Sphalerites from Central Tennessee (Figure 6) lie between the Ge2+S and Ge4+S poles. Samples were divided into dark and light bands, but some of the measurements labelled “dark bands” actually correspond to analytical points that covered more light bands than dark bands. Likewise, some of the measurements labelled “light bands” correspond to analytical points that covered more dark bands than light bands. With a proportion of Ge4+S greater than 35%, the DCT data lie closer to the Sph2 pole. The LCT data are more evenly distributed between the two poles, with the proportion of Ge4+S ranging from 0 to 100%.
In Figure 7, which shows the sphalerite data from East Tennessee, the brown sphalerites (BET) are also scattered between the Sph1 and Sph2 poles and the proportion of Ge4+S is greater than 75%. This distribution is comparable to, and even more marked than, the DCT data. The data from the yellow sphalerite from East Tennessee (YET) are scattered between the Sph2 and Sph3 poles, but are closer to pole Sph3.
Prior to synchrotron experiments, the sphalerite samples were imaged and analysed using EPMA, SEM-FEG, and XRF in order to check for solid inclusions in the sulphides. No inclusion was found at theses scales, which are around 100 nm for Back Scattered Electron images and ~20 µm for XRF. These results are shown below (Figure 8) and as Figure S7 for the CY3068-C3 in which spectrum Sph3 was obtained, specific of the Ge oxide found exclusively in the YET samples.
Figure 8 shows that synchrotron acquisitions were performed in homogeneous, inclusion-free, non-fractured areas. Fractures are not filled with clays or other phases that may have crystallized after ore deposition. Round or oval-shaped pores represent opened fluid inclusions.

4. Discussion

4.1. Implications of Experimental Conditions

The large spot size (300 × 100 µm) was selected in order to increase the number of photons, which in turn allowed us to probe samples with low Ge concentrations, in particular the yellow sphalerites from East Tennessee. However, the large beamsize meant that both dark and light growth bands were analysed during each measurement of the sphalerites from Central Tennessee. The conditions used in this study, aimed at increasing the sensitivity, are therefore complementary to those used by [20,21], which were aimed at increasing the spatial resolution.

4.2. Implications for the Conditions of Sphalerite Formation

In the third germanium configuration (Sph3), the energy position of its white line exactly corresponds to that of the GeO2 standard, and these samples thus host germanium surrounded by oxygen. This result can be interpreted either as germanium being present as silicate due to the substitution of Si by Ge (both have z/r close to 8) or as germanium being in a simpler form with oxygen atoms, probably in the form of the argutite germanium oxide.
Optical and SEM images revealed no other mineral phase than sphalerite. SEM images were performed on in the area where the peak at 11,112 eV was measured (Figure 8a–d), but also nearby this zone in fractures (Figure 8e,f). The fractures nearby the measured sites show no filling. Other types of porosity include opened fluid inclusions and ripped off surfaces. Polishing these samples was a demanding task due to its micro crystalline structure (See Figures S1 and S2). As fractures are free of any filling material, they may also have been opened upon sample cutting. The SEM images also show that sphalerite is homogenous: the image Figure 8a,c shows a zoning with dark and light bands, coming from the crystal structure of sphalerite. This zoning shows only low compositional variations in the trace elements concentration using LA-ICP-MS (10 to 100 ppm), which are below what BSE can detect. The images of Figure 8e,f show the porosity of these samples and the whitening of the pore edges due to charge effects. Synchrotron experiments were performed away from these places. No silicate mineral was observed, neither in XRF maps (Figure S1) nor optical and SEM images (Figure 8 and Figure S1). A previous study on the argut deposit in the central Pyrenees (France) revealed the presence of the micro-inclusion of argutite associated with sphalerite [33]. This study also revealed a whole set of silicate mineral where Si was replaced by Ge (Ge > 1%). Hence, if there had been silicon in the system, there would have been a whole assemblage of Ge species, which should have been imaged using SEM, XRF, and optical microscopy. Therefore, the third germanium configuration (Sph3) found in YET samples most probably consists of germanium oxide hosted in sphalerite. These Ge-oxide inclusions were not images using BSE, which means that they are smaller than 500 nm in size.
The most critical point is the petrogenetic link between sphalerite and the germanium-oxide phases. These inclusions could not be imaged, as they could be anterior, cogenetic, or posterior to sphalerite genesis. The third hypothesis is hardly conceivable since sphalerites do not present alteration or phases that precipitate thereafter. The two first hypotheses remain undetermined. A Ge-oxide pre-existing to sphalerite implies that it was not completely dissolved during the precipitation of sphalerite. This implies limited or the absence of chemical disequilibrium between the germanium oxides and the growing sphalerite. Indeed, given the small size of these inclusions, their dissolution would have been complete if they were in strong imbalance with the fluid responsible for the precipitation of sphalerite. If these two phases are cogenetic, they precipitated at equilibrium. Hence, anterior or cogenetic, sphalerite and Ge-oxides were close to equilibrium, and it is therefore possible to use this thermodynamic equilibrium to estimate the conditions in fO2 and fS2 which lead to the precipitation of sphalerite.
The existence of various germanium configurations associated with sphalerite implies differences in conditions during sphalerite formation. As discussed above, the equilibrium between the two forms of germanium exists between these two phases, and therefore, this implies particular thermodynamic conditions. Two different systems in which germanium is associated with sphalerite can be proposed:
(1) Germanium associated only with sulphur, under 2+ and 4+ forms. This configuration was found in the sample from Central Tennessee and in the brown sphalerite from East Tennessee.
(2) Germanium under 4+ form only, associated with sulphur or oxygen. This configuration was only found in the yellow sphalerite from East Tennessee. This configuration of germanium with oxygen or sulphur is not surprising in an MVT type environment, since in these deposits, there is the precipitation of both sulphur and sulphate.
The sphalerites from the two districts formed at similar temperatures, between 100 °C (373 K) and 150 °C (423 K), are determined by the fluid inclusion study [34]. Temperature does not therefore control germanium speciation in this context. [3] constructed three models for germanium speciation in hydrothermal environments with sulphur and oxygen (at 298.15, 500, and 1000 K).
Temperatures derived from fluid inclusion studies are minimal temperatures of trapping, and temperatures of formation should thus be higher than or equal to these temperatures. The three diagrams presented in [3] were not constructed for temperature conditions close to those of the MVT deposits. Therefore, for this study, we drew a diagram at 400 K using the thermodynamic data compiled in [35,36] (Figure 9). In this diagram, the GeS species, which corresponds to germanium 2+ with sulphur, is metastable under the chosen temperature conditions [3] and is represented by the grey zone. The diagram can be used to explain the differences between the two systems. The presence of two forms of germanium implies a thermodynamic equilibrium between these two phases. The thermodynamic conditions of the existence of these two phases are defined by the common limit between the two domains of stability of these two phases. According to this diagram, the first system corresponds to conditions close to the equilibrium between Ge and GeS2, corresponding to Log S2 > 16.1 with Log O2 < −62.5. The second system corresponds to conditions close to the equilibrium between GeS2 and GeO2, corresponding to Log S2 > −16.1 and Log O2 > −62.5.
While this diagram provides the speciation of germanium species in sphalerite, it does not, however, give the germanium configuration. Chemical and thermodynamic data on germanium incorporation in sphalerite are scarce, and this is one of the proxies available for estimating the chemical conditions that control Ge speciation.
The difference between an equilibrium between sphalerites from Central (with Ge(II) and Ge(IV) with sulphur) and Yellow sphalerites from East Tennessee sphalerites (Ge(IV) with sulphur or oxygen) can be understood here as similar conditions in sulphur fugacity and a marked difference in oxygen fugacity. For sphalerites in central Tennessee, dark bands and light bands have similar germanium configurations (Ge2+ and Ge4+ with sulphur), so the formation conditions of these sphalerites are very similar. On the other hand, for sphalerites from East Tennessee, brown sphalerites and yellow sphalerites have very different formation conditions (with Ge2+ and Ge4+ with sulphur for browns and Ge4+ with sulphur or oxygen for yellows). There was a change in the formation conditions between these two phases of sphalerites. However, since the chronology of these two sphalerites is not known, it is impossible to determine in what sense the conditions have evolved.
Germanium speciation, in our study, therefore appears to be controlled by the fO2 and fS2. Keeping in mind that sphalerites from the Tennessee deposits are depleted in iron compared to those observed in previous studies [20,21], we could also think about a competing role played by iron in buffering excess in oxygen.
Studies of germanium configuration could therefore potentially be used to estimate the oxygen fugacity in sphalerite from MVT deposits. If this hypothesis can be confirmed by measurements made on synthetic sphalerite in which oxygen fugacity is controlled during sphalerite formation, then the Ge oxidation state could be used as a marker of oxygen fugacity during ore formation in the future.

5. Conclusions

XANES spectroscopy coupled with synchrotron radiation has allowed germanium configurations to be investigated in natural sphalerite samples. Three germanium configurations were identified in sphalerite samples from MVT deposits in Central and East Tennessee: (i) Ge2+ associated with sulphur in tetrahedral coordination; (ii) Ge4+ associated with sulphur in tetrahedral coordination; and (iii) Ge4+ associated with oxygen, interpreted as nano-inclusions of germanium oxide in the sphalerite lattice. These three germanium configurations can be divided into two systems: Ge2+ and Ge4+ associated with sulphur, identified in most of the samples analysed; and a more limited system in which Ge4+ is associated with sulphur and oxygen. Despite the lack of data related to the incorporation of germanium into sphalerite, these two systems can be interpreted in terms of sphalerite formation using a diagram of Log S2 versus Log O2 for estimating the formation conditions of the deposits.

Supplementary Materials

The following are available online at www.mdpi.com/2075-163X/7/5/79/s1. Figure S1: Transmitted light of CU51S#4N sample (Reference used by mining companies) from Cumberland mine, Central Tennessee, USA. The sample exhibits a complex zonation with dark and light bands. These bands contain different trace elements concentration as revealed by XRF-map of Zn, Cu, Ga, Ge, Cd and Fe. The analysis zones (red rectangle) were carried out in zones with different trace elements assemblage. The dark bands have high Ge, Ga and Cu concentration while the light bands have high Fe and Cd concentration. Figure S2: Transmitted light of CU45S#10 sample (Reference used by mining companies) from Cumberland mine, Central Tennessee, USA. The sample doesn’t have zonation at thin section scale, but at microscopic scale dark and light areas such as the sample CU51S#4N appear. The analysis zones (red rectangle) were carried out in dark bands with high Ge, Ga and Cu concentration. Figure S3: Transmitted light of CU50S#2sample (Reference used by mining companies) from Cumberland mine, Central Tennessee, USA. The sample doesn’t have zonation at thin section scale, but at microscopic scale dark and light areas such as the sample CU51S#4N appear. The analysis zones (red rectangle) were carried out in dark bands with high Ge, Ga and Cu concentration. Figure S4: Transmitted light of CU12S#6B sample (Reference used by mining companies) from Cumberland mine, Central Tennessee, USA. The sample doesn’t have zonation at thin section scale, but at microscopic scale dark and light areas such as the sample CU51S#4N appear. The analysis zones (red rectangle) were carried out in dark bands with high Ge, Ga and Cu concentration. Figure S5: Transmitted light of CU51S4#4B sample (Reference used by mining companies) from Cumberland mine, Central Tennessee, USA. The sample doesn’t have zonation at thin section scale, but at microscopic scale dark and light areas such as the sample CU51S#4N appear. The analysis zones (red rectangle) were carried out in dark bands with high Ge, Ga and Cu concentration. Figure S6: Transmitted light of ELM2W#19 sample (Reference used by mining companies) from Elmwood mine, Central Tennessee, USA. The sample doesn’t have zonation at thin section scale, but at microscopic scale dark and light areas such as the sample CU51S#4N appear. The analysis zones (red rectangle) were carried out in dark bands with high Ge, Ga and Cu concentration. Figure S7: Transmitted light of CY3068B sample (Reference used by mining companies) from Coy mine, East Tennessee, USA. The sample is divided in two parts: a first part to the left with a brown sphalerite and a second part to the right with a light sphalerite. The brown sphalerites are rich in Fe, Cd and Ge while the light sphalerites are poorer in Fe with some Cd. Several analysis zones (red rectangle) were carried out in brown and light sphalerites. The reference spectra at 11112 eV was acquired in the exact zone marked by the red rectangle in the light sphalerite. This zone has been fully analyzed in high-resolution SEM images to try to find GeO2 inclusions. Some SEM images are presented in Figure 8. The location of SEM images is reported with the letters a, b, c, d, e, and f.

Acknowledgments

This research project was funded by an inter-CARNOT grant (CARNOT ICEEL and BRGM). We acknowledge the European Synchrotron Radiation Facility for the beamtime and access to their installation. We thank the FAME team for their help in preparing the experiment, their support during beamtime, and training in data processing, and we are grateful to ID26 for the loan of analyser crystals. The Royal Museum for Central Africa in Tervuren, Belgium, is thanked for providing the Renierite sample. We also acknowledge Isabelle Bihannic of the LIEC laboratory (UMR 7360, Université de Lorraine) for XRD support, and Peiffert Chantal of the GeoRessources laboratory (UMR 7359, Université de Lorraine) for the LA-ICP-MS analyses. We express gratitude to the reviewers and editors for their time spent helping us improve this study.

Author Contributions

The paper was written by Julien Bonnet and Jean Cauzid; Denis Testemale, Isabelle Kieffer, and Olivier Proux conceived and designed the X-ray absorption experiments; Julien Bonnet, Jean Cauzid, Denis Testemale, Isabelle Kieffer, and Olivier Proux performed the X-ray absorption analyses; Julien Bonnet, Jean Cauzid, Denis Testemale, Isabelle Kieffer, Olivier Proux, and Laurent Bailly analysed the data; Andreï Lecomte performed the SEM analyses.

Conflicts of Interest

The authors declare no conflict of interest. The founding sponsors had no role in the design of the study; in the collection, analyses, or interpretation of data; in the writing of the manuscript, and in the decision to publish the results.

References

  1. Butterman, W.C.; Jorgenson, J.D. Mineral Commodity Profiles: Germanium; USGS Open-File Report 2004-1218; USGS: Washington, DC, USA, 2015. Available online: https://pubs.er.usgs.gov/publication/ofr20041218 (accessed on 9 May 2017).
  2. Guberman, D.E. Germanium in 2014 Minerals Yearbook; USGS Open-File Report; USGS: Washington, DC, USA, 2014. Available online: https://minerals.usgs.gov/minerals/pubs/commodity/germanium/myb1-2014-germa.pdf (accessed on 9 May 2017).
  3. Bernstein, L.R. Germanium geochemistry and mineralogy. Geochim. Cosmochim. Acta 1985, 49, 2409–2422. [Google Scholar] [CrossRef]
  4. Cook, N.J.; Ciobanu, C.L.; Pring, A.; Skinner, W.; Shimizu, M.; Danyushevsky, L.; Saini-Eidukat, B.; Melcher, F. Trace and minor elements in sphalerite: A LA-ICPMS study. Geochim. Cosmochim. Acta 2009, 73, 4761–4791. [Google Scholar] [CrossRef]
  5. Ye, L.; Cook, N.J.; Ciobanu, C.L.; Yuping, L.; Qian, Z.; Tiegeng, L.; Wei, G.; Yulong, Y.; Danyushevskiy, L. Trace and minor elements in sphalerite from base metal deposits in South China: A LA-ICPMS study. Ore Geol. Rev. 2011, 39, 188–217. [Google Scholar] [CrossRef]
  6. George, L.L.; Cook, N.J.; Ciobanu, C.L. Partitioning of trace elements in co-crystallized sphalerite–galena–chalcopyrite hydrothermal ores. Ore Geol. Rev. 2016, 77, 97–116. [Google Scholar] [CrossRef]
  7. Höll, R.; Kling, M.; Schroll, E. Metallogenesis of germanium—A review. Ore Geol. Rev. 2007, 30, 145–180. [Google Scholar] [CrossRef]
  8. Cook, N.J.; Ciobanu, C.L.; Brugger, J.; Etschmann, B.; Howard, D.L.; De Jonge, M.D.; Ryan, C.; Paterson, D. Determination of the oxidation state of Cu in substituted Cu-In-Fe-bearing sphalerite via μ-XANES spectroscopy. Am. Miner. 2012, 97, 476–479. [Google Scholar] [CrossRef]
  9. Beaudoin, G. Acicular sphalerite enriched in Ag, Sb, and Cu embedded within color-banded sphalerite from the Kokanee Range, British Columbia, Canada. Can. Miner. 2000, 38, 1387–1398. [Google Scholar] [CrossRef]
  10. Benedetto, F.D.; Bernardini, G.P.; Costagliola, P.; Plant, D.; Vaughan, D.J. Compositional zoning in sphalerite crystals. Am. Miner. 2005, 90, 1384–1392. [Google Scholar] [CrossRef]
  11. Pfaff, K.; Koenig, A.; Wenzel, T.; Ridley, I.; Hildebrandt, L.H.; Leach, D.L.; Markl, G. Trace and minor element variations and sulfur isotopes in crystalline and colloform ZnS: Incorporation mechanisms and implications for their genesis. Chem. Geol. 2011, 286, 118–134. [Google Scholar] [CrossRef]
  12. Johan, Z. Indium and germanium in the structure of sphalerite: An example of coupled substitution with Copper. Miner. Pet. 1988, 39, 211–229. [Google Scholar] [CrossRef]
  13. Pokrovski, G.S.; Martin, F.; Hazemann, J.-L.; Schott, J. An X-ray absorption fine structure spectroscopy study of germanium-organic ligand complexes in aqueous solution. Chem. Geol. 2000, 163, 151–165. [Google Scholar] [CrossRef]
  14. Valeev, R.G.; Surnin, D.V.; Beltyukov, A.N.; Vetoshkin, V.M.; Kriventsov, V.V.; Zubavichus, Y.V.; Mezentsev, N.A.; Eliseev, A.A. Synthesis and structural study of the ordered germanium nanorod arrays. J. Struct. Chem. 2010, 51, 132–136. [Google Scholar] [CrossRef]
  15. Bowron, D.T.; Newport, R.J.; Rigden, J.S.; Tarbox, E.J.; Oversluizen, M. An X-ray absorption study of doped silicate glass, fibre optic preforms. J. Mater. Sci. 1996, 31, 485–490. [Google Scholar] [CrossRef]
  16. Gurman, S.J. EXAFS studies in materials science. J. Mater. Sci. 1982, 17, 1541–1570. [Google Scholar] [CrossRef]
  17. Matsubara, E.; Harada, K.; Waseda, Y.; Inoue, A.; Bizen, Y.; Masumoto, T. X-ray diffraction study of an amorphous Al60Ge30Ni10 alloy. J. Mater. Sci. 1988, 23, 3485–3489. [Google Scholar] [CrossRef]
  18. Bernstein, L.R.; Waychunas, G.A. Germanium crystal chemistry in hematite and goethite from the Apex Mine, Utah, and some new data on germanium in aqueous solution and in stottite. Geochim. Cosmochim. Acta 1987, 51, 623–630. [Google Scholar] [CrossRef]
  19. Etschmann, B.; Liu, W.; Li, K.; Dai, S.; Reith, F.; Falconer, D.; Kerr, G.; Paterson, D.; Howard, D.; Kappen, P.; et al. Enrichment of germanium and associated arsenic and tungsten in coal and roll-front U deposits. Chem. Geol. 2017, in press. [Google Scholar] [CrossRef]
  20. Cook, N.J.; Etschmann, B.; Ciobanu, C.L.; Geraki, K.; Howard, D.L.; Williams, T.; Rae, N.; Pring, A.; Chen, G.; Johannessen, B. Distribution and substitution mechanism of Ge in a Ge-(Fe)-bearing sphalerite. Minerals 2015, 5, 117–132. [Google Scholar] [CrossRef]
  21. Belissont, R.; Muñoz, M.; Boiron, M.-C.; Luais, B.; Mathon, O. Distribution and oxidation state of Ge, Cu and Fe in sphalerite by μ-XRF and K-edge μ-XANES: Insights into Ge incorporation, partitioning and isotopic fractionation. Geochim. Cosmochim. Acta 2016, 177, 298–314. [Google Scholar] [CrossRef]
  22. Frenzel, M.; Hirsch, T.; Gutzmer, J. Gallium, germanium, indium, and other trace and minor elements in sphalerite as a function of deposit type—A meta-analysis. Ore Geol. Rev. 2016, 76, 52–78. [Google Scholar] [CrossRef]
  23. Pugsley, A.J.; Bull, C.L.; Sella, A.; Sankar, G.; McMillan, P.F. XAS/EXAFS studies of Ge nanoparticles produced by reaction between Mg2Ge and GeCl4. J. Solid State Chem. 2011, 184, 2345–2352. [Google Scholar] [CrossRef]
  24. Bernstein, L.R.; Reichel, D.G.; Merlino, S. Renierite crystal structure refined from Rietveld analysis of powder neutron-diffraction data. Am. Miner. 1989, 74, 1177–1181. [Google Scholar]
  25. Bonnet, J.; Mosser-Ruck, R.; Caumon, M.-C.; Rouer, O.; Andre-Mayer, A.-S.; Cauzid, J.; Peiffert, C. Trace element distribution (Cu, Ga, Ge, Cd and Fe) in sphalerite from the Tennessee MVT deposits, USA, by combined EMPA, LA-ICP-MS, Raman spectroscopy and crystallography. Can. Miner. (accepted).
  26. Ravel, B.; Newville, M. ATHENA, ARTEMIS, HEPHAESTUS: Data analysis for X-ray absorption spectroscopy using IFEFFIT. J. Synchrotron Radiat. 2005, 12, 537–541. [Google Scholar] [CrossRef] [PubMed]
  27. Newville, M. IFEFFIT: Interactive XAFS analysis and FEFF fitting. J. Synchrotron Radiat. 2001, 8, 322–324. [Google Scholar] [CrossRef] [PubMed]
  28. Newville, M.; Līviņš, P.; Yacoby, Y.; Rehr, J.J.; Stern, E.A. Near-edge X-ray-absorption fine structure of Pb: A comparison of theory and experiment. Phys. Rev. 1993, 47, 14126–14131. [Google Scholar] [CrossRef]
  29. Proux, O.; Biquard, X.; Lahera, E.; Menthonnex, J.-J.; Prat, A.; Ulrich, O.; Soldo, Y.; Trévisson, P.; Kapoujyan, G.; Perroux, G.; et al. FAME: A new beamline for X-ray absorption investigations of very-diluted systems of environmental, material and biological interests. Phys. Scr. 2005, 2005, 970. [Google Scholar] [CrossRef]
  30. Proux, O.; Nassif, V.; Prat, A.; Ulrich, O.; Lahera, E.; Biquard, X.; Menthonnex, J.J.; Hazemann, J.L. Feedback system of a liquid-nitrogen-cooled double-crystal monochromator: Design and performances. J. Synchrotron Radiat. 2006, 13, 59–68. [Google Scholar] [CrossRef] [PubMed]
  31. Hazemann, J.L.; Proux, O.; Nassif, V.; Palancher, H.; Lahera, E.; Da Silva, C.; Braillard, A.; Testemale, D.; Diot, M.A.; Alliot, I.; et al. High-resolution spectroscopy on an X-ray absorption beamline. J. Synchrotron Radiat. 2009, 16, 283–292. [Google Scholar] [CrossRef] [PubMed]
  32. Llorens, I.; Lahera, E.; Delnet, W.; Proux, O.; Braillard, A.; Hazemann, J.-L.; Prat, A.; Testemale, D.; Dermigny, Q.; Gelebart, F.; et al. High energy resolution five-crystal spectrometer for high quality fluorescence and absorption measurements on an X-ray absorption spectroscopy beamline. Rev. Sci. Instrum. 2012, 83, 063104. [Google Scholar] [CrossRef] [PubMed]
  33. Johan, Z.; Oudin, E.; Picot, P. Analogues germanifères et gallifères des silicates et oxydes dans les gisements de zinc des Pyrénées centrales, France; argutite et carboirite, deux nouvelles espèces minérales. Tschermaks Mineral. Petrogr. Mitt. 1983, 31, 97–119. [Google Scholar] [CrossRef]
  34. Gratz, J.F.; Misra, K.C. Fluid inclusion study of the Gordonsville zinc deposit, central Tennessee. Econ. Geol. 1987, 82, 1790–1804. [Google Scholar] [CrossRef]
  35. Murray, W.T.; O’hare, P.A.G. Thermochemistry of inorganic sulfur compounds. II: Standard enthalpy of formation of germanium disulfide. J. Chem. Thermodyn. 1984, 16, 335–341. [Google Scholar] [CrossRef]
  36. Robie, R.A.; Hemingway, B.S. Thermodynamic Properties of Minerals and Related Substances at 298.15 K and 1 Bar (10^5 Pascals) Pressure and at Higher Temperatures; U.S. Geological Survey Bulletin; U.S. GPO: Washington, DC, USA, 1995.
Figure 1. Ge K-edge for different germanium compounds (adapted from [23]).
Minerals 07 00079 g001
Figure 2. Sphalerite samples from Tennessee mines (YS: Yellow sphalerite; BS: Brown sphalerite). (A) Reddish-brown sphalerite from Central Tennessee; (B) Polished section of sphalerite from CT with dark (DCT) and light (LCT) banding; (C) Yellow sphalerite from East Tennessee (YET); (D) Polished section of Yellow sphalerite from ET; (E) Brown sphalerite (BET) with yellow sphalerite from East Tennessee; (F) Polished section of brown sphalerite from ET.
Minerals 07 00079 g002
Figure 3. Standard experimental spectra compared to the XANES calculations, performed to verify the main peak position of each standard. Dotted lines indicate the position of the main peaks and solid lines indicate the position of the edge. (A) Ge metal spectra; (B) Renierite spectra; (C) GeO2 spectra and (D) GeI2 spectra.
Minerals 07 00079 g003
Figure 4. Experimental spectra of standards GeO2, renierite, GeI2, and Ge. In this study, spectra were identified using the position of the white line instead of using the edge of the spectra, because, in the samples, GeI2 displays three peaks due to its partial oxidation to GeI4. The measured and calculated positions for peak values are similar and are 11,106.5 eV for Ge metal, 11,109 eV for renierite, and 11,112 eV for GeO2. Concerning GeI2, three peaks are visible due to GeI2 oxidation: 11,107.5 eV corresponds to GeI2, and 11,108.5 eV corresponds to GeI4 (Ge4+ in coordination with four I atoms of electronegativity close to that of sulphur). The last peak on the experimental GeI2 spectrum falls at the same energy as that of GeO2 (11,112 eV).
Minerals 07 00079 g004
Figure 5. Spectra of the three end members found in the sphalerites samples. Sph1 with a peak at 11,107.5 eV; Sph2 with a peak at 11,109 eV; and Sph3 with a peak at 11,112 eV. All the other spectra measured on natural sphalerite from East and Central Tennessee can be modelled by a linear combination of Sph1, Sph2, and Sph3.
Minerals 07 00079 g005
Figure 6. Ternary diagram for germanium configuration in samples from central Tennessee.
Minerals 07 00079 g006
Figure 7. Ternary diagram for germanium configuration in samples from east Tennessee.
Minerals 07 00079 g007
Figure 8. HD-SEM images of sample CY3068-C3, where the end members at 11,112 eV have been found. The images show no included minerals. (ad) SEM images of area of 11,112 eV end members and (e,f) SEM images of fractured zones near the area where the peak at 11,112 eV was measured. The bright white point on the top-left image is an artefact due to metallization and the white edges on the bottom images are the contribution of topographical effects. The images at the top and middle left present zoning with dark and light bands. As analyses by LA-ICP-MS revealed no significant variation in composition, this is interpreted as a structural artefact. BSE images using an FEG-SEM showed no visible inclusion, regardless of the position or size of the area. The FEG-SEM was equipped with WDS that could not detect any Ge in these samples. Detection limits are expected to be comparable to EPMA. The white borders on the two bottom photos are due to charging effects on the grain margins.
Minerals 07 00079 g008aMinerals 07 00079 g008b
Figure 9. Diagram of Log S2 versus Log O2 for germanium species at 400 K, adapted from [3].
Minerals 07 00079 g009
Table 1. Average trace element contents in sphalerites from Central and East Tennessee (analysis by LA-ICP-MS) (% Atomic for Zn and S and ppm for the others).
DistrictSphaleriteStatisticsZn (%)S (%)Fe (ppm)Cu (ppm)Ga (ppm)Ge (ppm)Cd (ppm)
East TNYET
n = 91
Average49.050.77347994111565
Max49.251.14043953801483531
Min48.850.2163000267
BET
n = 27
Average49.549.2961318891312820
Max50.150.330400520883577367
Min49.146.7416237<4<7882
Central TNLCT
n = 35
Average49.150.318994708071821867
Max49.550.9360797927876124996
Min48.949.7773611179447
BCT
n = 55
Average49.150.512525867653811306
Max49.350.92404144145367903153
Min48.950.0701824<7493

