
The Hydrothermal Fluid Evolution of Vein Sets at the Pipeline Gold Mine, Nevada

1
Department Earth and Environmental Science, New Mexico Institute of Mining and Technology, 801 Leroy Place, Socorro, NM 87801, USA
2
Department Earth Sciences, Brock University, 1812 Sir Isaac Brock Way, St Catharines, ON L2S 3A1, Canada
*
Author to whom correspondence should be addressed.
Minerals 2017, 7(6), 100; https://doi.org/10.3390/min7060100
Submission received: 9 May 2017
/
Revised: 7 June 2017
/
Accepted: 9 June 2017
/
Published: 13 June 2017
(This article belongs to the Special Issue Fluid Inclusions: Study Methods, Applications and Case Histories)
Abstract
:The origin of sediment-hosted Nevada gold deposits has been highly debated, especially regarding the relative contribution of multiple mineralizing events, particularly relating to the Cretaceous. We examined the Pipeline gold mine in north-central Nevada, focusing on data from the four vein sets in this atypical deposit where there is evidence for Cretaceous gold mineralization. Only the third, a quartz-sericite-pyrite-calcite vein set, has any link with the alteration styles and gold mineralization within the Pipeline deposit. Our geochemical results from fluid inclusion microthermometry and gas analysis show that the fluids from which quartz deposited were sourced from condensing magmatic volatiles and were trapped at ~300 °C and 2 kbar lithostatic pressure (~8 km). 40Ar/39Ar dating of sericite demonstrates that the quartz-sericite-pyrite veins formed at ~92 Ma, matching the dates of gold-associated epigenetic illite. Ore fluids enriched in CO2 and H2S caused decarbonation thereby releasing Fe2+ that reacted with H2S to form pyrite. Decreasing H2S destabilized gold bisulfide complexes and deposited gold. We conclude that this process can occur in a single Cretaceous event in advance of potential Tertiary mineralization.
1. Introduction
The Pipeline deposit is an atypical sediment-hosted gold deposit in north-central Nevada (Figure 1). It is located along the Battle Mountain/Eureka trend near the historic town of Tenabo and the Cortez Hills, Gold Acres, Cortez, Horse Canyon and Robertson gold mines. Discovery of Pipeline in 1991 beneath alluvium resulted in the development of a world-class gold mine that, during the years 1994 to 2006, yielded 8,850,000 oz gold at an average mill grade >0.10 oz/ton. To date >11 mil oz gold has been produced.
A single genetic model that describes all sediment-hosted gold ore deposits in Nevada is elusive owing to conflicting ideas and data on mineral paragenesis, timing of mineralization, ore fluid temperature, pressure, and fluid chemistry [2,3,4,5,6,7,8,9]. Pipeline shares similarities with other north-central Nevada gold deposits as a group but also some differences. Similarities include: gold mineralization hosted by altered carbonate rocks; localized total decalcification; high Au/Ag ratios; sub-micron sized gold in oxidized ores; strong structural control; and location along a regional trend [10]. The differences are largely the strong relationship of shear zones to mineralization, lack of arsenian pyrite and the Cretaceous age dates.
Four vein sets are spatially associated with the Pipeline deposit: early dark calcite veins, white calcite stockwork veins, coarse quartz-sericite-pyrite-gold veins, and vuggy calcite veins. Based on cross-cutting relationships, the first two sets predate the main phase of gold mineralization, and the fourth set distinctly postdates it. However, we argue that the coarse quartz-sericite-pyrite-gold veins, the paragenetically third set, at least contributed to the gold budget at Pipeline and may be related to the main phase of mineralization. Our objectives are to constrain the physical conditions and fluid chemistry related to this vein set, identify the fluid sources associated with each vein set, and using data from fluid inclusion gases test if gold mineralization can occur through interaction between fluid and the host carbonate rocks at the Pipeline mine. In addition, we aim to test the hypothesis that it is plausible for gold mineralization to occur in one event, and does not require a ground preparation event. Much of the deposit has undergone extreme alteration in addition to later oxidation but we focus on the un-oxidized veins mostly underlying the deposit that potentially could have introduced the gold-bearing ore fluids. Field studies and sample collection were performed during three field seasons from 1996 to 1998 and the sample numbers and drill hole locations are presented in Supplementary Table S1. Our approach was to first establish the vein paragenesis, and where applicable, the mineral paragenesis. Vein fluid geochemistry is constrained by fluid inclusion microthermometry and gas analysis. Fluid sources are inferred on the basis of fluid inclusion gas ratios and stable isotope data.
We show that Pipeline vein conditions changed through time. Only one vein set shares any alteration styles and mineralogy with the mineralized ore body and this vein set formed at ~92 Ma with pressure-temperature (PT) conditions about 300 °C and 2 kbar. Fluid inclusion gas analysis confirms that fluids were sourced from condensing magmatic volatiles into evolved crustal brines during plutonism. The Cretaceous timing differs from most other Nevada gold deposits during the mid to late Eocene but is consistent with alteration or gold mineralization reported from some sediment-hosted gold deposits in Nevada, for example Getchell, Mike and Twin Creeks [11,12,13].
1.1. Regional Geologic Setting
The stratigraphic sequence in central Nevada comprises both shelf and deeper marine sediments. Thrusting has brought these time-equivalent sediments that were once spatially separated on the continental shelf into close proximity. Stratigraphic order in the Pipeline area (Figure 2) is described as the Lower Plate rocks followed by the Upper Plate rocks. The oldest lower-plate unit in the area is the Middle Cambrian Hamburg Dolomite, followed unconformably by the Ordovician Eureka Quartzite that is conformably overlain by the dolomitic Ordovician Hanson Creek Formation [14,15]. The Silurian Roberts Mountains Formation (SRM) conformably overlies the Hanson Creek Formation. A gradational boundary separates the SRM and the overlying Lower Devonian Wenban Formation [14,15], and both the Upper SRM and lower Wenban are mineralized. Upper plate rocks comprise the Ordovician Valmy Formation, the Silurian Elder Sandstone and the Devonian Slaven Chert [14,15].
Eastward directed compressional tectonism during the late Devonian through middle Mississippian Antler orogeny resulted in regional-scale, north-south folding and imbricate thrusting of the deep marine rocks [16]. In the Pipeline area, Leonardson (2011) [17] describes duplexing during this period. The region experienced additional compressional tectonism during the late Pennsylvanian through Permian Humboldt orogeny, and finally the early Cretaceous Sevier orogeny [10]. The Crescent Valley reconstruction model [1] indicates that NNW-trending faulting likely predates the Mesozoic stocks with reactivation of this fault set postdating the Mill Canyon intrusion (RC Hays, personal communication, 2004). Basin-and-Range faulting in the Cortez area occurred around 16 Ma [18,19]. NE-trending faults are observed but their timing is not constrained. For a recent and comprehensive description of the structural history affecting the north-central Nevada region see Rhys et al. (2015) [20].
Pipeline is located near the eastern flank of the Shoshone Range in Lander County, Nevada. Mining activities in the Pipeline district began in 1862 with the discovery of silver at Cortez and Mill Canyon areas [21]. Mining activities at Gold Acres deposit began in 1935 and has produced >500,000 troy oz of gold [21]. Placer Dome U.S., formerly known as American Exploration and Mining Co. (AMEX), began exploration within the Cortez district in 1959, which led to the discovery of the Cortez Gold deposit that started production in 1969 [21]. The discovery in 1991 of the Pipeline deposit beneath thin alluvium resulted from condemnation drilling for Gold Acres heap leach pads (RC Hays, personal communication 1996) [21]. In 2006 Placer Dome was acquired by Barrick and has become the operator for Pipeline and the former Cortez Joint Venture, now that Barrick bought Kennecott’s share of the CJV.
The main Pipeline ore zone is 150 to 180 m below the surface (Figure 3), varies in thickness from 15 to 105 m, is tabular in shape, and dips at a low angle to the east. This zone measures about 760 m by about 460 m and is elongated in the northerly direction, controlled by a low-angle duplex/shear zone regarded as a zone of imbricate thrusting subparallel to and beneath the Roberts Mountains Thrust [21] as well as a possible asymmetrical overturned fold. The Upper Devonian Horse Canyon Formation is exposed in parts of the mine, and is not altered. Covering the deposit is about 15 to 50 m of Tertiary-Quaternary gravel which increases in thickness to >2 km towards the east.
1.2. Local Geologic Setting
1.2.1. Alteration
The alteration styles characteristic of the Pipeline deposit are worthy of mention because one vein set shares some common alteration styles with those encountered in the ore zone. Like many other gold deposits in Nevada, Pipeline exhibits decalcification, argillization, Fe-enrichment and silicification. Decalcification, or the removal of calcite from limestone, is common. In shear zones total decalcification has led to carbonate being removed from the host units leaving residual clay, silt, carbon, and Fe-bearing minerals. Thus, decalcification can lead to argillization. All clay that was analyzed by XRD is confirmed as 2M1 polytype illite. A second type of argillization, which is distinctively off-white, occurs locally within the pit and is invariably associated with high gold values. Cross-cutting relationships suggest that this off-white clay material is epigenetic. Silicification is localized within the ore zone and is most intense “above steeply dipping structures” (RC Hays, personal communication, 2004). Observations made on thin sections and polished surfaces show that open-space filling by quartz occurs. Sulfidation, although seen associated with quartz-sericite-pyrite-calcite (qsp-calcite) veins below the deposit, is inferred on the basis of Fe enrichment in shear zones. The upper ore zone is oxidized and the oxidation halo can extend to 300 m below the current land surface. Within this zone, evidence for earlier sulfidation is obliterated by the pseudomorph replacement of sulfide to Fe-oxide in the form of hematite and goethite.
1.2.2. Gold Mineralization
The timing of gold mineralization at Pipeline is by no means perfectly constrained, in part due to the oxidation event that destroyed much evidence provided by sulfide minerals. We present what we know and constrain the timing of vein-related gold mineralization by deduction. Debate will no doubt continue but we ask the reader to keep to the evidence for this non-typical Nevada sediment-hosted gold deposit.
Samples from all vein sets were collected from drill core and assayed by the fire assay-AA method; no gold was detected in the calcite veins. Neutron activation of quartz crystals separated from qsp-calcite veins indicates gold in quartz crystals is <2 ppb. Since the hydrothermal veins contain negligible gold, where is the gold located? Neutron activation gold assay of sulfidized qsp-calcite vein selvages gave values from 0.36 to 0.84 ppm Au, values that are nevertheless lower than the average 3 g/t from the deposit. Assays of wall rock beyond the qsp-calcite selvages showed gold content below the fire assay detection limit.
Gold-bearing vein selvages were studied by electron microprobe. No arsenic coatings were detected to occur on pyrite grains which differs from Eocene mineralization along the Carlin trend. Gold was not detected within pyrite; however, the instrumental gold detection limit is 250 ppm.
In the pit, there is a strong correlation between gold values and silicification above where the qsp veins intersect the ore zones (R.C. Hays, personal communication) in addition to gold correlating with total decalcification and the presence of epigenetic illite (samples NB-20 and NB-59 are up to 20 ppm gold).
As gold is not associated with the other vein sets, and only the qsp veins are associated with the classic alteration styles such as decarbonation, argillization, and silicification, by deduction we propose that the qsp veins are associated with a gold-bearing event. Later in this paper we will see how the fluid chemistry associated with the quartz supports this deduction and how gold deposition can occur by wall-rock interaction to support the genetic model.
1.2.3. Vein Paragenesis
Paragenetic relationships at the Pipeline mine are determined from drill cores and field observations. A protracted series of events that occurred between the Mississippian and present have culminated in the presently complex geology and geochemistry of the Pipeline deposit. Four vein sets are identified and are described in the sequence in which they formed.
Dark calcite veins (Figure 4a) are the first vein event because they are crosscut by all other veinsets. They show no relationship with horizontal faulting. Deformation of dark calcite, and lack of deformation in later veins indicates that they were most likely emplaced concurrently with or before the Antler orogeny.
White calcite stockworks (Figure 4b) are the second vein event because they cut the dark calcite veins and in turn are cut by both the qsp-calcite veins and the vuggy calcite veins. Lack of white calcite veins in the ore zone, even though they comprise a significant percentage of the host units, is interpreted as removal due to decalcification, hence these veins predate the decalcification event.
Qsp-calcite veins crosscut the white and dark calcite veins and are themselves crosscut by vuggy calcite veins. In thin section and hand specimen the qsp-calcite veins show the paragenetic sequence of coarse-grained sericite, quartz and pyrite, followed by calcite which fills open space (Figure 4c). The mineralogy of quartz, sericite and pyrite found within the early development of these veins is similar to the epigenetic mineralogy found within the ore body. The most logical sequence of events in the vein selvage is decalcification, which opened permeability for later fluids, followed by sulfidation and silicification. All vein selvages that we analyzed contained gold. These qsp-calcite veins have much less As-, Sb- or Hg-bearing minerals than reported from other Nevada gold deposits [22,23] and hence could offer a unique insight into Nevada gold mineralization.
Vuggy calcite veins (Figure 4b,d) cut all other types of veins as well as the ore body, hence are the last known vein event. The dip of the sediment within these vugs is 10°–15° from horizontal indicating that late vuggy calcite veins predate Basin-and-Range extension and tilting in Crescent Valley.
No intrusive bodies occur in the Pipeline deposit that might otherwise have helped to improve upon the vein paragenesis and timing. However, approximately 2 miles to the west is the Gold Acres pit where drilling within the pit intersected a 103.8 Ma [24] quartz-monzonite pluton referred to as the Gold Acres stock.
2. Materials and Methods
Fluid inclusion microthermometry was performed on 100–300 μm doubly-polished thick sections using a Linkam TH600 heating-freezing stage (Linkam Scientific, Surrey, UK). The instrument calibration is checked daily using a H2O standard, and each week the calibration is checked using at least three standards. The analytical error in melting-point determinations near 0 °C is 0.1 °C; error in Th measurements performed at 200 °C is 0.5 °C. Microthermometry measurements are presented in Supplementary Table S2.
Fluid inclusion volatile analysis was done in vacuum using the CFS (crush-fast scan) method [25,26]. Fluid inclusion thick sections were checked for secondary fluid inclusion trails and only samples lacking secondary trails were selected for gas analysis. Samples of about 0.1 gram were crushed incrementally under a vacuum of <10−7 Torr and the analysis performed by means of a Balzers QME125 quadrupole mass spectrometer operating in fast-scan, peaking-hopping mode. The amount of each species is calculated by a combination of peak-stripping and matrix-inversion methods. The instrument was calibrated with Scott Gas standard gas mixtures (2% uncertainty), synthetic inclusions filled with gas mixtures, and three in-house fluid inclusion gas standards (HF-1 see [26]; Snowbird quartz see [27], and; NB-84 see [28]) [26,27,28]. Precision is better than 5 percent for major gaseous species and 0.2 percent for water/gas ratios. The 3-σ detection limits determined using the formulae of Blamey et al. (2015) [26] are typically ~0.25 ppm. The fluid inclusion gas analyses are presented in Supplementary Table S3 and individual crushes representative of each vein set is reported in Table 1.
Stable isotopes in calcite, quartz and pyrite were analyzed. Calcite carbon and oxygen stable isotope analyses were performed at New Mexico Tech. Samples are reacted overnight with phosphoric acid and the produced CO2 is analyzed on a Finnigan MAT δE using Oztech gas standards. Fluid inclusions hosted in quartz were analyzed with a Finnigan MAT TC/EA carbon reduction furnace. Chips of quartz were dropped into the furnace where water was liberated by thermal decrepitation at 1450 °C and converted to H2 and CO. The H2 was analyzed in continuous flow mode with a Finnigan Delta + XP at New Mexico Tech. Quartz δ18O analyses were performed at the University of Arizona. Pyrite was analyzed at Memorial University of Newfoundland for δ34S.
The 40Ar/39Ar geochronology was performed at the New Mexico Geochronology Research Laboratory. All isotopic data were measured with a MAP-215-50 mass spectrometer. The evacuated vials were irradiated at the University of Michigan Ford reactor together with blank vials and neutron fluence gradients were monitored with Fish Canyon (FC-2) sanidine. Furnace step-heating was performed in addition to in vacuo encapsulation to evaluate recoil during neutron irradiation. See Supplementary Table S4 for further information.
3. Results
3.1. Fluid Inclusion Classification and Analysis
Two main fluid inclusion types are recognized (Figure 5). Type 1 inclusions have liquid and vapor with liquid dominating. These are subdivided into Type 1a inclusions that do not exhibit clathrate-melting behavior, Type 1b that exhibit clathrate-melting behavior, and Type 1c that exhibit clathrate-melting behavior and have visible liquid CO2 around the vapor bubble. Type 2 inclusions have two liquids (carbonic and aqueous) at room temperature (or when cooled) with the carbonic phases comprising at least 50 percent by volume. All inclusions homogenize to liquid when heated.
3.2. Microthermometry
Dark calcite inclusions: The dark calcite contains primary and secondary, 5 to 10 μm, Type 1a and 1b inclusions that are about 98 percent water filled. Type 1a inclusion homogenization temperatures (Th) vary from 142 °C to 152 °C with one outlier value of 124 °C. Ice melting temperatures (Tmice) are between −0.4 °C and −1.2 °C; calculated salinity ranges from 0.7 to 2.2 wt % NaCl equivalent using MACFLINCOR [29]. Type 1b inclusions have Tmcl (clathrate-melting temperature) from +1 °C to +23.2 °C. The salinity of clathrate-bearing inclusion liquids cannot be accurately determined because clathrate-melting temperatures above +10.7 °C indicate methane clathrate, and clathrate-melting temperatures above +16 °C suggest complex clathrates involving heavier hydrocarbon species [30]. High concentrations of methane and higher hydrocarbon compounds were confirmed by gas analyses [31]. There is no experimental data to interpret the hydrocarbon-CO2-NaCl clathrate-melting behavior.
White calcite inclusions: White calcite veins are host to abundant primary Type 2 fluid inclusions that consist of about equal proportions by volume of aqueous and carbonic phases. Homogenization of CO2-liquid and vapor (ThCO2) to liquid occurs between +23.2 °C and +25.5 °C which corresponds to a CO2 density range of 0.72 to 0.75. When heated, inclusions start to decrepitate at 200 °C. All inclusions decrepitated below 276 °C, before total homogenization occurred. Measurement of Tmcl varied from +9.6 °C to +11.5 °C. Gas analysis presented elsewhere indicates white calcite inclusion fluids have low concentrations of methane. The Tmcl slightly above that of pure CO2 can be attributed to either clathrate metastability or high pressure [30]. The stability of CO2 clathrate is extended to higher temperatures as the partial pressure of CO2 increases (R Bakker, personal communication, 2000). Fluid inclusion salinity of about 0.8 wt % NaCl equivalent is estimated assuming CO2-clathrate melting.
Quartz-sericite-pyrite-calcite vein inclusions: Inclusions were studied in vein quartz and calcite, and in silicified material from the Pipeline ore body. Both vein quartz and silicified material from the pit have identical fluid inclusion assemblages and are therefore grouped together. Quartz is host to primary (Figure 6) Type 1a, 1b, and sparse Type 1c and 2 inclusions of 2–20 μm in size. In one quartz crystal that was sectioned perpendicular to the c-axis, there is a progression of Type 1a, 1b and Type 2 fluid inclusions from grain interior to grain margin, indicating an increase in CO2 content with time during growth of that crystal. In other crystals (possibly due to most wafers being sectioned subparallel to the c-axis) no inclusion zoning was noted. Type 1 Th measurements range from 179 °C to 265 °C (Figure 7), Tmice measurements range from −26.0 °C to −3.0 °C, and Tmcl from +4.0 °C to +10.1 °C. Calculated inclusion salinities using MACFLINCOR mostly range from 5 to 10 wt % NaCl equivalent with values as high as 25 wt % NaCl equivalent (Figure 7). Samples that have salinities near 25 wt % NaCl equivalent exhibit eutectic melting of hydrohalite to brine at temperatures of −21.1 °C to −26.0 °C. There is no hydrohalite to ice transition. Type 1c inclusion generally have high Th values that average 276 °C compared to a combined Type 1a and 1b inclusion average Th of 202.4 °C (Figure 7). Bulk crush leach analyses confirm measureable calcium as the dominant divalent cation [31], whereas magnesium was below detection within inclusions. Assuming that the potassium contribution can be added to the Na budget, then the Ca/Na ratio of the hypersaline inclusions is determined by the transition temperature of hydrohalite to ice [32]. The range of calculated Ca/Na ratios for these hypersaline inclusions is 0.8:1 to 1.4:1.
Type 1b inclusions exhibit clathrate melting behavior with Tmcl around +7 °C. The calculated salinities from Tmice and Tmcl measurements are about 7 wt % NaCl equivalent.
In Type 1c inclusions, liquid-CO2 and vapor homogenize to liquid, and ThCO2 ranges from +13 °C to +23 °C. A general, increase in ThTotal values is observed for Type 1c inclusions compared to Type 1a and 1b Th values; the highest Th measured is 265 °C.
Type 2 inclusions are sparse and vary from 3 to 20 μm in size. The carbonic phase in Type 2 inclusions melts at about −57.6 °C to −59.7 °C and corresponds to 6 to 20 mol % CH4 in the carbonic phase [32]. Measured Tmcl for the minor aqueous phase range from +7.2 °C to +8.5 °C; homogenization to liquid of the liquid and vapor CO2 phases was measured at +15.8 °C to +23.4 °C which corresponds to a CO2 density range of 0.69 to 0.82 (using [32]). Total homogenization of Type 2 inclusions range from 295 °C to 323 °C (Figure 7). Few of these measurements were made because inclusions typically decrepitated before Th was attained.
Calcite from qsp-calcite veins are host to primary (Figure 6) Type 1a fluid inclusions. Inclusion size is commonly submicron but sizes range to a maximum of 8 µm. Secondary inclusions are not observed. Calcite Tmice measurements range from −1.8 °C to −2.0 °C and Th values range from 219 °C to 235 °C. Calculated salinities are 3.0 to 3.3 wt % NaCl equivalent.
3.3. Fluid Inclusion Gas Chemistry
Early dark and white calcite: Gas analyses were performed on three samples of dark calcite and one sample of white calcite. Gaseous species comprise 0.2 to 2.3 mol % in dark calcite inclusions. Significant methane is present and the amount of C2-C6 hydrocarbon compounds is higher than in inclusions from other stages. Some of the organic species we measured could reside in the small hydrocarbon inclusions. The mass spectrometry system is not calibrated for C7 and above organic compounds that occur as liquids, hence no attempt was made to analyze those compounds. White calcite analyses indicate inclusions contain 25 to 37 mol % CO2 and 0.0009 to 0.0017 mol % H2S. White calcite gas analyses show little variability compared to other vein types. On a CO2/CH4–N2/Ar diagram (Figure 8), dark calcite inclusions plot in the meteoric and evolved organic fields, whereas white calcite analyses plot in a narrow range on the boundary of the meteoric and magmatic fields. The gas analyses confirm fluid inclusion petrography and microthermometry analysis that indicates dark calcite fluids have high concentrations of hydrocarbon compounds and white calcite inclusions have roughly equal amounts of CO2 and water.
Quartz-sericite-pyrite-calcite veins: Eight samples of quartz and 4 samples of calcite from the qsp-calcite veins were analyzed yielding 89 inorganic sample analyses and 25 organic sample analyses. Quartz inclusion analyses show gaseous species ranging from 0.54 to 13.21 mol %. The H2S content is highly variable ranging from 0.00001 to 0.03 mol % and CO2 ranges from 0.22 to 11.3 mol %. The remaining species show little variation. Quartz-hosted inclusion analyses on a CO2/CH4–N2/Ar diagram (Figure 9a) show that the quartz fluids are distinctly different than dark and white calcite analyses; silicification quartz and vein quartz inclusions have similar gas chemistry and analyses plot in the magmatic field. The silicification quartz and vein quartz gas data plotted on the N2–Ar–He discrimination diagram plot partly in the calc-alkaline magmatic field but extend further to the right and downward which does not match the meteoric field (Figure 9b). CO2 and CH4 are not coupled although CO2 and H2S correlate. Analyses plotted on a CO2/N2 versus total inclusion gas content (Figure 10) show a positive slope typical of condensation [33]. The large range in inclusion CO2 measured by gas analysis agrees with quartz fluid inclusions that range from Type 1a with no apparent to CO2 to Type 1b inclusions with CO2 clathrate-melting behavior and Type 2 inclusions with visible CO2 liquid.
Calcite-hosted fluid inclusions generally have lower concentration of gaseous species and different gas chemistry than quartz-hosted inclusions. Calcite gaseous species mostly range from 0.24 to 1.5 mol %, although a few analyses indicate up to 5 mol %. Calcite CO2/CH4 ratios are similar to those measured in quartz, but the N2/Ar ratios are much lower, although some plot in the magmatic field (Figure 9). There is appreciably less H2S in calcite-hosted inclusions; analyses range from 0.001 to 0.00001 mol % H2S. Calcite analyses show a mixing relationship between a shallow meteoric that has air-saturated water N2/Ar ratios and a composite magmatic-sedimentary volatile source (Figure 9).
Late vuggy calcite: Five samples of late vuggy calcite were analyzed yielding thirty-nine analyses of inorganic species and nine analyses of organic species. The analyses are distinctly different than calcite inclusion analyses (from qsp-calcite veins), and like dark calcite analyses plot in the evolved field on a CO2/CH4–N2/Ar diagram (Figure 8).
3.4. Stable Isotopes
Analyses of 21 samples are reported in Table 2 with their estimated fluid temperatures and δD (fluid inclusion), δ18O, δ13C and δ34S mineral and sample values. The δ18O values of quartz crystals from qsp-calcite veins exhibit a narrow range from +19.0 to +20.6 per mil. The δD values from quartz-hosted fluid inclusions however show a much broader range of −61 to −148 per mil. Pyrite δ34S values range from +4.4 to +6.4 per mil. Overall carbonate δ18O values range from +10 to +24 per mil but the ranges for each stage are largely distinct. The δ13C values for all carbonates range from −5.2 to +1.5 per mil but the positive values are the dark and white calcites whereas the negative values are from the qsp-calcite veins and late vuggy calcites. Temperatures used for fluid calculations for early dark calcite and late vuggy calcite are based on maximum Th measurements and for white calcite are based on the minimum miscibility temperature for equal water-CO2 contents. Temperatures for quartz calculations are based on Type 2 inclusion Ths, and for calcite from qsp-calcite veins from inclusion Ths. The quartz-H2O fractionation is taken from [34], the calcite-H2O fractionation factor from [35], the calcite-HCO3 δ13C fractionation factor from [36], and the pyrite-H2S(a) fractionation factor from [37]. The calculated fluid δ13C and δ18O data are plotted in Figure 11. The quartz fluid δD and δ18O are plotted in Figure 11; the magmatic box and meteoric water line are shown for comparison.
3.5. Geochronology
The only vein material suitable for analysis by the 40Ar/39Ar method was coarse-grained hydrothermal sericite that is part of the qsp-calcite vein paragenesis in sample NB-102. All calcite veins lacked K-bearing minerals and remain undated.
Electron microprobe analysis was performed to verify the purity of this sericite. Results are presented in Table 3 with locations shown in Figure 12. Consistent K/Al ratios occur whereas Si varies. The apparent age spectrum is show in Figure 13 and gives a total gas age of 92.2 ± 0.3 Ma. The individual heating steps do not form a plateau. Instead apparent ages are initially around 115 Ma then begin to decrease until about 82% 39Ar released, followed by a dramatic decrease in the apparent age of the final heating steps.
Epigenetic 2M1 illite associated with high gold values and collected from the pit were analyzed by the 40Ar/39Ar method. X-ray diffraction analysis of NB-20 illite yields a Kubler index of 0.341 and based on the Dong et al. (1995) [38] expression would undergo about 8 percent 39Ar loss due to recoil. We also have a Kubler index for NB-19 of 0.362 that indicates about 9 percent loss of 39Ar according to the Dong et al. (1995) [38] relationship.
4. Discussion
4.1. Microthermometry
Early dark calcite: Dark calcite inclusions have a narrow Th range and relatively low salinity. Multiple fluid inclusion generations are indicated by both ice- and clathrate-melting behavior. Clathrate-melting behavior of some inclusions as high as +23.2 °C confirms CH4 and not CO2 as the clathrate gas and that propane has contributed to gas-hydrate stability [30].
White calcite stockwork: The uniformity in fluid inclusion liquid CO2 to aqueous phase ratio, coupled with consistent clathrate-melting temperature of +9.6 °C to +11.5 °C, and vapor (ThCO2) to liquid of +23.2 °C and +25.5 °C is unusual. We cannot find similar data reported from other deposits in Nevada.
Quartz-sericite-pyrite-calcite veins: Vein quartz and silicification hosted fluid inclusions have calculated salinities that mostly range from 5 to 10 wt % NaCl equivalent in addition to values as high as 25 wt % NaCl equivalent (Figure 7b). The Type 1 (aqueous-dominated) Th range is consistent with most other Th’s reported in Nevada (see Table 4) whereas the Type 2 inclusions (carbonic-dominated) range of 295 °C to 323 °C and appear much higher. From the Chinese “Carlin-type” equivalents, [39] report microthermometry for gold-stage quartz at Bashishan with salinities of 4.3 to 9.3 wt % NaCl equivalent and Th’s that range from 210 to 330 °C. Their Th distribution [39] bears a remarkable similarity to our reported Th’s during quartz deposition and their salinity estimate is also in agreement. However, whereas temperatures reported for many Nevada gold deposits labelled as “Carlin-type” deposits are 180–200 °C, these studies fail to discriminate between Th’s and trapping conditions. Without well-constrained isochors, other studies could potentially be underestimating trapping temperatures or pressures. We therefore address this issue below.
4.2. Temperature, Pressure and Depth
Early dark calcite: Measured dark calcite Ths are approximately 125° above ambient conditions. The average primary fluid inclusions Th of 145.4 °C is the minimum trapping temperature because there is no evidence that fluid trapping occurred at PT conditions where both liquid and vapor were present. If a geothermal gradient of 25 °C/km is assumed, then rock temperature of 150 °C is reached at a depth of ~6 km. This should be considered maximum depths because local geothermal gradients are elevated where there is upward flow of fluids and transient magmatism.
White calcite stockwork: Constraints on the pressure-temperature conditions for white calcite veins are complicated by fluid inclusion decrepitation below 276 °C in these samples. Pressure calculated using MACFLINCOR suggests a minimum Ptotal between 1200 and 1450 bars assuming Th = 276 °C. This pressure corresponds to a minimum depth of 5 km assuming a lithostatic load.
Bulk gas analysis indicates white calcite stockwork fluids are homogeneous, principally a mixture of 74 mol % H2O, 25 mol % CO2 and other minor gases. For H2O and CO2 to be mixed requires a minimum pressure and temperature of 1.5 kbars and 300 °C [40]. Since calcite decrepitated before significant stretching occurred, isochors determined for white calcite inclusions give a minimum pressure of about 1.3 kbar at 276 °C. Homogenization temperature is higher than the decrepitation temperature (most likely above 300 °C), therefore 1.5 kbar is a realistic minimum pressure. This corresponds to a minimum depth of about 6 km assuming lithostatic pressure.
Quartz-sericite-pyrite-calcite veins: PT conditions are determined by two methods, using MACFLINCOR and by gas-corrected isochors. For gas-corrected isochors, the trapping pressure is constrained using microthermometry (applying NaCl-H2O equations in MACFLINCOR) and gas analysis data. We assume that above Th all gaseous species are dissolved in the liquid. The combined partial pressures for all the species,
is calculated from the average gas analysis using Henry’s Law constants [41] and assuming fugacity coefficients Equation (1). Hence
where PH2O is determined by the H2O-NaCl isochor at the temperature T, XCO2, XCH4 etc. are average mole ratios and K is the Henry’s Law Constants [41] for gas species.
Ptotal = PH2O + PCO2 + PCH4 + PN2 + .....
Some inclusions in quartz homogenize to a carbonic phase and some to an aqueous phase indicating, that for a short time during quartz deposition, CO2 increased sufficiently to induce fluid immiscibility and phase separation/boiling in the 295 °C to 323 °C range. Type 2 inclusions do not appear to be the products of pinching off as they show similar Th values. Using MACFLINCOR, Type 2 fluid inclusions have calculated homogenization pressures of 1910 to 2423 bar, with most data points occurring around 305 °C and about 2000 bars pressure (Figure 14), and comprise about 0.71 to 0.75 mol fraction CO2. Assuming Type 2 inclusions were trapped during phase-separation/boiling conditions, Th = Tt, which follows that the pressure at homogenization is Pt.
Type 1a and 1b inclusions have Th values about 100 °C lower and show evidence of sporadic phase separation that may be regarded as boiling of a high-density carbonic phase. Either (1) the aqueous fluid was trapped at significantly lower temperature, (2) the two types of fluid were trapped under similar PT conditions such that low CO2 fluids did not boil, or (3) the type 2 inclusions are accidental. To test the idea that Type 1 and Type 2 inclusions were trapped under similar P-T conditions, we assume that Type 2 inclusions were trapped under phase-separation/boiling conditions when aqueous and carbonic phases were present, hence Th = Tt. Therefore, Pt and Tt for Type 1 inclusions can be estimated by the crossing-isochor method. Gas-corrected isochors (the H2O-NaCl isochor is calculated using MACFLINCOR and gas partial pressures calculated from the formulae of [41]) of Type 1 inclusions both intersect the zone defined by the Type 2 inclusions (Figure 14). The crossing-isochors show that the assumption that Type 1 and Type 2 inclusions were trapped under similar P-T conditions is permissible. It follows then that Th measured for most Type 1 inclusions are considerably less that Tt. It should be noted that all other fluid inclusions studies in Nevada where isochors are used to estimate pressure conditions, lack gas analyses and therefore are unable to present accurate isochors.
Our pressure estimate of 1.9 to 2.4 kbar is greater than estimates for other Nevada gold deposits. Lamb and Cline (1997) [42] estimate minimum pressures of 750 to 1235 bars and 1000 to 1425 bars, and depths of 2.8 to 4.7 km and 3.8 to 5.4 km at Betze/Post assuming lithostatic pressure. Kuehn and Rose (1995) [3] estimate a pressure of 800 ± 400 bars and depth of 3.8 ± 1.9 km assuming lithostatic pressure. Emsbo et al. (2000) [43] report >1.8 kbar pressure during mineralization at Meikle. Groff (1996) [44] reports an estimate pressure of 660 bar to 1.7 kbar at Twin Creeks during main stage mineralization. A minimum of 330 bars is estimated for fluorite-hosted inclusions at Getchell [45] and a depth of 1.2–2.4 km lithostatic pressure or 3.3–6.5 km hydrostatic pressure. Bagby and Cline (1991) [46] estimate a minimum of 1.9 kbar which is in agreement with our value of 2 kbars.
Calcite from quartz-sericite-pyrite-calcite veins (see Figure 4c) were deposited shortly after quartz and therefore should have the same depth as quartz. The Th values for calcite show less spread than values measured for quartz, and overall, calcite Th measurements are slightly higher than quartz Th values. Blamey (2000) [31] shows that calcite inclusion isochors calculated using MACFLINCOR and Equation (2) do not intersect quartz gas-corrected isochors and that for any given temperature, Ptcalcite is less than Ptqtz. This can only realistically be explained by a change from lithostatic conditions during quartz deposition to hydrostatic conditions when calcite infilled the veins.
Late vuggy calcite: Calcite pressure estimates are poorly constrained. There is no indication of boiling (except one sample). Trapping pressure estimated using Equation (2) is 93 bars, corresponding to a depth of ~930 m hydrostatic. The open-space filling and presence of calcareous sediment strongly suggest that calcite was deposited at epithermal conditions.
4.3. Fluid Sources Indicated by Fluid Inclusion Gas Analysis
Early dark calcite: Inclusions hosted within the dark calcite veins have widely varying methane contents. It is most likely that inclusions which form methane-bearing clathrate correlate with the methane-rich population recognized in the gas analysis data. Fluid inclusion gas analyses measure gas released only by small groups of inclusions or possibly single 40-micron inclusions. Non-clathrate inclusions are linked to the low CH4 gas analyses. The N2/Ar vs. CO2/CH4 plot (Figure 8) shows the fluid inclusions with low methane to be meteoric waters. Inclusion volatiles with low CO2/CH4 ratios have higher N2/Ar ratios. This is explained by the breakdown of amino acids to produce both CH4 and N2 [47], which should plot in the organic field.
Calcite has retrograde solubility, but is also deposited from hydrothermal solutions by boiling, pH change, and loss of dissolved CO2 [48,49]. There is no evidence for the latter three processes during early dark calcite formation. The most plausible explanation is that calcite deposition resulted from heating of downward penetrating cooler groundwater that mixed with hydrocarbon-rich fluids from the carbonate host units. The 145.4 °C Th indicates that fluid temperatures were above the petroleum maturation temperature and well into the natural gas temperature window, potentially offering a source of methane. Cross-cutting relationships and deformation of dark calcite veins indicate fracturing occurred before the orogenic event. The Th and estimated depth is compatible with dark calcite fluid generation during burial diagenesis.
White calcite: Uniform ThCO2, salinity and gas chemistry for white calcite inclusions indicate calcite deposition by a fluid with a chemistry that was remarkably homogenous over time. The origin of such a constant composition fluid trapped of nearly equal parts (by volume) of CO2 and H2O is not evident from the gas chemistry. The N2/Ar ratios, which are higher than air-saturated water, are more representative of basalt volcanic gases than felsic magmas [50,51]. The high CO2 may have originated during skarn formation associated with an intrusion but we cannot say with any certainty. It is not clear how a supercritical fluid like that could have deposited the white calcite.
Quartz-sericite-pyrite-calcite: The isochor calculations coupled with observations of increasing fluid inclusion CO2 content towards the outside of a quartz crystal, indicates that Type 1 and Type 2 inclusions were derived from a fluid of increasing CO2 content at approximately 300 °C and 2 kbar. Pasteris et al. (1986) [52] and Kuehn and Rose (1995) [3] report CO2-vapor-filled inclusions in Carlin mineralization, similar to the Type 2. We observed Type 2 inclusions in quartz veins several tens of meters below the ore zone and observed no increase in abundance of Type 2 inclusions in mineralized gold-bearing silicification within the ore zone. This suggests that Pt did not change during quartz deposition. Isochors indicate a pressure of ~2.0 kbar; this is most likely lithostatic (±8 km), for a hydrostatic pressure of 2 kbar would require an unreasonable depth (±20 km) during quartz growth.
Quartz gas analysis data indicate a range of N2/Ar ratios which agrees with a magmatic volatile signature (Figure 9), matching magmatic fluid sources proposed for the Carlin deposits [53,54,55]. Although only some data points plot in the calc-alkaline magmatic box on a N2-Ar-He discrimination diagram (Figure 9b), the data points are clearly not meteoric and their positions suggest that the field for the magmatic fluid on this diagram may require updating. The quartz CO2/N2 vs. total gas exhibits a condensation trend (Figure 10). Volcanic gases have very low concentrations of CH4 whereas CO2 and sulfur species are the major constituents [50]. The gas analyses show a correlation of CO2 and H2S, whereas CO2 and CH4 are independent of each other (Figure 10). It is plausible that methane was sourced from methane-rich crustal fluids similar to those that formed the dark calcite inclusions. Our analytical data therefore supports derivation of the quartz depositing fluids from the condensation of a magmatic vapor phase into a methane rich crustal fluid. Vapor transport is recognized as an important mechanism [56] for transporting metals (including gold) and therefore should be considered since carbonic fluid inclusions and magmatic volatiles occur during the qsp-calcite vein event. The duration of this event is expected to be short lived owing to localized ore zones and focused alteration haloes which is in agreement with a short duration [57].
The condensation process occurred at an unknown depth beneath Pipeline. This is suggested by the few Type 2 inclusions. Addition of gas to the ore fluid at Pipeline would both lower the pH (addition of CO2) and offered a ligand (H2S) for the formation of gold complexes. It makes sense that condensation occurred distal to the Pipeline deposit creating a relatively acidic fluid out of equilibrium with country rock that could cause decalcification as well as transport gold.
The calcite (qsp-calcite) isochors do not intersect the P-T conditions measured for the quartz Type 2 inclusions, nor do they intersect quartz Type 1 inclusion gas-corrected isochors [31]. Therefore, deposition at pressures lower than those during quartz mineralization is indicated, assuming Tt was the same or less. Gas analysis shows qsp-calcite stage calcite-depositing fluids contain a shallow meteoric component mixed with a magmatic fluid (Figure 9). For meteoric fluids to enter qsp-calcite veins during lithostatic conditions is impossible, however, it is possible for meteoric fluids to migrate downwards into the deposit under less than lithostatic pressure. Meteoric fluids are expected to be saturated with calcite due to contact with carbonate sediments; and the calcite deposition is explained by heating as meteoric fluids descended due to its reverse solubility. Veins with similar quartz-calcite mineralogy are known to occur in other Nevada gold deposits (JS Cline, personal communication 2000; [3]).
4.4. Fluid Sources Indicated by Stable Isotopes
The mineral and calculated fluid isotopic values in this study are similar to the dataset compiled from other Nevada gold deposits [6]. The host rock δ13C 0.0 ± 3.0 per mil is consistent with marine carbonate values and agrees with the −8 to +3 per mil range reported by [6] for unaltered sedimentary rocks from “a variety of units in different ore deposits” (AH Hofstra, personal communication 2004), however, δ18O values are lighter than primary marine values. This suggests that the SRM samples have been subjected to either diagenesis or isotopic exchange, possibly in broad exchange haloes, similar to that reported [58] at Lone Tree.
Early dark calcite fluid values of +0.6 ± 0.5 per mil δ13C are relatively heavy and close to the host rock values. It is probable that the host rock was the source of carbon in dark calcite veins.
White calcite is represented by one sample. The δ13C fluid value of this sample is consistent with a carbon source for white calcite that was marine carbonate, similar to the SRM. The calculated δ18O fluid values are similar to early dark calcite (Table 2). Either a similar source is shared between early dark and white calcite, or both have exchanged with the host carbonates. The δ13C and δ18O values for NB-84 are an exact match for many isotopic values [59]. Whereas they [59] group all the calcite veins together, we recognize that the white calcite stockwork and vuggy calcite veins are temporarily separate, with contrasting gas chemistries and are not coeval.
Quartz from qsp-calcite veins was deposited from a fluid with a +11 per mil δ18O value. This fluid δ18O value is very similar to fluid values [44] for the Cretaceous gold-bearing event. Both our isotopic compositions and Groff’s data have δ18O values that are suggestive of magmatic or highly exchanged fluids. Quartz fluid inclusion δD values vary from −61 to −148 per mil. A similar broad range in fluid δD values are reported for Getchell [44] and data compiled by [6]. The combined δD and δ18O data (Figure 11) can be explained as mixing of a highly exchanged meteoric water and magmatic fluid. Contamination of δD values by secondary fluid inclusions is ruled out because secondary trails were not observed in the fluid inclusion thick sections. In addition, gas analysis of quartz lacks the meteoric gas component characteristic of qsp-calcite and vuggy calcite. The consistent heavy δ18O precludes fresh meteoric water as a fluid mixing source. Qsp-stage calcite δ18O fluid values are only slightly lighter than qsp quartz, suggesting they were deposited from similar exchanged fluids. The qsp calcite fluid δ13C values around −5.5 per mil is lighter than the early dark and white calcite fluids and might also represent a magmatic input.
The qsp pyrite has δ34S values around +5.4 ± 1.0 per mil giving a H2S(a) value of +4.2 ± 1.0 per mil δ34S, suggesting a major magmatic component with possible contamination by heavier sulfur. Pyrite δ34S isotopic composition is close to the −1 to +5 per mil reported by [60] and is within the +0.1 to +5.5 per mil reported by [44]. Our sulfur isotopic composition is consistent with sulfur sourced from condensing magmatic gases and is supported by fluid inclusion N2/Ar ratios that are magmatic.
The vuggy calcite δ18O values are the lightest of all the calcite stages with water δ18O values around 0 per mil. Owing to the depth of formation estimated for post-qsp calcite, it is feasible that the percolating meteoric water isotopic signature has become modified by exchange with the country rock during its flow path.
4.5. Geochronology
Sample NB-102 sericite is hydrothermal and occurs as part of a vein paragenesis, therefore inherited argon from detrital clays is not a problem. The sericite is well crystallized and relatively coarse-grained (ca. 5 μm) and therefore 39Ar recoil loss during irradiation is not a major concern especially if ejected 39Ar reimplanted into other grains. Electron microprobe analysis showed that the sericite has consistent K/Al ratios but that Si varies (Table 3), implying that quartz is intergrown with the sericite (Figure 12). This intergrown mineralogy seems to explain the form of the age spectrum within the context of a recoil model (Figure 13) as it is very likely that 39Ar had recoiled from the high-K sericite into the non-K bearing quartz. The steep drop in age over the last 20 percent 39Ar released is presumably the release of 39Ar that was implanted into the quartz during irradiation. Additionally, the radiogenic yield and the K/Ca values also decrease. The drop in radiogenic yield may be related to atmospheric argon trapped in the quartz. The drop in K/Ca can be interpreted as a result of the differential recoil implantation of 37Ar and 39Ar into the intergrown quartz. Since the recoil distance for 39ArK is about 65 percent less than for 37ArCa, it follows that the overall concentrations of 37Ar relative to 39Ar between the host (sericite) and target (quartz) would be fractionated thereby providing an apparently lower K/Ca value during the degassing of the quartz. Assuming that recoil of 39Ar out of the sample is negligible, the total gas age of 92.2 ± 0.3 Ma for sample NB-102 should be the best estimate for the timing of sericite growth and subsequent argon closure. This timing is in agreement with local igneous activity represented by a quartz porphyry dyke in the area (94.3 ± 1.9 Ma sericite K-Ar age) [61]; and 103.8 Ma U-Pb dates from the Gold Acres stock [24]. There is also a 40Ar/39Ar biotite age of 104.6 ± 0.6 Ma from a granodiorite recovered by drilling ~4 km south of Cortez Hills (40.17380, −116.72157, NAD27) (C.D. Henry, personal communication, 2016). These Cretaceous dates confirm that magmatism was ongoing around the time that hydrothermal fluids entered the Pipeline deposit.
The only vein set to postdate the qsp-calcite veins are the vuggy calcite veins. The vuggy calcite veins crosscut the ore body and the fact that calcite is deposited in these veins precludes them from being coeval with the Cretaceous decalcification event at Pipeline. The calcareous sediment in some of these veins indicates the veins formed prior to 11 Ma basin-and-range tilting in the Crescent Valley area [19]. Blamey (2000) [31] confirms ~35 Ma igneous activity (40Ar/39Ar date of dyke at Cortez) several km away that may have acted as a heat engine for hydrothermal fluid but there are no igneous rocks within the Pipeline deposit. Fission track data [62] indicate ages ranging from 12.8 to 96.9 Ma in the Pipeline area that suggests a protracted thermal history for the area. Our date of 92.2 Ma for the qsp sericite is within the range determined by [62].
40Ar/39Ar age spectra recovered from clay samples can be difficult to interpret because of commonly mixed age populations, recoil problems associated with neutron irradiation, and poor knowledge of argon closure temperatures. Despite these problems clay dating can provide useful information on a variety of geologic problems [38], but dating of clay minerals from other Carlin-type deposits has been largely unsuccessful [2,63,64]. However, the shape of our age spectra reported here differ greatly from disturbed spectra reported by [2]. Our clay data appear to be influenced by minor contamination from an older (possibly syn-sedimentary) clay however the dominant part of the age spectra yield Cretaceous apparent ages. All spectra (Figure 13) have high temperature parts of their spectra that dramatically increase in age to values greater than 400 Ma. The preservation of these old apparent ages indicates that at least part of the clay population has not been completely degassed of radiogenic 40Ar since diagenetic growth in the Paleozoic. Considering the magmatic activity in the Jurassic, Cretaceous and Eocene and the estimated Pipeline gold vein deposition temperatures of about 300 °C, the estimated closure temperatures for at least some clay fractions appears most consistent with argon kinetic parameters [65]. For instance, using an activation energy of 64 kcal/mol, Do of 4 cm2/s, cooling rate 100 °C/Ma and a cylindrical geometry yields closure temperatures of 337 and 376 °C for 1 and 5 μm grains, respectively [65]. These kinetic parameters also indicate that ca. 1 μm grains may only be partially degassed during relatively short-lived thermal events (tens to hundreds of thousand years) that approach 350 °C. The alternative hypothesis is that epigenetic illite is dominating the spectra.
39Ar recoil out of the clay samples dated here is partly quantified by two in vacuo encapsulation experiments on NB-20 and NB-87 (Figure 13). These two samples only lost about 6% of the total 39Ar due to ejection out of the sample. The relatively low 39Ar ejection is related to the fairly coarse clay faction (microns rather than sub-micron) and the fairly high degree of crystallinity. Dong et al. (1995) [38] provide a formula to calculate the amount of 39Ar loss due to recoil based on the illite crystallinity (Kubler Index), which is: 43.8 × (∆2θ) − 6.74 where (∆2θ) is the Kubler Index. X-ray diffraction analysis of NB-20 illite yields a Kubler index of 0.341 and a Kubler index of 0.362 for NB-19. Based on the expression [38], we calculate about 8 and 9 percent 39Ar loss respectively due to recoil which is in excellent agreement with the encapsulation data. These XRD analyses and our direct encapsulation experiments indicate that the clay samples dated here have total gas ages that are approximately 5 to 10 Ma too high because of recoil loss of 39Ar and thus the measured ages need to be adjusted down by this amount. Nevertheless, our epigenetic gold-bearing illite dates cannot be interpreted as Tertiary and we can only arrive at the conclusion that their timing is Cretaceous.
4.6. Genetic Model for Vein Formation
The dark petroliferous calcite veins are precursors to gold mineralization and were deposited in fractures within the carbonate host rocks prior to one or more major compressive events such as the Antler or Golconda orogeny. Depth of formation is estimated at 5 km and about 150–250 °C. Hydrocarbons present within the fluid inclusions were locally derived.
Movement from west to east along the Roberts Mountains thrust during the Antler orogeny resulted in emplacement of Upper Plate rocks on top of Lower Plate rocks (and locally vice versa). Sympathetic shears developed in the carbonate host package, close to and subparallel to the Roberts Mountains thrust. Recumbent folding and duplexing related to this regional compressional event provided the structural setting for fluid flow and trapping at what is now the Pipeline deposit. White calcite stockwork deposited from meteoric fluid that descended downward in newly-formed fractures, under P-T conditions exceeding 300 °C at ~6 km depth.
Emplacement of the Mill Canyon stock occurred during the Jurassic, at 158.4 ± 0.6 Ma [66], and the Gold Acres stock was emplaced during the Cretaceous, about 103.8 Ma [24].
It is probable that the Gold Acres stock is one of multiple igneous bodies emplaced in the Gold Acres area during the Upper Cretaceous. One such body released volatiles that condensed into methane-rich evolved basinal fluids. The hydrothermal fluids that formed were in equilibrium with the quartz monzonite but would be out of equilibrium with the surrounding carbonate sediments. The escaping hydrothermal fluids utilized the path of least resistance, migrating into the nearby Pipeline area. Qsp-stage sericite and quartz were deposited on the sidewalls of the veins at 92.2 ± 0.3 Ma, and limited sulfidation occurred as the fluid temperature decreased. Pressure-temperature conditions that existed were ~300 °C and 2.0 kbar lithostatic. The proposed condensing magmatic volatiles model during quartz deposition explains the covariation relationship between CO2 and H2S, and their independence from methane. Toward the end of the quartz precipitation, fracturing extended outwards from the deposit. As the hydrothermal system collapsed, meteoric fluids under hydrostatic conditions penetrated the country rock. Calcite was deposited from these fluids as they warmed.
Oxidation at Pipeline occurred after 92.2 Ma and prior to development of the vuggy veins. Circulating meteoric water caused replacement of pyrite by Fe-oxides and this has potentially destroyed evidence that may have supported an Eocene event at Pipeline. Post-oxidation vuggy calcite was precipitated in open fractures that occur above, within, and below the deposit. During one precipitation cycle, a calcareous sediment was deposited. Drusey calcite subsequently covered this sediment. It is not known which of these events correlates with ~34–35 Ma dike emplacement in the region, the Caetano volcanics to the south, as well as the vast range in dates reported by [62], but the Eocene magmatic activity was potentially a heat source to drive circulating meteoric water. Gold mineralization is found associated with the ~34–35 Ma dike emplacement as is the case with Cortez Hills collapse breccias [67].
Basin-and-Range extension tilted the deposit by about 10–15°. Pipeline was nearly exposed by erosion prior to 16 Ma but was buried by basin-fill sediments as the Crescent Valley half graben formed.
4.7. Gold Solubility and Depositional Mechanism
Assays indicate that gold is not associated with the calcite veins. This leaves the quartz-sericite-pyrite mineralization as the only choice for feeder veins, otherwise one is required to assume that all the gold mineralization at Pipeline is not represented by any vein set. It is also not surprising that qsp veins in other ore deposit styles are usually associated with mineralization. As the fluid inclusion assemblage from the gold-bearing silicification within the deposit matches the qsp vein assemblage interpreted to be the feeders below the deposit, we propose that the silica-depositing event relates to gold deposition. This concept is supported by the decalcification and gold mineralization associated with alteration haloes immediately in contact with the qsp veins. This links the gold mineralization with the quartz fluid chemistry. We do not rule out the possibility that our paragenesis is incomplete and that an Eocene hydrothermal system existed, remobilizing or introducing gold after the qsp veinset, however, we did not find such evidence.
PHREEQC [68] is used to model the changing fluid chemistry during wall-rock interaction. Updated thermodynamic data for muscovite was provided by David Parkhurst (personal communication, 2013). Gold solubility is modelled using the formulae of [69]. Using PHREEQC we will model the changing fluid chemistry based on the premise that ore fluids entered the limestone, thus causing hydrothermal alteration and gold mineralization. To achieve this, the initial fluid chemistry will be constrained from fluid inclusion microthermometry and gas analysis data, and massaged if necessary. The fluid will then be brought into equilibrium with limestone that has 4% Fe relative to 96% Ca [31]. Equilibrium reactions will be taken to completion. At each stage the theoretical gold solubility is calculated based on the formulae of [69].
Starting conditions are constrained by fluid inclusion gas chemistry and the critical equilibrium species (quartz, pyrite and sericite as muscovite) or parameters (CO2(aq), CH4(aq), H2S(aq), Ca2+, HCO3− and pH) are presented in Supplementary Table S5. The equilibrium fluid was brought into equilibrium with small quantities of calcite with 4% Fe2+. From these data, gold solubility was calculated. Modelling shows a steady decrease in CO2(aq) and H2S(aq), whereas there is an increase in pH, Ca2+, HCO3− and Fe2+ (see Figure 15). Gold solubility decreases from 1827 to 385 ppb (see Figure 15) until equilibrium is achieved, thus confirming that the decalcification reaction has the potential to cause gold deposition. The surprising outcome is that only 0.25 mol % CO2 is required to cause decalcification, release Fe which consumes more than 90% of the H2S to form pyrite, increase the pH by 2.5 units, and deplete gold solubility by a factor of ~5. This is compelling evidence that a single mechanism of gold deposition caused by decalcification is plausible with potential for remobilization of Cretaceous gold or further introduction of gold during the Tertiary.
4.8. Genetic Model
The genetic model presented here is based on fluid inclusion data and geochemical modelling offers a plausible mechanism for Cretaceous mineralization with ore fluids sourced by condensing magmatic volatiles. As few studies in other Nevada sediment-hosted gold deposits use quantitative fluid inclusion gas analysis to resolve the “enigmatic” fluid sources, we do not imply that all Nevada sediment-hosted deposits form by our proposed mechanism for Pipeline. Our genetic model does offer an enriched gold source such that later Tertiary hydrothermal fluids might not only be introducing new gold but also mobilize Cretaceous gold and redeposit it, giving the indication that gold as exclusively sourced by Tertiary hydrothermal fluids. Our findings and modelling therefore supports the evidence for Cretaceous contribution of gold at Pipeline but this does not imply that a Tertiary event could not have contributed gold as well. While [62] use 7 out of 49 apatite dates collected for outside the pit to support Eocene mineralization at Pipeline, the oxidation event may have made it impossible to find conclusive evidence for an Eocene mineralizing event at Pipeline. Our proposed genetic model leaves one unanswered question remaining: does gold introduced into a site during the Cretaceous and remobilized during the Tertiary classify Nevada sediment-hosted gold deposits as Cretaceous or Tertiary?
We suggest that some Nevada sediment-hosted gold deposits were mineralized by Cretaceous-aged hydrothermal fluids, providing an ideal source for later local mobilization and redeposition. Alteration associated with the Cretaceous-aged qsp veins match ore-related alteration styles from other Nevada deposits, namely decarbonation, increase in clay content (either by calcite removal or by introduction of epigenetic illite), silicification, sulfidation, and increasing gold values.
Unlike many other gold deposits along the Carlin trend where dating of adularia provides Tertiary ages, the K-bearing minerals at Pipeline are K-bearing phyllosilicates and yield Cretaceous ages. PHREEQC modelling confirms that illite/sericite is stable under the high CO2 levels measured by quantitative gas analysis (and consequently more acid conditions, lowering the K+/H+ ratio) and that adularia would not be stable. This matches reports elsewhere in Nevada where sericite is dated as Cretaceous and not Eocene. Several Cretaceous illite dates are reported at Twin Creeks [13], supporting that our Cretaceous dates are not unique. In addition, the intergrowth of Upper Cretaceous illite and gold is also recognized at Getchell [70].
5. Conclusions
Four Pipeline vein sets are documented at the Pipeline gold deposit and demonstrate a protracted hydrothermal history spanning from pre-compressional to the Tertiary. Only one hydrothermal system shares similar alterations with the Pipeline ore body and occurred at ~92.2 Ma. Although the alteration styles recognized at Pipeline match that from many other Nevada gold deposits, the Pipeline deposit is atypical by virtue of the age dates being Cretaceous, and a strong structural control for mineralization.
Early dark calcite fluid inclusions have a narrow Th range ~145 °C and relatively low salinity and formed at a depth of ~6 km. Fluid inclusion gas signatures indicate a meteoric component as well as other potential sources.
The white calcite stockwork fluid inclusion salinity is relatively low and gas composition is homogeneous. The veins most likely formed above 300 °C at a minimum depth of about 6 km under lithostatic pressure.
Only the quartz-sericite-pyrite-calcite (qsp-calcite) veins exhibit the same alteration styles as recognized in the ore body, similar to the alteration in other Nevada gold deposits. 40Ar/39Ar dating of hydrothermal sericite from qsp-calcite veins gives total gas age of 92.2 ± 0.3 Ma. Similarly, dating of epigenetic gold-bearing 2M1 illite confirms that a significant hydrothermal event occurred during the Cretaceous, possibly related to the Gold Acres Stock. Quartz fluid inclusion volatiles are sourced from magmatic volatiles that condensed into methane-rich basinal fluids. PT conditions were ~300 °C at 2 kbar pressure under lithostatic conditions (an equivalent of ~8 km depth) as defined by carbonic fluid inclusion Th’s and pressures. Fluid-rock equilibria and gold solubility modelling confirm that reactions between hydrothermal fluids and the host limestone liberated Fe2+, caused scavenging of H2S to form pyrite, thereby destabilizing gold bisulfide complexes which caused gold to precipitate. PHREEQC modelling confirms that decarbonation and gold mineralization can occur in a single event and during the Cretaceous. We do not rule out further gold mineralization during the Tertiary.
The late vuggy calcite veins were formed at a minimum depth of ~930 m hydrostatic, probably under epithermal type conditions. Fluid inclusion gas signatures are meteoric.
Supplementary Materials
The following are available online at www.mdpi.com/2075-163X/7/6/100/s1, Table S1: Sample numbers and locations, Table S2: Microthermometry data, Table S3: Fluid inclusion gas data, Table S4: Argon geochronology data, Table S5: PHREEQC output.
Acknowledgments
David Norman is credited with pioneering the quantitative fluid inclusion gas analysis by mass spectrometry and he imparted this valuable knowledge to NJFB. Without that knowledge, this manuscript would have lacked the key chemical constraints. The authors wish to acknowledge the financial assistance of Placer Dome, in particular Richard Duncan who approved the project at its inception. Many thanks go to Bob Hays, the former chief geologist at the Pipeline Mine as well as Mark Bradley and the geology team for their assistance. Meghan Jackson is thanked for constructive comments and discussion. Funding from the Charles Parks Foundation to NJFB is also acknowledged. We acknowledge the New Mexico Bureau of Mines and Mineral Resources where XRD and electron microprobe analysis were performed. Jamie Wilkinson and David Banks provided constructive and thought-provoking discussion. Amanda Rowe is thanked for conducting δD analysis of the quartz fluid inclusions. Mike Lozon at Brock University is thanked for drafting some of the diagrams.
Author Contributions
All authors were involved in writing and formulation of the manuscript with the majority of the text written by N.B., A.C. coordinated the stable isotope analysis; M.H. conducted the argon geochronology; N.B. conducted all of the fluid inclusion microthermometry and gas analyses as well as the PHREEQC modeling.
Conflicts of Interest
The authors declare no conflict of interest.
References
- Arehart, G.B.; Chryssoulis, S.L.; Kesler, S.E. 40Ar/39Ar, K/Ar, and fission track geochronology of sediment-hosted disseminated gold deposits at the Post-Betze, Carlin-trend, northeastern Nevada. Econ. Geol. 1993, 88, 622–646. [Google Scholar] [CrossRef]
- Kuehn, C.A.; Rose, A.W. Carlin gold deposits, Nevada: Origin in a deep zone of mixing between normally pressured and over-pressured fluids. Econ. Geol. 1995, 90, 17–36. [Google Scholar] [CrossRef]
- Cline, J.S.; Hofstra, A.H.; Rye, R.O.; Landis, G.P. Stable isotope and fluid inclusion evidence for a deep sourced ore fluid at the Getchell, Carlin-type, gold deposit, Nevada. PACROFI VI 1996, 33–35. [Google Scholar]
- Stenger, D.P.; Kesler, S.E.; Peltonen, D.R.; Tapper, C.J. Deposition of gold in Carlin-type deposits: The role of sulfidation and decarbonation at Twin Creeks, Nevada. Econ. Geol. 1998, 93, 201–215. [Google Scholar] [CrossRef]
- Hofstra, A.H.; Cline, J.S. Characteristics and models for Carlin-type gold deposits. SEG Rev. 2000, 13, 163–220. [Google Scholar]
- Hofstra, A.H.; John, D.A.; Theodore, T.G. A special issue devoted to gold deposits in Northern Nevada: Part 2. Carlin-type deposits. Econ. Geol. 2003, 98, 1063–1067. [Google Scholar] [CrossRef]
- Muntean, J.L.; Cline, J.S.; Johnston, M.K.; Ressel, M.W.; Seedorf, E.; Barton, M.D. Controversies of the origin of world-class gold deposits: Part 1. Carlin-type gold deposits in Nevada: SEG Newsletter. Soc. Econ. Geol. 2004, 59, 1. [Google Scholar]
- Cline, J.S.; Hofstra, A.H.; Muntean, J.L.; Tosdal, R.M.; Hickey, K.A. Carlin-type gold deposits in Nevada: Critical geologic characteristics and viable models. In Econ Geol 100th Anniversary Volume; Hedenquist, J.W., Thompson, J.F.H., Goldfard, R.J., Richards, J.P., Eds.; Society of Economic Geologists, Inc.: Littleton, CO, USA, 2005; Volume 100, pp. 451–484. [Google Scholar]
- Teal, L.; Jackson, M. Geologic overview of the Carlin Trend Gold Deposits and descriptions of recent deep discoveries. SEG Newsl. 1997, 31, 12–25. [Google Scholar]
- Groff, J.A.; Heizler, M.T.; McIntosh, W.C.; Norman, D.I. 40Ar/39Ar dating and mineral paragenesis for Carlin-type gold deposits along the Getchell trend, Nevada: Evidence for Cretaceous and Tertiary gold mineralization. Econ. Geol. 1997, 92, 601–622. [Google Scholar] [CrossRef]
- Teal, L.; Branham, A. Geology of the Mike gold-copper deposit, Eureka County, Nevada. In Carlin-Type Gold Deposits Field Conference; Vikre, P., Thompson, T.B., Bettles, K., Christensen, O., Parratt, R., Eds.; Society of Economic Geology: Littleton, CO, USA, 1997; Volume 28, pp. 257–276. [Google Scholar]
- Hall, C.M.; Kesler, S.E.; Simon, G.; Fortuna, J. Overlapping Cretaceous and Eocene alteration, Twin Creeks Carlin-type deposit, Nevada. Econ. Geol. 2000, 95, 1739–1752. [Google Scholar] [CrossRef]
- Gilluly, J.; Gates, O. Tectonic and Igneous Geology of the Northern Shoshone Range Nevada; U.S. Government Printing Office: Washington, DC, USA, 1965; p. 153.
- Gilluly, J.; Masursky, H. Geology of the Cortez Quadrangle Nevada: Geological Survey Bulletin 1175; U.S. Government Printing Office: Washington, DC, USA, 1965; p. 117.
- Roberts, R.J.; Hotz, P.E.; Gilluly, J.; Ferguson, H.G. Paleozoic rocks of north-central Nevada. Am. Assoc. Petro. Geol. Bull. 1958, 42, 2813–2857. [Google Scholar]
- Leonardson, R.W. Barrick Cortez gold acres structure. In Great Basin Evolution and Metallogeny Geological Society of Nevada 2010 Symposium; Steininger, R.C., Pennell, W.M., Eds.; DEstech Publications, Inc.: Lancaster, PA, USA, 2011; pp. 17–30. [Google Scholar]
- McCormack, J.K.; Hays, R.C., Jr. Crescent Valley: A model for reconstruction of district mineralization in the Basin and Range. In Geology and Ore Deposits of the American Cordillera; Coyner, A.R., Fahey, P.L., Eds.; Geological Society of Nevada: Reno/Sparks, NV, USA, 1996; pp. 635–646. [Google Scholar]
- Colgan, J.P.; John, D.A.; Henry, C.D.; Fleck, R.J. Large-magnitude Miocene extension of the Eocene Caetano caldera, Shoshone and Toiyabe Ranges, Nevada. Geosphere 2008, 4, 107–131. [Google Scholar] [CrossRef]
- Colgan, J.P.; Henry, C.D.; John, D.A. Evidence for large-magnitude, post-Eocene extension in the northern Shoshone Range, Nevada, and its implications for Carlin-type gold deposits in the lower plate of the Roberts Mountains allochthon. Econ. Geol. 2014, 109, 1843–1862. [Google Scholar] [CrossRef]
- Rhys, D.; Valli, F.; Burgess, R.; Heitt, D.; Greisel, G.; Hart, K. Controls of fault and fold geometry on the distribution of gold mineralization on the Carlin trend. In New Concepts and Discoveries (Geological Society of Nevada 2015 Symposium); Pennell, W.M., Garside, L.J., Eds.; DEStech Publications, Inc.: Lancaster, PA, USA, 2015; pp. 333–389. [Google Scholar]
- Foo, S.T.; Hays, R.C., Jr.; McCormack, J.K. Geology and mineralization of the Pipeline Gold Deposit, Lander County, Nevada. In Geology and Ore Deposits of the American Cordillera: Symposium Proceedings; Coyner, A.R., Fahey, P.L., Eds.; Geological Society of Nevada: Reno/Sparks, NV, USA, 1996; pp. 95–109. [Google Scholar]
- Tretbar, D.R.; Arehart, G.B.; Christensen, J.N. Dating gold deposition in a Carlin-type gold deposit using Rb/Sr methods on the mineral galkhaite. Geology 2000, 28, 947–950. [Google Scholar] [CrossRef]
- Cline, J.S. Timing of gold and arsenic sulfide mineral deposition at the Getchell Carlin-type gold deposit, North-Central Nevada. Econ. Geol. 2001, 96, 75–89. [Google Scholar] [CrossRef]
- Bradley, M.A.; Eck, N. The Goldrush discovery, Cortez District, Nevada—The stratigraphic story. In New Concepts and Discoveries; Pennell, W.M., Garside, L.J., Eds.; DEStech Publications, Inc.: Lancaster, PA, USA, 2015; pp. 435–452. [Google Scholar]
- Blamey, N.J.F. Composition and evolution of crustal, geothermal and hydrothermal fluids interpreted using quantitative fluid inclusion gas analysis. J. Geochem. Explor. 2012, 116–117, 17–27. [Google Scholar] [CrossRef]
- Blamey, N.J.F.; Parnell, J.; McMahon, S.; Mark, D.; Tomkinson, T.; Lee, M.; Shivak, J.; Izawa, M.; Banerjee, N.; Flemming, R. Evidence for methane in Martian meteorites. Nat. Commun. 2015, 6, 7399. [Google Scholar] [CrossRef] [PubMed]
- Norman, D.I.; Ting, W.; Putnam, B.R.; Smith, R.W. Mineralization of the Hansonburg Mississippi-Valley type deposit, New Mexico: Insight from composition of gases in fluid inclusions. Can. Miner. 1985, 23, 353–368. [Google Scholar]
- Norman, D.I. Geology and Geochemistry of the Tribag Mine, Batchawana Bay, Ontario. Ph.D. Thesis, University of Minnesota, Minneapolis, MN, USA, 1977; p. 257. [Google Scholar]
- Brown, P.E.; Hageman, S.G.; Vanko, D.A. Macflincor and its application to fluids in Archean lodegold deposits. Geochim. Cosmochim. Acta 1995, 59, 3943–3952. [Google Scholar] [CrossRef]
- Katz, D.L.; Cornell, D.; Kobayashi, R.; Poetmann, F.H.; Vary, J.A.; Elenbaas, J.R.; Weinaug, C.F. Handbook of Natural Gas Engineering; McGraw-Hill Book Company: New York, NY, USA, 1959; p. 802. [Google Scholar]
- Blamey, N.J.F. The Evolution of Hydrothermal Fluids at the Pipeline Gold Mine, Lander County, Nevada. Unpublished Ph.D. Dissertation, New Mexico Institute of Mining and Technology, Socorro, NM, USA, 2000; p. 200. [Google Scholar]
- Shepherd, T.J.; Rankin, A.H.; Alderron, D.H.M. A Practical Guide to Fluid Inclusion Studies; Blackie & Son Ltd.: Glasgow/London, UK, 1985; p. 239. [Google Scholar]
- Norman, D.I.; Blamey, N.J.F.; Kurilovich, L. New applications of geothermal gas analysis to exploration. Trans. Geotherm. Res. Council 2002, 26, 345–353. [Google Scholar]
- Sharp, Z.D.; Krischner, D.L. Quartz-calcite oxygen isotope thermometry: A calibration based on natural isotopic variations. Geochim. Cosmochim. Acta 1994, 58, 4491–4501. [Google Scholar] [CrossRef]
- O’Neil, J.R.; Clayton, R.N.; Mayeda, T.K. Oxygen isotope fractionation in divalent metal carbonates. J. Chem. Phys. 1969, 51, 5547–5558. [Google Scholar] [CrossRef]
- Deines, P.; Langmuir, D.; Harmon, R.S. Stable carbon isotope ratios and the existence of a gas phase in the evolution of carbonate groundwaters. Geochim. Cosmochim. Acta 1974, 38, 1147–1164. [Google Scholar] [CrossRef]
- Ohmoto, H.; Rye, R.O. Isotopes of sulfur and carbon. In Geochemistry of Hydrothermal Deposits; Barnes, H.L., Ed.; John Wiley & Sons: Hoboken, NJ, USA, 1979; pp. 509–567. [Google Scholar]
- Dong, H.; Hall, C.M.; Peacor, C.R.; Halliday, C.N. Mechanisms of argon retention in clays revealed by laser 40Ar/39Ar dating. Science 1995, 267, 355–359. [Google Scholar] [CrossRef] [PubMed]
- Cromie, P.W.; Zaw, K. Geological setting, nature of ore fluids and sulfur isotope geochemistry of the Fu Ning Carlin-type gold deposits, Yunnan Province, China. Geofluids 2003, 3, 133–143. [Google Scholar] [CrossRef]
- Bowers, T.S.; Helgeson, H.C. Calculation of the thermodynamic and geochemical consequences of non-ideal mixing in the system H2O-CO2-NaCl on phase relations in geologic systems. Equation of state for H2O-CO2-NaCl fluids at high pressures and temperatures. Geochim. Cosmochim. Acta 1983, 47, 1247–1275. [Google Scholar] [CrossRef]
- Drummond, S.E. Boiling and Mixing of Hydrothermal Fluids: Chemical Effects on Mineral Precipitation. Unpublished Ph.D. Dissertation, Pennsylvania State University, State College, PA, USA, 1981; p. 380. [Google Scholar]
- Lamb, J.B.; Cline, J.S. Depths of formation of the Meikle and Betze/Post deposits. In Society Economic Geologists Guidebook Series; Society of Economic Geology: Littleton, CO, USA, 1997; Volume 28, pp. 101–108. [Google Scholar]
- Emsbo, P.; Hofstra, A.H.; Lauha, E.A. Jurassic auriferous polymetallic mineralization at the Goldstrike Mine, Carlin Trend, Nevada. In Geology and Ore Deposits 2000: The Great Basin and Beyond; Cluer, J.K., Price, J.G., Struhsacker, E.M., Hardyman, R.F., Morris, C.L., Eds.; Geological Society of Nevada: Reno, NV, USA, 2000; Appendix B2. [Google Scholar]
- Groff, J.A. Geochronology and Origin of Auriferous Fluids for the Getchell and Twin Creeks mines, Humbolt County, Nevada. Unpublished Ph.D. Dissertation, New Mexico Institute of Mining and Technology, Socorro, NM, USA, 1996; p. 291. [Google Scholar]
- Cline, J.S.; Hofstra, A.H. Ore-fluid evolution at the Getchell Carlin-type gold deposit, Nevada, USA. Eur. J. Miner. 2000, 12, 195–212. [Google Scholar] [CrossRef]
- Bagby, W.C.; Cline, J.S. Constraints on the pressure of formation of the Getchell gold deposit, Humbolt County, Nevada, as interpreted from secondary fluid inclusion data. In Geology and Ore Deposits of the Great Basin; Raines, G.L., Lisle, R.E., Schaeffer, R., Wilkinson, W., Eds.; Geological Society of Nevada: Reno, NV, USA, 1991; pp. 793–804. [Google Scholar]
- Norman, D.I.; Moore, J.N. Methane and excess N2 and Ar in geothermal fluid inclusions. In Proceedings of the Twenty-Fourth Workshop of Geothermal Reservoir Engineering, Stanford University, Stanford, CA, USA, 22–24 January 1999; pp. 233–240. [Google Scholar]
- Heinrich, C.A.; Henley, R.W.; Seward, T.M. Hydrothermal Systems; Australian Mineral Foundation: Adelaide, SA, Australia, 1989; p. 74. [Google Scholar]
- Simmons, S.F.; Arehart, G.B.; Simpson, M.P.; Mauk, J.L. Origin of massive calcite veins in the Golden Cross low-sulphidation, epithermal Au-Ag deposit, New Zealand. Econ. Geol. 1999, 95, 99–112. [Google Scholar] [CrossRef]
- Giggenbach, W.F. Redox control of gas compositions in Phillippine volcanic-hydrothermal systems. Geothermics 1993, 22, 575–587. [Google Scholar] [CrossRef]
- Blamey, N.J.F.; Norman, D.I. New interpretations of geothermal volatiles: Ar/He and N2/Ar ratios—Better indicator of magmatic volatiles, and equilibrium gas geothermometry. In Proceedings of the Twenty-Seventh Workshop of Geothermal Reservoir Engineering, Stanford University, Stanford, CA, USA, 28–30 January 2002. [Google Scholar]
- Pasteris, J.D.; Kuehn, C.A.; Bodnar, R.J. Applications of the laser Raman microprobe RAMANOR U-1000 to hydrothermal ore deposits: Carlin as an example. Econ. Geol. 1986, 81, 915–930. [Google Scholar] [CrossRef]
- Kesler, S.E.; Riciputi, L.C.; Ye, Z. Evidence for a magmatic origin for Carlin-type gold deposits: Isotopic composition of sulfur in the Betse-Post-Screamer Deposit, Nevada, USA. Miner. Depos. 2005, 40, 127–136. [Google Scholar] [CrossRef]
- Thompson, T.B. Origin of fluids associated with Carlin-type ore systems. In Great Basin Evolution and Metallogeny Geological Society of Nevada 2010 Symposium; Steininger, R.C., Pennell, W.M., Eds.; DEStech Publications, Inc.: Lancaster, PA, USA, 2010; pp. 201–219. [Google Scholar]
- Muntean, J.L.; Cline, J.S.; Simon, A.C.; Longo, A.A. Magmatic–hydrothermal origin of Nevada’s Carlin-type gold deposits. Nat. Geosci. 2011, 4, 122–127. [Google Scholar] [CrossRef]
- Williams-Jones, A.E.; Heinrich, C.A. Vapor transport of metals and the formation of magmatic-hydrothermal ore deposits. Econ. Geol. 2005, 100, 1287–1312. [Google Scholar] [CrossRef]
- Hickey, K.A.; Barker, S.L.L.; Dipple, G.M.; Arehart, G.B.; Donelick, R.A. The Brevity of Hydrothermal Fluid Flow Revealed by Thermal Halos around Giant Gold Deposits: Implications for Carlin-Type Gold Systems. Econ. Geol. 2014, 109, 1461–1487. [Google Scholar] [CrossRef]
- Young, C.M.; Campbell, A.R.; Chavez, W.X., Jr. Whole-rock isotope traverses across gold-bearing and barren structures, Lone Tree Complex, Nevada. In Geology and Ore Deposits 2000: The Great Basin and Beyond; Cluer, J.K., Price, J.G., Struhsacker, E.M., Hardyman, R.F., Morris, C.L., Eds.; Geological Society of Nevada: Reno, NV, USA, 2000; pp. 969–987. [Google Scholar]
- Hickey, K.A.; Ahmed, A.D.; Barker, S.L.L.; Leonardson, R. Fault-controlled lateral fluid flow underneath and into a Carlin-type gold deposit: Isotopic and geochemical footprints. Econ. Geol. 2014, 109, 1431–1460. [Google Scholar] [CrossRef]
- Kesler, S.E.; Fortuna, J.; Ye, Z.; Alt, J.C.; Core, D.P.; Zohar, P.; Borhauer, J.; Chryssoulis, S.L. Evaluation of the role of sulfidation in deposition of gold, Screamer Section of the Betze-Post Carlin-type deposit, Nevada. Econ. Geol. 2003, 98, 1137–1157. [Google Scholar] [CrossRef]
- Silberman, M.L.; McKee, E.H. K-Ar ages of granitic plutons in north-central Nevada. Isochron/West 1971, 1, 15–32. [Google Scholar]
- Arehart, G.B.; Donelick, R.A. Thermal and isotopic profiling of the Pipeline hydrothermal system: Application to exploration for Carlin-type gold deposits. J. Geochem. Explor. 2006, 91, 27–40. [Google Scholar] [CrossRef]
- Folger, H.W.; Snee, L.W.; Mehnert, H.H.; Hofstra, A.H. Significance of K-Ar and 40Ar/39Ar dates of mica from Carlin-type deposits: Evidence from the Jerritt Canyon District in Nevada. In Geology and Ore Deposits of the American Cordillera; Coyner, A.R., Fahey, P.L., Eds.; Geological Society of Nevada: Reno/Sparks, NV, USA, 1996; pp. 41–60. [Google Scholar]
- Arehart, G.B.; Chakurian, A.M.; Tretbar, D.R.; Christensen, J.N.; McInnes, B.A.; Donelick, R.A. Evaluation of radioisotope dating of Carlin-type deposits in the Great Basin, western North America, and implications for deposit genesis. Econ. Geol. 2003, 98, 235–248. [Google Scholar]
- Harrison, T.M.; Celerier, J.; Aikman, A.B.; Hermann, J.; Heizler, M.T. Diffusion of 40-Ar in muscovite. Geochim. Cosmochim. Acta 2009, 73, 1039–1051. [Google Scholar] [CrossRef]
- Mortensen, J.K.; Thompson, J.F.H.; Tosdal, R.M. U-Pb age constraints on magmatism and mineralization in the northern Great Basin, Nevada. In Geology and Ore Deposits 2000: The Great Basin and Beyond; Cluer, J.K., Price, J.G., Struhsacker, E.M., Hardyman, R.F., Morris, C.L., Eds.; Geological Society of Nevada: Reno, NV, USA, 2000; pp. 419–438. [Google Scholar]
- Clark Maroun, L.R.; Cline, J.S.; Simon, A.; Anderson, P.; Muntean, J. High-grade gold deposition and collapse breccia formation, Cortez Hills Carlin-type gold deposit, Nevada, USA. Econ. Geol. 2017, 112, 707–740. [Google Scholar] [CrossRef]
- Parkhurst, D.L.; Appelo, C.A.J. User’s Guide to PHREEQC (Version 2)—A Computer Program for Speciation, Batch-reaction, One-dimensional Transport, and Inverse Geochemical Calculations; USGS Water-Resources Investigations Report; U.S. Geological Survey: Reston, VA, USA, 1999; pp. 99–4259.
- Benning, L.G.; Seward, T.M. Hydrosulphide complexing of Au(I) in hydrothermal solutions from 150–400 °C and 500–1500 bar. Geochim. Cosmochim. Acta 1996, 60, 1849–1871. [Google Scholar] [CrossRef]
- Cail, T.L.; Cline, J.S. Alteration associated with gold deposition at the Getchell Carlin-type gold deposit, North-Central Nevada. Econ. Geol. 2001, 96, 1343–1359. [Google Scholar] [CrossRef]
Figure 1.
Location of the Pipeline and several other gold mines in Nevada (modified after [1]). The Battle Mountain-Eureka, Carlin and Getchell Trends are shaded.
Figure 1.
Location of the Pipeline and several other gold mines in Nevada (modified after [1]). The Battle Mountain-Eureka, Carlin and Getchell Trends are shaded.

Figure 2.
Simplified stratigraphy of the Pipeline area showing the units of both Upper and Lower Plates, the Roberts Mountain thrust and crosscutting relationship of the Gold Acres intrusion, based on information from [14,15,16,17].
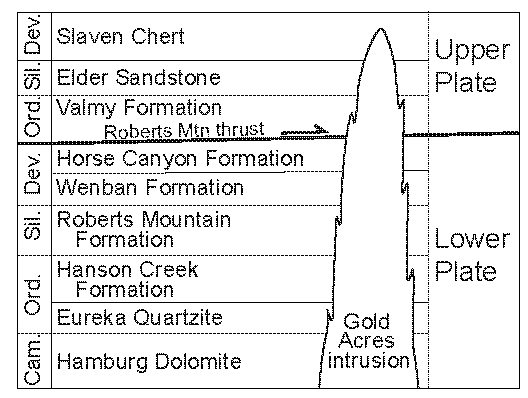
Figure 3.
Idealized geologic section of the Pipeline deposit area. Pipeline is inferred to be on the eastern limb of a domed feature whereas Gold Acres is on the western limb (modified after [21]).
Figure 3.
Idealized geologic section of the Pipeline deposit area. Pipeline is inferred to be on the eastern limb of a domed feature whereas Gold Acres is on the western limb (modified after [21]).
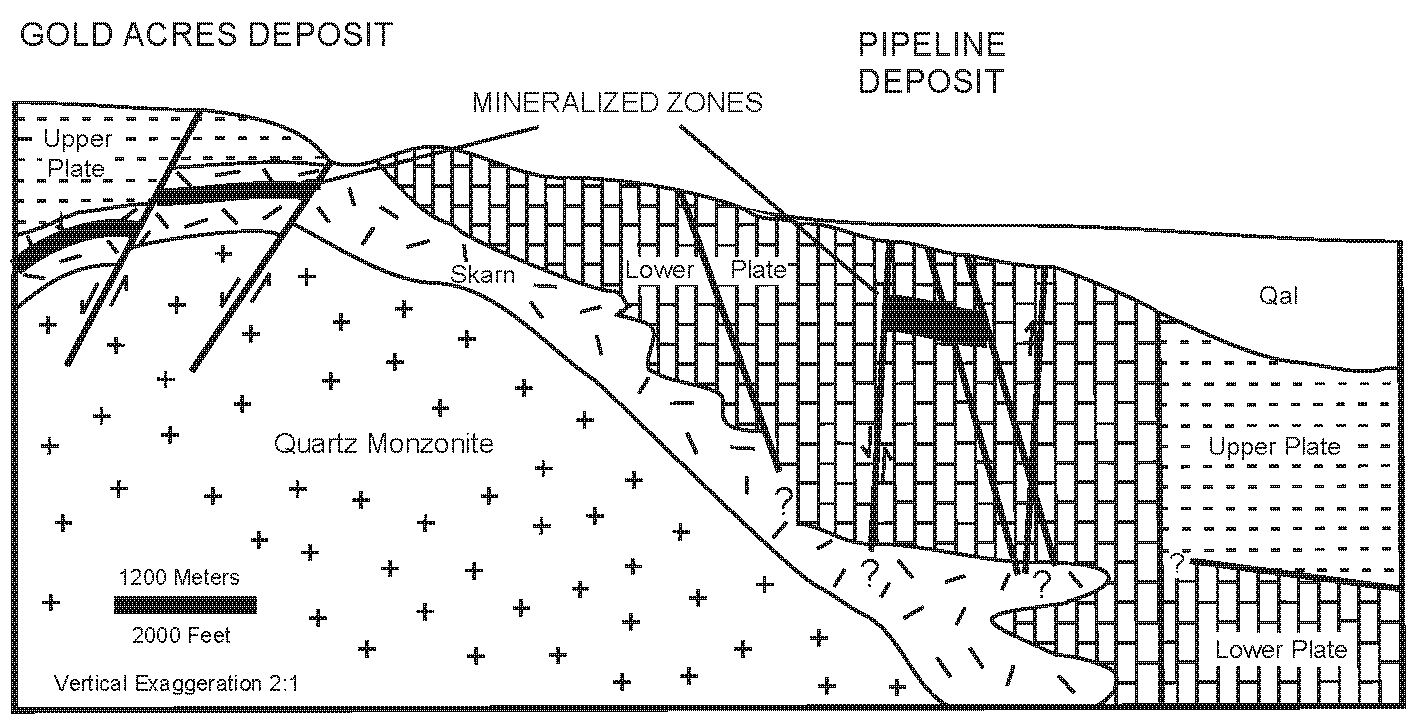
Figure 4.
(a) Cross section of drill core showing a dark calcite vein hosted in fresh Silurian Roberts Mountains Formation (SRM); (b) Sample of white calcite stockwork (bottom) crosscut by late vuggy calcite; (c) Section cut through a quartz-sericite-pyrite-calcite vein hosted by fresh SRM. The vein has euhedral quartz crystals that grew from the sidewalls, followed by infilling of white calcite. The adjacent SRM shows alteration zones; indicated are the limits of silicification, 20 percent decalcification and sulfidation; (d) Drill core showing a late vuggy calcite vein partly infilled with carbonate sediment. In all photographs the scale bar is in cm.

Figure 5.
Photographs of the fluid inclusion types identified at Pipeline. From left to right they are Type 1a (or 1b), 1c and Type 2.
Figure 5.
Photographs of the fluid inclusion types identified at Pipeline. From left to right they are Type 1a (or 1b), 1c and Type 2.

Figure 6.
Fluid inclusion sections of (a) qsp-calcite vein quartz and (b) calcite showing primary fluid inclusion zones. The hexagonal quartz habit in (a) and calcite habit in (b) is mimicked by fluid inclusion zones.
Figure 6.
Fluid inclusion sections of (a) qsp-calcite vein quartz and (b) calcite showing primary fluid inclusion zones. The hexagonal quartz habit in (a) and calcite habit in (b) is mimicked by fluid inclusion zones.

Figure 7.
Histogram of (a) homogenization temperatures and (b) aqueous fluid salinities for quartz inclusions. Homogenization temperatures of Type 1 inclusions in qsp-calcite veins and silicification within the deposit are similar. No measurements of Type 2 inclusions were made in silicification although they were observed. Type 1a fluid inclusion salinities are calculated using MACFLINCOR [29] and are based on the melting depression of ice. The aqueous phase salinities for Type 1b, 1c, and 2 inclusions are calculated using MACFLINCOR based on clathrate-melting behavior.

Figure 8.
Fluid inclusion gas analysis of early dark calcite (stars), white calcite stockwork (circles), and late vuggy calcite (boxes), plotted on a CO2/CH4 vs. N2/Ar diagram.
Figure 8.
Fluid inclusion gas analysis of early dark calcite (stars), white calcite stockwork (circles), and late vuggy calcite (boxes), plotted on a CO2/CH4 vs. N2/Ar diagram.

Figure 9.
Fluid inclusion gas analysis of quartz (open circles) and calcite (open squares) in the qsp-calcite veins. Quartz inclusion volatiles show a clear magmatic signature. Calcite from qsp-calcite veins show both meteoric and magmatic signatures. The quartz and calcite analyses together support mixing of meteoric and magmatic fluids during the qsp-calcite event.
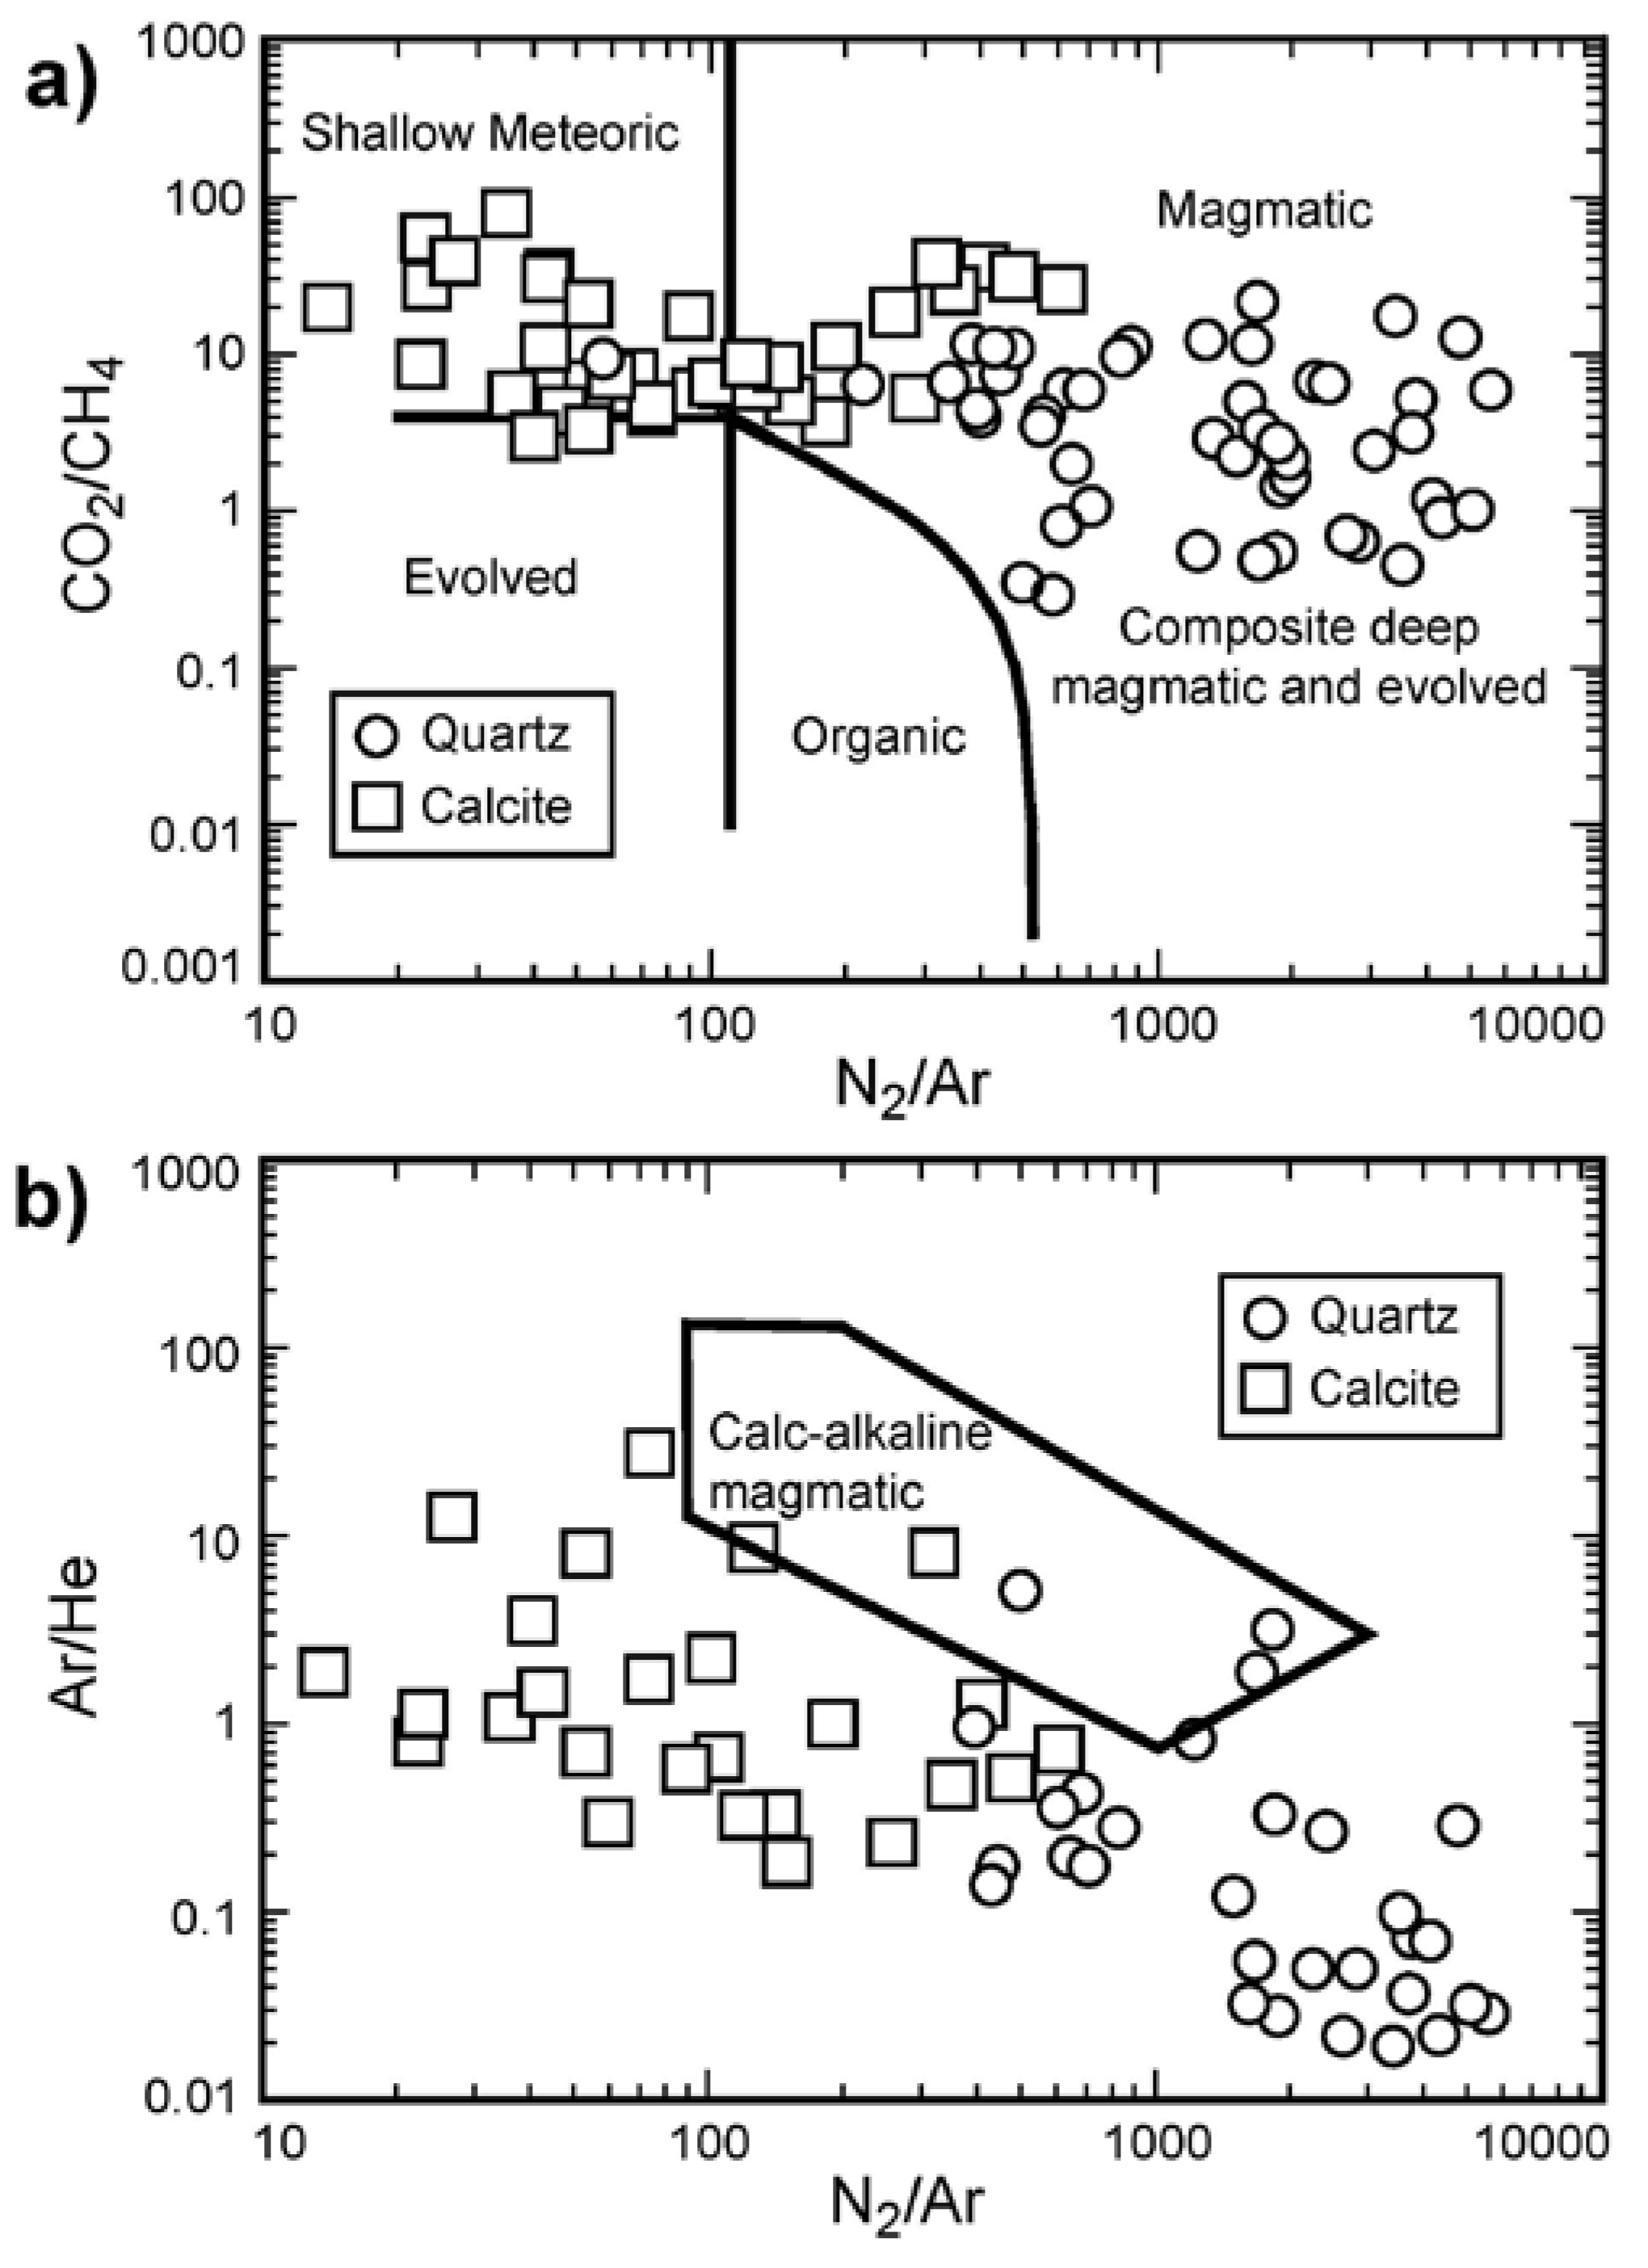
Figure 10.
(a) Plot of quartz (both vein and silicified material) fluid inclusion gas analysis showing CO2 and CH4 vs. total gas. The analyses indicate that quartz inclusions have a similar concentration of CH4, but CO2 varies from <0.5 to 8 mole percent; (b) Plot of all quartz inclusion gases for CO2/N2 vs. total non-aqueous gas content shows a positive relationship. The boiling and condensation trend directions for geothermal systems reported by [25] are shown.

Figure 11.
(a) Calculated carbon and oxygen isotopic composition (in per mil) for fluids in equilibrium with calcite from various stages. The mid-Tertiary meteoric water, carbonatite, limestone and calcite in carbonaceous shale δ13C composition ranges are taken from [6]. The quartz fluid δ18O range is shown; (b) Plot of quartz calculated fluid δ18O and fluid inclusion δD (in per mil). For comparison, the meteoric water line and magmatic box are shown.
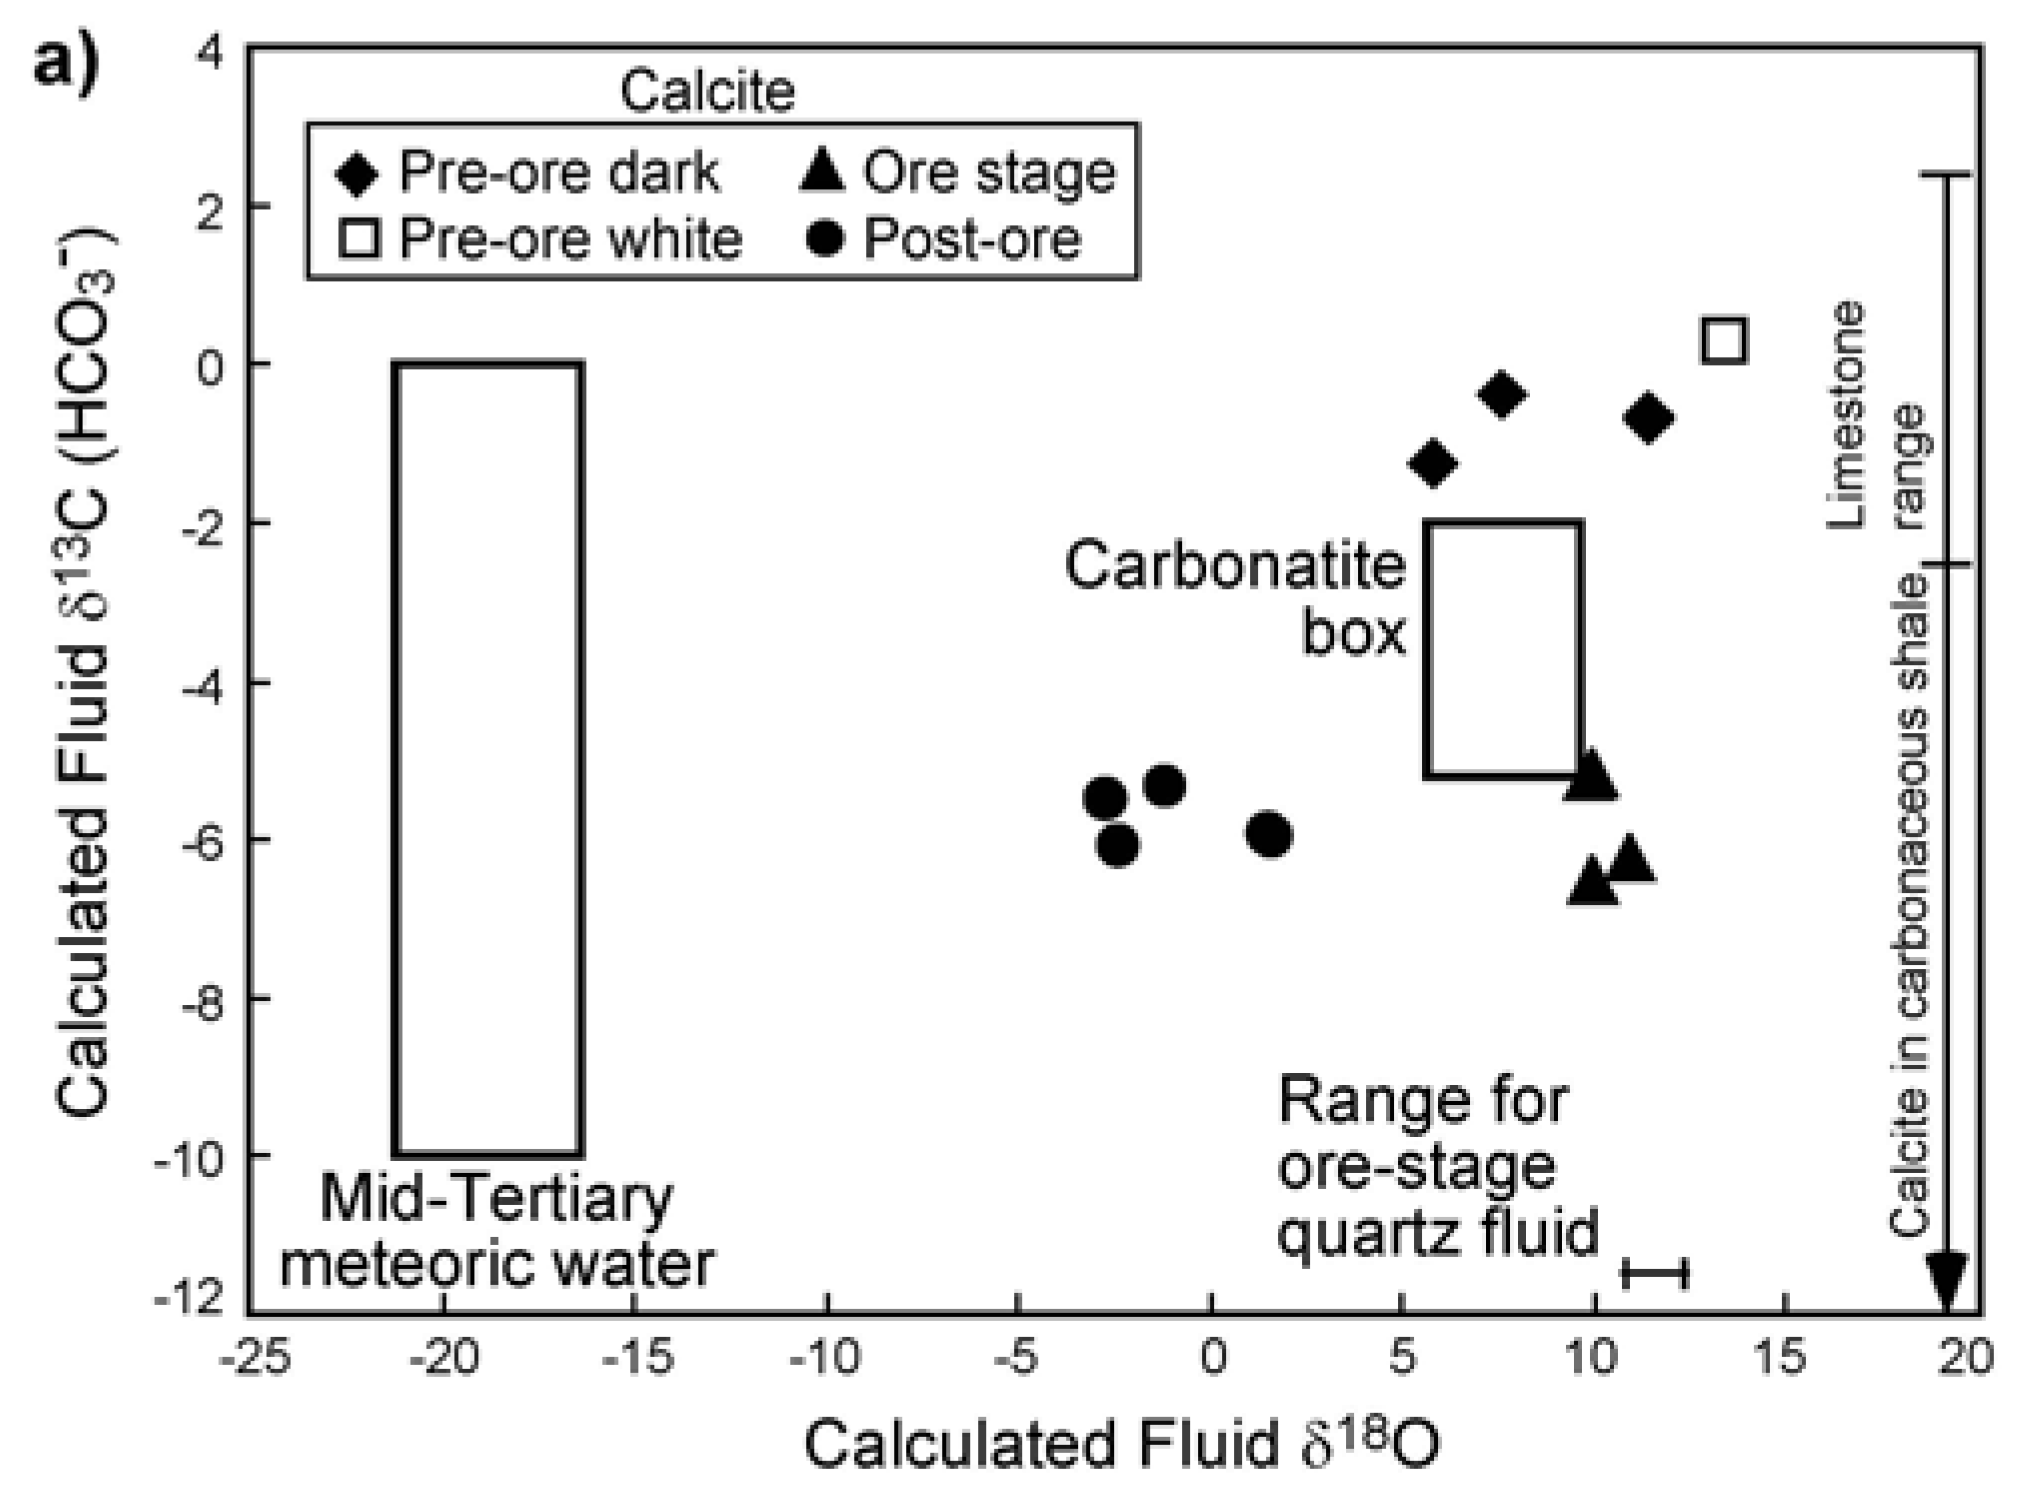

Figure 12.
Transmitted-light photomicrograph (top) and electron microprobe backscatter images of hydrothermal sericite from a qsp-calcite vein (sample NB-102). The thin section coarse-grained sericite grew on the side of these veins. The backscatter images (middle and lower) show a mosaic of sericite and intergrown quartz. Point analyses are shown and correspond to point quantitative analyses presented in Table 3.
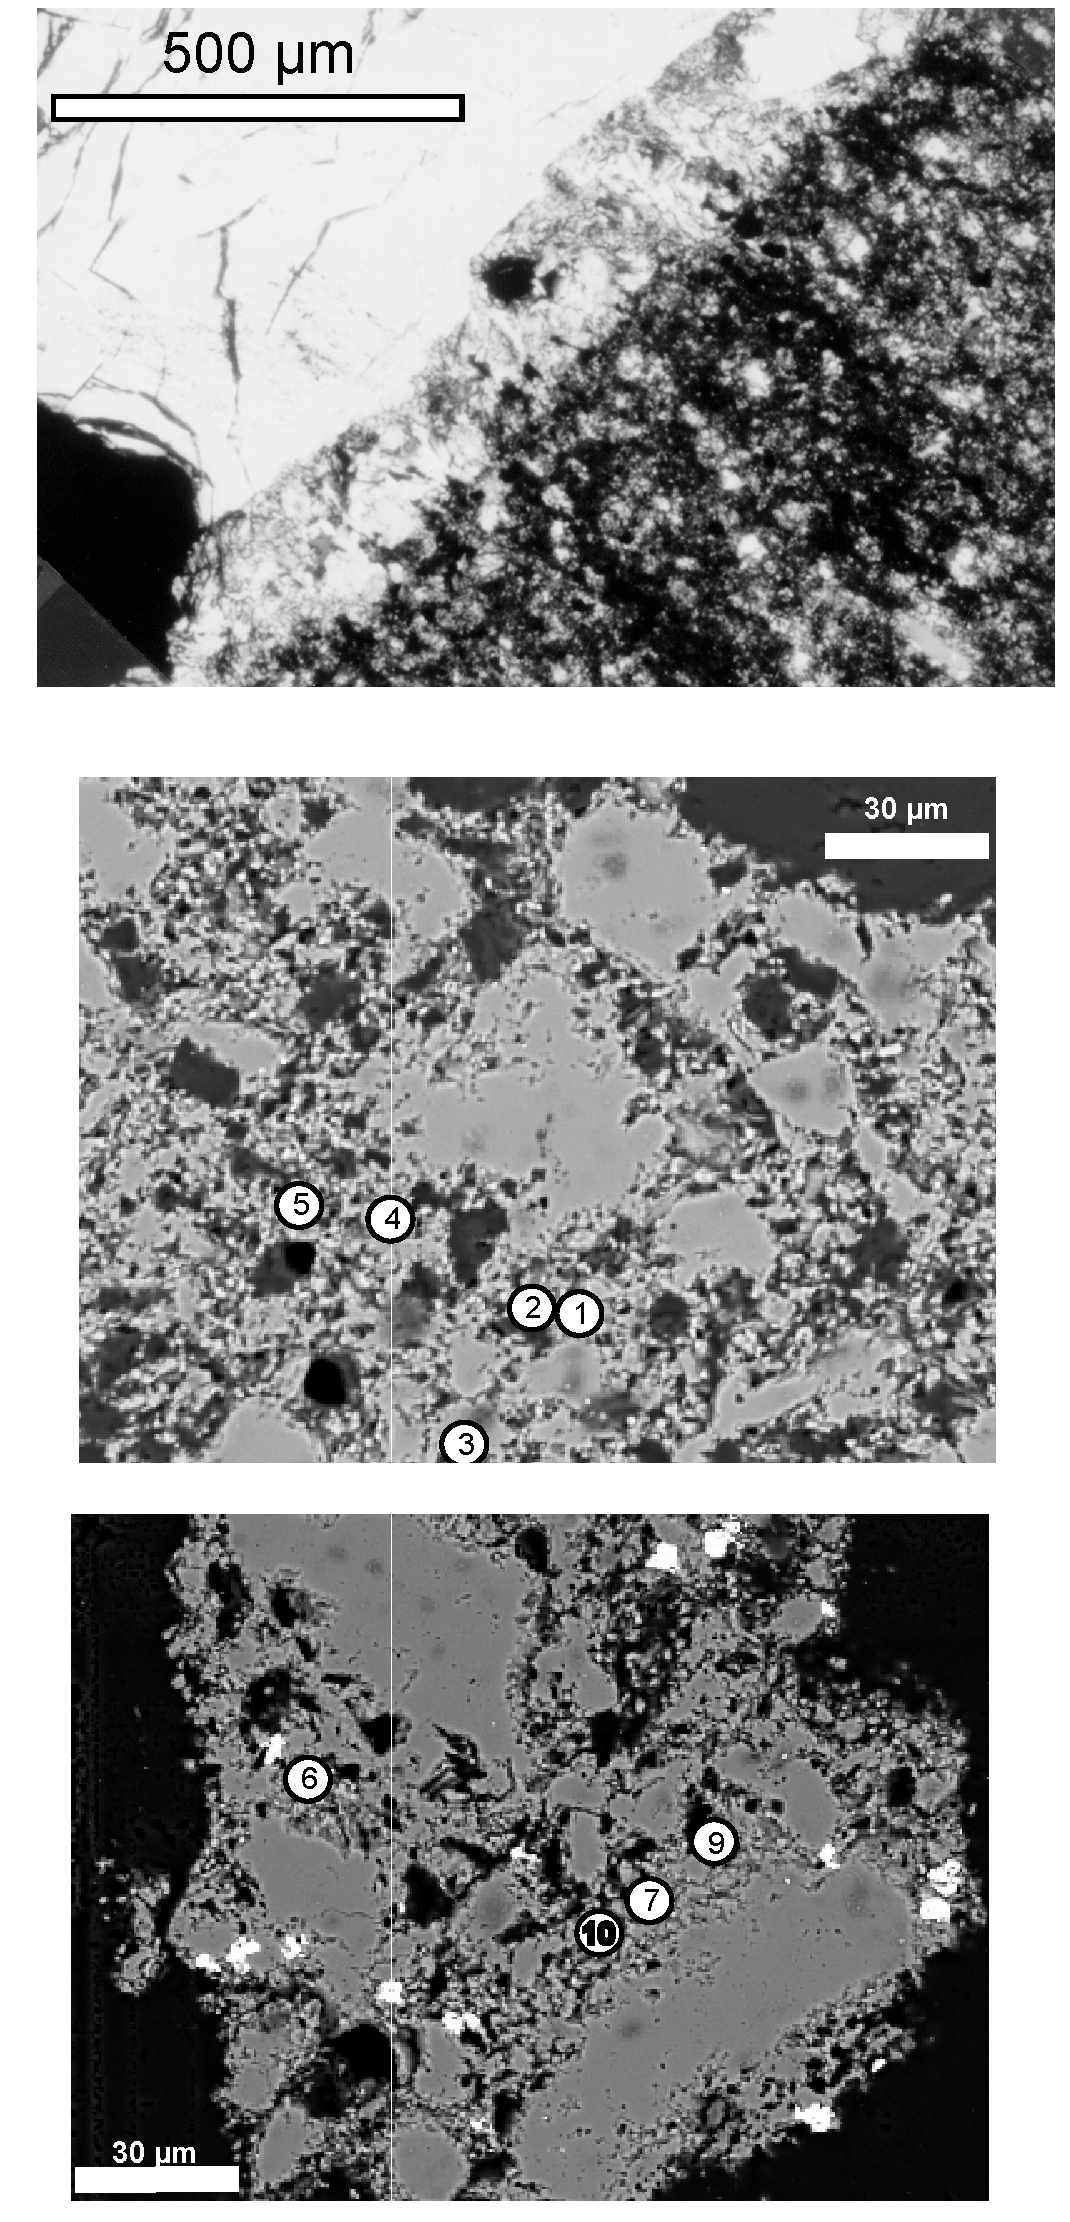
Figure 13.
40Ar/39Ar age and Ca/K spectra (a–d) for gold-bearing epigenetic 2M1 illite and (e) hydrothermal sericite from qsp-calcite veins. Electron microprobe backscatter images confirm the presence of intergrown sericite and quartz that explains the decrease in apparent ages measured in the final heating steps caused by 39Ar recoil into quartz that is released at relatively high laboratory temperature.
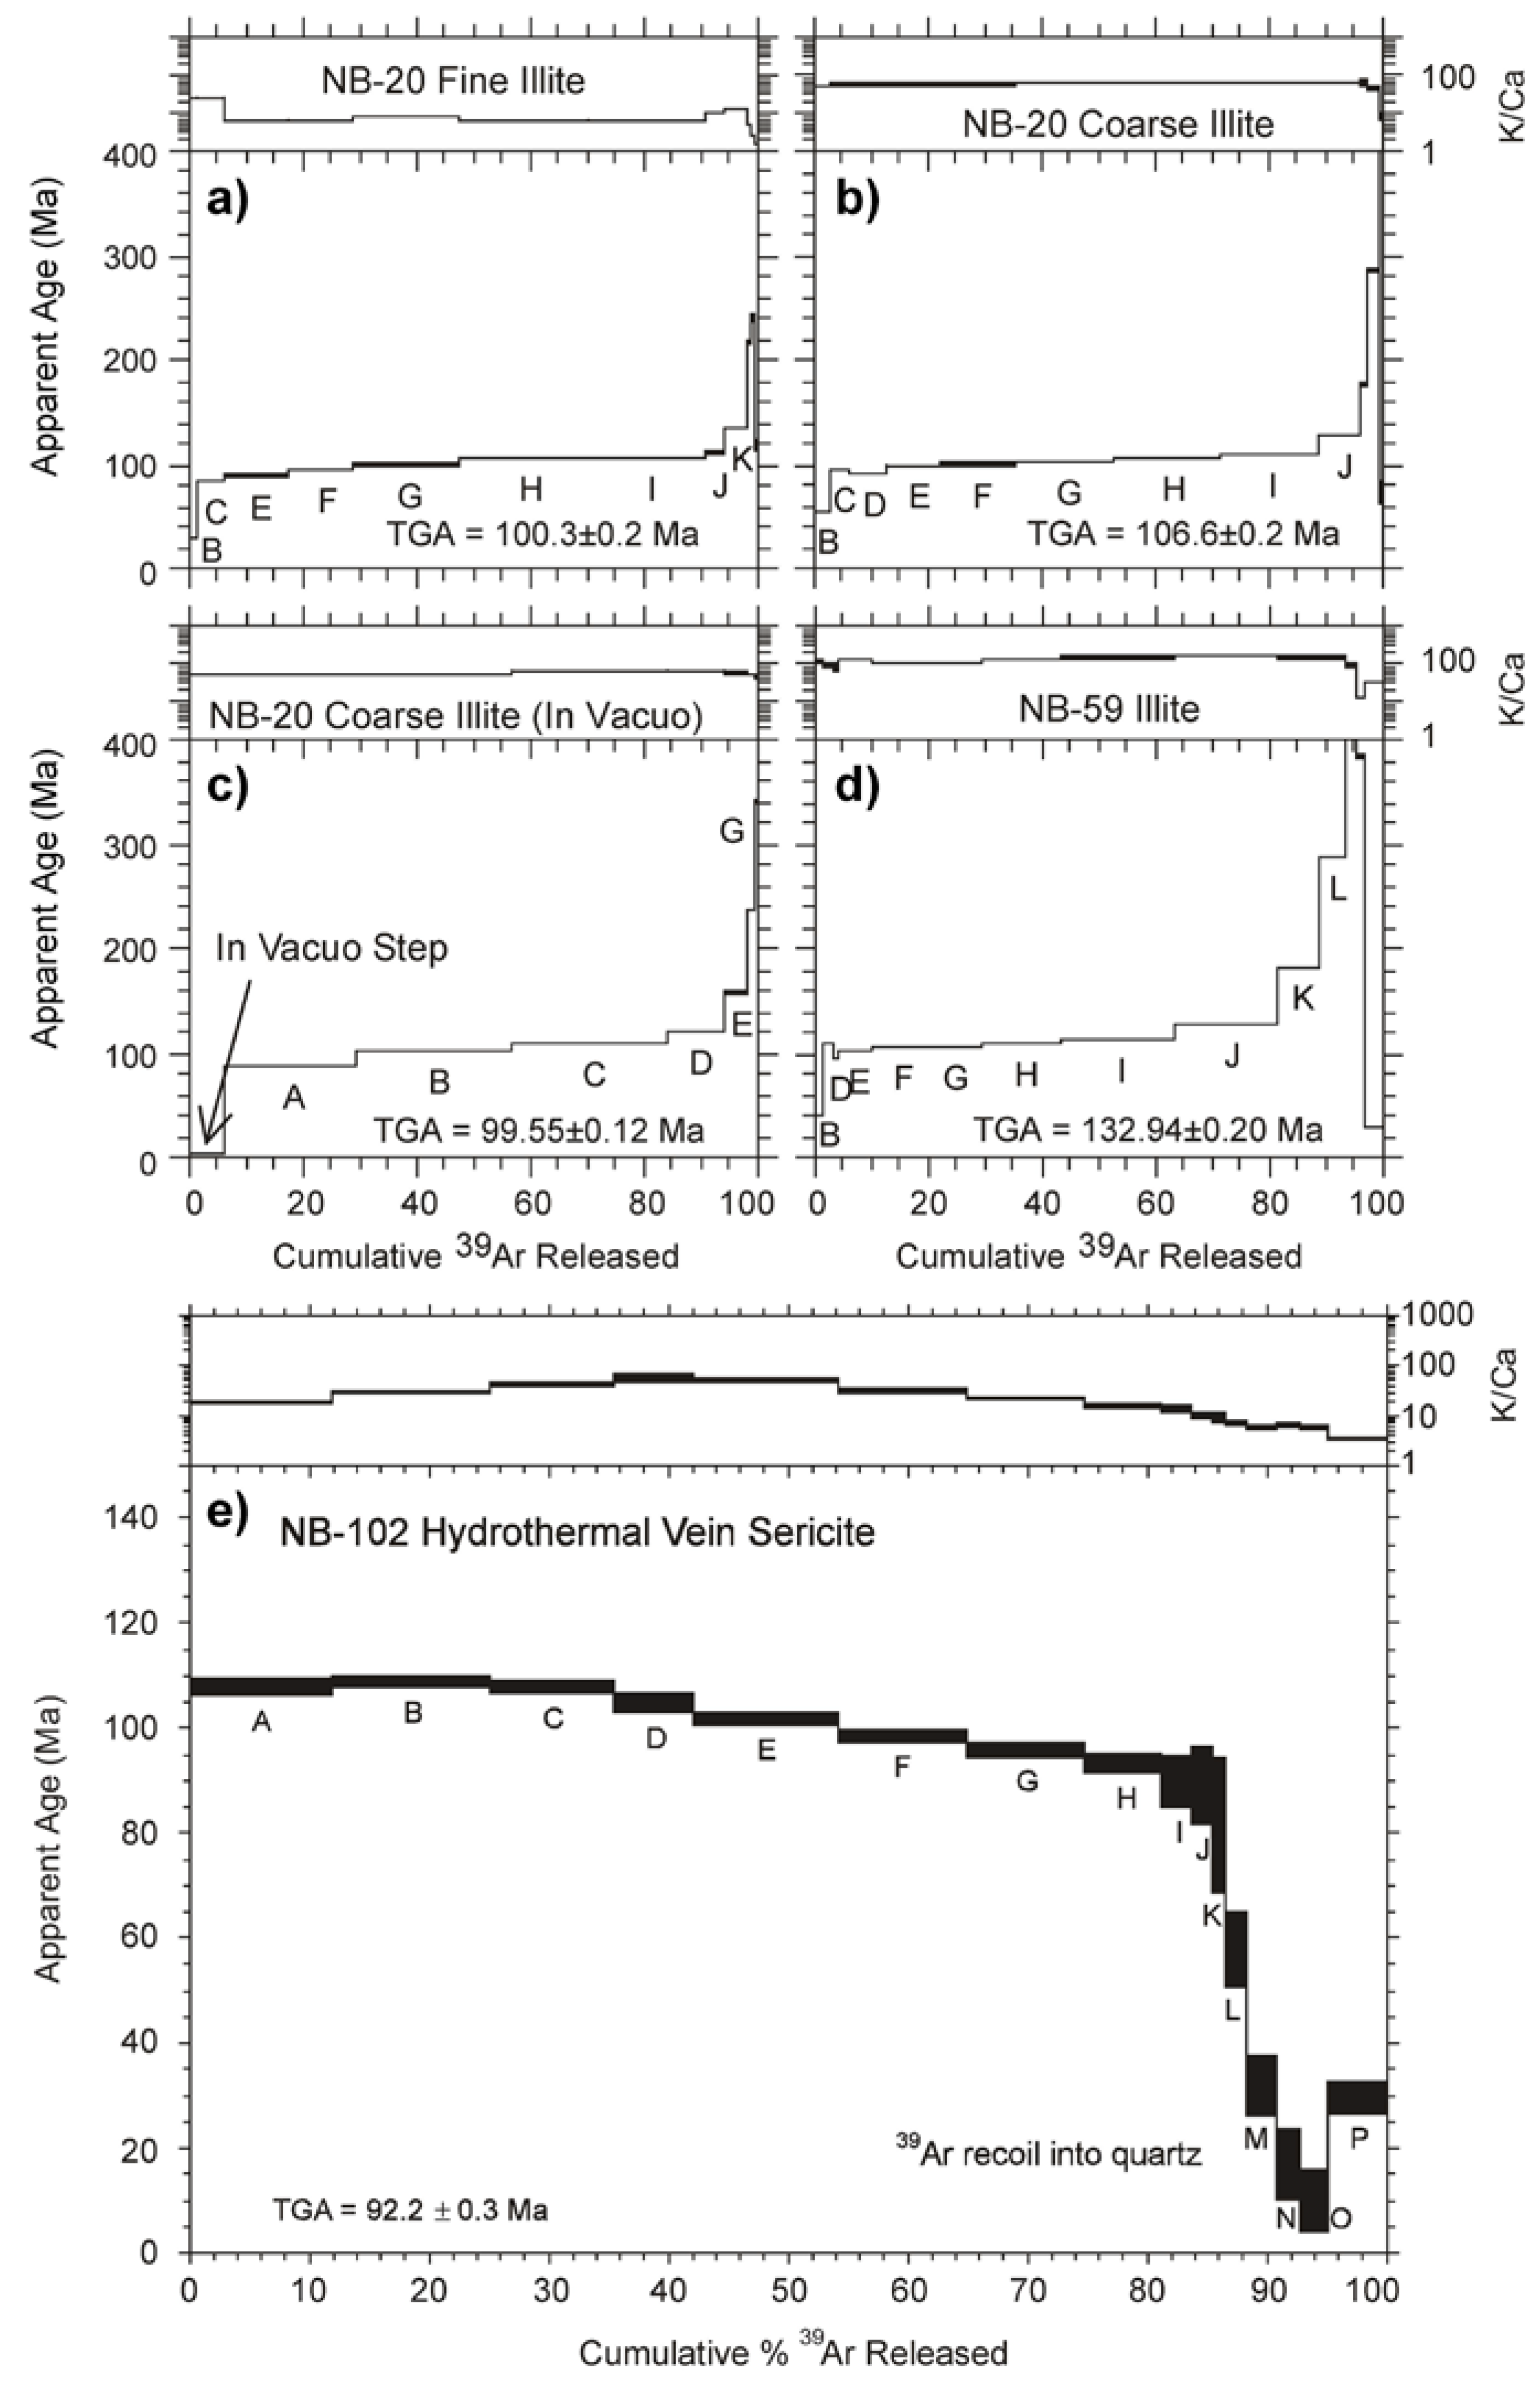
Figure 14.
A pressure–temperature (PT) diagram for quartz fluid inclusions (see text for details). The solid lines are the upper and lower isochor limits for aqueous-dominated inclusions, including the contribution from partial pressure of dissolved gases. The long-dashed lines represent Type 1c (aqueous-dominated but with double bubble) inclusion isochors whereas the short-dashed lines are the isochors for carbonic-dominated inclusions. Note that Type 1 and Type 2 isochors intersect in the trapping conditions for Type 2 inclusions. Type 1 (aqueous-dominated) inclusions require a significant PT correction.
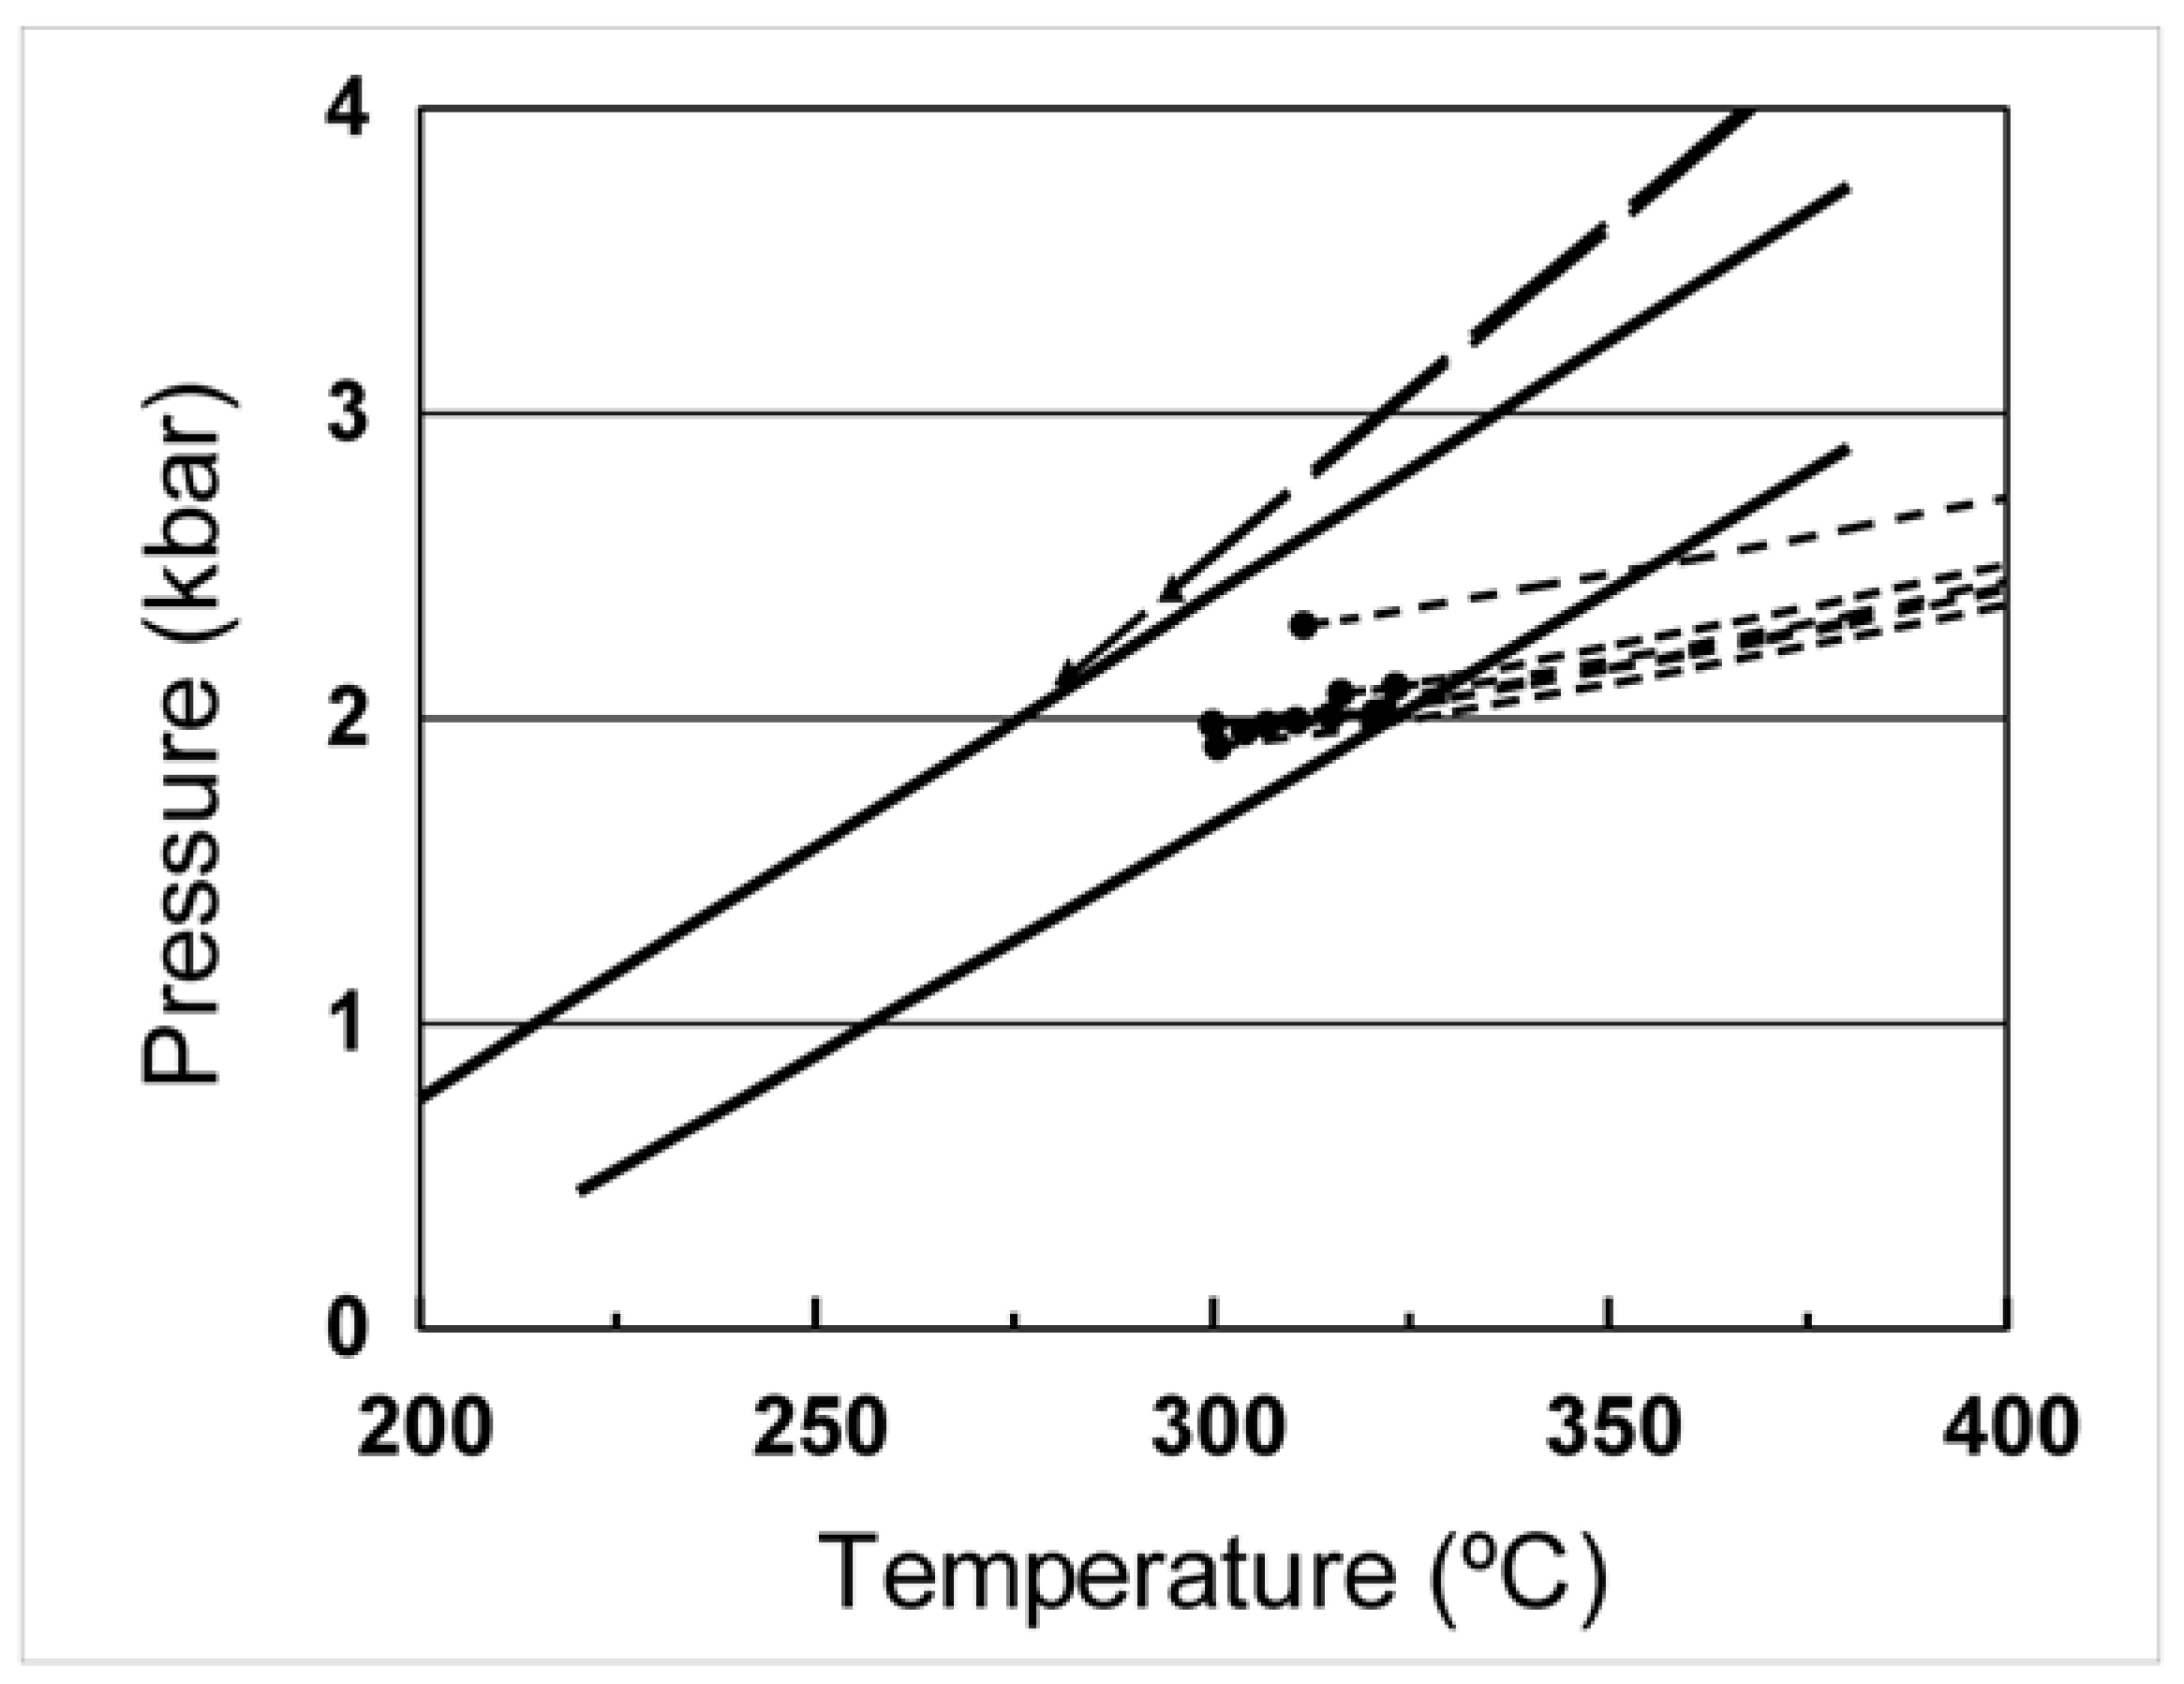
Figure 15.
Results of PHREEQC modelling whereby 0.002 mol of Fe-bearing calcite was incrementally added to fluid constrained by fluid inclusion gas chemistry and phases present in the qsp veins. Each incremental step shows a decrease in H2S and CO2 whereas the pH increases. Gold concentrations calculated by the formulae of [69] indicate a five times decrease in gold solubility.
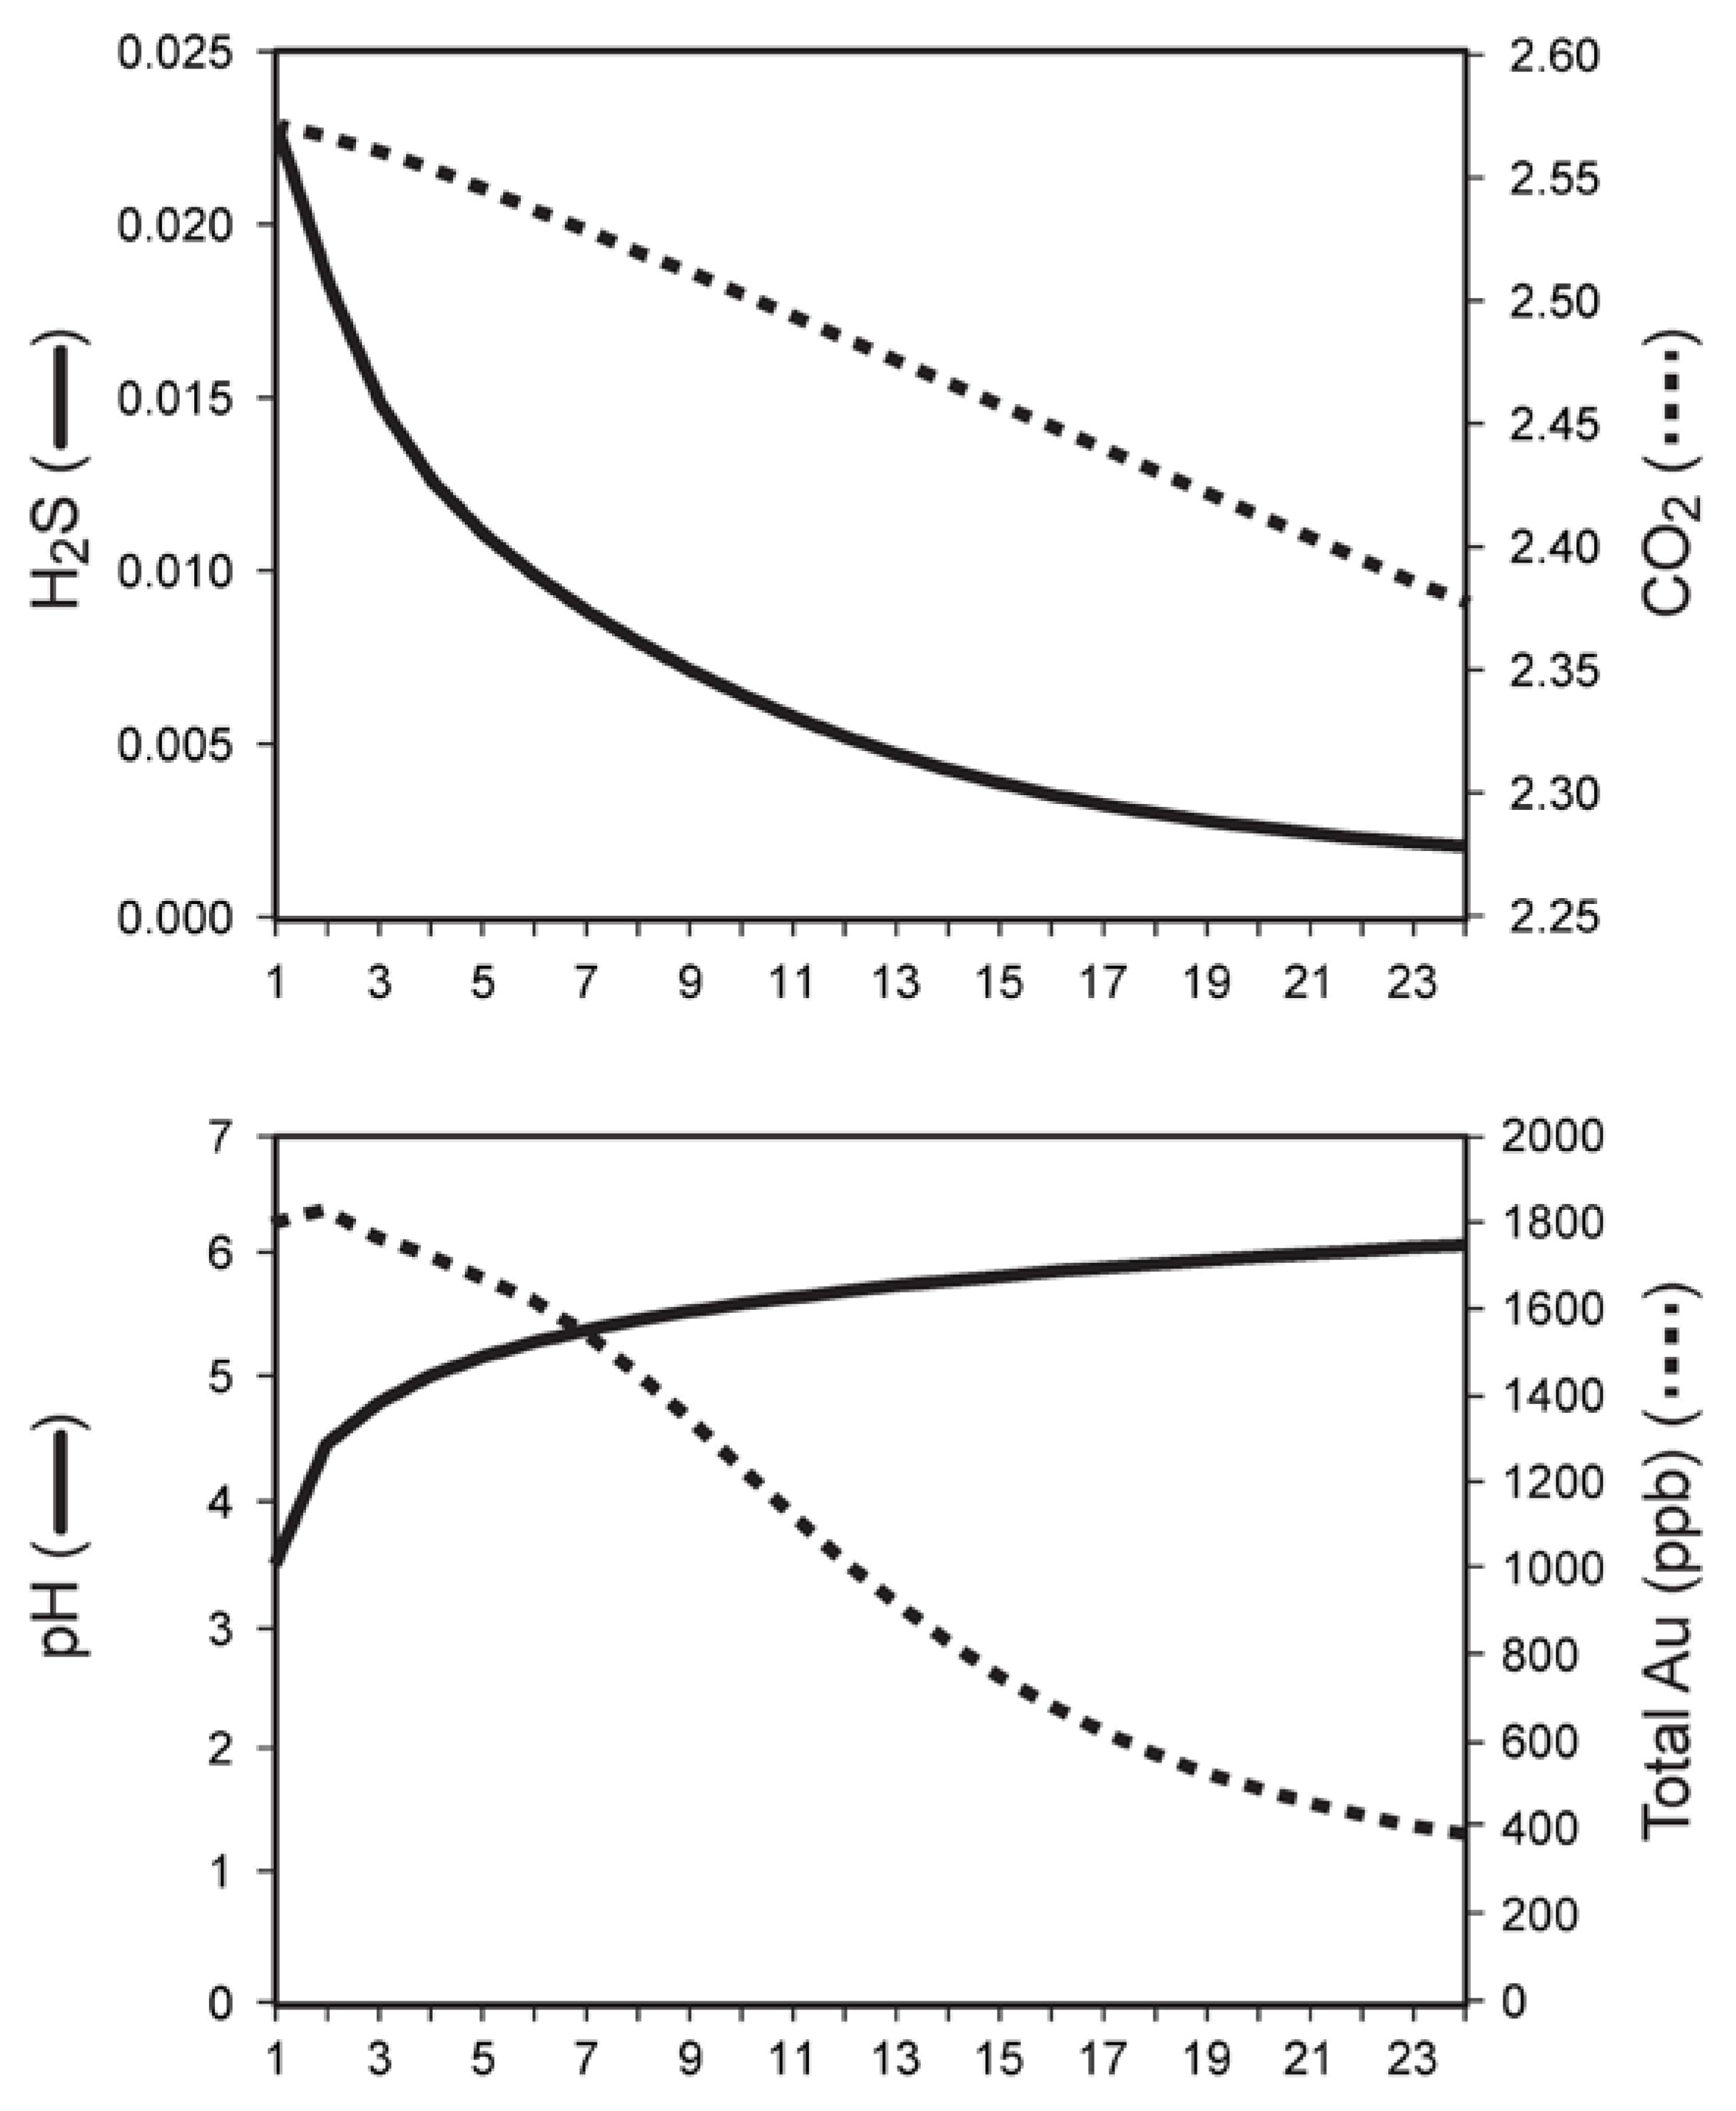

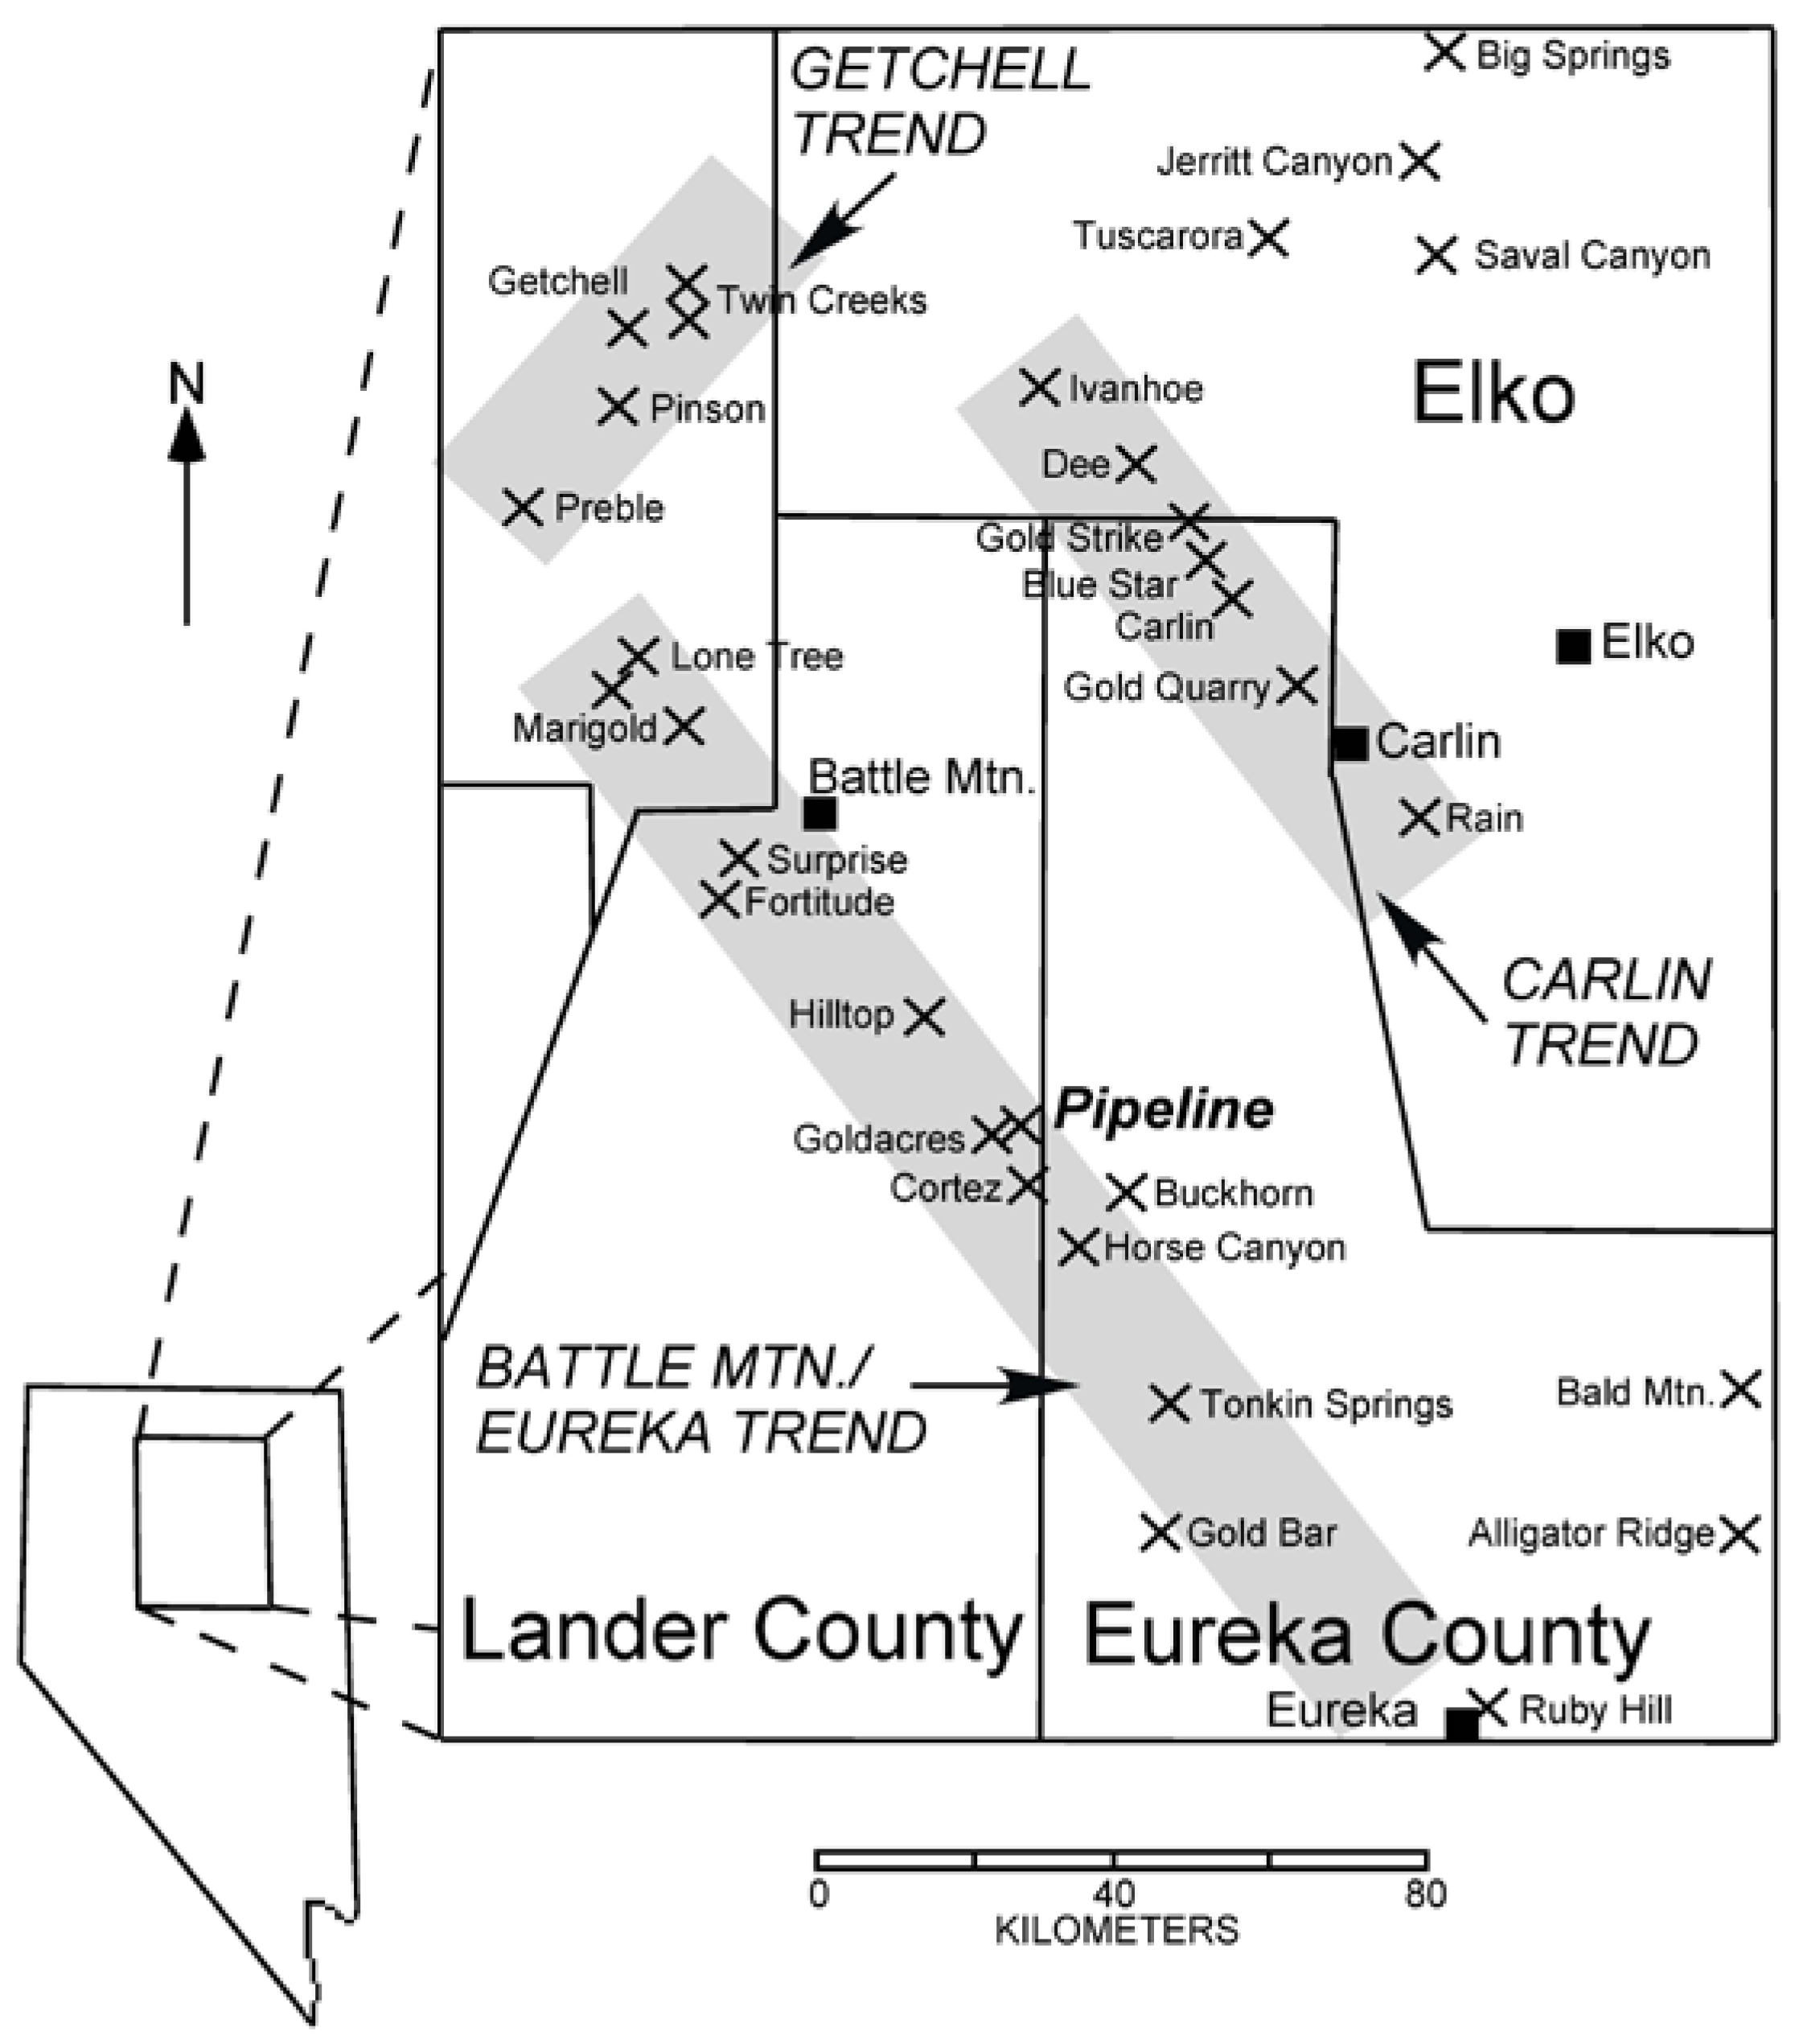
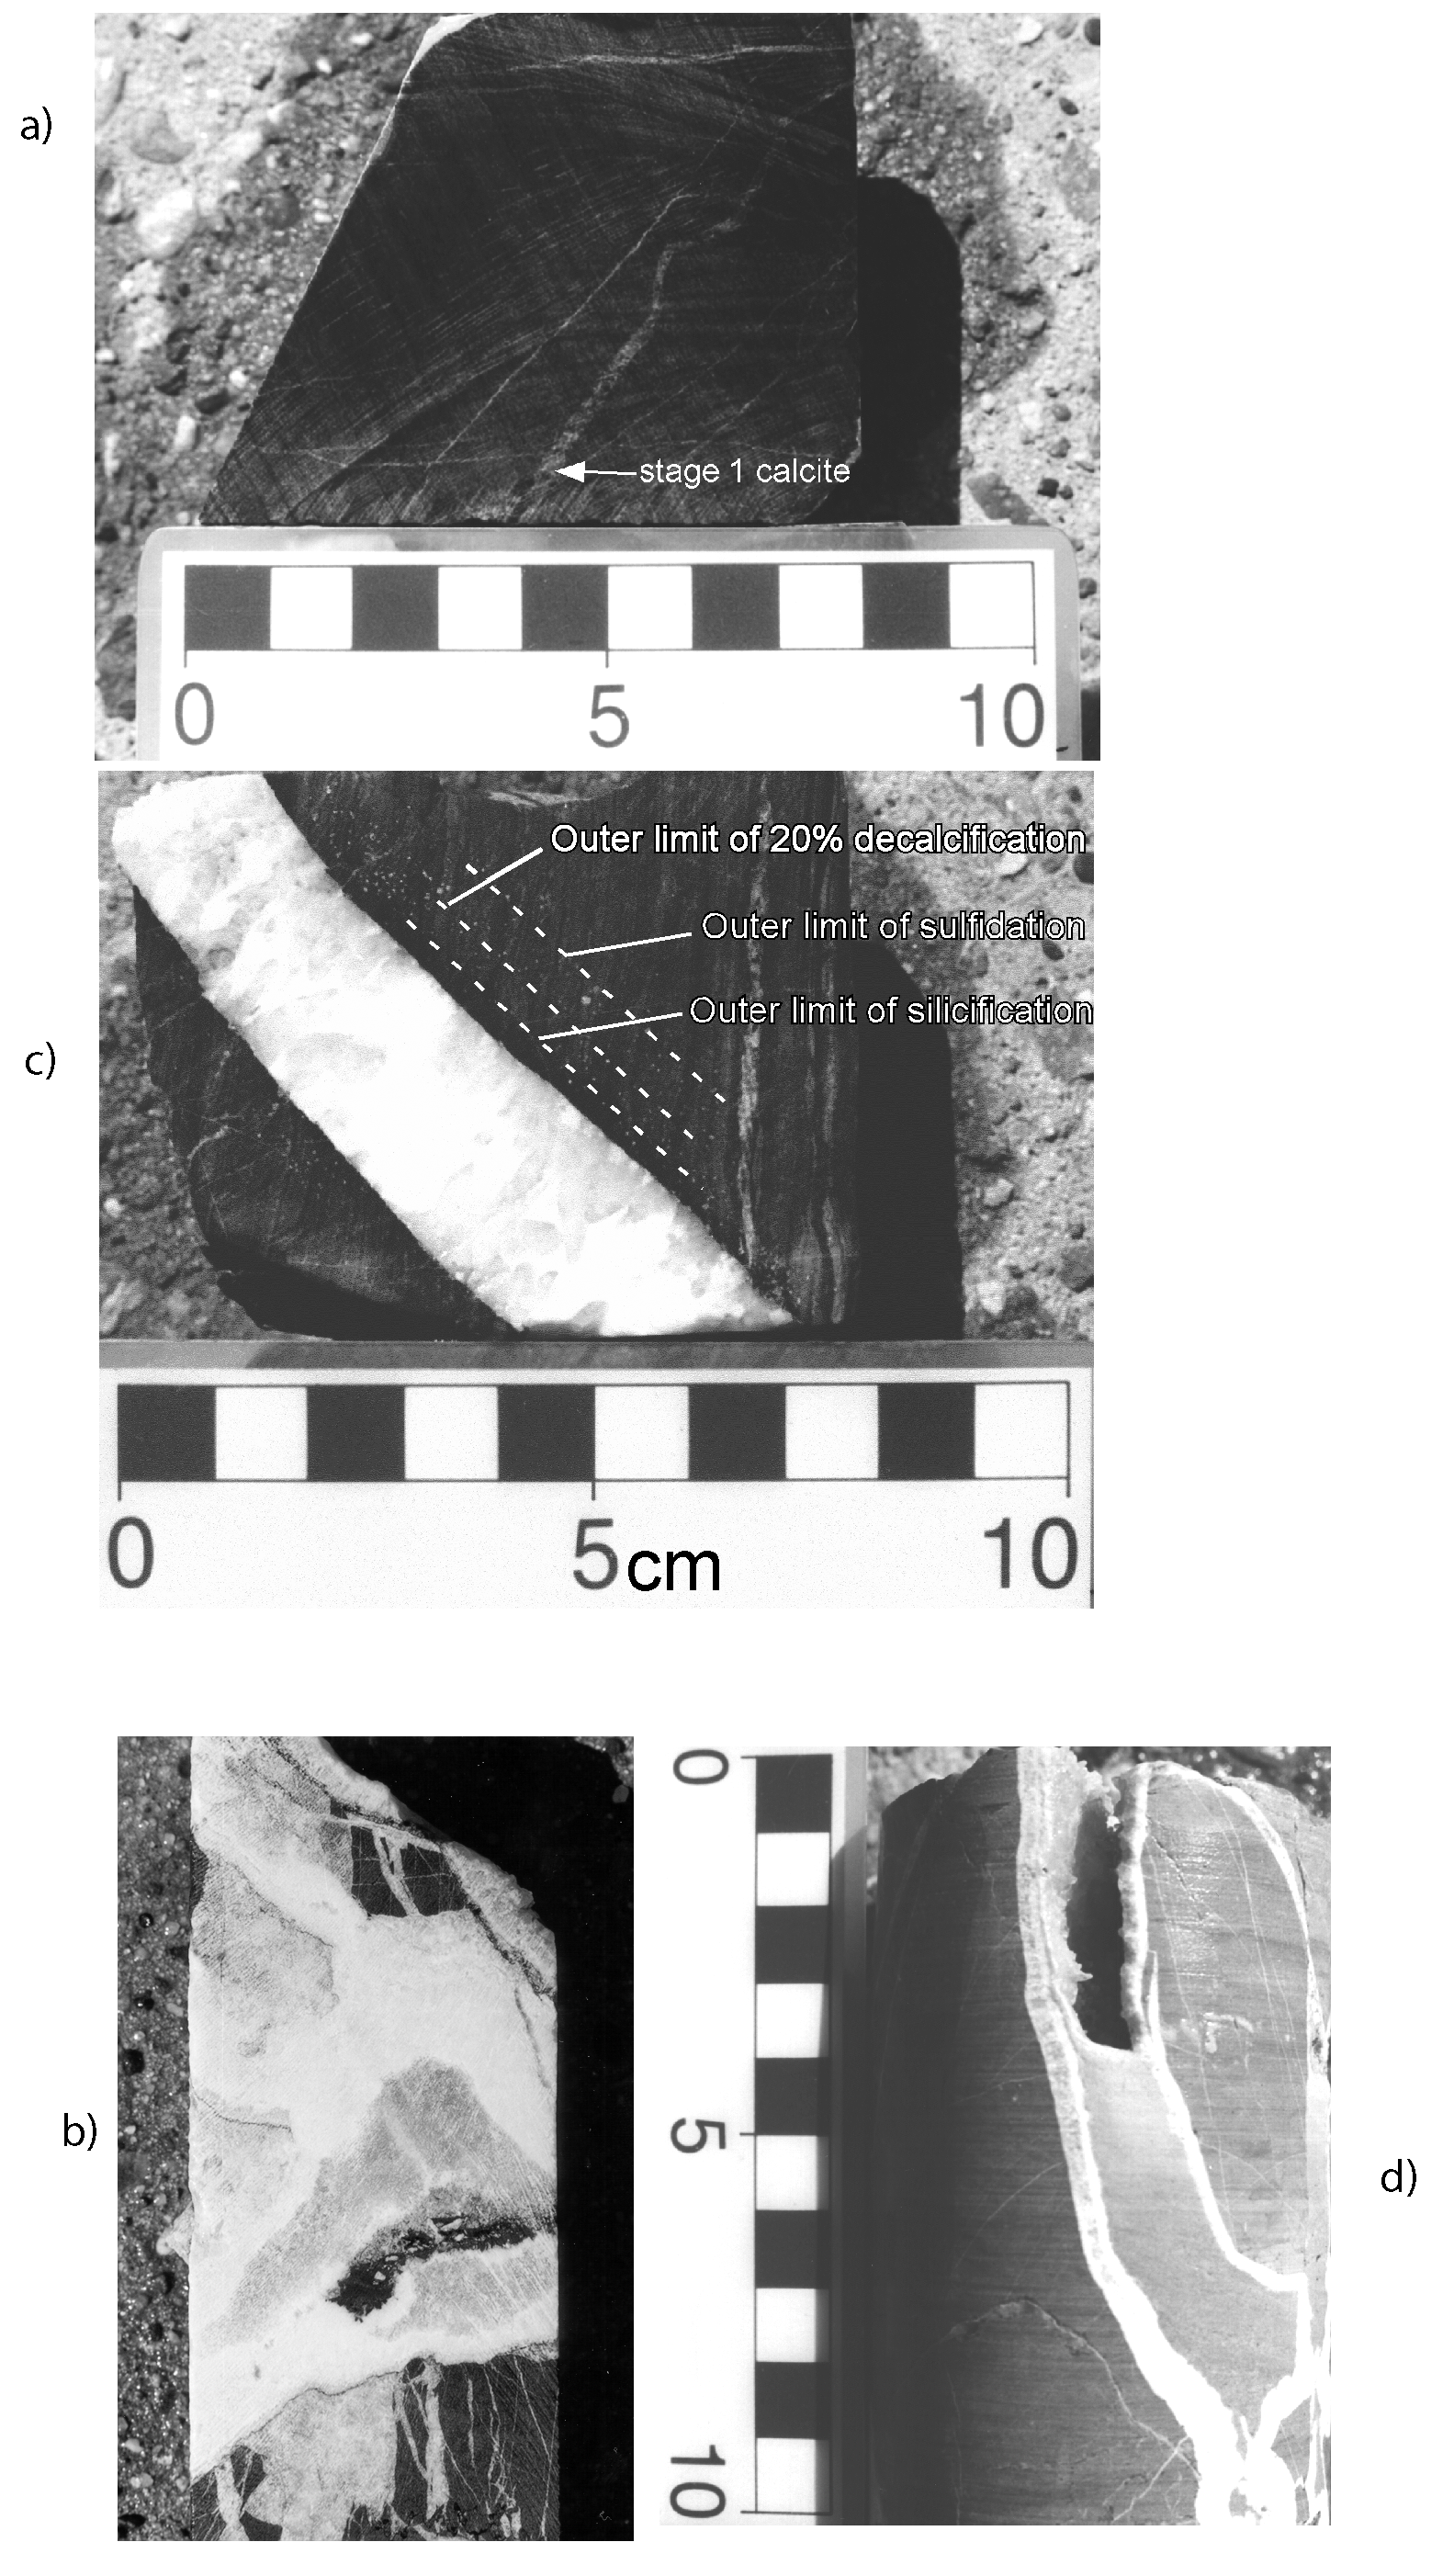
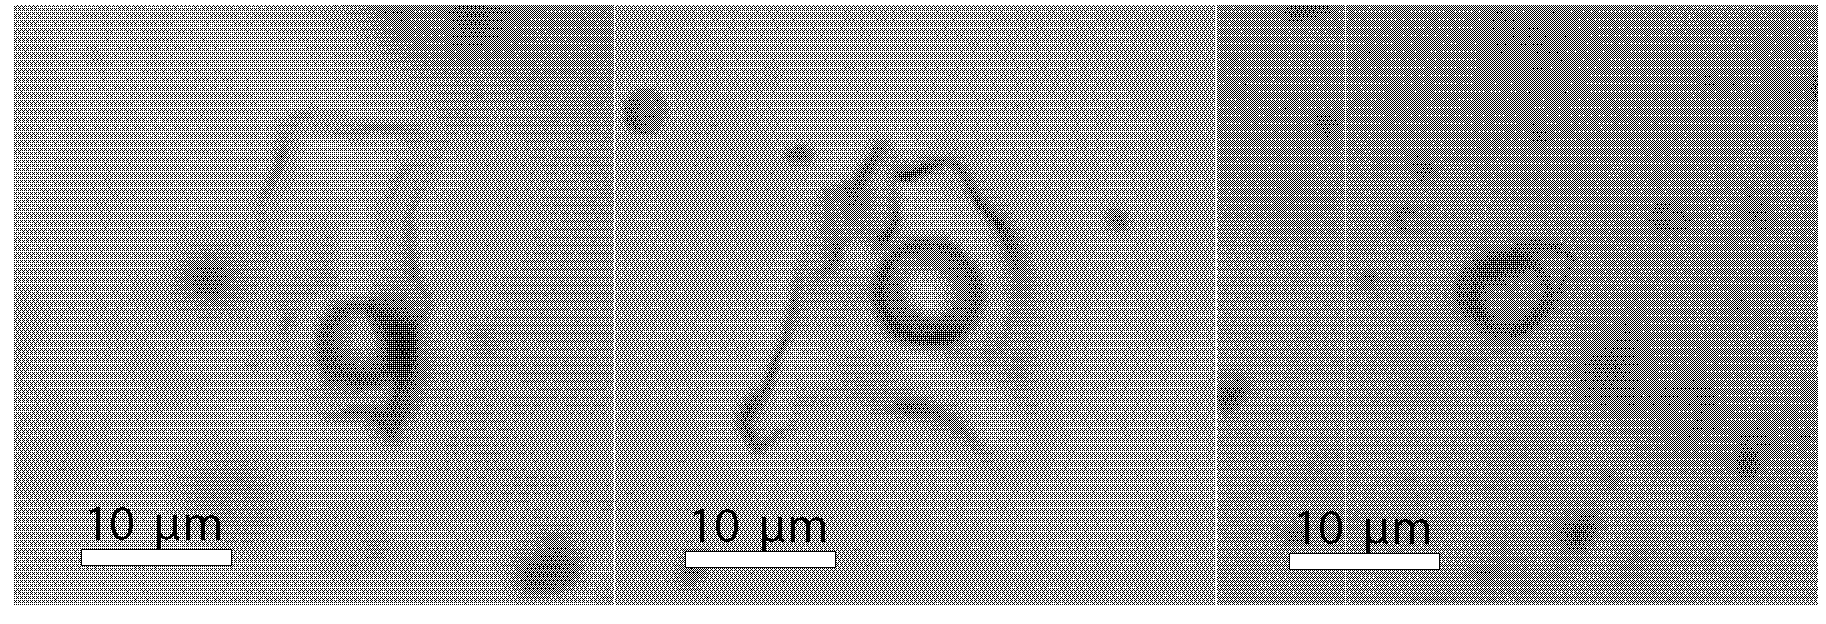
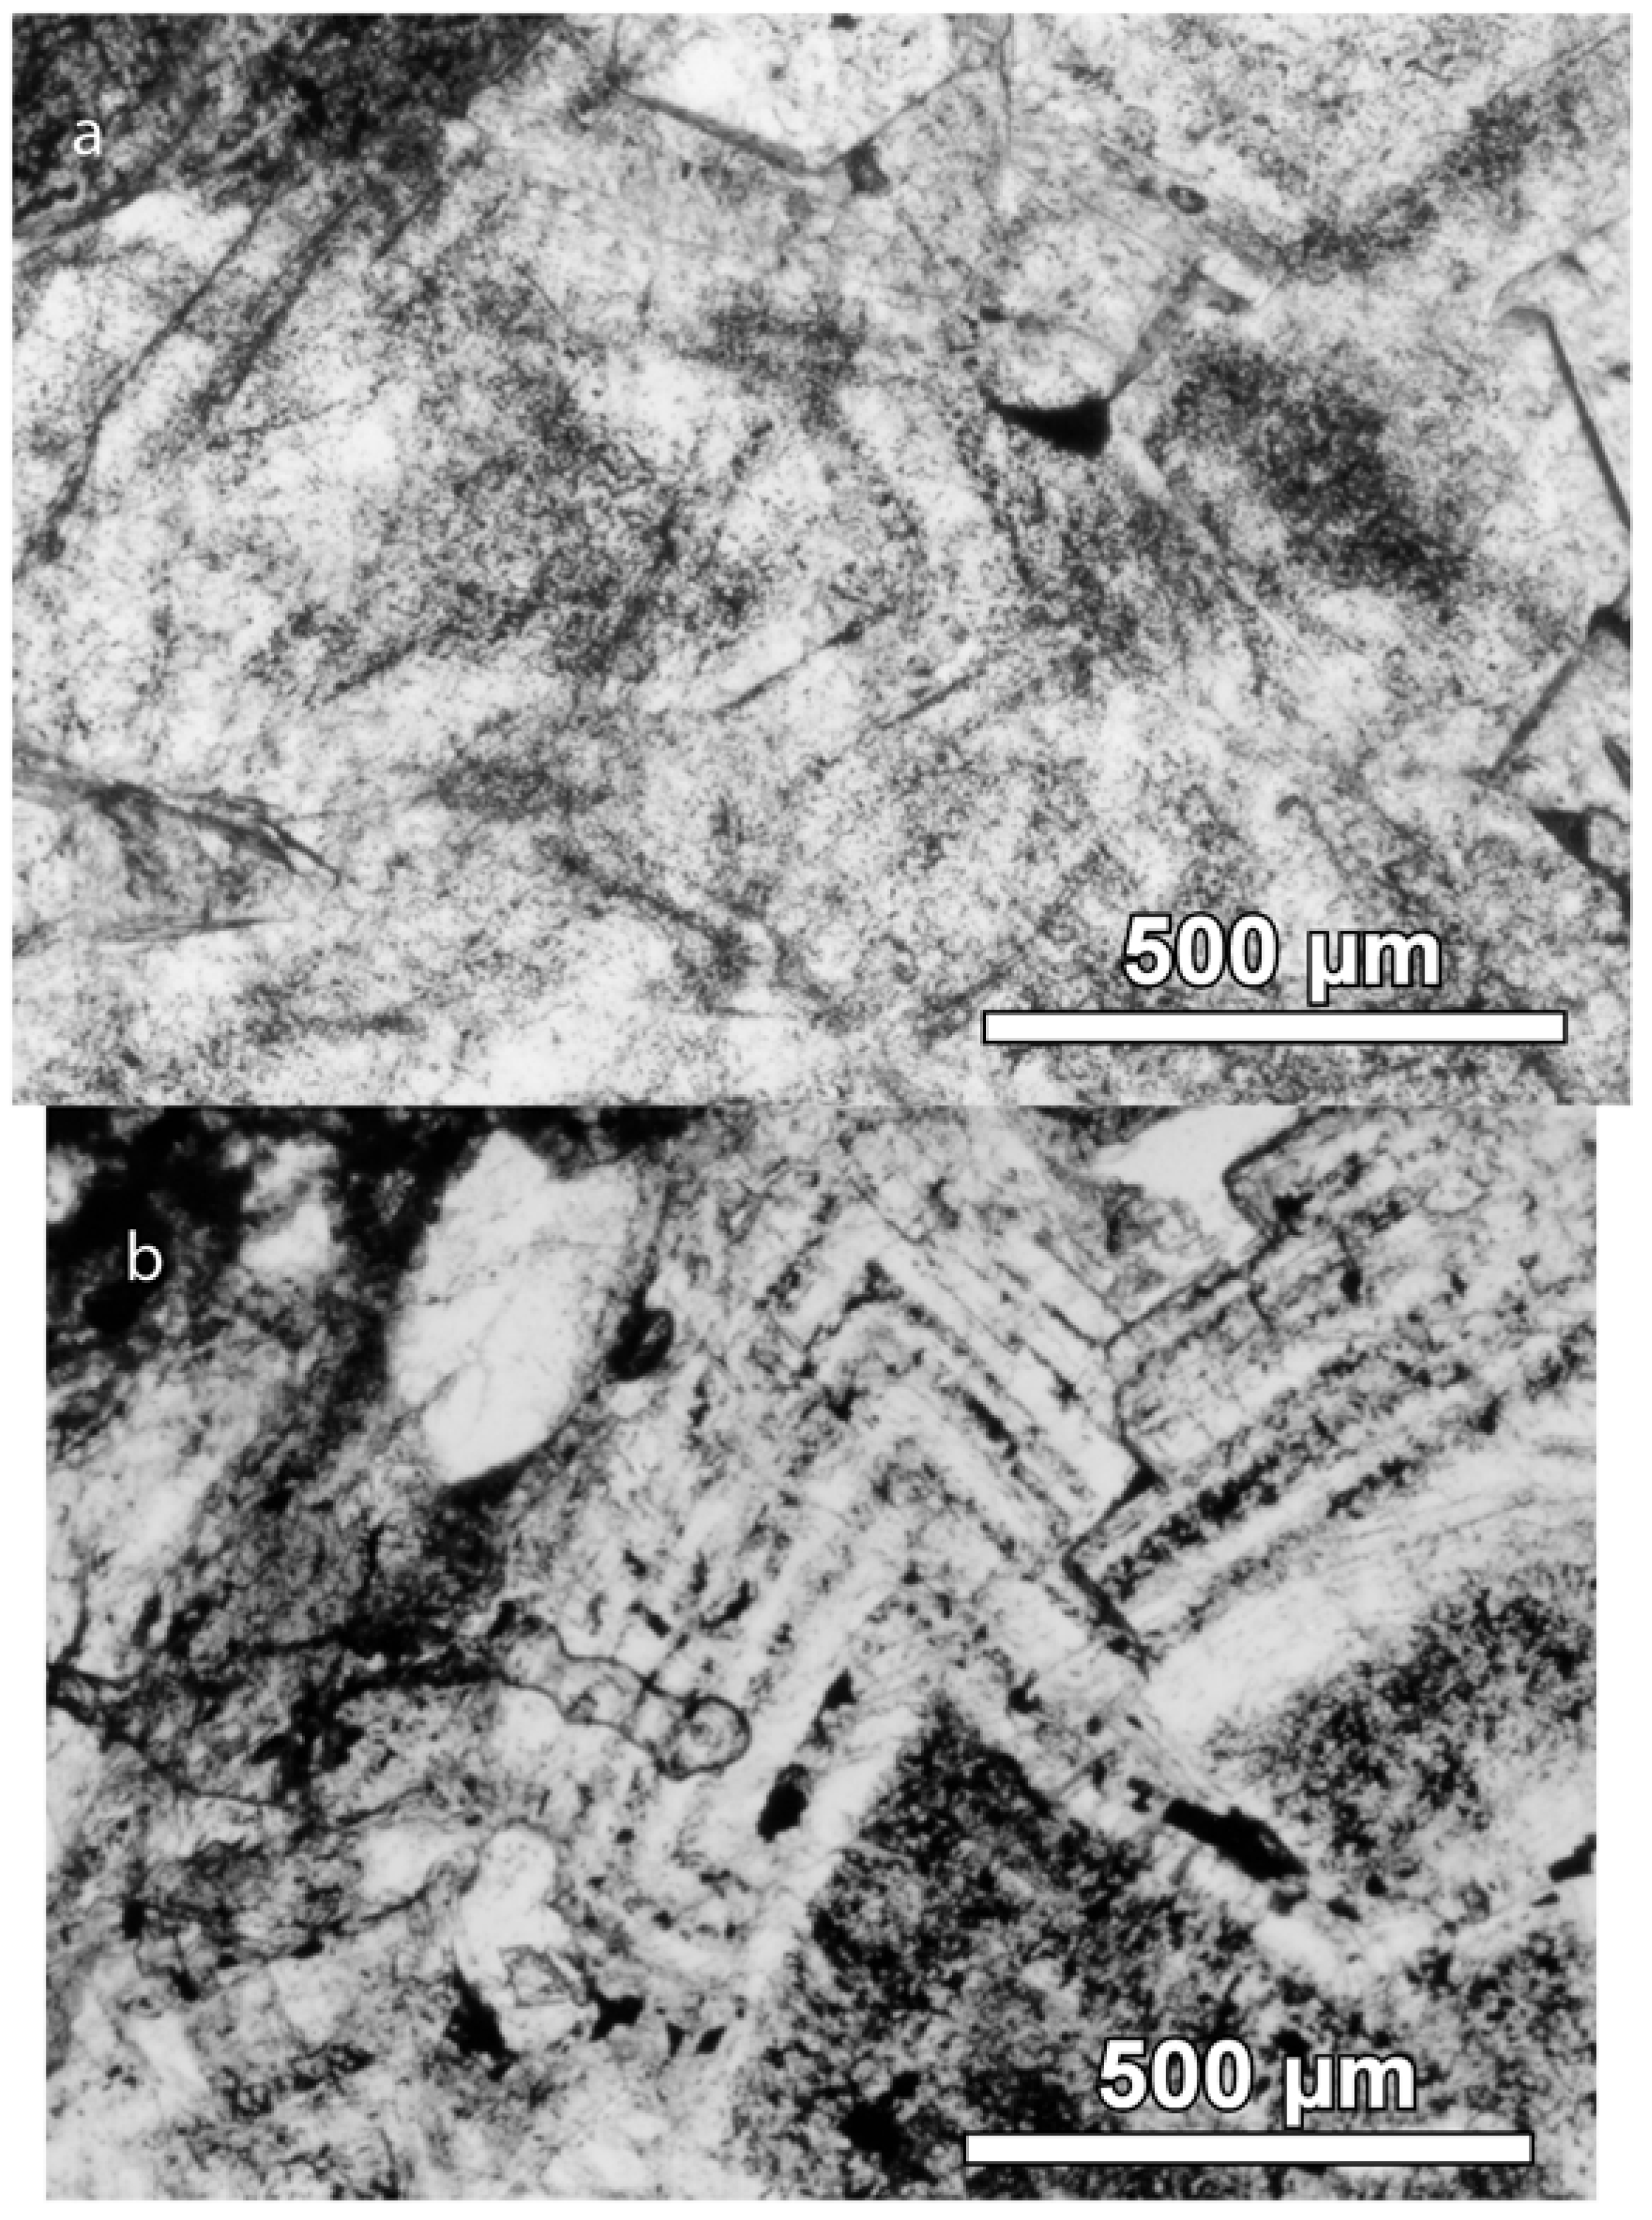
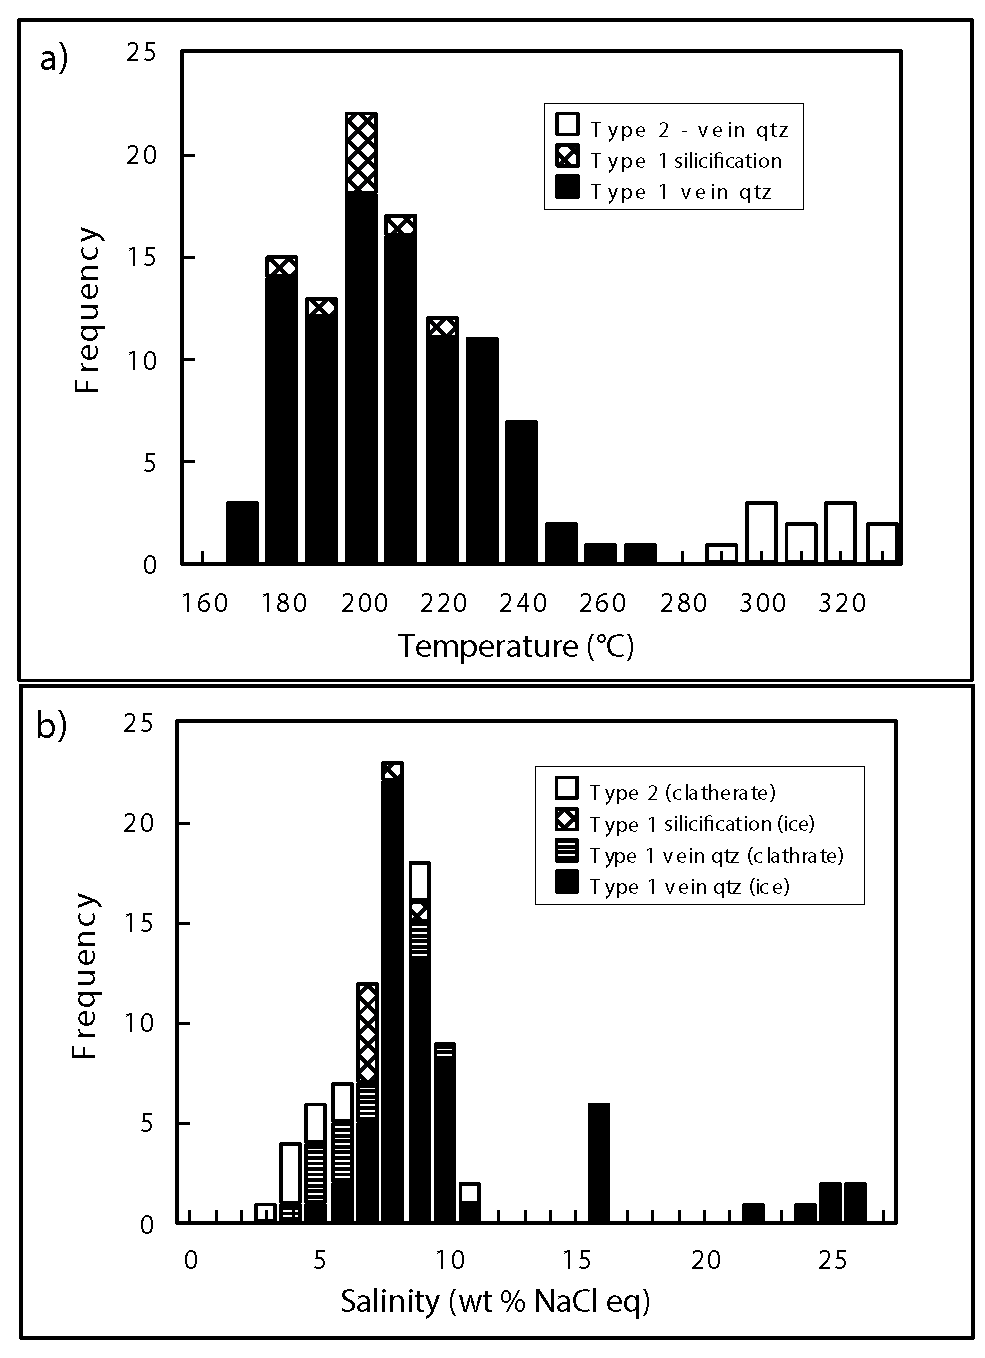
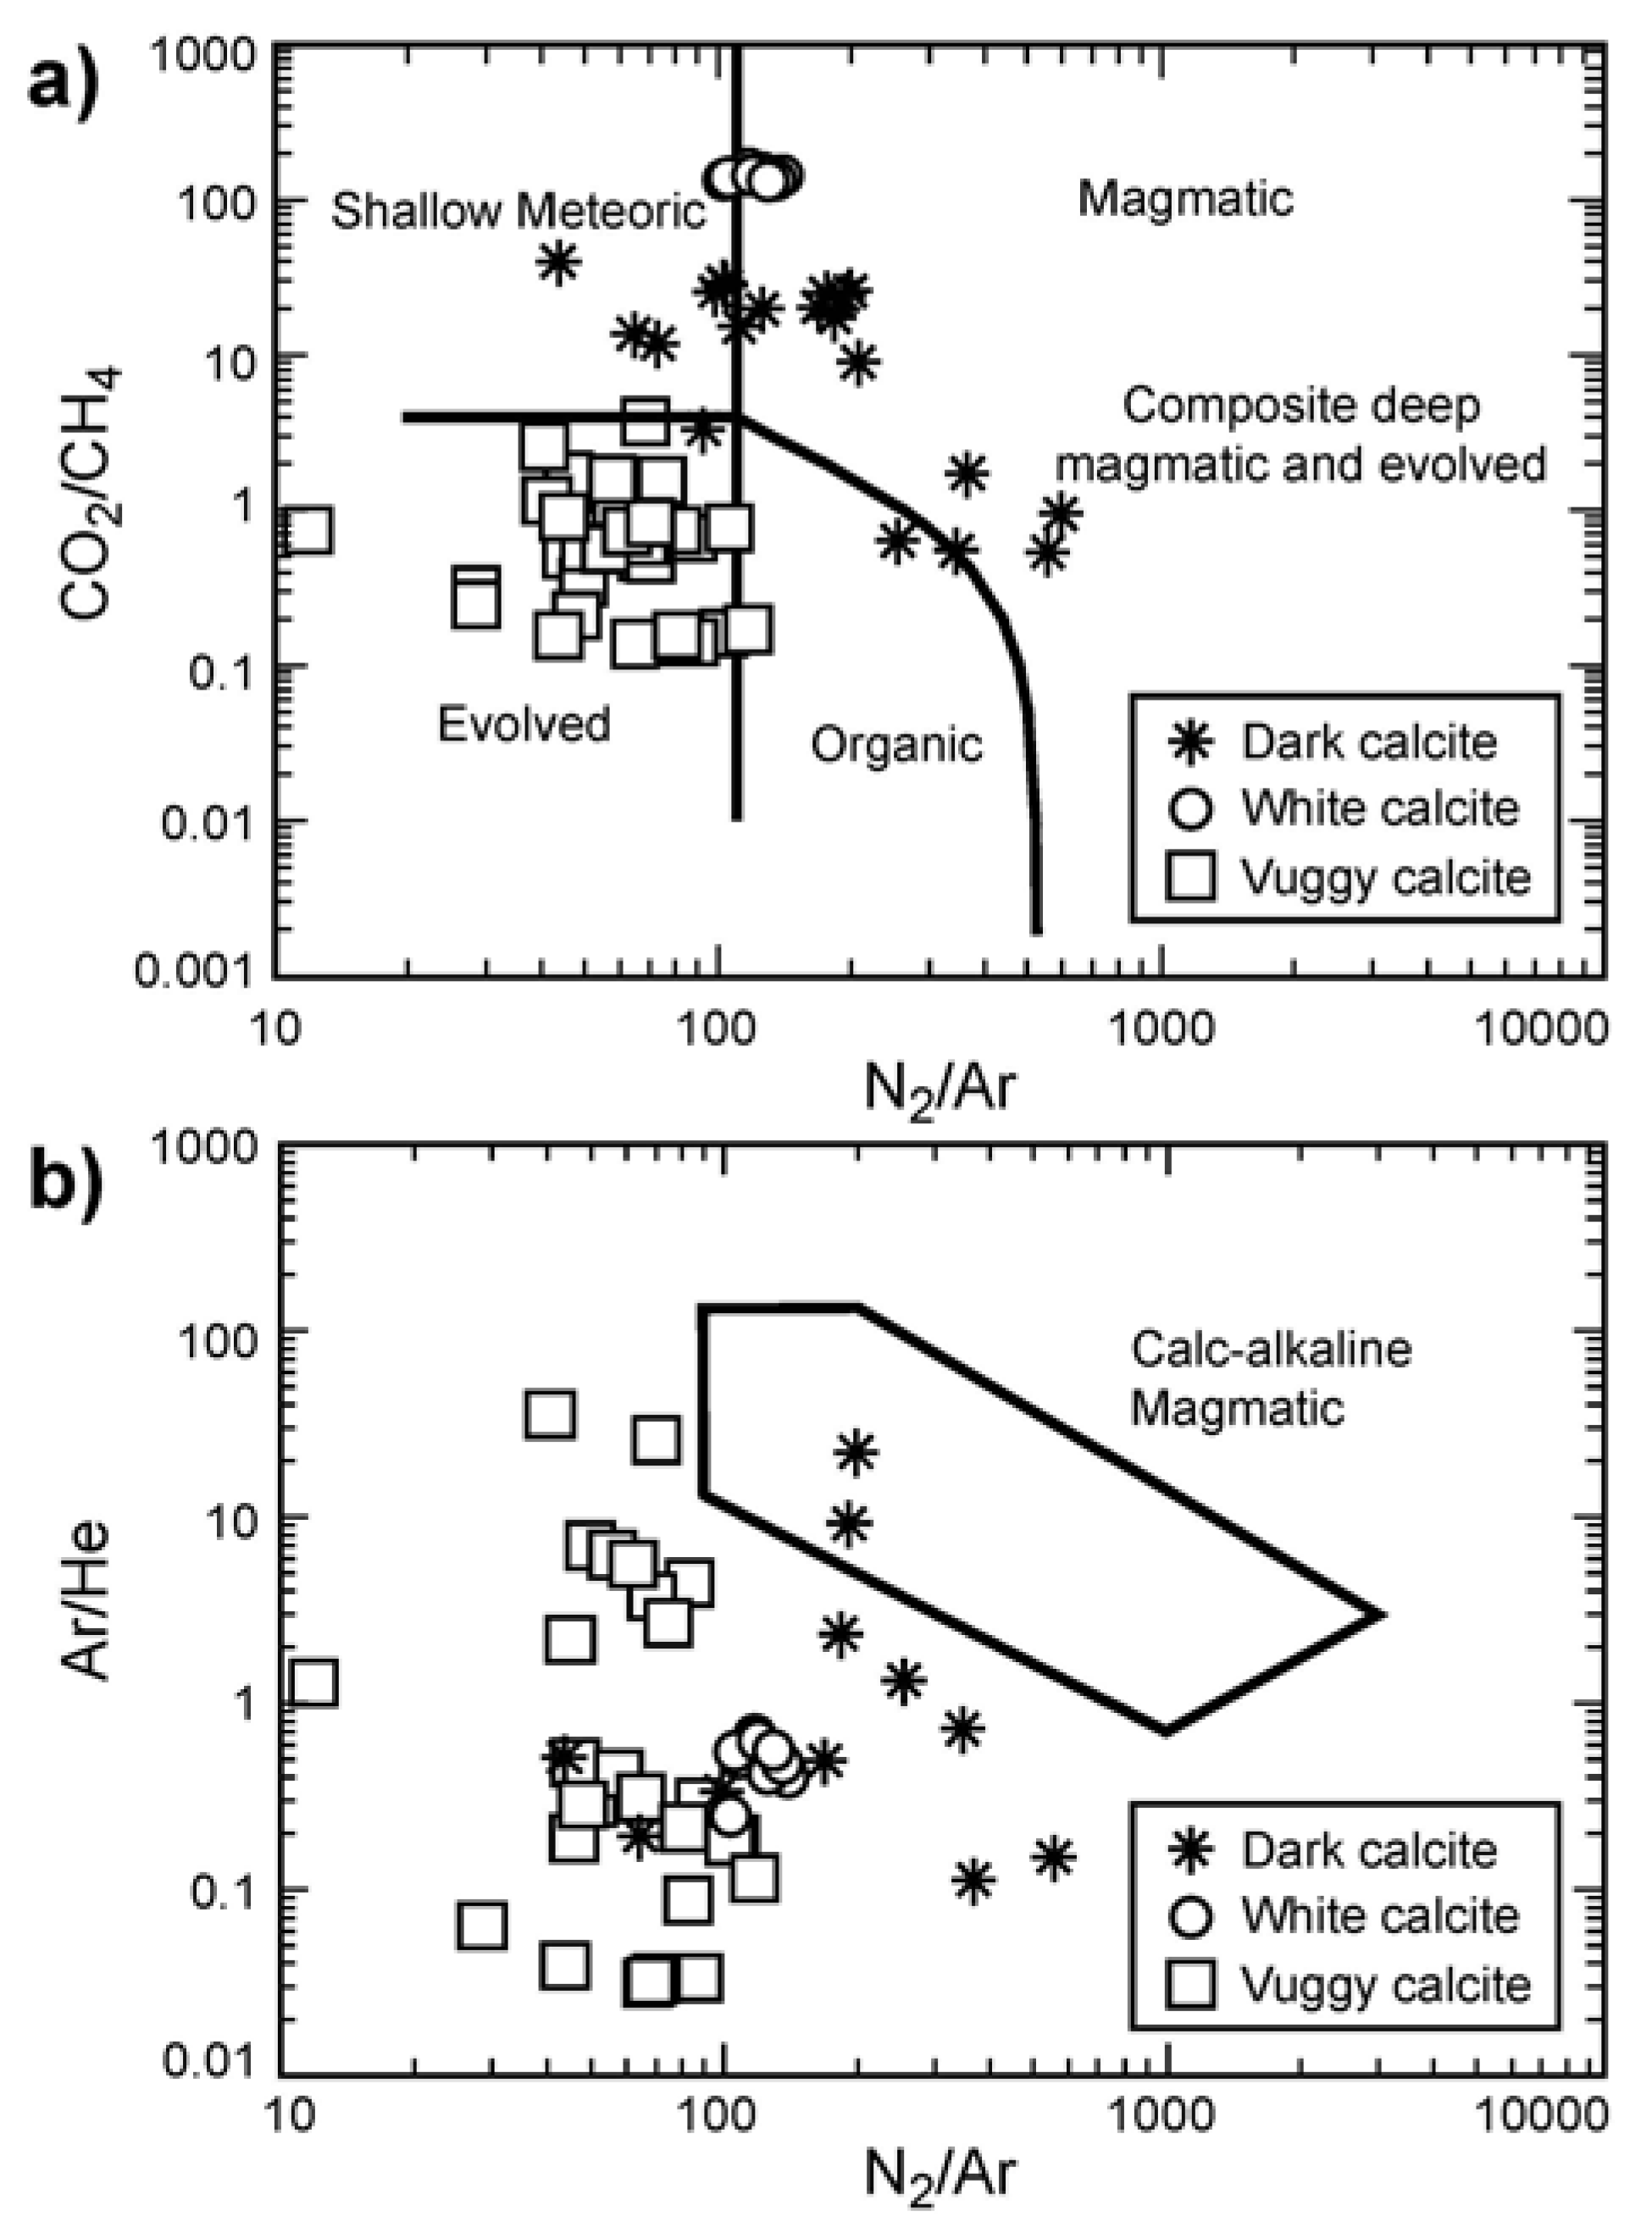
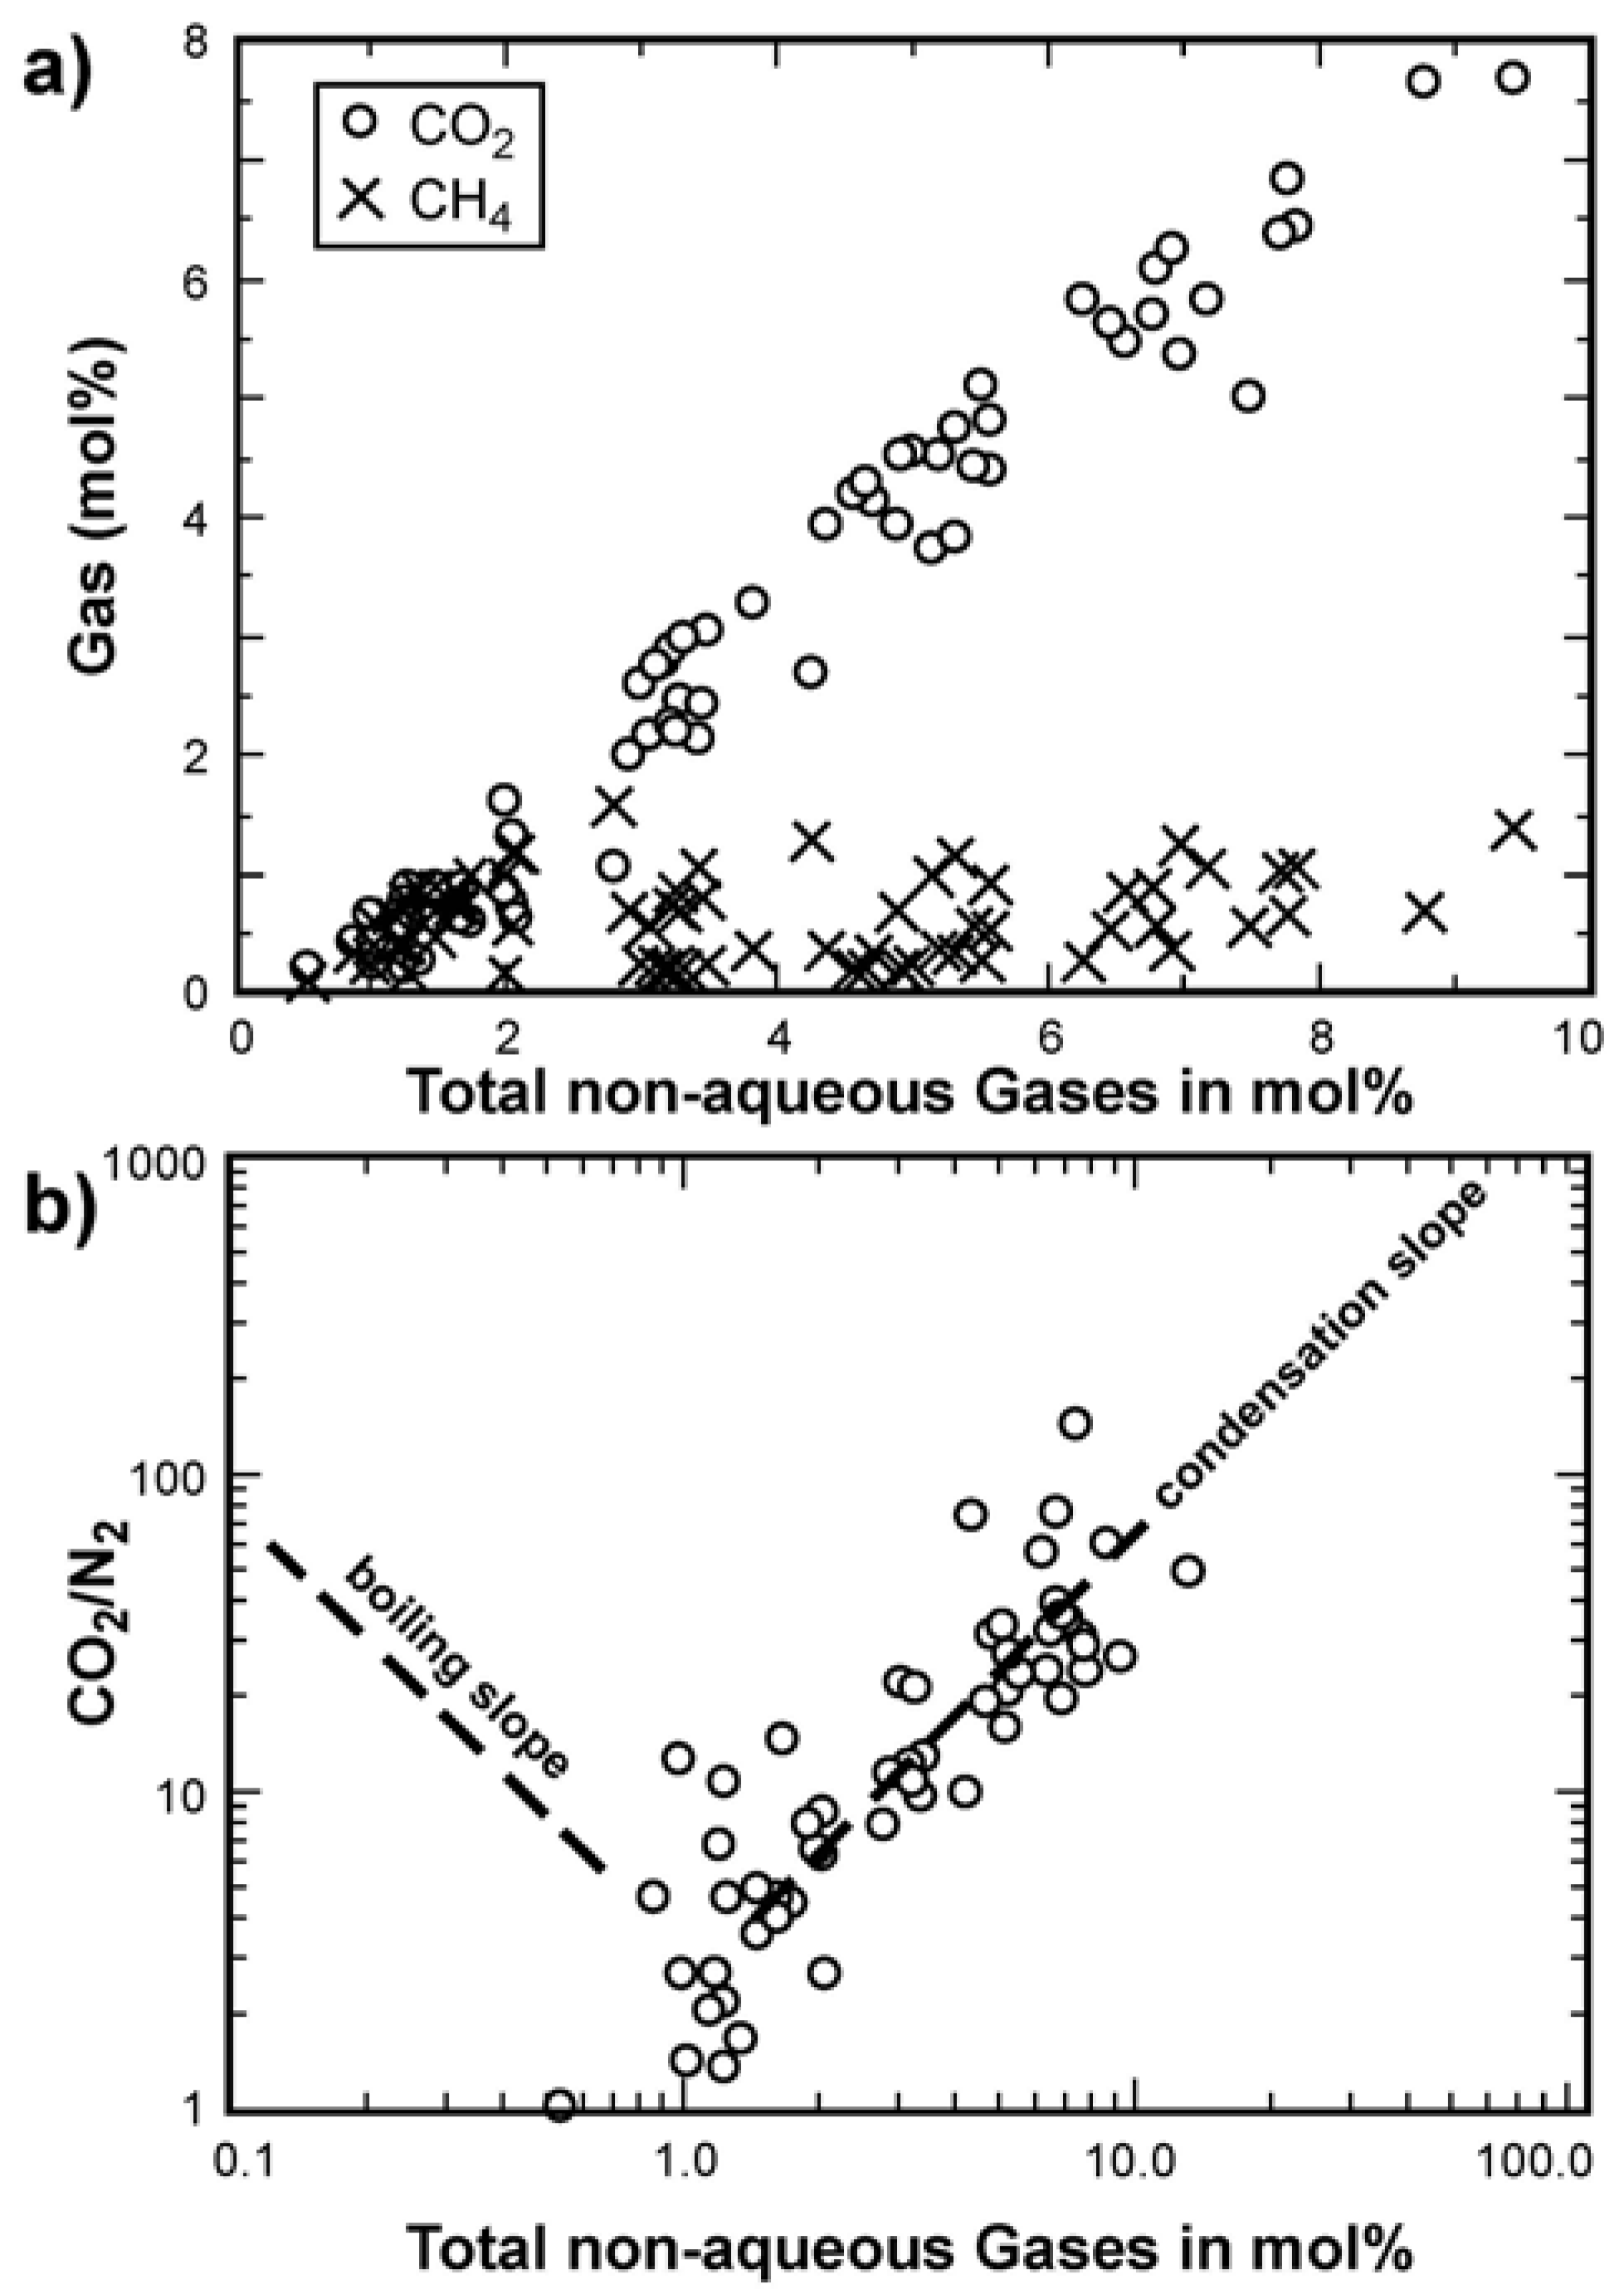
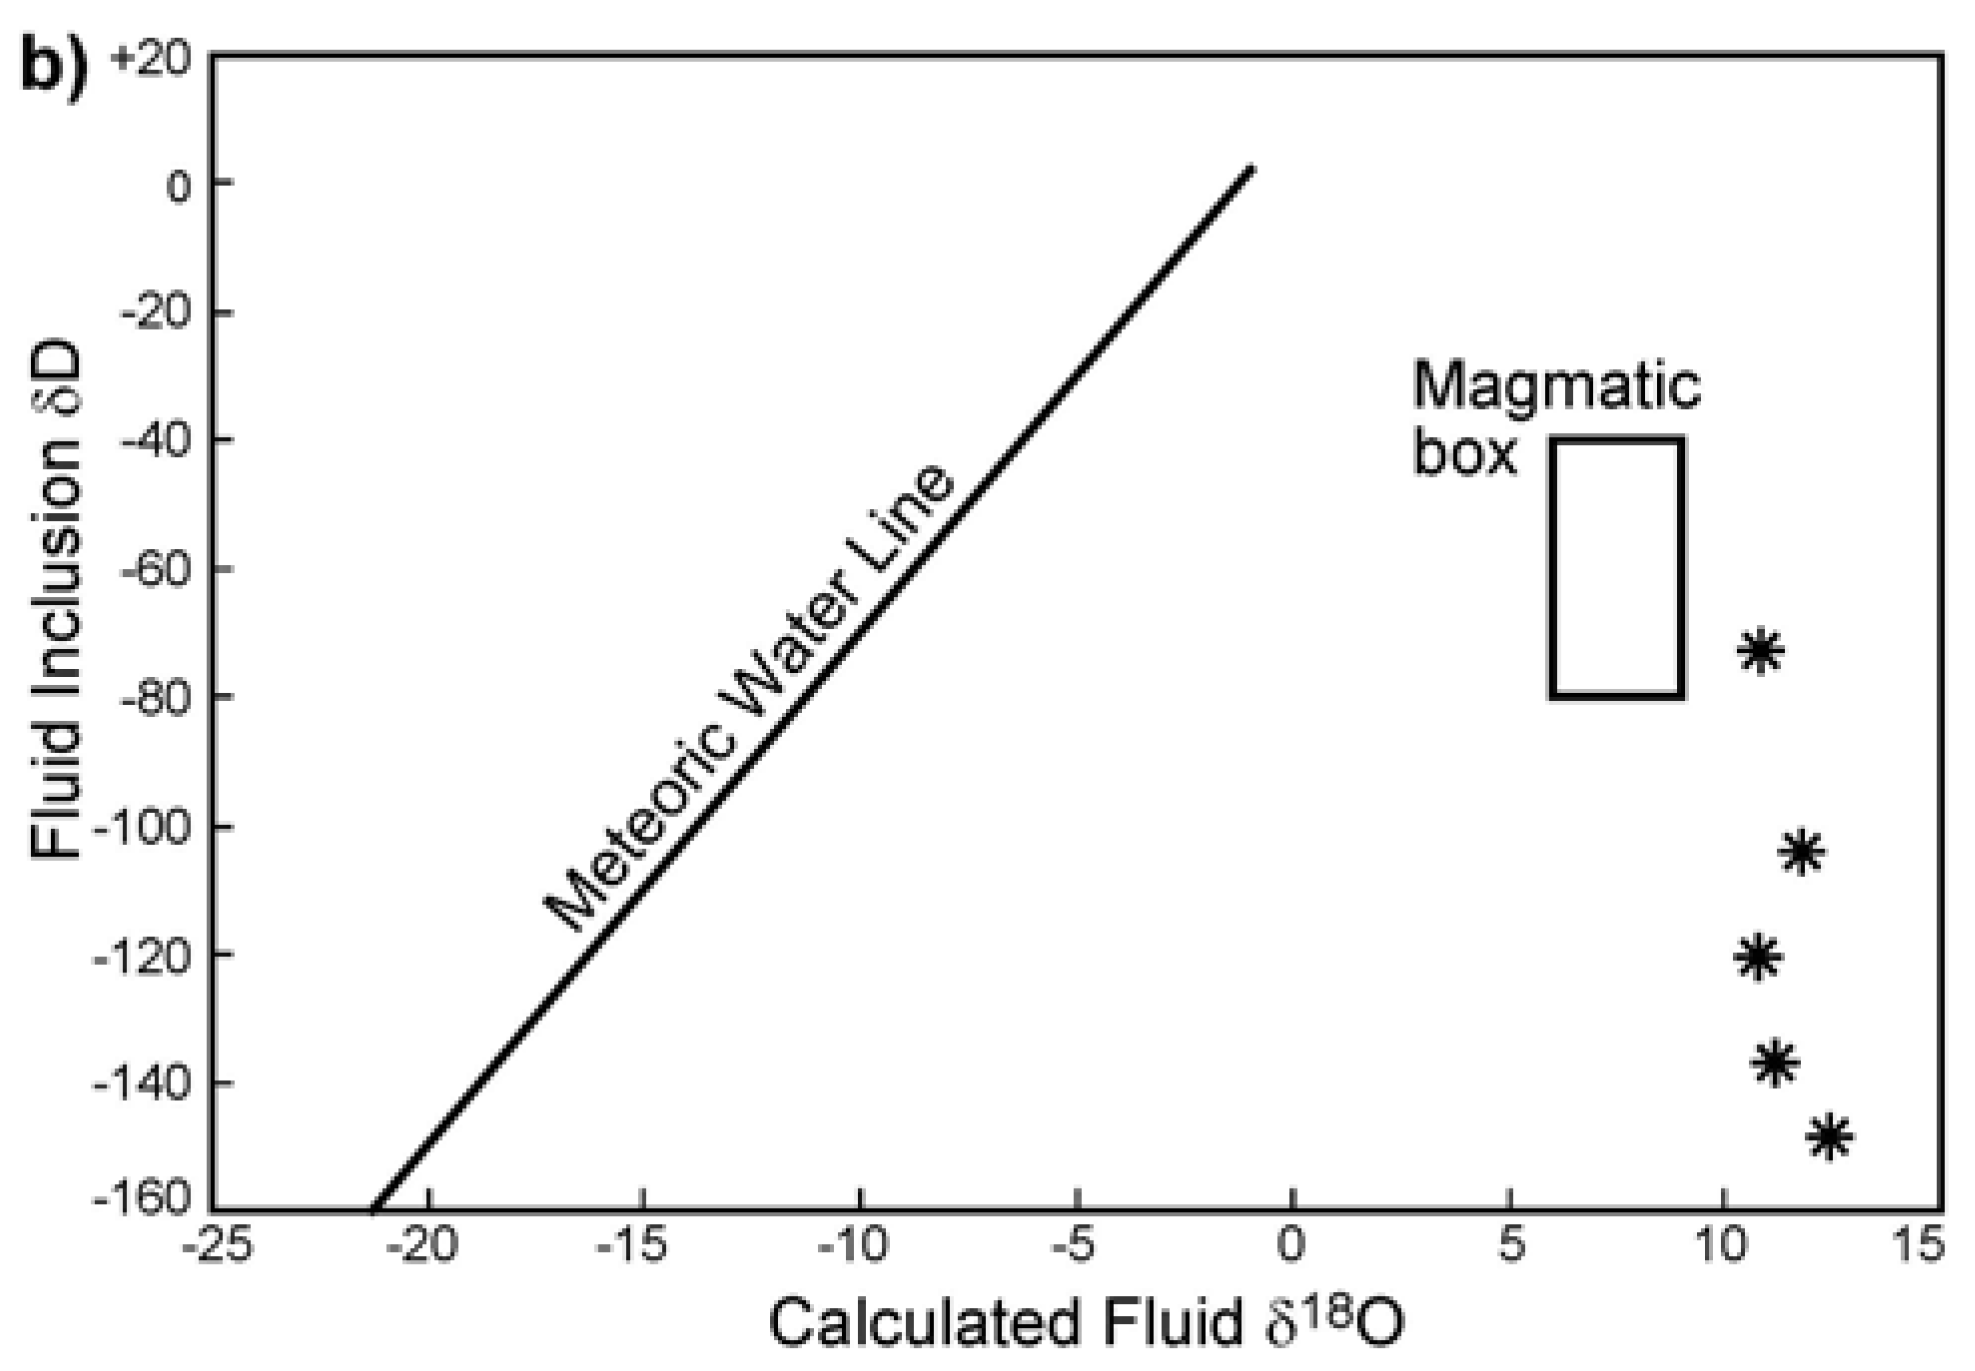
Table 1.
Selected fluid inclusion gas analyses that are most representative of the mode. Note that inorganic and organic analyses were analyzed in separate analyses performed sequentially. Inorganic analyses are reported in mol percent whereas organic species are reported in ppm.
Table 1.
Selected fluid inclusion gas analyses that are most representative of the mode. Note that inorganic and organic analyses were analyzed in separate analyses performed sequentially. Inorganic analyses are reported in mol percent whereas organic species are reported in ppm.
| Stage Mineral Analysis# | Early Dark Calcite 5390L | White Calcite Stockwork 6492L | Qsp-Stage Quartz 5830D | Qsp-Stage Quartz 6208D | Qsp-Stage Calcite 5847L | Late Vuggy Calcite 6058B |
| H2 (mol %) | 0.58 | 0.091 | 0.04 | <0.0001 | <0.0001 | <0.0001 |
| He (mol %) | 0.0003 | 0.007 | 0.0009 | 0.0006 | 0.0001 | 0.0003 |
| CH4 (mol %) | 1.74 | 0.48 | 0.53 | 0.40 | 0.10 | 0.067 |
| H2O (mol %) | 96.4 | 35.7 | 93.5 | 98.8 | 99.2 | 99.9 |
| N2 (mol %) | 0.11 | 0.39 | 0.24 | 0.072 | 0.025 | 0.033 |
| H2S (mol %) | 0.0001 | 0.0028 | 0.011 | 0.0002 | 0.0002 | <0.0001 |
| Ar (mol %) | 0.0005 | 0.0036 | 0.00027 | 0.0001 | 0.0002 | 0.0007 |
| CO2 (mol %) | 1.11 | 63.1 | 5.6 | 0.76 | 0.66 | 0.060 |
| SO2 (mol %) | 0.0001 | 0.0002 | 0.0001 | <0.0001 | <0.0001 | <0.0001 |
| Analysis# | 5861H | 6492R | 5830G | 6208F | 5847J | 6058F |
| C2H4 (ppm) | 348 | 101 | 7 | - | 7 | 5 |
| C2H6 (ppm) | 826 | 705 | 96 | 237 | 23 | 14 |
| C3H6 (ppm) | 511 | 702 | 38 | - | - | - |
| C3H8 (ppm) | - | 25 | 83 | 54 | 21 | 16 |
| C4H8 (ppm) | - | - | 7 | 36 | 7 | - |
| C4H10 (ppm) | 152 | - | - | 9 | 12 | 14 |
| C6H6 (ppm) | - | - | - | - | 1 | 10 |
| C7H8 (ppm) | - | - | - | - | 0.3 | 1 |
Table 2.
Pipeline stable isotope data and calculated fluid isotopic composition. Unless otherwise reported, the analytical standard deviation for calcite δ13C, calcite δ18O, quartz δ18O, and pyrite δ34S are approximately 0.1. The δD analytical error ranges from 4 to 8 per mil. The fluid isotopic compositions reported are calculated based on temperatures, and isotopic fractionation factors from the literature as discussed in the text.
| Sample# | Material | δ13C in ‰ | δ18O in ‰ | ||||
| NB-33 | SRM | −2.90 | +10.8 | ||||
| NB-106 | SRM | −3.00 | +15.9 | ||||
| NB-114 | SRM | −2.69 | +14.4 | ||||
| NB-115 | SRM | −3.07 | +14.8 | ||||
| NB-116 | SRM | +2.90 | +16.3 | ||||
| Sample# | Mineral | Stage | T (°C) | Mineral δ34S | δ34S H2S(a) | ||
| NB-111 | Pyrite | Qsp | 300 | +6.4 | +5.2 | ||
| NB-113 | Pyrite | Qsp | 300 | +4.8 | +3.6 | ||
| NB-114 | Pyrite | Qsp | 300 | +4.4 | +3.2 | ||
| Sample# | Mineral | Stage | T (°C) | Mineral δ18O | δ18O Fluid | F.I. δD | |
| NB-99 | Quartz | Qsp | 300 | +19.0 | +10.8 | −117 | |
| NB-100 | Quartz | Qsp | 300 | +20.6 | +12.4 | −148 | |
| NB-102 | Quartz | Qsp | 300 | +19.4 | +11.2 | −137 | |
| NB-103 | Quartz | Qsp | 300 | +19.0 | +10.8 | −73 | |
| NB-106 | Quartz | Qsp | 300 | −61 | |||
| NB-107 | Quartz | Qsp | 300 | +20.0 | +11.8 | −104 | |
| Sample# | Mineral | Stage | T (°C) | Mineral δ13C | δ13C Fluid | Mineral δ18O | δ18O Fluid |
| NB-77 | Calcite | Early dark | 150 | +0.8 | −0.7 | +24.0 | +11.4 |
| NB-77dup | Calcite | Early dark | 150 | +0.7 | −0.7 | +24.0 | +11.4 |
| NB-43 | Calcite | Early dark | 150 | +1.1 | −0.4 | +20.2 | +7.6 |
| NB-32 | Calcite | Early dark | 150 | +0.2 | −1.3 | +18.4 | +5.8 |
| NB-84 | Calcite | White stockwork | 300 | +1.5 | +0.3 | +19.1 | +13.5 |
| NB-84dup | Calcite | White stockwork | 300 | +1.5 | +0.3 | +19.1 | +13.5 |
| NB-84dup2 | Calcite | White stockwork | 300 | +1.5 | +0.3 | +18.9 | +13.3 |
| NB-84 | Calcite | White stockwork | 300 | +1.5 | +0.3 | +18.9 | +13.3 |
| NB-33 | Calcite | Qsp-calcite | 240 | −3.9 | −5.1 | +17.6 | +9.9 |
| NB-33dup | Calcite | Qsp-calcite | 240 | −4.0 | −5.2 | +17.6 | +9.9 |
| NB-34 | Calcite | Qsp-calcite | 240 | −4.9 | −5.2 | +18.5 | +10.9 |
| NB-106 | Calcite | Qsp-calcite | 240 | −5.2 | −6.5 | +17.6 | +9.9 |
| NB-78 | Calcite | Late vuggy | 150 | −4.5 | −6.0 | +14.2 | +1.6 |
| NB-86 | Calcite | Late vuggy | 150 | −4.1 | −5.5 | +10.0 | −2.6 |
| NB-85 | Calcite | Late vuggy | 150 | −4.7 | −6.1 | +10.3 | −2.3 |
| NB-7 | Calcite | Late vuggy | 150 | −3.9 | −5.3 | +11.5 | −1.1 |
Table 3.
Point analyses that correspond to points show in Figure 12. Note the consistent K2O/Al2O3 ratios whereas the SiO2/(Al2O3+K2O) ratios are variable.
Table 3.
Point analyses that correspond to points show in Figure 12. Note the consistent K2O/Al2O3 ratios whereas the SiO2/(Al2O3+K2O) ratios are variable.
| # | Al2O3 | P2O5 | TiO2 | MgO | CaO | MnO | Na2O | K2O | Al2O3 | SiO2 | Total | K2O/Al2O3 | SiO2/(Al2O3 + K2O) |
|---|---|---|---|---|---|---|---|---|---|---|---|---|---|
| 1 | 4.00 | 0.02 | 0.00 | 0.09 | 0.05 | 0.01 | 0.01 | 1.12 | 4.00 | 70.69 | 76.00 | 0.28 | 13.8 |
| 2 | 3.08 | 0.02 | 0.03 | 0.08 | 0.04 | 0.02 | 0.02 | 0.76 | 3.08 | 83.81 | 87.85 | 0.25 | 21.8 |
| 3 | 1.62 | 0.01 | 0.00 | 0.05 | 0.03 | 0.03 | 0.04 | 0.41 | 1.62 | 94.27 | 96.45 | 0.24 | 46.4 |
| 4 | 1.81 | 0.01 | 0.01 | 0.04 | 0.04 | 0.01 | 0.00 | 0.44 | 1.81 | 75.39 | 77.78 | 0.25 | 33.5 |
| 5 | 2.57 | 0.06 | 0.00 | 0.11 | 0.05 | 0.00 | 0.03 | 0.65 | 2.57 | 94.11 | 97.58 | 0.27 | 29.2 |
| 6 | 2.82 | 0.00 | 0.01 | 0.07 | 0.05 | 0.00 | 0.02 | 0.75 | 2.82 | 92.35 | 96.07 | 0.29 | 25.9 |
| 7 | 3.45 | 0.03 | 0.00 | 0.08 | 0.02 | 0.00 | 0.02 | 1.00 | 3.45 | 82.39 | 87.01 | 0.29 | 18.5 |
| 9 | 2.18 | 0.00 | 0.03 | 0.08 | 0.05 | 0.00 | 0.03 | 0.49 | 2.18 | 81.06 | 83.94 | 0.27 | 30.3 |
| 10 | 2.75 | 0.00 | 0.00 | 0.10 | 0.05 | 0.00 | 0.03 | 0.74 | 2.75 | 82.27 | 85.94 | 0.27 | 23.6 |
Table 4.
Comparison of microthermometry data from several Carlin-type gold deposits. Not all authors report trapping temperatures and the reader is reminded that trapping temperatures are equal to or greater than the homogenization temperatures.
Table 4.
Comparison of microthermometry data from several Carlin-type gold deposits. Not all authors report trapping temperatures and the reader is reminded that trapping temperatures are equal to or greater than the homogenization temperatures.
| Deposit | Salinity (wt % NaCl eq.) | Th (°C) | Reference |
|---|---|---|---|
| Carlin | 0 to 10 | 120 to 290 | Kuehn, 1989 |
| Getchell | 3 to 6 | 160 to 220 | Hofstra and Cline, 2000 |
| Getchell | 1.4 to 42 | 159 to 350 | Groff, 1996 |
| Twin Creeks | 4.8 to 6.0 | 148 to 225 | Groff, 1996 |
| Meikle | 10 to 20 | 200 to 225 | Lamb, 1996 |
| Betze-Post | - | 150 to 210 | Lamb, 1996 |
| Lone Tree | 1.2 to 41.4 | 210 to 411 | Kamali, 1996 |
| Bashishan | 4.3 to 9.3 | 210 to 330 | Cromie and Zaw, 2003 |
| Pipeline | 5 to 10 | 179 to 323 | This study |
© 2017 by the authors. Licensee MDPI, Basel, Switzerland. This article is an open access article distributed under the terms and conditions of the Creative Commons Attribution (CC BY) license (http://creativecommons.org/licenses/by/4.0/).
Share and Cite
MDPI and ACS Style
Blamey, N.J.F.; Campbell, A.R.; Heizler, M.T. The Hydrothermal Fluid Evolution of Vein Sets at the Pipeline Gold Mine, Nevada. Minerals 2017, 7, 100. https://doi.org/10.3390/min7060100
AMA Style
Blamey NJF, Campbell AR, Heizler MT. The Hydrothermal Fluid Evolution of Vein Sets at the Pipeline Gold Mine, Nevada. Minerals. 2017; 7(6):100. https://doi.org/10.3390/min7060100
Chicago/Turabian StyleBlamey, Nigel J.F., Andrew R. Campbell, and Matt T. Heizler. 2017. "The Hydrothermal Fluid Evolution of Vein Sets at the Pipeline Gold Mine, Nevada" Minerals 7, no. 6: 100. https://doi.org/10.3390/min7060100
Note that from the first issue of 2016, this journal uses article numbers instead of page numbers. See further details here.