Abstract
The El Callao district, with a total endowment of more than 2000 t Au, is considered to be the most prolific gold resource in Venezuela. Mineralization is hosted by a vein system that is genetically associated with the El Callao transpressional shear zone. This vein system consists of a network of interconnected quartz–albite–ankerite veins enveloping a large number of metabasaltic fragments that host gold-bearing pyrites. Based on detailed mineralogical, microstructural, and fluid inclusion studies, a pressure-temperature pathway was established for the evolution of the mineralizing fluid during shear-zone development and exhumation. This path is characterized by repeated episodes of fluid pressure fluctuation from lithostatic (higher than 1.6 kbar) to near-hydrostatic values (<0.4 kbar), recorded throughout the transition from the quasi-plastic to frictional deformation cortical domains. Each successive pressure drop induced boiling of the hydrothermal fluid, with the resulting fluid phase separation controlling: (i) pyrite and invisible gold crystallization, which occurred during ductile and ductile-brittle transition strain conditions, and (ii) primary gold remobilization with consequent native-refined gold precipitation, occurring mainly under brittle conditions. The metallogenic framework that was proposed for the El Callao shear zone can be used as a vector to explore and characterize other mineralized shear zones in the Guiana Shield and analogous orogenic systems worldwide.
1. Introduction
Located in the Guiana Shield of South America (Figure 1), the El Callao gold deposit is hosted by the El Callao shear zone, a megatectonic feature extending through the entire Guyana Craton in Venezuela [1,2]. El Callao is the most prolific gold district in Venezuela (>2000 t gold [1]) and it is considered as a giant orogenic gold deposit [2]. This study focusses on the Colombia Mine (Figure 1b) which, with reserves of ~24 Moz (740 t), is the largest producing mine in this district [2].
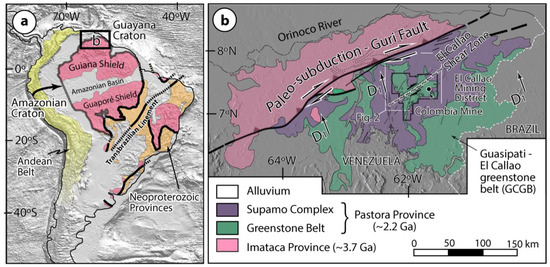
Figure 1.
(a) Simplified geological setting of the geotectonic provinces of South America, modified after Velásquez et al. [1]. (b) A sketch map illustrating the regional geology of the Guayana Craton (Venezuela), the location of the Guri Fault, the El Callao Shear Zone, and the El Callao Mining District (modified after Velásquez et al. [1]). Dashed inset in (b) outlines the position of Figure 2.
Orogenic gold deposits are typically formed at a late stage of the deformational–metamorphic–magmatic history of an evolving orogeny [3,4,5,6]. They are believed to be syn-kinematic with at least one main penetrative deformation stage of the host rocks, based on the widespread observation that the deposits structurally cut across fabrics that were formed during orogenesis, and that most of them are largely unaffected by early orogenic deformation [3,4,5,6].
During the past several decades, orogenic lode gold deposits have been investigated from different points of view, including structural analysis of veins systems, petrological and geochemical studies of alteration and ore paragenesis, and fluid inclusion studies [6,7], providing insights into the origin of the mineralizing fluids as well as on the pressure-temperature (P-T) evolution within fault zone systems. The majority of these studies have documented the involvement of CO2-H2O-NaCl fluids and they pointed to the role of fluid unmixing on gold mineralization [6,8,9,10]. The latter process is considered to be related to pressure fluctuations within a fault zone, rather than to post-entrapment modifications [9,10], and has been commonly interpreted to be responsible for triggering the precipitation of most of the sulfides as well as gold in orogenic systems [11,12,13]. However, accurate linking fluid circulation history, repeated pressure fluctuations, and ore deposition is still a subject of debate [14].
In this paper, we present the results of detailed studies of mineral microstructures and fluid inclusions (distribution, typology, and chemical composition) from the mineralized rocks of the El Callao shear zone. Using these data, we propose a pressure-temperature fluid circulation pathway during the development and exhumation of the El Callao shear zone, and propose a direct link between pressure fluctuations and gold endowment. Our metallogenic model can be replicated to explore or to characterize others gold-bearing shear zones in the Guiana Shield or in equivalent belts elsewhere.
2. Geological Background
The Guiana Shield (Figure 1a) covers an area of nearly 900,000 km2 between the Amazon and the Orinoco rivers and it underlies the territory of five countries: Venezuela, Guyana, Suriname, French Guiana, and Brazil [15]. In Venezuela, the northern part of the Guiana Shield, known as the Guayana Craton (Figure 1b), is subdivided into several geological provinces, of which the two oldest are related to the metallogenic framework for orogenic gold deposits [1], namely: (1) The Archean Imataca Province and (2) The Pastora Province, a Trans-Amazonian Paleoproterozoic granitoid–greenstone terrane, hosting the Guasipati-El Callao Greenstone Belt (GCGB; Figure 1b), where the El Callao gold mining district is located (Figure 1b). The NE–SW trending Guri Fault (Figure 1b), is localized in Venezuela, i.e., the Guayana Craton, and it juxtaposes Paleoproterozoic volcano–plutonic terranes against gneissic rocks of the Archean Imataca Province (Figure 1b). The Guri Fault is interpreted as a tectonic plate contact, in which the Pastora oceanic plate subducted under the Imataca continental plate at the climax of the Trans-Amazonian Orogenesis [16]. Later, this plate contact was transformed from an oblique subduction to an oblique collision, at the end of the Trans-Amazonian Orogenesis. During the collision, the Pastora oceanic plate accommodated mainly trench-orthogonal deformation, as evidenced by regional greenschist-facies-metamorphic cleavage fabrics and kilometric-scale folds (Figure 1b). This superimposed tectonic condition transformed the subduction plate contact on a lithospheric-scale fault (the Guri Fault; Figure 1b). Such processes were evidenced by the formation of a suture zone on the position of the previously-formed subduction margin. The convergent contact accommodated dextral strike-slip deformation, configuring the current architecture of the Guri Fault [16]. The development of this lithospheric-scale fault zone generated several shear zones, parallel to the Guri Fault, which are mainly located in the oceanic Pastora plate [1], under a transpressive regime. The Guri Fault has been reactivated in several deformation events [16], including the Nickerian Orogenesis (~1200 Ma [16]) and during the opening of the Atlantic Ocean (210–190 Ma [16]). Finally, the long-term kinematics of the Guri Fault seems to be consistent with neotectonic re-activation processes, although this aspect is still a subject of discussion and research.
In the El Callao mining district (Figure 1b), gold mineralization is considered to have formed at the ductile to brittle deformational transition environment [2], related to a succession of deformational stages, including mainly (Figure 1b and Figure 2): (i) a regional deformation, trending 15°–20° N, which corresponds to the orientation of major structures (e.g., folds and cleavages), which are associated with the collisional events and marked by greenschist-facies metamorphism (D1); (ii) development of 45°–65° N shear zones, e.g., the El Callao shear zone (Figure 1b), host of gold-bearing quartz veins (D2) parallel to the Guri Fault; and, (iii) a 140°–180° N brittle fracturing (D3) that affected the entire El Callao shear zone [16]. These tectonic events are associated to the cortical deformation during shear zone formation and exhumation [2,16]. Other brittle structures that were found in the mining district were generated during the final superficial exposure of the shear zones and are considered to postdate mineralization.
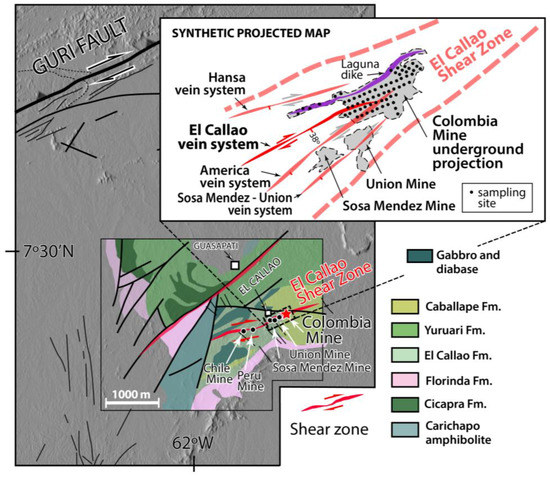
Figure 2.
Simplified geology of the El Callao mining district (modified after Velásquez et al. [2]) showing the localization of the El Callao shear zone and the Colombia Mine (study area). The sketch map in the inset represents a projection of the underground observations at the Colombia mine, locating the sampling sites.
Gold was discovered in the Guayana Craton by natives, probably in the 1820s–1830s, but it is only in the 1850s that the first gold pellet was found in the area now covered by the El Callao Mining District (Figure 1b). In 1993, the United States and the Venezuelan geological surveys [17] compiled more than 200 sites for gold (mines, prospects and occurrences) within the area of the Venezuelan Guayana Craton and were classified most as belonging to the low-sulfidation gold–quartz vein deposit type.
3. The El Callao Gold Shear Zone
The El Callao shear zone (Figure 1b and Figure 2) is the most thoroughly explored zone in the District [16]. It is parallel to the Guri Fault and located south of it (Figure 1b and Figure 2). The kinematics of the shear zone is dextral and it is related to the Guri Fault kinematics [16] (Figure 1b and Figure 2). It measures 2 to 10 m in width, strikes 45° N–65° E and dips 38° SE [1], and extends for at least 10 km toward the southwest [16]. The shear zone hosts several operating mines, including the Colombia, Sosa-Mendez, Union, Peru, and Chile mines (Figure 2), with a mean gold grade value of 10 g/t [2,16].
Our research is focused on the Colombia Mine (Figure 1b and Figure 2), which is an underground operation that extends to some 430 m below the surface. The mine counts seven exploitation levels: the more superficial (L1) is located at 133 m depth, while the deepest (L7) at 433 m. Each level consists of more than 1000 m of horizontal development.
In the Colombia Mine, the El Callao shear zone consists of a network of interconnected quartz, albite, and ankerite veins enclosing altered centimeter- to meter-sized metabasaltic fragments. Both vein network and enclosed fragments form a large, discrete body contained between metabasaltic hanging- and foot-walls (the El Callao Basalts unit; Figure 3a,b). This vein system is marked by an alteration halo that overprints early greenschist-facies metamorphic assemblages [1]. The metabasaltic fragments are rich in pyrite (Figure 3c) and they host most of the gold mineralization. This occurs in the form of native (-visible) gold, which is systematically related to pyrite in which it forms mineral inclusions (Figure 4a) or fills fractures (Figure 4b). Figure 3a illustrates an idealized vertical section of the El Callao vein system, obtained by summarizing information from underground levels (L1 to L7) at the Colombia Mine.
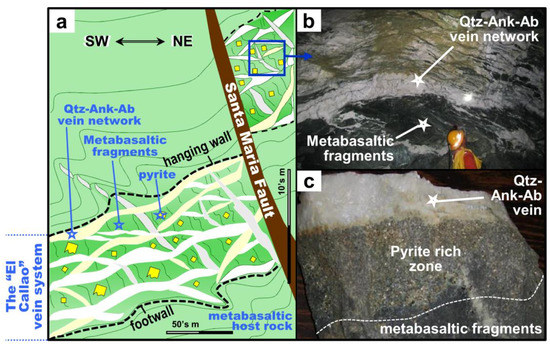
Figure 3.
(a) Schematic illustration of the El Callao vein system, depicting the complex vein mesh and its intersection with the Santa Maria Fault (modified from Velásquez et al. [2]). (b) Underground photograph showing the interconnected veins, enclosing pyrite-rich metabasaltic fragments. (c) Photograph of a hand sample (20 cm across) showing a close-up view of a metabasaltic fragment hosting pyrite crystals, adjacent to a quartz–ankerite–albite vein.
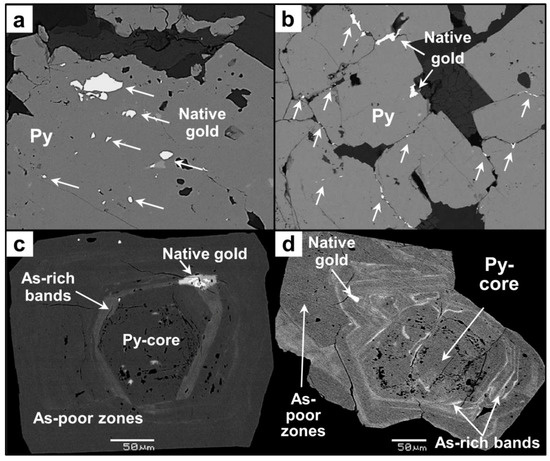
Figure 4.
SEM backscattered electron images illustrating features in pyrite at El Callao. Native gold occurs as mineral inclusion (a) and filling fractures in pyrite (b). (c,d) Asymmetric sequential overgrowths surrounding pyrite cores, with inclusions of native gold in As-rich band.
4. Analytical Techniques
Petrographic studies were carried out at the Géosciences Environnement Toulouse (GET) laboratory in Toulouse, France, on some one-hundred representative samples from different rock facies of the El Callao vein system. Of these, fifteen were found to be suitable for in-depth investigation of fluid inclusions. Rock samples were collected at different levels of the Colombia Mine, being distributed throughout the horizontal galleries (Figure 2). Thin sections were examined using: (1) a polarizing microscope Nikon Eclipse LV100POL (Nikon instruments Europe, Amsterdam, The Netherlands) in reflected and transmitted light, equipped with 5×, 10×, 20×, 50× and 100× objectives, and (2) a JEOL 6360LV scanning electron microscopy (SEM) (JEOL Ltd., Tokyo, Japan) coupled to an energy dispersive X-ray spectrometer (SDD Bruker 129 eV) (Bruker Corporation, Billerica, MA, USA), equipped to acquire images in backscattered electron (BSE) mode at an acceleration voltage of 20 kV.
Microthermometric parameters of fluid inclusions were characterized at temperatures between −170 °C and +600 °C while using a LINKAM MDS 600 (LINKAM scientific instruments, Tadworth, Surrey, UK) heating–freezing stage equipped with a video camera. The microthermometric stage was thermally calibrated using Synflinc CO2 and H2O synthetic fluid inclusion (FI) standards. The accuracy of measurements is ±0.2 °C at low temperature and ±2 °C at high temperatures. Homogenization temperatures were observed at 1 to 5 °C/min rates, depending on the inclusion size. Densities and pressure-volume-temperature-composition (P-V-T-X) properties of FI used to determine the isochores were calculated using the software package FLUIDS 1 (University of Leoben, Leoben, Austria) [18]. Salinities were calculated using the final melting temperature of ice, or halite, when present [19], and from clathrate dissociation temperatures, in CO2-rich inclusions [20].
Raman micro-spectrometric analyses on fluid inclusions were performed at the G2R laboratory, University of Nancy, France. Information about the application of this analytical technique to fluid inclusions is available in several review papers [21,22]. The Raman spectrometer that was used is a Labram-type (®Dilor) equipped with a Notch (®Kaiser) filter and with only one grating (1800 grooves/mm), which results in high optical throughput. The detector is a CCD cooled at −30 °C. The exciting radiation is provided by an Ar + laser (Type 2020, ®Spectraphysics). The spectral resolution is 2 cm−1.
5. Mineral and Microstructural Description
Based on petrographic, microstructural and textural observations (Figure 4, Figure 5 and Figure 6), two types of pyrite (Py), five types of ankerite (Ank) and quartz (Qtz), three types of albite (Ab) and muscovite (Ms), and two types of chlorite (Chl) were recognized in metabasaltic fragments and the surrounding vein network. Mineral types and generations are defined below and mineral abbreviations and subscript definition are shown in Table 1. The two subsequent sections describe the mineralogical characteristics of each environment in detail (i.e., metabasaltic fragments and vein network), while a third section deals with the characterization of fluid inclusions (Figure 7 and Figure 8), and, in particular, their relationship to microstructural and textural characteristics. These features will be used to provide constraints on strain rate, pressure, temperature, and fluid content during deformation and mineralization [23,24,25,26,27], and to discuss the relationship between fluid circulation, pyrite crystallization, and gold precipitation in the El Callao Shear Zone.
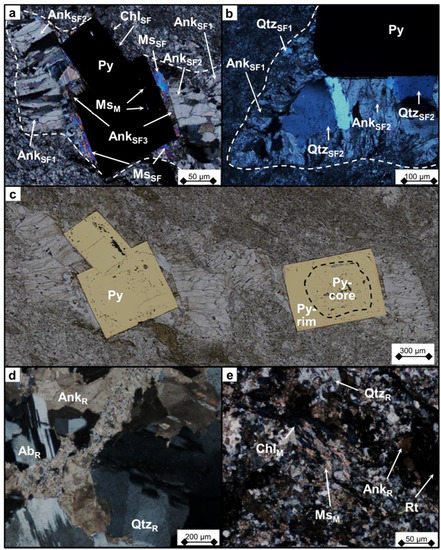
Figure 5.
Photomicrographs under cross-polarized and reflected light showing the different microstructures observed in the metabasaltic fragments. (a–c) Fringes structures formed around a pyrite crystal, and minerals filling the strain fringes (SF). (d,e) Relict (R) and metamorphic (M) minerals. Mineral abbreviations and subscript definition are shown in Table 1.
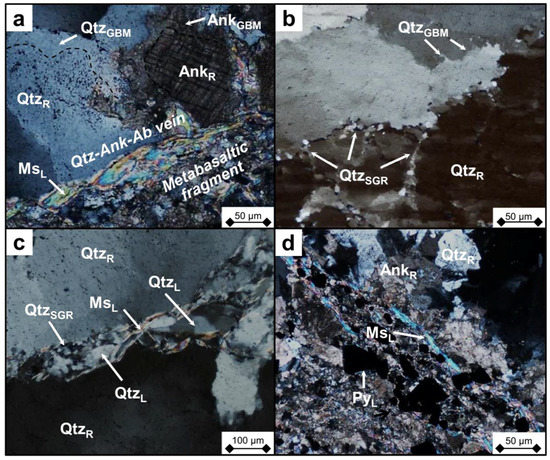
Figure 6.
(a–d) Photomicrographs under cross-polarized light of several quartz and ankerite crystals, showing the different microstructures observed in the vein network.

Table 1.
Subscript definition and mineral abbreviations.
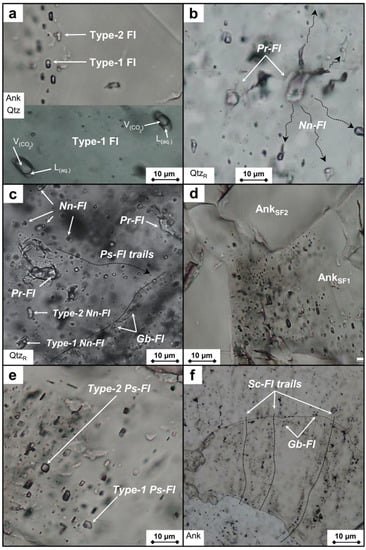
Figure 7.
(a–f) Photomicrographs of thick sections of quartz and ankerite crystals (transmitted light), showing fluid inclusion (FI) distribution and types. Generations consist of primary (Pr-FI), neonate (Nn-FI) and pseudosecondary (Ps-FI) inclusions, FI along grain boundaries (Gb-FI), and inclusions within transgranular secondary microcracks (Sc-FI). QtzR: quartz relict.
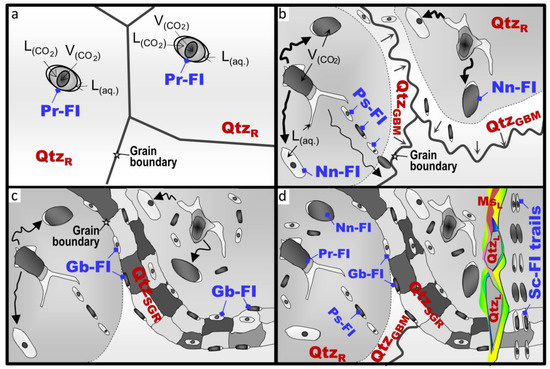
Figure 8.
Sketches showing trapping chronologies of FI relative to mineral microstructures (a–d). (a) Pr-FI trapped within relict quartz grains (QtzR) during earliest stages of vein network formation. (b,c) Coeval dynamic recrystallization by grain boundary migration (GBM) and sub-grain rotation (SGR); (b) shows decrepitated Pr-FI within relict QtzR grains surrounded by clusters of Nn-FI and trails of Ps-FI, while (c) illustrates FI in grain boundaries (Gb-FI). (d) Sc-FI crosscutting all microstructures associated to fracturing marked by the occurrence of late muscovite (MsL).
Below are described mineral types and generations, indicating whether they occur in metabasaltic fragment groundmass, vein network or strain fringes.
PyZ: zoned (Z) pyrite crystals (Figure 4c,d), are characterized by an anhedral core that is rich in mineral inclusions (Py-core) and an euhedral rim almost free of inclusions (Py-rim), which, in turn, consist of rhythmic alternations of arsenic-rich bands and arsenic-poor zones (Figure 4c). This pyrite type is systematically found in the metabasaltic fragments as the core of fringe structures [23,27,28] (Figure 5a–c).
QtzR, AnkR, AbR: millimeter-sized, anhedral, highly deformed quartz (Qtz), ankerite (Ank), and albite (Ab) crystals (Figure 5d,e), exhibiting preferential crystal-growth orientations, deformation bands, and undulatory extinction. They are characterized by a high density of dislocations, deformation lamellae, fluid inclusion content, and subgrain boundaries. They are considered as relict (R) crystals and make up the metabasaltic fragment groundmass.
ChlM, MsM: early-generation chlorite and muscovite, related to greenschist facies metamorphism (M), forming relicts at the limits of areas rich in remnant ankerite, albite and/or quartz (Figure 5e), or as inclusions in pyrite (Figure 5a). These minerals are found mainly in the metabasaltic fragments.
AnkSF1,SF2,…, QtzSF1,SF2,…, MsSF1, ChlSF1: these minerals have crystallized in the strain fringes, formed around the PyZ crystals and in the form of fibrous crystals. They are found only in the metabasaltic fragments. These are named sequentially according to their successive order of precipitation, during shear progressive deformation (Figure 5a–c).
QtzGBM, AnkGBM, AbGBM: these generation of minerals are characterized by lobate and wavy grain boundaries (Figure 6a,b), indicative of recrystallization by grain boundary migration (GBM) [23,24,25]. This type of mineral texture can be found in both metabasaltic fragments and veins.
QtzSGR, AnkSGR, AbSGR: this nomenclature defines grains showing microstructures indicative of dynamic recrystallization such as subgrain rotation (SGR) [26,27,28]. They generally occur as 5 µm to 100 µm-sized subgrains mantling larger “relict” crystals in all rock facies (Figure 6b,c).
PyL, AnkL, QtzL, MsL: micrometer-sized euhedral crystals of pyrite, ankerite, quartz, and muscovite commonly found filling late (L) shear fractures that crosscut both metabasaltic fragments and the vein network (Figure 6a,c,d).
5.1. Metabasaltic Fragments
Fragments of metabasalt are included in the vein mesh and are made up of relict crystals of ankerite, quartz, and albite, which, during early hydrothermal alteration, replaced the metamorphic assemblage consisting of actinolite, epidote, chlorite, quartz, albite, and accessory titanite and rutile [1]. Anhedral muscovite and chlorite (Figure 5e), interstitial to quartz, ankerite, and albite, are interpreted as relicts of the metamorphic assemblage, while pyrite cores of zoned crystals are interpreted to have formed during the earliest hydrothermal alteration event [2]. Most zoned pyrite crystals (PyZ) show evidence of several overgrowth episodes in their rims (Figure 4a,b), which are related to the formation of strain fringes around pyrite cores [2].
Fringe structures: these are found in the metabasaltic fragments and consist of zoned pyrite crystals forming the rigid-object core, plus surrounding strain-fringe (SF) crystals [26,27,28]. Of these, quartz and ankerite show a particular texture, i.e., they grow perpendicularly from the boundary of the strain fringe (wall rock) towards the pyrite crystal, similar to geodic grain growth (Figure 5a–c) in an antitaxial mode [26,27,28]. The first generation of these minerals, i.e., quartz and ankerite, shows the highest internal deformation pattern (Figure 5a,b), while the last generation, growing in the strain fringes, are found in the vicinity of the pyrite crystal (Figure 5a–c) and they are almost devoid of internal deformation. Secondary euhedral muscovite ± chlorite crystals (Figure 5a–c) are always found next to the pyrite rim. These late minerals grow filling the space between quartz/ankerite and pyrite, mostly parallel to pyrite faces.
5.2. Vein Network
At El Callao, veining takes the form of a mesh of large, massive veins with coarse-grained textures (Figure 6a–c). The absence of laminated wall-rock fragments inside a single vein infers a single stage of dilation and sealing for each vein [12,26]. Vein microstructures consist of mm- to cm-sized crystals of quartz and ankerite showing lobate and wavy grain boundaries (Figure 6a–c), which is indicative of grain boundary migration (GBM) [23,24,25]. Locally, these grains are mantled by 5- to 100-µm subgrains (Figure 6b,c), which is indicative of recrystallization by subgrain rotation (SGR).
5.3. Shear Fractures
These features correspond to late stage fractures that crosscut the vein network (Figure 6c) and metabasaltic fragments (Figure 6d). Associated micron-sized extensional shear veinlets, filled by euhedral muscovite (MsL), quartz (QtzL), and pyrite (PyL) crystals (Figure 6c,d), intersect all of the microstructures described above.
6. Fluid Inclusion Characterization
Detailed fluid inclusion (FI) petrography was carried out at room temperature (~20 °C), on selected doubly-polished 200-µm thick sections, for each quartz–ankerite generation found in the strain fringes around pyrite (Figure 5a–c) and in the vein network (Figure 6a–c). This work consisted in identifying FI types, and mapping their distribution and abundance (Figure 7). Most of the quartz and ankerite samples that were investigated contain abundant fluid inclusions, which were trapped in relict (R) and recrystallized (GBM and SGR) grains, whereas late grains (L), related to late stage shear-fractures, are almost systematically devoid of inclusions. Particular attention was paid to the relationships between fluid inclusions and the host mineral microstructures (Figure 8).
Based on phase transformation during freezing/heating experiments and on the chemical characteristics that were obtained from microthermometry (Table 2) and Raman spectroscopy, the fluid inclusions were divided in two types, following the nomenclature of Diamond [29]: (Type-1) three-phase low-salinity aqueous-carbonic FI (H2O-CO2-salt system) and (Type-2) two-phase low-salinity aqueous FI (H2O-salt system) (Figure 7a). Except for CO2, no other gases were detected in the vapor phase by Raman spectroscopy. These two types of inclusions occur in all different FI generations, which are classified, as follows, according to Roedder [30] and following the fluid inclusion assemblage (FIA) approach of Goldstein and Reynolds [31,32].
Table 2.
Microthermometric data, calculated bulk composition and salinity for selected fluid inclusion assemblages.
- Primary fluid inclusions (Pr-FI): they consist of relicts of isolated inclusions that had naturally decrepitated (Figure 7b,c and Figure 8a). These relict inclusions measure 5 to 30 µm, are irregularly shaped and are surrounded by a halo of tiny (generally <10 µm) neonate inclusions (Nn-FI), which are regularly shaped and commonly display negative crystal forms (Figure 7b,c and Figure 8b). Together, these two groups of inclusions define one FIA [31,32], with relict inclusions consisting exclusively of Type-1 (aqueous-carbonic), whereas the neonates consist of both Type-1 and Type-2 FI (Figure 7b,c and Figure 8a,b). This FIA has been only recognized in the relict (QtzR and AnkR) crystals, which are found in the vein network and metabasaltic fragment groundmass and not in the pressure fringe minerals. The Pr-FI generation shows the lowest homogenization temperatures for the carbonic phase (LCO2–V → LCO2 mean of 8.7 °C) and the highest total homogenization temperatures (LCO2–Laq → L up to 275 °C) compared to all the other aqueous-carbonic FI generations (Table 2).
- Pseudosecondary fluid inclusions (Ps-FI): small FI trails have been locally recognized starting at the edge of larger, decrepitated primary inclusions and extending towards the grain boundary (Figure 7c and Figure 8b), or in trails generally parallel to a quartz crystal face or to an ankerite cleavage (Figure 7d,e). These trails are composed of small (<10 µm) Type-1 and Type-2 fluid inclusions (Figure 7d,e). The former are generally rounded in shape, whereas the latter form negative crystals. In this generation, there is no evidence of decrepitation.
- Fluid inclusions at grain boundaries (Gb-FI): FI recognized at the vicinity or within grain and subgrain boundaries (Figure 7c,f and Figure 8c), which show very irregular shapes (Figure 7c,f), indicating decrepitation and/or post-trapping changes, such as necking down and leakage. This generation is also made up of Type-1 and Type-2 FI and has been recognized in quartz and ankerite crystals, in the vein network and strain fringes.
- Secondary fluid inclusions (Sc-FI): these occur within sealed microcracks that crosscut grain boundaries of recrystallized quartz and/or ankerite grains (Figure 7f and Figure 8d). This generation consists of Type-1 and Type 2 FI, which may occur next to each other. These inclusions are found in both vein network and strain fringes.
Microthermometric measurements that were obtained from FI in quartz and ankerite are similar, indicating that the two minerals trapped the same fluid(s) and thus are cogenetic. Calculated salinities are low, and are similar for all FI types and generations, varying from about 3 to 5 wt % NaCl eq. (Figure 9). Final homogenization (Th) took place by vapor disappearance for FI of both Type-1 and Type-2, between 135 °C and 275 °C (Table 2; Figure 9b). The Th distribution pattern shows two clusters: one, from 135 °C to 190 °C, which consists mostly of Ps-, Gb-, and Sc-FI, and a second around 250 ± 30 °C, consisting mostly of Pr-FI (Figure 9b).
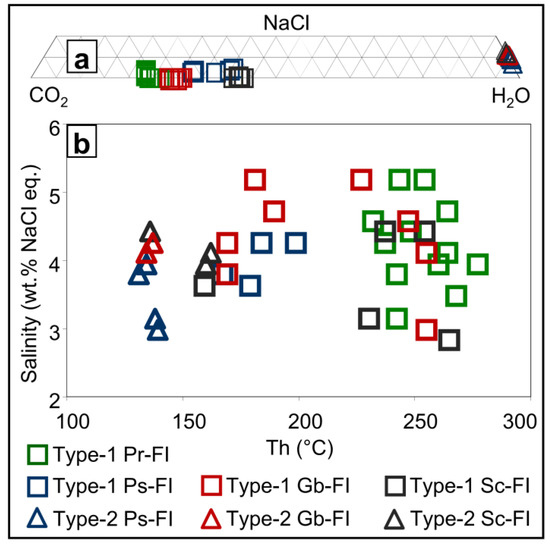
Figure 9.
(a) A ternary diagram showing bulk CO2-H2O-NaCl ratios in all FI types and corresponding FI generations. (b) A plot of total homogenization temperature (Th(total)) versus salinity.
6.1. Fluid Circulation History in the El Callao Shear Zone
Based on petrographic considerations and microthermometric data, we consider that primary fluid inclusions (Figure 7b,c and Figure 8a) were trapped during the earliest stage of vein network formation and that they represent the closest relict of the first mineralizing fluid that entered the system. During this stage, P-T conditions were above the H2O-CO2 solvus, allowing for trapping of an aqueous-carbonic homogeneous fluid [10,13] represented by the primary fluid assemblages. The heterogeneous clusters of neonate inclusions and pseudosecondary intragranular FI trails (Figure 8b,c), containing H2O-CO2-NaCl (Type-1) as well as H2O-NaCl (Type-2) FI, are spatially and texturally linked to primary H2O-CO2-NaCl inclusions, and, as such, are interpreted as the result of decrepitation of the latter [9]. According to this scenario, once the internal pressure within a primary FI becomes greater than the confining pressure (lithostatic load), the inclusion may expand and eventually decrepitate, releasing its fluid, which formed a halo of neonate FI (Figure 7b,c and Figure 8b) surrounding the decrepitated primary inclusion [9,10], during dynamic recrystallization and grain size reduction. Alternatively, some FI might withstand the internal pressure by stretching, resulting in FI with anomalously high homogenization temperatures.
Trails of Ps- and Sc-FI (Figure 7c,f), as well as the FI distributed along grain boundaries (Gb-FI, Figure 7c and Figure 8c) of recrystallized quartz crystals, are interpreted as redistribution of the fluid via migration during successive deformation events. Petrographic evidence indicates that this took place at P-T conditions below the H2O-CO2-NaCl solvus, resulting in the trapping of two separated fluid phases (Type-1 and Type-2 FI).
6.2. P-T Pathway
Coexisting H2O-NaCl and CO2-H2O-NaCl fluid inclusion types were generated by phase separation of an initially homogeneous fluid. In this case, trapping occurred along an immiscibility surface in the CO2-H2O-NaCl system, with Th(Total) of the purest end-members being a close estimate of the trapping temperatures [33,34]. Corresponding pressures were calculated while using R. Bakker’s FLUIDS software (Version of 2003) (University of Leoben, Leoben, Austria) package [18]. Isochores were calculated combining results from microthermometry and Raman spectroscopy analyses (Table 2). The fluid trapping history established above allows for the reconstruction of the relative timing of formation for the El Callao vein system, along a pressure-temperature path (Figure 10).
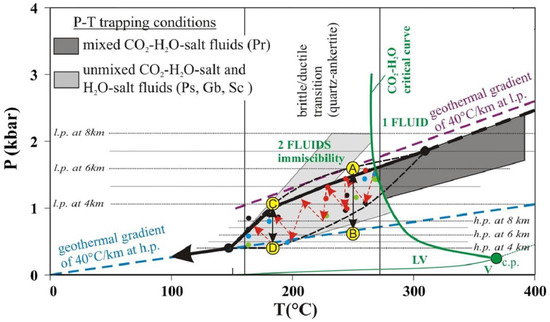
Figure 10.
Schematic illustration of the inferred P-T fluid circulation pathway during formation of the El Callao vein system. The black arrow indicates the suggested P-T pathway during vein mesh development. The dashed curved black line indicates the range of pressure fluctuations (red dashed arrows) within the transition from a lithostatic (calculated for an average rock density of 2.7 g/cm3) to a hydrostatic pressure regime. The critical curve is illustrated for a salt-free composition. Green dots: neonate fluid inclusions, blue dots: pseudosecondary fluid inclusions, red dots: grain boundary fluid inclusions and black dots: secondary fluid inclusions.
- (1)
- The initial fluid was trapped by Pr-FI during vein emplacement and “relict” quartz–ankerite–albite crystallization in the vein network and metabasaltic fragment groundmass. It consisted of a homogeneous CO2-H2O phase, thus P-T trapping conditions should lie on the right side of the CO2-H2O critical curve, as shown in Figure 10. Isochores of Pr-FI indicate the minimum trapping conditions of 270 °C and 1.6 kbar (for very diluted compositions).
- (2)
- Fluid phase separation, i.e., unmixing of CO2 from H2O, occurred during migration of the fluid out of the primary fluid inclusions and creation of neonate inclusions, during subsequent stages of crystal-plastic and semi-brittle deformation of the host minerals. Hence, trapping conditions for these fluids (150–270 °C and 0.6–1.6 kbar) lie in the two-phase field of the CO2-H2O system, to the left side of the critical curve (Figure 10).
The compositions recorded by the different FI populations/assemblages indicate that the physical separation of CO2 and H2O occurred only after trapping of the primary fluid inclusions, at P-T conditions below the H2O-CO2 solvus [9,10,13]. Fluid inclusion data concur with one CO2-H2O fluid circulation event, with Th(total) variations being attributable to perturbations that are closely linked to pressure fluctuations.
6.3. Pressure Fluctuations
Textural, petrographic, and microthermometric data indicate that the fluid inclusions in the El Callao samples recorded fluctuations in pressure conditions, interpreted to occur at the transition from the quasi-plastic to frictional deformation cortical domains (here referred to as the ductile-brittle transition, DBT; Figure 10). This process can be summarized, as follows:
The maximum fluid pressure recorded within primary fluid inclusions (0.95 g cm−3) is 1.6 kbar and corresponds to a lithostatic load at a depth of ~6 km (Figure 10). The average homogenization temperature for such inclusions is ~270 °C, consistent with a thermal gradient of 40 °C km−1. A higher geothermal gradient would place the highest observed fluid pressures above the lithostatic geothermal gradient (Figure 10). At depths of 6 km and 270 °C, fluids are trapped at the upper limit of the DBT transition, in the ductile domain. Below these P-T conditions, the confining pressure can locally switch from lithostatic to close to hydrostatic during fracturing (red dashed arrows in Figure 10), triggering the decrepitation of primary fluid inclusions due to confining pressure drops [35], and, consequently, generating fluid expulsion. The resulting fluid is then trapped as neonate and/or pseudosecondary fluid inclusion, at pressures ranging from near-lithostatic down to near-hydrostatic (dots A to B in Figure 10), producing the wide vertical range of minimal trapping conditions, i.e., pressure drops down to 0.5 kbar at 220–270 °C (colored dots in Figure 10). At these conditions, the trails of Ps-FI were trapped in the newly-formed minerals precipitating in the strain fringes, according to the crack-seal mechanism proposed by Ramsay [36]. The trails of Ps-FI record fluid-phase separation in form of H2O-CO2-low salinity (Type-1) and H2O-salt (Type-2) FI. Such fluctuations occur down to depths of 4 km, where conditions alternated between hydrostatic and lithostatic pressure regimes (dots C to D in Figure 10). Further pressure drops during cooling resulted in repeated unmixing, which explains the heterogeneity of the CO2/H2O filling ratios of the inclusions; a process that has been evidenced in other shear zone-hosted mesozonal Au-deposits (e.g., [37,38,39,40]).
The resulting zigzag P-T path, i.e., recurrent P drops from lithostatic to near hydrostatic conditions, can be related to fluid overpressures and subsequent pressure drops during major earthquakes and/or successions of micro-seismic events that are related to the shear zone formation [9], as well as to the crack-and-seal process occurring during vein opening [36]. Similar pressure fluctuations are evoked to have occurred during the uplift of the Northern Apennines (Italy) [41]. According to these authors, successive pressure fluctuations are also associated to the fault-valve activity during the evolution of orogenic cortical terrains [41].
7. The El Callao Vein System: A Typical Example of a Fluid Driven Shear Zone
The El Callao vein system (Figure 3a) formed during a syn-tectonic event, when fluids interacted with the metabasaltic host rock while circulation throughout the El Callao shear zone [2] (Figure 2 and Figure 3a). A mechanism that can be invoked to explain its formation is the fault-valve model proposed by Sibson and Scott [42]. According to this model, fault activation can translate into several sequential micro-seismic events, during which deformation might generate extensive fracturing of the country rock. The petrographic and fluid inclusion characterization done in this study highlights the relationship between this model, fluid circulation, fluid-rock interaction, and gold mineralization at El Callao. The different stages leading to the development of the vein system are illustrated schematically and by corresponding examples from underground galleries at the Colombia Mine, in Figure 11. The overall model for formation of the vein system is summarized in Figure 12.
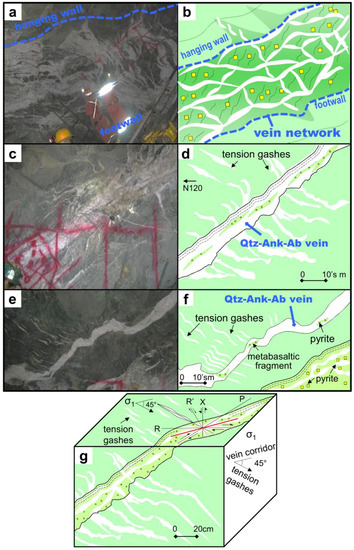
Figure 11.
(a–f) Photographs from underground workings (a,c,e) and corresponding schematic drawings (b,d,f) illustrating sequential steps in the formation of the El Callao vein system, from early (e,f) to late (a,b) stages. (a,b) Example of quartz–ankerite–albite vein network englobing rich-pyrite metabasaltic fragments, illustrating the mature vein system. (c,d) Photograph showing the quartz–ankerite–albite veins, incorporating slivers of detached pyrite-rich metabasaltic fragments, parallel to contacts. (e,f) A satellite vein of the interconnected network associated to extensional tension gashes, illustrating early stages of vein network formation. (g) A block diagram illustrating the structural setting of the shear zone and associated network of veins and tension gashes, as well as the metabasaltic fragments containing gold-bearing pyrite. The red line on the top indicates the orientation of shear (c) plane.
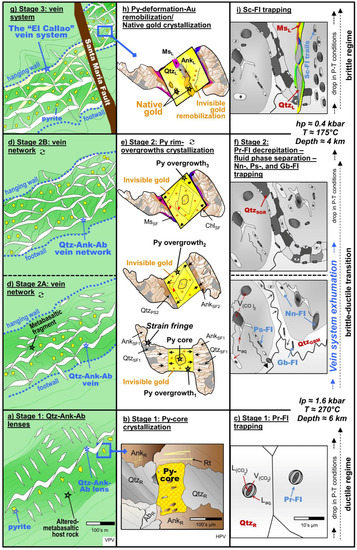
Figure 12.
Schematic model for the El Callao vein system, temporally correlating (bottom to top) the sequence of structural events with the development of zoned pyrite crystals and fluid evolution. (a–c) Early stage of vein development, showing: quartz + ankerite + albite lenses formation (a), pyrite core crystallization (b), and primary fluid inclusions (FI) trapping (c), under ductile conditions. (d–f) Vein network formation takes place from the connection of several lenses (d), accompanied by multiple cycles of crystallization of pyrite rim-overgrowths (containing invisible gold nanoparticles) (e), (indicated by the red circular arrows), which are in turn accompanied by crystallization of gangue minerals in the empty space (indicated by the black arrows) to form strain fringes, and (f) primary-FI decrepitation. (g–i) Final stage, showing the late semi-brittle high-angle Santa Maria fault (g) crosscutting the entire vein system and subsequent fracturing of pyrite crystals (h), which are infilled by native gold grains.
During the earliest stages of formation of the vein system, fault activation processes caused the formation of open space (tension gashes), driving circulation of fluid through the metabasaltic country rocks, enhancing fluid-rock interaction, and consequent pyrite precipitation in the altered country rock (pyrite core; Figure 12a,b). Meanwhile, the first set of quartz + ankerite + albite lenses precipitated in tension gashes (Figure 11e,f and Figure 12a) accompanied by the trapping of primary fluid inclusions (Figure 12c). Crystallization of these minerals sealed the tension gashes, reducing the permeability and causing fluid pressure to build up to lithostatic conditions [43]. As subsequent micro-seismic events took place, new open space was created, triggering again fluid circulation and renew fluid-rock interaction, generating new quartz + ankerite + albite lenses (Figure 11c,d and Figure 12d), which interconnected with each other to build a fault-vein network (Figure 11c,d and Figure 12d). This newly formed veins exhibit a ribbon texture, with bands of quartz + ankerite + albite interlaminated with slivers of detached metabasaltic fragments, subparallel to the walls (Figure 11c,d and Figure 12d). In these fragments, at a smaller scale, open space is also created in form of strain fringes, around previously crystallized pyrite (i.e., py-core in our model), in which the formation of a (first) rim-overgrowth on pyrite took place (Figure 12e), paralleled by trapping of neonate and pseudosecondary fluid inclusions (Figure 12f).
This cycle repeated itself several times (Figure 12d,e), leading to the formation of the complex shear fracture-hosted mesh [42,44], rich in multiply-zoned pyrite crystals, which is the El Callao vein system (Figure 11a,b and Figure 12d). At late stages, as suggested by the FI evidence (Figure 10), semi-brittle to brittle deformation conditions were reached (Figure 12g–i) with the formation of shear fracturing (e.g., the Santa Maria Fault; Figure 12g). This episode is considered responsible for the fracturing of previously-formed pyrite crystals (Figure 12h) and for trapping of abundant secondary fluid inclusions (Figure 12i). A similar scenario has been proposed for the Pampe mine, an orogenic gold deposit that is genetically related to the Ashanti shear zone, in the West African Craton [45]. Interestingly, zones where the El Callao vein system is intersected by late fractures mark the highest gold concentrations in the mine (up to 60 g/t; [2]). This conclusion can be helpful in highlighting new exploration targets at the mine and district scales, at El Callao and elsewhere.
8. Constrains on Pyrite Crystallization and Gold Precipitation
The sequences of events described above have also been recorded, at a smaller scale, by pyrite in the metabasaltic fragments. It is particularly important to understand this process, as this sulfide hosts most of the gold in this and in similar deposits worldwide (e.g., [2,45]). Multiple pyrite overgrowths, documented by the complex rhythmic zoning, such as in Figure 4, developed after the crystallization of early pyrite cores due to repeated episodes of open-space creation and subsequent filling, with each fault activation episode (Figure 12). This process is considered to be roughly synchronous to the formation of tension gashes and is also responsible for creating the gangue-filled strain fringes around pyrite (Figure 12e). Once several strain fringes became interconnected, the fluid pressure dropped locally to near hydrostatic conditions, point at which phase separation in the fluids (boiling) could occur [9,46]. Boiling at moderate temperatures (<300 °C) is considered as a very efficient mechanism for precipitating most metals in solution from a fluid [47,48], because of removal of part of the H2O into the vapor, resulting in an increase of the concentrations of dissolved non-volatile components in the liquid [13,48]. Additionally, pressure drops induce important changes in the solubility of aqueous gold complexes as well as of those of arsenic and other metals in solution [48]. According to this, in addition to prompting the precipitation of pyrite and other minerals in the stain fringes, fluid phase separation drastically lowered the solubility of gold and other metals, so that the newly precipitating pyrite overgrowths (Figure 12e) became enriched in primary gold, incorporated in the form of invisible nanoparticles [2]. Pyrite crystallization is accompanied by ankerite, quartz, chlorite, and muscovite (Figure 5a–c and Figure 12e) in the empty spaces, resulting in the sealing of the porosity and thus permeability reduction. This caused fluid pressure to build back up to lithostatic conditions [43], until a new micro-seismic event triggered a new cycle with formation of a new set of strain fringes with more gold-rich pyrite overgrowth (Figure 12e), finally resulting in the multiply-zoned gold-bearing pyrite crystals.
Sometime after pyrite formation, during brittle deformation conditions (Figure 12g–i), late-stage fracturing that affected the vein system shattered the composite pyrite crystals (Figure 12h), creating permeability, and thus enhancing fluid circulation. This facilitated (re-)mobilization of the invisible gold trapped in the pyrite [2] via coupled dissolution-precipitation reactions [49,50], producing native visible gold grains (Figure 12h) in pores and fractures of pyrite. Multiple deformation episodes, occurring during the exhumation of the shear zone, progressively built economic-grade gold mineralization. This model explains why the highest gold concentrations in the deposit occur where late-stage shear fractures intersect the vein system, and it can be considered as a vector for exploration of the richest gold zones across shear zones.
9. Conclusions
The El Callao vein system occurs in the exhumed El Callao transpressional shear zone, in which crustal shortening was accommodated along a discrete deformation band, hosted by low-grade metamorphic rocks. It consists of a complex network of intersecting veins, including a block of various sizes of the host metabasalt. Fluid inclusion and textural evidence have shown that the vein system formed in response to fluid circulation in a shear zone under variable strain conditions. These ranged from pure ductile to near brittle regimes, passing through a ductile-brittle transition (DBT) in which pressure-temperature conditions varied from higher than 1.6 kbar and 275 °C (lithostatic regime)—at depths below 6 km—to lower than 0.4 kbar and 175 °C (quasi-hydrostatic regime)—at depth around 4 km. Extensive fluid circulation produced pervasive hydrothermal alteration of the metabasaltic fragments and of the wall rock surrounding the vein network. Throughout ductile strain conditions a one-phase fluid circulated in the system, while under strain conditions from DBT to near brittle regime the fluid boiled causing the circulation of two separated fluid phases.
Fluid-rock interactions caused the generation of three successive mineralization stages, during the exhumation of the vein system: (i) crystallization of pyrite cores from circulation of a one-phase fluid under ductile strain conditions; (ii) pyrite rim-overgrowths crystallization with the incorporation of primary (invisible) gold, from unmixed fluids at DBT strain conditions; and, (iii) remobilization of primary gold, which precipitates in its native (visible) form in fractures and pores within pyrite, at the end of DBT at near-brittle conditions.
In summary, the economically exploitable gold mineralization (>2000 t gold) at El Callao is the result of long-term fluid circulation that is controlled by the formation and exhumation of the crustal-scale El Callao shear zone. As evidenced by mineralogical and fluid inclusion data, cyclic pressure fluctuations in form of a zigzag P-T path, recorded during the ductile-brittle transition in the upper continental crust, controlled precipitation of primary refractory gold and its refinement into native grains. The metallogenic model proposed here for the formation of the El Callao system and gold enrichment can be used as a vector to characterize and explore similar shear zones in other mining districts in the Guiana Shield as well as in analogous orogenic systems, worldwide.
Author Contributions
Conceptualization, G.V., S.S., L.S., D.B.; Funding acquisition, S.S., D.B. and D.C.; Investigation, G.V. and S.S.; Methodology, G.V., S.S., L.S. and D.B.; Validation, D.C.; Writing—review & editing, G.V., S.S., L.S., D.B. and D.C.
Funding
This research received no external funding.
Acknowledgments
We wish to thank A. Graterol and O. González for their help in the field, and the Gold Mining Company of Venezuela (MINERVEN) for allowing access to the site and sampling of their drill core, and for their logistical support. Financial support for this study was provided by the French CNRS and the University of Toulouse. Constructive comments by three anonymous reviewers contributed to the quality of this manuscript.
Conflicts of Interest
The authors declare no conflict of interest.
References
- Velásquez, G.; Béziat, D.; Salvi, S.; Tosiani, T.; Debat, P. First occurrence of Paleoproterozoic oceanic plateau in the Guiana Shield: The gold-bearing El Callao Formation, Venezuela. Precambrian Res. 2011, 186, 181–192. [Google Scholar] [CrossRef]
- Velásquez, G.; Béziat, D.; Salvi, S.; Siebenaller, L.; Borisova, A.Y.; Pokrovski, G.S.; De Parseval, P. Formation and deformation of pyrite and implications for gold mineralization in the El Callao District, Venezuela. Econ. Geol. 2014, 109, 457–486. [Google Scholar] [CrossRef]
- Kerrich, R.; Cassidy, K.F. Temporal relationships of lode gold mineralization to accretion, magmatism, metamorphism and deformation—Archean to present: A review. Ore Geol. Rev. 1994, 9, 263–310. [Google Scholar] [CrossRef]
- Goldfarb, R.J.; Groves, D.I.; Gardoll, S. Orogenic gold and geologic time: A global synthesis. Ore Geol. Rev. 2001, 18, 1–75. [Google Scholar] [CrossRef]
- Groves, D.I.; Goldfarb, R.J.; Robert, F.; Hart, C.J.R. Gold Deposits in Metamorphic Belts: Overview of Current Understanding, Outstanding Problems, Future Research, and Exploration Significance. Econ. Geol. 2003, 98, 1–29. [Google Scholar] [CrossRef]
- Goldfarb, R.J.; Groves, D.I. Orogenic gold: Common or evolving fluid and metal sources through time. Lithos 2015, 233, 2–26. [Google Scholar] [CrossRef]
- Wyman, D.A.; Cassidy, K.F.; Hollings, P. Orogenic gold and the mineral systems approach: Resolving fact, fiction and fantasy. Ore Geol. Rev. 2016, 78, 322–335. [Google Scholar] [CrossRef]
- Robert, F.; Boullier, A.M.; Firdaous, K. Gold-quartz veins in metamorphic terranes and their bearing on the role of fluids in faulting. J. Geophys. Res. 1995, 100, 12861–12879. [Google Scholar] [CrossRef]
- Wilkinson, J.J.; Johnston, J.D. Pressure fluctuations, phase separation, and gold precipitation during seismic fracture propagation. Geology 1996, 24, 395–398. [Google Scholar] [CrossRef]
- Ridley, J.R.; Diamond, L.W. Fluid chemistry of orogenic lode gold deposits and implications for genetic models. In Gold in 2000; Hagemann, S.G., Brown, P.E., Eds.; Society of Economic Geologists: Littleton, CO, USA, 2000; Volume 13, pp. 141–162. [Google Scholar]
- Sibson, R.H.; Robert, F.; Poulsen, K.H. High-angle reverse faults, fluid pressure cycling and mesothermal gold-quartz deposits. Geology 1988, 16, 551–555. [Google Scholar] [CrossRef]
- Cox, S.F. Faulting processes at high fluid pressures: An example of fault valve behavior from the Wattle Gully Fault, Victoria, Australia. J. Geophys. Res. 1995, 100, 12841–12859. [Google Scholar] [CrossRef]
- Mikucki, E.J. Hydrothermal transport and depositional processes in Archean lode gold systems: A review. Ore Geol. Rev. 1998, 13, 307–321. [Google Scholar] [CrossRef]
- Peterson, E.C.; Mavrogenes, J.A. Linking high-grade gold mineralization to earthquake-induced fault-valve processes in the Porgera gold deposit, Papua New Guinea. Geology 2014, 42, 383–386. [Google Scholar] [CrossRef]
- Voicu, G.; Bardoux, M.; Stevenson, R. Lithostratigraphy, geochronology and gold metallogeny in the northern Guiana Shield, South America: A review. Ore Geol. Rev. 2001, 18, 211–236. [Google Scholar] [CrossRef]
- Sidder, G.B.; Mendoza, V. Geology of the Venezuela Guayana Shield and its relation to the entire Guayana Shield. In Geology and Mineral Deposits of the Venezuelan Guayana Shield; Sidder, G.B., Garcia, A.E., Stoeser, J.W., Eds.; U.S. Government Publishing Office: Washington, DC, USA, 1995; pp. B1–B41. ISBN 9995305615. [Google Scholar]
- U.S. Geological Survey. Geology and Mineral Resource Assessment of the Venezuelan Guayana Shield; Bulletin 2062; U.S. Government Publishing Office: Washington, DC, USA, 1993; pp. 1–121. ISBN 9993537462.
- Bakker, R.J. Package FLUIDS 1. Computer programs for analysis of fluid inclusion data and for modelling bulk fluid properties. Chem. Geol. 2003, 194, 3–23. [Google Scholar] [CrossRef]
- Bodnar, R.J. Interpretation of data from aqueous-electrolyte fluid inclusions. In Fluid Inclusions: Analysis and Interpretation; Samson, I., Anderson, A., Marshall, D.J., Eds.; Mineralogical Association of Canada Short Course Notes: Calgary, AB, Canada, 2003; Volume 32, pp. 81–100. ISBN 10 0921294328. [Google Scholar]
- Diamond, L.W. Review of the systematics of CO2–H2O fluid inclusions. Lithos 2001, 55, 69–99. [Google Scholar] [CrossRef]
- Burke, E.A.J. Raman microspectrometry of fluid inclusions. Lithos 2001, 55, 139–158. [Google Scholar] [CrossRef]
- Frezzotti, M.L.; Tecce, F.; Casagli, A. Raman spectroscopy for fluid inclusion analysis. J. Geochem. Explor. 2012, 112, 1–20. [Google Scholar] [CrossRef]
- Bons, P.D.; Urai, J.L. Syndeformational grain growth: Microstructures and kinetics. J. Struct. Geol. 1992, 14, 1101–1109. [Google Scholar] [CrossRef]
- Law, R.D. Deformation thermometry based on quartz c-axis fabrics and recrystallization microstructures: A review. J. Struct. Geol. 2014, 66, 129–161. [Google Scholar] [CrossRef]
- Hirth, G.; Tullis, J. Dislocation creep regimes in quartz aggregates. J. Struct. Geol. 1992, 14, 145–159. [Google Scholar] [CrossRef]
- Passchier, C.W.; Trouw, R.A.J. Microtectonics, 2nd ed.; Springer: Berlin/Heidelberg, Germany; New York, NY, USA, 2006; pp. 1–366. ISBN 3 540 64003 7. [Google Scholar]
- Durney, D.W.; Ramsay, J.G. Incremental strains measured by syntectonic crystal growths. In Gravity and Tectonics; De Jong, K.A., Scholten, R., Eds.; John Wiley & Sons Inc.: New York, NY, USA, 1973; pp. 67–96. ISBN 10 047120305X. [Google Scholar]
- Ramsay, J.G.; Huber, M.I. The Techniques of Modern Structural Geology: Folds and Fractures, 1st ed.; Academic Press: Cambridge, MA, USA, 1983; Volume 2, p. 392. ISBN 0125769024. [Google Scholar]
- Diamond, L.W. Glossary: Terms and Symbols used in Fluid Inclusion Studies. In Fluid inclusions: Analysis and Interpretation; Samson, I., Anderson, A., Marshall, D.J., Eds.; Mineralogical Association of Canada Short Course Notes: Calgary, AB, Canada, 2003; Volume 32, pp. 365–374. ISBN 10 0921294328. [Google Scholar]
- Roedder, E. Fluid inclusions. In Reviews in Mineralogy; de Gruyter: Berlin, Germany, 1984; Volume 12, pp. 1–644. ISBN 0-939950-16-2. [Google Scholar]
- Goldstein, R.H.; Reynolds, T.J. Systematics of Fluid Inclusions in Diagenetic Minerals; SEPM Society for Sedimentary Geology: Tulsa, OK, USA, 1994; pp. 1–199. ISBN 1-56576-008-5. [Google Scholar]
- Goldstein, R.H. Petrographic Analysis of Fluid Inclusion. In Fluid Inclusions: Analysis and Interpretation; Samson, I., Anderson, A., Marshall, D.J., Eds.; Mineralogical Association of Canada Short Course Notes: Calgary, AB, Canada, 2003; Volume 32, pp. 9–54. ISBN 10 0921294328. [Google Scholar]
- Touret, J.L.R. Fluid inclusions in high-grade metamorphic rocks. In Short Course in Fluid Inclusions: Applications to Petrology; Hollister, L.S., Crawford, M.L., Eds.; Mineralogical Association of Canada Short Course Notes: Calgary, AB, Canada, 1981; Volume 6, pp. 182–208. [Google Scholar]
- Pichavant, M.; Ramboz, C.; Weisbrod, A. Fluid immiscibility in natural processes: Use and misuse of fluid inclusion data: I. Phase equilibria analysis—A theoretical and geometrical approach. Chem. Geol. 1982, 37, 1–27. [Google Scholar] [CrossRef]
- Sterner, S.M.; Bodnar, R.J. Synthetic fluid inclusions—VII. Re-equilibration of fluid inclusions in quartz during laboratory-simulated metamorphic burial and uplift. J. Metamorph. Geol. 1989, 7, 243–260. [Google Scholar] [CrossRef]
- Ramsay, J.G. The crack-seal mechanism of rock deformation. Nature 1980, 284, 135–139. [Google Scholar] [CrossRef]
- Barrie, I.J.; Touret, J.L.R. Fluid inclusion studies of gold-bearing quartz veins from the Yirisen deposit, Sula Mountains greenstone belt, Masumbiri, Sierra Leone. Ore Geol. Rev. 1999, 14, 203–225. [Google Scholar] [CrossRef]
- Zoheir, B.A. Characteristics and genesis of shear zone-related gold mineralization in Egypt: A case study from the Um El Tuyor mine, south Eastern Desert. Ore Geol. Rev. 2008, 34, 445–470. [Google Scholar] [CrossRef]
- Klein, E.L.; Harris, C.; Renac, C.; Giret, A.; Moura, C.A.V.; Fuzikawa, K. Fluid inclusion and stable isotope (O, H, C, and S) constraints on the genesis of the Serrinha gold deposit, Gurupi Belt, Northern Brazil. Miner. Depos. 2006, 41, 160–178. [Google Scholar] [CrossRef]
- Klein, E.L.; Fuzikawa, K. Origin of the CO2-only fluid inclusions in the Palaeoproterozoic Carará vein-quartz gold deposit, Ipitinga Auriferous District, SE-Guiana Shield, Brazil: Implications for orogenic gold mineralisation. Ore Geol. Rev. 2010, 37, 31–40. [Google Scholar] [CrossRef]
- Montomoli, C.; Ruggieri, G.; Boiron, M.C.; Cathelineau, M. Pressure fluctuation during uplift of the Northern Apennines (Italy): A fluid inclusions study. Tectonophysics 2001, 341, 121–139. [Google Scholar] [CrossRef]
- Sibson, R.H.; Scott, J. Stress/fault controls on the containment and release of overpressured fluids: Examples from gold–quartz vein systems in Juneau, Alaska; Victoria, Australia and Otago, New Zealand. Ore Geol. Rev. 1998, 13, 293–306. [Google Scholar] [CrossRef]
- Cox, S.F.; Knackstedt, M.A.; Braun, J. Principles of structural control on permeability and fluid flow in hydrothermal systems. In Structural Controls on Ore Genesis; Richards, J.P., Tosdal, R.M., Eds.; Society of Economic Geologists: Littleton, CO, USA, 2001; Volume 14, pp. 1–24. [Google Scholar]
- Sibson, R.H. Controls on maximum fluid overpressure defining conditions for mesozonal mineralization. J. Struct. Geol. 2004, 26, 1127–1136. [Google Scholar] [CrossRef]
- Salvi, S.; Velásquez, G.; Miller, J.M.; Béziat, D.; Siebenaller, L.; Bourassa, Y. The Pampe gold deposit (Ghana): Constraints on sulfide evolution during gold mineralization. Ore Geol. Rev. 2016, 78, 673–686. [Google Scholar] [CrossRef]
- Gartman, A.; Hannington, M.; Jamieson, J.W.; Peterkin, B.; Garbe-Schönberg, D.; Findlay, A.J.; Fuchs, S.; Kwasnitschka, T. Boiling-induced formation of colloidal gold in black smoker hydrothermal fluids. Geology 2018, 46, 39–42. [Google Scholar] [CrossRef]
- Zhu, Y.; An, F.; Tan, J. Geochemistry of hydrothermal gold deposits: A review. Geosci. Front. 2011, 2, 367–374. [Google Scholar] [CrossRef]
- Pokrovski, G.S.; Akinfiev, N.N.; Borisova, A.Y.; Zotov, A.V.; Kouzmanov, K. Gold speciation and transport in geological fluids: Insights from experiments and physical-chemical modelling. In Gold-Transporting Hydrothermal Fluids in the Earth’s Crust; Garofalo, P.S., Ridley, J.R., Eds.; Geological Society, London, Special Publications: London, UK, 2014; Volume 402, pp. 9–70. [Google Scholar]
- Putnis, A. Mineral replacement reactions: From macroscopic observations to microscopic mechanisms. Mineral. Mag. 2002, 66, 689–708. [Google Scholar] [CrossRef]
- Ruiz-Agudo, E.; Putnis, C.V.; Putnis, A. Coupled dissolution and precipitation at mineral–fluid interfaces. Chem. Geol. 2014, 383, 132–146. [Google Scholar] [CrossRef]
© 2018 by the authors. Licensee MDPI, Basel, Switzerland. This article is an open access article distributed under the terms and conditions of the Creative Commons Attribution (CC BY) license (http://creativecommons.org/licenses/by/4.0/).