Rare Earth Elements Geochemistry and C–O Isotope Characteristics of Hydrothermal Calcites: Implications for Fluid-Rock Reaction and Ore-Forming Processes in the Phapon Gold Deposit, NW Laos

Abstract
:1. Introduction
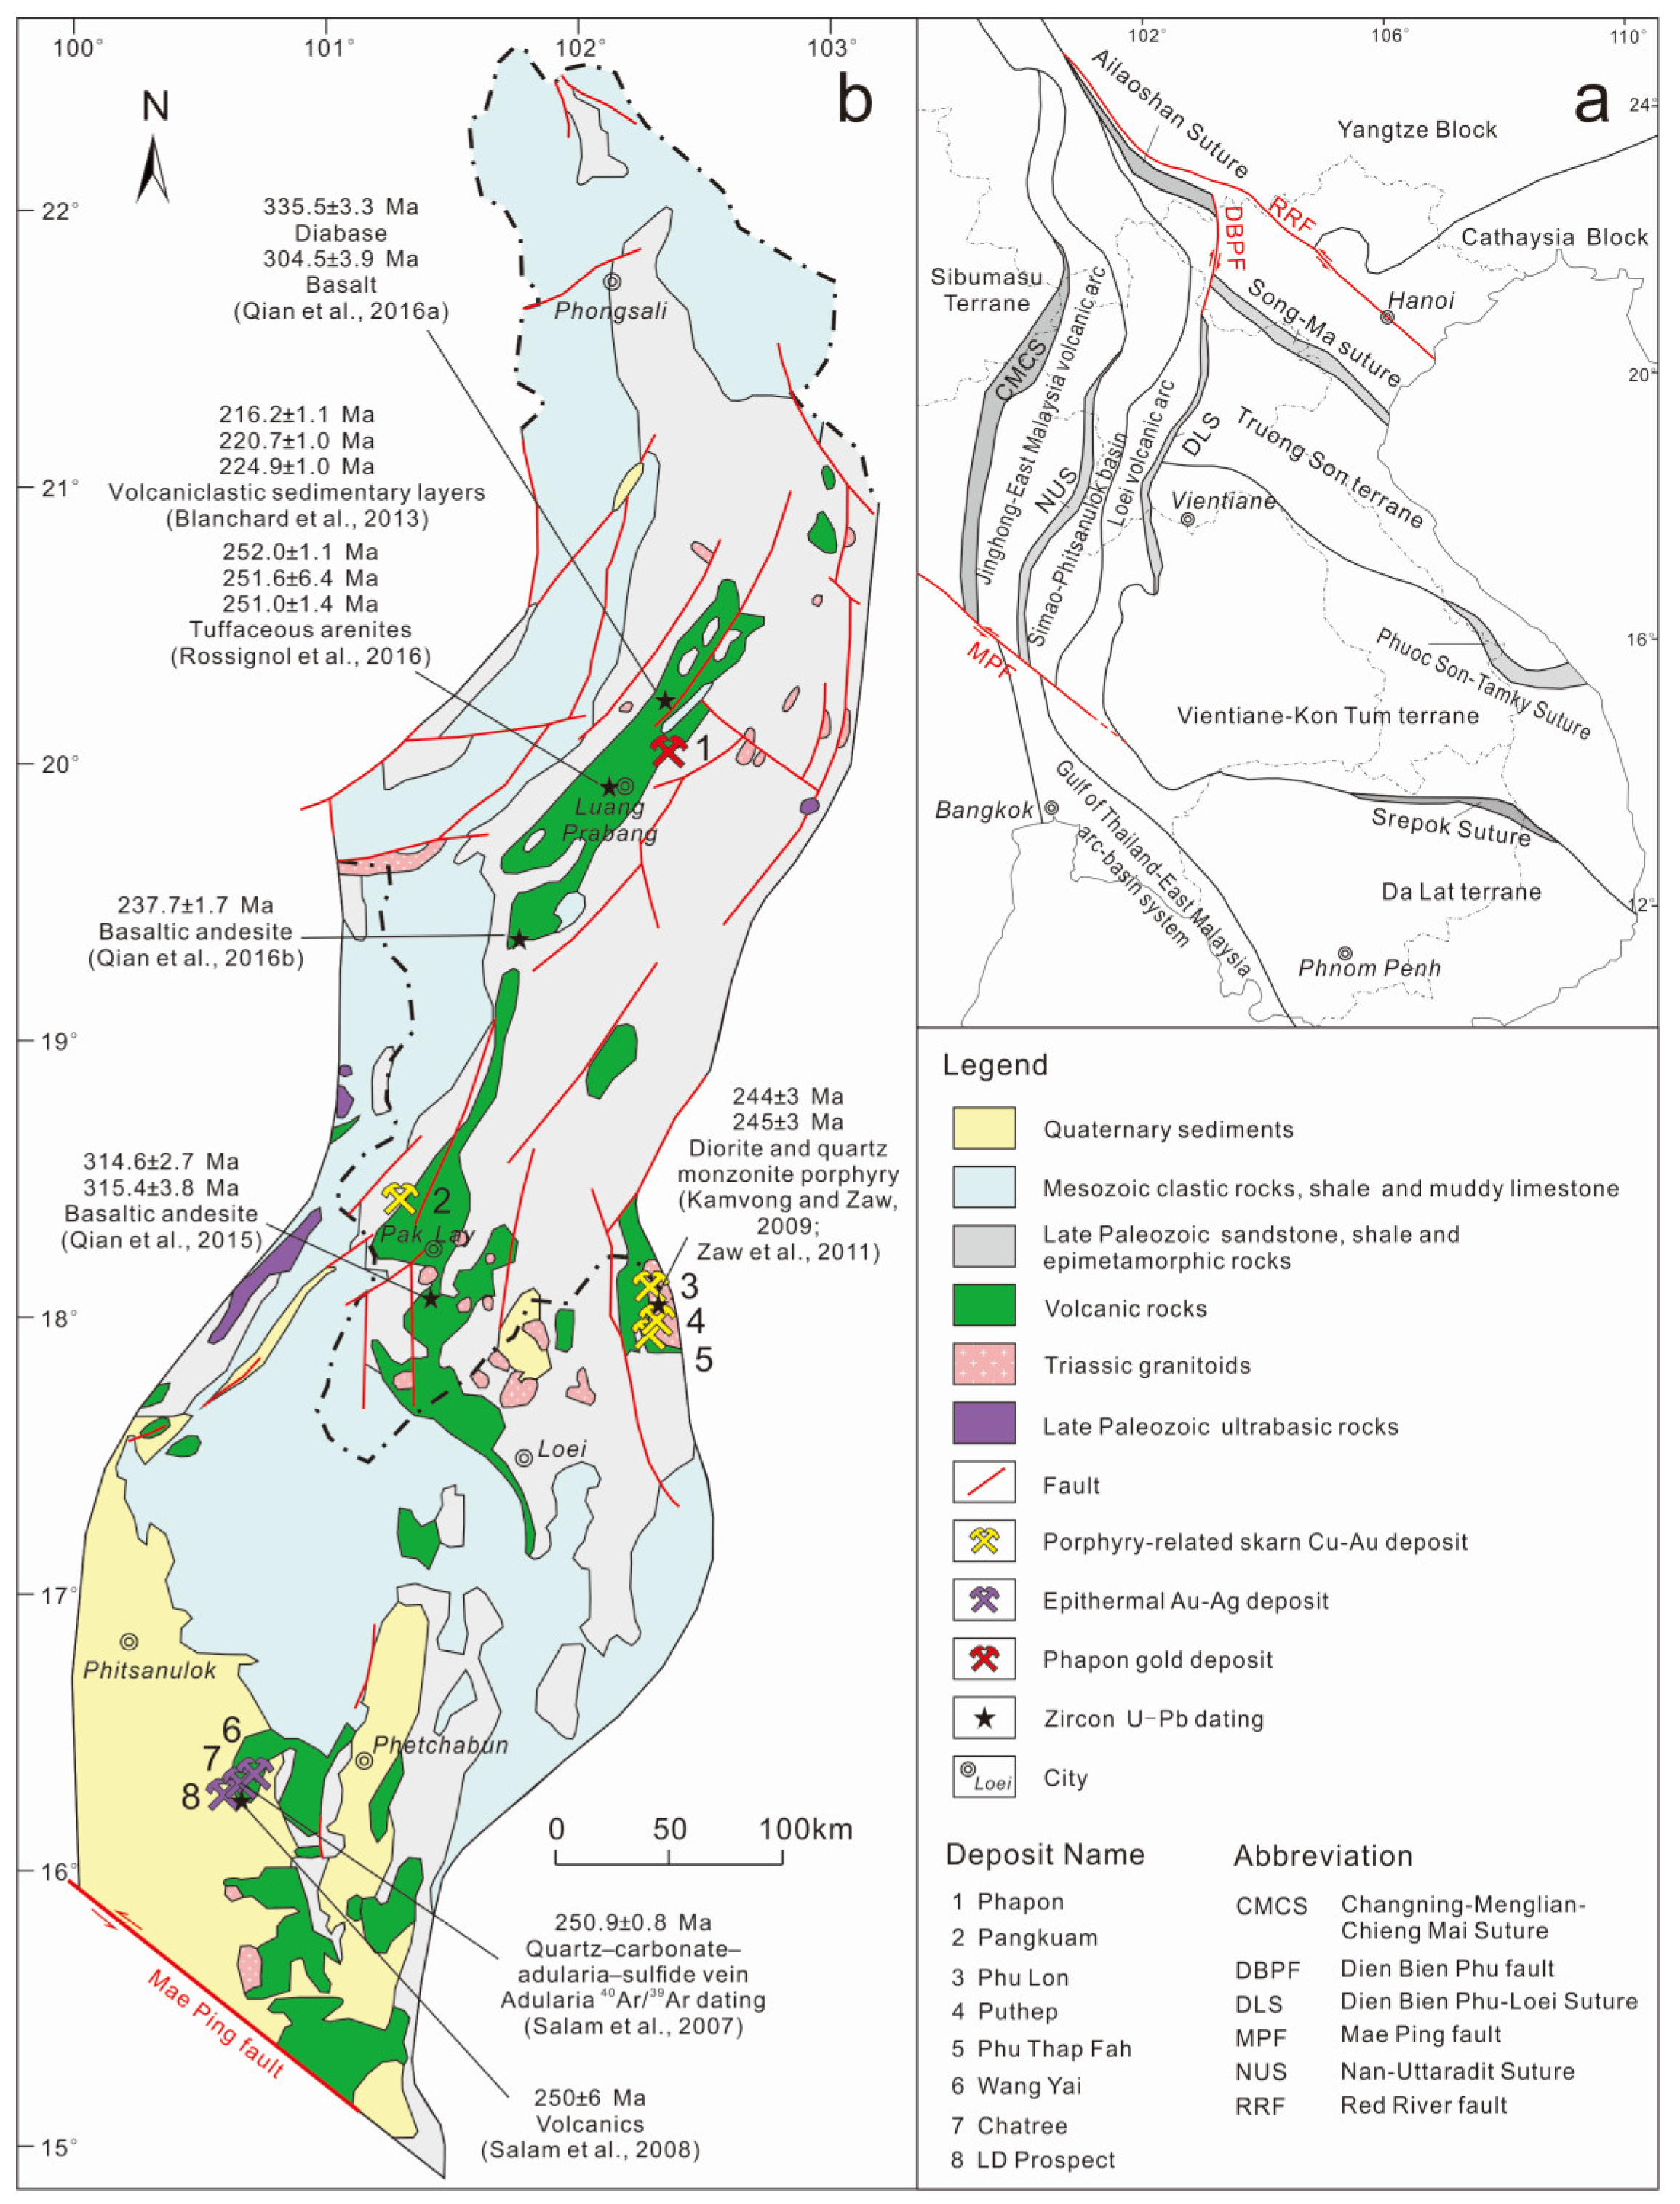
2. Regional Geology
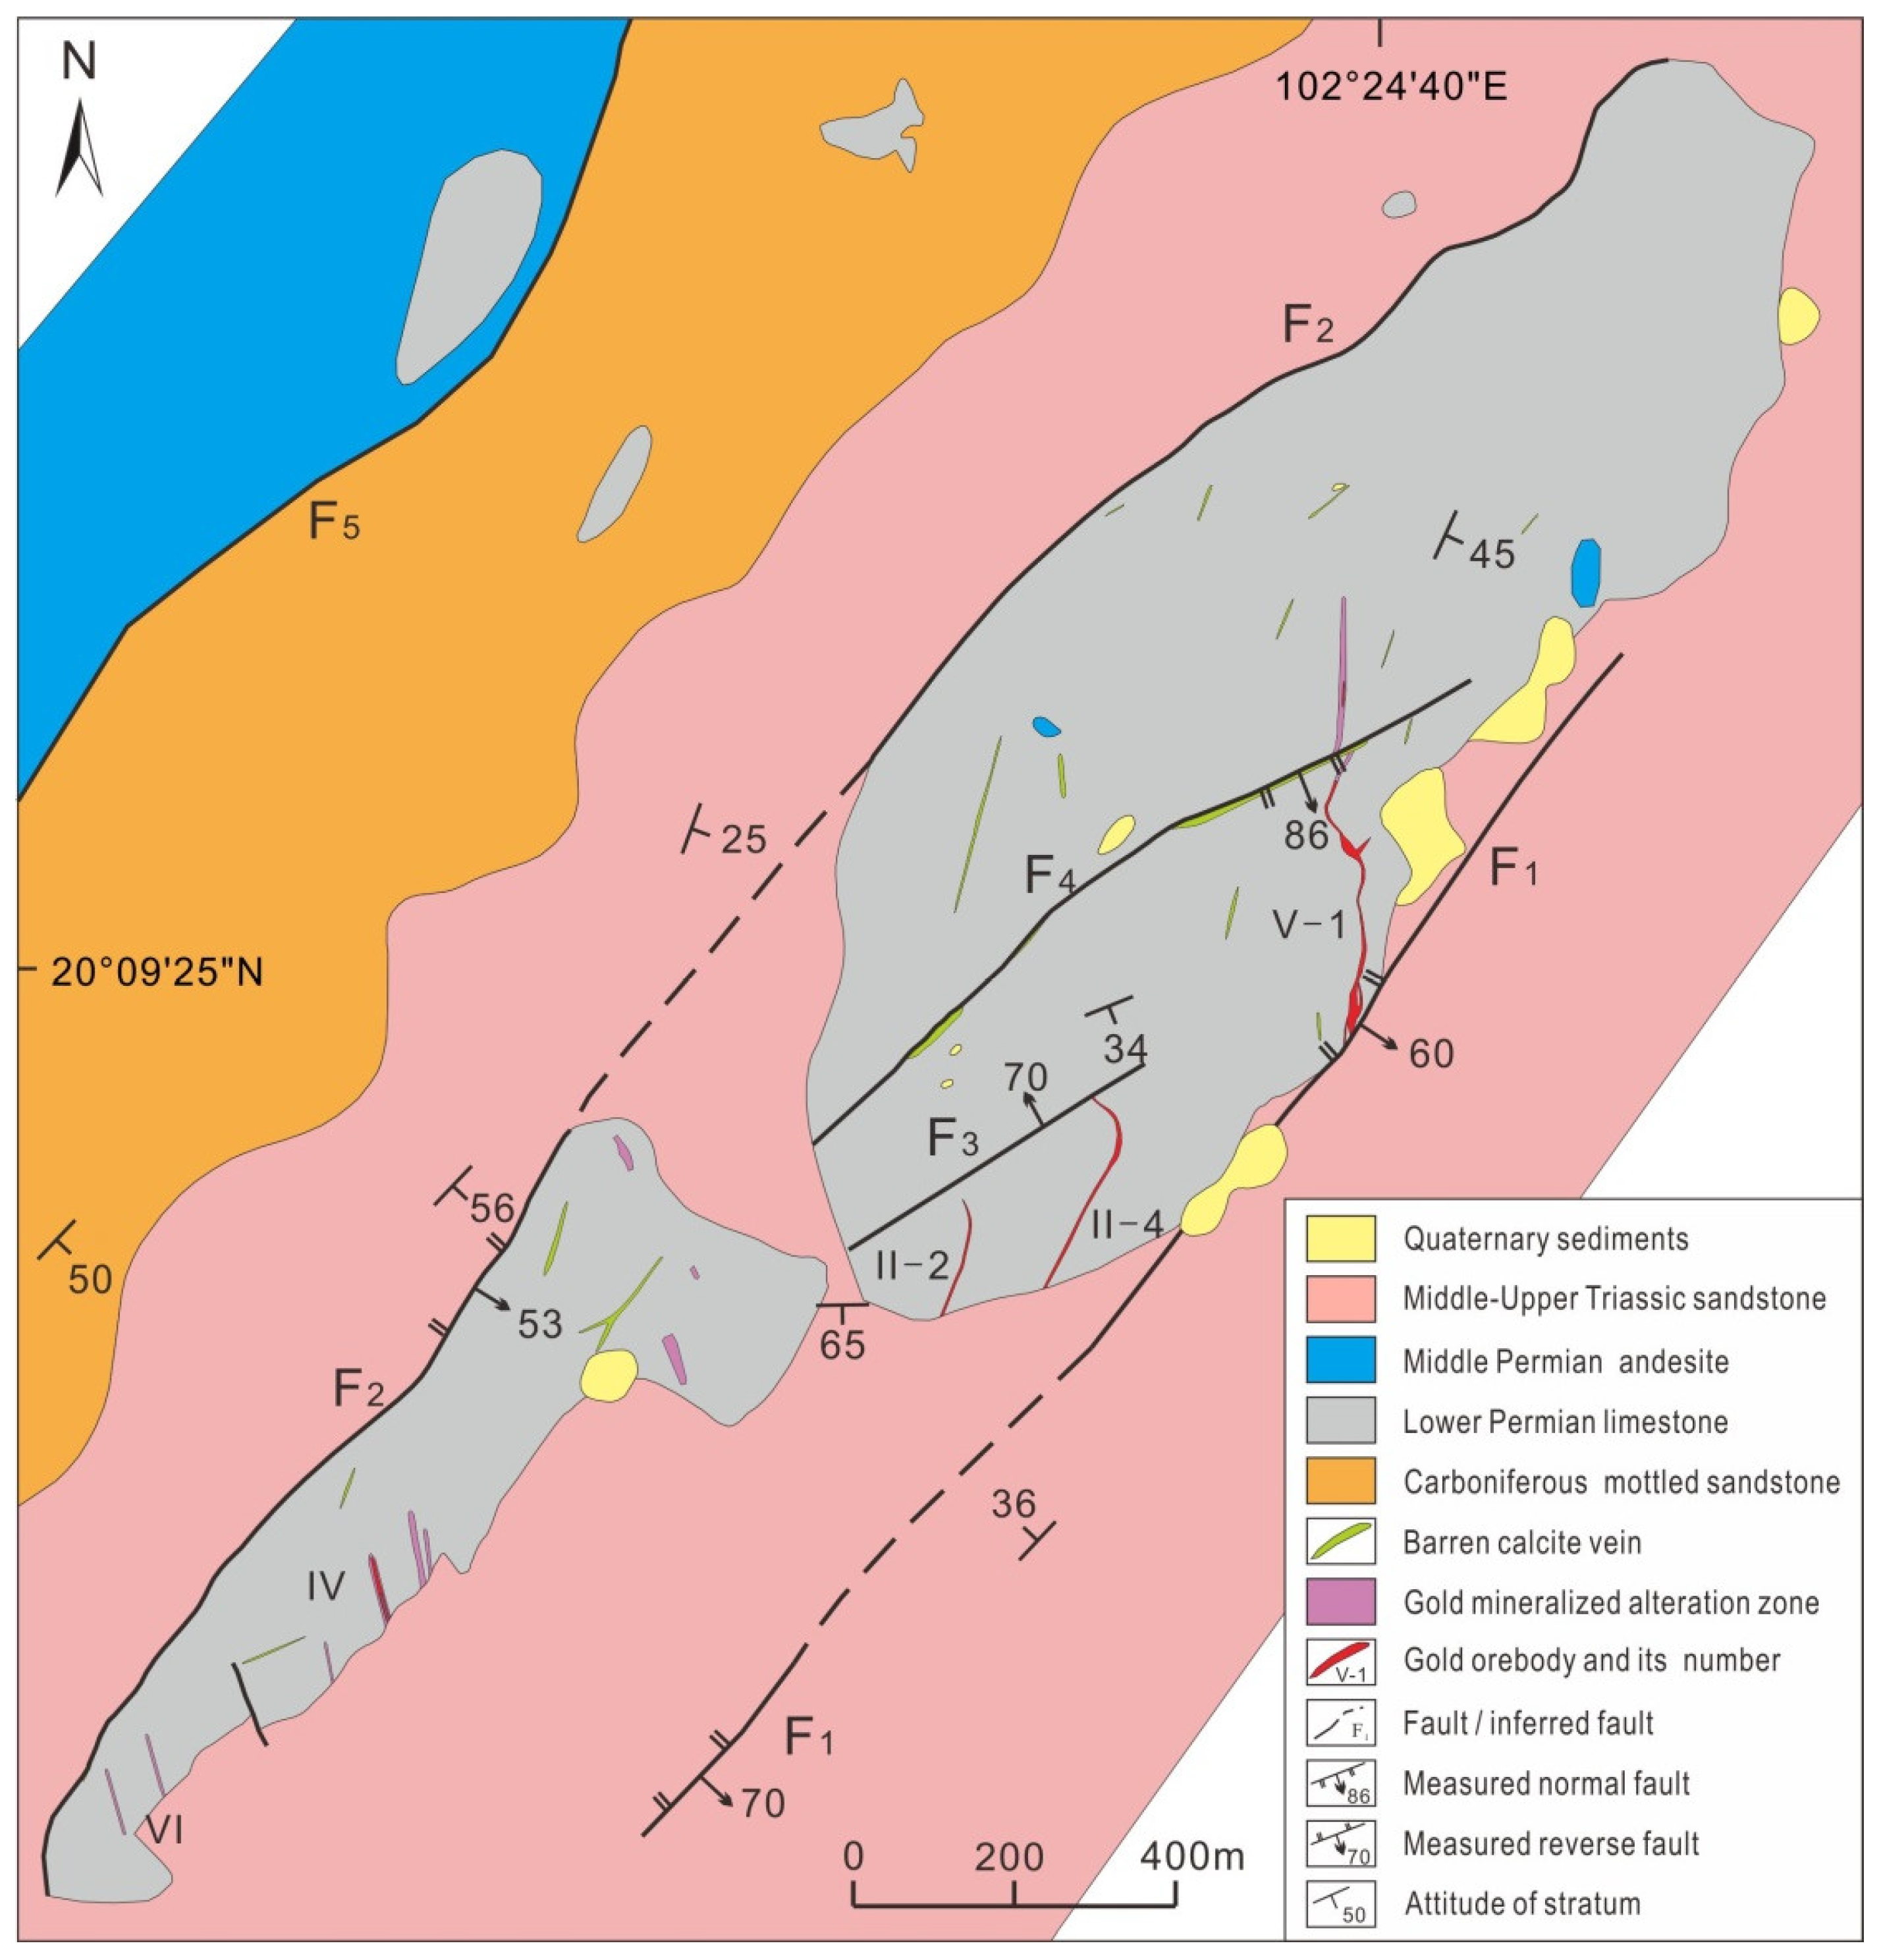
3. Local Geology
3.1. Ore Deposit Geology
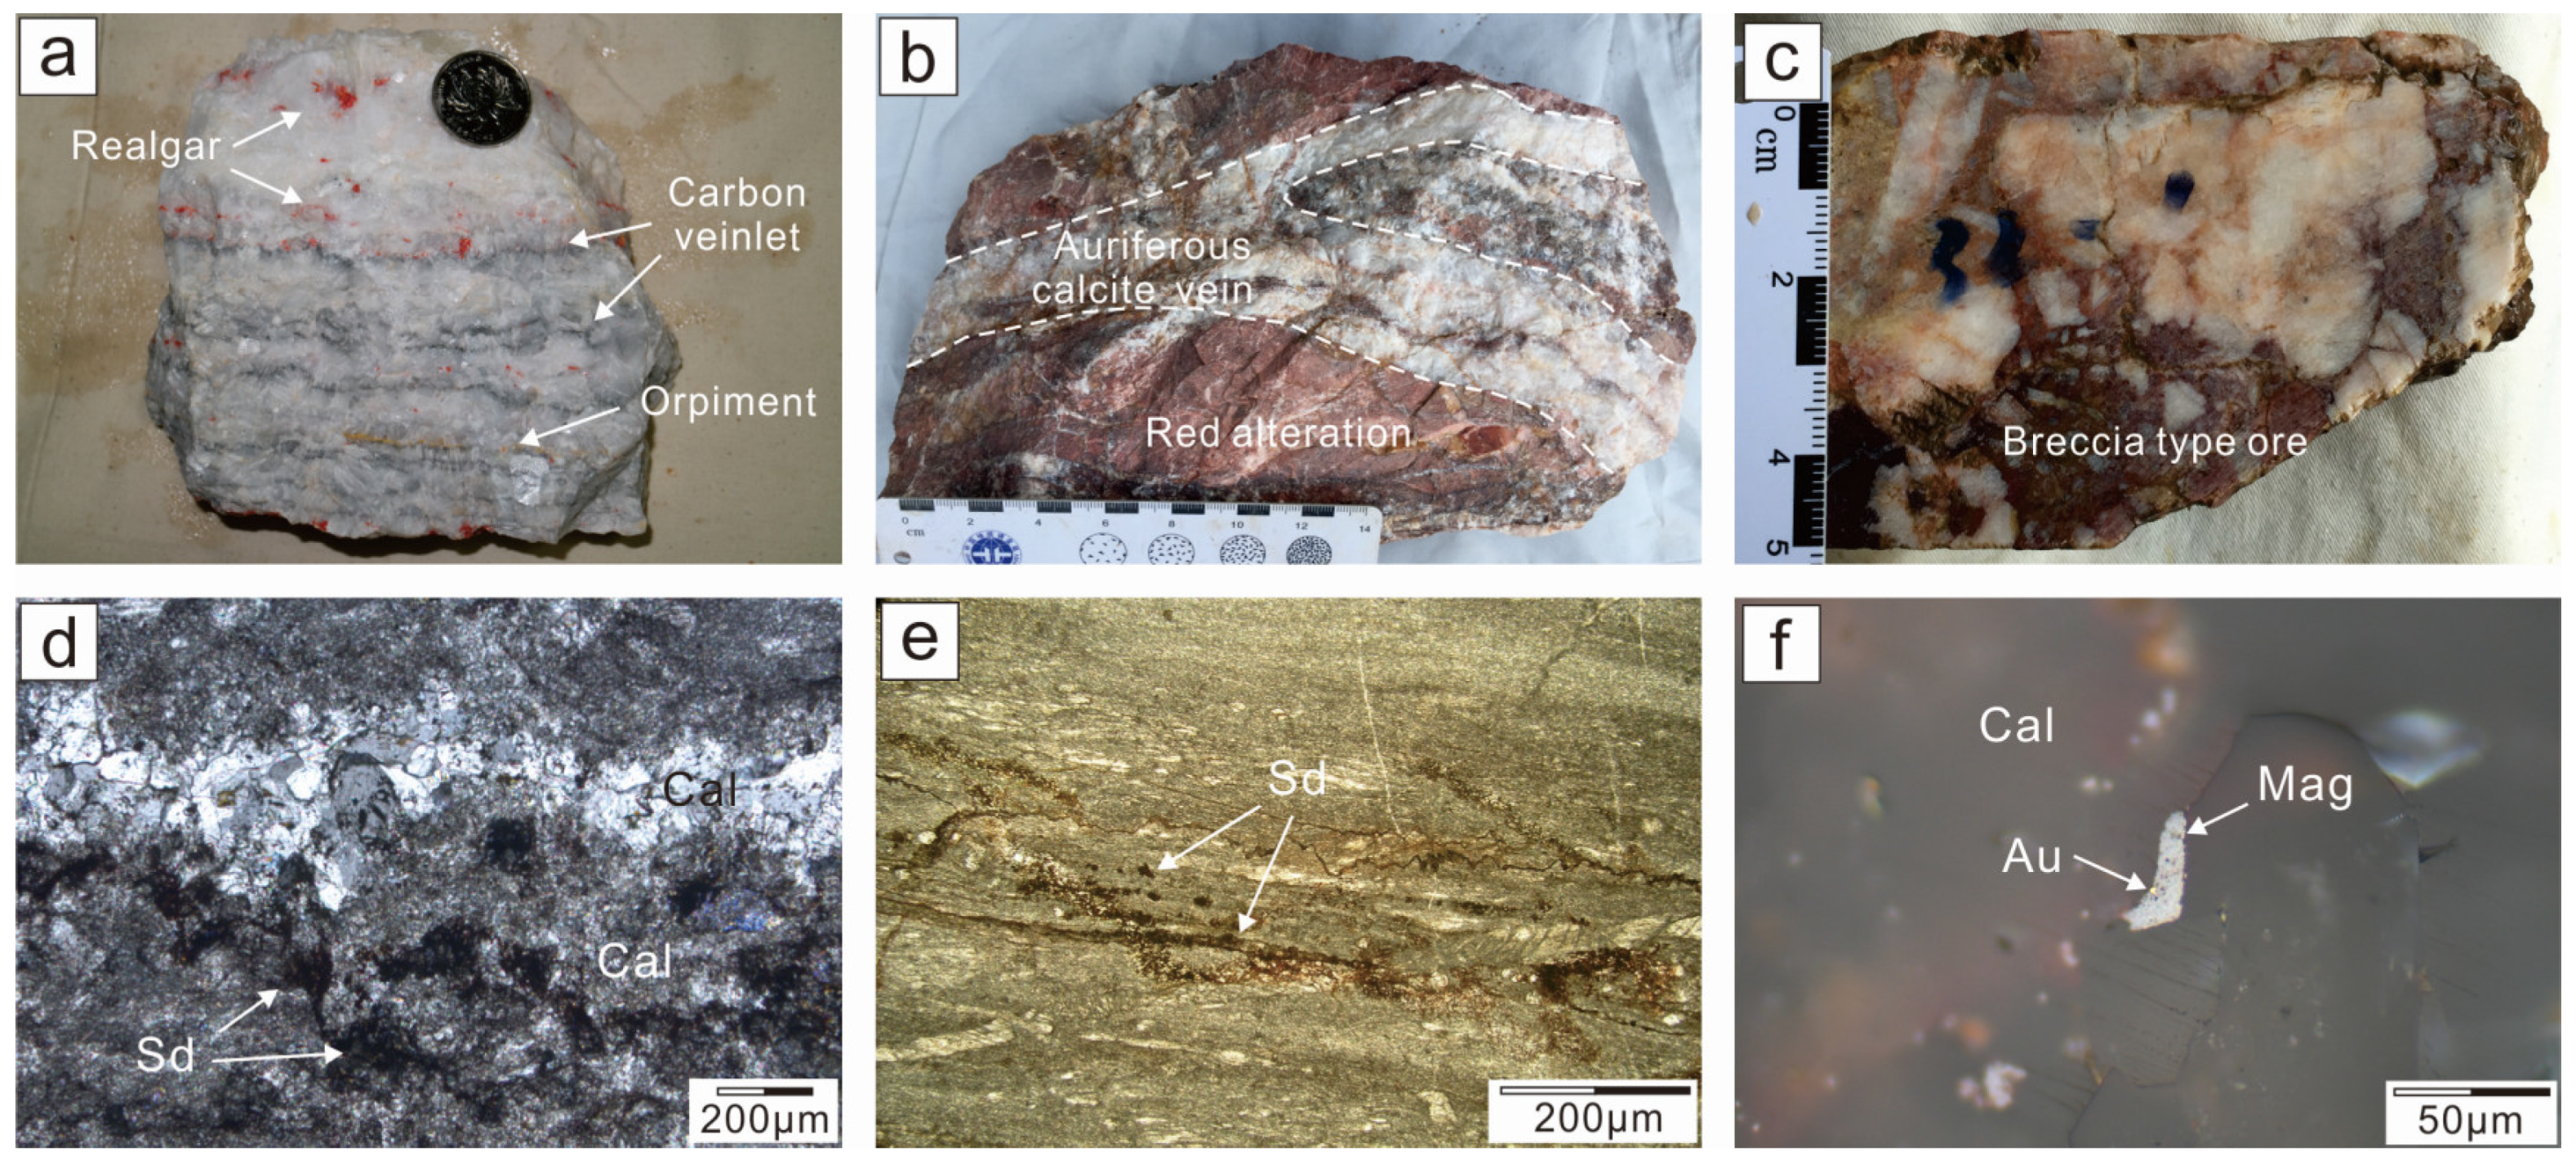
3.2. Alteration and Mineralization
4. Sampling and Analytical Methods
4.1. Trace Element Analyses
4.2. C–O Isotope Analyses
5. Analytical Results
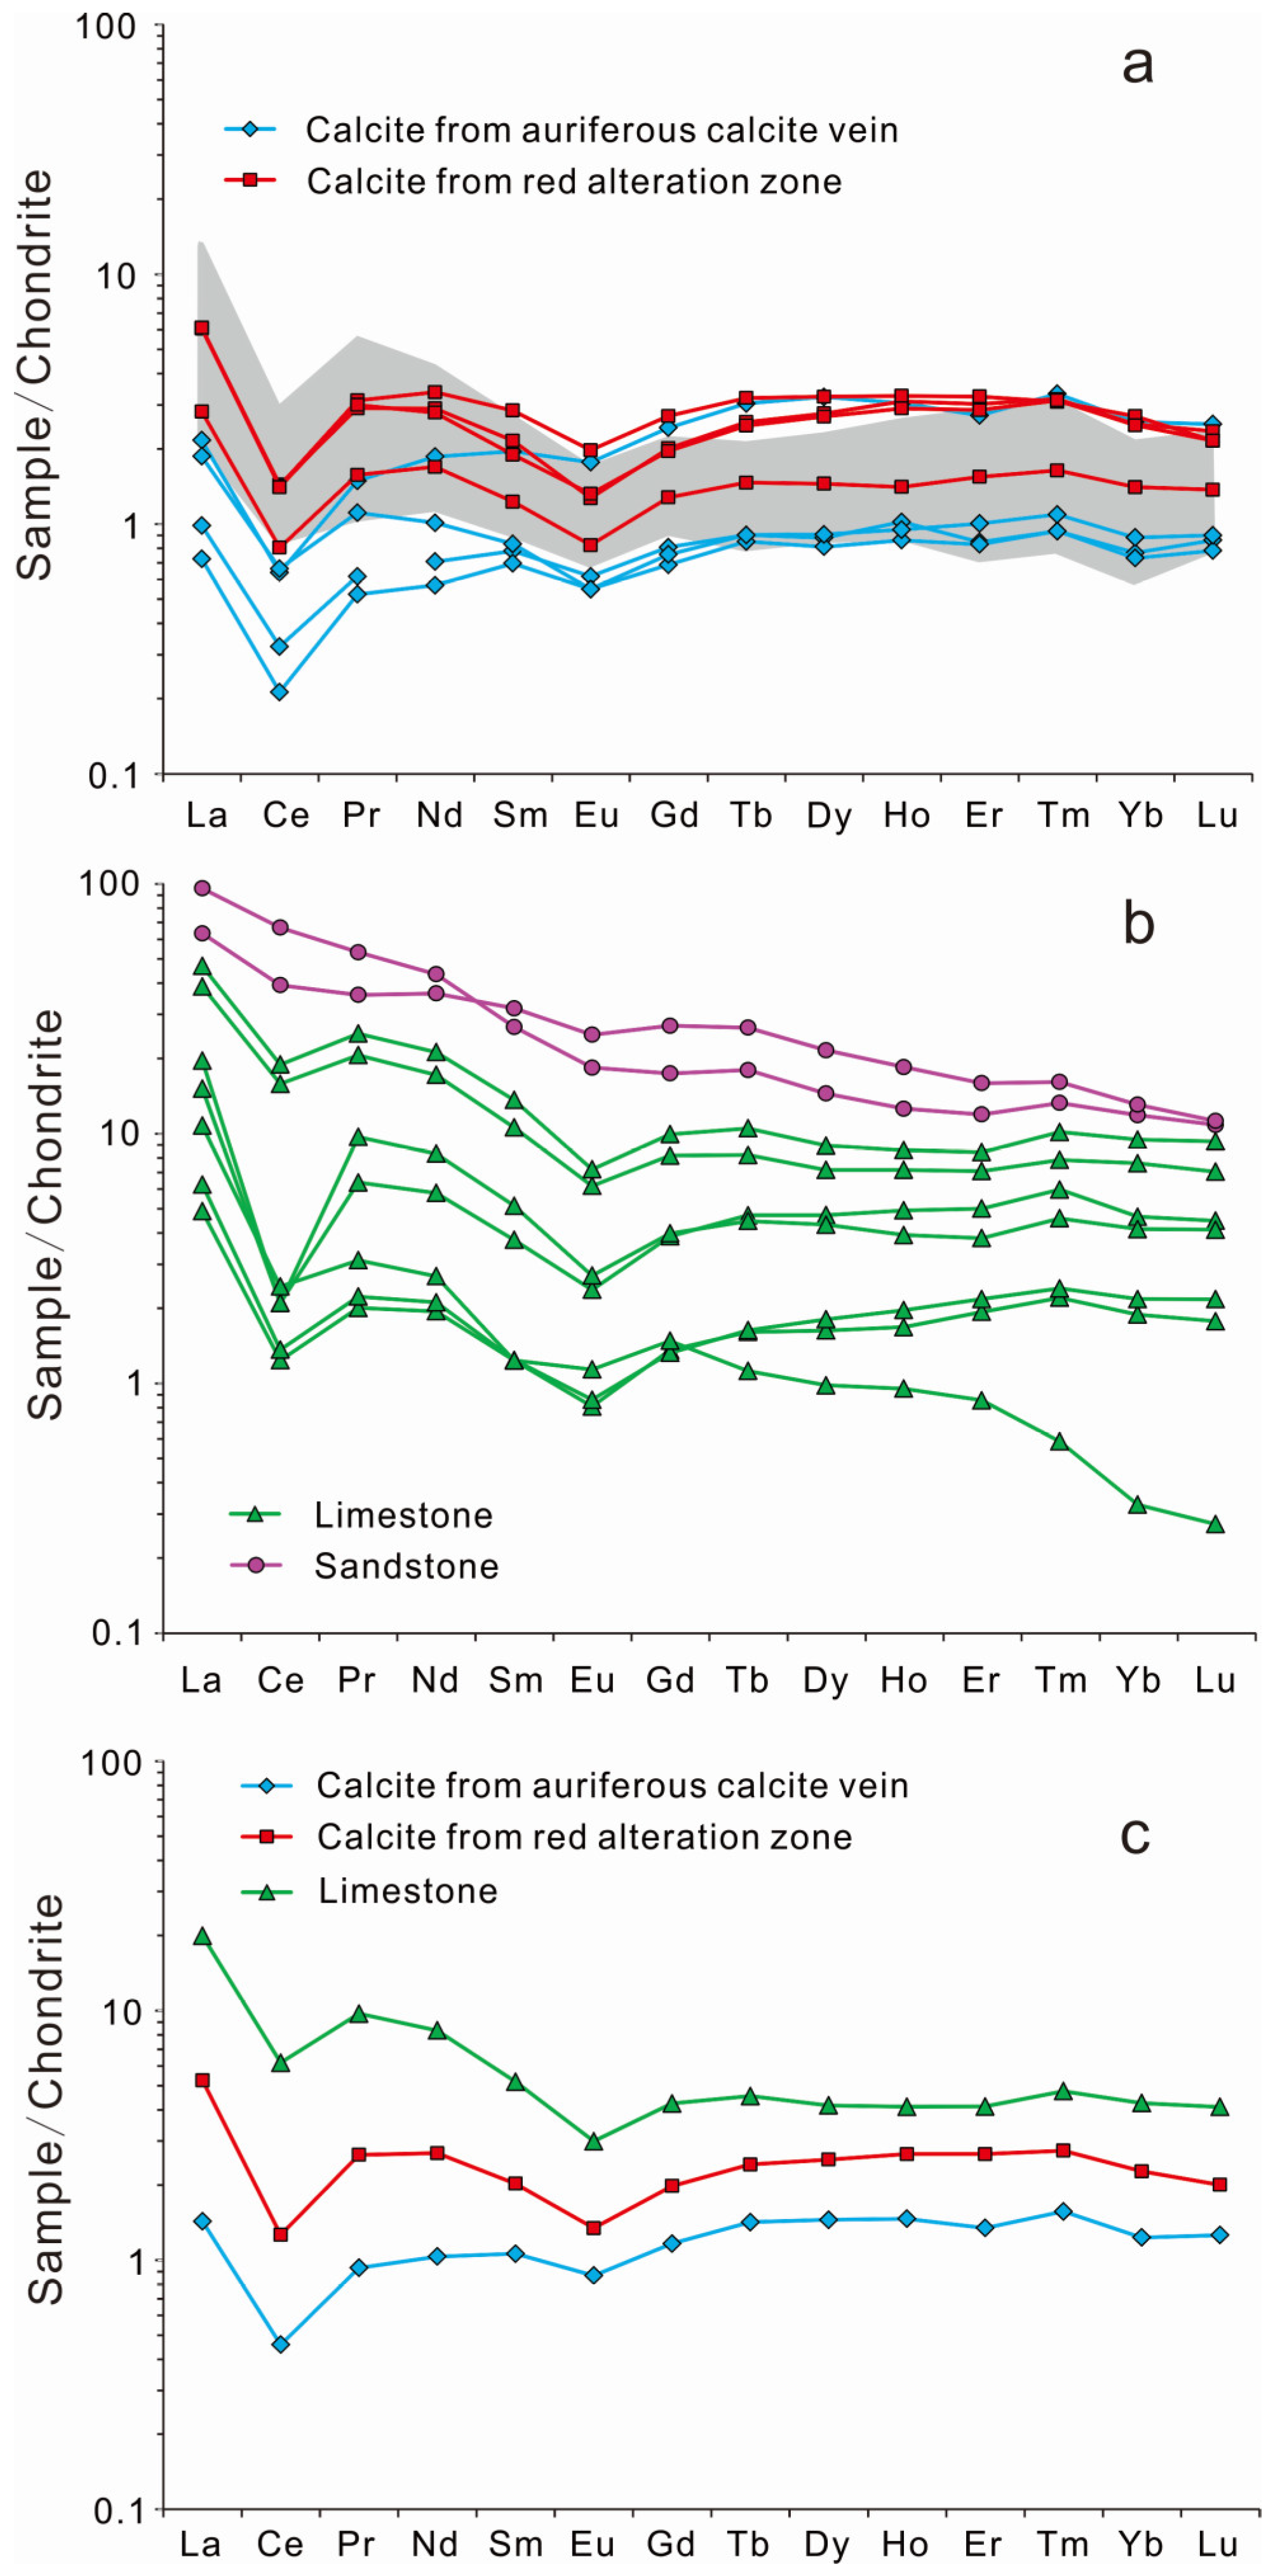
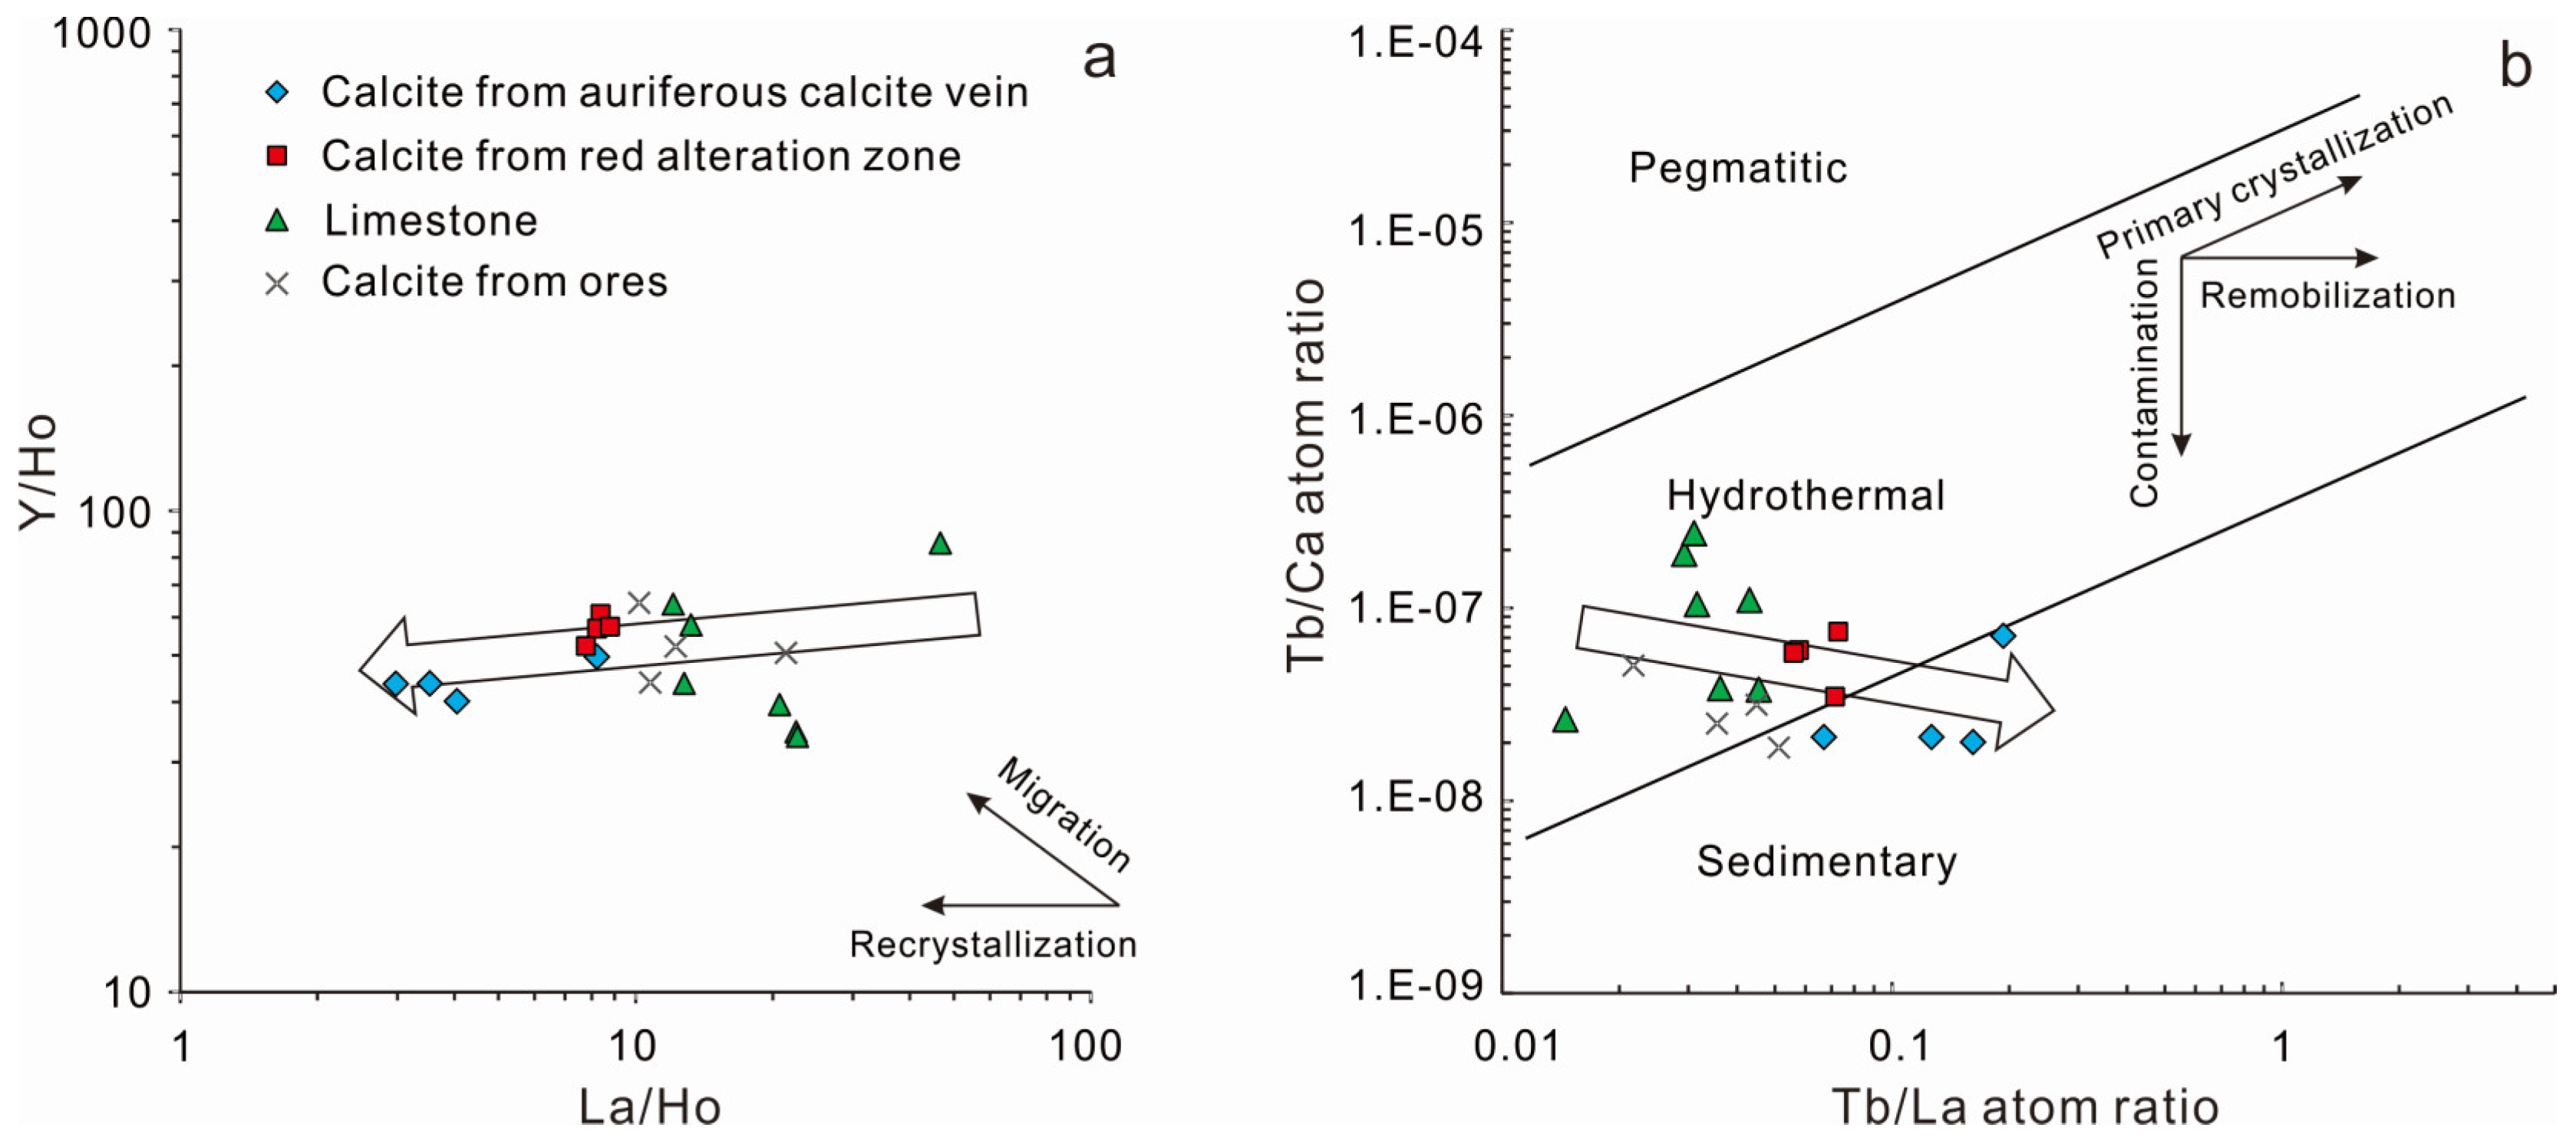
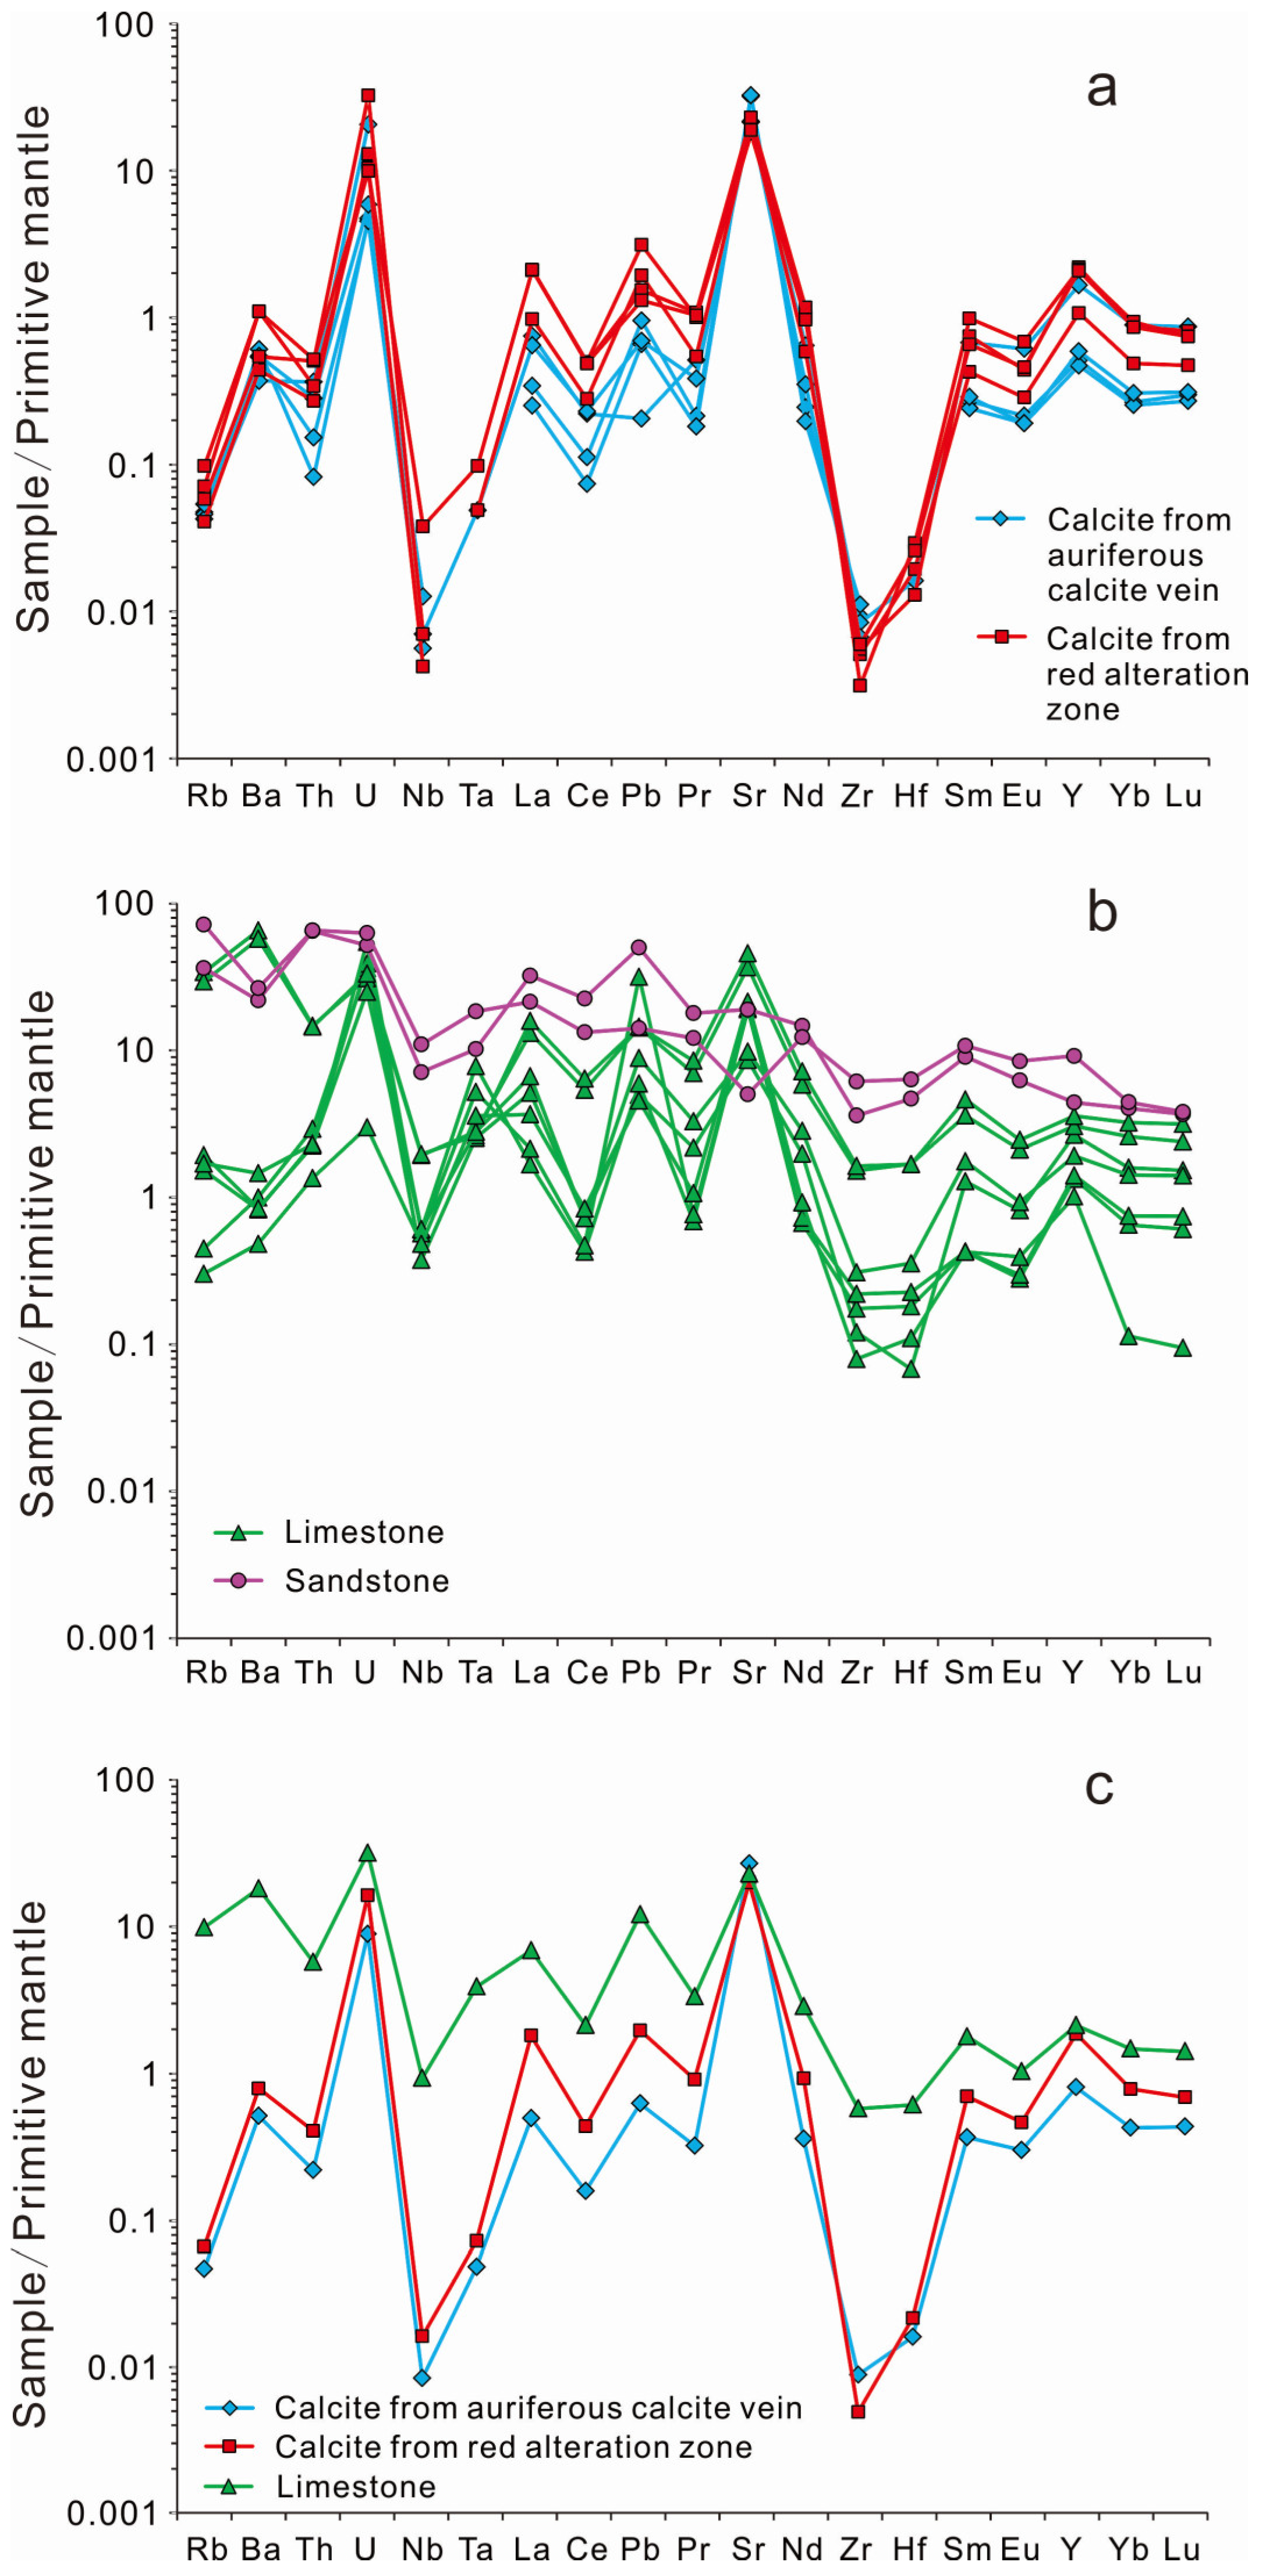
5.1. Rare Earth Elements
5.2. The Other Trace Elements
5.3. C–O Isotopic Compositions
6. Discussion
6.1. Genetic Relationships of the Two Types of Hydrothermal Calcite
6.2. Nature and Sources of Ore-Forming Fluids
6.3. Implications for Ore-Forming Processes
7. Conclusions
Author Contributions
Funding
Acknowledgments
Conflicts of Interest
References
- Goldfarb, R.J.; Taylor, R.D.; Collins, G.S.; Goryachev, N.A.; Orlandini, O.F. Phanerozoic continental growth and gold metallogeny of Asia. Gondwana Res. 2014, 25, 48–102. [Google Scholar] [CrossRef]
- Deng, J.; Wang, Q.F. Gold mineralization in China: Metallogenic provinces, deposit types and tectonic framework. Gondwana Res. 2016, 36, 219–274. [Google Scholar] [CrossRef]
- Zhao, Y.P.; Kang, T.S.; Ning, G.C.; Ge, H.; Pan, H. Geochemical characteristics of the volcanic intrusive complex in the Pangkuam copper-gold deposit of Laos and its geological significance. Acta Petrol. Mineral. 2017, 36, 281–294, (In Chinese with English Abstract). [Google Scholar]
- Shi, M.F.; Lin, F.C.; Fan, W.Y.; Deng, Q.; Cong, F.; Tran, M.D.; Zhu, H.P.; Wang, H. Zircon U–Pb ages and geochemistry of granitoids in the Truong Son terrane, Vietnam: Tectonic and metallogenic implications. J. Asian Earth Sci. 2015, 101, 101–120. [Google Scholar] [CrossRef]
- Lin, F.C.; Shi, M.F.; Li, X.Z. Geological Background and Metallogenic Regularities of the Sanjiang—Mekong Metallogenic Belt; Internal materials of Chengdu Center, China Geological Survey: Chengdu, China, 2010; p. 437. (In Chinese) [Google Scholar]
- Shao, C.L. The geological characteristics and prospecting criteria of the Phabon gold deposit, Laos. Geol. Surv. Res. 2011, 34, 203–209, (In Chinese with English Abstract). [Google Scholar]
- Liu, X.C.; Zhang, R.H.; Che, L.K. Geological characteristics of B. Phatem primary gold deposit, Laos and the ore-searching directions. Contrib. Geol. Miner. Resour. Res. 2010, 25, 171–176, (In Chinese with English Abstract). [Google Scholar]
- Dai, F.Y.; Niu, Y.J. Characters of mineralogy and genesis of Phabon gold deposit in Luang Prabang Province, Laos. Miner. Explor. 2014, 5, 511–518, (In Chinese with English Abstract). [Google Scholar]
- Shi, L.H.; Xue, L.H.; Sun, H.Y. Characteristic of wall rock alteration and its relation with gold mineralization of the Phapon gold deposit in Laos. Geol. Surv. Res. 2016, 39, 184–190, (In Chinese with English Abstract). [Google Scholar]
- Lu, F.F.; Yang, H.L.; Tong, W.H.; Zhao, M.S. Inclusion characteristics of Phabon gold deposit, Laos. Henan Sci. 2015, 33, 1985–1989, (In Chinese with English Abstract). [Google Scholar]
- Niu, Y.J.; Liu, W.; Gao, Y.L.; Liu, Z.Y.; Yang, H.L.; Yu, W.X. Geochemical characteristics of stable isotopes and REE at the PHAPUN gold deposit in Laos. Geol. Surv. Res. 2015, 3, 277–283, (In Chinese with English Abstract). [Google Scholar]
- Li, H.K.; Zhang, X.J.; Wang, J. Genesis of Phapon Au deposit in Luangprabang, Laos. Yunnan Geol. 2011, 30, 280–284, (In Chinese with English Abstract). [Google Scholar]
- Yang, C.Z.; Shen, L.X.; Zhou, L.; Feng, J.Z.; Liu, X.W. Characteristics of geology and structural geochemistry and metallogenic mechanism of Phapon gold deposit in Laos. Miner. Resour. Geol. 2017, 31, 11–22, (In Chinese with English Abstract). [Google Scholar]
- Xue, L.H.; Shi, L.H. Mineralization and metallogenic evolution of the Phapon gold deposit, Laos. Geol. Surv. Res. 2016, 39, 191–203, (In Chinese with English Abstract). [Google Scholar]
- Niu, Y.J.; Sun, H.Y.; Wang, J.S.; Chen, J.Y.; Liu, Z.Y.; Wang, K. Study on feature of ore-forming fluid and ore genesis of Phapon gold deposit, Luangprobang, Laos. Contrib. Geol. Miner. Resour. Res. 2017, 32, 317–323, (In Chinese with English Abstract). [Google Scholar]
- Wang, H.; Lin, F.C.; Li, X.Z.; Shi, M.F. The division of tectonic units and tectonic evolution in Laos and its adjacent regions. Geol. China 2015, 42, 71–83, (In Chinese with English Abstract). [Google Scholar]
- Hinton, R.W.; Upton, B.J.G. The chemistry of zircon: Variations within and between large crystals from syenite and alkali basalt xenoliths. Geochim. Cosmochim. Acta 1991, 55, 3287–3302. [Google Scholar] [CrossRef]
- Orman, J.A.V.; Grove, T.L.; Shimizu, N.; Graham, D.L. Rare earth element diffusion in diopside: Influence of temperature, pressure and ionic radius and an elastic model for diffusion in silicates. Contrib. Mineral. Petrol. 2001, 141, 687–703. [Google Scholar] [CrossRef]
- Brugger, J.; Etschmann, B.; Pownceby, M.; Liu, W.; Grundler, P.; Brewe, D. Oxidation state of europium in scheelite: Tracking fluidrock interaction in gold deposits. Chem. Geol. 2008, 257, 26–33. [Google Scholar] [CrossRef]
- Peng, J.T.; Zhang, D.L.; Hu, R.Z.; Wu, M.J.; Liu, X.M.; Qi, L.; Yu, Y.G. Inhomogeneous distribution of rare earth elements (REEs) in scheelite from the Zhazixi W-Sb deposit, western Hunan and its geological implications. Geol. Rev. 2010, 56, 810–820, (In Chinese with English Abstract). [Google Scholar]
- Schönenberger, J.; Köhler, J.; Markl, G. REE systematics of fluorides, calcite and siderite in peralkaline plutonic rocks from the Gardar Province, South Greenland. Chem. Geol. 2008, 247, 16–35. [Google Scholar] [CrossRef]
- Dostal, J.; Kontak, D.; Chatterjee, A.K. Trace element geochemistry of scheelite and rutile from metaturbidite-hosted quartz vein gold deposits, Meguma Terrane, Nova Scotia, Canada: Genetic implications. Mineral. Petrol. 2009, 97, 95–109. [Google Scholar] [CrossRef]
- Brugger, J.; Lahaye, Y.; Costa, S.; Lambert, D.; Bateman, R. Inhomogeneous distribution of REE in scheelite and dynamics of Archaean hydrothermal systems (Mt. Charlotte and Drysdale gold deposits, Western Australia). Contrib. Mineral. Petrol. 2000, 139, 251–264. [Google Scholar] [CrossRef]
- Bau, M.; Romer, R.L.; Lüders, V.; Dulski, P. Tracing element sources of hydrothermal mineral deposits: REE and Y distribution and Sr-Nd-Pb isotopes in fluorite from MVT deposits in the Pennine orefield, England. Miner. Depos. 2003, 38, 992–1008. [Google Scholar] [CrossRef]
- Zhang, D.L.; Peng, J.T.; Fu, Y.Z.; Peng, G.X. Rare-earth element geochemistry in Ca-bearing minerals from the Xianghuapu tungsten deposit, Hunan Province, China. Acta Petrol. Sin. 2012, 28, 65–74, (In Chinese with English Abstract). [Google Scholar]
- Wang, J.S.; Wen, H.J.; Fan, H.F.; Zhu, J.J.; Zhang, J.R. Sm-Nd geochronology, REE geochemistry and C and O isotope characteristics of calcites and stibnites from the Banian antimony deposit, Guizhou Province, China. Geochem. J. 2013, 46, 393–407, (In Chinese with English Abstract). [Google Scholar] [CrossRef]
- Wu, Y.; Zhang, C.Q.; Tian, G. REE geochemistry of fluorite from Paoma lead-zinc deposit in Sichuan Province, China and its geological implications. Acta Mieral. Sin. 2013, 33, 295–301, (In Chinese with English Abstract). [Google Scholar]
- Cao, H.W.; Zhang, W.; Pei, Q.M.; Zhang, S.T.; Zheng, L. Trace element geochemistry of fluorite and calcite from the Xiaolonghe Tin deposits and Lailishan Tin deposits in Western Yunnan, China. Bull. Mineral. Petrol. Geochem. 2016, 35, 925–935, (In Chinese with English Abstract). [Google Scholar]
- Deng, J.; Wang, Q.F.; Li, G.J.; Li, C.S.; Wang, C.M. Tethys tectonic evolution and its bearing on the distribution of important mineral deposits in the Sanjiang region, SW China. Gondwana Res. 2014, 26, 419–437. [Google Scholar] [CrossRef]
- Deng, J.; Wang, Q.F.; Li, G.J.; Santosh, M. Cenozoic tectono-magmatic and metallogenic processes in the Sanjiang region, southwestern China. Earth-Sci. Rev. 2014, 138, 268–299. [Google Scholar] [CrossRef]
- Yang, L.Q.; He, W.Y.; Gao, X.; Xie, S.X.; Yang, Z. Mesozoic multiple magmatism and porphyry-skarn Cu-polymetallic systems of the Yidun Terrane, Eastern Tethys: Implications for subduction- and transtension-related metallogeny. Gondwana Res. 2018, 62, 144–162. [Google Scholar] [CrossRef]
- Phajuy, B.; Panjasawatwong, Y.; Osataporn, P. Preliminary geochemical study of volcanic rocks in the Pang Mayao area, Phrao, Chiang Mai, Northern Thailand: tectonic setting of formation. J. Asian Earth Sci. 2005, 24, 765–776. [Google Scholar] [CrossRef]
- Zaw, K.; Meffre, S. Metallogenic Relations and Depositscale Studies, Final Report: Geochronology, Metallogenesis and Deposit Styles of Loei Fold Belt in Thailand and Laos PDR; ARC Linkage Project, CODES with Industry Partners; University of Tasmania: Hobart, Australia, 2007. [Google Scholar]
- Salam, A. A Geological, Geochemical and Metallogenic Study of the Chatree Epithermal Deposit, Petchabun Province, Central Thailand. Ph.D. Thesis, ARC Centre of Excellence in Ore Deposits (CODES), University of Tasmania, Hobart, Australia, 2013; p. 250. [Google Scholar]
- Salam, A.; Zaw, K.; Meffre, S.; Mcphie, J.; Lai, C.K. Geochemistry and geochronology of epithermal Au-hosted Chatree volcanic sequence: Implication for tectonic setting of the Loei Fold Belt in central Thailand. Gondwana Res. 2014, 26, 198–217. [Google Scholar] [CrossRef]
- Qian, X.; Feng, Q.L.; Wang, Y.J.; Chonglakmani, C.; Monjai, D. Geochronological and geochemical constraints on the mafic rocks along the Luang Prabang zone: Carboniferous back-arc setting in northwest Laos. Lithos 2016, 245, 60–75. [Google Scholar] [CrossRef]
- Qian, X.; Feng, Q.L.; Yang, W.Q.; Wang, Y.J.; Chonglakmani, C.; Monjai, D. Arc-like volcanic rocks in NW Laos: Geochronological and geochemical constraints and their tectonic implications. J. Asian Earth Sci. 2015, 98, 342–357. [Google Scholar] [CrossRef]
- Rossignol, C.; Bourquin, S.; Poujol, M.; Hallot, E.; Dabard, M.P.; Nalpas, T. The volcaniclastic series from the Luang Prabang Basin, Laos: A witness of a triassic magmatic arc? J. Asian Earth Sci. 2016, 120, 159–183. [Google Scholar] [CrossRef] [Green Version]
- Qian, X.; Feng, Q.L.; Wang, Y.J.; Yang, W.Q.; Chonglakmani, C.; Monjai, D. Petrochemistry and tectonic setting of the Middle Triassic arc-like volcanic rocks in the Sayabouli Area, NW Laos. J. Earth Sci. 2016, 27, 365–377. [Google Scholar] [CrossRef]
- Blanchard, S.; Rossignol, C.; Bourquin, S.; Dabard, M.P.; Hallot, E.; Nalpas, T. Late Triassic volcanic activity in South-East Asia: New stratigraphical, geochronological and paleontological evidence from the Luang Prabang Basin (Laos). J. Asian Earth Sci. 2013, 70–71, 8–26. [Google Scholar] [CrossRef]
- Kamvong, T.; Zaw, K.; Meffre, S.; Maas, R.; Stein, H.; Lai, C.K. Adakites in the Truong Son and Loei fold belts, Thailand and Laos: Genesis and implications for geodynamics and metallogeny. Gondwana Res. 2014, 26, 165–184. [Google Scholar] [CrossRef]
- Kamvong, T.; Zaw, K. The origin and evolution of skarn-forming fluids from the Phu Lon deposit, northern Loei Fold Belt, Thailand: Evidence from fluid inclusion and sulfur isotope studies. J. Asian Earth Sci. 2009, 34, 624–633. [Google Scholar] [CrossRef]
- Zaw, K.; Kamvong, T.; Khositanont, S.; Mernagh, T.P. Oxidized vs. reduced Cu–Au skarn formation and implication for exploration, Loei and Truong Son fold belts, SE Asia. In Proceedings of the International Conference on Geology, Geotechnology and Mineral Resources of Indochina (GEOINDO 2011), Khon Kean, Thailand, 1–3 December 2011; pp. 97–100. [Google Scholar]
- Zaw, K.; Meffre, S.; Lai, C.K.; Burrett, C.; Santosh, M.; Graham, I.; Manaka, T.; Salam, A.; Kamvong, T.; Cromie, P. Tectonics and metallogeny of mainland Southeast Asia—A review and contribution. Gondwana Res. 2014, 26, 5–30. [Google Scholar] [CrossRef]
- Tangwattananukul, L.; Ishiyama, D.; Matsubaya, O.; Mizuta, T.; Charusiri, P. Gold mineralization of Q prospect at Chatree deposit, central Thailand. NMCC Annu. Rep. 2009, 16, 70–75. [Google Scholar]
- Qiu, K.F.; Taylor, R.D.; Song, Y.H.; Yu, H.C.; Song, K.R.; Li, N. Geologic and geochemical insights into the formation of the Taiyangshan porphyry copper–molybdenum deposit, Western Qinling Orogenic Belt, China. Gondwana Res. 2016, 35, 40–58. [Google Scholar] [CrossRef]
- Qiu, K.F.; Marsh, E.; Yu, H.C.; Pfaff, K.; Gulbransen, C.; Gou, Z.Y.; Li, N. Fluid and metal sources of the Wenquan porphyry molybdenum deposit, Western Qinling, NW China. Ore Geol. Rev. 2017, 86, 459–473. [Google Scholar] [CrossRef]
- Liu, Y.S.; Hu, Z.C.; Gao, S.; Günthe, D.; Xu, J.; Gao, C.G.; Chen, H.H. In situ analysis of major and trace elements of anhydrous minerals by LA-ICP-MS without applying an internal standard. Chem. Geol. 2008, 257, 34–43. [Google Scholar] [CrossRef]
- Liu, H.B.; Jin, G.S.; Li, J.J.; Han, J.; Zhang, J.F.; Zhang, J.; Zhong, F.W.; Guo, D.Q. Determination of stable isotope composition in uranium geological samples. World Nucl. Geosci. 2013, 3, 174–179, (In Chinese with English Abstract). [Google Scholar]
- Sun, S.S.; McDonough, W.F. Chemical and isotopic systematics of oceanic basalts: Implications for mantle composition and processes. Geol. Soc. Lond. Spec. Publ. 1989, 42, 313–345. [Google Scholar] [CrossRef]
- Schwinn, G.; Markl, G. REE systematics in hydrothermal fluorite. Chem. Geol. 2005, 216, 225–248. [Google Scholar] [CrossRef]
- Bau, M.; Dulski, P. Comparative study of yttrium and rare-earth element behavior in fluorine-rich hydrothermal fluids. Contrib. Mineral. Petrol. 1995, 119, 213–223. [Google Scholar] [CrossRef]
- Shuang, Y.; Bi, X.W.; Hu, R.Z.; Peng, J.T.; Li, Z.L.; Li, X.M.; Yuan, S.D.; Qi, Y.Q. REE geochemistry of hydrothermal calcite from tin-polymetallic deposit and its indication of source of hydrothermal ore-forming fluid. J. Mineral. Petrol. 2006, 26, 57–65, (In Chinese with English Abstract). [Google Scholar]
- Möller, P.; Parekh, P.P.; Schneider, H.J. The application of Tb/Ca–Tb/La abundance ratios to problems of fluorspar genesis. Miner. Depos. 1976, 11, 111–116. [Google Scholar] [CrossRef]
- Morgan, J.W.; Wandless, G.A. Rare earth elements in some hydrothermal minerals: Evidence for crystallographic control. Geochim. Cosmochim. Acta 1980, 44, 973–980. [Google Scholar] [CrossRef]
- Michard, A. Rare earth element systematics in hydrothermal fluids. Geochim. Cosmochim. Acta 1989, 53, 745–750. [Google Scholar] [CrossRef]
- Bau, M.; Möller, P. Rare earth element fractionation in metamorphogenic hydrothermal calcite, magnesite and siderite. Mineral. Petrol. 1992, 45, 231–246. [Google Scholar] [CrossRef]
- Bau, M. Rare-earth element mobility during hydrothermal and metamorphic fluid-rock interaction and the significance of the oxidation state of europium. Chem. Geol. 1991, 93, 219–230. [Google Scholar] [CrossRef]
- Subías, I.; Fernández-Nieto, C. Hydrothermal events in the Valle de Tena (Spanish Western Pyrenees) as evidenced by fluid inclusions and trace-element distribution from fluorite deposits. Chem. Geol. 1995, 124, 267–282. [Google Scholar] [CrossRef]
- Constantopoulos, J. Fluid inclusions and rare-earth element geochemistry of fluorite from south-central Idaho. Econ. Geol. 1988, 88, 626. [Google Scholar] [CrossRef]
- Chesley, J.T.; Halliday, A.N.; Scrivener, R.C. Samarium-Neodymium Direct of Fluorite. Science 1991, 252, 949–951. [Google Scholar] [CrossRef] [PubMed]
- Ghaderi, M.; Palin, J.M.; Campbell, I.H.; Sylvester, P.J. Rare earth element systematics in scheelite from hydrothermal gold deposits in the Kalgoorlie-Norseman region, Western Australia. Econ. Geol. 1999, 94, 423–437. [Google Scholar] [CrossRef]
- Xu, C.; Taylor, R.N.; Li, W.; Kynicky, J.; Chakhmouradian, A.R.; Song, W. Comparison of fluorite geochemistry from REE deposits in the Panxi region and Bayan Obo, China. J. Asian Earth Sci. 2012, 57, 76–89. [Google Scholar] [CrossRef]
- Pei, Q.M.; Zhang, S.T.; Santosh, M.; Cao, H.W.; Zhang, W.; Hu, X.K.; Wang, L. Geochronology, geochemistry, fluid inclusion and C, O and Hf isotope compositions of the Shuitou fluorite deposit, Inner Mongolia, China. Ore Geol. Rev. 2017, 83, 174–190. [Google Scholar] [CrossRef]
- Möller, P.; Morteani, G. On the chemical fractionation of REE during the formation of Ca-minerals and its application to problems of the genesis of ore deposits. In The Significance of Trace Elements in Solving Petrogenetic Problems; Augustithis, S., Ed.; Theophrastus Publications: Athens, Greece, 1983; pp. 747–791. [Google Scholar]
- Faure, G. Principles of Isotope Geology, 2nd ed.; Wiley: New York, NY, USA, 1986; pp. 1–589. [Google Scholar]
- Ohmoto, H. Systematics of sulfur and carbon isotopes in hydrothermal ore deposits. Econ. Geol. 1972, 67, 551–578. [Google Scholar] [CrossRef]
- Liu, J.M.; Liu, J.J.; Zheng, M.H.; Gu, X.X. Stable isotope compositions of micro-disseminated gold and genetic discussion. Geochimica 1988, 27, 585–591. [Google Scholar]
- Assadzadeh, G.E.; Samson, I.M.; Gagnon, J.E. The trace element chemistry and cathodoluminescence characteristics of fluorite in the Mount Pleasant Sn–W–Mo deposits: Insights into fluid character and implications for exploration. J. Geochem. Explor. 2017, 172, 1–19. [Google Scholar] [CrossRef]
- Seward, T.M. Thio complexes of gold and the transport of gold in hydrothermal ore solutions. Geochim. Cosmochim. Acta 1973, 37, 379–399. [Google Scholar] [CrossRef]
- Hayashi, K.I.; Ohmoto, H. Solubility of gold in NaCl- and H2S-bearing aqueous solutions at 250–350 °C. Geochim. Cosmochim. Acta 1991, 55, 2111–2126. [Google Scholar] [CrossRef]
- Gammons, C.H.; Williams-Jones, A.E.; Yu, Y. New data on the stability of gold (I) chloride complexes at 300 °C. Mineral. Mag. A 1994, 58, 309–310. [Google Scholar] [CrossRef]
- Benning, L.G.; Seward, T.M. Hydrosulphide complexing of gold (I) in hydrothermal solutions from 150 to 500 °C and 500 to 1500 bars. Geochim. Cosmochim. Acta 1996, 60, 1849–1871. [Google Scholar] [CrossRef]
- Pokrovski, G.S.; Tagirov, B.R.; Schott, J.; Hazemann, J.L.; Proux, O. A new view on gold speciation in sulfur-bearing hydrothermal fluids from in situ X-ray absorption spectroscopy and quantum-chemical modeling. Geochim. Cosmochim. Acta 2009, 73, 5406–5427. [Google Scholar] [CrossRef]
- Cox, S.F.; Sun, S.S.; Etheridge, M.A.; Wall, V.J.; Potter, T.F. Structural and geochemical controls on the development of turbidite-hosted gold quartz vein deposits, Wattle Gully mine, central Victoria, Australia. Econ. Geol. 1995, 90, 1722–1746. [Google Scholar] [CrossRef]
- Mikucki, E.J. Hydrothermal transport and depositional processes in Archean lode-gold systems: A review. Ore Geol. Rev. 1998, 13, 307–321. [Google Scholar] [CrossRef]
- Williams-Jones, A.E.; Bowell, R.J.; Migdisov, A.A. Gold in solution. Elements 2009, 5, 281–287. [Google Scholar] [CrossRef]
- Guo, L.N.; Zhang, C.; Song, Y.Z.; Chen, B.H.; Zhou, Z.; Zhang, B.L.; Xu, X.L.; Wang, Y.W. Hydrogen and oxygen isotopes geochemistry of the Wang’ershan gold deposit, Jiaodong. Acta Petrol. Sin. 2014, 30, 2481–2494, (In Chinese with English Abstract). [Google Scholar]
- Guo, L.N.; Goldfarb, R.J.; Wang, Z.L.; Li, R.H.; Chen, B.H.; Li, J.L. A comparison of Jiaojia-and Linglong-type gold deposit ore-forming fluids: Do they differ? Ore Geol. Rev. 2017, 88, 511–533. [Google Scholar] [CrossRef]
- Yang, L.Q.; Deng, J.; Guo, L.N.; Wang, Z.L.; Li, X.Z.; Li, J.L. Origin and evolution of ore fluid, and gold deposition processes at the giant Taishang gold deposit, Jiaodong Peninsula, eastern China. Ore Geol. Rev. 2016, 72, 585–602. [Google Scholar] [CrossRef]
- Muntean, J.L.; Cline, J.S.; Simon, A.C.; Longo, A.A. Magmatic-hydrothermal origin of Nevada’s Carlin-type gold deposits. Nat. Geosci. 2011, 4, 122–127. [Google Scholar] [CrossRef]
- Makoundi, C.; Zaw, K.; Large, R.R.; Meffre, S.; Lai, C.K.; Hoe, T.G. Geology, geochemistry and metallogenesis of the Selinsing gold deposit, central Malaysia. Gondwana Res. 2014, 26, 241–261. [Google Scholar] [CrossRef]
- Deng, J.; Wang, Q.F.; Li, G.J.; Zhao, Y. Structural control and genesis of the Oligocene Zhenyuan orogenic gold deposit, SW China. Ore Geol. Rev. 2015, 65, 42–54. [Google Scholar] [CrossRef]
- Deng, J.; Yang, L.Q.; Li, R.H.; Groves, D.I.; Santosh, M.; Wang, Z.L.; Sai, S.X.; Wang, S.R. Regional structural control on the distribution of world-class gold deposits: An overview from the giant Jiaodong Gold Province, China. Geol. J. 2018, 1–14. [Google Scholar] [CrossRef]
- Deng, J.; Wang, C.M.; Bagas, L.; Santosh, M.; Yao, E. Crustal architecture and metallogenesis in the south-eastern North China Craton. Earth-Sci. Rev. 2018, 182, 251–272. [Google Scholar] [CrossRef]
- Gebre-Mariam, M.; Groves, D.I.; Mcnaughton, N.J.; Mikucki, E.J.; Vearncombe, J.R. Archaean Au–Ag mineralisation at Racetrack, near Kalgoorlie, Western Australia: A high crustal-level expression of the Archaean composite lode-gold system. Miner. Depos. 1993, 28, 375–387. [Google Scholar] [CrossRef]
- Groves, D.I.; Goldfarb, R.J.; Gebre-Mariam, M.; Hagemann, S.G.; Robert, F. Orogenic gold deposits: A proposed classification in the context of their crustal distribution and relationship to other gold deposit types. Ore Geol. Rev. 1998, 13, 7–27. [Google Scholar] [CrossRef]
- Yang, L.Q.; Deng, J.; Wang, Z.L.; Guo, L.N.; Li, R.H.; Groves, D.I.; Danyushevskiy, L.; Zhang, C.; Zheng, X.L.; Zhao, H. Relationships between gold and pyrite at the Xincheng gold deposit, Jiaodong Peninsula, China: Implications for gold source and deposition in a brittle epizonal environment. Econ. Geol. 2016, 111, 105–126. [Google Scholar] [CrossRef]
- Yang, L.Q.; Guo, L.N.; Wang, Z.L.; Zhao, R.X.; Song, M.C.; Zheng, X.L. Timing and mechanism of gold mineralization at the Wang’ershan gold deposit, Jiaodong Peninsula, eastern China. Ore Geol. Rev. 2017, 88, 491–510. [Google Scholar] [CrossRef]


| No. in Map | Deposit | Deposit Type | Tonnage (Mt) | Grade | Host Rocks | Intrusions/Ages | Alteration Minerals |
|---|---|---|---|---|---|---|---|
| 1 | Phapon (Au) | Calcite vein-type | No data | 6.28 g/t Au | Limestone | No known intrusion | Calcite, siderite, magnitite, realgar |
| 2 | Pangkuam (Cu–Au) | Porphyry-related skarn | No data | 0.69% Cu, 2.41 g/t Au | Limestone, argillaceous siltstone | Intermediate-mafic intrusions | Quartz, sericite, epidote, chlorite, K-feldspar, garnet |
| 3 | Phu Lon (Cu–Au) | Porphyry-related skarn | 5.4 | 2.4% Cu, 0.64 g/t Au | Limestone, volcaniclastics | Diorite and quartz monzonite porphyry/244 ± 3 Ma | Garnet, pyroxene, K-feldspar, tremolite, epidote, chlorite, calcite |
| 4 | Puthep (Cu–Au) | Porphyry-related skarn | 164 | 0.53% Cu, 0.09 g/t Au | Sandstone, siltstone and sandstone | Diorite and monzodiorite porphyry/242.4 ± 1.3 Ma | K-feldspar, sericite, garnet, epidote, chlorite, calcite |
| 5 | Phu Thap Fah (Cu–Au–Ag) | Skarn | 6.4 | 0.14% Cu, 2.19 g/t Au, 3.9 g/t Ag | Siliciclastics and limestone | Granodiorite/245 ± 3 Ma | garnet, pyroxene, quartz, epidote, calcite, chlorite |
| 6 | Wang Yai (Au–Ag) | Low-S epithermal | No data | No data | Volcaniclastics, rhyolite breccia | No known intrusion | Quartz, calcite, adularia, sericite, chlorite |
| 7 | Chatree (Au–Ag) | Low-S epithermal | 81.7 | 1.18 g/t Au, 9 g/t Ag | Andesite breccias, volcanogenic sedimentary rocks | Diorite dyke and granodiorite-bearing basaltic dyke/244 ± 7 Ma | Quartz, calcite, adularia, sericite, chlorite, illite, smectite |
| 8 | LD Prospect (Au–Ag) | Low-S epithermal | 2.9 | 1.1 g/t Au, 10 g/t Ag | Andesite | No known intrusion | Quartz, pyrite, calcite, adularia, sericite, chlorite |
| Sample | Calcite from Auriferous Calcite Vein | Calcite from Red Alteration Zone | Limestone | Sandstone | |||||||||||||
|---|---|---|---|---|---|---|---|---|---|---|---|---|---|---|---|---|---|
| PB-PDB04-1 | PB-PDB04-2 | PB-PDB04-3 | PB-ZKB04 | PB-ZKB05-1 | PB-ZKB05-2 | PB-ZKB05-3 | PB-ZKB05-4 | PB-PDB03 | PB-PDB05-1 | PB-PDB05-2 | PB-B01-1 | PB-B01-2 | PB-ZKB02-1 | PB-ZKB02-2 | PB-PDB06 | PB-ZKB01 | |
| Li | <0.002 | <0.002 | <0.002 | <0.002 | <0.002 | <0.002 | <0.002 | <0.002 | 2.02 | 2.24 | 1.89 | 5.28 | 5.76 | 1.82 | 2.18 | 23.6 | 38 |
| Be | 0.017 | 0.002 | 0.024 | 0.005 | <0.002 | 0.025 | <0.002 | 0.033 | 0.085 | 0.036 | 0.061 | 0.431 | 0.348 | 0.063 | 0.022 | 1.53 | 1.19 |
| Sc | 0.431 | 1.05 | 0.469 | 0.509 | 0.469 | 0.48 | 0.949 | 0.581 | 1.03 | 1.05 | 1.13 | 4.31 | 4.12 | 2.16 | 1.06 | 14.4 | 4.65 |
| V | 1.76 | 5.01 | 1.61 | 1.38 | 1.69 | 1.39 | 3.04 | 1.4 | 3.94 | 5.2 | 6.32 | 25.5 | 23.1 | 7.28 | 2.75 | 103 | 36.5 |
| Cr | 1.27 | 2.54 | 1.49 | 3.27 | 3.12 | 3.24 | 3.9 | 3.6 | 8.75 | 8.62 | 12.3 | 9.83 | 11.4 | 6.7 | 3.18 | 73 | 20.5 |
| Co | 1.13 | 1.14 | 1.31 | 1.2 | 1.18 | 1.21 | 1.28 | 1.26 | 1.52 | 1.5 | 1.57 | 3 | 3.41 | 1.75 | 1.66 | 14.2 | 4.44 |
| Ni | 11.8 | 13.7 | 13.5 | 14.3 | 15.3 | 15.1 | 16.6 | 16.3 | 12.2 | 12.6 | 13.2 | 7.62 | 10 | 13.7 | 13 | 17.9 | 15.4 |
| Cu | 0.057 | 0.099 | 0.061 | 0.149 | 0.026 | 0.196 | 0.104 | 0.024 | 0.585 | 0.429 | 0.474 | 16.5 | 18.2 | 1.61 | 0.207 | 9.08 | 11.6 |
| Zn | 2.53 | 2.1 | 2.1 | 2.22 | 6.05 | 3.34 | 2.9 | 4.11 | 4.22 | 7.68 | 7.35 | 25.3 | 33.1 | 18.6 | 4.98 | 68.1 | 48.3 |
| Ga | 0.019 | 0.01 | <0.002 | 0.011 | 0.02 | 0.019 | 0.022 | 0.039 | 0.067 | 0.19 | 0.249 | 3.43 | 3.12 | 0.287 | 0.066 | 13.4 | 19.5 |
| Rb | 0.03 | 0.029 | 0.027 | 0.034 | 0.026 | 0.045 | 0.037 | 0.062 | 0.285 | 0.968 | 1.23 | 21.6 | 18.7 | 1.08 | 0.192 | 23.1 | 45.6 |
| Sr | 674 | 451 | 686 | 456 | 430 | 376 | 485 | 398 | 181 | 401 | 409 | 777 | 965 | 207 | 452 | 400 | 106 |
| Y | 2.33 | 7.55 | 2.14 | 2.68 | 4.88 | 10 | 9.67 | 9.47 | 12.1 | 6.07 | 6.42 | 13.9 | 16.3 | 8.72 | 4.62 | 20.1 | 41.7 |
| Mo | <0.002 | <0.002 | <0.002 | <0.002 | <0.002 | <0.002 | <0.002 | <0.002 | <0.002 | 0.032 | 0.037 | 0.283 | 0.258 | 0.008 | <0.002 | 0.284 | 0.193 |
| Cd | 0.01 | 0.009 | 0.036 | 0.175 | 0.013 | 0.056 | 0.076 | 0.025 | 0.573 | 0.418 | 0.383 | 0.2 | 0.247 | 1.28 | 0.088 | 0.22 | 0.617 |
| In | <0.002 | 0.002 | <0.002 | 0.002 | <0.002 | 0.003 | 0.005 | 0.003 | <0.002 | 0.004 | 0.005 | 0.017 | 0.018 | <0.002 | <0.002 | 0.058 | 0.016 |
| Sb | 0.028 | 0.012 | 0.038 | 0.055 | 0.04 | 0.04 | 0.051 | 0.053 | 0.369 | 0.206 | 0.301 | 0.622 | 0.737 | 0.569 | 0.128 | 0.65 | 0.613 |
| Cs | 0.011 | 0.011 | 0.012 | 0.018 | 0.012 | 0.013 | 0.012 | 0.025 | 0.022 | 0.058 | 0.057 | 1.06 | 0.98 | 0.194 | 0.027 | 1.03 | 10.1 |
| Ba | 4.25 | 2.59 | 3.75 | 3.83 | 3.07 | 7.67 | 3.79 | 7.7 | 6.98 | 5.78 | 5.87 | 458 | 401 | 10.2 | 3.37 | 153 | 185 |
| La | 0.235 | 0.515 | 0.173 | 0.444 | 0.671 | 1.45 | 1.44 | 1.45 | 3.54 | 1.15 | 1.47 | 9.03 | 10.9 | 4.58 | 2.52 | 22.2 | 14.7 |
| Ce | 0.199 | 0.393 | 0.131 | 0.408 | 0.495 | 0.885 | 0.875 | 0.864 | 1.28 | 0.757 | 0.835 | 9.54 | 11.4 | 1.28 | 1.49 | 40 | 23.6 |
| Pr | 0.059 | 0.142 | 0.05 | 0.106 | 0.15 | 0.277 | 0.298 | 0.286 | 0.6 | 0.19 | 0.211 | 1.93 | 2.35 | 0.911 | 0.294 | 4.95 | 3.35 |
| Nd | 0.332 | 0.873 | 0.267 | 0.475 | 0.794 | 1.36 | 1.58 | 1.31 | 2.68 | 0.905 | 0.983 | 7.91 | 9.74 | 3.84 | 1.25 | 19.9 | 16.7 |
| Sm | 0.12 | 0.3 | 0.107 | 0.128 | 0.189 | 0.331 | 0.437 | 0.291 | 0.571 | 0.189 | 0.19 | 1.6 | 2.06 | 0.781 | 0.189 | 4.02 | 4.77 |
| Eu | 0.036 | 0.103 | 0.032 | 0.032 | 0.048 | 0.074 | 0.115 | 0.077 | 0.137 | 0.047 | 0.05 | 0.355 | 0.413 | 0.156 | 0.066 | 1.05 | 1.42 |
| Gd | 0.167 | 0.501 | 0.142 | 0.156 | 0.264 | 0.415 | 0.558 | 0.404 | 0.792 | 0.279 | 0.272 | 1.66 | 2.02 | 0.814 | 0.304 | 3.53 | 5.46 |
| Tb | 0.034 | 0.114 | 0.032 | 0.034 | 0.055 | 0.096 | 0.12 | 0.093 | 0.175 | 0.06 | 0.061 | 0.304 | 0.388 | 0.166 | 0.042 | 0.662 | 0.976 |
| Dy | 0.225 | 0.822 | 0.207 | 0.232 | 0.37 | 0.706 | 0.825 | 0.686 | 1.19 | 0.413 | 0.458 | 1.8 | 2.25 | 1.09 | 0.25 | 3.63 | 5.39 |
| Ho | 0.058 | 0.173 | 0.049 | 0.054 | 0.08 | 0.176 | 0.185 | 0.165 | 0.277 | 0.095 | 0.111 | 0.401 | 0.481 | 0.221 | 0.054 | 0.703 | 1.03 |
| Er | 0.141 | 0.452 | 0.138 | 0.167 | 0.257 | 0.502 | 0.538 | 0.475 | 0.823 | 0.319 | 0.359 | 1.16 | 1.38 | 0.628 | 0.142 | 1.95 | 2.6 |
| Tm | 0.024 | 0.085 | 0.024 | 0.028 | 0.042 | 0.081 | 0.079 | 0.08 | 0.151 | 0.056 | 0.061 | 0.198 | 0.256 | 0.116 | 0.015 | 0.334 | 0.405 |
| Yb | 0.131 | 0.438 | 0.125 | 0.151 | 0.24 | 0.428 | 0.461 | 0.424 | 0.785 | 0.32 | 0.369 | 1.28 | 1.59 | 0.7 | 0.056 | 1.99 | 2.19 |
| Lu | 0.022 | 0.064 | 0.02 | 0.023 | 0.035 | 0.06 | 0.055 | 0.055 | 0.113 | 0.045 | 0.055 | 0.177 | 0.234 | 0.104 | 0.007 | 0.272 | 0.282 |
| W | 2.95 | 0.768 | 2.64 | 0.669 | 42.3 | 0.712 | 0.666 | 0.502 | 5.42 | 0.505 | 0.265 | 0.289 | 0.313 | 0.398 | 0.247 | 0.751 | 2.63 |
| Re | <0.002 | <0.002 | <0.002 | <0.002 | <0.002 | <0.002 | <0.002 | <0.002 | <0.002 | <0.002 | <0.002 | <0.002 | 0.002 | <0.002 | <0.002 | <0.002 | <0.002 |
| Tl | 0.01 | 0.007 | 0.008 | 0.05 | 0.186 | 0.016 | 0.1 | 0.003 | 0.11 | 0.03 | 0.044 | 0.143 | 0.107 | 0.099 | 0.01 | 0.13 | 0.409 |
| Pb | 0.176 | 0.038 | 0.122 | 0.128 | 0.358 | 0.577 | 0.284 | 0.242 | 0.92 | 1.1 | 5.87 | 2.65 | 2.68 | 1.64 | 0.84 | 9.26 | 2.62 |
| Bi | <0.002 | <0.002 | <0.002 | <0.002 | <0.002 | <0.002 | <0.002 | <0.002 | 0.012 | 0.06 | 0.036 | 0.051 | 0.071 | 0.018 | 0.014 | 0.207 | 0.011 |
| Th | 0.007 | 0.031 | 0.013 | 0.024 | 0.023 | 0.029 | 0.043 | 0.044 | 0.249 | 0.197 | 0.191 | 1.25 | 1.23 | 0.195 | 0.115 | 5.52 | 5.58 |
| U | 0.099 | 0.432 | 0.095 | 0.123 | 0.272 | 0.218 | 0.679 | 0.209 | 0.763 | 0.821 | 1.15 | 0.651 | 0.699 | 0.526 | 0.063 | 1.09 | 1.32 |
| Nb | 0.009 | <0.002 | 0.004 | 0.005 | <0.002 | 0.003 | 0.005 | 0.027 | 0.268 | 0.432 | 0.405 | 1.38 | 1.4 | 0.433 | 0.343 | 5.07 | 7.83 |
| Ta | <0.002 | <0.002 | <0.002 | 0.002 | 0.002 | <0.002 | <0.002 | 0.004 | 0.104 | 0.321 | 0.214 | 0.115 | 0.108 | 0.114 | 0.147 | 0.418 | 0.756 |
| Zr | 0.104 | 0.094 | 0.125 | 0.075 | 0.057 | 0.062 | 0.035 | 0.067 | 1.35 | 1.96 | 2.47 | 17 | 18.3 | 3.46 | 0.89 | 40.4 | 68.9 |
| Hf | <0.002 | 0.005 | <0.002 | <0.002 | 0.006 | 0.004 | 0.009 | 0.008 | 0.021 | 0.056 | 0.07 | 0.52 | 0.519 | 0.11 | 0.034 | 1.45 | 1.96 |
| ΣREE | 1.78 | 4.98 | 1.50 | 2.44 | 3.69 | 6.84 | 7.57 | 6.66 | 13.11 | 4.83 | 5.49 | 37.35 | 45.46 | 15.39 | 6.68 | 105.19 | 82.87 |
| LREE | 0.98 | 2.33 | 0.76 | 1.59 | 2.35 | 4.38 | 4.75 | 4.28 | 8.81 | 3.24 | 3.74 | 30.37 | 36.86 | 11.55 | 5.81 | 92.12 | 64.54 |
| HREE | 0.80 | 2.65 | 0.74 | 0.85 | 1.34 | 2.46 | 2.82 | 2.38 | 4.31 | 1.59 | 1.75 | 6.98 | 8.60 | 3.84 | 0.87 | 13.07 | 18.33 |
| LREE/HREE | 1.22 | 0.88 | 1.03 | 1.89 | 1.75 | 1.78 | 1.68 | 1.80 | 2.05 | 2.04 | 2.14 | 4.35 | 4.29 | 3.01 | 6.68 | 7.05 | 3.52 |
| δEu | 0.78 | 0.81 | 0.79 | 0.69 | 0.66 | 0.61 | 0.71 | 0.69 | 0.62 | 0.63 | 0.67 | 0.67 | 0.62 | 0.60 | 0.84 | 0.85 | 0.85 |
| δCe | 0.41 | 0.36 | 0.35 | 0.46 | 0.38 | 0.34 | 0.33 | 0.33 | 0.22 | 0.40 | 0.37 | 0.56 | 0.55 | 0.15 | 0.42 | 0.94 | 0.82 |
| La/Ho | 4.05 | 2.98 | 3.53 | 8.22 | 8.39 | 8.24 | 7.78 | 8.79 | 12.78 | 12.11 | 13.24 | 22.52 | 22.66 | 20.72 | 46.67 | 31.58 | 14.27 |
| Y/Ho | 40.2 | 43.6 | 43.7 | 49.6 | 61.0 | 56.8 | 52.3 | 57.4 | 43.7 | 63.9 | 57.8 | 34.7 | 33.9 | 39.5 | 85.6 | 28.6 | 40.5 |
| Tb/La | 0.14 | 0.22 | 0.18 | 0.08 | 0.08 | 0.07 | 0.08 | 0.06 | 0.05 | 0.05 | 0.04 | 0.03 | 0.04 | 0.04 | 0.02 | 0.03 | 0.07 |
| Sm/Nd | 0.36 | 0.34 | 0.40 | 0.27 | 0.24 | 0.24 | 0.28 | 0.22 | 0.21 | 0.21 | 0.19 | 0.20 | 0.21 | 0.20 | 0.15 | 0.20 | 0.29 |
| Ore Type | Sample No. | δ13CV-PDB (‰) | δ18OV-SMOW (‰) |
|---|---|---|---|
| Auriferous calcite vein | PB-PDB04-1 | 1.5 | 29.6 |
| PB-PDB04-2 | 1.6 | 28.5 | |
| PB-PDB04-3 | 1.6 | 28.7 | |
| PB-ZKB04 | 1.7 | 23.8 | |
| Red alteration zone | PB-ZKB05-1 | 1.2 | 27.5 |
| PB-ZKB05-2 | 1.2 | 28.2 | |
| PB-ZKB05-3 | 0.7 | 28.7 | |
| PB-ZKB05-4 | 1.5 | 28.8 | |
| Limestone | PB-PDB03 | 3 | 25.6 |
| PB-PDB05-1 | 3.3 | 25.5 | |
| PB-PDB05-2 | 3.3 | 27.4 | |
| PB-B01-1 | 2.7 | 18.8 | |
| PB-B01-2 | 2.6 | 20.3 | |
| PB-ZKB02-1 | 3.6 | 26.1 | |
| PB-ZKB02-2 | 3.3 | 26.2 |
© 2018 by the authors. Licensee MDPI, Basel, Switzerland. This article is an open access article distributed under the terms and conditions of the Creative Commons Attribution (CC BY) license (http://creativecommons.org/licenses/by/4.0/).
Share and Cite
Guo, L.; Hou, L.; Liu, S.; Nie, F. Rare Earth Elements Geochemistry and C–O Isotope Characteristics of Hydrothermal Calcites: Implications for Fluid-Rock Reaction and Ore-Forming Processes in the Phapon Gold Deposit, NW Laos. Minerals 2018, 8, 438. https://doi.org/10.3390/min8100438
Guo L, Hou L, Liu S, Nie F. Rare Earth Elements Geochemistry and C–O Isotope Characteristics of Hydrothermal Calcites: Implications for Fluid-Rock Reaction and Ore-Forming Processes in the Phapon Gold Deposit, NW Laos. Minerals. 2018; 8(10):438. https://doi.org/10.3390/min8100438
Chicago/Turabian StyleGuo, Linnan, Lin Hou, Shusheng Liu, and Fei Nie. 2018. "Rare Earth Elements Geochemistry and C–O Isotope Characteristics of Hydrothermal Calcites: Implications for Fluid-Rock Reaction and Ore-Forming Processes in the Phapon Gold Deposit, NW Laos" Minerals 8, no. 10: 438. https://doi.org/10.3390/min8100438