Article

Assessing Thallium Elemental Systematics and Isotope Ratio Variations in Porphyry Ore Systems: A Case Study of the Bingham Canyon District

by
Angus Fitzpayne
1,2,*,
Julie Prytulak
1,3,
Jamie J. Wilkinson
1,4,5,
David R. Cooke
5,6,
Michael J. Baker
5,6 and
Clara C. Wilkinson
4,5
1
Department of Earth Science and Engineering, Imperial College London, Exhibition Road, London SW7 2AZ, UK
2
School of Earth Sciences, The University of Melbourne, Parkville, Melbourne, Victoria 3010, Australia
3
Department of Earth Sciences, University of Durham, DH1 3LE, UK
4
London Centre for Ore Deposits and Exploration (LODE), Department of Earth Sciences, Natural History Museum, Cromwell Road, London SW7 5BD, UK
5
ARC Centre of Excellence in Ore Deposits (CODES), University of Tasmania, Hobart, Tasmania 7001, Australia
6
Transforming the Mining Value Chain (TMVC), an Australian Research Council (ARC) Industrial Transformation Research Hub, University of Tasmania, Hobart, Tasmania 7001, Australia
*
Author to whom correspondence should be addressed.
Minerals 2018, 8(12), 548; https://doi.org/10.3390/min8120548
Submission received: 1 October 2018 / Revised: 16 November 2018 / Accepted: 19 November 2018 / Published: 26 November 2018
(This article belongs to the Special Issue Thallium: Mineralogy, Geochemistry and Ore Processes)

Abstract

:
The Bingham Canyon porphyry deposit is one of the world’s largest Cu-Mo-Au resources. Elevated concentrations of thallium (Tl) compared to average continental crust have been found in some brecciated and igneous samples in this area, which likely result from mobilization of Tl by relatively low temperature hydrothermal fluids. The Tl-enrichment at Bingham Canyon therefore provides an opportunity to investigate if Tl isotope ratios reflect hydrothermal enrichment and whether there are systematic Tl isotope fractionations that could provide an exploration tool. We present a reconnaissance study of nineteen samples spanning a range of lithologies from the Bingham district which were analysed for their Tl content and Tl isotope ratios, reported as parts per ten thousand (ε205Tl) relative to the NIST SRM997 international standard. The range of ε205Tl reported in this study (−16.4 to +7.2) is the largest observed in a hydrothermal ore deposit to date. Unbrecciated samples collected relatively proximal to the Bingham Canyon porphyry system have ε205Tl of −4.2 to +0.9, similar to observations in a previous study of porphyry deposits. This relatively narrow range suggests that high-temperature (>300 °C) hydrothermal alteration does not result in significant Tl isotope fractionation. However, two samples ~3–4 km away from Bingham Canyon have higher ε205Tl values (+1.3 and +7.2), and samples from more distal (~7 km) disseminated gold deposits at Melco and Barneys Canyon display an even wider range in ε205Tl (−16.4 to +6.0). The observation of large positive and negative excursions in ε205Tl relative to the mantle value (ε205Tl = −2.0 ± 1.0) contrasts with previous investigations of hydrothermal systems. Samples displaying the most extreme positive and negative ε205Tl values also contain elevated concentrations of Tl-Sb-As. Furthermore, with the exception of one sample, all of the Tl isotopic anomalies occur in hydrothermal breccia samples. This suggests that ε205Tl excursions are most extreme during the migration of low-temperature hydrothermal fluids potentially related to sediment-hosted gold mineralization. Future investigation to determine the host phase(s) for Tl in breccias displaying both chalcophile element enrichment and ε205Tl excursions can potentially provide new information about hydrothermal fluid composition and could be used to locate sites for future porphyry exploration.

1. Introduction

1.1. Porphyry Ore Deposits

Porphyry ore deposits are large anomalies of sulfide-hosted mineralization caused by magmatic-hydrothermal processes, and constitute significant resources of Cu (~75% of the world’s reserves), Mo (~50%), Au (~20%) and lesser amounts of other metals such as Ag [1]. They are associated both genetically and spatially with porphyritic intrusions in the upper crust, which cool and exsolve hydrothermal fluids containing water-soluble Cl and S species that extract metals from the source magmas and wall-rocks [2]. The fluids are focused along cracks within the host intrusion and surrounding country rock, and precipitate ore minerals due to fluid cooling and mixing, phase separation (vapor/liquid), and wall-rock reaction [3]. Although porphyry ore mineralization is centred upon the host intrusion, mineralization may occur elsewhere in the surrounding rocks due to metal transport in cooler hydrothermal fluids that form skarns, sediment-hosted mineralization, or epithermal deposits, which may be proximal or distal to the porphyry intrusions [1,4,5,6,7,8]. The formation of such deposits may be influenced by country rock lithology: for example, skarns require reactive, carbonate-rich rocks to form, whereas the genesis of epithermal deposits may be facilitated by permeable rocks, possibly aided by extensive fracturing and brecciation [1,2].

1.2. Bingham Canyon Cu-Mo-Au Deposit

This study focuses on the Bingham Canyon district in the USA, which contains the Bingham Canyon porphyry Cu-Au-Mo deposit. This is among the largest known porphyry Cu deposits in terms of total contained metals; for example, in 2005, Bingham Canyon was identified as the seventh largest porphyry deposit in the world in terms of contained Cu [9]. The deposit contains around 28 MT of Cu, making it a supergiant deposit [10], with an average grade of 0.88 wt.%; 0.81 MT Mo at 0.02 wt.%; and 1600 T Au at 0.5 μg/g [9]. High-grade (~10 μg/g) gold mineralization occurs in a skarn, located ~2 km to the west of the Bingham Canyon mine, and is associated with quartz and pyrite, as well as enrichment in arsenic, mercury, and thallium [11].
The Bingham Canyon mine is situated in the Oquirrh Mountains between the Basin and Range province and the Cordilleran fold-thrust belt [12,13], near Salt Lake City, Utah (Figure 1). Although most porphyry deposits are associated with compressional tectonic regimes [14], the Bingham Canyon intrusions are suggested to have formed by melting of previously metasomatized lithosphere during a phase of Eocene extension ([15,16], and references therein). The host rocks for the deposit consist of several igneous lithologies, which form the Bingham and Last Chance stocks [13,16,17]. The Bingham intrusions are intermediate to felsic in composition (57–65 wt.% SiO2; [18]) and oxidized in nature (fO2 = NNO + 1.7; [19]); the compositional range may be a result of either magmatic differentiation [15] or magma mixing [20]. The quartz monzonite porphyry (QMP) is the main “causative” intrusion and hosts a large proportion of the copper ore body [13,16]. Other porphyries occur as dikes that intruded the QMP [16] within a relatively short time period of ~0.3 My [21]. The country rocks into which the Bingham Canyon porphyries were emplaced are Pennsylvanian in age, and were folded and faulted during multiple orogenies through the Mesozoic [18,22]. They vary in composition between sandstones and limestones and their metamorphic counterparts, and locally they are mineralized [18].
Surrounding the Bingham Canyon mine are several sediment-hosted gold deposits, including the Barneys Canyon and Melco deposits located ~7 km to the north (Figure 1). Both exhibit characteristics of Carlin-type gold deposits [23], which have been linked to low temperature, magmatic-hydrothermal fluids [8,24]. The sediment-hosted gold deposits in the Bingham district have been inferred to represent part of a distal, asymmetric Au-As alteration facies related to the Bingham Canyon deposit [23,25]. A variety of palaeothermometry techniques appear to support a genetic link between the gold deposits and the Bingham Canyon porphyry system [23,26], although it has been suggested that the Bingham Canyon system was neither hot enough nor large enough to cause such distant gold mineralization in the epithermal environment, and that a different low-temperature hydrothermal fluid was introduced, which mixed with local meteoric waters [12,27].
The Bingham Canyon deposit has been extensively studied and therefore provides a good basis for this reconnaissance study, in which a well-characterized set of samples distributed roughly N–S through the Bingham district is examined. The investigation focuses on thallium and its isotope ratios, supplemented by whole-rock geochemistry, to establish the extent of Tl isotopic fractionation in porphyry-hydrothermal systems and to evaluate its utility for tracing hydrothermal fluid flow and depositional processes. Although the investigation focuses on Bingham Canyon as a case study, the findings of this study may have wider implications for future investigations in other hydrothermal systems.

1.3. The Geochemistry of Thallium and Thallium Isotope Systematics

Thallium (Tl) is a volatile, highly incompatible trace metal, which displays both lithophile and chalcophile affinities [28,29,30,31]. Where sulfides are absent, Tl behaves like the large-ion lithophile (LIL) elements K, Rb, and Cs, due to their similar ionic radii (K+: 1.33 Å; Tl+: 1.49 Å; Rb+: 1.49 Å; Cs+: 1.65 Å; e.g., [32,33]), and preferentially partitions into K-bearing phases, such as biotite (KD = 8.6) and K-feldspar (KD = 3.67) [34]. Although some experimental studies have predicted that sulfides might contain high abundances of Tl [35], only a minority (14 of 38) of natural sulfides analysed in a recent study [36] contained Tl abundances above the detection limit (0.2 µg/g). This makes it likely that K-rich silicates will dominate Tl-partitioning over coexisting sulfide phases. The only relevant Tl redox species in most natural environments is Tl+ [37]; Tl3+ is thought to be present only in near surface or aqueous conditions in the laboratory [38].
Thallium has two stable isotopes, 203Tl (29.5%) and 205Tl (70.5%). Thallium isotope ratios are measured in parts per ten thousand (ε units) relative to the NIST SRM997 Tl standard, where
ε 205 Tl   =   10 4   ×   T   205 l / T   203 l sample     T   205 l / T   203 l SRM 997 T   205 l / T   203 l SRM 997  
The primitive mantle contains an estimated 0.0035 μg/g Tl, whereas the crust has ~0.5 μg/g (see review in [31]). Thallium concentrations in low-temperature hydrothermal systems are generally higher than in high-temperature regimes (e.g., [39,40]). Both the mantle and continental crust display restricted isotope compositions of ε205Tl = −2.0 ± 1.0 [31,41], although some natural variability is implied by the fact that this range is slightly larger than the long-term, external 2 s.d. (standard deviation) analytical reproducibility, which is conservatively estimated to be ±0.5 epsilon units [31,42]. Magmatic processes do not appear to cause significant Tl isotope fractionations [33], allowing Tl isotopes to be applied, for example, as useful tracers of different sediment types in variably evolved arc lavas [43,44,45,46]. In general, stable isotope fractionations strongly increase in magnitude with decreasing temperature (e.g., [47]). Indeed, previous studies have highlighted the large differences in Tl isotopic behavior in low- (<150 °C) and high-temperature (300–400 °C) hydrothermal systems [39,40,48], with low-temperature alteration causing variable, isotopically light values (ε205Tl = −2 to −16), and high-temperature alteration having a limited effect on ε205Tl [39]. The lack of response in Tl isotope signatures to both high-temperature hydrothermal and magmatic processes suggests that Tl isotope investigations in porphyry systems will be most sensitive to the relatively low-temperature hydrothermal processes that post-date, and/or are distal to, the main porphyry ore-forming event.

1.4. Thallium Isotope Studies of Hydrothermal Ore Deposits

Several previous studies have evaluated the potential of Tl isotopic measurements as tracers of hydrothermal processes in ore deposits. Baker et al. [48] focused on Tl isotope behavior in porphyry deposits, and presented Tl concentration and isotope variations in rocks from the Collahuasi Formation (Chile), which is composed of lava flows, pyroclastic rocks, and porphyritic intrusions of varying composition, emplaced between 240 and 300 Ma [49]. These older igneous rocks displayed varying degrees of alteration, caused by younger porphyry ore-related intrusions (~35 Ma; [50]), some of which were also analysed by Baker et al. [48]. The assorted samples from the Collahuasi district contained 0.1–3.2 μg/g Tl, and Tl was found to preferentially partition into K-bearing phases. Abundances of Tl and K were interpreted to be governed by hydrothermal, and not magmatic, processes. Thallium isotope compositions varied between −5.1 and +0.1 ε205Tl (Figure 2), with a mean value (−2.0 ± 2.0; 2 s.d.) that is indistinguishable from the mantle value [31,41]. The igneous and hydrothermal processes within the Collahuasi Formation therefore appear not to have caused significant Tl isotope fractionation. No systematic relationship between ε205Tl and whole-rock concentration of K2O (enriched in the potassic-altered core of porphyry systems) or Cu was found, leading to the suggestion that Tl isotopes could not be used as a tracer for mineralization in porphyry systems.
However, the study of Baker et al. [48] was limited to samples that were mostly altered at temperatures of 300–400 °C [51]. Consequently, it is perhaps unsurprising that the ε205Tl values measured showed neither systematic variation nor significant deviations from the mantle range (Figure 2).
By contrast, Wickham [54] analysed ore- to late-stage sulfide samples from Carlin-type gold deposits in Nevada to determine the metal sources contributing to ore formation. Although no definitive conclusion was reached regarding the source(s) of Tl (and hence, Au), a negative shift in ε205Tl values between ore-stage (ε205Tl = −1.3) and late-stage (ε205Tl = −2.1) sulfides (Figure 2) was interpreted to reflect the evolution of magmatic fluids, accompanied by mixing with either meteoric fluids or fluids derived from metamorphosed country rocks.
Hettmann et al. [55] analysed mineral separates from the Ilimaussaq complex, Greenland, to trace magmatic-hydrothermal processes using Tl isotope compositions. Most of their samples had ε205Tl between −3 and +2, although one sample was enriched in the heavy 205Tl isotope (ε205Tl = +5.8) and was inferred to be the result of alteration (Figure 2). Thallium concentrations varied from 0.03–350 μg/g and were higher in the hydrothermal regime compared to magmatic stages, implicating hydrothermal transport of Tl.
Hettmann et al. [56] examined mineral separates from the metamorphic Lengenbach Pb-As-Tl-Zn sulfide deposit, Switzerland, where relatively large Tl isotope fractionations (ε205Tl: −4.1 to +1.9) were observed. They suggested the large ε205Tl range was related to crystallization of a variety of sulfide phases from a melt.
More recently, Peter et al. [57] conducted a bulk geochemical and Tl isotope study on samples from a sedimentary-exhalative (Sedex) Pb-Zn deposit in Canada, and found that “mineralized” samples displayed higher ε205Tl values (−3.6 to −2.6) than “unmineralized” samples (−7.5 to −4.0; Figure 2). They also determined that the most likely Tl-hosting minerals were pyrite and sphalerite, due to correlations between Tl and Fe-S-Zn concentrations. Thallium abundances were also positively correlated with As-Hg-Sb concentrations, but not Pb.
Rader et al. [36] conducted the first systematic study to document Tl concentrations and ε205Tl values of mineral separates from a variety of igneous, metamorphic, and metasomatic systems. In contrast to Peter et al. [57], they concluded that sulfides such as sphalerite and pyrite typically contain low or undetectable Tl. However, they also noted that, among co-existing minerals, sulfides and Fe-rich micas displayed the highest and lowest ε205Tl values, respectively (Figure 2).
Based on the limited data that have been published to date, it can be concluded that samples from a variety of ore deposit types display Tl isotope fractionations that can be attributed to fluid evolution [54] or sulfide precipitation [36,55,56,57] (Figure 2). As a result, the current study aims to evaluate the potential of Tl isotopes for tracing fluid evolution, alteration, and sulfide precipitation in porphyry deposits by addressing the following questions: (1) Do Tl concentrations or ε205Tl values correlate with elemental enrichments in porphyry deposits? (2) Can ε205Tl be used to fingerprint hydrothermal fluids in porphyry systems? This latter question also permits examination of the possible genetic link between the Bingham Canyon porphyry system and the nearby sedimentary-hosted gold deposits of Barneys Canyon and Melco. The Bingham district was chosen for this study owing to previous reports of Tl-enrichment in late-stage gold mineralization (e.g., [11]) and its occurrence in the putative distal alteration halo [26]. Unlike the study of Baker et al. [48], the samples chosen for this study span a variety of lithologies from more distal areas of the Bingham district (up to 8.5 km away from the Bingham Canyon mine), which may help to elucidate Tl isotope behavior in the lower-temperature regimes of porphyry systems.

2. Materials and Methods

2.1. Samples

A comprehensive chemical database for 350 surface grab and drill core samples was compiled during an AMIRA International Ltd. (formerly Australian Mineral Industries Research Association) project (P1060), comprising major element compositions and the concentrations of 59 trace elements, including Tl. A subset of these data is presented in the Supplementary Material. Based on this larger sample suite, 19 samples comprising a variety of lithologies (Table 1) were selected for Tl isotope analysis.

2.2. Whole Rock Geochemistry

Bulk-rock geochemical analyses for major and trace elements were carried out by ACME Analytical Laboratories Ltd. (now Bureau Veritas Commodities Canada Ltd.) in Vancouver, Canada. Samples were crushed using a jaw crusher, before being powdered (95% passing <100 µm) using a ceramic rod pulverizer. Approximately 0.2 g of each sample was mixed with 1.5 g of lithium metaborate/lithium tetraborate flux in a graphite crucible, before being fused at 980 °C for 30 min. The fused sample was then dissolved in 5% HNO3. Major element compositions were obtained using a Jarrel-Ash AtomComp Model 975 (Waltham, MA, USA)/Spectro Ciros Vision (Kleve, Germany) inductively-coupled-plasma optical emission spectrometer (ICP-OES).
Another cut of the powdered sample was dissolved in a mixture of H2O-HF-HClO4-HNO3. The solution was evaporated to dryness, and dilute HCl was subsequently added for analysis, which was conducted using a Perkin-Elmer Elan 6000 or 9000 (Boston, MA, USA) inductively-coupled-plasma mass spectrometer (ICP-MS). The detection limits are 0.04 wt.% for major elements and 0.5 µg/g for most trace elements (except the rare earth elements: 0.05 µg/g).

2.3. Chemical Separation of Tl

Samples for Tl isotope analysis were sourced from rocks collected close (within ~10 cm) to where whole-rock geochemical samples were obtained. These samples were dissolved using conventional acid digestion methods [3:1 HF:HNO3], and Tl was separated by a two-stage ion chromatography procedure as described by Rehkamper and Halliday [58] and refined by Nielsen et al. [59] (Figure 3). Thallium isotope measurements were performed using a Nu Instruments (Wrexham, UK) multiple-collector inductively-coupled-plasma mass spectrometer (MC-ICP-MS) in the MAGIC laboratories at Imperial College London.

2.4. MC-ICP-MS Protocols

Thallium concentrations in rock powders were determined during MC-ICP-MS (utilizing the known concentration of Pb added to solutions), thus allowing comparison with ICP-MS determinations from adjacent whole-rock samples. For Tl isotope measurements, a solution of 0.1 mol HNO3-0.1% H2SO4 was prepared for the dilution of all samples and standards to minimize possible matrix effects (see [59]). Because Tl has only two stable isotopes, samples were doped with a known amount of NIST SRM981 Pb solution to correct for instrumental mass bias [58]. Sample solutions were run at Pb/Tl ratios of between 2.4–3.9 and contained 2–6 ng/g Tl. Samples were measured by sample-standard bracketing with NIST SRM997 Tl, which is defined as ε205Tl = 0. A secondary Tl solution standard from Sigma Aldrich was interspersed with unknown samples. The Aldrich solution standard has been run by multiple laboratories over the last decade (ε205Tl = −0.8 ± 0.3, 2 s.d.; [31,42]) and provided additional quality control. Machine performance was considered acceptable when the variation between bracketing NIST SRM997 Tl solutions was <4 × 10⁻⁵ and the Aldrich solution returned ε205Tl within its documented long-term reproducibility. Concentrations of Pb and Tl in the samples were matched to within 15% of their concentrations in the bracketing standards in order to minimize possible matrix effects.

3. Results

3.1. Data Quality Assessment: Reference Materials, Solution Standards and Total Procedural Blanks

Data accuracy and precision were assessed using USGS andesitic reference material AGV-2, which has been characterized for its Tl concentration and isotope composition [33,43,60] and was dissolved and measured as an unknown during each MC-ICP-MS session. The secondary standard Aldrich solution was also measured as an unknown at the beginning and end of each analytical session to assess further the accuracy and precision of the isotope measurements. Results for the standards are given in Table 1 and are within error of accepted values. Total procedural blanks yielded 10–15 mV Pb (~50 pg/g) and Tl at electronic background levels (3 mV, ~6 pg/g).

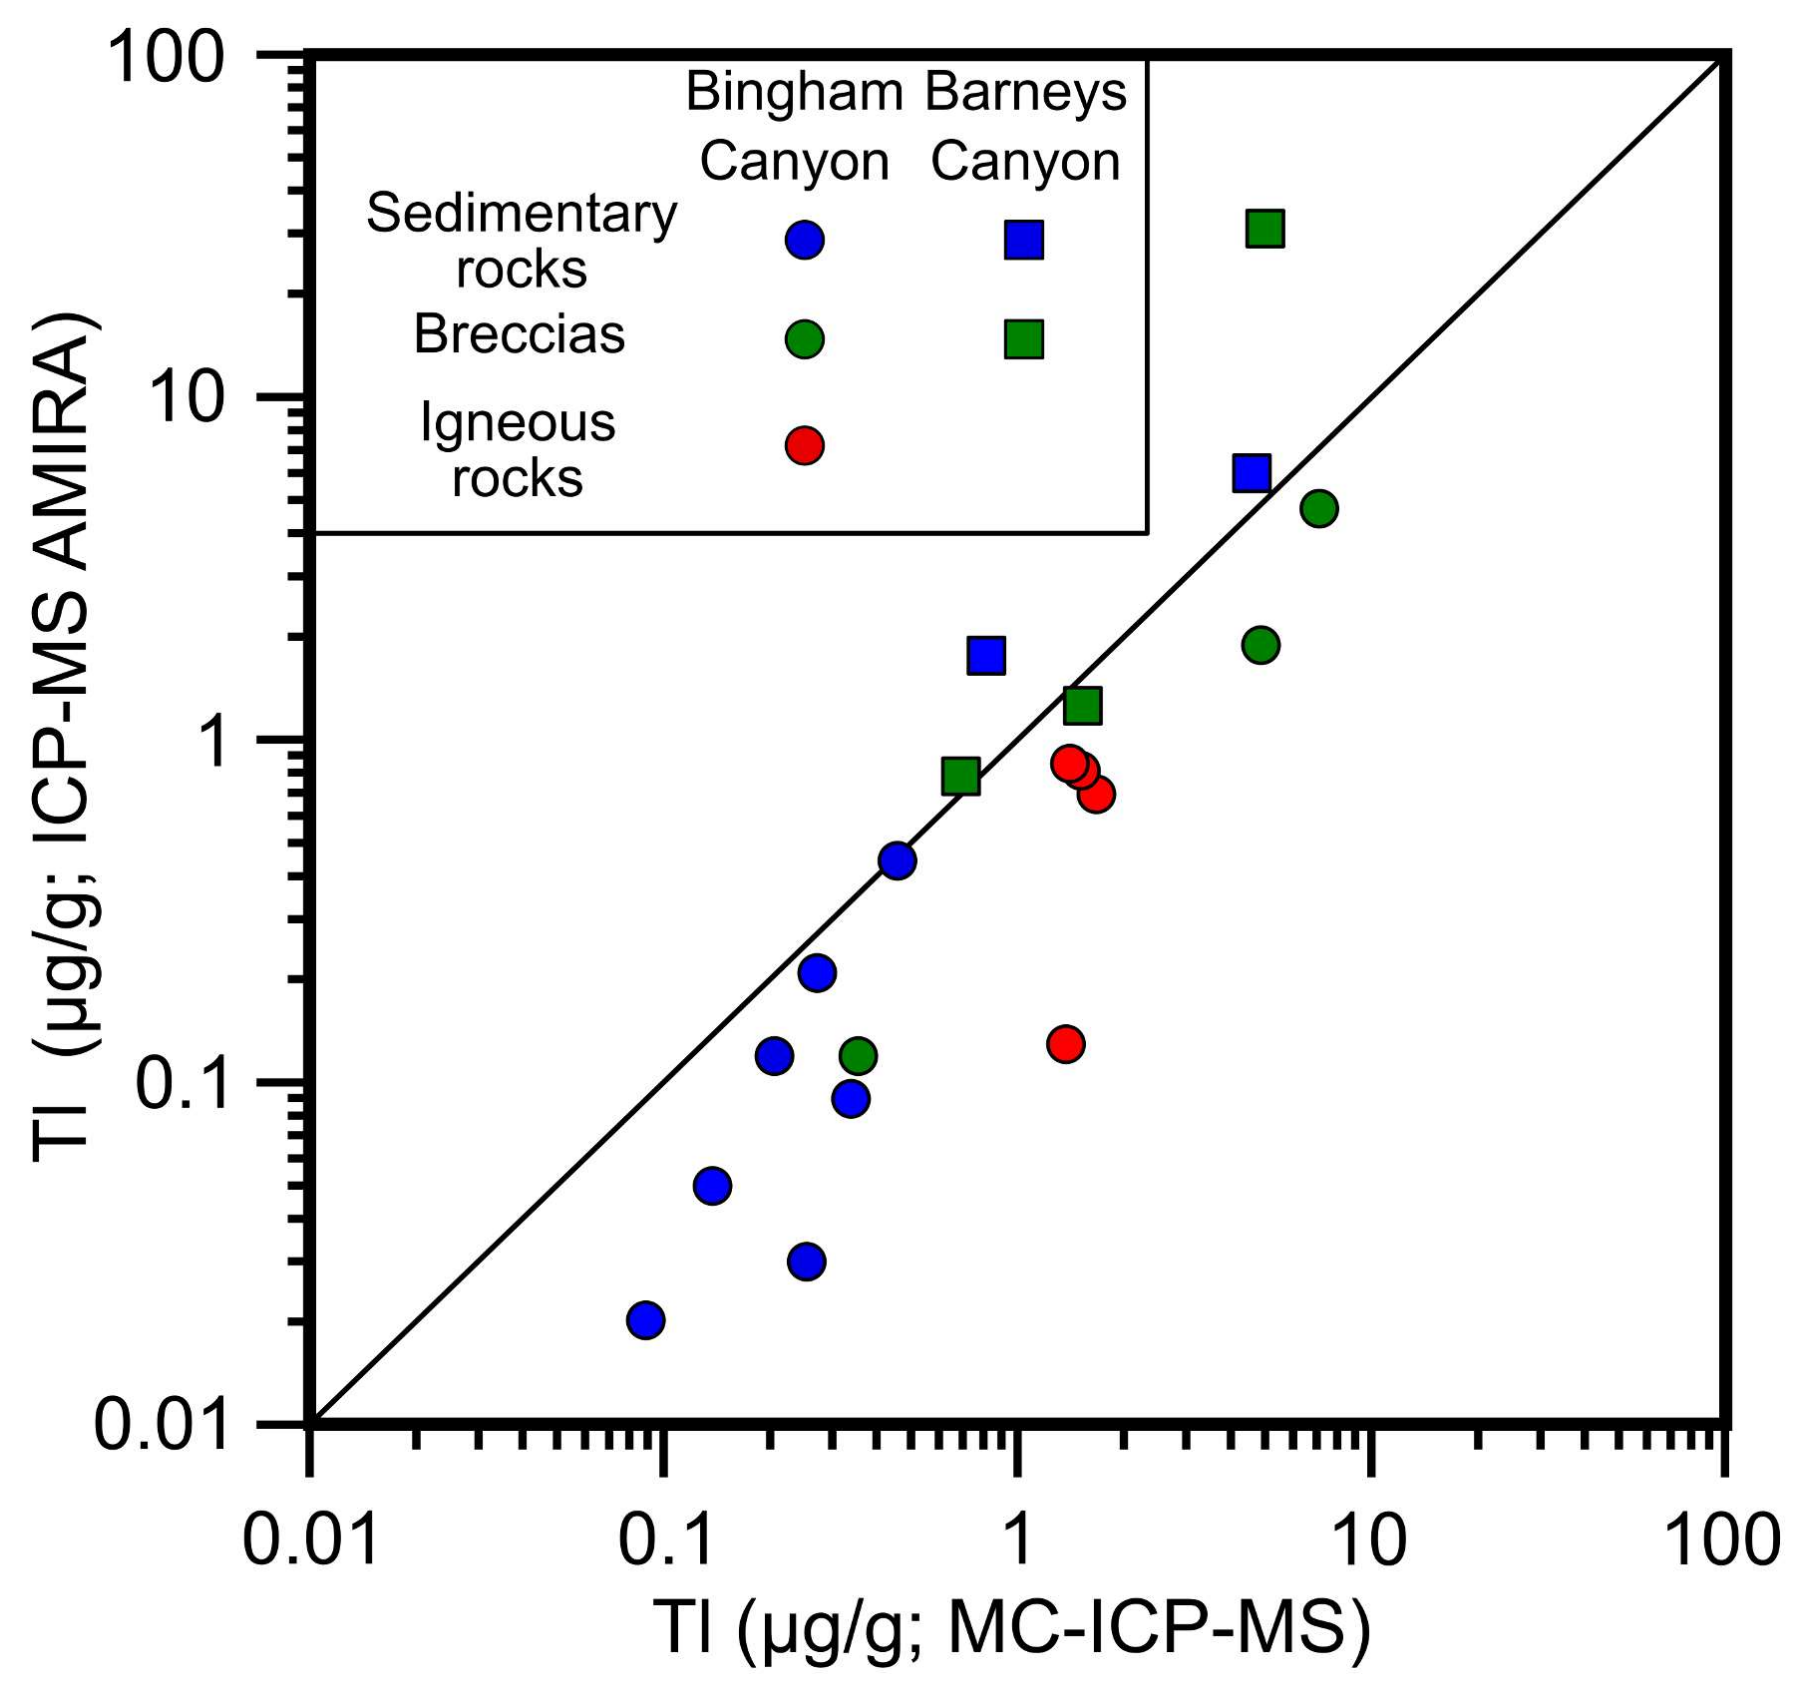
3.2. Thallium Concentrations Measured by MC-ICP-MS vs. ICP-MS

Sample Tl concentrations analysed by the two different methods scatter around a 1:1 line (Figure 4). Small differences in Tl content are likely due to MC-ICP-MS concentration estimates being made on a different powder from an adjacent sample to the trace element determinations from the AMIRA project. This implies some heterogeneity of Tl concentrations on the hand sample scale. Where available, concentration data from the MC-ICP-MS measurements are used in any figures henceforth, as they were obtained from the same powder and dissolution as the isotope data.

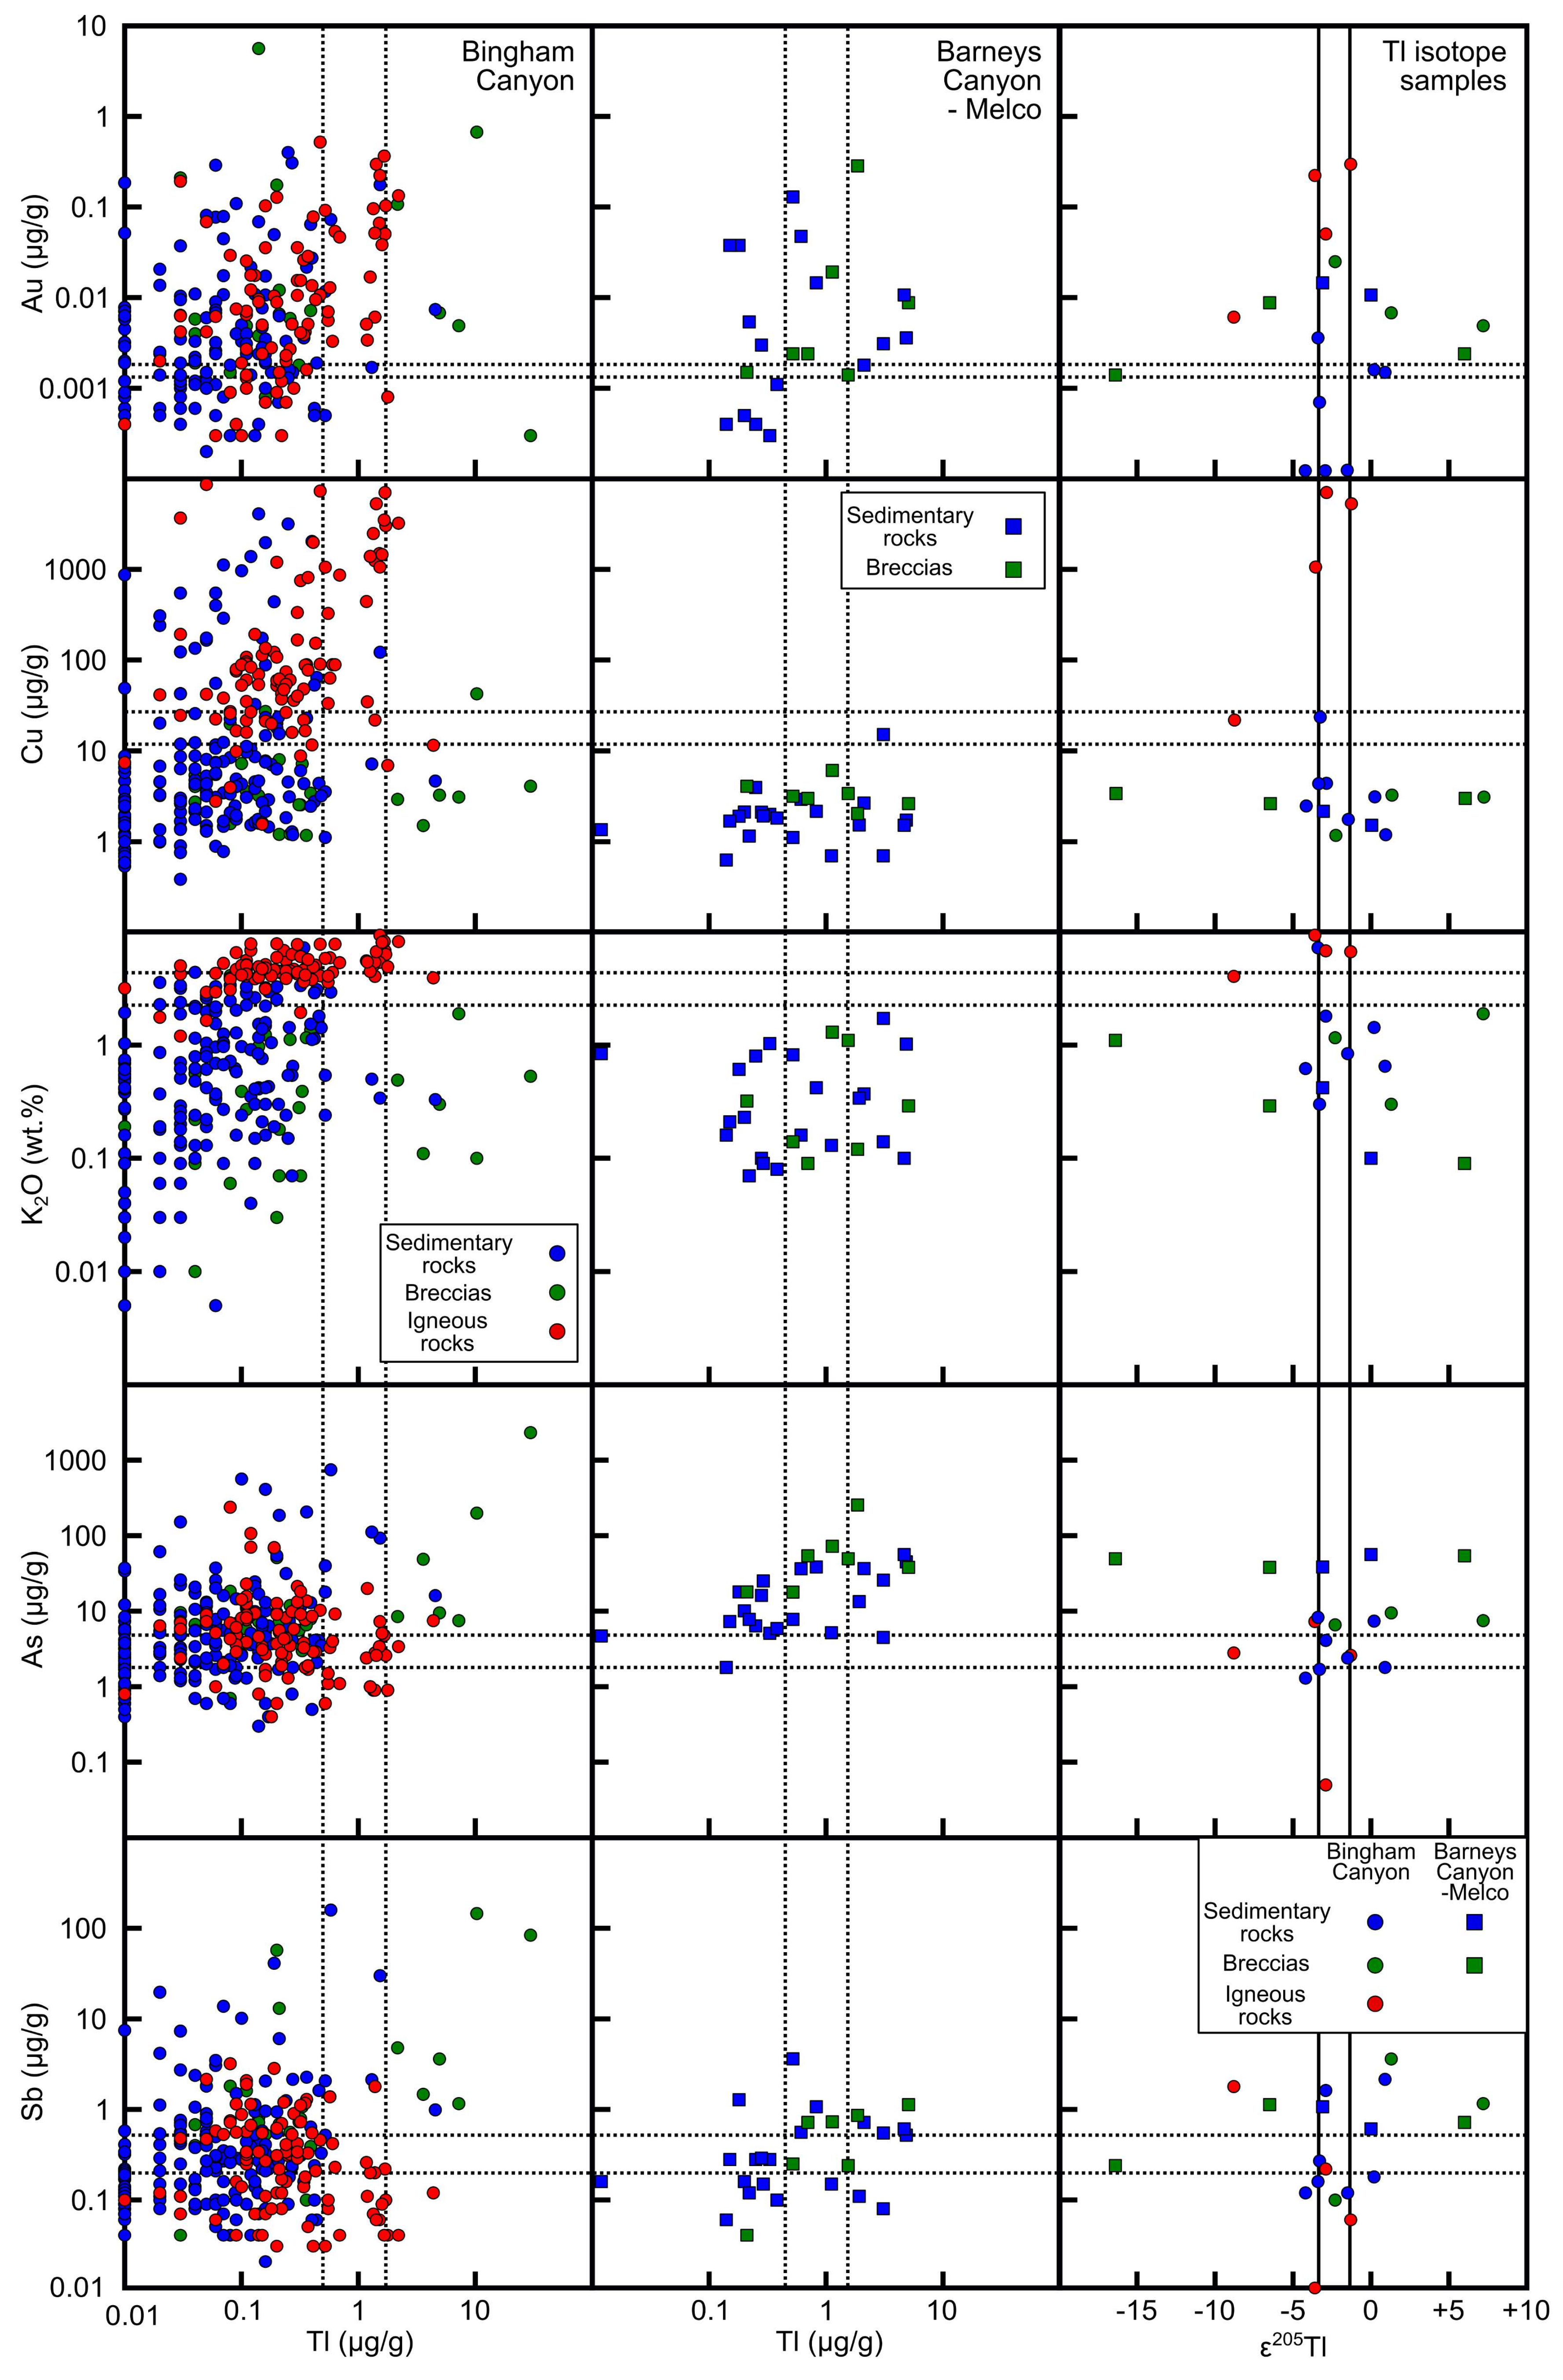
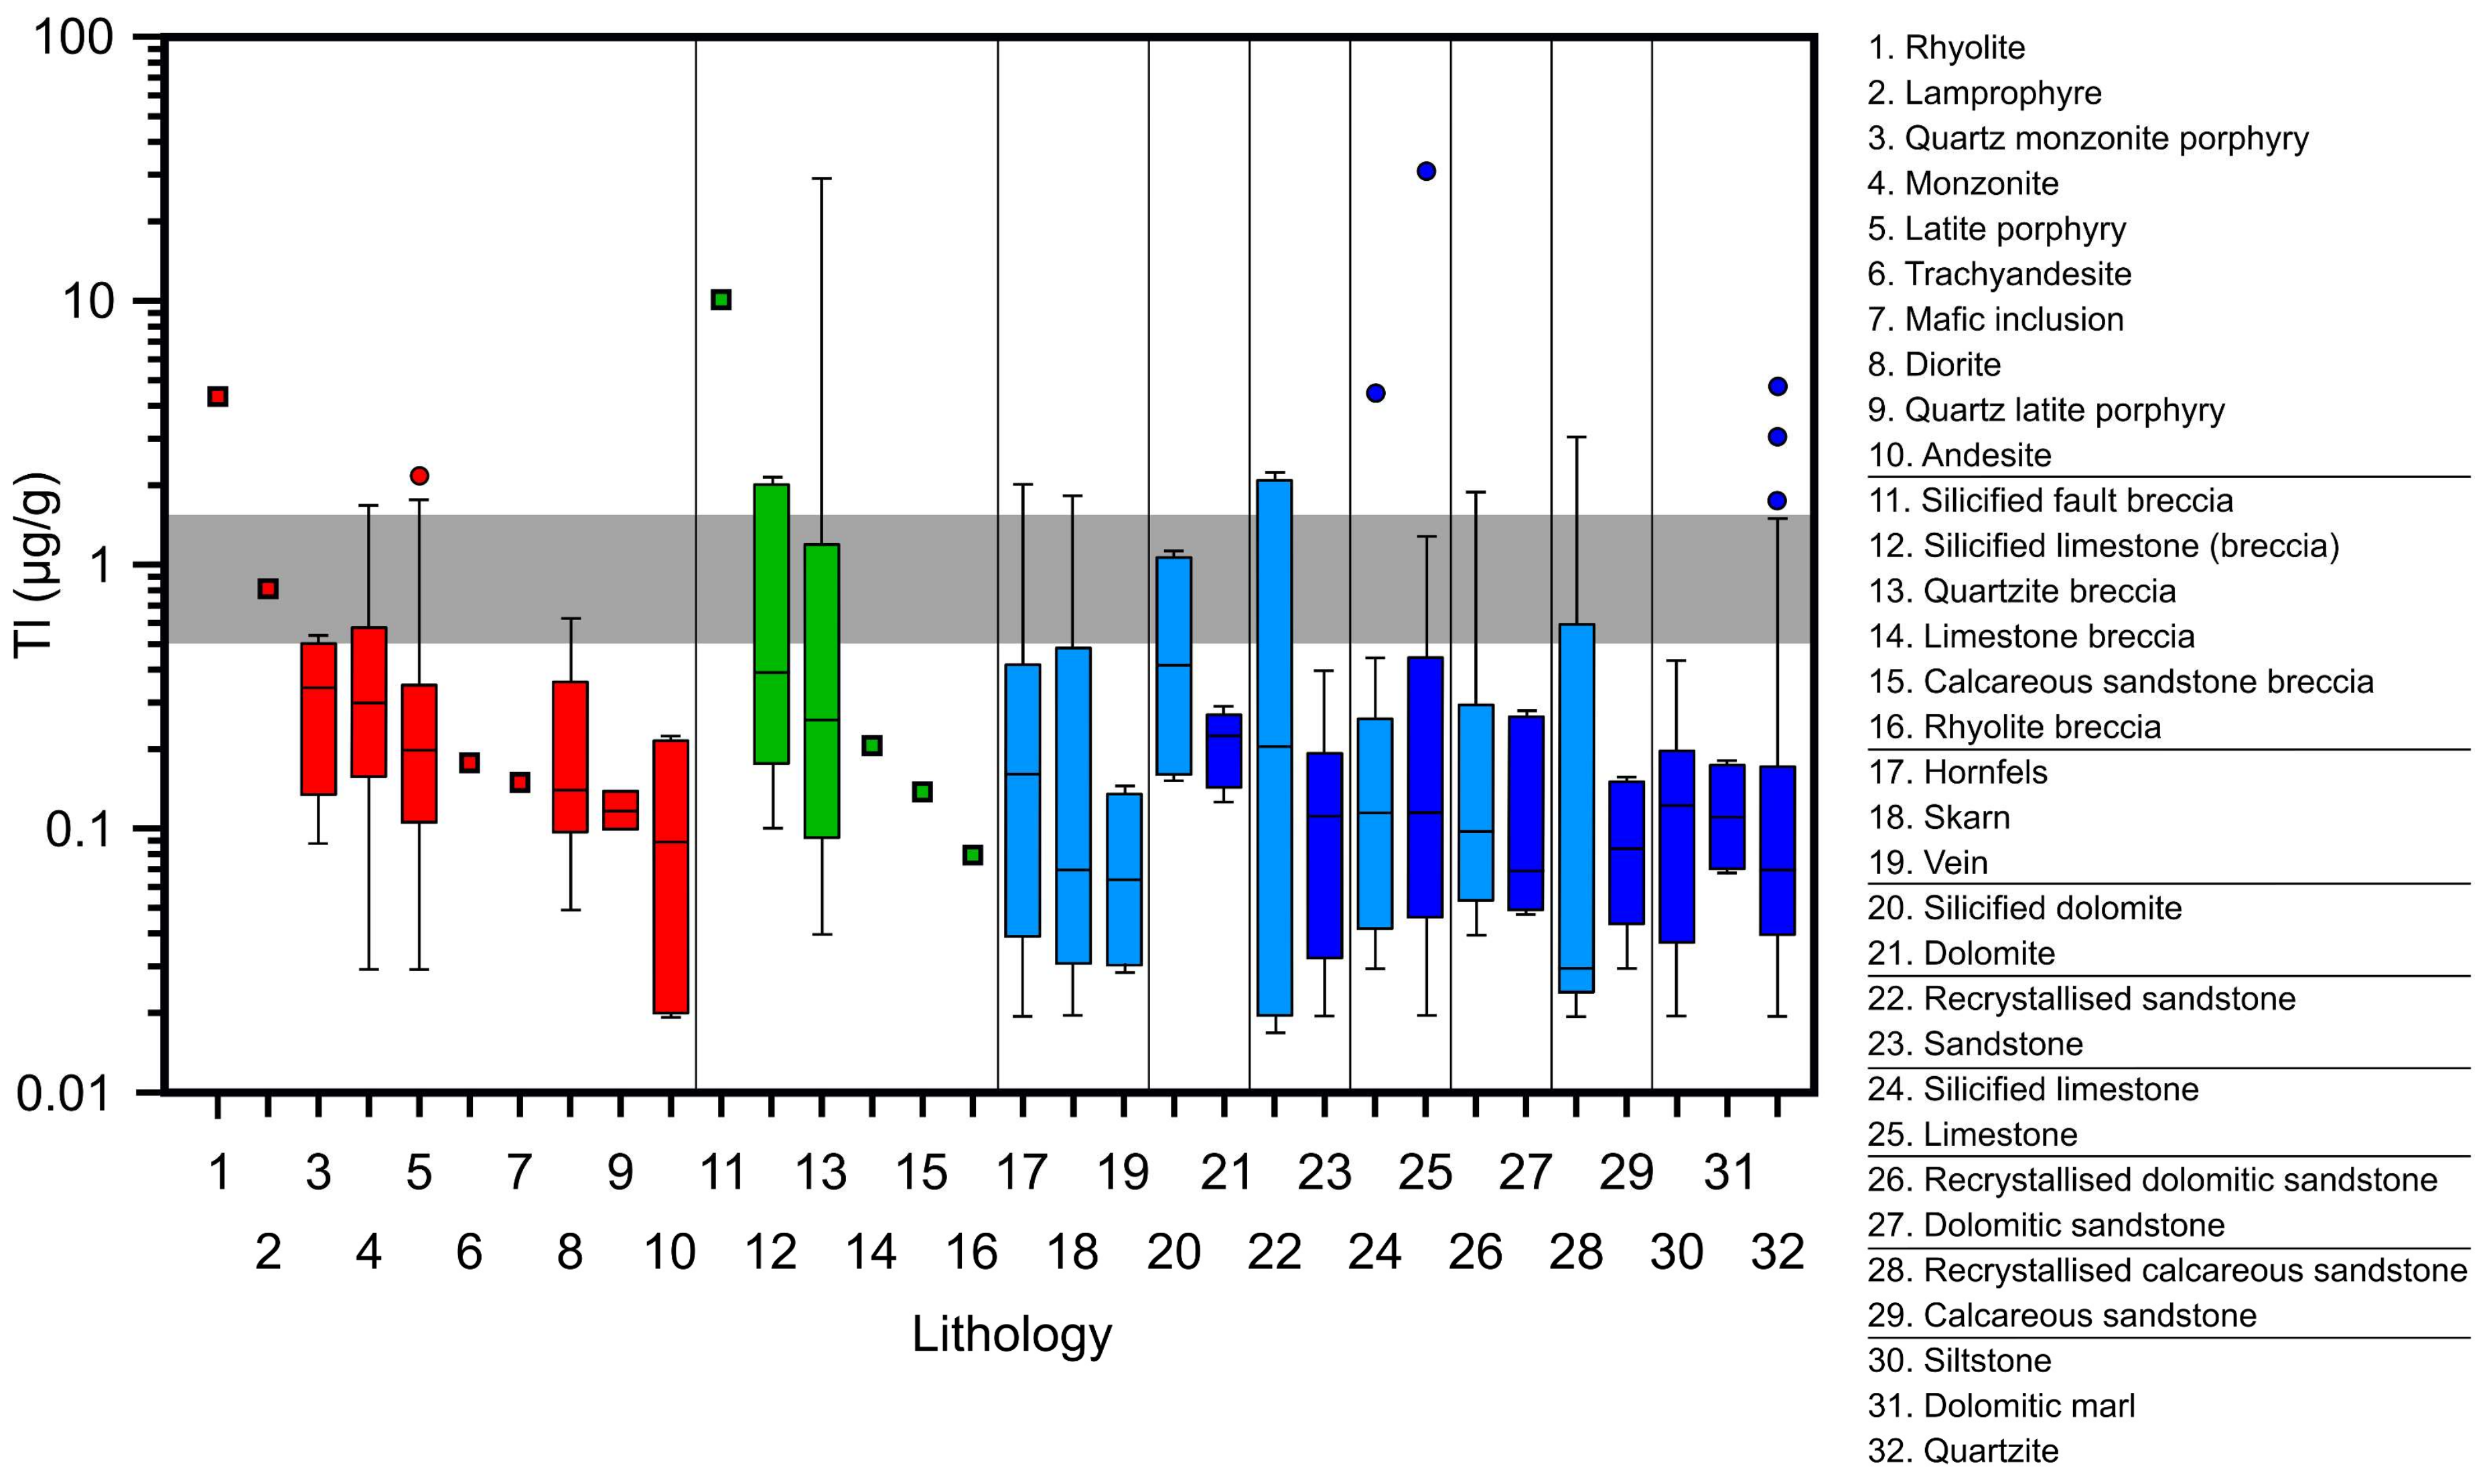
3.3. Thallium Concentrations as a Function of Sample Type and Location

Overall, Tl concentrations do not show strong correlations with other elements (Figure 5). The strongest correlations are with alkali metals (e.g., K2O-Tl Spearman Rank correlation coefficient = 0.49). A box-and-whisker plot of Tl concentrations subdivided according to rock type (Figure 6) shows that there is slight enrichment in Tl in more evolved igneous rocks, consistent with the incompatible behavior of Tl during magmatic fractionation. The igneous rocks that form part of the Bingham intrusive complex are also generally enriched in Tl relative to the surrounding sedimentary host rocks (Figure 6). It is noteworthy, however, that most samples from the district are at or below the average abundance of Tl in the continental crust (0.5–1.6 µg/g; [61]). Of the sedimentary host rock lithologies, dolomite, siltstone, and sandstone display the highest Tl concentrations (median concentrations of 0.21, 0.12, and 0.11 µg/g, respectively). However, these samples are located in the north, in the area associated with the Melco and Barneys Canyon hydrothermal systems (i.e., the Permian sedimentary rocks in Figure 1; [12,23]). Of greatest significance is the fact that hydrothermal breccias are generally enriched in Tl relative to their coherent sedimentary counterparts (Figure 6).

3.4. Thallium Isotope Compositions

Table 1 shows Tl concentration and isotope ratio data for the subset of samples analysed for Tl isotopes from the Bingham district. The range in Tl isotope compositions reported here is compared with results from previous studies in Figure 7.

3.4.1. Bingham Canyon

Thallium isotope compositions of samples from Bingham Canyon show significant variations (ε205Tl from −8.8 to +7.2). However, three igneous samples closest to the Bingham Canyon mine display a narrow range of ε205Tl (−3.6 to −1.3), resembling the mantle range (ε205Tl = −2.0 ± 1.0). Unbrecciated sedimentary samples (n = 7) also display a limited range in ε205Tl (between −4.2 and +0.9). These compositions contrast with that of a latite dyke sample from the southwest of the Bingham district, which has anomalously low ε205Tl (= −8.8), and brecciated samples, which have much more variable ε205Tl (−2.3 to +7.2).

3.4.2. Barneys Canyon and Melco

Five samples from the area surrounding the sediment-hosted gold systems were analysed. The ε205Tl range in these samples (−16.4 to +6.0) is significantly greater than at Bingham Canyon. All of this variability occurs in brecciated or veined samples; by contrast, unbrecciated sedimentary samples have similar ε205Tl values (−3.1 to +0.0) to unbrecciated samples from Bingham Canyon (Figure 5 and Figure 7).

4. Discussion

The relationship between spatial position, pathfinder metal concentrations such as Cu (that are typically zoned in whole rock data from porphyry systems), ε205Tl, and Tl concentrations is key to understanding Tl transport in porphyry fluids and evaluating the potential of Tl as a vectoring tool. Furthermore, there is scope in the dataset to potentially distinguish between the porphyry hydrothermal system and distal, low temperature hydrothermal systems that may or may not be associated with it. Comparisons are first drawn between Tl concentrations and isotope fractionations at Bingham Canyon, USA, and the only previous study of Tl in a porphyry Cu system in Chile [48]. The overall variabilities of both Tl content and isotope ratios in the Bingham district are then discussed, before the potential for using Tl isotopes as a vectoring tool is assessed. Factors controlling Tl isotope fractionations are also examined, including the possible composition and aqueous species of the Barneys Canyon hydrothermal fluids.

4.1. Comparison between Bingham Canyon, USA, and Collahuasi Formation, Chile

There has only been one previous study of Tl isotope variations in a porphyry Cu system, which examined the Collahuasi Formation in Chile, i.e., the host rocks to the Collahuasi cluster of deposits [48]. In this area, where the principal host rocks are all igneous, Tl showed strong lithophile affinities. Similarly, in the Bingham district, Tl abundances are also most strongly correlated with alkali metals such as K (Figure 5). This again suggests that Tl behaves predominantly as a lithophile element, likely substituting into minerals such as biotite and K-feldspar, consistent with the data presented by Baker et al. [48]. In contrast, there is no correlation in any lithology at Bingham Canyon between Tl abundances and chalcophile elements or ore metals (Figure 5), suggesting that Tl behavior in this location is not simply linked to the distribution of Cu, and will not provide a direct means of tracing Cu ore precipitation, supporting the conclusions of Baker at al. [48]. The general Tl-enrichment of the more evolved igneous rocks at Bingham Canyon (Figure 6) suggests that the dominant control on elevated Tl concentrations in this location is the incompatibility of Tl during magmatic processes.
The range of ε205Tl values from the Collahuasi Formation (−5.1 to +0.1; [48]) is very similar to the range found in unbrecciated sedimentary and igneous samples from Bingham Canyon (−4.2 to +0.9; Figure 7). Furthermore, igneous samples at Bingham Canyon (excluding the anomalous latite sample) have ε205Tl values (−2.6 ± 2.3, 2 s.d.) and Tl abundances (1544 ± 135 ng/g) that fall within the range of values from the Collahuasi Formation [48] (Figure 7). It can therefore be concluded that there is limited fractionation of Tl isotopes during high temperature igneous and/or hydrothermal processes.

4.2. Variability in Tl Abundance and ε205Tl throughout the Bingham District

The overall range in ε205Tl observed in samples from the Bingham district (~24 ε units) is almost double what has been previously observed in hydrothermally altered basalts (~15 ε units) and in Fe-Mn deposits (~14 ε units; Figure 7). Moreover, samples from the Bingham district display both positive and negative excursions in ε205Tl from the mantle value (−2.0 ± 1.0; [41]). Most of the variability in ε205Tl is found in samples further away from the Bingham Canyon porphyry intrusions (Figure 8), and most of the extreme ε205Tl values were observed in breccia samples from both the Bingham Canyon (−2.3 to +7.2) and Barneys Canyon areas (−16.4 to +6.0; Figure 7). Breccia samples also display a wide range of Tl concentrations (360–7200 ng/g; Figure 6; Table 1). The extreme variations in both ε205Tl and Tl concentration in breccia samples suggest a strong control on Tl behavior by the nature (P–T–x properties) of the fluids involved in breccia formation.
There are three breccias from the Bingham Canyon area that display a wide range in ε205Tl values (from −2.3 to +7.2). The sample with a mantle-like ε205Tl value (BC11DC164) comes from a brecciated zone around a clayey shear band (Table 1), and is therefore interpreted to reflect fragmentation of the pre-existing country rock (quartzite) in a fault zone, rather than having any hydrothermal influence. The other two breccia samples from the Bingham Canyon area, which are distinct in having both high Tl contents (4932–7213 ng/g) and unusual, high ε205Tl (+1.3 to +7.2; Figure 7), are both cemented breccias with matrices of quartz and/or calcite.
One sample from a latite dyke ~2 km to the southwest of the Bingham Canyon mine (BC11MB101) has anomalously low ε205Tl (−8.8), which is not consistent with the other igneous rocks analysed in this study or by Baker et al. [48]. This sample also has a different major and trace element composition relative to the other analysed magmatic samples, with higher Sb, and lower K2O, Cu, and Au contents (Figure 5). It is notable that this sample occurs beyond the zone of proximal porphyry alteration and mineralization at Bingham Canyon [62], and the presence of chlorite (-illite) indicates that it has undergone lower temperature propylitic alteration. Without further detailed investigation, it is not possible to infer the exact cause, but we suggest that low temperature alteration (200–300 °C) has resulted in Tl isotope fractionation in this sample, with preferential mobilization of 205Tl out of altered K-feldspar and/or biotite, accompanied by K removal. This isotopic shift may have been exacerbated by pre-existing 203Tl-enrichment in biotite (Figure 2 and Figure 7; [36,42]).
Although Tl concentrations and isotope compositions are not directly related to other common proximal indicators of porphyry deposits (e.g., Cu or Au concentrations, K-enrichment due to potassic alteration; Figure 5), it may instead be possible to use Tl isotope ratios to enhance the characterization of geochemical halos in the more distal areas surrounding porphyry deposits. In the Bingham district, samples displaying large ε205Tl excursions coincide with elevated abundances of Tl (Figure 7) and other chalcophile elements (e.g., As, Sb; Figure 5) that are typically enriched in low temperature hydrothermal systems (e.g., [8,63]). The enrichment in Tl and greater variability in ε205Tl values also correlate with hydrothermally brecciated zones involving calcite and quartz cements, silicification and/or veining, with crustiform textures generally suggestive of low temperature, epithermal conditions. These breccias may be linked to late-stage and/or more distal, low-temperature hydrothermal fluid activity, potentially responsible for the gold mineralization in the Barneys Canyon-Melco area to the north of Bingham Canyon (Figure 7 and Figure 8; Table 1).

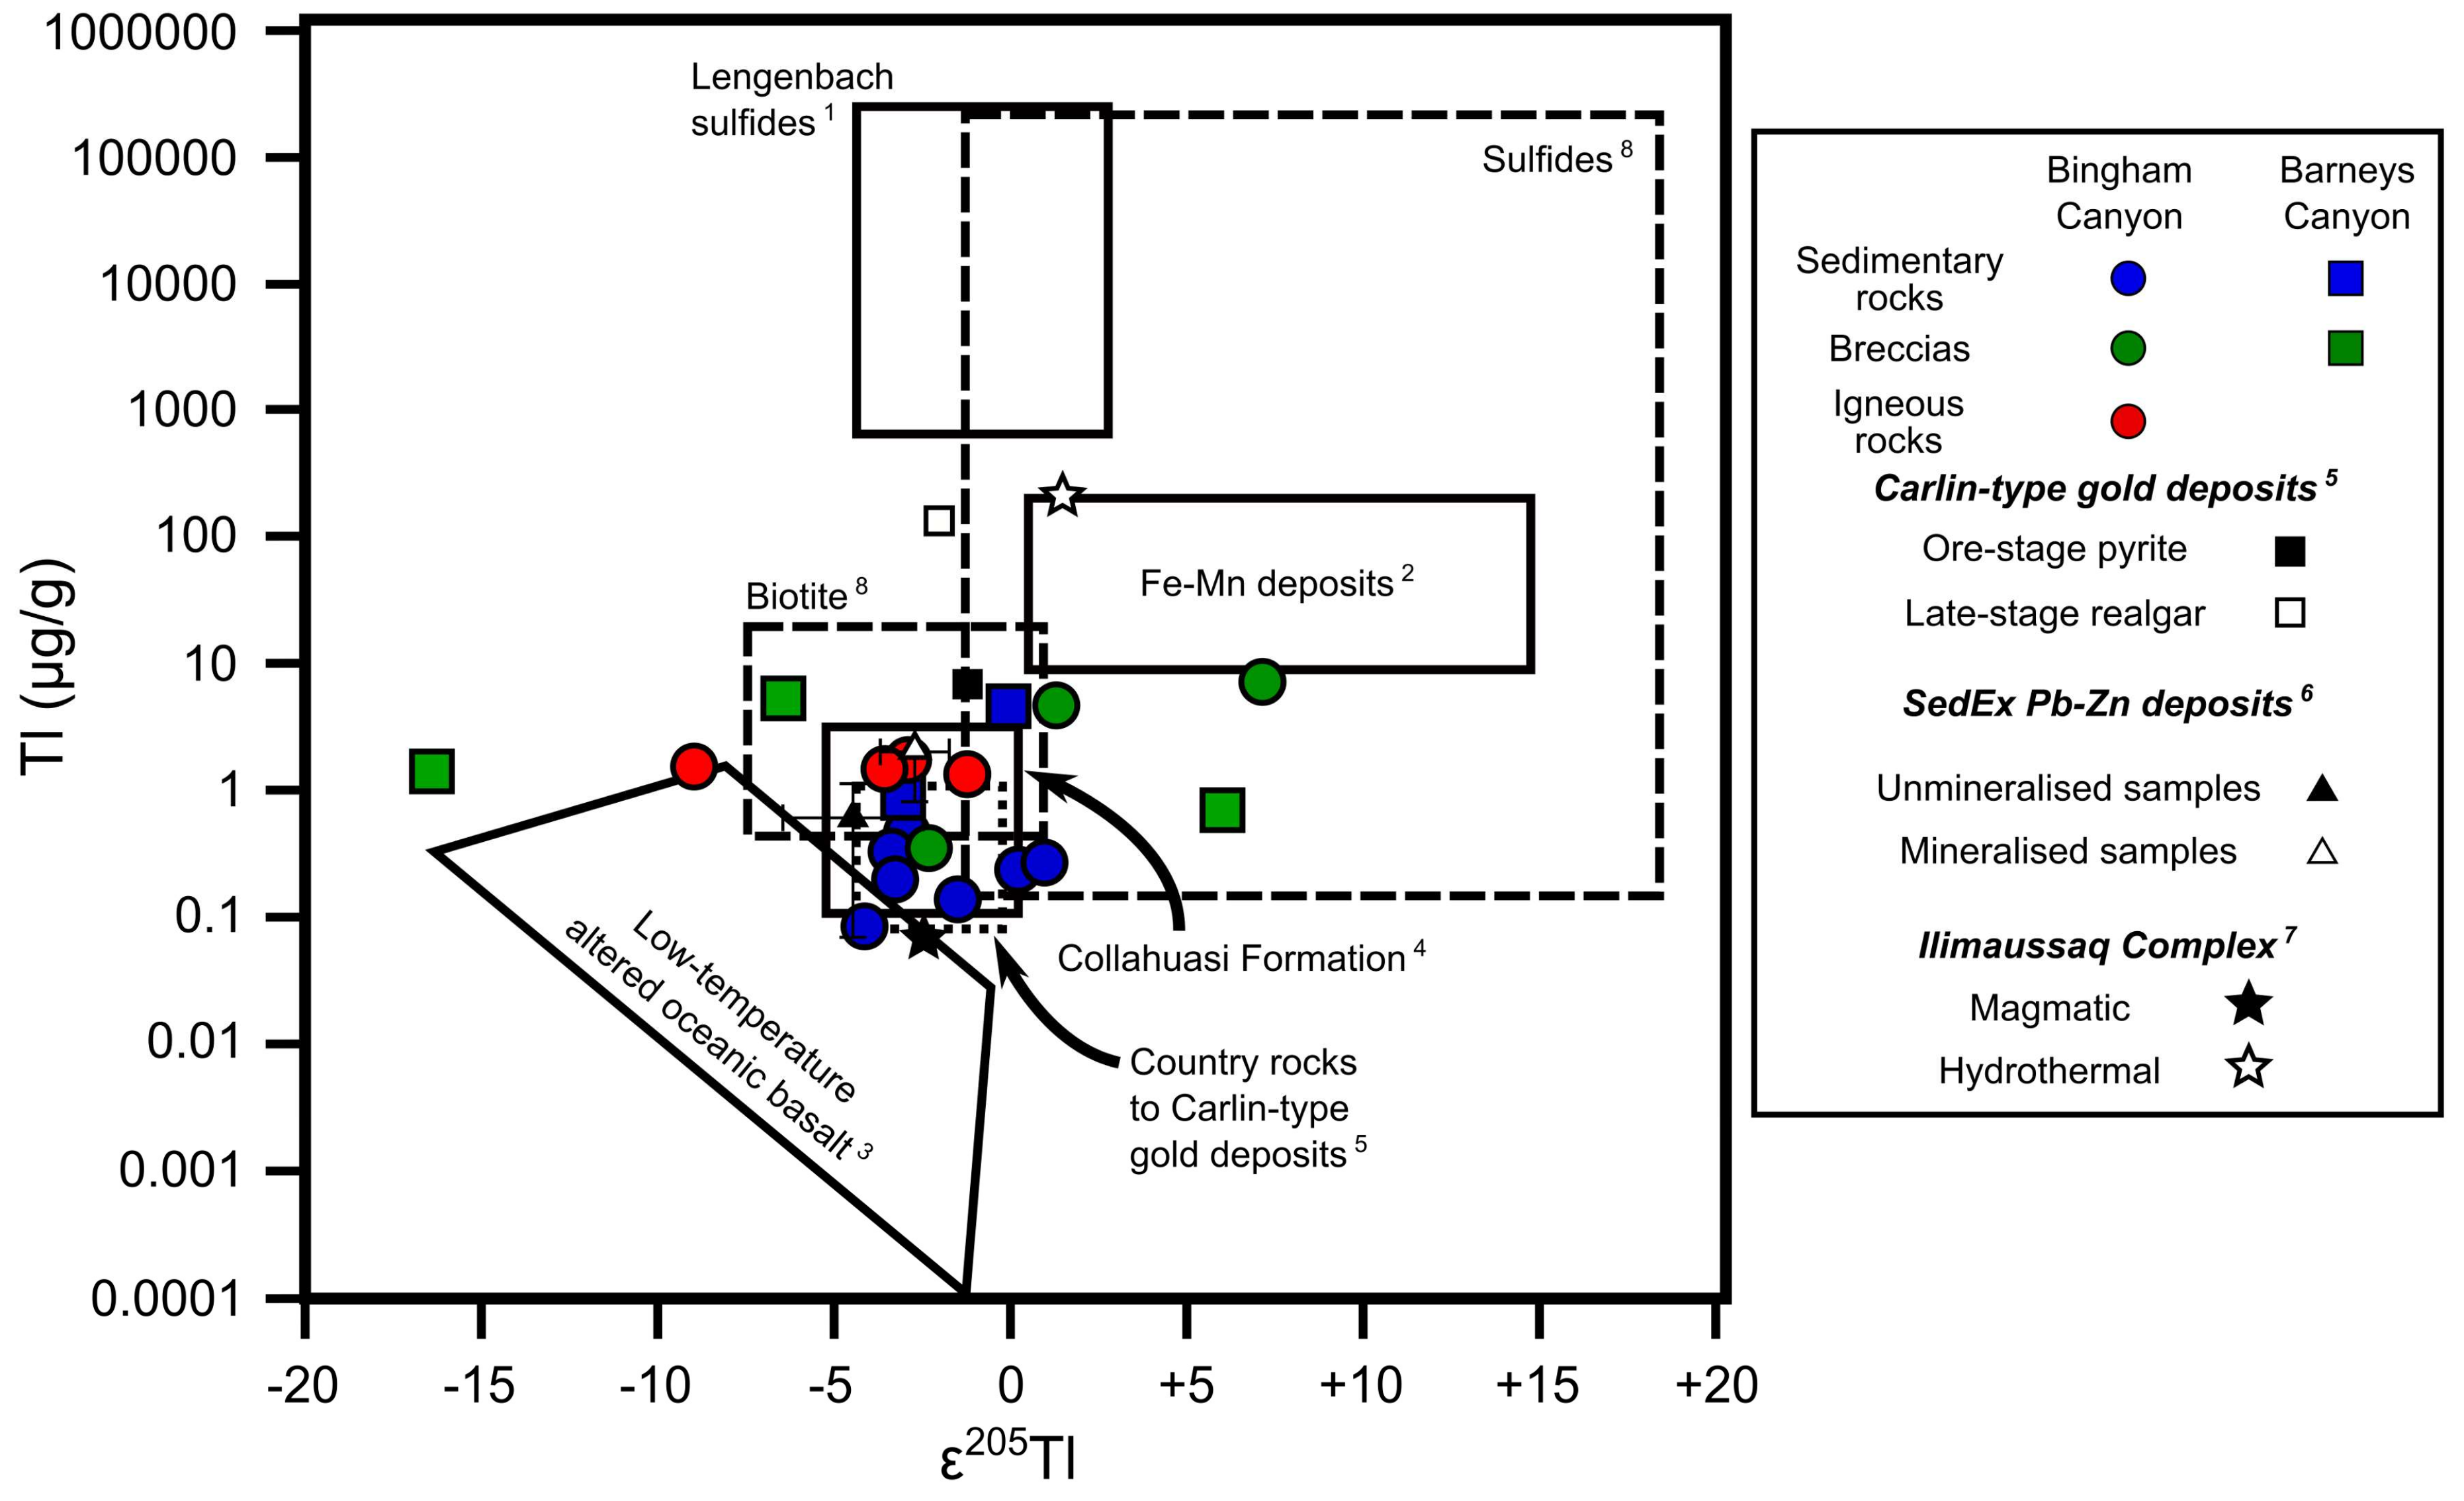
4.3. Thallium Behavior in Sediment-Hosted Gold Systems

Samples from the northern part of the Bingham district display a large range in ε205Tl (from −16.4 to +6.0; Figure 7), in addition to a general enrichment in Tl (Figure 8). The variations in ε205Tl in the Barneys Canyon-Melco area are positively correlated with Sb abundances, and negatively correlated with K abundances (Figure 5). Excursions in ε205Tl may therefore be related to variable Tl-partitioning behavior between K-bearing silicate phases and sulfides that may be more closely related to low temperature gold mineralization than to porphyry ore-forming processes.
Thallium isotope ratios can also be affected by kinetic processes during boiling (e.g., [31]); however, Presnell and Parry [12] found no evidence for boiling in fluid inclusions at Barneys Canyon. Other processes that result in kinetic fractionation are not necessarily constrained in the context of Tl isotopes. Baker et al. [60] examined the effects of volcanic degassing, evaporation, and condensation on Tl isotopes by analysis of volcanic gas condensates and particulates. They found no systematic direction of kinetic isotope fractionation, and instead proposed a counterbalance between the processes of evaporation, which creates an isotopically light gas phase, and condensation during gas cooling, which creates an isotopically heavy residual vapor phase. The lack of systematic behavior (i.e., excursions in ε205Tl to both positive and negative values; Figure 7 and Figure 8) in the Barneys Canyon-Melco area could, in principle, be explained by kinetic fractionation processes of this kind involving volcanic gas interactions with meteoric water.
The variability in both Tl concentration and isotope composition observed in this study may also have been caused by hydrothermal fluid evolution that led to changes in parameters such as temperature, pH, or fO2. Thallium isotope fractionations have been closely linked to temperature (e.g., [39]) and redox conditions (e.g., [57]), so any proposed model must assess these factors. Fluid inclusion homogenization temperatures are lower at Barneys Canyon than at Bingham Canyon, with measurements falling between 130–390 °C and an inferred maximum temperature at Barneys Canyon of 280 °C [12]. By contrast, Cunningham et al. [23] suggested that the Barneys Canyon area did not experience temperatures greater than ~120 °C.
Xiong [64] attempted to quantify the relative concentrations of anionic species transporting Tl in oxidizing and reducing solutions at temperatures ≤300 °C, making this relevant to the conditions extant during low-temperature gold mineralization in the Bingham district. The low-salinity (i.e., low concentration of Cl) and weakly acidic nature of the solutions that form such peripheral gold deposits [6,65] implies a pH range between 5 and 7. Under these conditions, and considering all possible fluid temperatures between 100–300 °C, HS theoretically dominates Tl transport in hydrothermal fluids (Figure 9; [64]); this is analogous to Au behavior (e.g., [65]). Some fluid inclusions in samples from Barneys Canyon were found to have high H2S concentrations [65], supporting the notion that Tl (together with Au) could have been transported to Barneys Canyon-Melco by complexation with HS. Increased abundances of other “low temperature” chalcophile elements (e.g., As) in the Barneys Canyon–Melco area (Figure 5) further support Tl-transport to this location in a sulfur-rich fluid phase.
A variety of sulfide minerals, which may occur at the centre of disseminated gold deposits like Barneys Canyon [12,66,67], have been found to incorporate Tl. Arehart et al. [67] noted that As-sulfides—including realgar (AsS), orpiment (As2S3), and galkhaite [(Cs,Tl)(Hg,Cu,Zn)6(As,Sb)4S12]—typically occur in Carlin-type deposits, albeit late in the Au-mineralization stage. Whereas galkhaite contains Tl as a major element, orpiment can contain high Tl contents (850 µg/g), and realgar minor quantities (0.2 µg/g: [36]; or 127 µg/g: [54]). Variable ε205Tl at Barneys Canyon may therefore be related to the localized precipitation and segregation of different Tl-bearing sulfides, or more likely during Tl-accumulation as a trace element in other, more abundant sulfide phases [36,54]. Such a mechanism would be reflected by equilibrium isotope fractionation driven by the contrasting co-ordination (i.e., bonding environment) of Tl with anions (such as Cl and S2−) in magmas, aqueous fluids, and the precipitating minerals [56]. Control on isotope fractionation by the precipitation of Tl-rich minerals is supported by large ε205Tl variations (19 ε units) in sulfides from assorted hydrothermal ore deposits [36], and a smaller yet still significant range of ~6 ε units in sulfides from the Lengenbach deposit [56] (Figure 2 and Figure 7).
Although Tl behaves differently at Bingham Canyon compared to the Barneys Canyon–Melco area, the data presented herein do not provide conclusive evidence regarding a genetic relationship between the two. The causes of the variability in Tl behavior remain uncertain: kinetic processes associated with vapor separation cannot be definitively dismissed, but the effect of contrasting bonding environments of Tl-rich sulfide minerals with the low temperature hydrothermal fluids from which they precipitate likely plays a dominant role.

5. Outlook

This reconnaissance study investigated the range of Tl isotope ratios in a well-characterized porphyry district (Bingham Canyon and neighbouring low temperature gold deposits). Although no relationship is evident between Tl isotopes and porphyry deposit pathfinder elements, brecciated and veined samples display significant excursions from the mantle ε205Tl value to both positive and negative values, most likely caused by the volatility of Tl, kinetic isotope effects, or more broadly due to interactions with low-temperature hydrothermal fluids.
Individual mineral separates have been shown to have analytically significant variations in ε205Tl values [36]; such a study could be conducted on samples from Bingham Canyon to determine (1) which phases host the highest Tl concentrations; and (2) whether anomalous ε205Tl values or concentrations of Tl are associated with specific Tl-bearing minerals, or are linked to Tl substitution within sulfides. Importantly, it is now analytically feasible to analyze multiple isotope systems—which may provide information on fluid speciation (e.g., O–Cl–S, together with Tl)—on the same materials as bulk-rock analysis and mineralogical characterization.

6. Conclusions

Samples from the Bingham Canyon district in Utah, USA, document the largest range in ε205Tl (−16.4 to +7.2) observed in hydrothermal ore deposits to date. This range in ε205Tl (~24 ε units) also surpasses the variability that has previously been observed in both hydrothermally altered basalts (~15 ε units) and Fe-Mn crusts (~14 ε units). The locally high (up to ~30,000 ng/g; see Supplementary Material) and variable Tl concentrations in samples analysed in this study are also uncommon and warrant further investigation of the mineral phases that host Tl.
Thallium appears to behave in a lithophile manner in igneous samples at Bingham Canyon, which is suggested to be a result of its incompatibility during magmatic processes and the similarities between Tl+ and alkali metal ions. Thallium isotope fractionations at Bingham Canyon cannot be directly related to other geochemical enrichments that would ordinarily be associated with ore formation, or potassic alteration. Instead, the data presented here are consistent with limited fractionation of Tl isotopes during high temperature igneous and/or hydrothermal processes.
In contrast, samples from the Barneys Canyon–Melco area, and from breccia samples throughout the district, show positive correlations between Tl and chalcophile elements such as As and Sb, which may relate to low temperature hydrothermal activity linked to sediment-hosted gold mineralization. Theoretical considerations, coupled with fluid inclusion analyses, suggest Tl and Au could have been co-transported to the Barneys Canyon–Melco area as bisulfide (HS) complexes, consistent with increased levels of chalcophile elements in this location. The extraordinary range in ε205Tl from −16 to +7 in breccia samples from the Bingham district further supports a strong control on ε205Tl variability by low temperature hydrothermal fluid activity. Kinetic processes, which may relate to vapor separation during hydrothermal fluid evolution, cannot be definitively dismissed as the cause of Tl isotope variability; however, Tl-rich sulfide precipitation also appears to be a strong candidate for fractionating Tl isotopes.
Further analysis to determine the mineral phase(s) hosting Tl and extreme Tl isotope signatures offers a fruitful avenue of future research. Combining such findings with analyses of other stable isotope systems on the same material is a potentially powerful approach to elucidate fluid complexation routes in the final cooling of hydrothermal fluids that generate ore deposits.

Supplementary Materials

Selected major and trace element contents in bulk-rock samples from AMIRA project P1060.

Author Contributions

J.P. and J.J.W. conceived the project; A.F. and J.P. performed the experiments; A.F. analysed the data; J.J.W., D.R.C., M.J.B., C.C.W. contributed the samples; and A.F. wrote the paper (assisted by all other authors).

Funding

Samples were collected during the AMIRA P1060 research project, funded by a consortium of industry sponsors.

Acknowledgments

This study was undertaken as part of AF’s Master’s research project at Imperial College London. The authors acknowledge the assistance of Barry Coles and Alex Brett, who helped throughout analytical sessions. We also thank Janet Hergt (University of Melbourne) for her generosity, Kim Schroeder (Rio Tinto) for his help and advice during this project, and Jennifer Thompson and Lejun Zhang (both TMVC/CODES) for collecting additional samples used in this study. An early version of this manuscript benefited from informal reviews by R. Sievwright and E. Spencer. We are also grateful for extremely efficient editorial handling and constructive comments from four anonymous reviewers. The entire MAGIC research group at Imperial College London, and particularly Katharina Kreissig, are thanked for their overwhelming support.

Conflicts of Interest

The authors declare no conflict of interest. The funding sponsors had no role in the design of the study; in the collection, analyses, or interpretation of data; in the writing of the manuscript, and in the decision to publish the results.

References

  1. Sillitoe, R.H. Porphyry copper systems. Econ. Geol. 2010, 105, 3–41. [Google Scholar] [CrossRef]
  2. Tosdal, R.M.; Dilles, J.H.; Cooke, D.R. From source to sinks in auriferous magmatic-hydrothermal porphyry and epithermal deposits. Elements 2009, 5, 289–295. [Google Scholar] [CrossRef]
  3. Richards, J.P. Tectono-magmatic precursors for porphyry Cu-(Mo-Au) deposit formation. Econ. Geol. 2003, 98, 1515–1533. [Google Scholar] [CrossRef]
  4. Wilkinson, J.J. Triggers for the formation of porphyry ore deposits in magmatic arcs. Nat. Commun. 2013, 6, 917–925. [Google Scholar] [CrossRef] [Green Version]
  5. Sillitoe, R.H.; Hedenquist, J.W. Linkages between volcanotectonic settings, ore-fluid compositions, and epithermal precious metal deposits. Spec. Publ. Soc. Econ. Geol. 2003, 10, 315–343. [Google Scholar]
  6. Heinrich, C.A.; Driesner, T.; Stefansson, A.; Seward, T.M. Magmatic vapor contraction and the transport of gold from the porphyry environment to epithermal ore deposits. Geology 2004, 32, 761–764. [Google Scholar] [CrossRef]
  7. Hemley, J.J.; Hunt, J.P. Hydrothermal ore-forming processes in the light of studies in rock-buffered systems: II. Some general geologic applications. Econ. Geol. 1992, 87, 23–43. [Google Scholar] [CrossRef]
  8. Sillitoe, R.H.; Bonham, H.F., Jr. Sediment-hosted gold deposits: Distal products of magmatic-hydrothermal systems. Geology 1990, 18, 157–161. [Google Scholar] [CrossRef]
  9. Cooke, D.R.; Hollings, P.; Walshe, J.L. Giant porphyry deposits: Characteristics, distribution, and tectonic controls. Econ. Geol. 2005, 100, 801–818. [Google Scholar] [CrossRef]
  10. Singer, D.A. World class base and precious metal deposits—A quantitative analysis. Econ. Geol. 1995, 90, 88–104. [Google Scholar] [CrossRef]
  11. Jones, B.K. Application of metal zoning to gold exploration in porphyry copper systems. J. Geochem. Explor. 1992, 43, 127–155. [Google Scholar] [CrossRef]
  12. Presnell, R.D.; Parry, W.T. Geology and geochemistry of the Barneys Canyon gold deposit, Utah. Econ. Geol. 1996, 91, 273–288. [Google Scholar] [CrossRef]
  13. Redmond, P.B.; Einaudi, M.T. The Bingham Canyon porphyry Cu-Mo-Au deposit. I. Sequence of intrusions, vein formation, and sulfide deposition. Econ. Geol. 2010, 105, 43–68. [Google Scholar] [CrossRef]
  14. Sillitoe, R.H. A plate tectonic model for the origin of porphyry copper deposits. Econ. Geol. 1972, 67, 184–197. [Google Scholar] [CrossRef]
  15. Grondahl, C.; Zajacz, Z. Magmatic controls on the genesis of porphyry Cu-Mo-Au deposits: The Bingham Canyon example. Earth Planet. Sci. Lett. 2017, 480, 53–65. [Google Scholar] [CrossRef]
  16. Waite, K.A.; Keith, J.D.; Christiansen, E.H.; Whitney, J.A.; Hattori, K.; Tingey, D.G.; Hook, C.J. Petrogenesis of the volcanic and intrusive rocks associated with the Bingham Canyon porphyry Cu-Au-Mo deposit, Utah. Soc. Econ. Geol. Guideb. Ser. 1997, 29, 69–90. [Google Scholar]
  17. Atkinson, W.W., Jr.; Einaudi, M.T. Skarn formation and mineralization in the contact aureole at Carr Fork, Bingham, Utah. Econ. Geol. 1978, 73, 1326–1365. [Google Scholar] [CrossRef]
  18. Lanier, G.; John, E.C.; Swensen, A.J.; Reid, J.; Bard, C.E.; Caddey, S.W.; Wilson, J.C. General geology of the Bingham Mine, Bingham Canyon, Utah. Econ. Geol. 1978, 73, 1228–1241. [Google Scholar] [CrossRef]
  19. Core, D.P.; Kesler, S.E.; Essene, E.J. Unusually Cu-rich magmas associated with giant porphyry copper deposits: Evidence from Bingham, Utah. Geology 2006, 34, 41–44. [Google Scholar] [CrossRef]
  20. Zhang, D.; Audétat, A. What caused the formation of the giant Bingham Canyon porphyry Cu-Mo-Au deposit? Insights from melt inclusions and magmatic sulfides. Econ. Geol. 2017, 112, 221–244. [Google Scholar] [CrossRef]
  21. Von Quadt, A.; Erni, M.; Martinek, K.; Moll, M.; Peytcheva, I.; Heinrich, C.A. Zircon crystallization and the lifetimes of ore-forming magmatic-hydrothermal systems. Geology 2011, 39, 731–734. [Google Scholar] [CrossRef]
  22. Landtwing, M.R.; Furrer, C.; Redmond, P.B.; Pettke, T.; Guillong, M.; Heinrich, C.A. The Bingham Canyon porphyry Cu-Mo-Au deposit. III. Zoned copper-gold ore deposition by magmatic vapor expansion. Econ. Geol. 2010, 105, 91–118. [Google Scholar] [CrossRef]
  23. Cunningham, C.G.; Austin, G.W.; Naeser, C.W.; Rye, R.O.; Ballantyne, G.H.; Stamm, R.G.; Barker, C.E. Formation of a paleothermal anomaly and disseminated gold deposits associated with the Bingham Canyon porphyry Cu-Au-Mo system, Utah. Econ. Geol. 2004, 99, 789–806. [Google Scholar] [CrossRef]
  24. Cline, J.S.; Hofstra, A.H.; Muntean, J.L.; Tosdal, R.M.; Hickey, K.A. Carlin-type deposits gold deposits in Nevada: Critical geologic characteristics and viable models. Econ. Geol. 100 Anniv. Vol. 2005, 451, 484. [Google Scholar]
  25. Babcock, R.C., Jr.; Ballantyne, G.H.; Phillips, C.H. Summary of the geology of the Bingham District, Utah. Ariz. Geol. Soc. Dig. 1995, 20, 316–335. [Google Scholar]
  26. Cunningham, C.G.; Austin, G.W.; Naeser, C.W.; Rye, R.O.; Ballantyne, G.H.; Stamm, R.G.; Barker, C.E. Formation of a paleothermal anomaly and disseminated gold deposits associated with the Bingham Canyon porphyry Cu-Au-Mo system, Utah—A reply. Econ. Geol. 2005, 100, 594–595. [Google Scholar] [CrossRef]
  27. Presnell, R.D.; Parry, W.T. Formation of a paleothermal anomaly and disseminated gold deposits associated with the Bingham Canyon porphyry Cu-Au-Mo system, Utah—A discussion. Econ. Geol. 2005, 100, 591–593. [Google Scholar] [CrossRef]
  28. McGoldrick, P.J.; Keays, R.R.; Scott, B.B. Thallium: A sensitive indicator of rock/seawater interaction and of sulfur saturation of silicate melts. Geochim. Cosmochim. Acta 1979, 43, 1301–1311. [Google Scholar] [CrossRef]
  29. Noll, P.D., Jr.; Newsom, H.E.; Leeman, W.P.; Ryan, J.G. The role of hydrothermal fluids in the production of subduction zone magmas: Evidence from siderophile and chalcophile trace elements and boron. Geochim. Cosmochim. Acta 1996, 60, 587–611. [Google Scholar] [CrossRef]
  30. Rehkamper, M.; Nielsen, S.G. The mass balance of dissolved thallium in the oceans. Mar. Chem. 2004, 85, 125–139. [Google Scholar] [CrossRef]
  31. Nielsen, S.G.; Rehkamper, M.; Prytulak, J. Investigation and application of thallium isotope fractionation. Rev. Mineral. Geochem. 2017, 82, 759–798. [Google Scholar] [CrossRef]
  32. Shaw, D.M. The geochemistry of thallium. Geochim. Cosmochim. Acta 1952, 2, 118–154. [Google Scholar] [CrossRef]
  33. Prytulak, J.; Brett, A.; Webb, M.; Plank, T.; Rehkamper, M.; Savage, P.S.; Woodhead, J. Thallium elemental behavior and stable isotope fractionation during magmatic processes. Chem. Geol. 2017, 448, 71–83. [Google Scholar] [CrossRef] [Green Version]
  34. Bea, F.; Pereira, M.D.; Stroh, A. Mineral/leucosome trace-element partitioning in a peraluminous migmatite (a laser ablation-ICP-MS study). Chem. Geol. 1994, 117, 291–312. [Google Scholar] [CrossRef]
  35. Kiseeva, E.S.; Wood, B.J. A simple model for chalcophile element partitioning between sulphide and silicate liquids with geochemical applications. Earth Planet. Sci. Lett. 2013, 383, 68–81. [Google Scholar] [CrossRef]
  36. Rader, S.T.; Mazdab, F.K.; Barton, M.D. Mineralogical thallium geochemistry and isotope variations from igneous, metamorphic, and metasomatic systems. Geochim. Cosmochim. Acta 2018, 243, 42–65. [Google Scholar] [CrossRef]
  37. Vink, B.W. The behavior of thallium in the (sub) surface environment in terms of Eh and pH. Chem. Geol. 1993, 109, 119–123. [Google Scholar] [CrossRef]
  38. Batley, G.E.; Florence, T.M. Determination of thallium in natural waters by anodic stripping voltammetry. J. Electroanal. Chem. 1975, 61, 205–211. [Google Scholar] [CrossRef]
  39. Nielsen, S.G.; Rehkamper, M.; Teagle, D.A.H.; Butterfield, D.A.; Alt, J.C.; Halliday, A.N. Hydrothermal fluid fluxes calculated from the isotopic mass balance of thallium in the ocean crust. Earth Planet. Sci. Lett. 2006, 251, 120–133. [Google Scholar] [CrossRef]
  40. Coggon, R.M.; Rehkamper, M.; Atteck, C.; Teagle, D.A.H.; Alt, J.C.; Cooper, M.J. Controls on thallium uptake during hydrothermal alteration of the upper ocean crust. Geochim. Cosmochim. Acta 2014, 144, 25–42. [Google Scholar] [CrossRef]
  41. Nielsen, S.G.; Rehkamper, M.; Norman, M.D.; Halliday, A.N.; Harrison, D. Thallium isotopic evidence for ferromanganese sediments in the mantle source of Hawaiian basalts. Nature 2006, 439, 314–317. [Google Scholar] [CrossRef] [PubMed]
  42. Brett, A.; Prytulak, J.; Hammond, S.J.; Rehkamper, M. Thallium mass fraction and stable isotope ratios of sixteen geological reference materials. Geostand. Geoanal. Res. 2018. [Google Scholar] [CrossRef]
  43. Prytulak, J.; Nielsen, S.G.; Plank, T.; Barker, M.; Elliott, T. Assessing the utility of thallium and thallium isotopes for tracing subduction zone inputs to the Mariana arc. Chem. Geol. 2013, 345, 139–149. [Google Scholar] [CrossRef]
  44. Nielsen, S.G.; Yogodzinski, G.; Prytulak, J.; Plank, T.; Kay, S.; Kay, R.; Blusztajn, J.; Owens, J.; Auro, M.; Kading, T. Tracking along-arc sediment inputs to the Aleutian arc using thallium isotopes. Geochim. Cosmochim. Acta 2016, 181, 217–237. [Google Scholar] [CrossRef] [Green Version]
  45. Nielsen, S.G.; Prytulak, J.; Blusztajn, J.; Shu, Y.; Auro, M.; Regelous, M.; Walker, J. Thallium isotopes as tracers of recycled materials in subduction zones: Review and new data from Tonga-Kermadec and Central America. J. Volcanol. Geotherm. Res. 2017, 339, 23–40. [Google Scholar] [CrossRef]
  46. Shu, Y.; Nielsen, S.G.; Zeng, Z.; Shinjo, R.; Blusztajn, J.; Wang, X.; Chen, S. Tracing subducted sediment inputs to the Ryukyu arc-Okinawa trough system: Evidence from thallium isotopes. Geochim. Cosmochim. Acta 2017, 217, 462–491. [Google Scholar] [CrossRef]
  47. Bigeleisen, J.; Mayer, M.G. Calculation of equilibrium constants for isotopic exchange reactions. J. Chem. Phys. 1947, 15, 261–267. [Google Scholar] [CrossRef]
  48. Baker, R.G.A.; Rehkamper, M.; Ihlenfeld, C.; Oates, C.J.; Coggon, R. Thallium isotope variations in an ore-bearing continental igneous setting: Collahuasi Formation, northern Chile. Geochim. Cosmochim. Acta 2010, 74, 4405–4416. [Google Scholar] [CrossRef]
  49. Munizaga, F.; Maksaev, V.; Fanning, C.M.; Giglio, S.; Yaxley, G.; Tassinari, C.C.G. Late Paleozoic-Early Triassic magmatism on the western margin of Gondwana: Collahuasi area, northern Chile. Gondwana Res. 2008, 13, 407–427. [Google Scholar] [CrossRef]
  50. Masterman, G.J.; Cooke, D.R.; Berry, R.F.; Clark, A.H.; Archibald, D.A.; Mathur, R.; Walshe, J.L.; Durán, M. 40Ar/39Ar and Re-Os geochronology of porphyry copper-molybdenum deposits and related copper-silver veins in the Collahuasi district, northern Chile. Econ. Geol. 2004, 99, 673–690. [Google Scholar] [CrossRef]
  51. Masterman, G.J.; Cooke, D.R.; Berry, R.F.; Walshe, J.L.; Lee, A.W.; Clark, A.H. Fluid chemistry, structural setting, and emplacement history of the Rosario Cu-Mo porphyry and Cu-Ag-Au epithermal veins, Collahuasi District, northern Chile. Econ. Geol. 2005, 100, 835–862. [Google Scholar] [CrossRef]
  52. Rehkamper, M.; Frank, M.; Hein, J.R.; Porcelli, D.; Halliday, A.; Ingri, J.; Liebetrau, V. Thallium isotope variations in seawater and hydrogenetic, diagenetic, and hydrothermal ferromanganese deposits. Earth Planet. Sci. Lett. 2002, 197, 65–81. [Google Scholar] [CrossRef]
  53. Rehkamper, M.; Frank, M.; Hein, J.R.; Halliday, A. Cenozoic marine geochemistry of thallium deduced from isotopic studies of ferromanganese crusts and pelagic sediments. Earth Planet. Sci. Lett. 2004, 219, 77–91. [Google Scholar] [CrossRef]
  54. Wickham, K. Thallium Isotope Implications for the Metalliferous Source of Carlin-Type Gold Deposits in Northern Nevada. Master’ Thesis, University of Nevada, Reno, NV, USA, 2014. [Google Scholar]
  55. Hettmann, K.; Marks, M.A.W.; Kreissig, K.; Zack, T.; Wenzel, T.; Rehkamper, M.; Jacob, D.E.; Markl, G. The geochemistry of Tl and its isotopes during magmatic and hydrothermal processes: The peralkaline Ilimaussaq complex, southwest Greenland. Chem. Geol. 2014, 366, 1–13. [Google Scholar] [CrossRef]
  56. Hettmann, K.; Kreissig, K.; Rehkamper, M.; Wenzel, T.; Mertz-Kraus, R.; Markl, G. Thallium geochemistry in the metamorphic Lengenbach sulfide deposit, Switzerland: Thallium-isotope fractionation in a sulfide melt. Am. Miner. 2014, 99, 793–803. [Google Scholar] [CrossRef]
  57. Peter, J.M.; Gadd, M.G.; Layton-Matthews, D.; Voinot, A. Reconnaissance thallium isotope study of zinc-lead SEDEX mineralization and host rocks in the Howard’s Pass district, Selwyn Basin, Yukon: Potential application to paleoredox determinations and fingerprinting of mineralization. In Targeted Geoscience Initiative: 2017 Report of Activities; Rogers, N., Ed.; Geological Survey of Canada: Ottawa, ON, Canada, 2018; Volume 3, Open File 8358; pp. 173–191. [Google Scholar]
  58. Rehkamper, M.; Halliday, A.N. The precise measurement of Tl isotopic compositions by MC-ICPMS: Application to the analysis of geological materials and meteorites. Geochim. Cosmochim. Acta 1999, 63, 935–944. [Google Scholar] [CrossRef]
  59. Nielsen, S.G.; Rehkamper, M.; Baker, J.; Halliday, A.N. The precise and accurate determination of thallium isotope compositions and concentrations for water samples by MC-ICPMS. Chem. Geol. 2004, 204, 109–124. [Google Scholar] [CrossRef]
  60. Baker, R.G.A.; Rehkamper, M.; Hinkley, T.K.; Nielsen, S.G.; Toutain, J.P. Investigation of thallium fluxes from subaerial volcanism—Implications for the present and past mass balance of thallium in the oceans. Geochim. Cosmochim. Acta 2009, 73, 6340–6359. [Google Scholar] [CrossRef]
  61. Rudnick, R.L.; Gao, S. Composition of the continental crust. In Treatise on Geochemistry; Rudnick, R.L., Ed.; Elsevier Ltd: Amsterdam, The Netherlands, 2014; Volume 3, p. 659. [Google Scholar]
  62. Parry, W.T.; Jasumback, M.; Wilson, P.N. Clay mineralogy of phyllic and intermediate argillic alteration at Bingham, Utah. Econ. Geol. 2002, 97, 221–239. [Google Scholar] [CrossRef]
  63. Cameron, D.E.; Garmoe, W.J. Geology of skarn and high-grade gold in the Carr Fork Mine, Utah. Econ. Geol. 1987, 82, 1319–1333. [Google Scholar] [CrossRef]
  64. Xiong, J. Hydrothermal thallium mineralization up to 300 °C: A thermodynamic approach. Ore Geol. Rev. 2007, 32, 291–313. [Google Scholar] [CrossRef]
  65. Roedder, E. Fluid inclusion studies on the porphyry-type ore deposits at Bingham, Utah, Butte, Montana, and Climax, Colorado. Econ. Geol. 1971, 66, 98–118. [Google Scholar] [CrossRef]
  66. Arehart, G.B. Characteristics and origin of sediment-hosted disseminated gold deposits: A review. Ore Geol. Rev. 1996, 11, 383–403. [Google Scholar] [CrossRef]
  67. Arehart, G.B.; Chakurian, A.M.; Tretbar, D.R.; Christensen, J.N.; McInnes, B.A.; Donelick, R.A. Evaluation of radioisotope dating of Carlin-type deposits in the Great Basin, western North America, and implications for deposit genesis. Econ. Geol. 2003, 98, 235–248. [Google Scholar] [CrossRef]
Figure 1. Geological map of the area surrounding the Bingham Canyon porphyry Cu deposit; all samples analysed for Tl isotope compositions are marked with sample name and lithology; inset map of Utah showing study area (black rectangle), modified after [23].
Minerals 08 00548 g001
Figure 2. Summary of published Tl isotope ratios in hydrothermally altered basalts [39,40], Fe-Mn deposits [52,53], hydrothermal ore deposits [48,54,55,56,57], and mineral separates of biotite and sulfide from various geological environments [36]. The grey box represents the nominal mantle value of ε205Tl (−2 ± 1 [31,41]); long-term external 2 s.d. reproducibility of several reference materials of ±0.5 [31,42] shown as error bars for reference.
Minerals 08 00548 g002
Figure 3. A flowchart showing the Tl separation column chromatography process, modified after [59].
Minerals 08 00548 g003
Figure 4. A plot of Tl concentrations (μg/g) measured by ICP-MS (during the AMIRA project (P1060)) compared to MC-ICP-MS (this study); 1:1 line provided for reference.
Minerals 08 00548 g004
Figure 5. Plots of Au (μg/g), Cu (μg/g), K2O (wt.%), As (μg/g), and Sb (μg/g) against Tl (μg/g) and ε205Tl values measured in this study for the Bingham Canyon area (left column), the Barneys Canyon-Melco area (centre) and for samples analysed for Tl isotopes (right column); symbols as in Figure 4; dotted lines indicate range of continental crust abundance estimates [61]; solid lines in ε205Tl plots indicate mantle range [31,41]; geochemical data reported in the Supplementary Material.
Minerals 08 00548 g005
Figure 6. A box and whisker plot showing Tl abundance by lithology in all samples (n = 350) from the Bingham district, with samples grouped into broad lithological categories. “Boxes” denote the first and third quartile values, while the intermediate lines indicate median Tl contents; whiskers extend to the highest and lowest values, excluding outliers (circles), which are >1.5 times the inter-quartile range higher and lower than the third quartile and first quartile measurements, respectively; the solid squares indicate one measurement for a given lithology; colors as in Figure 4 and Figure 5; pale blue color indicates recrystallized/silicified sedimentary lithologies. Note log-scale on y-axis; shaded box indicates range of estimates for Tl content of bulk continental crust [61].
Minerals 08 00548 g006
Figure 7. A plot of Tl concentration (μg/g) vs ε205Tl in samples from the Bingham Canyon district (this study) compared to literature data: 1 [56]; 2 [52,53]; 3 [39,40]; 4 [48]; 5 [54]; 6 [57]; 7 [55]; 8 [36].
Minerals 08 00548 g007
Figure 8. Map of sample locations in the Bingham district, showing (a) Tl concentration (µg/g) and (b) ε205Tl value in all analysed samples, using color (a,b) and symbol size (a only); ranges in concentration for the bulk continental crust (values from [61]) and in rocks from the Collahuasi Formation (values from [48]) are also marked on the key for reference, as is the range of ε205Tl for the mantle [31,41]; dashed lines delineate the extents of the main intrusive bodies of the Bingham complex; locations of Melco and Barneys Canyon mines also shown; samples with high Tl concentrations are shown with abbreviated lithologies as follows: CaSst = calcareous sandstone; Cht = chert; Fbx = fault breccia; Hf = hornfels; Lbx = limestone breccia; LP = latite porphyry; Lst = limestone; Mz = monzonite; Qbx = quartzite breccia; Qzt = quartzite; Rhy = rhyolite; Sk = skarn; SLst = silicified limestone; Sst = sandstone.
Minerals 08 00548 g008
Figure 9. Modelled % of total Tl transported by Cl and HS anions in hydrothermal fluids plotted against fluid pH in reducing conditions at temperatures between 100–300 °C; modified after [63].
Minerals 08 00548 g009
Table 1. Thallium concentrations and isotope compositions in samples from the Bingham district, compared to standard reference materials; values of 2σ in italics originally returned values <<0.6, and were consequently assigned a more conservative value on the basis of multiple analyses of the Aldrich standard.
SampleLithologyDescriptionTlWR (ng/g)ε205TlTl (ng/g)# Runs# Sessions# Dissolutions
Bingham Canyon
BC11MB116SandstoneWeakly calcareous white sandstone on Middle Canyon Road20−4.20.68811421
BC11MB111Silicified limestoneSilicified, grey Jordan limestone cut by thin calcite veinlets450−2.90.645976211
BC11MB101Latite porphyryFeldspar-phyric (± biotite) latite porphyry dyke with disseminated chlorite alteration130−8.80.61384155211
BC11MB102Silicified limestone brecciaBrecciated, silicified limestone19101.30.6493247211
BC11CW020QuartziteMassive, pale grey, fine-grained quartzite2100.91.127420321
BC12LZ527Latite porphyryLatite porphyry with K-feldspar altered plagioclase, strong propylitic alteration and quartz-pyrite veins700−2.90.6168778321
BC11DC007cLamprophyreLamprophyre containing minor bornite and chalcopyrite and late quartz-calcite veins820−3.60.61525124511
BC11DC005aMonzonitePropylitically-altered monzonite, with early barren quartz veins cut by quartz-molybdenite-Cu-Fe-sulfide veins (5–20 mm wide)860−1.30.6142085411
BC12JT601Recrystallised calcareous sandstoneWeakly-bedded, recrystallised, and fractured calcareous sandstone, containing calcite-pyrite veins120−3.30.620730321
BC11MB155Silicified limestoneSilicified limestone from above Northern Haul Road, cut by numerous thin (up to 1 cm) coarse crystalline calcite veins300.20.825623511
BC11MB152bQuartziteQuartzite from layer below limestone; contains spots of red-brown mineral, possibly Fe-carbonate-after-pyrite90−3.40.63415321
BC11MB151QuartziteMassive quartzite50−1.50.613814211
BC11MB146Quartzite brecciaQuartzite breccia, with angular to sub-rounded quartzite clasts in calcite-dominated crystalline cement47907.21.872131108211
BC11DC164Quartzite breccia0.5 m-wide breccia zone in quartzite surrounding shear band; clayey matrix obscures clast-matrix/cement relationship120−2.30.735812321
Barneys Canyon/Melco
BC11CW089bVeined limestoneDark grey limestone with stockwork of calcite veins (between 1-10 mm in width)31590−6.50.65072634211
BC11MB184Quartzite brecciaSilicified, solution-collapse breccia in quartzite, located immediately NE of Melco pit7906.00.669833421
BC11MB185Quartzite brecciaBrecciated quartzite containing discontinuous calcite veinlets; 1270−16.40.71545137722
BC11CW079QuartzitePale beige, hard, finely crystalline quartzite containing stockwork of quartz veinlets (0.–2 mm wide) from Barney’s Canyon mine, sampled away from most intense clay alteration and fracturing1780−3.10.682419211
BC11CW080bDolomitic nodulePossibly bituminous dolomite nodules with large (up to 10 cm) open cavities with inwards-growing calcite crystals (up to 4 mm long)60800.00.64650499211
Standards
AGV-2 (this study) −2.80.527192222
AGV-2 [43] −3.00.62673515n/a8
Aldrich (this study) −0.80.6n/an/a362n/a
Aldrich [31] −0.80.3n/an/a133n/an/a

