Article

Nanoscale Study of Clausthalite-Bearing Symplectites in Cu-Au-(U) Ores: Implications for Ore Genesis

1
School of Chemical Engineering, The University of Adelaide, Adelaide, SA 5005, Australia
2
Adelaide Microscopy, The University of Adelaide, Adelaide, SA 5005, Australia
*
Author to whom correspondence should be addressed.
Minerals 2018, 8(2), 67; https://doi.org/10.3390/min8020067
Submission received: 19 January 2018 / Revised: 9 February 2018 / Accepted: 9 February 2018 / Published: 13 February 2018
(This article belongs to the Special Issue Se-Bearing Minerals: Structure, Composition, and Origin)

Abstract

:
Symplectites comprising clausthalite (PbSe) and host Cu-(Fe)-sulphides (chalcocite, bornite, and chalcopyrite) are instructive for constraining the genesis of Cu-Au-(U) ores if adequately addressed at the nanoscale. The present study is carried out on samples representative of all three Cu-(Fe)-sulphides displaying clausthalite inclusions that vary in size, from a few µm down to the nm-scale (<5 nm), as well as in morphology and inclusion density. A Transmission Electron Microscopy (TEM) study was undertaken on foils prepared by Focussed Ion Beam and included atom-scale High-Angle Annular Dark-Field Scanning TEM (HAADF-STEM) imaging. Emphasis is placed on phase relationships and their changes in speciation during cooling, as well as on boundaries between inclusions and host sulphide. Three species from the chalcocite group (Cu2–xS) are identified as 6a digenite superstructure, monoclinic chalcocite, and djurleite. Bornite is represented by superstructures, of which 2a and 4a are discussed here, placing constraints for ore formation at T > 265 °C. A minimum temperature of 165 °C is considered for clausthalite-bearing symplectites from the relationships with antiphase boundaries in 6a digenite. The results show that alongside rods, blebs, and needle-like grains of clausthalite within the chalcocite that likely formed via exsolution, a second, overprinting set of replacement textures, extending down to the nanoscale, occurs and affects the primary symplectites. In addition, other reactions between pre-existing Se, present in solid solution within the Cu-(Fe)-sulphides, and Pb, transported within a fluid phase, account for the formation of composite, commonly pore-attached PbSe and Bi-bearing nanoparticles within the chalcopyrite. The inferred reorganisation of PbSe nanoparticles into larger tetragonal superlattices represents a link between the solid solution and the symplectite formation and represents the first such example in natural materials. Epitaxial growth between clausthalite and monazite is further evidence for the interaction between pre-existing Cu ores and fluids carrying REE, P, and most likely Pb. In U-bearing ores, such Pb can form via decay of uranium within the ore, implying hydrothermal activity after the initial ore deposition. The U-Pb ages obtained for such ores therefore need to be carefully assessed as to whether they represent primary ore deposition or, more likely, an overprinting event. A latest phase of fluid infiltration is the recognised formation of Cu-selenide bellidoite (Cu2Se), as well as Fe oxides.

1. Introduction

Selenides, often with associated tellurides, are common accessories in a wide variety of base and precious metal mineral deposits [1,2,3]. Despite their modest proportions, their speciation and mineral chemistry can be important sources of information that can help constrain conditions and mechanisms of ore genesis.
The lead selenide, clausthalite (PbSe), is the most common selenide mineral [4] and a relatively common accessory phase in copper sulphide and uranium deposits of different genetic types (e.g., [5,6,7]). In hydrothermally derived ore systems, clausthalite may form synchronous to the initial mineralization event from hydrothermal fluids, or within uranium-bearing deposits, in which clausthalite is formed from Pb, derived from the decay of U, and available selenium within the rock [8]. The occurrence of clausthalite within Cu-(Fe)-sulphides, notably bornite, is generally interpreted as exsolution related to the cooling of broader solid solution fields (e.g., [9]). Liu and Chang [10] described phase relations in the system PbS-PbSe-PbTe, showing the temperature dependence of Pb-chalcogenide compositions, and thus their potential value as indicator minerals that can aid understanding of how an ore formed. Experimental studies of the system Pb-Se-Cu-(Fe)-S are, however, lacking, emphasizing the difficulty in modelling the evolution of observed assemblages in terms of phase relationships.
Clausthalite, as well as other selenides and tellurides, have been noted as trace minerals in iron oxide copper gold (IOCG) deposits (e.g., [11]) and other ore systems with comparable sulphide mineralogy (e.g., the Polish Kupferschiefer) [12]. The Mesoproterozoic Olympic Cu-Au Province of South Australia [13] is arguably the world’s largest IOCG province and is host to the 10 billion-tonne Olympic Dam Cu-U-Au-Ag deposit [14]. A dozen or so selenide and telluride mineral species, including clausthalite and altaite (PbTe), are documented from the Olympic Dam. A similar range of minerals are identified in other deposits or prospects within the province, although these are poorly documented in the published literature. Although seldom greater than a few microns in size, selenides and tellurides are typically hosted within Cu-(Fe)-sulphides throughout the province.
In this contribution, we characterize world class examples of nano- to micron-scale symplectite intergrowths between clausthalite and Cu-(Fe)-sulphides (chalcocite, bornite, and chalcopyrite). Their small size necessitates an approach that bridges observations at the micron- and nanoscales. The overarching objective is to document the relationships between Pb-chalcogenides and host Cu-(Fe)-sulphides down to the atomic scale. We demonstrate that Pb-chalcogenide morphology, speciation, and textural relationships with host minerals give valuable insights into processes of ore formation and can also provide information on the fundamental nature of trace element incorporation into minerals. We go on to discuss the implications that the prevailing symplectite textures have for ore evolution.

2. Background

Copper-Au mineralisation in the Olympic Cu-Au Province is suggested to have formed synchronous to the ca. 1600–1585 Ma emplacement of Hiltaba Suite granites and eruption of co-magmatic Gawler Range Volcanics (GRV) [13,15]. This event is associated with initial magmatic-hydrothermal activity leading to the deposition of Cu-Au mineralisation within the region. However, within the Olympic Dam Cu-Au-(U) deposit, there is widespread textural and isotopic evidence for later remobilisation, replacement, and recrystallization of ore-forming minerals, e.g., [16,17,18]. These phenomena may relate to one or more tectonothermal events, including the intrusion of the regional ~820 Ma Gairdner Dyke Swarm, which are recognised in the region [19,20].
Complete miscibility exists in the system PbS–PbSe-PbTe above 500 °C. Immiscibility between galena-clausthalite and altaite is complete below 300 °C, with the critical temperature at which PbS and PbSe separate calculated at ~100 °C [10]. Hydrothermal origins with temperatures above 100 °C during Pb-chalcogenide mineralisation should therefore result in the preservation of the complete PbS-PbSe series, giving access to both chalcogen elements S and Se, with miscibility gaps appearing below 100 °C [10].
Selenium, substituting for sulphur, is a common minor element in most common sulphides. In some cases, there is complete isomorphous solid solution between the sulphide and analogue selenide, e.g., chalcopyrite-eskebornite (CuFeS2-CuFeSe2). Trace element analysis of Cu-(Fe)-sulphides typically show the presence of hundreds and, locally, thousands of mg/kg of Se within the crystal lattice [21,22,23]. In contrast, concentrations of lead in common Cu-(Fe)-sulphides are often erratic and readily interpretable in terms of inclusions of galena and other Pb-bearing minerals, rather than lattice-bound lead.
Textural relationships among dominant Cu-(Fe)-sulphides (chalcopyrite, bornite, chalcocite) and the associated phases djurleite, digenite, and covellite at the micron- to nanoscale in Cu ores from the Olympic Dam have been described by Ciobanu et al. [24]. Analogous bornite-chalcocite, bornite-chalcopyrite and chalcopyrite-pyrite assemblages are observed throughout the orebody from which the samples were taken (authors’ unpublished data).
A summary of Cu-(Fe)-sulphide and associated species discussed in this contribution and their crystal structure parameters are presented in Table 1. High- and low-temperature species are listed with their corresponding symmetry groups. Within the Cu-(Fe)-sulphides, phase transitions from high to low T are well defined with either cubic (bornite, digenite) or hexagonal (chalcocite) symmetry, indicating the primitive parent structure [24]. Although other minerals listed in Table 1 may display slight variation in their cell parameters a, b, and c because of compositional changes via solid solution of minor elements (e.g., in galena, clausthalite and altaite [25], and monazite [26]), they do not show changes in overall symmetry and remain within the same crystal system.

3. Sampling and Analytical Methodology

This research was undertaken on a set of 30 different laboratory-prepared sulphide concentrates from representative crushed ore samples. All instrumentation used in this study is housed at Adelaide Microscopy, The University of Adelaide. Each sample was prepared as a polished block, one-inch in diameter. Polished blocks were examined in reflected light and in backscatter electron (BSE) mode using a FEI Quanta 450 Field Emission Gun scanning electron microscope (SEM) (FEI, Eindhoven, The Netherlands) equipped with a silicon-drift energy-dispersive X-ray spectrometer.
Samples were quantitatively analysed using a Cameca SXFive Electron Microprobe running PeakSite software and equipped with 5 WDS X-ray detectors. The beam conditions were set at an accelerating voltage of 20 kV and 20 nA. Because of the small size of the minerals to be targeted, a focussed 1 μm beam was used for the analysis. The calibration and data reduction were carried out in Probe for electron probe microanalyzer (EPMA) (Cameca, Paris, France), distributed by Probe Software Inc. The calibration was performed on certified natural and synthetic standards from Astimex Standards Ltd. (Toronto, ON, Canada) and P & H Associates (Table A1 in Appendix A). The total acquisition time of all elements on a single point was ~5 min.
Initially, a set of 16 elements were measured: S Kα, Pb Mα, Cd Lα, Bi Mα, As Lα, Se Lα, Fe Kα, Cu Kα, Mn Kα, Ag Lα, Sb Lα, Te Lα, Hg Lα, Zn Kα, Ni Kα, Co Kα. This list was subsequently shorted by removing Cd, Hg, Ni, Co, as these elements were below DL in the samples. The average minimum detection limits (99% CI) in wt % for selenide analysis were: S (0.02), Pb (0.03), Cd (0.05), As (0.05), Se (0.02), Fe (0.02), Cu (0.04), Mn (0.02), Ag (0.06), Hg (0.07), Zn (0.03), Ni (0.03), Co (0.02), Sb (0.03), Te (0.03), Bi (0.07).
Cross-section imaging and TEM sample preparation were performed on a FEI-Helios nanoLab Dual Focused Ion Beam and Scanning Electron Microscope (FIB-SEM). The procedures outlined by Ciobanu et al. [39] were followed in extraction and thinning, to 50–70 nm, of TEM foils by Ga+ ion milling. The TEM foils were attached to Cu or Mo grids via Pt welding. Images were obtained in immersion mode to obtain maximum resolution.
High-resolution (HR)-TEM imaging in bright field (BF) mode and electron diffraction were performed using a Philips CM200 TEM. The instrument is equipped with a LaB6 source and operated at 200 kV and utilises a double-tilt holder and a Gatan Orius digital camera (Gatan Inc., Pleasanton, CA, USA). Energy-dispersive X-ray spectra (EDS) were acquired using an Oxford Instruments X-Max 65T SDD detector running the Aztec software.
High-Angle Annular Dark-Field Scanning Transmission Electron Microscope (HAADF-STEM) (FEI, Eindhoven, The Netherlands) imaging was performed using an ultra-high resolution, probe-corrected, FEI Titan Themis S/TEM. This instrument is equipped with the X-FEG Schottky source and Super-X EDS geometry (see also [40,41,42]) The Super-X EDS detector provides geometrically symmetric EDS detection with an effective solid angle of 0.8 Sr. Probe correction delivered sub-Ångstrom spatial resolution, and an inner collection angle greater than 50 mrad was used for HAADF experiments using the Fischione HAADF detector.
The diffraction measurements were performed using DigitalMicrographTM 3.11.1 (Gatan Inc., Pleasanton, CA, USA) and Winwulff© 1.4.0 (JCrystalSoft, Livermore, CA, USA) software. Publicly available data from the American Mineralogist Crystal Structure Database [43] were used for indexing of the electron diffractions. Crystal structure simulations were carried out using CrystalMaker® version 9.2.7 (CrystalMaker Software Ltd., Begbroke, Oxon, UK) and STEMTM for xHREM software (HREM Research Inc., Higashimastuyama, Japan).

4. Results

4.1. Characterisation of Symplectite Textures

All three Cu-(Fe)-sulphides (chalcopyrite, bornite, and chalcocite) display symplectitic textures containing clausthalite. The petrographic relationships within the symplectites were examined in backscatter electron (BSE) and secondary electron (SE) modes (SEM and FIB-SEM, respectively), and show a wide range of textures with respect to the density of the component phases, size, distribution, etc.
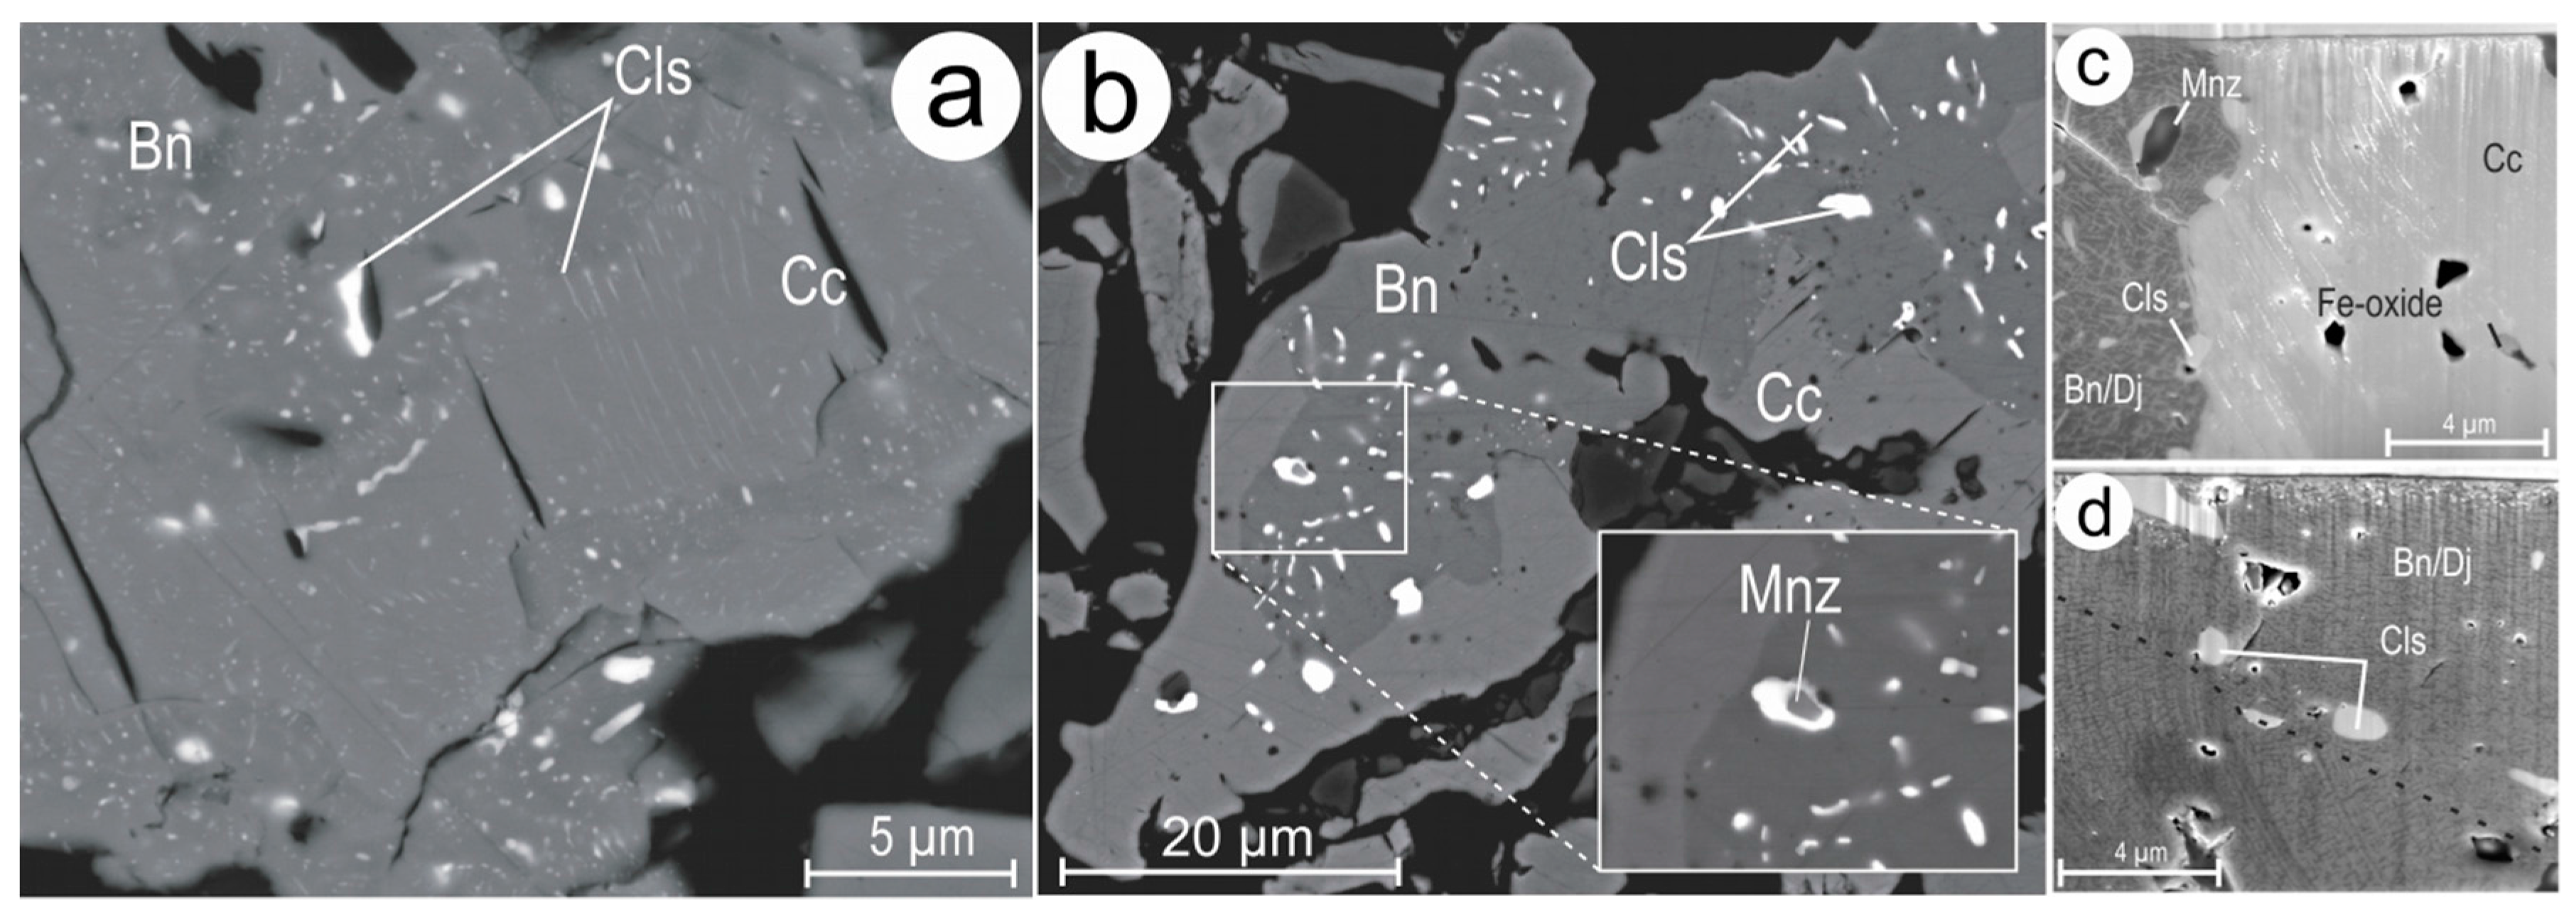
In the absence of other Cu-(Fe)-sulphide host minerals, chalcopyrite displays highly variable relationships with respect to the grain size of clausthalite, with some bleb-like grains of clausthalite as large as 10 µm but others down to fine lamella in the order of 0.01–0.1 µm. Fine lamellae of clausthalite are regularly associated with cracks and pore spaces within the chalcopyrite and tend to radiate from such features (Figure 1a,b). In one sample, chalcopyrite hosts a Cu-selenide phase, which is identified as bellidoite (see below). This appears blotchy and porous on the BSE images (Figure 1a), generally in the presence of coarse clausthalite.
Bornite with coarse chalcopyrite lamellae was regularly observed containing clausthalite, as either relatively coarse (2–10 µm) blebs or fine (<1 µm) lamellae, with both the density of the lamellae and their size varying from grain to grain. In grains containing fine lamellae of clausthalite, these lamellae were roughly parallel to one another within specific domains of the grain but also traversed boundaries between bornite and chalcopyrite without any change in orientation (Figure 1c). The coarser blebs of clausthalite displayed only weak orientation with respect to the crystallographic domains in bornite, typically appearing slightly elongated in the direction of the chalcopyrite lamellae within bornite (Figure 1d). The aforementioned Cu-Se phase was observed in a chalcopyrite-bornite sample where it was associated with a clausthalite, forming a composite bleb (Figure 1d).
Clausthalite hosted within chalcocite occurs as both fine (<1 µm) blebs and (<0.1 µm thick) lamellae. Coarser (>1 µm) blebs are less frequent than in chalcopyrite or bornite and are typically associated with a defect in the chalcocite host, such as cracks or pores. Clausthalite lamellae lie parallel to one another, forming discrete domains within the chalcocite host, identifiable by changes in clausthalite orientation (Figure 2).
Symplectites-containing clausthalite are less common in samples containing both bornite and chalcocite than in any of the other host mineral assemblages. Within chalcocite, clausthalite mainly occurs as fine lamellae orientated roughly parallel to one another, forming discrete zones (similar to the clausthalite hosted entirely within chalcocite in the absence of bornite intergrowths, e.g., Figure 2). Clausthalite mainly appears as larger blebs within bornite. At high magnification, bornite is seen to feature nanoscale basket-weave intergrowths of bornite and djurleite and/or chalcopyrite (Figure 3). The location of the clausthalite blebs is associated with the orientation of the djurleite basket-weave texture, in that clausthalite blebs mostly occur along shifts of the basket-weave textural orientation (Figure 3d). Clausthalite blebs are regularly observed at the mutual boundaries between bornite and chalcocite.
Symplectites preserved in bornite in the absence of either chalcopyrite or chalcocite occur as both randomly orientated and well aligned symplectite structures. Only rarely, however, do they contain clausthalite lamellae as fine as those observed in chalcopyrite or chalcocite.

4.2. Compositional Data for Pb-Chalcogenides and Host Cu-(Fe)-Sulphides

The small size and density of clausthalite within the symplectites makes it difficult to obtain high-quality compositional data by EPMA. Nevertheless, the data show: (1) the large (>5 µm) inclusions are end-member clausthalite without measurable sulphur; (2) the absence, at measurable concentrations, of Ag, Sb, or Bi, the most common minor components of Pb-chalcogenides; (3) the presence of measurable Te in the range 0.06–0.17 wt % within all clausthalite analyses. Inclusions of galena in the same Cu-(Fe)-sulphides outside of the symplectites contained no measurable Se.
Compositional data for the bornite and chalcocite (Figure 4) show that both Cu-(Fe)-sulphides consistently deviate from the ideal stoichiometry. This is attributed to the presence of nanoscale intergrowths of other mineral species such chalcopyrite (or more rarely djurleite) in bornite (Figure 3c,d) and digenite in chalcocite. A similar non-stoichiometry is reported for Cu-(Fe)-sulphides from the Olympic Dam [24].

4.3. Nanoscale Characterisation (TEM Data)

4.3.1. Host Sulphides

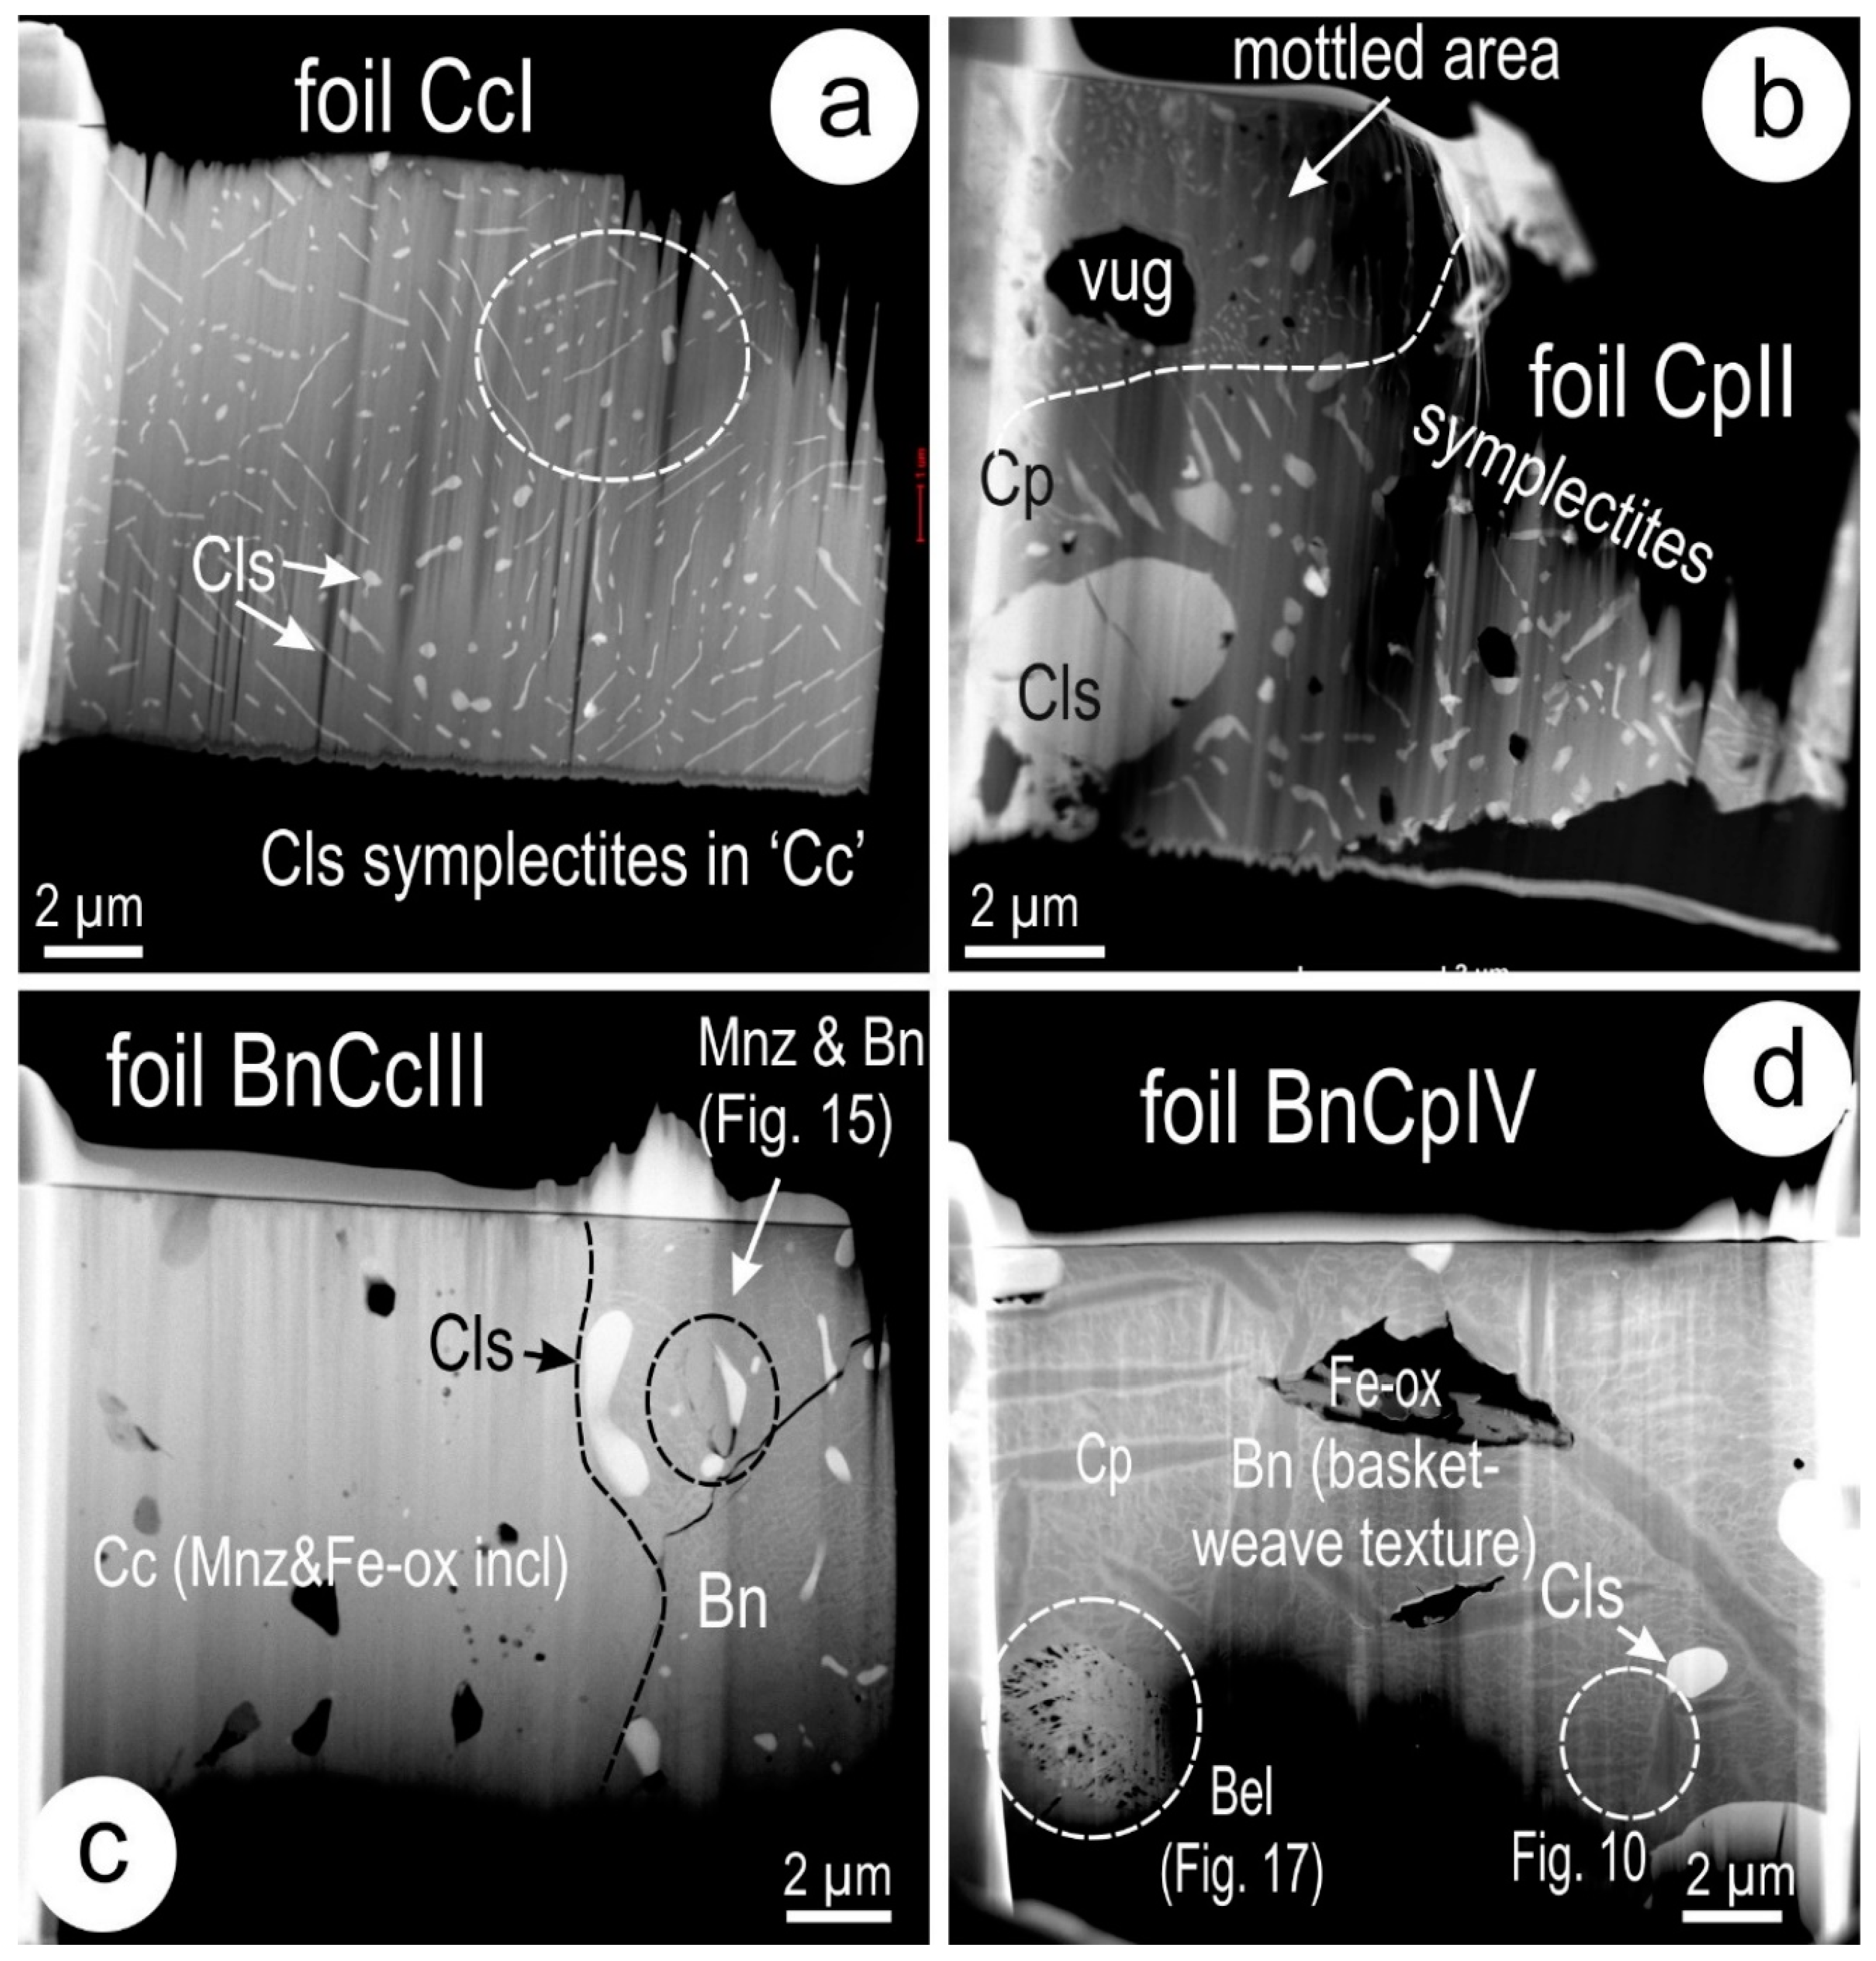
Nanoscale studies were carried out on four study cases using bright-field TEM and HAADF-STEM imaging, electron diffraction, and EDS spot analysis and mapping on four FIB-prepared TEM foils (Figure 5).
The four study cases represent: (1) dense symplectites of clausthalite in chalcocite-digenite (CcI; Figure 5a); (2) chalcopyrite with variable textures with respect to clausthalite inclusions (CpII; Figure 5b); (3) bornite-chalcocite with clausthalite and other mineral inclusions, notably monazite (BnCcIII; Figure 5c); (4) lamellar chalcopyrite in bornite with lesser clausthalite inclusions (BnCpIV; Figure 5d). The latter contains larger pore fillings comprising Fe oxides and a Cu-selenide (bellidoite). These study cases thus cover clausthalite hosted within both single and binary Cu-(Fe)-sulphides associations, with variability in morphology, size, and phase associations.
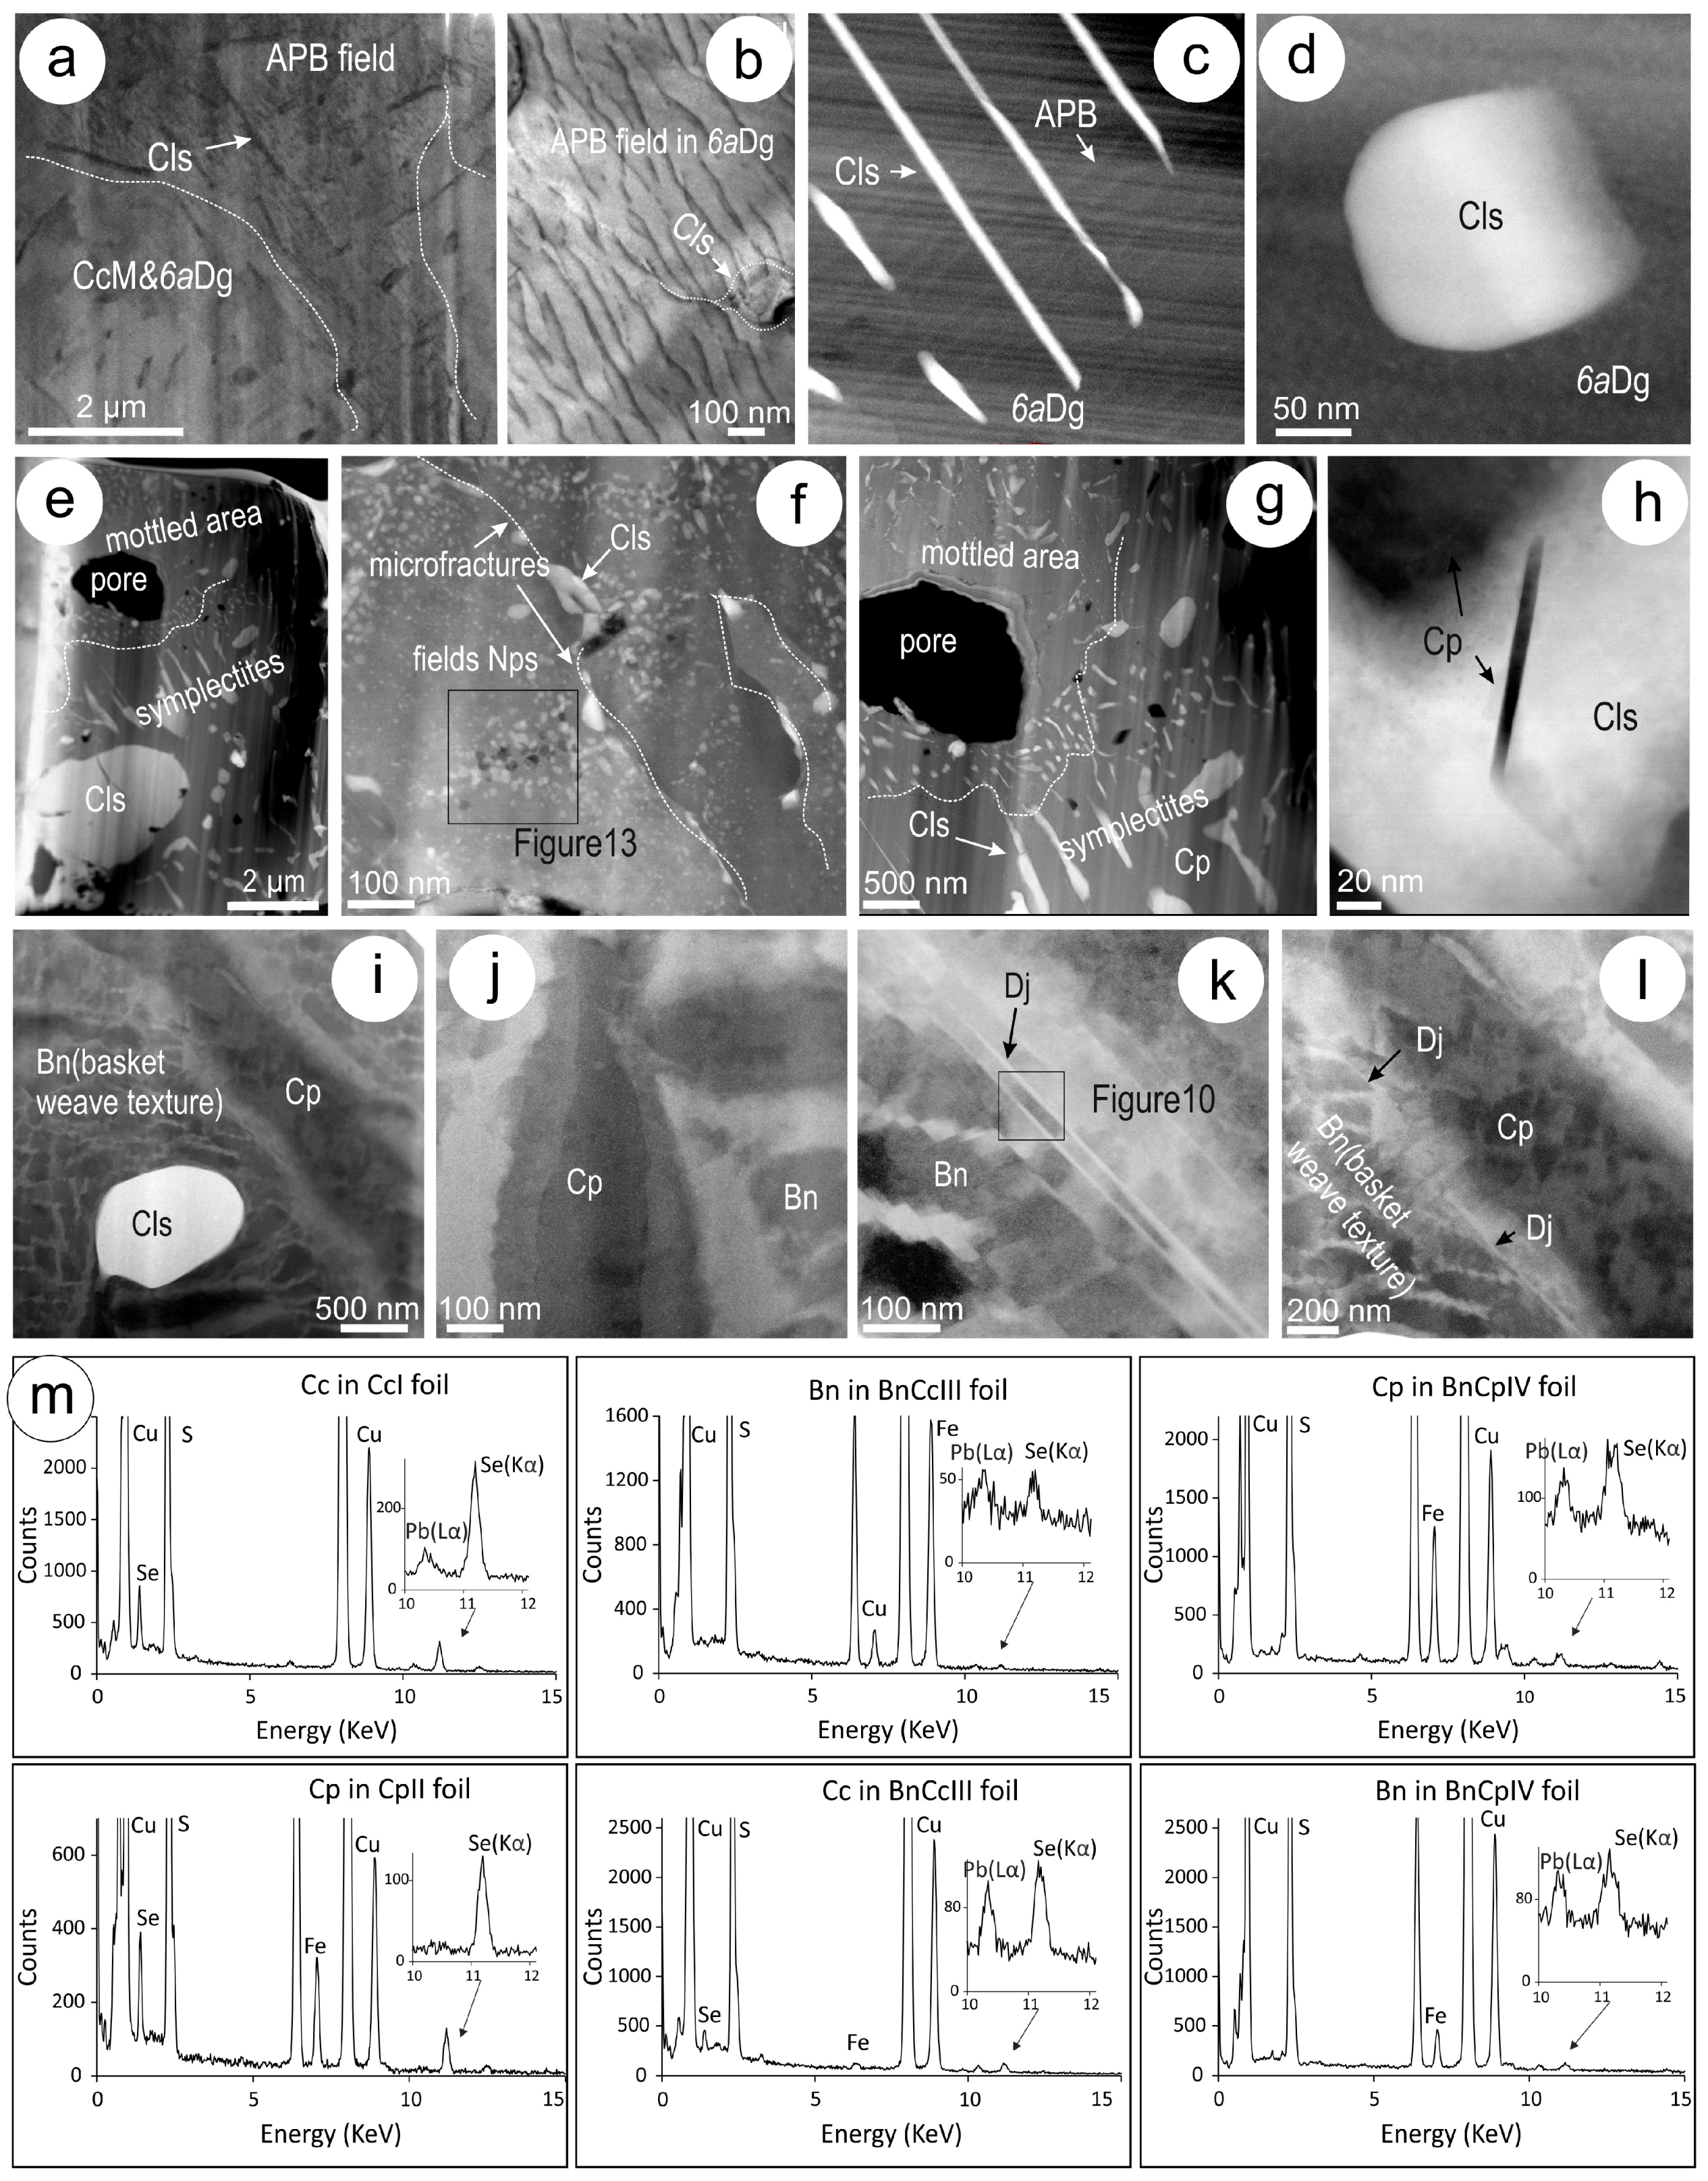
The variability in textures throughout the study cases is illustrated in Figure 6. In CcI, this comprises fields of antiphase boundary (APB) domains with variable orientation (Figure 6a). Similar APB domains are observed also in chalcocite in BnCcIII. Fine 30–80 nm-wide clausthalite inclusions are embedded within, or crosscut these domains (Figure 6b,c). Larger (200–500 nm-sized) inclusions of clausthalite also exist outside the APB domains (Figure 6d). In CpII, mottled textures with dense, fine inclusions occur in domains that are outlined by fine fractures and coarser rods of clausthalite, or surrounding micron-sized pores (Figure 6e,f). Symplectites, as in CcI, are developed outside of such mottled areas (Figure 6g). Needles of chalcopyrite inclusions are found in the coarser clausthalite from such areas (Figure 6h). In BnCpIV, rounded, micron-sized blebs of clausthalite are found at the margins of chalcopyrite lamellae in bornite (Figure 6i). The basket-weave texture on the sample develops around the edges of such lamellae and in the surroundings of needles of djurleite (Figure 6j–l). Such needles can be present within the bornite or adjacent to the chalcopyrite lamellae. HAADF-STEM imaging reveals the patchiness in greyscale intensity across foil BnCpIV; some of this is due to the higher alteration in this case (see below) but also to the effect of FIB milling in and around inclusions and lamellae. EDS compositional data for host sulphides was determined in areas free of inclusions (Figure 6m) and indicates the presence of Se throughout the Cu-(Fe)-sulphides and of Pb in those cases where two sulphides are present (BnCcIII and BnCpIV). In the single phases, minor Pb is noted in Cc1, but very little in CpII.
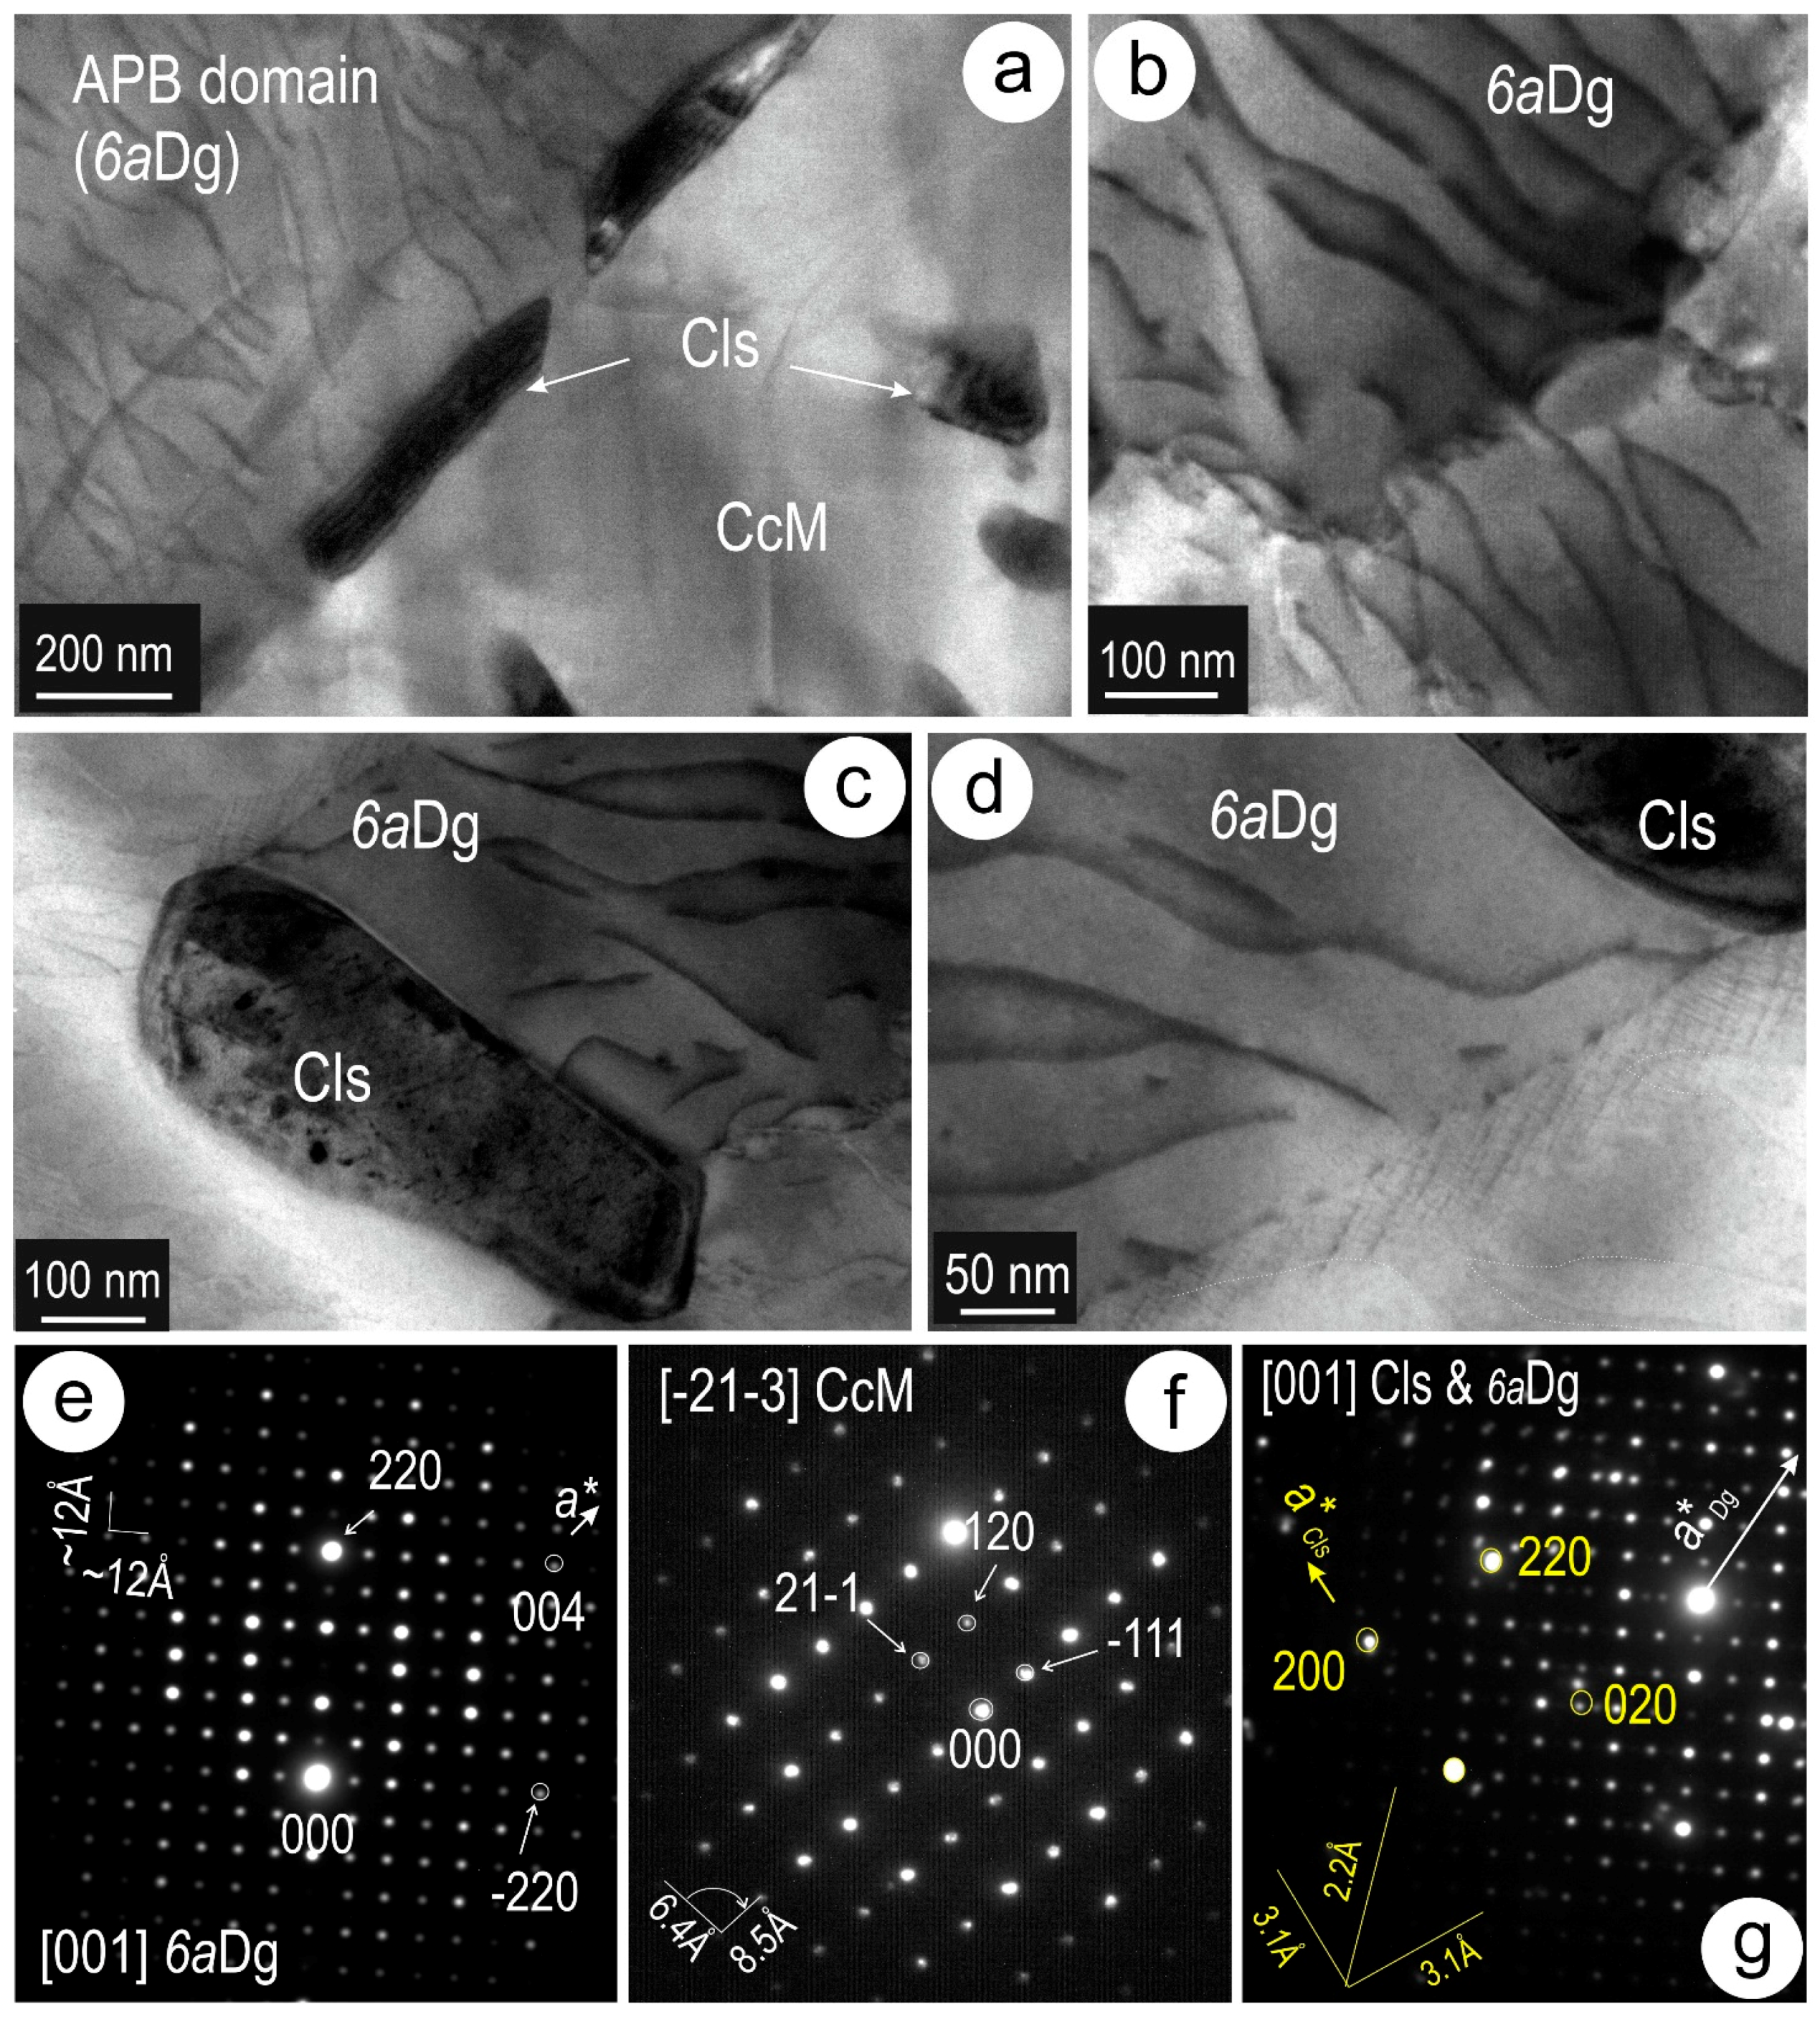
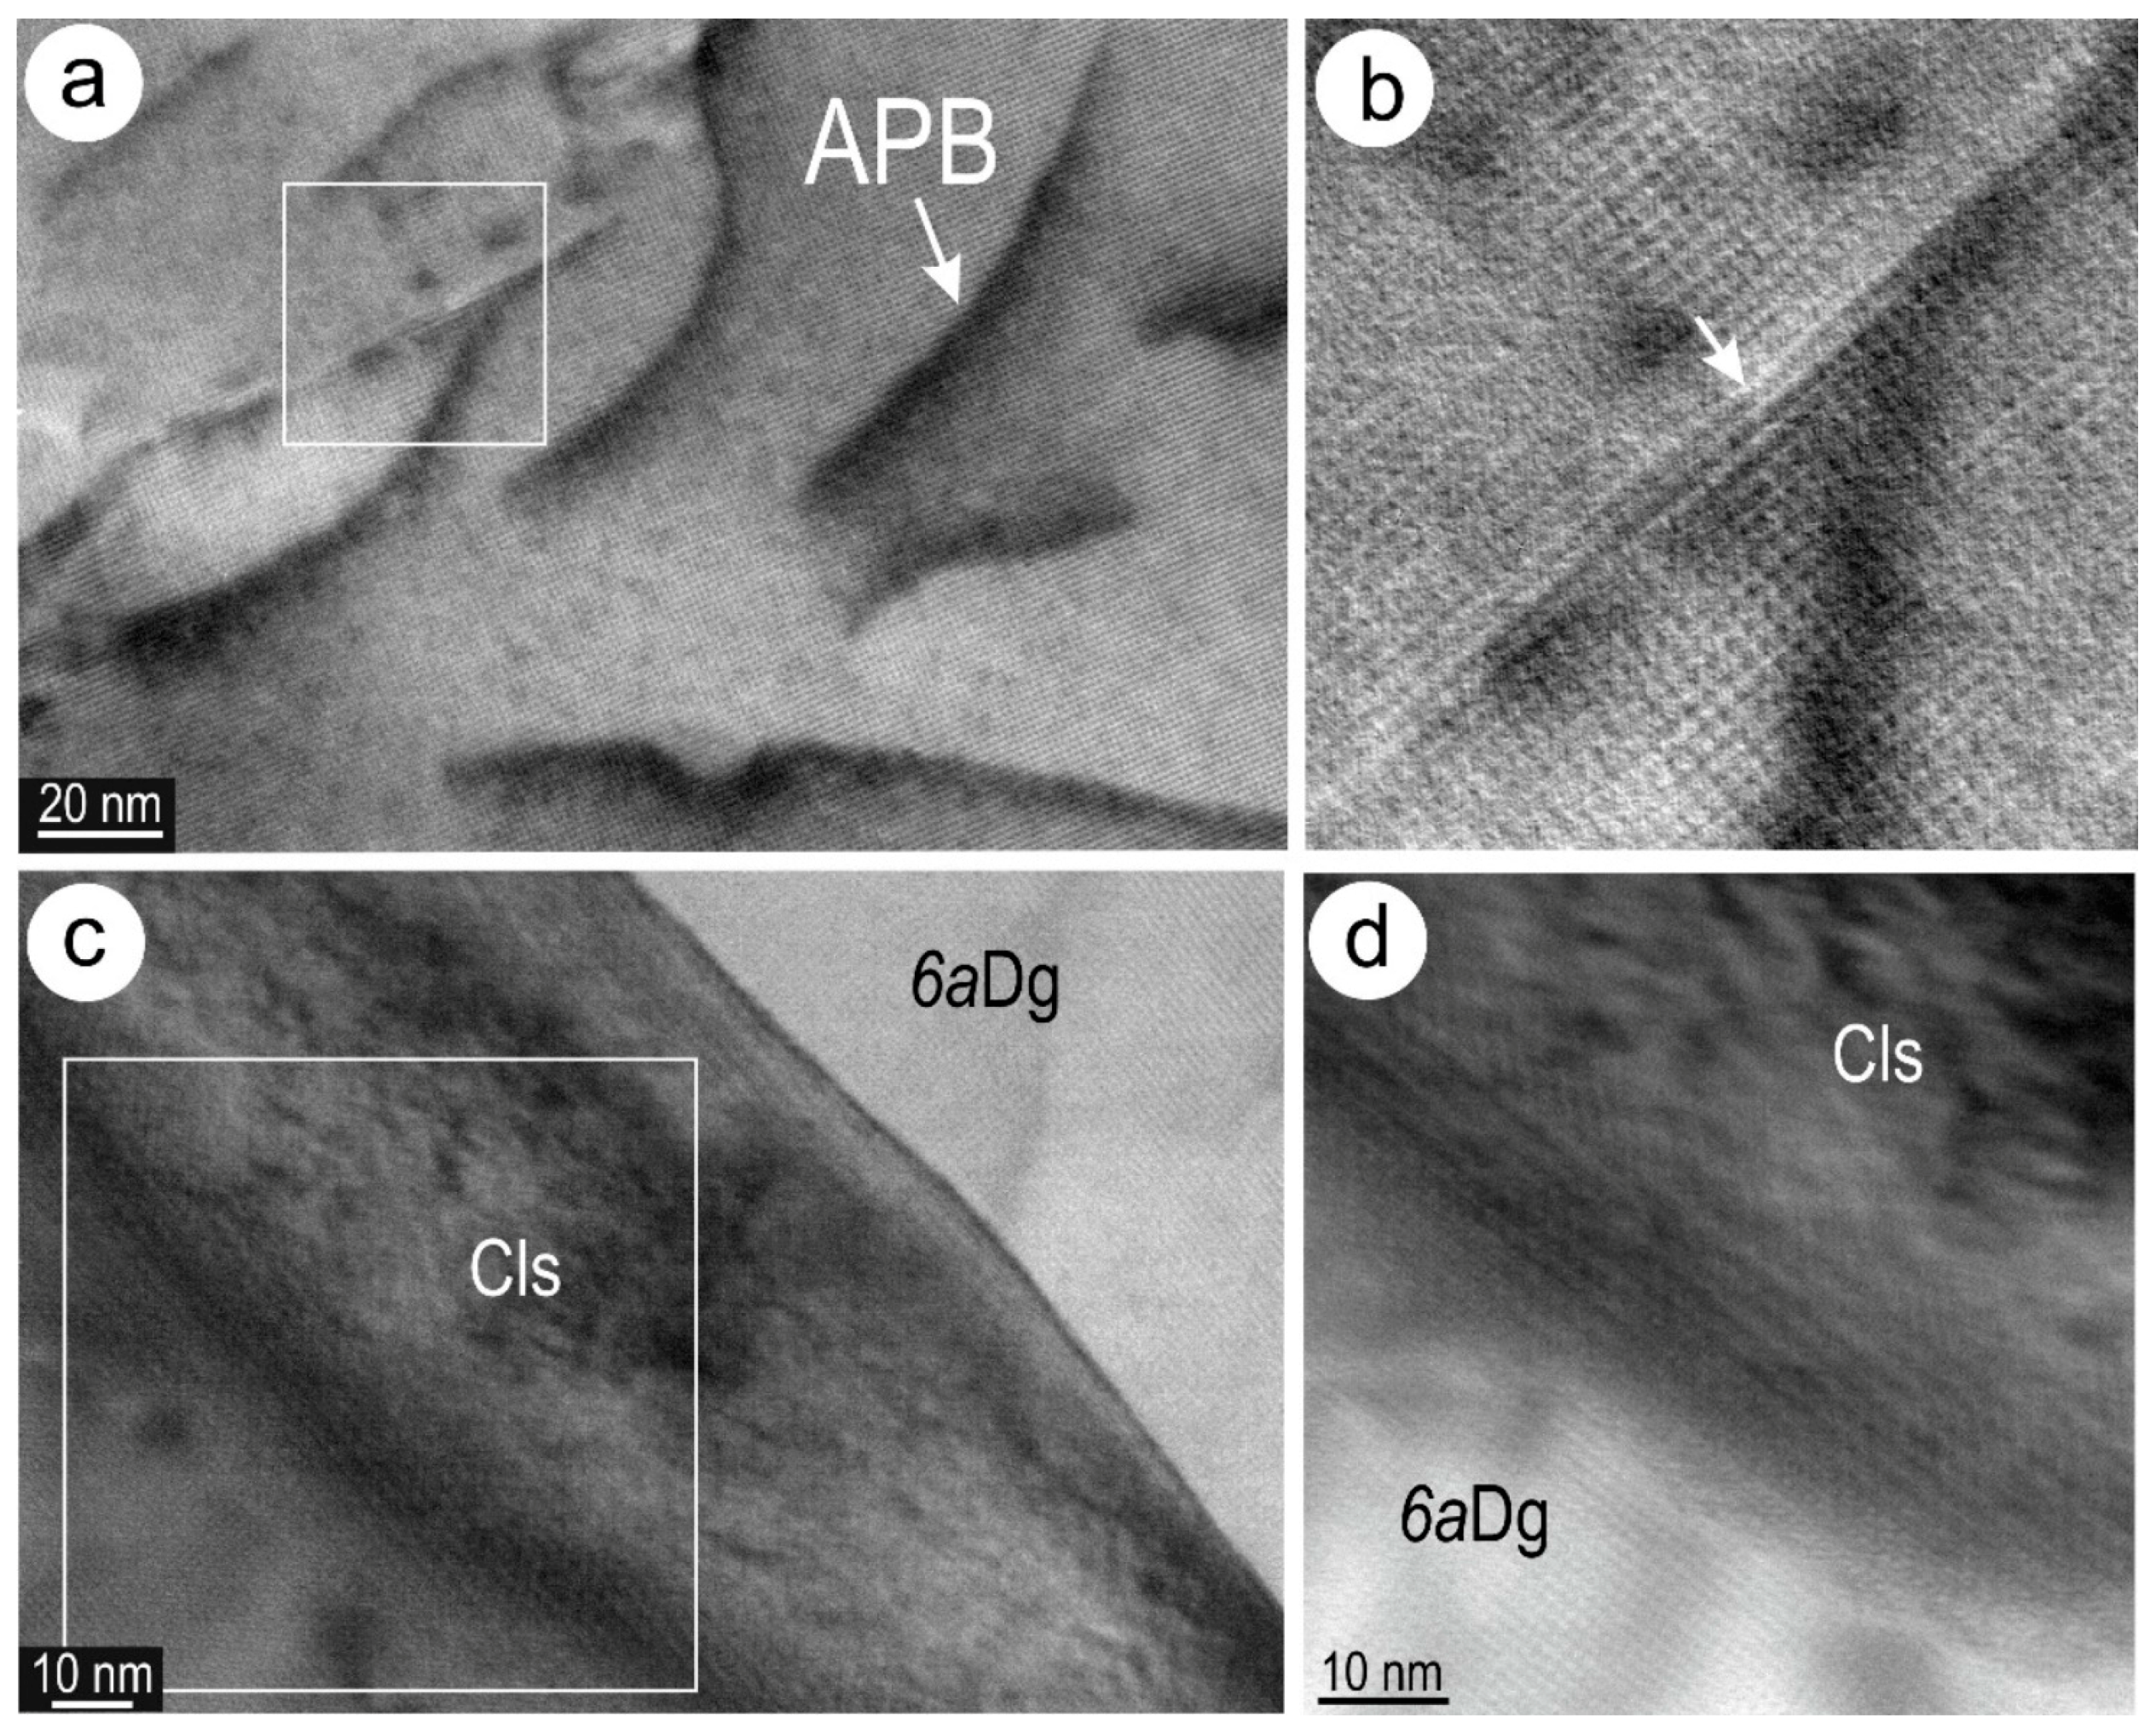
The identity of the species referred to above as “chalcocite” and “bornite”, as well as the characteristics of chalcopyrite in the mottled areas were studied in further detail via TEM imaging down to atomic scale and electron diffractions. In CcI, there are two co-existing species: digenite superstructure and monoclinic chalcocite (Figure 7). Digenite is present in the APB domains, whereas monoclinic chalcocite occurs outside. These domains are outlined in some cases by rods and blebs of clausthalite (Figure 7a) and are marked by different orientation of the sulphides. The APB domains are readily identified by strong contrast in BF-TEM imaging and are observed as dark ripples with variable morphology across internal subdomains (Figure 7b,c). A finer sub-stricture develops in such subdomains, particularly at the tip of the coarser clausthalite inclusions (Figure 7d). Selected area of electron diffraction (SAED) representative of the two species are shown in Figure 7e,f. Digenite is attributed to 6a superstructure on the basis of SAEDs showing an orthogonal lattice with ~12 × ~12 Å repeats, and intensity variation with brighter reflections indicative of a six-fold superlattice. SAEDs obtained over larger clausthalite inclusions (Figure 7g) indicate close-to-coherent orientation between digenite and clausthalite.
Further details of the APB domains and the boundary relationships between clausthalite and digenite are shown as HR BF TEM images in Figure 8. There is a continuation of the lattice fringes across the dark ripples within the APBs on the [001] zone axis of digenite (Figure 8a), but atom-scale defects occur along such ripples (Figure 8b). The two types of boundary (sharp and scalloped) between clausthalite and digenite are clearly observed in BF TEM imaging (Figure 8c). In detail, the scalloped boundaries show a stepwise morphology (Figure 8d).
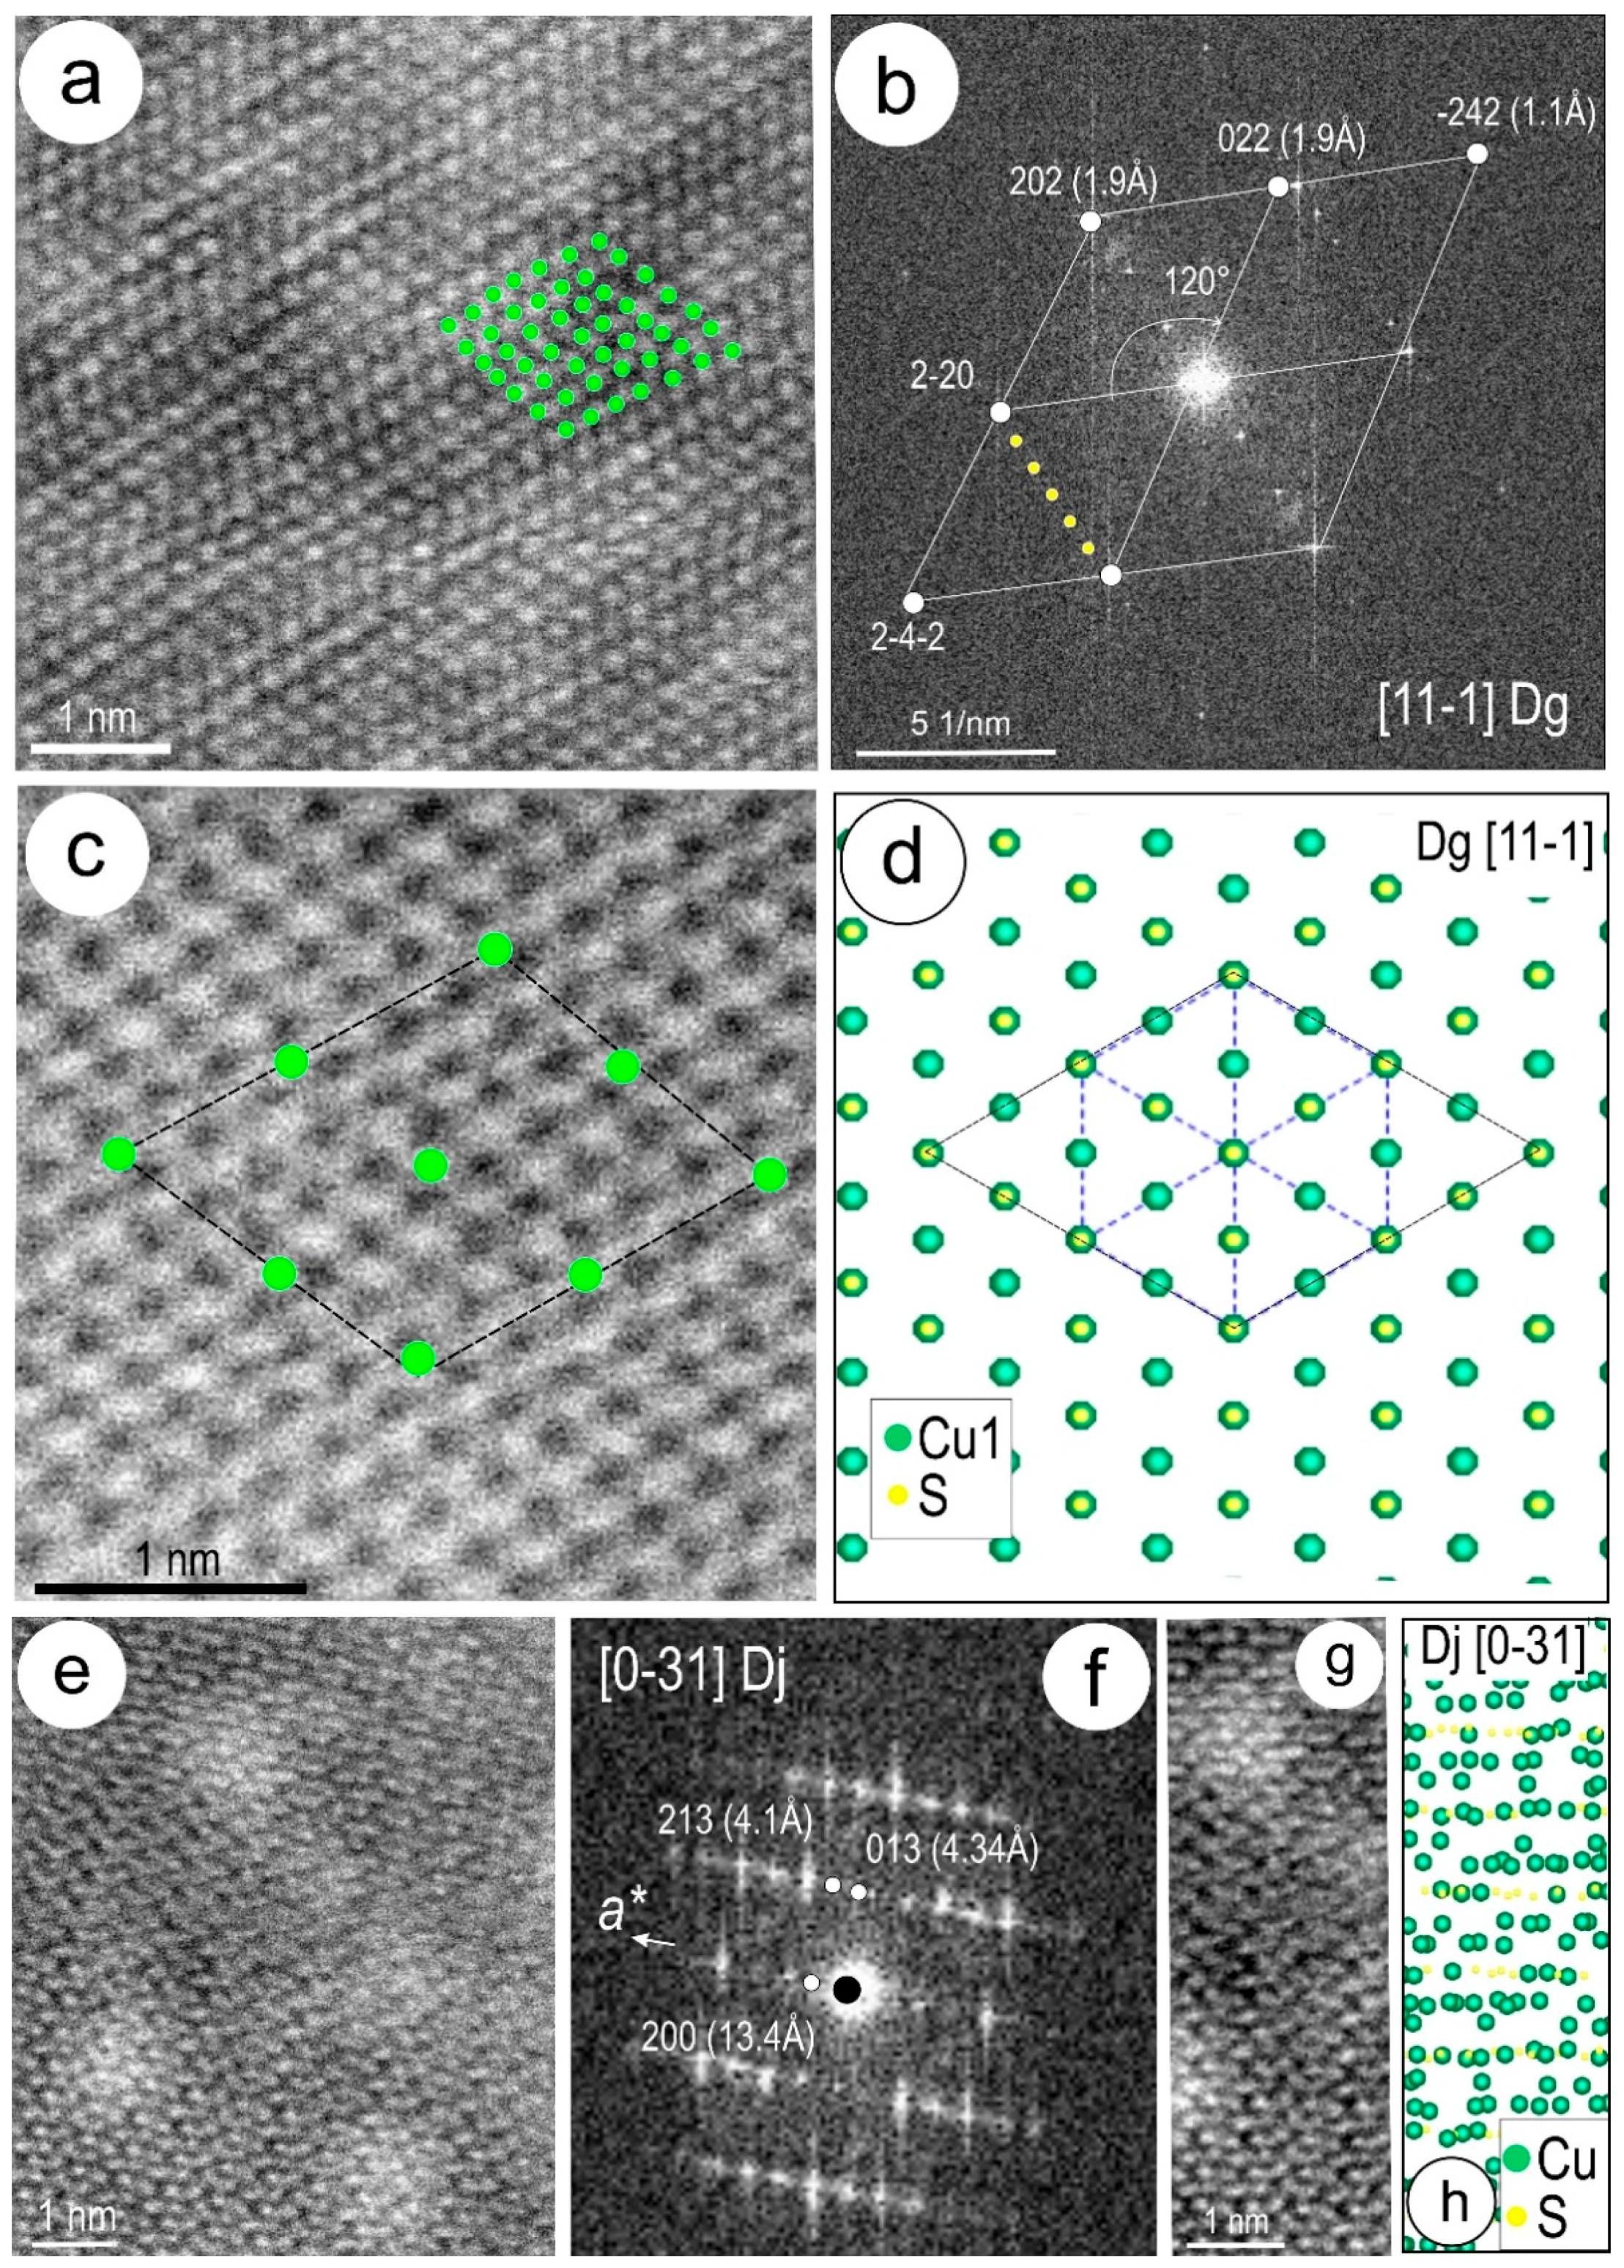
Atomic-scale imaging of digenite (in CcI) and djurleite (in BnCpIV) is shown in Figure 9. HAADF-STEM imaging was undertaken on [11 1 ¯ ] zone axis in digenite, showing bright atomic arrays with an arrangement compatible with the 6a superstructure, as marked by the green atomic motif shown on Figure 9a. The superstructure is highlighted by the presence of satellite reflections with six-fold periodicity between main spots, as shown on Fast Fourier Transform (FFT) images (Figure 9b). The image in Figure 9a also shows defects (stacking faults?). A portion of the corresponding supercell motif for 6a digenite is outlined on Figure 9c. A simplified crystal structural model for high-temperature digenite [37] shows that the distribution of the bright atoms relates to sites with dominant Cu occupancy (Figure 9d). Djurleite down to the [0 3 ¯ 1] zone axis (Figure 9e,f) shows a very different atomic arrangement. The detail in Figure 9g and the crystal model for a single unit cell (Figure 9h) show again that the brighter spots are attributable to Cu atoms, even though the complexity of the crystal structure requires work beyond the scope of the present study.
Bornite in the two foils (BnCcIII and BnCpIV) is represented by various superstructures, of which 2a and 4a are common in both, and 6a was only identified in BnCcIII. Bornite superstructures are documented in Figure 10 in an area highlighted in Figure 6k with the specimen titled to the [10 1 ¯ ] zone axis. These superstructures are imaged from areas outlined by djurleite needles (Figure 10a). Djurelite is coherently intergrown with the bornite, as shown by the FFT (inset on Figure 10a). A close-up of the bornite shows atomic arrays with partitioned spacings (Figure 10b) corresponding to superstructure ordering, as documented by the presence of satellite reflections on the FFTs obtained from such areas. Atomic-scale HAADF-STEM imaging shows subdomains with atom distribution periodicity attributable to the coexistence of 2a and 4a structures (Figure 10c). Superlattice motifs are highlighted by yellow dots in the figure. A further close-up of the atomic arrangement in 4a bornite shows the distribution in a quarter of the unit cell (Figure 10d). Atom distribution arrangements down to [10 1 ¯ ] zone axis for the two superstructures are shown as STEM simulations and crystal-structural models in Figure 10e–h. The 4a superstructure model is based upon eight sites with variable Cu-Fe occupancy ratios as shown, whereas the 2a superstructure has distinct Cu and Fe sites (Figure 10f,h). The STEM models clearly show the distinction between the two superstructures (Figure 10e,g), in which the 2a superstructure shows variable but high intensity for the Cu atoms relative to Fe atoms. In contrast, the 4a superstructure shows relatively even intensity of atoms with higher Cu occupancies (Figure 10e). This is mirrored by the image in Figure 10d for 4a bornite analysed here.
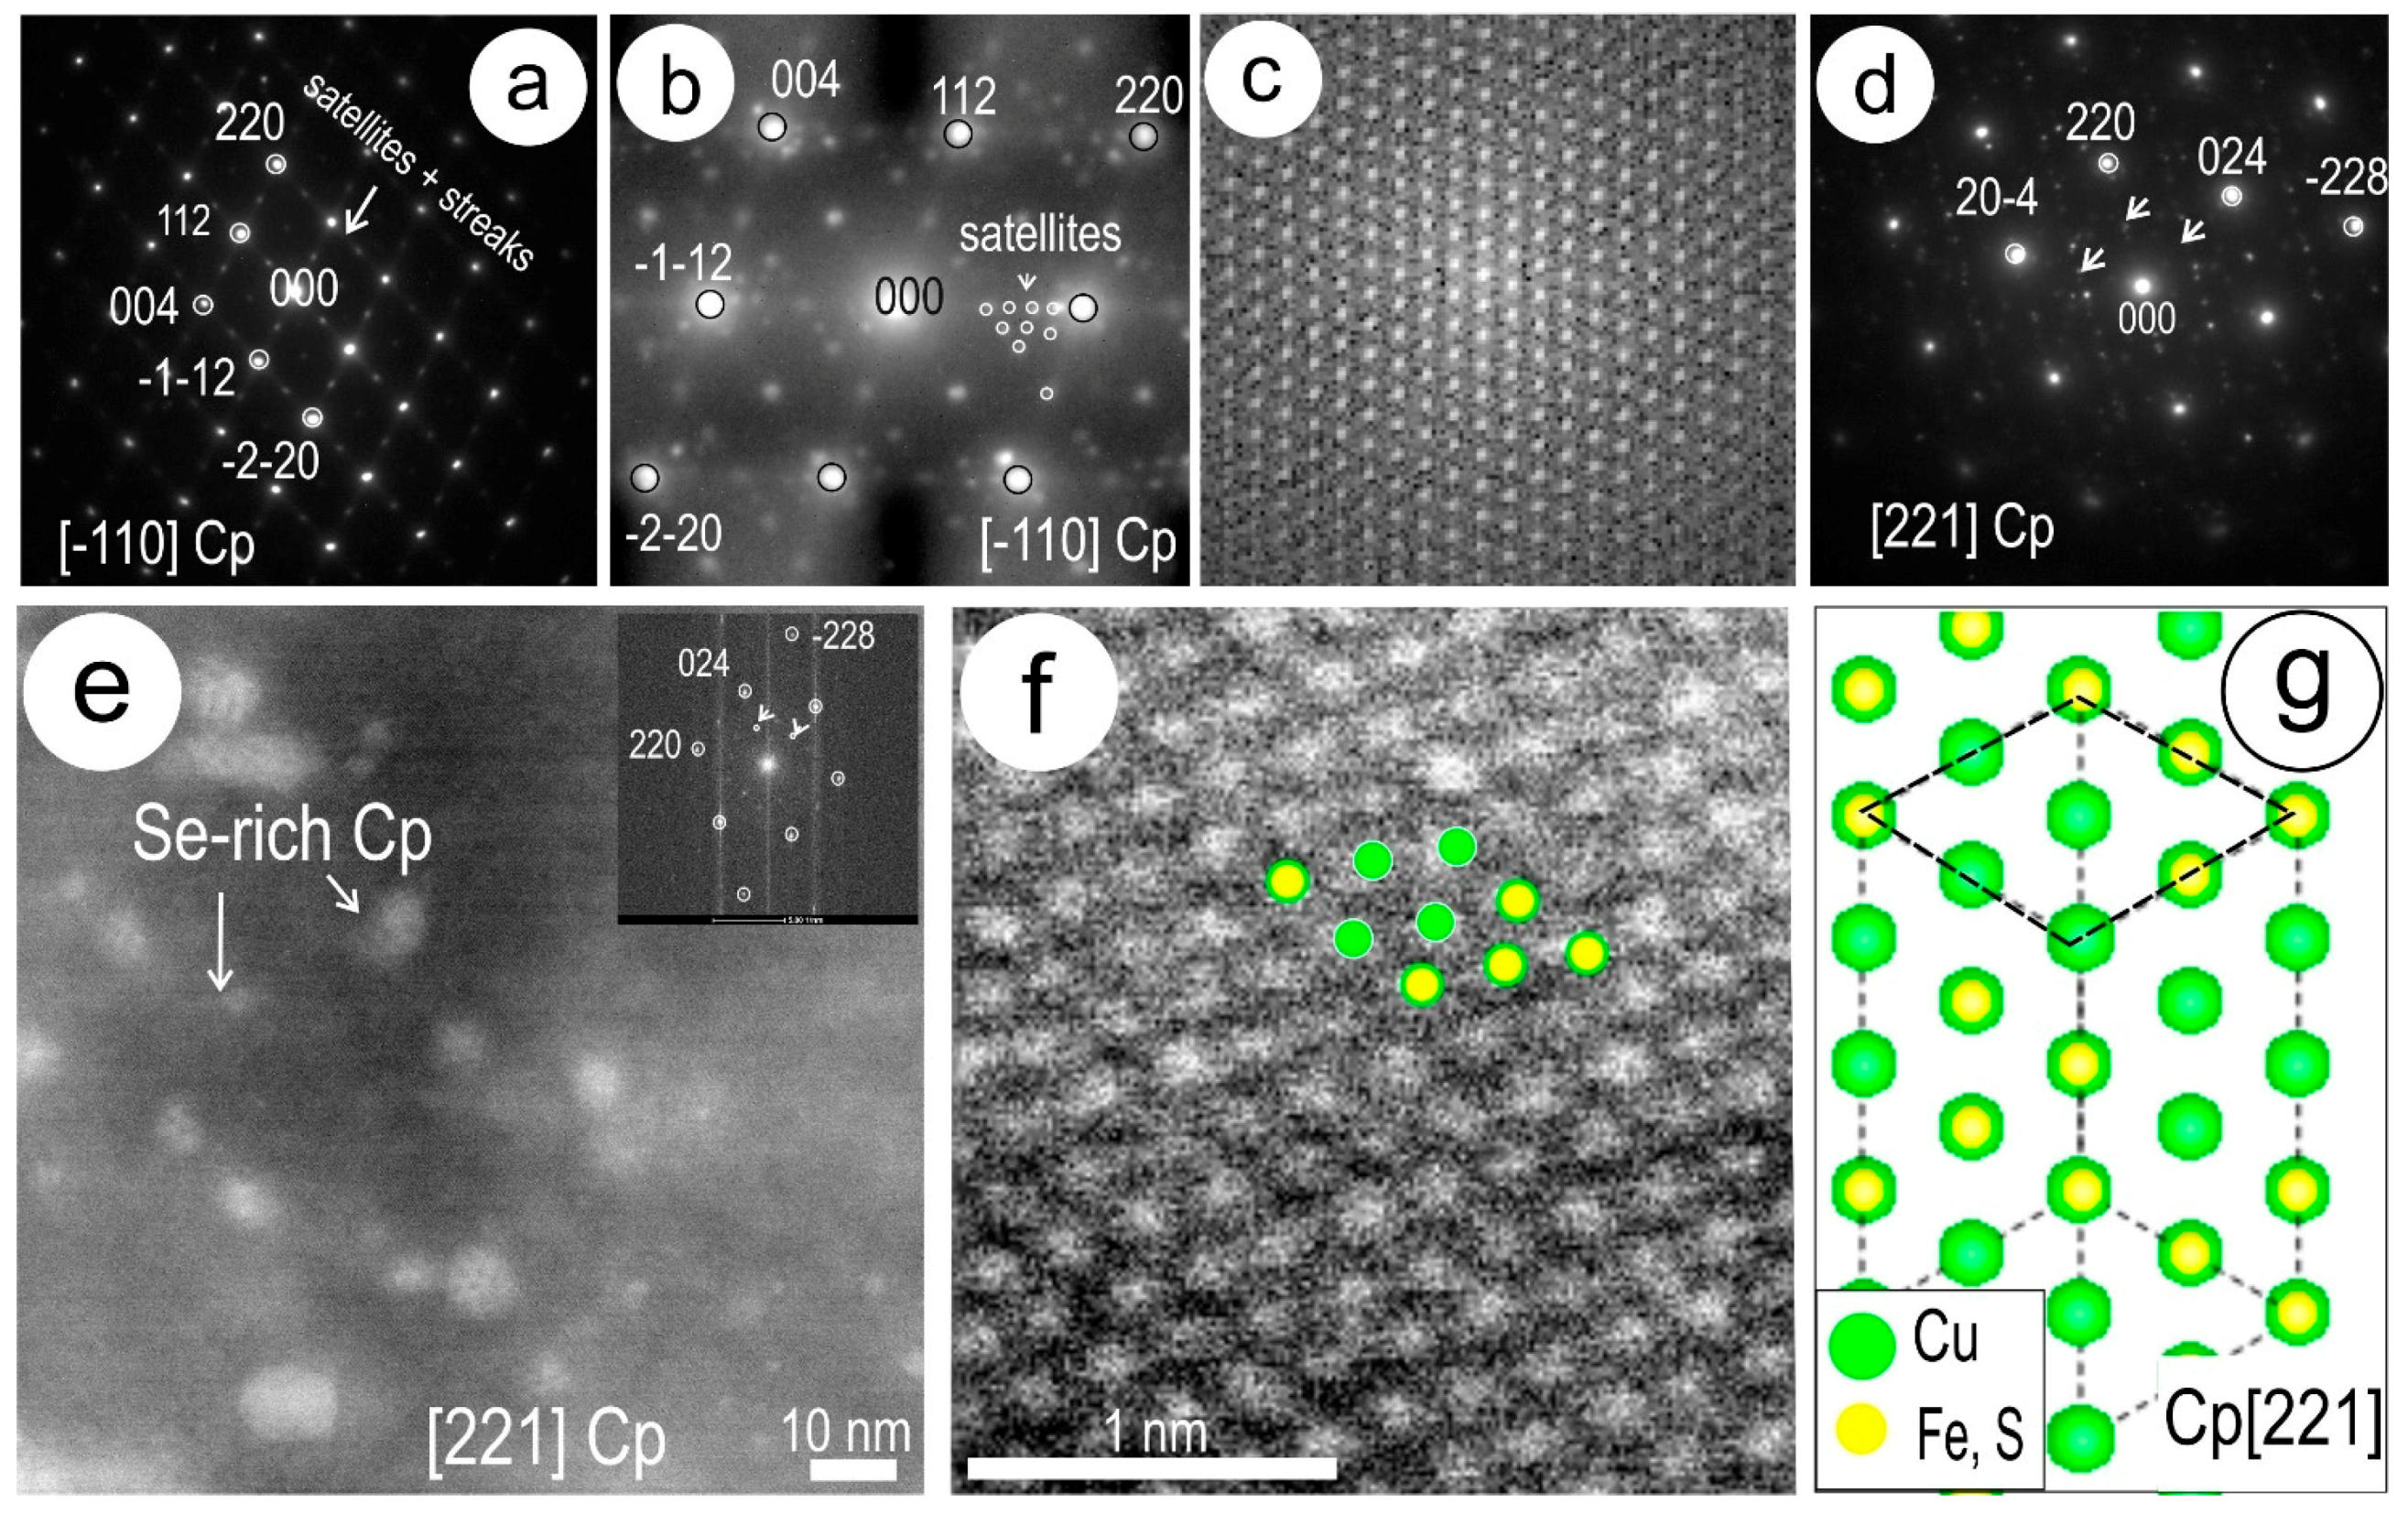
Chalcopyrite was studied in greater detail from mottled areas in foil CpII to better understand the underlying reasons for such textures (Figure 11). SAEDs obtained from such areas show satellite reflections on two zone axes (Figure 11a,b,d). Chalcopyrite down to the [ 1 ¯ 10] zone axis shows an increase in the number of satellite reflections and variable intensity with incommensurate distribution (Figure 11a,b). Image processing of selected areas from such SAEDs with highest density of satellites reveal an ordered pattern (Figure 11c). HAADF-STEM images of chalcopyrite down to the [221] zone axis display bright nm-scale blebs (Figure 11e), whose EDS spectra indicate they are high in Se, yet Pb is at almost negligible concentrations (Figure 6m). Nonetheless, such areas show satellite reflections on both SAEDs and FFTs (Figure 11d and inset on Figure 11e). Bright atoms on the HAADF-STEM image (Figure 11f) correspond to Cu positions on the crystal-structural model (Figure 11g). There is, however, variable intensity in the bright atoms that could represent an overlap between different atom columns, as well as the presence of incipient ordering towards another Se-bearing phase, since the FFTs obtained from such areas show satellite reflections (Figure 11f, inset).

4.3.2. Clausthalite and other Inclusions

Although clausthalite-bearing symplectites are ubiquitous, their sizes and morphologies in each case described here represent a broad spectrum from simple, dense symplectites in foil Cc1 down to clustered nanoparticles in foil CpII and composite inclusions with other phases in bornite-bearing samples. The nanoscale investigation is focussed on these three types of inclusions and their speciation in order to better understand the formation of the clausthalite-hosting sulphides.
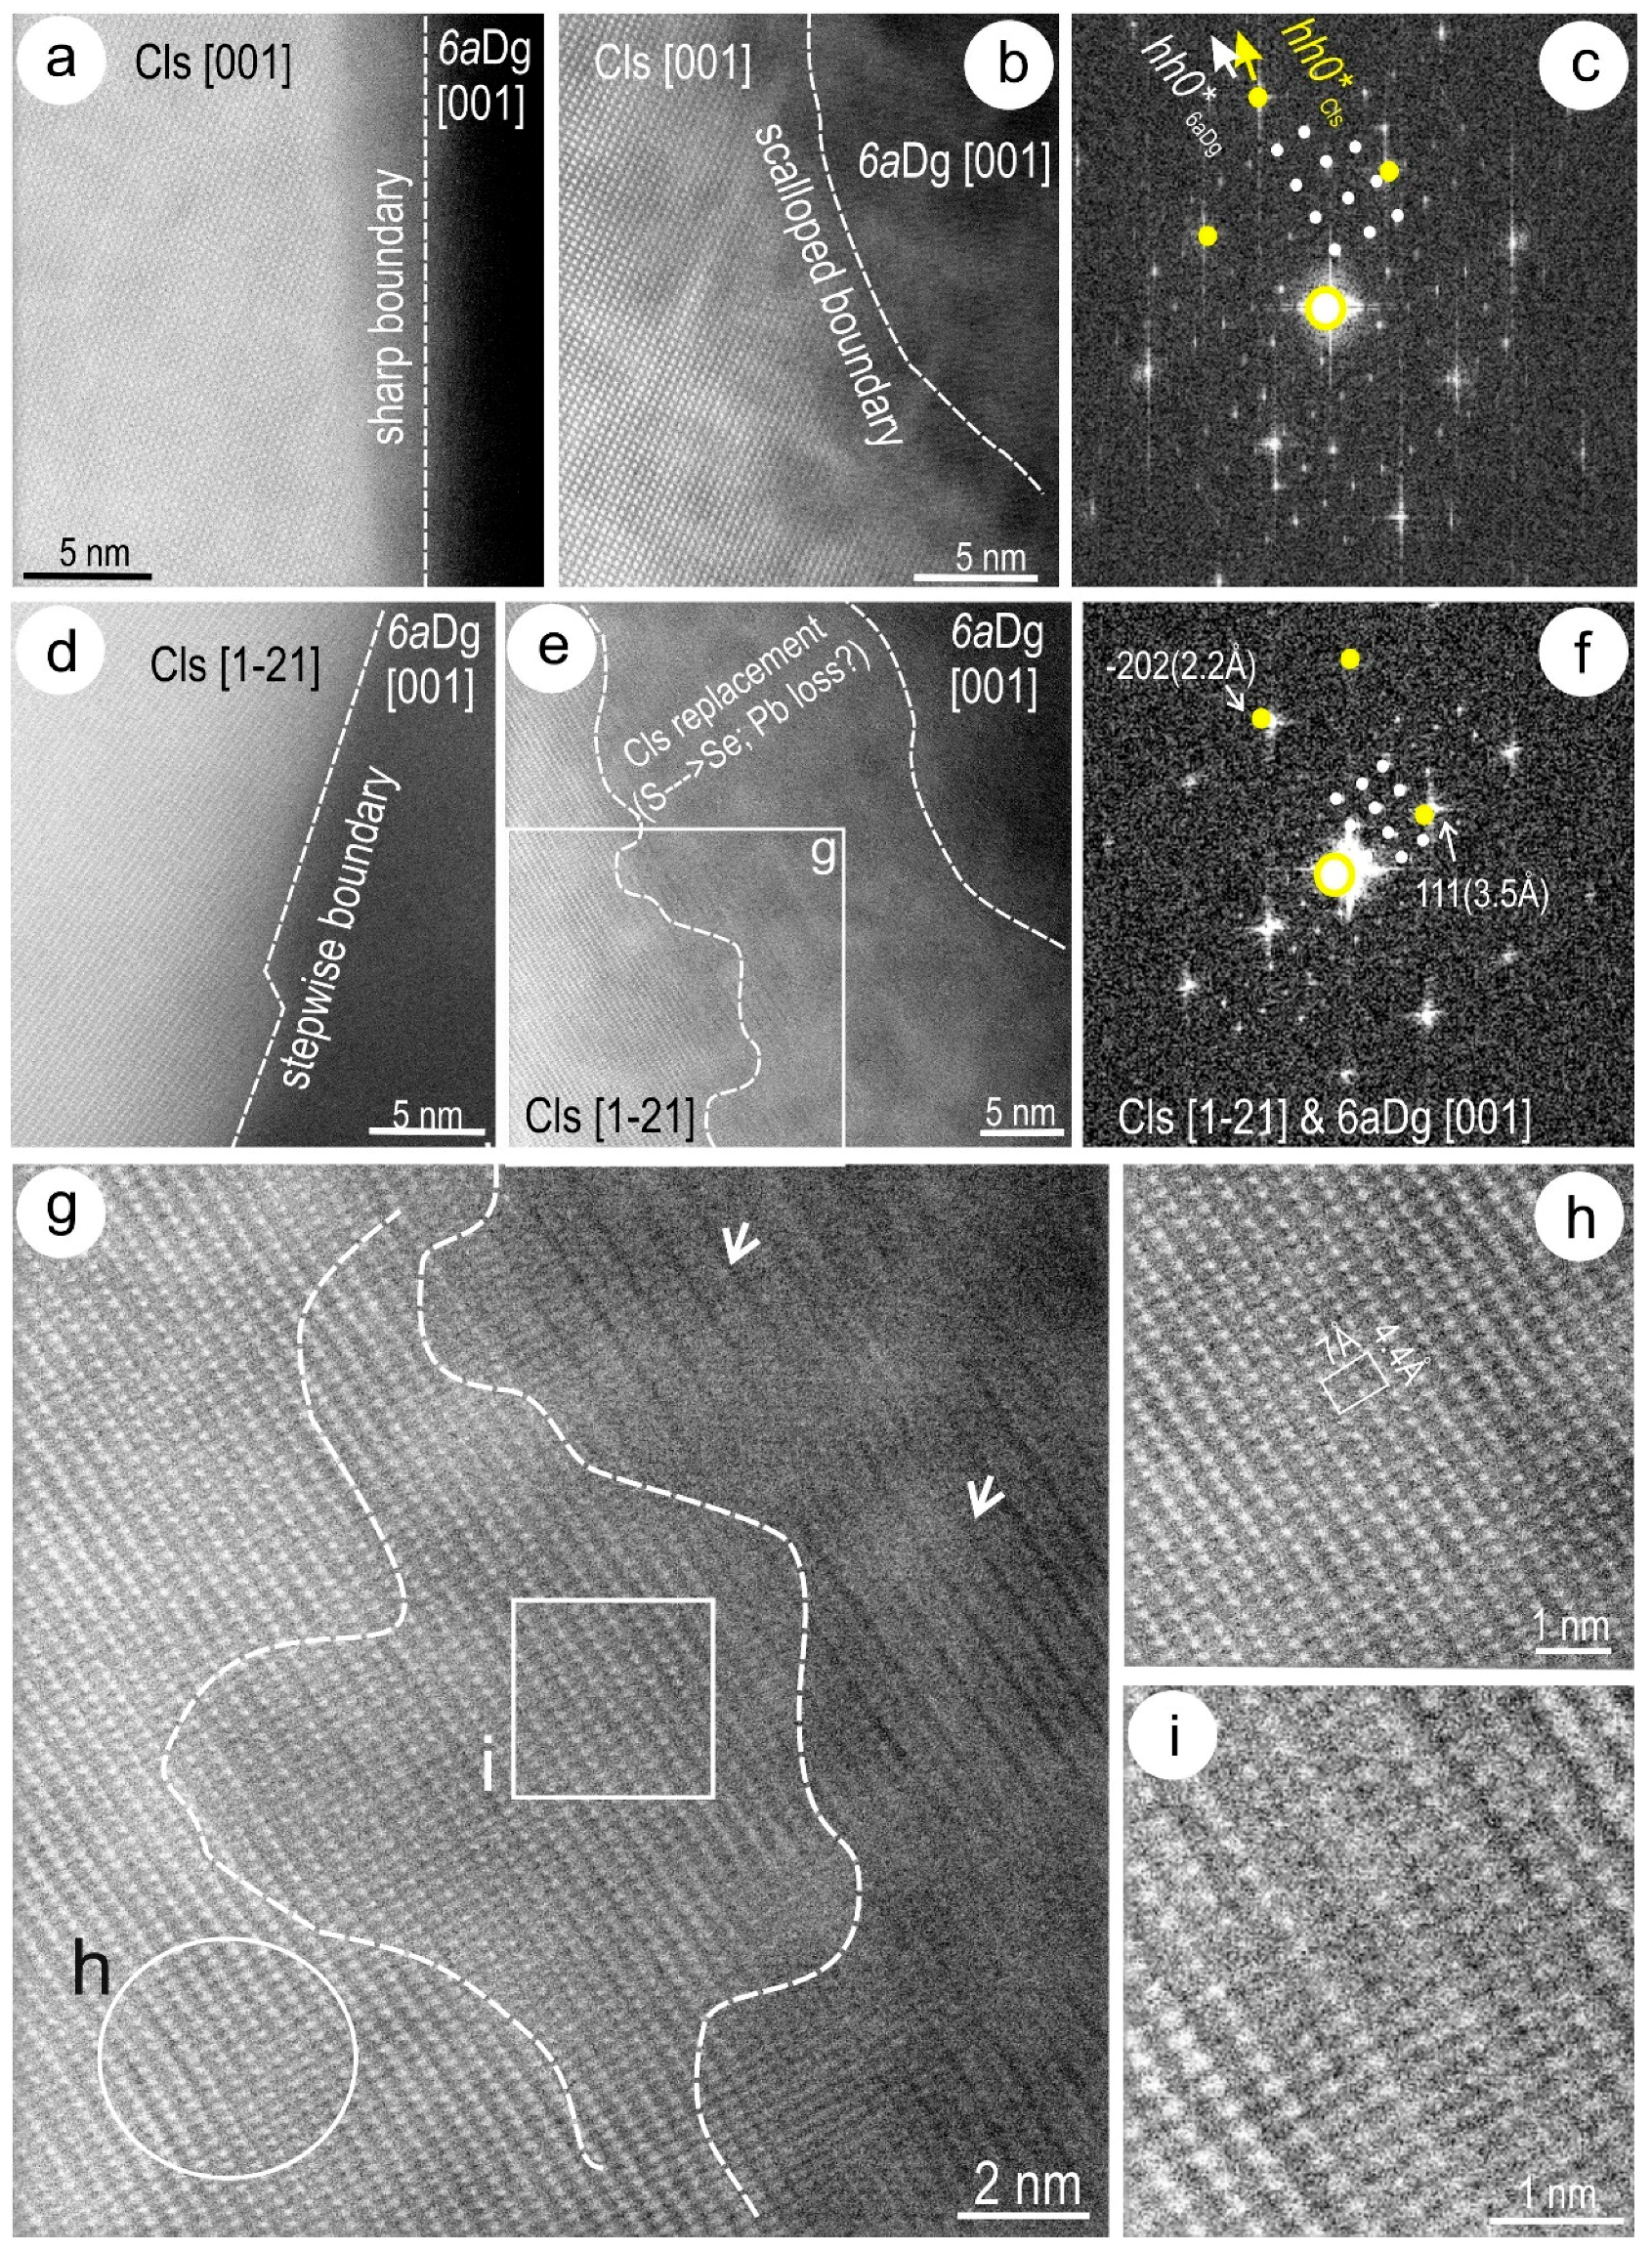
HAADF-STEM imaging and EDS were undertaken on several clausthalite inclusions (rods and blebs) in foil Cc1 to understand the relationships with host “chalcocite” (particularly in the digenite domains) in terms of orientation and boundary morphologies. Both types of boundaries (sharp and scalloped) shown in Figure 8 were found to be typical throughout the symplectites (Figure 12). The orientation of the clausthalite relative to the [001] zone axis of digenite changes from [001] (Figure 12a–c) to [1 2 ¯ 1] (Figure 12d–f), but retains the relatively coherent orientation between the two species (Figure 12c,f). One case of the scalloped boundaries was imaged at higher magnification (Figure 12g). This shows a ragged interface within the clausthalite edge with a decrease in the intensity of the Se signal, as determined by EDS, from the clausthalite towards digenite. The image shows a darkening correlating with the decrease in Se, as well as well-defined darker strips within the Se-depleted part of the clausthalite (arrowed on Figure 12g). In detail, the clausthalite shows changes in the atomic arrays, from parallel rows of bright atoms (attributable to Pb, see below) in the less affected part of the clausthalite (Figure 12h) to arrays in which some parts markedly miss the bright atoms, suggesting a localised Pb loss (Figure 12i). Altogether, the darkening, Se depletion and the removal of Pb are interpretable as a replacement of clausthalite along scalloped boundaries.
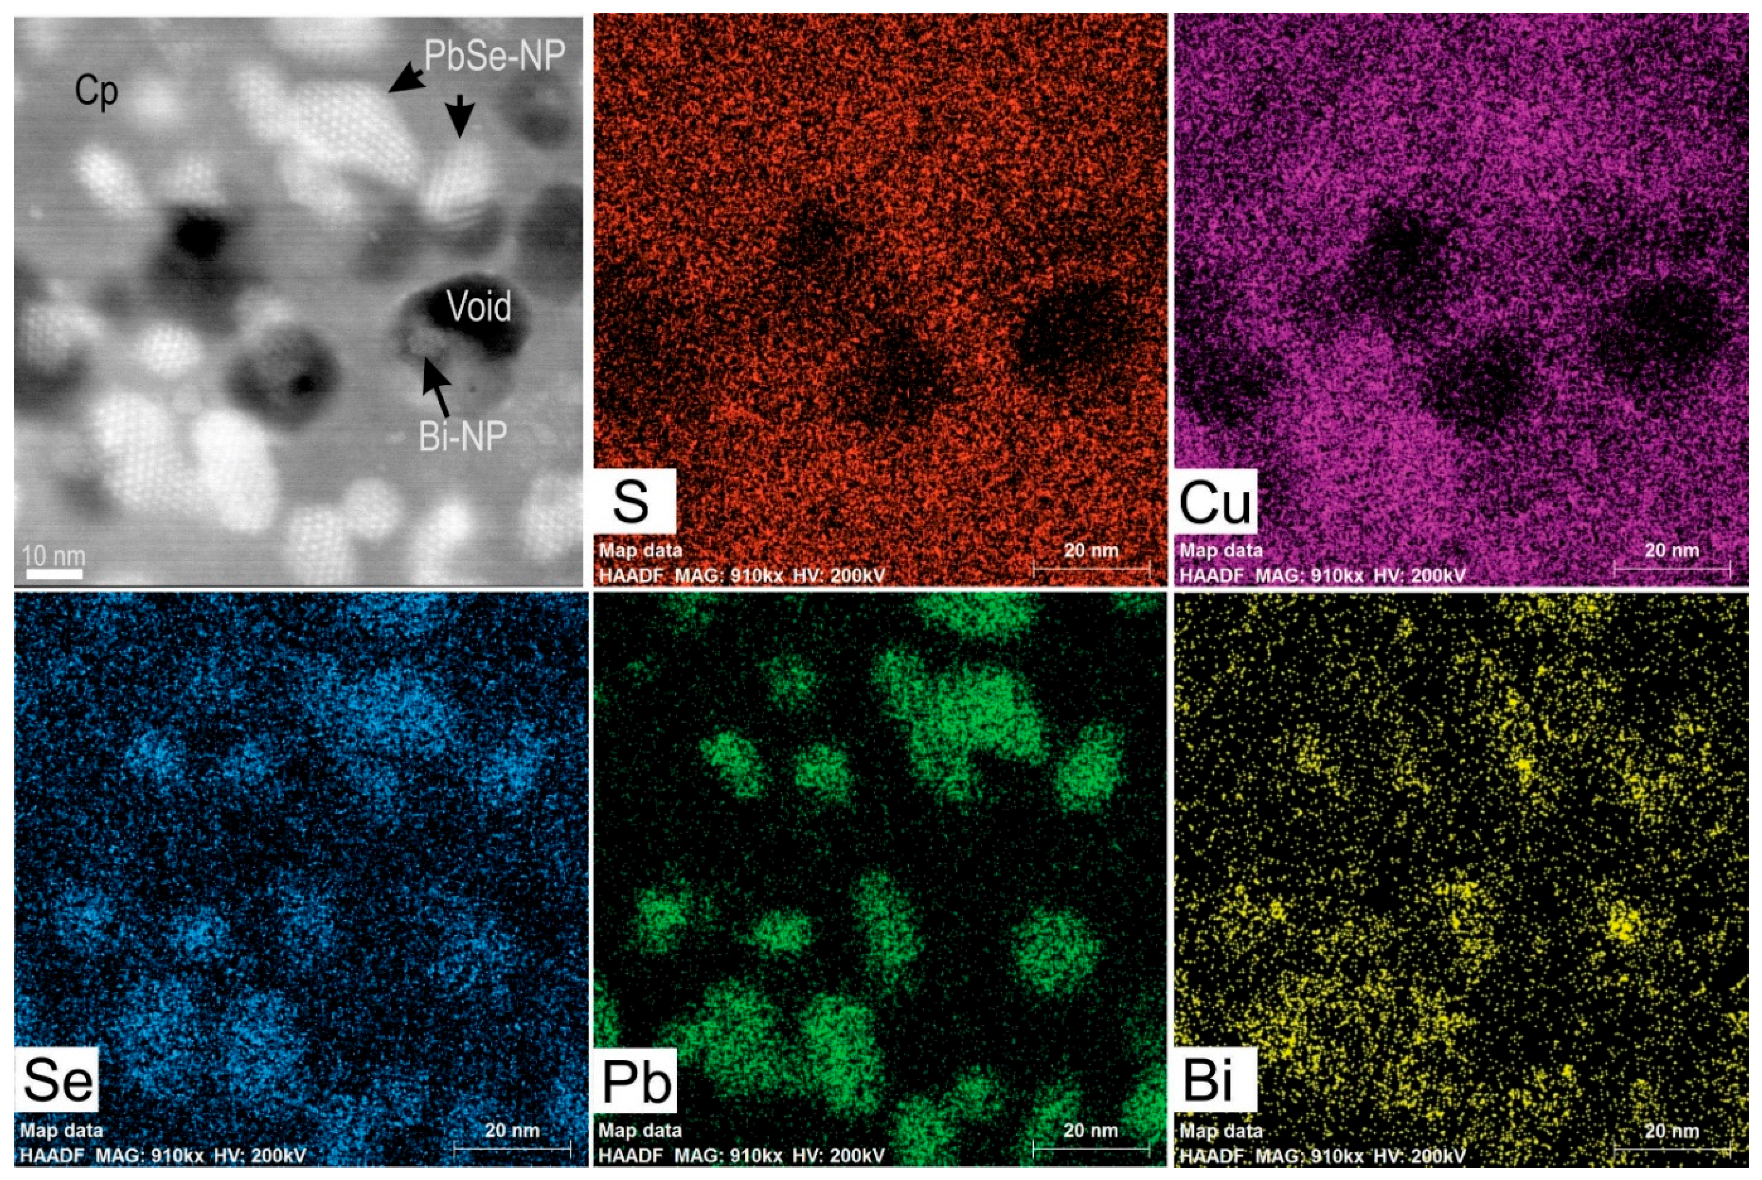
The mottled texture in chalcopyrite shown in Figure 6f consists of clusters of nanoparticles (NPs) with variation in size from ~5 nm up to some tens of nm (Figure 13). Some of the denser fields of inclusions are observed around domain boundaries and, although dominated by PbSe, they also include bismuth-bearing NPs (Bi-NPs) as revealed by EDS mapping (Figure 14). The densest agglomeration of NPs is seen in areas also containing voids (Figure 13a). Peculiar to the PbSe-NPs and clusters is a bright, dotted appearance with rhombic arrangement relative to each cluster (Figure 13b,c). The smallest Bi-NPs are found within clusters of PbSe adjacent to voids (Figure 13c). Notably, such NPs reorganise their atomic arrangement under the electron beam (Figure 13d,e). The rhombic arrangement of the brighter spots in PbSe is associated with the occurrence of satellite reflections on FFTs obtained from such images (Figure 13f). There is a marked coherence between the rhombic arrangement of the bright spots within the PbSe and the atomic arrangement in host chalcopyrite down to the [221] zone axis (Figure 13g). These features suggest that the PbSe-NP clusters undergo ordering towards the formation of large (tens of nm) superstructures. The appearance of PbSe in these NP clusters is clearly distinct from those in symplectites and other coarser textures (e.g., in Figure 12).
The middle part of the NP field in Figure 13a was mapped by STEM EDS (Figure 14) and clearly shows that most of the bright features are PbSe-NPs, whereas the darker features in the middle correlate with depletion in Cu and S. Bismuth is concentrated in the PbSe-NPs but also shows stronger signals indicative of discrete Bi-NPs as that imaged in Figure 13d, e. In contrast to lead, both Se and Bi show signals above background throughout the host chalcopyrite.
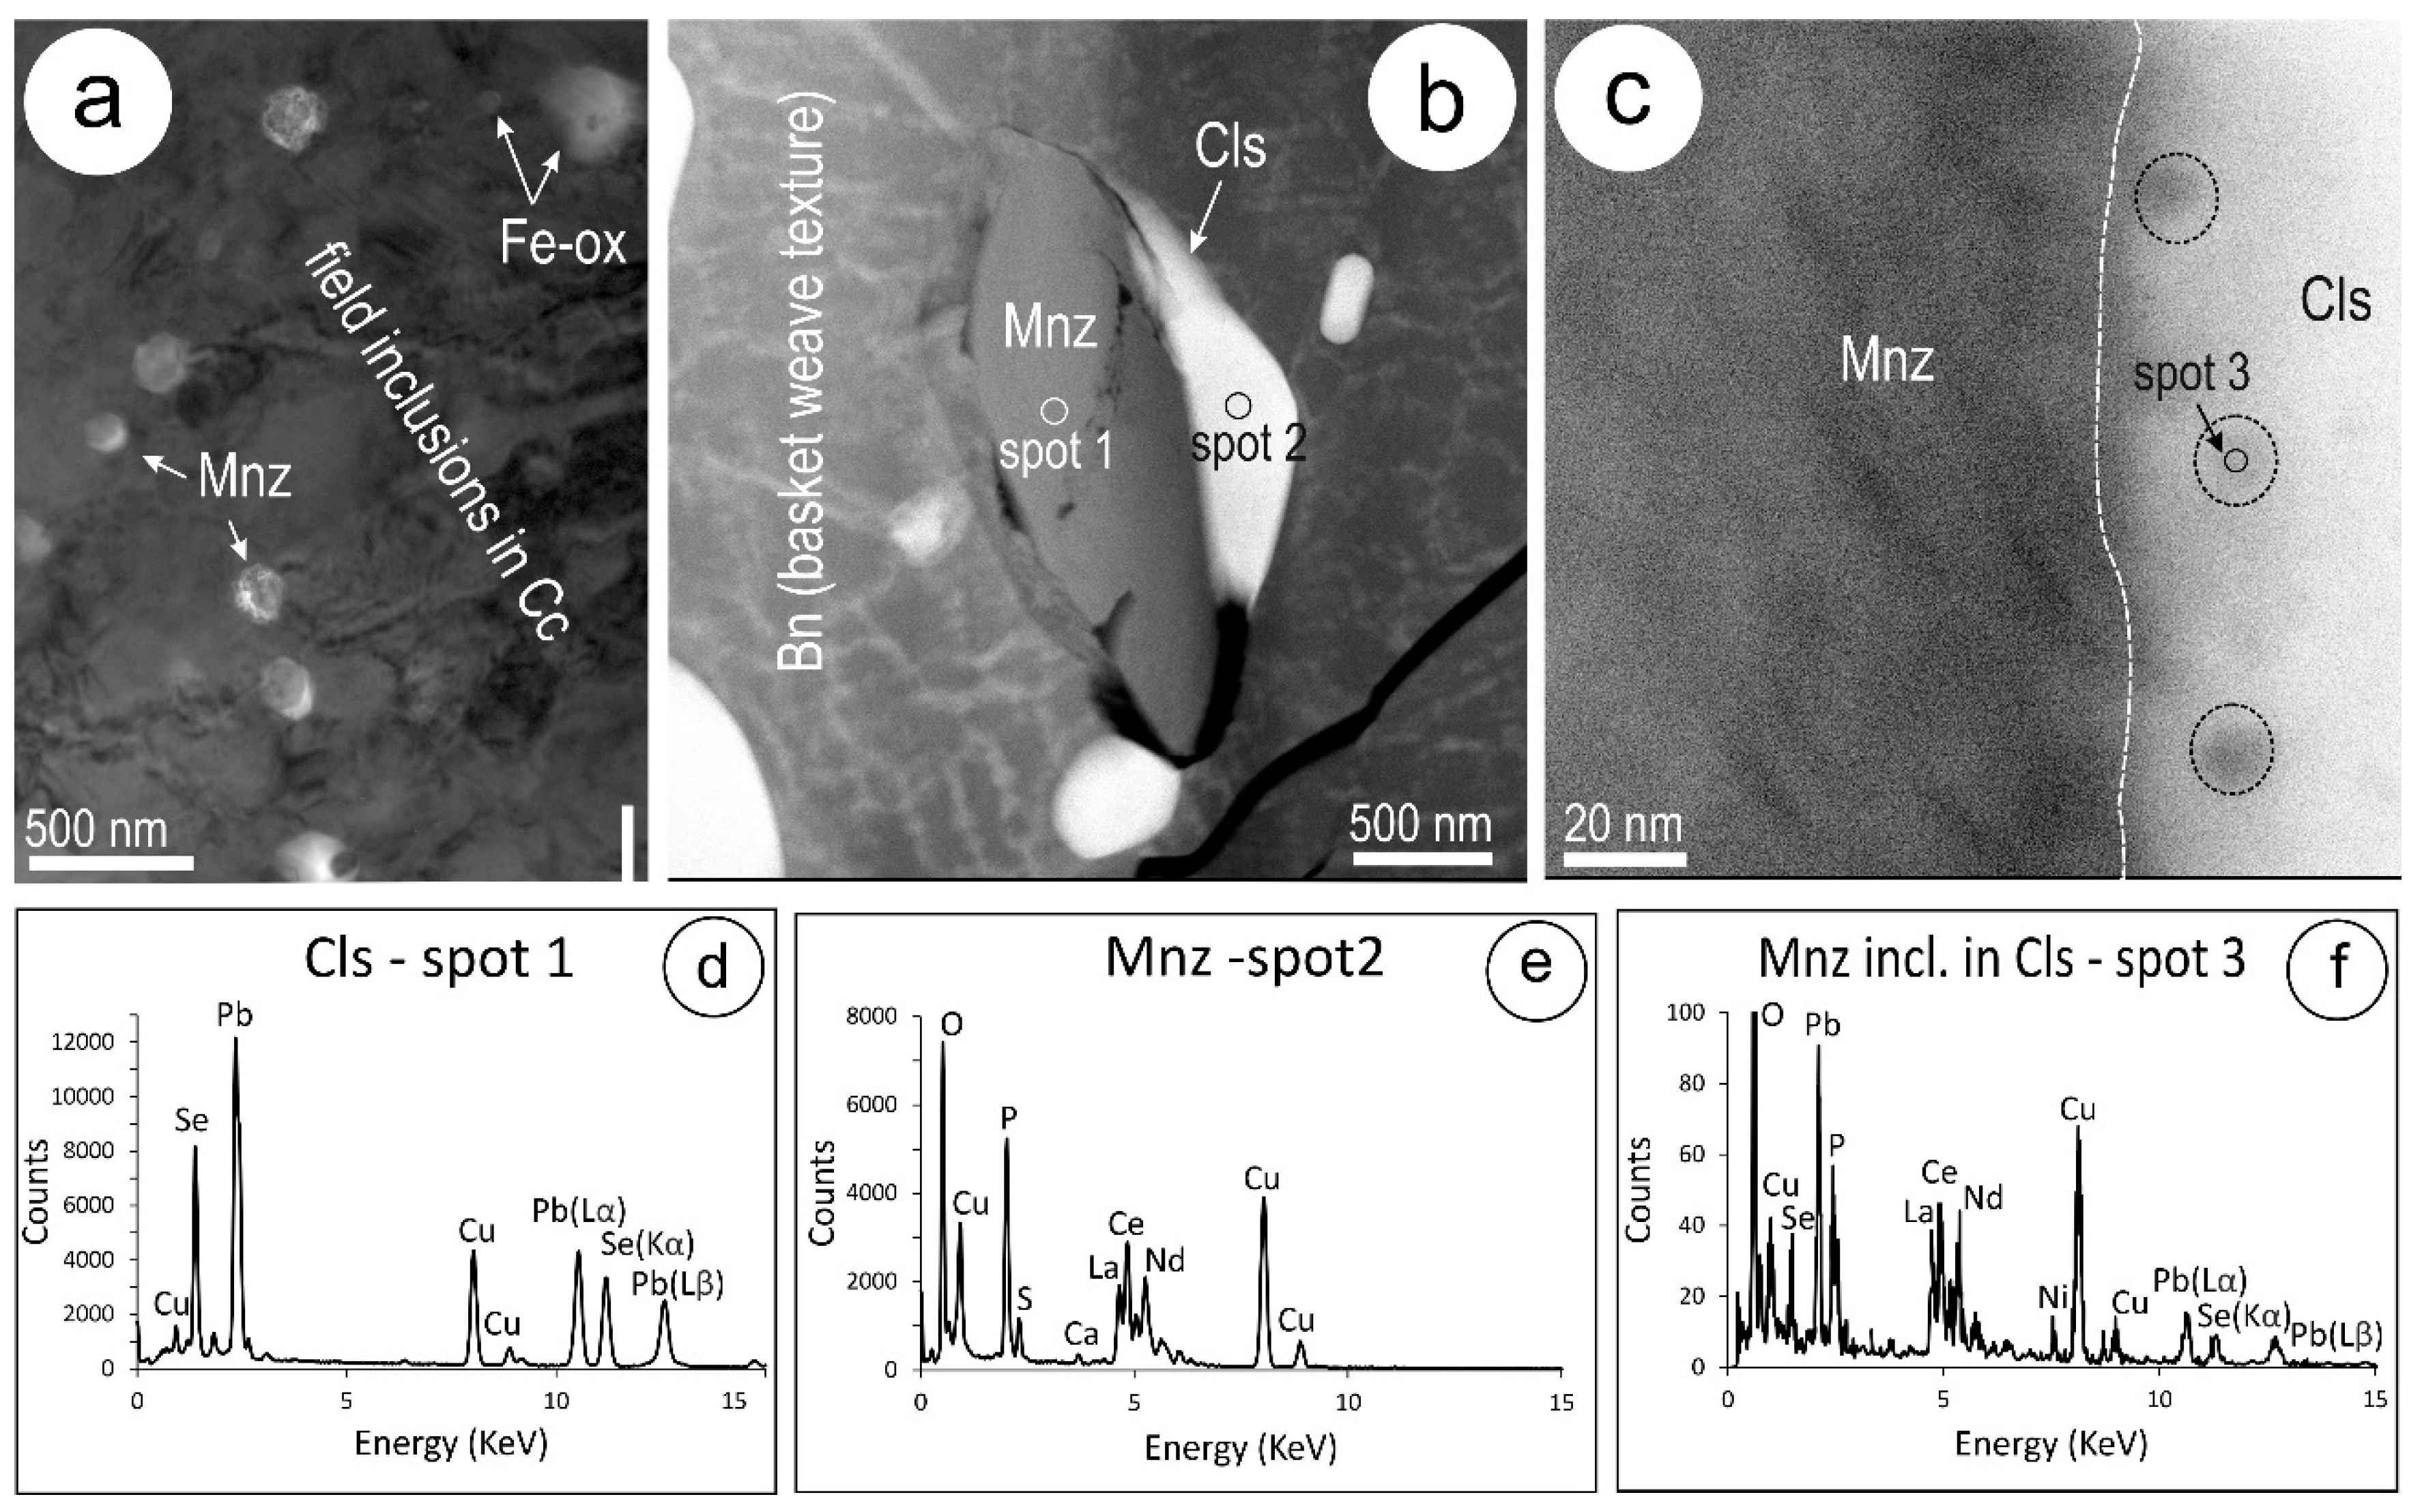
In contrast to the single-phase sulphides, inclusions with more varied composition are found in the bornite-bearing sulphide assemblages (Figure 5c,d). These comprise iron oxides (in both BnCcIII and BnCpIV), and numerous nanoinclusions of monazite in BnCcIII and a Cu-selenide in BnCpIV. The smallest monazite inclusions, associated or not with iron oxides, occur throughout the chalcocite domains in BnCcIII (Figure 15a). The coarsest grains of monazite (hundreds of nm in size) are found associated with clausthalite within bornite, near the boundary to chalcocite (Figure 5c and Figure 15b). Similar coarse inclusions are also located close to fractures. Monazite inclusions display a strong relief against the sulphides, with wedged boundaries. HAADF-STEM imaging along the mutual boundary between monazite and clausthalite (Figure 15d,e, respectively) show the occurrence of dark areas in clausthalite. A spectrum obtained with a smaller spot size (5–6 nm, smaller than the inclusion diameter) from such a darker domain (Figure 15c) indicates the presence of both phases, suggesting the presence of monazite inclusions within clausthalite.
Atomic-scale HAADF-STEM imaging of clausthalite and monazite from the binary inclusions in Figure 15b are shown as different tilts in Figure 16. The atomic arrangement in clausthalite down to the [010] zone axis is compared with crystal-structural models in Figure 16a. The model shows the bright spots correspond to Pb atoms. Tilting the specimen to the [031] zone axis in clausthalite, the image shows continuity between the atomic arrays in clausthalite and monazite (Figure 16b). The atomic arrangement in monazite is compatible with monazite down to the [023] zone axis, as shown in Figure 16c. The crystal-structural model shown for this zone axis in monazite indicates that the bright spots are Ce atoms. This is confirmed by the atomic arrangement in monazite down to the [ 1 ¯ 13] zone axis (Figure 16d), where Ce and P atoms do not overlap on the model. We also note the continuation of atomic arrangements from monazite into clausthalite.
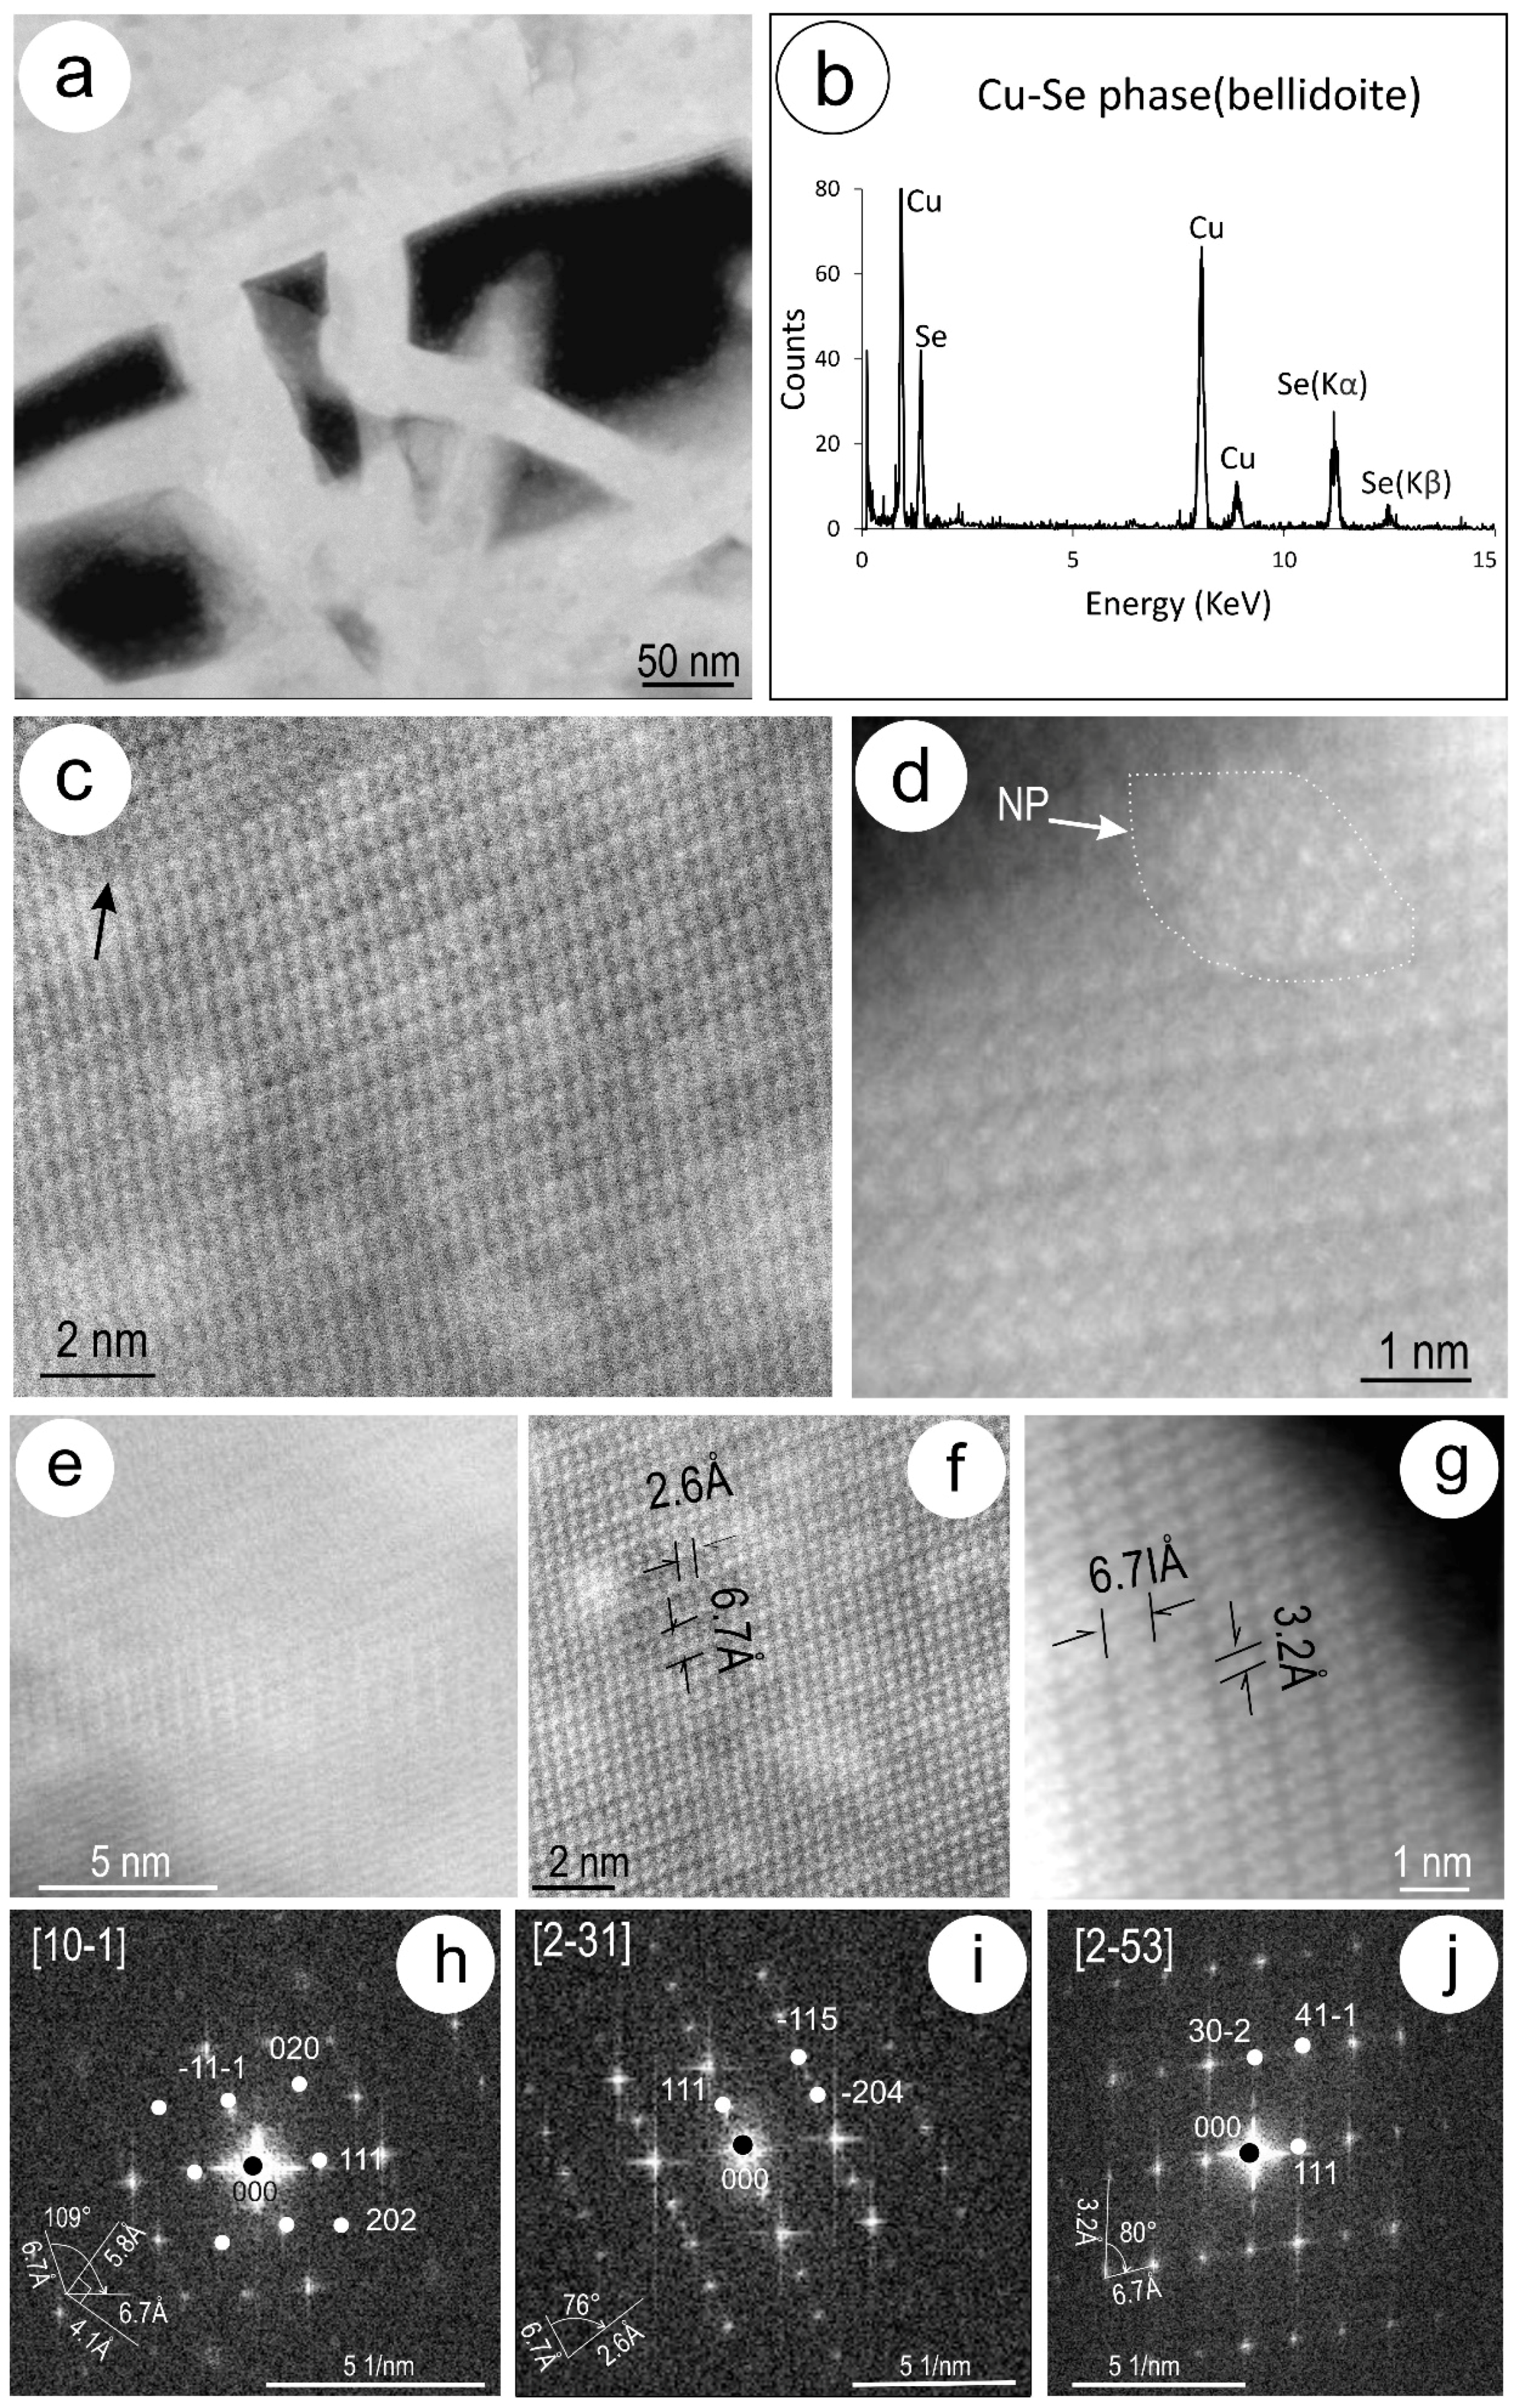
One of the micron-scale vugs in BnCpIV (Figure 5d) is filled with a lamellar aggregate of a Cu-selenide phase with a composition resembling ~Cu2Se (Figure 14a,b). HR HAADF-STEM imagining shows atom-scale defects at the lamellae boundaries (Figure 17c) or NP inclusions with different orientations to the host (Figure 17d). By tilting the specimen on different zone axes, we obtained HAADF-STEM images (Figure 17e–g) and corresponding FFTs (Figure 17h–j). Assuming the bellidoite crystal structure [38], we could index the FFTs on three distinct zone axes, one of which is a second-order zone axis down to [10 1 ¯ ] (Figure 17e,h). The other Cu2Se polymorph (berzelianite) is cubic, with a = 5.739 Å, smaller than the 6.7 Å measured along [111]. The other two zone axes, although not major [2 3 ¯ 1] and [2 5 ¯ 3] (FFTs in Figure 17i,j), were obtained by rotating the specimen around (111)* lattice vector, with good spatial resolution of atom arrays on the images (Figure 17f,g).

5. Discussion

Few, if any, HAADF-STEM studies have been carried out previously on Cu-(Fe)-sulphide assemblages. The assemblages and features described here are clearly from ores that can be considered as extremely complex. The observations, however, carry broader applications for features observable in a wide range of copper deposits formed in diverse geological environments. The complexity and presence of different species requires that the intricate associations and relationships are investigated at the nanoscale.

5.1. Evolution of Sulphide Assemblages

The study presented here covers chalcogenide incorporation and release from host Cu-(Fe)-sulphides in ores comprising the three main minerals present in any similar ores (chalcocite, bornite, and chalcopyrite). Both “chalcocite” and bornite show evidence of high-temperature phases that undergo phase transformation and restructuring upon cooling. Bornite solid solutions [44], resulting in bornite-chalcocite and bornite-chalcopyrite assemblages, are comparable to those seen elsewhere [24,45]. The presence of bornite superstructures indicates that the minimum temperatures of formation above 265 °C can be inferred [29]. The co-existence of different bornite superstructure domains at the nanoscale in the same sample (Figure 10) is also reported in natural samples [24,31]. The present study also confirms the widespread presence of lamellar low-temperature djurleite, formed via cooling of bornite solid solutions, as documented elsewhere [24]. The typical basket-weave appearance of bornite containing djurleite in foils prepared for TEM (Figure 6i,k,l) is a characteristic induced by FIB-milling [24].
The type of APBs observed here are constrained within digenite-bearing domains even though monoclinic chalcocite is present beyond these domains. This suggests that the two species derive from a single high-temperature digenite phase undergoing transformation during cooling via changes in the sulphur arrangement from cubic close-packed (ccp) to hexagonal close-packed [46] at temperatures below 120 °C [47]. The observed defects along the APBs (Figure 8b) are evidence in support of low-temperature transformation of the precursor digenite into either monoclinic chalcocite or djurleite at <103.5 °C and <93 °C, respectively [34]. The chalcocite-djurleite transformation may be continuous across lattice fringes and preserves stacking faults in the djurleite, as documented experimentally on CuxS films [48].
The intimate relationships between Cu-(Fe)-sulphides that extend down to the nanoscale (Figure 1, Figure 2 and Figure 3 and Figure 5) account for the non-stoichiometry observed here (Figure 4) and are common in these type of ores [24].

5.2. Formation of Clausthalite in Cu-(Fe)-Sulphides

The data presented here shows a continuum of textural aspects from smallest (<5 nm-sized) Se-rich areas in chalcopyrite, through nanoparticles and their reorganisation via superstructuring, to regular, dense symplectites, and isolated, relatively large blebs. The regular clausthalite rods in chalcocite and chalcopyrite would, at first, be considered as typical products of exsolution. If that is the case, the relationships between clausthalite and APBs in digenite should suggest that such exsolution took place prior to APB development (i.e., above 120 °C) but continued and coarsened thereafter, since the clausthalite rods crosscut the APB boundaries (Figure 6c). The close-to-coherent epitaxial orientation between clausthalite and host digenite is also an argument favouring an exsolution model, even though such symplectites can also occur via coupled dissolution-replacement reactions [49,50]. Nonetheless, the presence of two types of boundaries, expressed both morphologically and chemically (Figure 8c,d and Figure 12), are evidence of distinct processes: primary exsolution (sharp boundaries) and secondary replacement (scalloped boundaries). The latter is mostly observed around larger blebs or rods and is also associated with an increase in the offset in the orientation between clausthalite and the host.
The incorporation of chalcogens, such as Se within Cu-(Fe)-sulphides, and their release are best exemplified through the aspects observed in chalcopyrite, from areas rich in Se to the formation of clustered PbSe nanoparticles and their inferred superstructuring. The epitaxial relationships between the clustered NPs and the chalcopyrite on [221] (Figure 11e,f and Figure 13f,g) are interpretable in terms of a relationship between Se in solid solution and a PbSe superlattice, which in our case takes place via clustering NPs and maturation into coarser inclusions.
Self-assembly of nanocrystals into superlattices has been documented experimentally in PbSe, with three types of atom packing, one of which is tetragonal [51]. However, the superlattices given by Quan et al. [51] are smaller than those observed here in the tetragonal chalcopyrite matrix. None of the FFTs or SAEDs obtained from the mottled areas show the simple lattice of clausthalite (as, for example in the CcI study case) but instead show satellite reflections on SAEDs, representative of chalcopyrite on different zone axes. We thus infer the reorganisation of PbSe NPs into larger tetragonal superlattices, the first such example in natural materials. As chalcopyrite contains little or no Pb, this infers that the mottled areas represent the products of the interaction between the Se contained within the solid solution in the chalcopyrite with Pb supplied by infiltrating fluids. This leads to dense agglomerated fields of NPs that undergo further epitaxial superstructuring within the chalcopyrite. Further work, beyond the scope of the present report, is required to substantiate the PbSe superlattice(s). The presence of active and annealed microfractures, voids, and pores in the areas are, however, taken as evidence of fluid involvement. The relationships between the mottled areas and symplectites cannot be temporally constrained from the present data, although we point to the fact that it is more likely that the sympectites predate fluid infiltration and associated PbSe-NP formation. Further arguments supporting this hypothesis is the presence of Bi-NPs attached to pores in and around the PbSe. Such fluid-driven chalcogenide NP formation attached to pores is also documented from pyrite in ore systems elsewhere [52].
If such a scenario is feasible, it infers an overprint onto pre-existing symplectites, which can be related to the presence of chemically more complex assemblages, such as the monazite-clausthalite from BnCcIII. The monazite–clausthalite epitaxial relationships are further evidence for (potentially long-lived) overprinting of Cu-(Fe)-sulphide ores, with incoming fluids transporting other components, including Pb, REE, and P (Figure 14). This is exemplified in the relationships between monazite and clausthalite in BnCcIII (Figure 15 and Figure 16). Such aspects can be expected in U-bearing Cu ores in which Pb is produced during the decay of uranium. One significant implication is that attempts to date either monazite or Pb-bearing Cu-(Fe)-sulphides by bulk U-Pb methods (e.g., [53,54]) will return the ages of the overprint rather than those of the primary ore formation. As-yet unpublished work by the present authors has shown that Pb within Pb-chalcogenides, including the clausthalite-bearing symplectites addressed here, is enriched in 206Pb relative to primordial values.
The last stage of overprinting, driven by fluids percolating through the ores, is seen in the presence of vugs filled with “new” phases, such as the bellidoite documented here (Figure 17). Bellidoite, the tetragonal Cu2Se dimorph [38], is a rare mineral formed at moderate to low temperature with other hydrothermal selenides and sulphides (e.g., [55]). The present occurrence is the first in Australia, and the first from an iron oxide copper gold system. Other occurrences of bellidoite are described by Škácha et al. [56], including a recently observed occurrence within the Příbram uranium district, Czech Republic, in which it is intergrown with berzelianite.
It is noteworthy that all study cases described here display evidence of overprinting. The nanoscale textural evidence presented here, suggesting multiple events of Pb mobilisation, as well as extended periods of reworking and recrystallization of the ore minerals, is in alignment with previous studies of ores within the Olympic Cu-Au Province. Such observations are, for example, concordant with evidence for multiple events of U dissolution and reprecipitation of U-minerals within the Olympic Dam deposit [17,18,57]. It is suggested here that remobilisation of U from U-bearing minerals led to a decoupling of Pb from at least some of the parent U- (and Th-)bearing minerals, resulting in the progressive uptake of Pb by Cu-(Fe)-sulphides and in the formation of clausthalite inclusions within them.
Altogether, this study shows the importance of using combined advanced microbeam techniques on samples extracted on a site of petrogenetic interest to address the character of ore minerals and their formation [24,40,41,42].

6. Conclusions and Implications

There are three main overarching conclusions that can be drawn from this study. Firstly, the results, as discussed here, challenge the classic origin of symplectites via unmixing or exsolution, suggesting that the symplectite textures could have formed by reaction between pre-existing Se present in solid solution within Cu-(Fe)-sulphides and migrating Pb (resulting from U and Th decay) from a later fluid phase. Selenium was likely present within the host Cu-(Fe)-sulphides at the time of the initial deposition of sulphide mineralisation at relatively high-temperature conditions. Secondly, the introduction of Pb from an external source implies prolonged post-crystallization hydrothermal activity. The diffusion of Pb into Cu-(Fe)-sulphides to form clausthalite preserves evidence for episodes of significant U-Pb remobilisation within the sulphide ores. Such processes may have large implications for U-Pb isotope studies within the region. Thirdly, the observed superstructuring of nanoparticles within chalcopyrite represents a link between solid solution and symplectite formation and shows that Se within the Cu-(Fe)-sulphides reacts readily with Pb, acting as a sponge for the mobilised Pb within the mineralising system. As such, the symplectite textures presented and discussed within this study represent at least two stages of Pb mobilisation and subsequent incorporation into the Cu-(Fe)-sulphides.

Acknowledgments

This research is a contribution to the ARC Research Hub for Australian Copper-Uranium. Staff at Adelaide Microscopy are thanked for instrument access and guidance. CLC acknowledges support to the “FOX” project (Trace elements in iron oxides: deportment, distribution and application in ore genesis, geochronology, exploration and mineral processing), supported by the BHP Olympic Dam and the South Australian Government Mining and Petroleum Services Centre of Excellence. We appreciate the helpful comments of three anonymous Minerals reviewers.

Author Contributions

Nicholas D. Owen, Cristiana L. Ciobanu, and Ashley Slattery performed all analytical work, assisted by Animesh Basak. Cristiana L. Ciobanu and Nigel J. Cook devised the project and guided the analysis and interpretation. Nicholas D. Owen, Cristiana L. Ciobanu, and Nigel J. Cook wrote the paper, assisted by the other co-authors

Conflicts of Interest

The authors declare no conflict of interest.

Appendix A

Table A1. Elements analysed, peak/background positions, count times, and standards used for sulphide analysis.
Element/LineDiffracting Crystal/SpPeak Count Time (Sec)Background Type/FitBkgd Points Acquired (Lo/Hi)Background Count Time (Lo/Hi) (Sec)Standard
S KαLPET/110Multipoint2/210/10Astimex Marcasite
Pb MαLPET/1200Multipoint4/320/20P & H block Galena
Cd LαLPET/110Multipoint2/210/10P & H block Greenockite
Bi MαLPET/110Multipoint2/210/10P & H block Bi2Se3
As LαTAP/210Multipoint2/210/10Astimex GaAs
Se LαTAP/220Multipoint2/320/20P & H block Bi2Se3
Fe KαLLIF/310Multipoint2/210/10P & H block Chalcopyrite
Cu KαLLIF/310Linear-5/5P & H block Chalcopyrite
Mn KαLLIF/310Multipoint2/210/10P & H block Rhodonite
Ag LαLPET/410Multipoint1/210/10P & H block AgTe
Sb LαLPET/410Multipoint2/210/10Astimex Stibnite
Te LαLPET/410Multipoint2/210/10P & H block AgTe
Hg LαLLIF/510Multipoint3/315/15P & H Cinnabar
Zn KαLLIF/510Multipoint2/210/10P & H Spahlerite
Ni KαLLIF/510Linear-5/5Astimex Pentlandite
Co. KαLLIF/510Multipoint2/210/10Astimex Co. metal

References

  1. Simon, G.; Essene, E.J. Phase relations among selenides, sulfides, tellurides, and oxides: I. Thermodynamic properties and calculated equilibria. Econ. Geol. 1996, 91, 1183–1208. [Google Scholar] [CrossRef]
  2. Simon, G.; Kesler, S.E.; Essene, E.J. Phase relations among selenides, tellurides, and oxides; II, Applications to selenide-bearing ore deposits. Econ. Geol. 1997, 92, 468–484. [Google Scholar] [CrossRef]
  3. Cook, N.J.; Ciobanu, C.L.; Spry, P.G.; Voudouris, P. Understanding gold-(silver)-telluride-(selenide) mineral deposits. Episodes 2009, 32, 249–263. [Google Scholar]
  4. Ramdohr, P. The Ore Minerals and Their Intergrowths; English Translation of the 3rd Edition; Pergamon Press: Oxford, UK, 1969; p. 1174. [Google Scholar]
  5. Bogdanov, K.; Filipov, A.; Kehayov, R. Au-Ag-Te-Se minerals in the Elatsite porphyry-copper deposit, Bulgaria. Geochem. Miner. Petrol. 2005, 43, 13–19. [Google Scholar]
  6. Belogub, E.V.; Novoselov, K.A.; Yakovleva, V.A.; Spiro, B. Supergene sulphides and related minerals in the supergene profiles of VHMS deposits from the South Urals. Ore Geol. Rev. 2008, 33, 239–254. [Google Scholar] [CrossRef]
  7. Economou-Eliopoulos, M.; Eliopoulos, D.G.; Chryssoulis, S. A comparison of high-Au massive sulfide ores hosted in ophiolite complexes of the Balkan Peninsula with modern analogues: Genetic significance. Ore Geol. Rev. 2008, 33, 81–100. [Google Scholar] [CrossRef]
  8. Förster, H.J. Mineralogy of the U-Se-polymetallic deposit Niederschlema–Alberoda, Erzgebirge, Germany. IV. The continuous clausthalite-galena solid-solution series. N. Jahrb. Mineral. Abh. 2005, 181, 125–134. [Google Scholar] [CrossRef] [PubMed]
  9. Cepedal, A.; Fuertes-Fuente, M.; Martin-Izard, A.; Gonzalez-Nistal, S.; Rodriguez-Pevida, L. Tellurides, selenides and Bi-mineral assemblages from the Río Narcea Gold Belt, Asturias, Spain: genetic implications in Cu-Au and Au skarns. Mineral. Petrol. 2006, 87, 277–304. [Google Scholar] [CrossRef]
  10. Liu, H.; Chang, L.L.Y. Phase relations in the system PbS-PbSe-PbTe. Mineral. Mag. 1994, 58, 567–578. [Google Scholar] [CrossRef]
  11. Williams, P.J.; Pollard, P.J. Australian Proterozoic iron oxide-Cu-Au deposits; an overview with new metallogenic and exploration data from the Cloncurry District, Northwest Queensland. Explor. Min. Geol. 2001, 10, 191–213. [Google Scholar] [CrossRef]
  12. Piestrzynski, A.; Pieczonka, J. Low temperature ore minerals associations in the Kupferschiefer type deposit, Lubin-Sieroszowice Mining District SW Poland. Mineral. Rev. 2012, 62, 59–66. [Google Scholar]
  13. Skirrow, R.G.; Bastrakov, E.N.; Barovcich, K.; Fraser, G.L.; Creaser, R.A.; Fanning, C.M.; Raymond, O.L.; Davidson, G.J. Timing of iron oxide Cu-Au-(U) hydrothermal activity and Nd isotope constraints on metal sources in the Gawler craton, South Australia. Econ. Geol. 2007, 102, 1441–1470. [Google Scholar] [CrossRef]
  14. Ehrig, K.; McPhie, J.; Kamenetsky, V.S. Geology and mineralogical zonation of the Olympic Dam iron oxide Cu-U-Au-Ag deposit, South Australia. In Geology and Genesis of Major Copper Deposits and Districts of the World, a Tribute to Richard Sillitoe; Hedenquist, J.W., Harris, M., Camus, F., Eds.; Society of Economic Geologists: Littleton, CO, USA, 2012; Volume 16, pp. 237–268. [Google Scholar]
  15. Skirrow, R.G.; Raymond, O.L.; Bastrakov, E.; Davidson, G.J.; Heithersay, P. The geological framework, distribution and controls of Fe oxide Cu-Au mineralisation in the Gawler Craton, South Australia. Part II—alteration and mineralisation. In Hydrothermal Iron Oxide Copper-Gold & Related Deposits: A Global Perspective; Porter, T.M., Ed.; PGC Publishing: Adelaide, Australia, 2002; Volume 2, pp. 33–48. [Google Scholar]
  16. Kirchenbaur, M.; Maas, R.; Ehrig, K.; Kamenetsky, V.S.; Strub, E.; Ballhaus, C.; Münker, C. Uranium and Sm isotope studies of the supergiant Olympic Dam Cu-Au-U-Ag deposit, South Australia. Geochim. Cosmochim. Acta 2016, 180, 15–32. [Google Scholar] [CrossRef]
  17. Macmillan, E.; Ciobanu, C.L.; Ehrig, K.; Cook, N.J.; Pring, A. Chemical zoning and lattice distortion in uraninite from Olympic Dam, South Australia. Am. Mineral. 2016, 101, 2351–2354. [Google Scholar] [CrossRef]
  18. Macmillan, E.; Cook, N.J.; Ehrig, K.; Pring, A. Chemical and textural interpretation of late-stage coffinite and brannerite from the Olympic Dam IOCG-Ag-U deposit. Mineral. Mag. 2017, 81, 1323–1366. [Google Scholar] [CrossRef]
  19. Betts, P.G.; Valenta, R.K.; Finlay, J. Evolution of the Mount Woods Inlier, northern Gawler Craton, Southern Australia: An integrated structural and aeromagnetic analysis. Tectonophysics 2003, 366, 83–111. [Google Scholar] [CrossRef]
  20. Huang, Q.; Kamenetsky, V.S.; McPhie, J.; Ehrig, K.; Meffre, S.; Maas, R.; Thompson, J.; Kamenetsky, M.; Chambefort, I.; Apukhtina, O.; et al. Neoproterozoic (ca. 820–830 Ma) mafic dykes at Olympic Dam, South Australia: Links with the Gairdner Large Igneous Province. Precambrain Res. 2015, 271, 160–172. [Google Scholar] [CrossRef]
  21. Cook, N.J.; Ciobanu, C.L.; Danyushevsky, L.V.; Gilbert, S. Minor elements in bornite and associated Cu-(Fe)-sulfides: A LA-ICPMS study. Geochim. Cosmochim. Acta 2011, 73, 4761–4791. [Google Scholar] [CrossRef]
  22. George, L.L.; Cook, N.J.; Ciobanu, C.L. Partitioning of trace elements in co-crystallized sphalerite-galena-chalcopyrite hydrothermal ores. Ore Geol. Rev. 2016, 77, 97–116. [Google Scholar] [CrossRef]
  23. George, L.L.; Cook, N.J.; Crowe, B.B.P.; Ciobanu, C.L. Trace elements in hydrothermal chalcopyrite. Mineral. Mag. 2018, in press. [Google Scholar] [CrossRef]
  24. Ciobanu, C.L.; Cook, N.J.; Ehrig, K. Ore minerals down to the nanoscale: Cu-(Fe)-sulphides from the iron oxide copper gold deposit at Olympic Dam, South Australia. Ore Geol. Rev. 2017, 81, 1218–1235. [Google Scholar] [CrossRef]
  25. Noda, Y.; Masumoto, K.; Ohba, S.; Saito, Y.; Toriumi, K.; Iwata, Y.; Shibuya, I. Temperature dependence of atomic thermal parameters of lead chalcogenides, PbS, PbSe and PbTe. Acta Crystallogr. Sect. C Cryst. Struct. Commun. 1987, 43, 1443–1445. [Google Scholar] [CrossRef]
  26. Ni, Y.; Hughes, J.M.; Mariano, A.N. Crystal chemistry of the monazite and xenotime structures. Am. Mineral. 1995, 80, 21–26. [Google Scholar] [CrossRef]
  27. Hall, S.R.; Stewart, J.M. The crystal structure refinement of chalcopyrite, CuFeS2. Acta Cryst. 1973, 29, 579–585. [Google Scholar] [CrossRef]
  28. Tunell, G.; Adams, C.E. On the symmetry and crystal structure of bornite. Am. Mineral. 1949, 34, 824–829. [Google Scholar]
  29. Kanazawa, Y.; Koto, K.; Morimoto, N. Bornite (Cu5FeS4): Stability and crystal structure of the intermediate form. Can. Mineral. 1978, 16, 397–404. [Google Scholar]
  30. Ding, Y.; Veblen, D.R.; Prewitt, C.T. High-resolution transmission electron microscopy (HRTEM) study of 4a and 6a superstructure of bornite Cu5FeS4. Am. Mineral. 2005, 90, 1256–1264. [Google Scholar] [CrossRef]
  31. Ding, Y.; Veblen, D.R.; Prewitt, C.T. Possible Fe/Cu ordering schemes in the 2a superstructure of bornite (Cu5FeS4). Am. Mineral. 2005, 90, 1265–1269. [Google Scholar] [CrossRef]
  32. Pierce, L.; Buseck, P.R. Superstructuring in the bornite-digenite series: A high-resolution electron microscopy study. Am. Mineral. 1978, 63, 1–6. [Google Scholar]
  33. Koto, K.; Morimoto, N. Superstructure investigation of bornite, Cu5FeS4, by the modified partial Patterson function. Acta Crystallogr. 1975, 31, 2268–2273. [Google Scholar] [CrossRef]
  34. Evans, H.T. The crystal structures of low chalcocite and djurleite. Z. Krist. Cryst. Mater. 1979, 150, 299–320. [Google Scholar] [CrossRef]
  35. Buerger, M.J.; Buerger, N.W. Low-chalcocite and high-chalcocite. Am. Mineral. 1944, 29, 55–65. [Google Scholar]
  36. Morimoto, N.; Kullerud, G. Polymorphism in digenite. Am. Mineral. 1963, 48, 110–123. [Google Scholar]
  37. Will, G.; Hinze, E.; Abdelrahman, A.R.M. Crystal structure analysis and refinement of digenite, Cu1.8S, in the temperature range 20 to 500 °C under controlled sulfur partial pressure. Eur. J. Mineral. 2002, 14, 591–598. [Google Scholar] [CrossRef]
  38. De Montreuil, L.A. Bellidoite, a new copper selenide. Econ. Geol. 1975, 70, 384–387. [Google Scholar] [CrossRef]
  39. Ciobanu, C.L.; Cook, N.J.; Utsunomiya, S.; Pring, A.; Green, L. Focussed ion beam-transmission electron microscopy applications in ore mineralogy: Bridging micron-and nanoscale observations. Ore Geol. Rev. 2011, 42, 6–31. [Google Scholar] [CrossRef]
  40. Ciobanu, C.L.; Cook, N.J.; Maunders, C.; Wade, B.P.; Ehrig, K. Focused ion beam and advanced electron microscopy for minerals: insights and outlook from bismuth sulphosalts. Minerals 2016, 6, 112. [Google Scholar] [CrossRef]
  41. Ciobanu, C.L.; Kontonikas-Charos, A.; Slattery, A.; Cook, N.J.; Ehrig, K.; Wade, B.P. Short-range stacking disorder in Mixed-Layer compounds: A HAADF-STEM study of bastnäsite-parisite intergrowths. Minerals 2017, 7, 227. [Google Scholar] [CrossRef]
  42. Cook, N.J.; Ciobanu, C.L.; Ehrig, K.; Slattery, A.; Verdugo-Ihl, M.R.; Courtney-Davies, L.; Gao, W. Advances and opportunities in ore mineralogy. Minerals 2017, 7, 233. [Google Scholar] [CrossRef]
  43. Downs, R.T.; Hall-Wallace, M. The American mineralogist crystal structure database. Am. Mineral. 2003, 88, 247–250. [Google Scholar]
  44. Yund, R.A.; Kullerud, G. Thermal stability of assemblages in the Cu-Fe-S system. J. Petrol. 1966, 7, 454–488. [Google Scholar] [CrossRef]
  45. Posfai, M.; Buseck, P.R. Djurleite, digenite, and chalcocite: intergrowths and transformations. Am. Mineral. 1994, 79, 308–315. [Google Scholar]
  46. Van Dyck, D.; Conde-Amiano, C.; Amelinckx, S. The diffraction pattern of crystals presenting a digenite type of disorder. II. The structure of the digenite-related phases derived by means of the Cluster Theory. Phys. Status Solidi 1980, 58, 451–468. [Google Scholar] [CrossRef]
  47. Morimoto, N.; Kullerud, G. Polymorphism on the Cu9S5-Cu5FeS4 join. Z. Krist. 1966, 123, 235–254. [Google Scholar] [CrossRef]
  48. Echigoya, J.; Edington, J.W. A transmission electron microscope study of the chalcocite-djurleite transformation in topotactically grown thin films of CuxS. Phys. Status Solidi 1982, 72, 305–311. [Google Scholar] [CrossRef]
  49. Zhao, J.; Brugger, J.; Ngothai, Y.; Pring, A. The replacement of chalcopyrite by bornite under hydrothermal conditions. Am. Mineral. 2014, 99, 2389–2397. [Google Scholar] [CrossRef]
  50. Altree-Williams, A.L.; Pring, A.; Ngothai, Y.; Brugger, J. Textural and compositional complexities resulting from coupled dissolution-reprecipitation reactions in geomaterials. Earth Sci. Rev. 2015, 150, 628–651. [Google Scholar] [CrossRef]
  51. Quan, Z.; Wu, D.; Zhu, J.; Evers, W.H.; Boncella, J.M.; Siebbeles, L.D.A.; Wang, Z.; Navrotsky, A.; Xu, H. Energy landscape of self-assembled superlattices of PbSe nanocrystals. Proc. Nat. Acad. Sci. USA 2014, 111, 9054–9057. [Google Scholar] [CrossRef] [PubMed]
  52. Ciobanu, C.L.; Cook, N.J.; Utsunomiya, S.; Kogagwa, M.; Greem, L.; Gilbert, S.; Wade, B. Gold-telluride nanoparticles revealed in arsenic-free pyrite. Am. Mineral. 2012, 97, 1515–1518. [Google Scholar] [CrossRef]
  53. Meffre, S.; Ehrig, K.; Kamenetsky, V.; Chambefort, I.; Maas, R.; McPhie, J. Pb isotopes at Olympic Dam: Constraining sulphide growth. In Proceedings of the 13th Quadrennial IAGOD Symposium 2010, Adelaide, Australia, 6–9 April 2010; pp. 78–79. [Google Scholar]
  54. Maas, R.; Kamenetsky, V.; Ehrig, K.; Meffre, S.; McPhie, J.; Diemar, G. Olympic Dam U-Cu-Au deposit, Australia: New age constraints. Mineral. Mag. 2011, 75, 1375. [Google Scholar]
  55. Paar, W.H.; Topa, D.; Roberts, A.C.; Criddle, A.J.; Amann, G.; Sureda, R.J. The new mineral species brodtkorbite, Cu2HgSe2, and the associated selenide assemblage from Tuminico, Sierra de Cacho, La Rioja, Argentina. Can. Mineral. 2002, 40, 225–237. [Google Scholar] [CrossRef]
  56. Škácha, P.; Sejkora, J.; Plášil, J. Selenide Mineralization in the Příbram Uranium and Base-Metal District (Czech Republic). Minerals 2017, 7, 91. [Google Scholar] [CrossRef]
  57. Macmillan, E.; Cook, N.J.; Ehrig, K.; Ciobanu, C.L.; Pring, A. Uraninite from the Olympic Dam IOCG-U-Ag deposit: Linking textural and compositional variation to temporal evolution. Am. Mineral. 2016, 101, 1295–1320. [Google Scholar] [CrossRef]
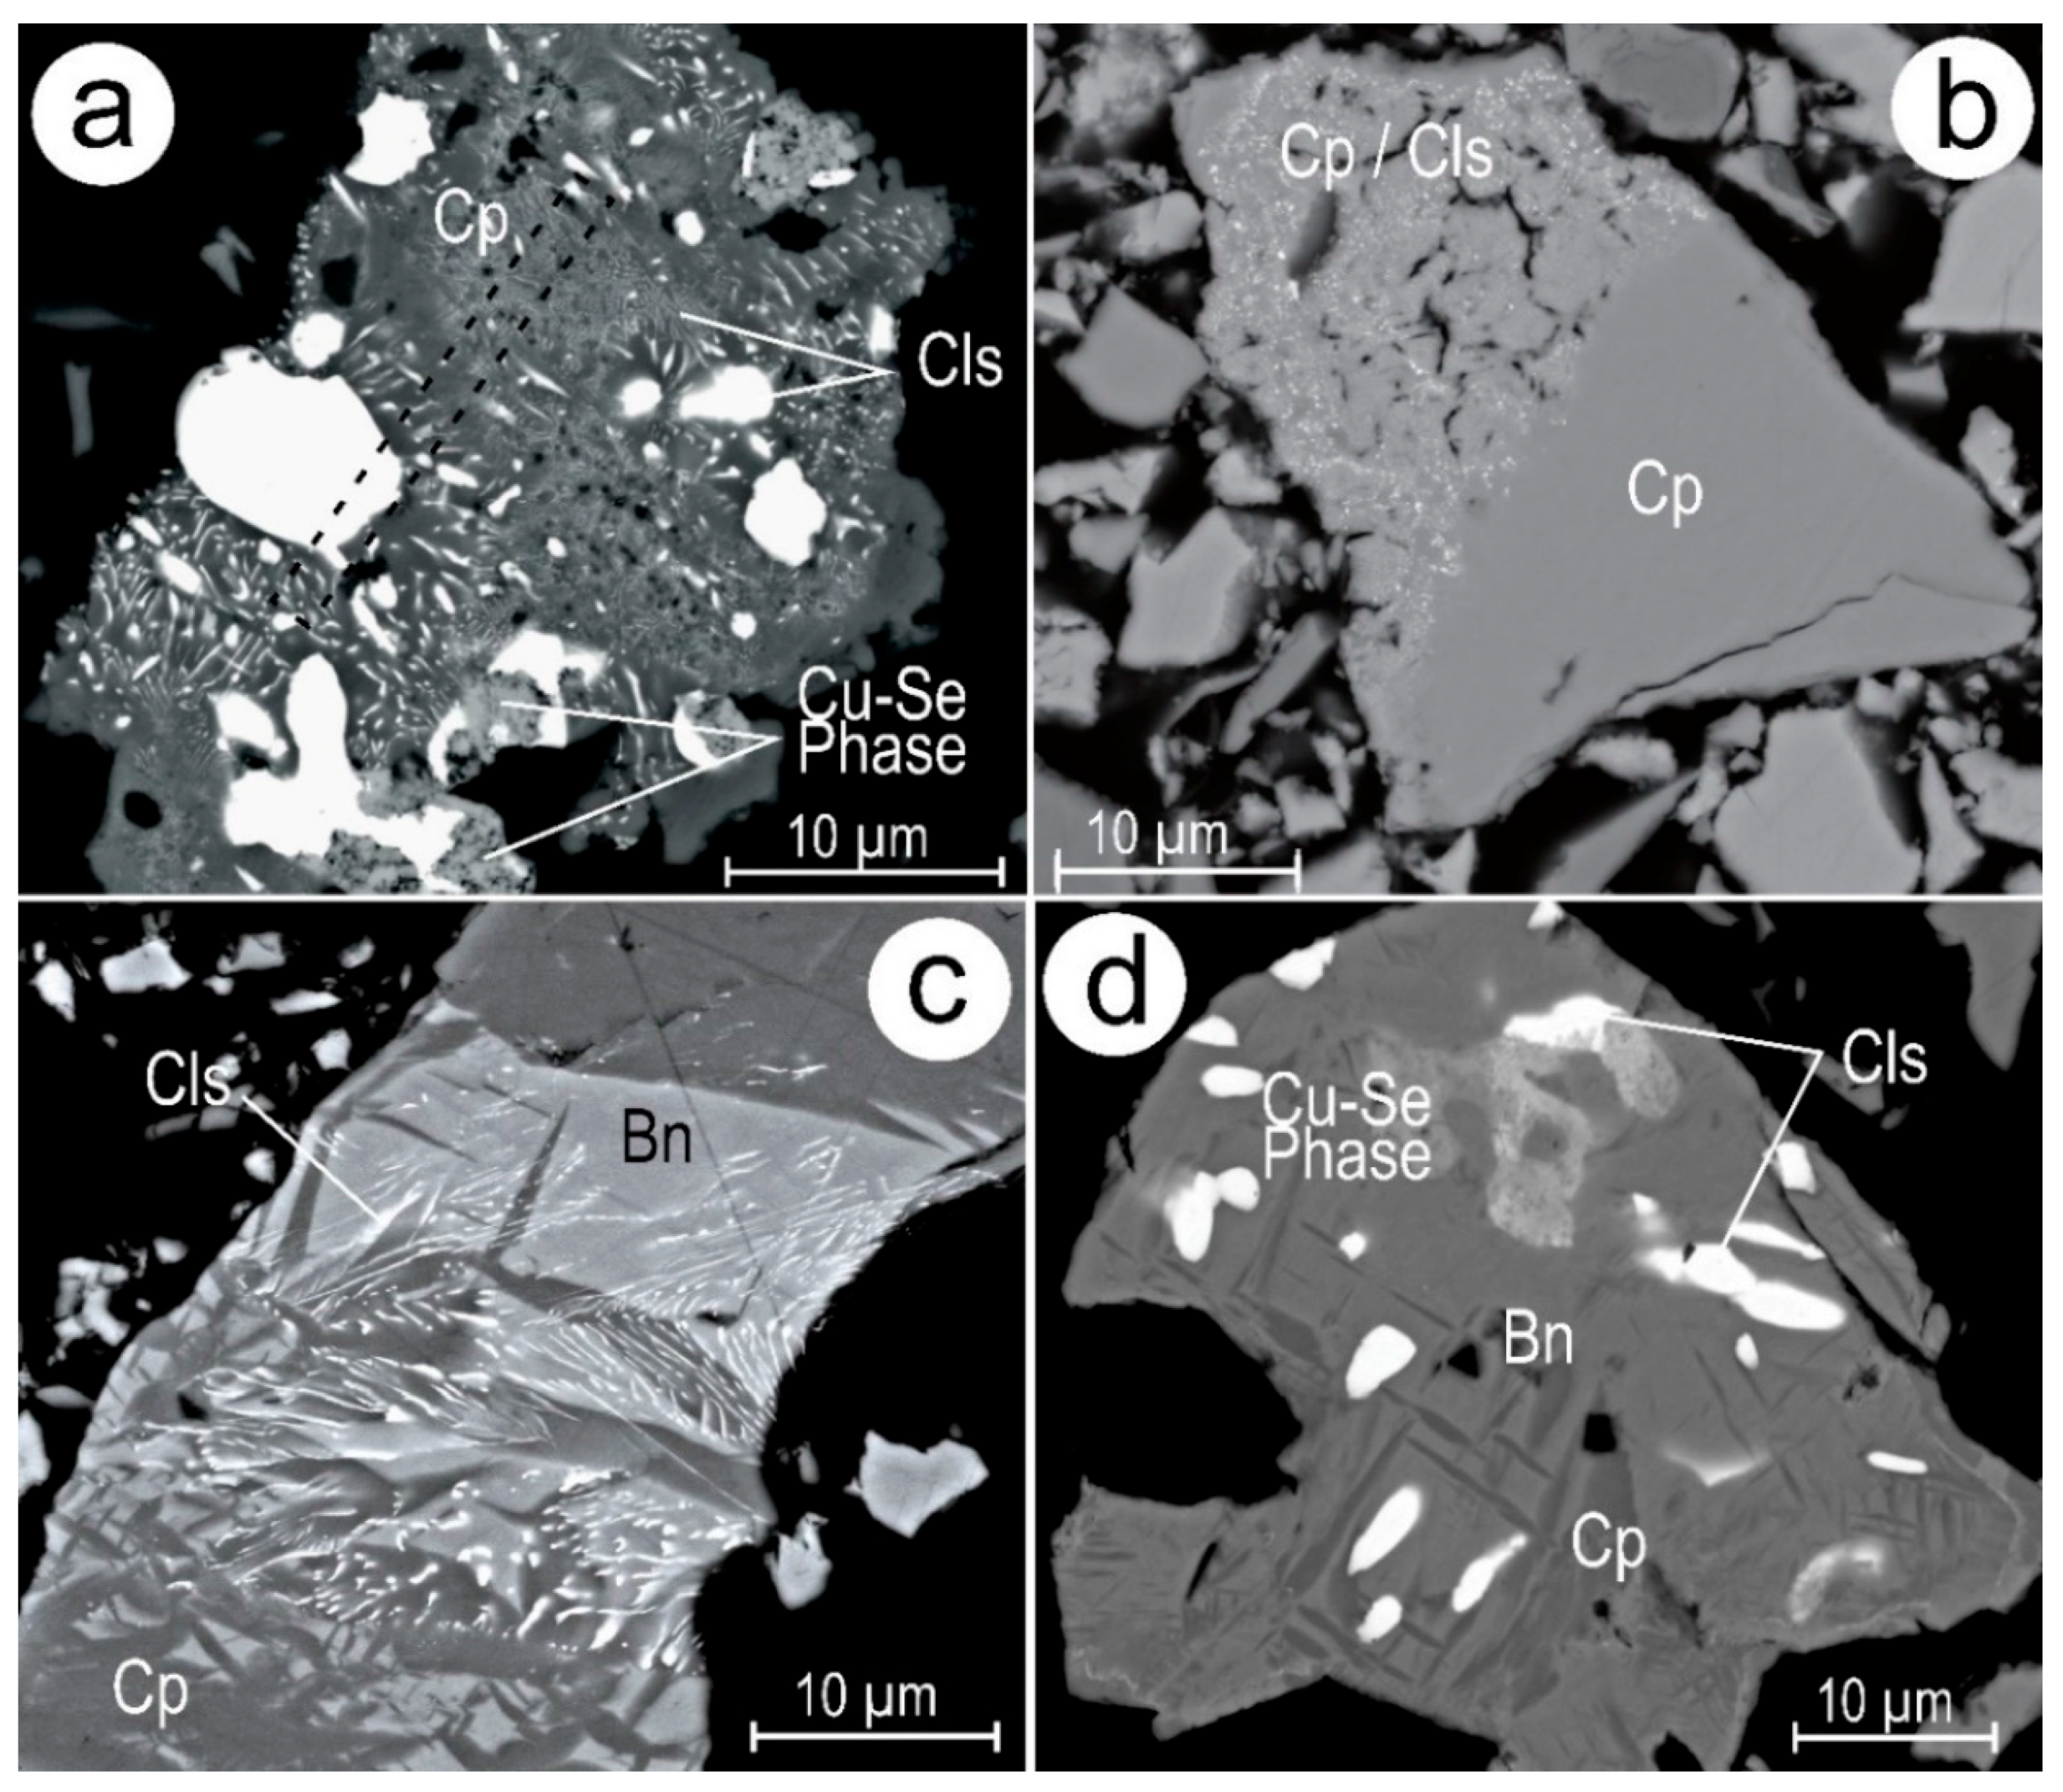
Figure 1. (a,b) Backscatter electron (BSE) images of clausthalite-bearing symplectites hosted within chalcopyrite. The location of the Focused Ion Beam (FIB) cuts for TEM foil preparation is indicated by the dotted line in (a), with clausthalite forming a composite grain with a Cu-Se phase. (c,d) Two varieties of clausthalite-bearing symplectites (fine vs. coarse grained) within coarser chalcopyrite-bornite symplectites. Clausthalite again forms a composite grain with a Cu-Se phase in (d). Abbreviations: Bn—bornite; Cls—clausthalite; Cp—chalcopyrite.
Minerals 08 00067 g001
Figure 2. BSE image of clausthalite-bearing symplectite with chalcocite. Note the discrete zones of well-orientated clausthalite lamellae. Abbreviations: Cc—chalcocite; Cls—clausthalite.
Minerals 08 00067 g002
Figure 3. (a,b) BSE images of clausthalite (Cls)-bearing symplectites hosted within coarser bornite (Bn)–chalcocite (Cc) symplectites. The FIB slice taken from (b) (study case BnCcIII, see text below) is imaged in cross section in (c,d), revealing a very fine bornite-djurleite (Dj) symplectic “basket-weave” texture. The dashed line on (d) indicates a change in the orientation of the bornite-djurleite “basket-weave” texture, with clausthalite forming along the boundary. Abbreviations: Bn—bornite; Cc—chalcocite; Cls—clausthalite; Dj—djurleite; Mnz—monazite.
Minerals 08 00067 g003
Figure 4. Diagram summarising the stoichiometry of bornite (brown) and chalcocite (blue). The measurements are presented as the ratio between the total metals measured (Me) and the total chalcogen elements (S, Se, and Te). The data are arranged in order of analysis only. An—anilite, Bn—bornite, Cc—chalcocite, Cp—chalcopyrite, Dg—digenite, Dj—djurleite.
Minerals 08 00067 g004
Figure 5. High-Angle Annular Dark-Field Scanning Transmission Electron Microscope (HAADF-STEM) images showing the four analysed TEM foils. (a) Dense field of clausthalite as rods and blebs of variable orientation in chalcocite. (b) Coarse micron-scale clausthalite in chalcopyrite coexisting with finer swarms of rods and mottled areas of clausthalite inclusions. (c) Clausthalite of variable size mostly in the bornite domain. Monazite and iron oxide are present throughout both chalcocite and bornite. (d) Dense lamellae of chalcopyrite in bornite, with scattered inclusions of clausthalite. Micron-sized pores are filled by iron oxides and the Cu-selenide bellidoite. Note in both (c,d) the basket-weave appearance of bornite due to the presence of sub-micron-scale djurleite lamellae. Abbreviations: Bel—bellidoite; Bn—bornite; Cls—clausthalite; Cp—chalcopyrite; Fe-ox—iron-oxides; Mnz—monazite.
Minerals 08 00067 g005
Figure 6. Aspects of host sulphides and their compositions: Bright field (BF)-TEM (a,b); HAADF-STEM (cl) images; energy-dispersive X-ray spectra (EDS) spectra (m). (a,b) Antiphase boundary (APB) domains with variable orientation in CcI. Note clausthalite inclusions embedded in (b). (c,d) Fine rods of clausthalite crosscutting APBs in CcI (c) and a coarser inclusion outside the APBs (d). (e,f) Mottled areas in CpII developed in domains outlined by fine fractures filled by clausthalite. (g) Boundary between mottled and symplectite areas in CpII. Note the density of inclusions surrounding a micron-sized pore. (h) Needle of chalcopyrite in clausthalite from an area with the coarser symplectites. (i) Clausthalite bleb adjacent to chalcopyrite lamellae in bornite (BnCpIV). Note the fine basket-weave texture surrounding the bleb. (j) Chalcopyrite in bornite, displaying marginal intensity variation relating to the development of the basket-weave texture. (k,l) Nanometre-sized needles of djurleite in bornite (k) and on the margin of chalcopyrite (l). (m) EDS spectra of the main sulphides hosting clausthalite. Abbreviations: APB—AntiPhase Boundaries; Bn—bornite; Cls—clausthalite; Cp—chalcopyrite; Dg—digenite; Dj—djurleite.
Minerals 08 00067 g006
Figure 7. BF-TEM images (ad) and selected area of electron diffraction (SAEDs) (eg) showing aspects of sulphide and clausthalite in Foil CcI. (a) Rods of clausthalite along boundaries between APB domains with digenite and monoclinic chalcocite outside the APB domains. (b) Typical aspects of APB domains represented by dark ripples of variable morphology across subdomains. (c) Larger clausthalite inclusion with marginal variation from straight to slightly scalloped. (d) Internal sub-structure of APBs developed at the tip of clausthalite shown in (c). (e,f) Representative SAEDs of digenite and monoclinic chalcocite (areas shown in (a)) on zone axes as marked. 6a digenite is indexed using the Fd3m space group of Morimoto and Kullerud [36]. Indexing on (e) refers to the 1a digenite parent structure. SAEDS in (e,f) were obtained at the same specimen tilt angle indicating different orientation of the sulphides throughout CcI. (g) Relatively coherent intergrowth between clausthalite and digenite. Abbreviations: CcM—monoclinic chalcocite; Cls—clausthalite; Dg—digenite.
Minerals 08 00067 g007
Figure 8. BF-high-resolution (HR)-TEM images of digenite and clausthalite in foil CcI. (a) APB domain characterised by dark ripples and continuation of lattice fringes across them. (b) Detail of the marked area in (a) showing an atom-wide defect along one of the dark ripples. (c) Sharp and scalloped boundaries of clausthalite (inclusion shown in Figure 7c). (d) Detail of the highlighted area in (c), showing the stepwise character of the scalloped boundary. Abbreviations: APB—AntiPhase Boundaries; Cls—clausthalite; Dg—digenite.
Minerals 08 00067 g008
Figure 9. Atomic-scale details images for digenite and djurleite in CcI and BnCpIV, respectively. (a) HAADF-STEM image showing atom arrangement in digenite on [11 1 ¯ ] zone axis as calculated from the corresponding Fast Fourier Transform (FFT) in (b). In (a), the structural motif shown by green dots underlines the 6a superstructure. Note this is also highlighted by atom-wide defects on the image. The superstructure is clearly highlighted by the six-fold satellite reflections marked in yellow dots on (b). (c) Close-up of an area in (a) showing the structural model consisting of bright atoms with a superstructure motif highlighted by green dots. (d) Simplified model of 1a (high-temperature) digenite on the [11 1 ¯ ] axis using data given in Will et al. [37]. This model includes two Cu sites with different occupancies, of which only Cu1 is shown here (0.3 occupancy). Note the correspondence between the bright spots on the image in (c) and the model in (d) for Cu. (e) HAADF-STEM image showing atom-scale distribution in djurleite down to [0 3 ¯ 1] zone axis as calculated from FFT in (f). (g,h) Atom distribution in a single unit cell on [0 3 ¯ 1] djurleite shown as a cropped imaged from (e) and a structural model (g) after Evans [34], respectively. Note that the distribution of bright spots resembles those of the Cu sites. Abbreviations: Dg—digenite; Dj—djurleite.
Minerals 08 00067 g009
Figure 10. Atomic-scale HAADF-STEM images (ad) and models (eh) of bornite superstructures down to the [10 1 ¯ ] zone axis in BnCpIV. (a) Bornite with marginal djurleite from an area highlighted on Figure 6k. FFT in the inset shows coherent intergrowths between 4a bornite and djurleite. (b) Close-up of the area marked in (a) showing domain heterogeneity throughout the bornite. Satellite reflections (FFT in inset) shows four-fold periodicity but with variation in intensity indicating the co-existence of 2a and 4a superstructures. (c) 2a and 4a superstructure domains in the area marked in (b). The yellow dots highlight the structural motifs for the two species. (d) Detail of the 4a superstructure showing atom distribution throughout the superlattice as marked by the yellow dots. Note faint variation in grey-scale intensity of the atoms that make the superstructure unit cell. (e,f) STEM simulation and crystal-structural model for the bornite 4a superstructure, respectively, using data for 4aI superstructure in Ding et al. [30]. Note the difference in the number of atoms in the STEM simulation relative to the crystal-structural model, whereby the very brightest atoms represent atomic sites with the highest Cu occupancy relative to Fe, and good correspondence between the simulation in (e) and the image in (d). (g,h) STEM simulation and crystal-structural model for the bornite 2a superstructure, respectively, using data 2aI superstructure in Ding et al. [31]. The yellow and green dots in (g) overlap with the Cu and Fe sites in (h). Sulphur atoms are ignored in both crystal-structural models. Abbreviations: Bn—bornite; Dj—djurleite.
Minerals 08 00067 g010
Figure 11. Nanoscale aspects of chalcopyrite from mottled areas in foil CpII. (a) SAED down to the [ 1 ¯ 10] zone axis showing satellite reflections (arrowed). (b) Close-up of SAED in (a), showing detail of satellite reflections and their incommensurate distribution. (c) Inverse FFT image obtained from (b), showing an ordered pattern. (d) SAED down to [221] zone axis, showing satellite reflection (arrowed). (e) HAADF-STEM image of chalcopyrite down to [221] zone axis with bright, nm-scale blebs and corresponding FFT (inset). (f) Atomic-scale HAADF-STEM image down to [221] zone axis, showing brightest atoms attributable to the Cu sites in the crystal-structural model [27] shown in (g). Note, however, the variation in intensity of such atoms and the presence of satellite reflections on FFTs obtained from such areas (inset). Abbreviation: Cp—chalcopyrite.
Minerals 08 00067 g011
Figure 12. HAADF-STEM imaging and FFTs showing clausthalite boundaries and the relationship with host digenite in CcI. (a,b) Sharp and scalloped boundaries between clausthalite and digenite with the same [001] orientation, as inferred from the FFT in (c). (d,e) Sharp and scalloped boundaries with different orientations to one another, i.e., [1 2 ¯ 1] in clausthalite and [001] for digenite, as depicted in the representative FFT (shown in f). Note the stepwise character of one of the sharp boundaries in (d). (g) Atom-scale image of clausthalite (area marked in e), showing modification in grey-scale intensity (distinct domains shown by dashed lines). (h) Unaffected clausthalite shows arrays of bright atoms with periodicities at 7 × 4.4 Å. (i) Parts of the affected clausthalite show evidence of replacement of these arrays in which the bright atoms are missing. Note (in g) that the most affected part of the image also shows dark strips (arrowed) at two-array periodicities. Abbreviations: Cls—clausthalite; Dg—digenite.
Minerals 08 00067 g012
Figure 13. HAADF-STEM images showing NPs present in mottled areas in chalcopyrite from foil CpII. (a) Field of dense NP agglomeration. Note the presence of nanopores (dark) through the middle of the field, whereas the bright dots are the NPs. (b,c) Details of NPs (brighter dots with regular rhombic geometry). Note, in (c), Bi NP highlighted by a dashed outline occurring adjacent to one of the larger voids. (d,e) Square arrangement of bright atoms in Bi-NP, changing the orientation under the electron beam from (d) to (e). (f) Close-up of PbSe NP cluster showing a distribution of bright dots and corresponding FFT (inset). Note that the FFT shows satellite reflections within the chalcopyrite pattern down to the [221] zone axis, instead of reflections attributable to clausthalite structure (a = 6.1 Å). This suggests that the brighter dots correspond to a superlattice of clausthalite ordering within the NPs. (g) Atom-scale image of a PbSe-NP cluster showing continuity of atomic arrays from PbSe-NP cluster into chalcopyrite. Rhombic motifs (blue dots) overlap with the brighter dots in NPs arranged in continuation with similar rhombic motifs in chalcopyrite (green dots), suggesting continuity from NP lattice to host chalcopyrite during superstructure development in the clustered NPs. Abbreviations: Bi-NP—bismuth-containing nanoparticle; Cp—chalcopyrite; NP—nanoparticles.
Minerals 08 00067 g013
Figure 14. STEM EDS element maps (S, Cu, Se, Pb, and Se) of the middle part of the NP field shown in Figure 13a. The corresponding HAADF-STEM image is shown top left. Abbreviations: Bi-NP—bismuth-containing nanoparticle; Cp—chalcopyrite; PbSe-NP—PbSe nanoparticle.
Minerals 08 00067 g014
Figure 15. BF-TEM image (a), HAADF images (b,c), and EDS spectra (df) of monazite and clausthalite inclusions in BnCcIII. (a) Field with smaller monazite nm-scale inclusions and iron oxides, some of which are attached to pores (arrowed). (b) Coarser monazite-clausthalite composite inclusion in bornite. Note the basket-weave pattern produced by FIB-milling in and around djurleite needles. (c) Close-up of boundary area between monazite and clausthalite showing the presence of darker spots attributable to monazite. (df) EDS spectra from inclusions in (b,c), as marked. In (f), Se and Pb peaks are attributable to the wedged monazite below the surface. Abbreviations: Cls, clausthalite; Fe-ox, iron oxides; Mnz, monazite.
Minerals 08 00067 g015
Figure 16. Atomic-scale HAADF-STEM imaging and crystal-structural models for clausthalite (a,b) and monazite (c,d) on zone axes as marked. (a) Clausthalite on the [010] zone axis; as shown in FFT (inset), showing bright atoms with square arrangement corresponding to Pb positions in the crystal structure (data from [25]). (b) Clausthalite on the [031] zone axis (indexed from FFT, inset) and crystal-structural model, showing correspondence between brighter spots and Pb positions. The dashed line outlines the darker inclusions with EDS spectra in Figure 15f, attributable to monazite–(Ce) down to [023], as shown by images and model in (c). Oxygen is excluded from the structural model built for monazite–(Ce) from data given by Ni et al. [26]. (d) Monazite down to the [ 1 ¯ 13] zone axis, as indexed from FFT (inset), showing a good correspondence between the brightest spots (Ce dumbbell site) and the fainter spots corresponding to single Ce atoms. The much lighter P atoms are not visible on the image. Abbreviations: Cls, clausthalite; Mnz, monazite.
Minerals 08 00067 g016
Figure 17. Aspects of Cu-selenide identified as bellidoite from a coarser vug in BnCpIV. (a) HAADF-STEM image showing lamellar aggregate. (b) Corresponding representative EDS spectra. (c,d) HAADF-STEM images showing atom-scale defects between lamellae (arrowed) and NP inclusions (arrowed). (eg) HAADF-STEM images of Cu-selenide on zones axes as indexed in (hj). FFTs could be indexed using the P4/m space group for bellidoite [38]. Note the good correspondence between the measured distances on the FFT and images.
Minerals 08 00067 g017
Table 1. Crystallographic data for the phases discussed in this contribution.
Mineral InformationFormulaCu/S RatioSymmetrySystemSuperstructuresa (Å)b (Å)c (Å)Angle (°)Reference(s)
Cu-Fe-sulphides
ChalcopyriteCuFeS2-TetragonalI42d 5.2895.28910.423 [27]
Bornite
>265 °CCu5FeS4-CubicF23(a)5.475.475.47 [28]
200–265 °C -CubicFm3m2a10.98110.98110.981 [29]
-CubicF43m2a10.7110.7110.71 [30,31]
-Cubic 3a(3 × 5.5)(3 × 5.5)(3 × 5.5) [32]
-CubicFm3m4a21.8821.8821.88 [30,31]
-Cubic 5a(5 × 5.5)(5 × 5.5)(5 × 5.5) [32]
-Cubic 6a(6 × 5.5)(6 × 5.5)(6 × 5.5) [32]
<200 °C -OrthorhombicPbca2a4a2a10.9521.86210.95 [33]
ChalcociteCu2-xS
High-T (104–435 °C)Cu2S2HexagonalP63/mmc 3.953.956.72γ = 120[34]
Low-T (<104 °C) MonoclinicP21/c 15.24611.88413.494β = 116.35[34]
Pseudo-orthorhombicABm2 11.88427.32413.494β = 90.08[35]
DjurleiteCu31S161.96MonoclinicP21/n 26.715.7213.57β = 90.13[34]
Digenite
High-T (>83 °C)Cu1.8S1.8CubicFm3m(a)5.575.575.57 [36,37]
Low-T CubicFd3mna(n × 5.57)(n × 5.57)(n × 5.57) [32,36]
Selenides and monazite
ClausthalitePbSe-CubicFm3m 6.10546.10546.1054 [25]
BellidoiteCu2Se-TetragonalP 41/m 11.52 11.74 [38]
MonaziteRE(PO4)-MonoclinicP21/n 6.79027.02036.4674β = 103.38[26]