1. Introduction
When the seismic wave comes across a certain point in the rock mass, it then disturbs the balance of rock mass particles at that point. The particles oscillate around their balance position for a certain period until they return to a complete standstill. Oscillation of the rock mass particles is something that is manifested and felt as shock, i.e., rock mass vibration. Shock or rock mass oscillation can be a consequence of natural processes or human activities (in the performance of mining). Measurements and monitoring of seismic processes can be done in different ways, depending on the cause of the shock [
1].
Intensity of the shock may be determined by measuring one of the three basic parameters that characterize oscillation of the aroused rock mass, and those parameters are: displacement of the rock mass particles, oscillation velocity of the rock mass particles and acceleration of the aroused environment. Sizes of these three parameters point to the intensity of the force which caused them, as well as to the degree of danger caused by the shock. The parameter that is most often applied to estimate seismic effect of the blasting is the oscillation velocity of the rock mass. It is considered that this is the parameter which best defines danger from shock and damages it may cause. Due to that, adequate standards for the protection from shock are based on data that refer to oscillation velocity [
2,
3].
As the relation between the rock mass oscillation velocity and basic parameters affecting its magnitude, being: the amount of explosive, the distance from the blast site, characteristics of the rock material and the type of blasting, the equation of M.A. Sadovskii, where the oscillation velocity
v is given in the form of the function, is most frequently used:
here
R represents reduced distance, meaning the distance from the blast site to the monitoring point
r, reduced to the used explosive amount
Q.
K and
n parameters conditioned by soil characteristics and blasting conditions, thereby
v is the decreasing convex function of the variable
R.
By applying the equation of rock mass oscillation while blasting, the determination of the rock mass oscillation velocity is made possible for each blast operation in advance, thus blasting is, as regards seismic effect, under control, giving opportunity to plan the magnitude of shock waves for each future blast operation [
4]. In this way adverse blasting effects are reduced. Adverse effects of blasting imply, in addition to the seismic ones, those of air blast waves, fly rock, etc. Thus, production efficiency is increased and, at the same time, construction and mining facilities, as well as the environment near the blast site are protected.
2. Recording Rock Mass Oscillation Velocity
Intensity of the shock is measured by instruments—seismographs, in the field. The main parts of a seismograph are sensors—geophones by way of which rock mass oscillation velocity is being recorded. Measuring of the rock mass oscillation velocity needed for this paper has been done by the instrument type Vibraloc, produced by the Swedish firm ABEM. Detector for detecting oscillation contains three seismometers placed in a common housing oriented in directions X, Y and Z from the rectangular coordination system. Seismograph is constructed to be able to record oscillation velocity, at the same time it is possible to calculate acceleration and displacement of the rock mass. The instrument also records frequency value. Recording of air shocks may be done on the fourth channel using a microphone that is connected to the external connector. Basic characteristics of the seismograph Vibraloc are:
Type and designation of instrument: Vibraloc
Manufactured: in Sundbyberg, Sweden
Measuring possibilities: speed, acceleration displacement
Number of channels: three channels—speed, fourth channel—air channel
Number of components: three—transversal, vertical, side
Frequency range: 2–250 Hz
Location possibility: flat floors, boards, foundations, ground
Trigger level, V, L, T (trigger levels): 0.1–200 mm/s
Channel trigger level A (microphone): 2–150 Pa
Sampling: 1000, 2000 or 4000 Hz
Recording length: 1–100 s or automatic length
Data transfer: Vibraloc PC software
Data analysis: UVSZ and UVSZA software (Vibraloc, Sundbyberg, Sweden)
At the monitoring point, waves that arise as the consequence of blasting, appear almost simultaneously. They also cause the movement of rock mass particles in different directions. Material rock mass particles oscillate along a very complex path. To define intensity and direction of the action of shocks at a certain point of time, it is necessary to record them in three directions, and that by way of:
horizontal component vt, normal to the direction of wave spreading (transversal component)
horizontal component vl, in direction of wave spreading (longitudinal component) and
vertical component vv.
Based on three oscillation velocity components resulting rock mass oscillation velocity may be determined in the equation of Sadovskii: oscillation velocity.
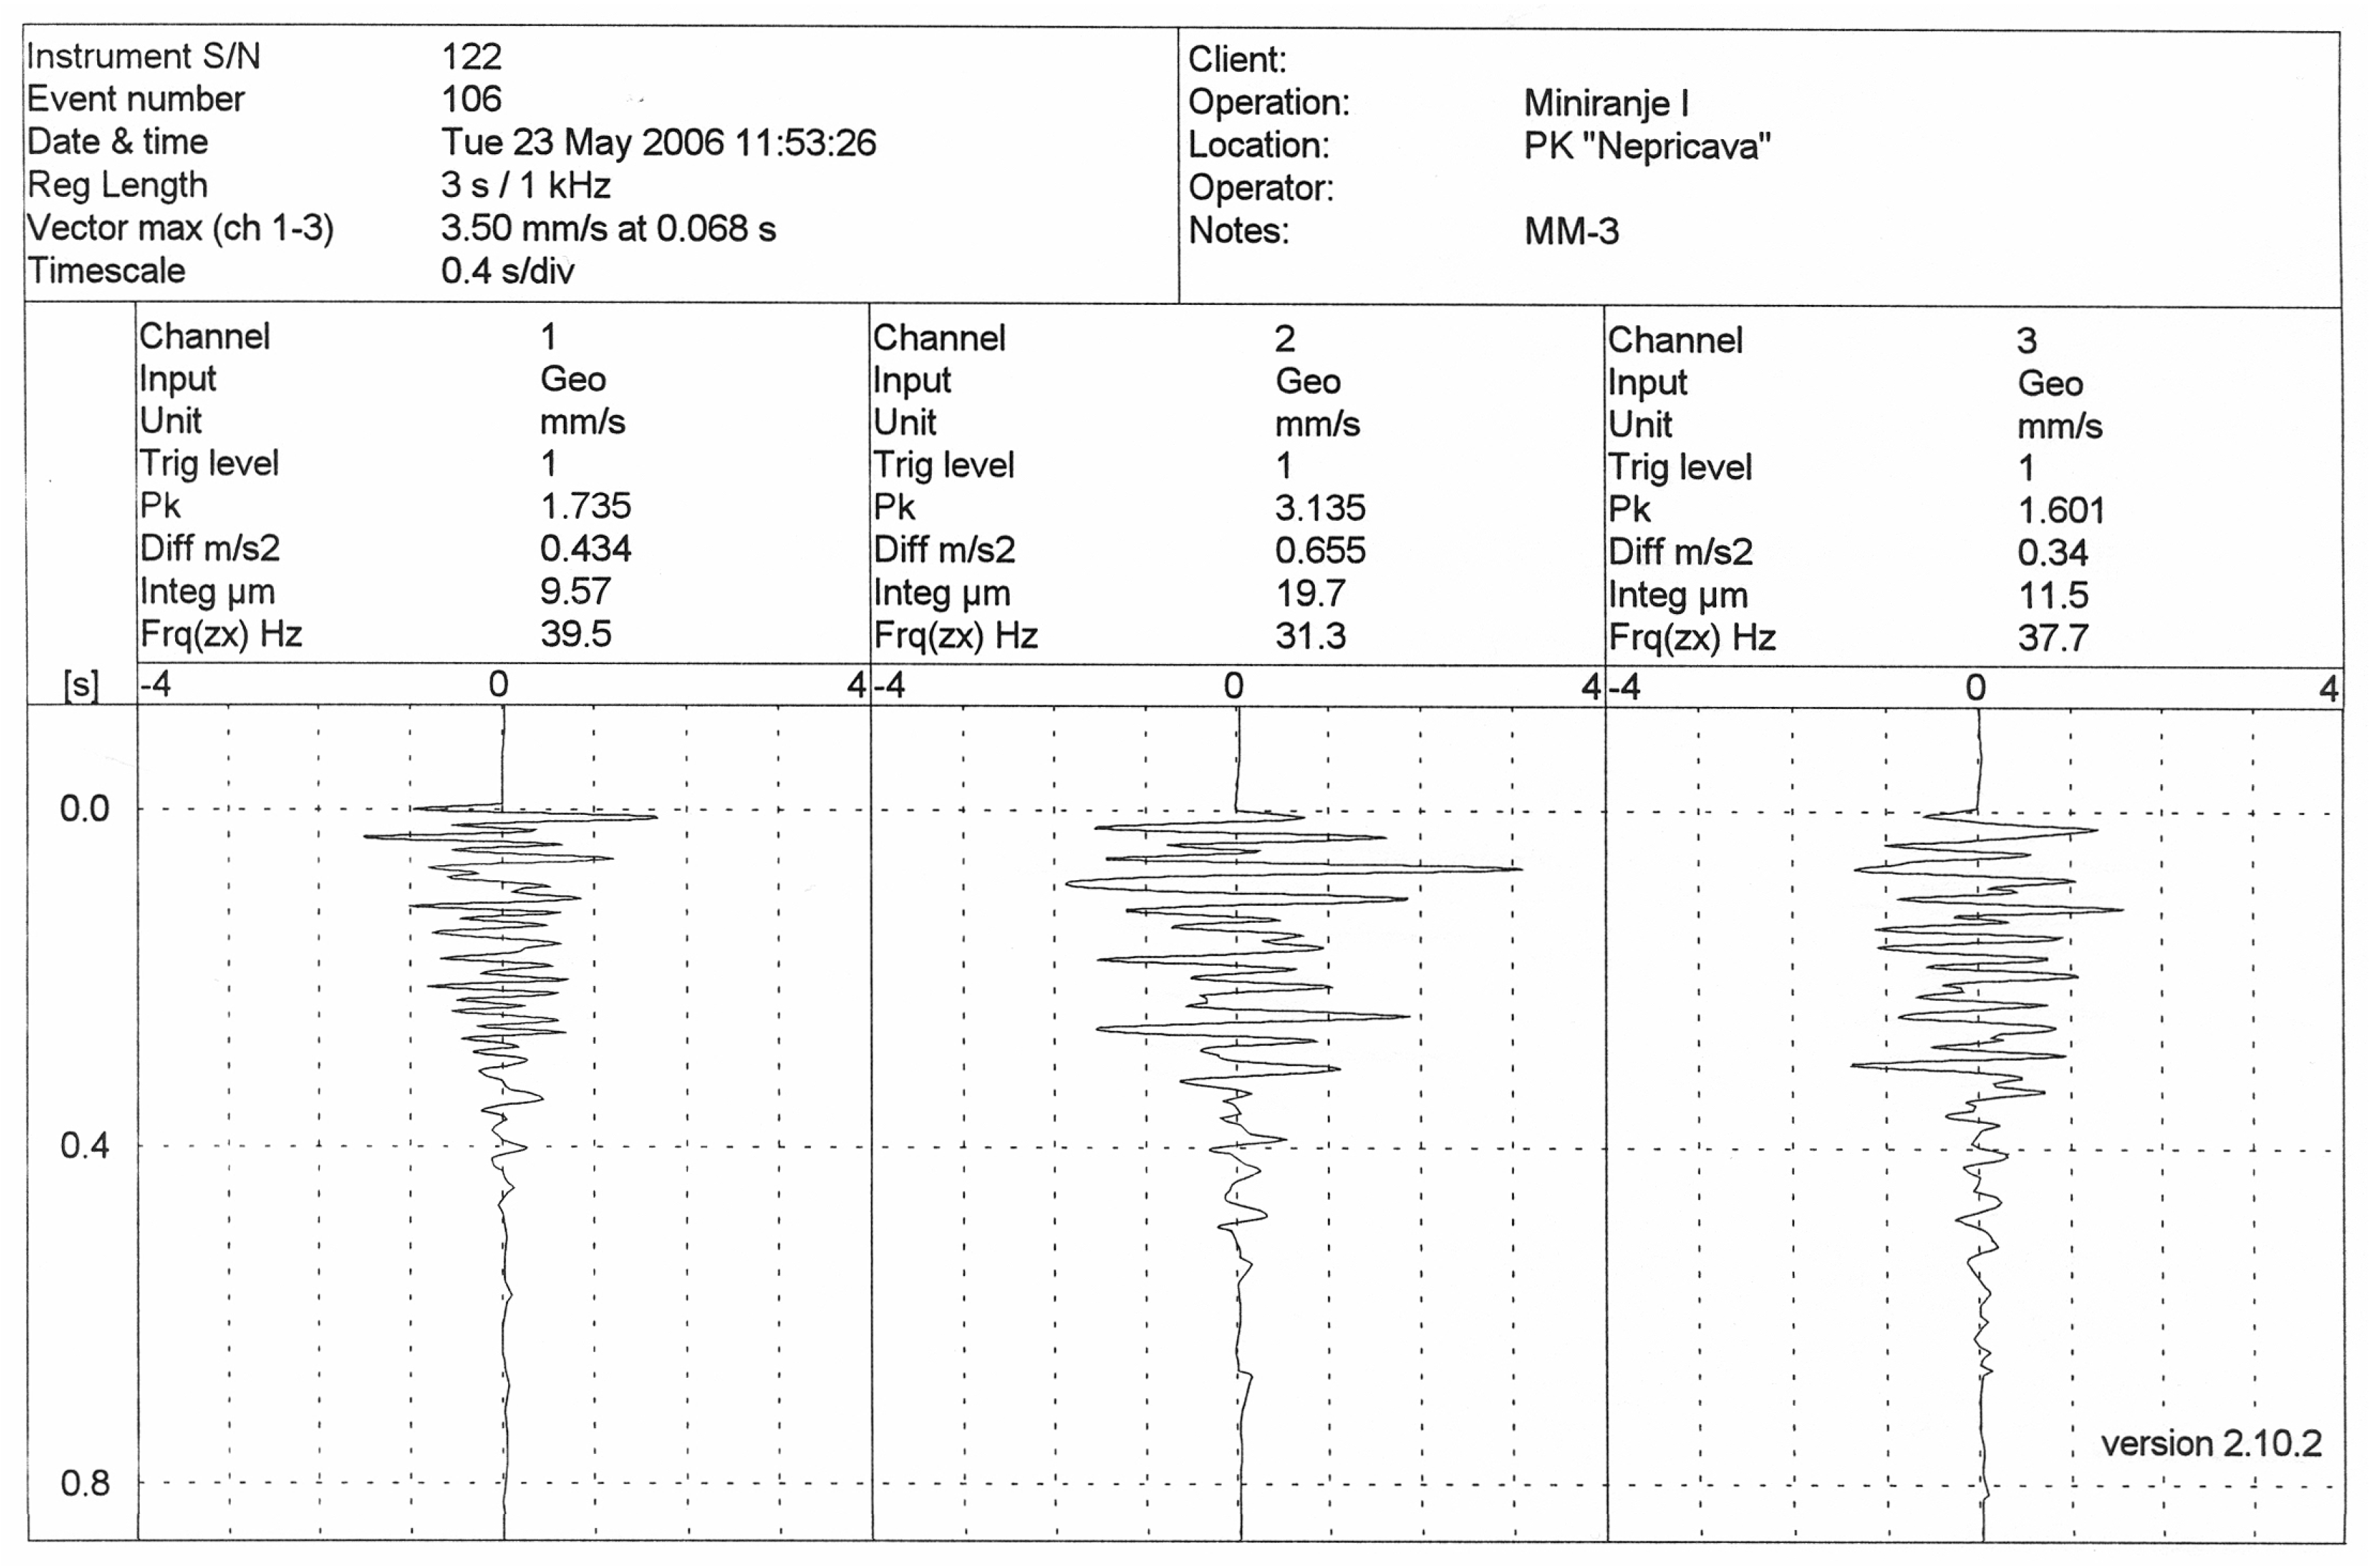
In
Figure 1 is shown the recording of oscillation velocity of the ground intended for blasting No. I—measuring point No. 3 at PK Nepričava.
3. Equation of Rock Mass Oscillation
To establish the correlation between the oscillation velocity and three basic parameters affecting its size: the explosive quantity, properties of rock material and the distance, there have been developed several mathematical models in the world. One of the most frequently used models, i.e., equations, is the equation of Sadovskii defining the law on velocity alteration of soil oscillation depending on the distance, the explosive quantity, and the way of blasting [
5,
6]. The equation defined in this way offers the possibility to determine the seismic effect of blasting towards a facility or a settlement, whereby the connection, between the velocity of soil oscillation and consequences that can affect facilities, is used. The equation of M.A. Sadovskii [
7] is given in the form:
where there are:
v—the velocity of rock mass oscillation (cm/s)
K—the coefficient conditioned by soil characteristics as well as blasting conditions where the explosive amount is given by way of the volume. K is being determined by terrain surveying,
n—the exponent, conditioned by soil properties and mining conditions and determined by field measurements as well,
r—the distance from the blast site to the monitoring point (m),
Q—the amount of explosive (kg),
R—reduced distance, expressed as .
3.1. Derivation of Equation of Rock Mass Oscillation
Sadovskii’s equation has been derived from the following condition: if the radius of the charge
r0 and the distance from the blast site to monitoring point
r increase in the same or approximately the same ratio, the soil oscillation velocity
v remains the same. Sadovskii equation, given in Equation (1) may be expressed in the form [
7]:
which denotes:
v—the velocity of rock mass oscillation (cm/s)
Kv—the coefficient conditioned by rock mass characteristics as well as blasting conditions where the explosive amount is given through radius of the explosive charge. K is being determined by terrain surveying,
r—the distance from the blast site to the monitoring point (m),
r0—the radius of the explosive charge,
n—the exponent, conditioned by rock mass properties and mining conditions and determined by field measurements as well.
The radius of the explosive charge
r0 and the amount of explosive
Q are related by the equation:
By replacing the value
r0 from the Equation (4), in the Equation (3), we obtain:
whereas:
whereby:
R—the reduced distance is the distance from blasting point to observation point reduced to a quantity of explosive and given in the following form .
Thus, we have obtained the oscillation law of rock mass, i.e., the equation of Sadovskii.
3.2. The Property of the Rock Mass Oscillation Equation
The rock mass oscillation equation, given in the Equation (1) may be written in the form:
Then from the Equation (7) for the derivation
v′(
R), we obtain:
which may be written in the form:
Having in mind Equation (7), from the Equation (9), we obtain:
If Lagrange’s equation is applied to the function
v(
R) from (7), in the final growth increment, we obtain:
For small absolute values
h, from (11), we obtain the relation:
Having (10) in mind, relation (12) becomes:
A significant property of the equation of rock mass oscillation velocity depending on the reduced distance which is obtained from the relation (13) is as follows: if the reduced distance
R from any level is increased (decreased) by 1%, the oscillation velocity of the soil
v will decrease (increase) by approximately
n% [
8].
Indeed, for
, from (12) we obtain:
3.3. Models to Determine the Parameters of Equation of Rock Mass Oscillation Velocity
In the Equation (1) two parameters appear, K and n, which need to be determined for a specific work environment and specific blasting conditions. Given the property of the rock mass oscillation equation, it is possible to determine the parameters K and n in many ways, i.e., models, using the values obtained by experimental measurements.
3.3.1. Model 1—Determining the Parameters by Applying the Least Square Method
The Least Square Method is mainly used to obtain the parameters
K and
n which represents a common model [
9,
10].
3.3.2. Model 2—Determining the Parameters through the Application of Quotient of Products of the Same Number of Reduced Distances and Oscillation Velocities
According to this model, determination of the parameter
n is based on the quotient of the product of equal number of experimental data of the rock mass oscillation velocity
v, using the oscillation velocity equation. In this way, first, we determine the parameter
n, and then with parameter
n found, we determine the parameter
K from the rock mass oscillation equation, which will be shown cases [
8].
Let
v1,
v2, …,
vN be the rock mass oscillation velocity values obtained for corresponding reduced distances
R1,
R2, …,
RN. Proceeding from the equation for the rock mass oscillation velocity, given by the Equation (1) we can assume, that for pairs (
Rm,
vm) the following relations are valid:
from where we obtain the relation:
i.e., relation:
From relation (17) by the logarithm operation we obtain:
In this way we obtained the value of the parameter n, which we will include into the Equation (1). Now we have the Equation (1) in which there is the unknown parameter K.
If we insert the values of pairs (
Rm,
vm),
m = 1, 2, …,
N, into the Equation (1), we will obtain one after the other:
wherein for the parameter
K, we take the mean value, i.e.,
With the values of n and K obtained in this manner, the rock mass oscillation equation is reduced to: .
3.3.3. Model 3—Determining the Parameters Using the Linear Connection between the Logarithms of Reduced Distances and the Logarithms of the Oscillation Velocity
To obtain a linear connection between reduced distance
R and rock mass oscillation velocity
v, the Equation (1) was converted to logarithm. In the observed experiment, in the coordinate system log
R-0-log
v, certain points (log
Ri, log
vi) will be below log
R axis. In this case, we will increase the values of the log
v ordinates by a positive number, so that all points are above the abscissa axis log
R [
11].
Such a procedure offers possibility to determine of parameters K and n from the equation for rock mass oscillation in a completely new way.
If the Equation (1) is converted to logarithm, we will obtain equation:
By introducing the change:
Equation (21) becomes a line equation:
We will increase ordinate values
by one positive number
c, so that all points
are above axis
, i.e., so that
. In this manner, the Equation (23) becomes equation:
In practice, for
c the following value can be taken:
In this case Equation (24) becomes equation:
Let us write Equation (26) in the form:
where:
If we connect points
by line segments
(
i = 1, 2, ...,
N − 1) we will get one broken line. In so doing, the area bounded by
x-axis, line segments
and
and broken line, consisting of (
N − 1) trapezoid [
12,
13], has the value:
Let’s mark the area bounded by line (27), lines
and
x-axis with
S. Its value is:
Let us assume that:
which means that:
In this manner we have obtained one link between coefficients A and B of the equation of line (27).
From Equation (32), it’s:
By replacing the value for
B from the Equation (33) into Equation (27), we obtain:
From Equation (34), we have:
Based on obtained experimental data of oscillation velocities
v1,
v2,
...,
vN and appropriate reduced distances
R1,
R2, ...,
RN and having in mind relations (22) and (27), we will calculate the value of
ST according to Equation (29). For each pair (
xi,
yi + 3) from Equation (35), we will determine the parameters
Ai,
i = 1, 2, ...,
N, and in so doing, for parameter
A, we will take the arithmetic mean value of parameters
Ai:
If the value of parameter
A obtained according to Equation (36), is replaced in the Equation (33), we will obtain the value of parameter
B. Based on the obtained values of parameters
A and
B and considering the relations (22), the Equation (27) becomes:
i.e., equation:
where from we obtain:
If we put that:
Equation (39) maybe written in the form:
i.e., in the form:
wherefrom we obtain:
3.4. Defining Statistical Criteria
For the above-mentioned models 1, 2 and 3, based on experimental data, we have obtained equations, which make possible to determine the oscillation velocities of the rock mass
v depending on the reduced distance
R. To assess the degree of connection between
v and
R, we have used the curved line dependency index
ρ [
14,
15].
The evaluation of the relationship degree of two variables [
7] to values of the curved line dependency index
ρ is given in the following survey:
0.0 < ρ < 0.2—none or highly poor correlation,
0.2 < ρ < 0.4—poor correlation,
0.4 < ρ < 0.7—significant correlation,
0.7 < ρ < 1.0—strong or highly strong correlation.
In order to make sure that the conclusions we reach based on the sample concerning the characteristics of the basic data set are credible, the sample needs to be representative. The sample will be representative, if it is, by its structure, like the basic set [
16].
4. Methodology and Results of Research
Practical part of this paper includes:
Experimental research carried out in Majdanpek open pit, situated in northern part of east Serbia and,
Investigations carried out during mass blasting in Nepričava open pit, located in central Serbia.
4.1. Experimental Investigation in Majdanpek Open Pit
4.1.1. General Characteristics of the Work Environment in Majdanpek Open Pit
In Majdanpek open pit we performed experimental investigations on copper ore [
17]. The basic physical and mechanical properties of the rock mass were determined on samples in the laboratory. By examining the physical and mechanical properties of the work environment, the following values were obtained:
compressive strength, σp = 109 MPa
bending strength, σs = 19 MPa
tensile strength, σI = 13 MPa
cohesion, C = 7.5 MPa
strength coefficient, f = 11
volume density, γ = 26 kN/m3
angle of internal friction, φ = 50°
porosity, p = 3.6%
4.1.2. Method of Blasting in Majdanpek Open Pit
The measurements of shocks resulting from blasting in Majdanpek open pit were performed during blasting using half-second electric detonators. Delay time of initiation between boreholes was 0.5 s, which led to ten explosions and appropriate rock mass oscillation velocities.
As explosive powdered ammonium nitrate for general purposes Amoneks-I manufactured by Trayal from Kruševac, Serbia was used. The holes were arranged in a single line while one cartridge of explosive was placed in each hole. Diameter of explosive cartridge was 28 mm, cartridge length 0.15 m, and cartridge weight 0.1 kg. Electric capacitor was used for initiation of the explosive [
17].
During experimental investigations performed in Majdanpek open pit, the following blasting parameters were specified:
depth of borehole: 0.5 m,
weight of explosive charge per borehole: 0.10 kg,
number of boreholes: 10,
distance between boreholes: 1.0 m,
distance between measuring point and the first borehole: 5.0 m,
time delay between initiation of boreholes: 0.5 s.
4.1.3. Calculation of Parameters of Rock Masses Oscillation Equation in Majdanpek Open Pit
The values of distance from the blasting point to the point of observation
r, quantity of explosive
Q, calculated values of reduced distances
R, registered values of rock mass oscillation velocities by components
vt,
vv,
vl and resulting rock mass oscillation velocities
vrez for a total of ten explosions, are given in
Table 1.
Based on data given in
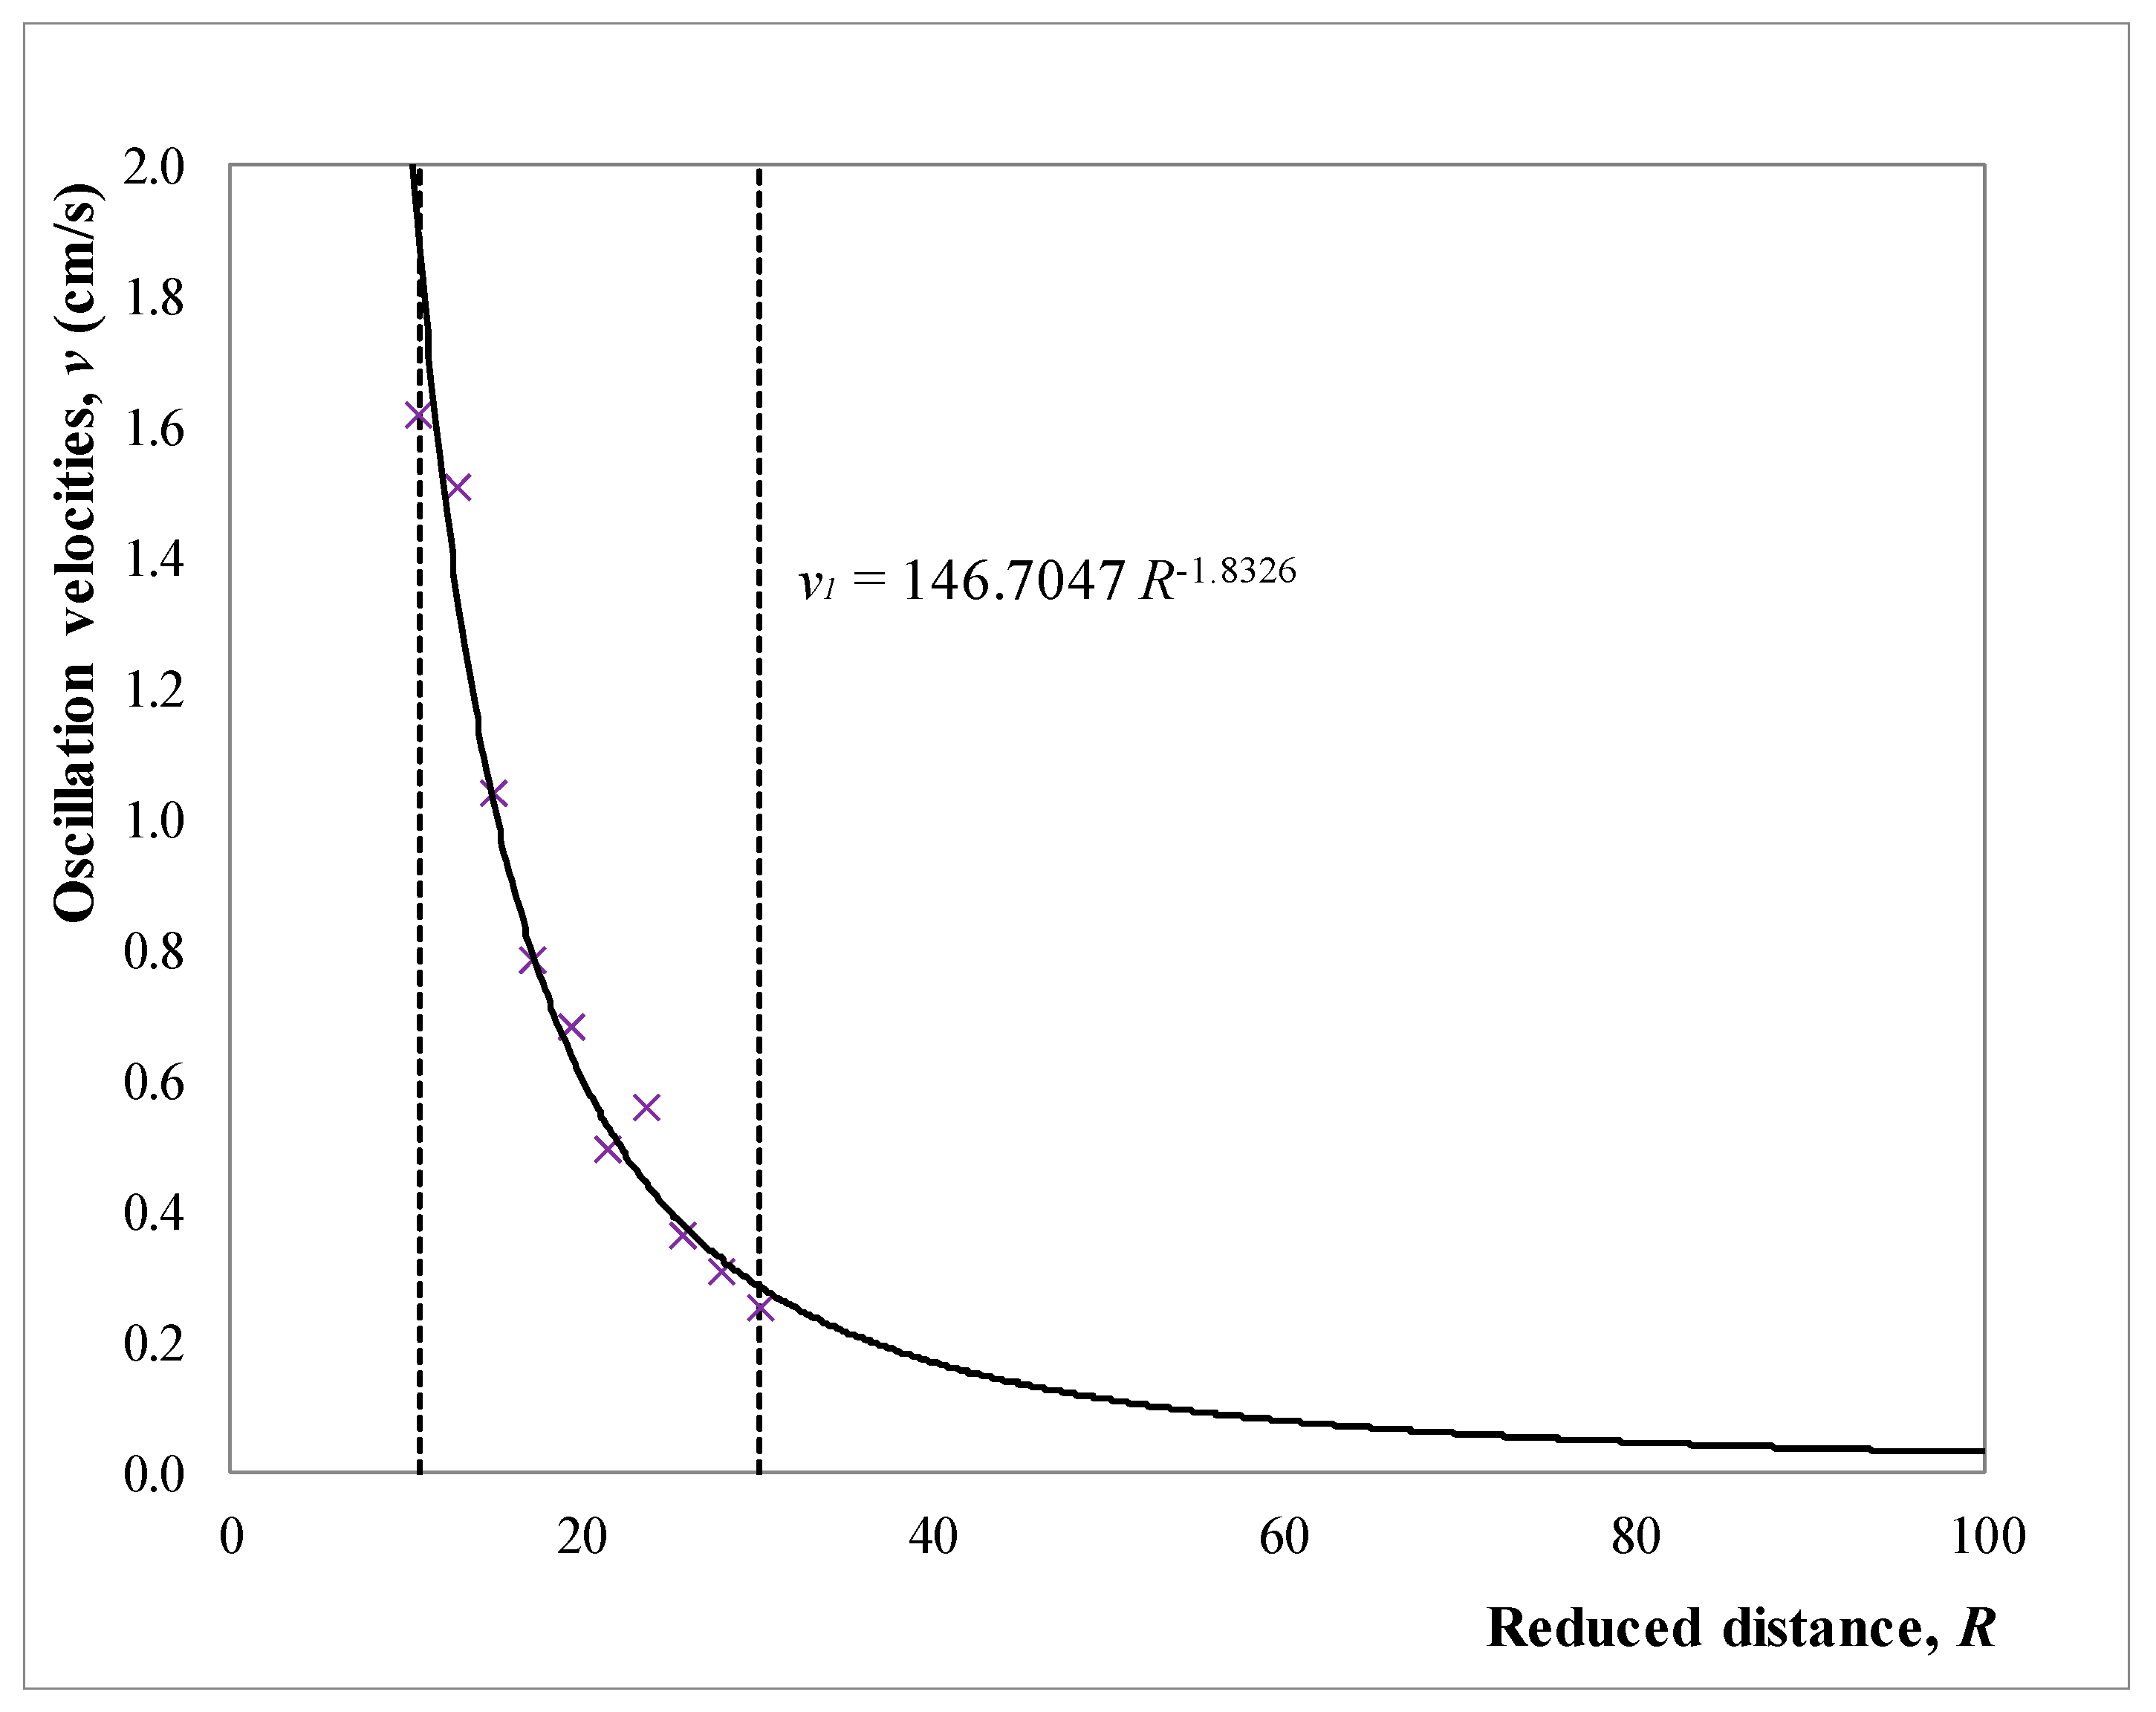
Table 1, the equation of rock mass oscillation is calculated by the Equation (1)—as per models 1, 2 and 3. The calculation of the curve was carried out for values of reduced distances from
R = 10.7722 to
R = 30.1621. Thus, curve parameters were calculated enabling us to determine the equation of rock mass oscillation in the form of:
Graphic representation of the rock masses oscillation equation in Majdanpek open pit is given in
Figure 2.
● Model 3
Table 2 shows the data for calculating the parameters of rock masses oscillation equation in Majdanpek open pit according to Model 3.
According to Equation (29), we obtain:
According to Equation (36), we find:
while according to Equation (33), we get:
If the obtained values of parameters A and B from (47) and (48) are put into Equation (27), we get:
Since
y = log
v,
x = log
R, then the Equation (49) becomes to equation:
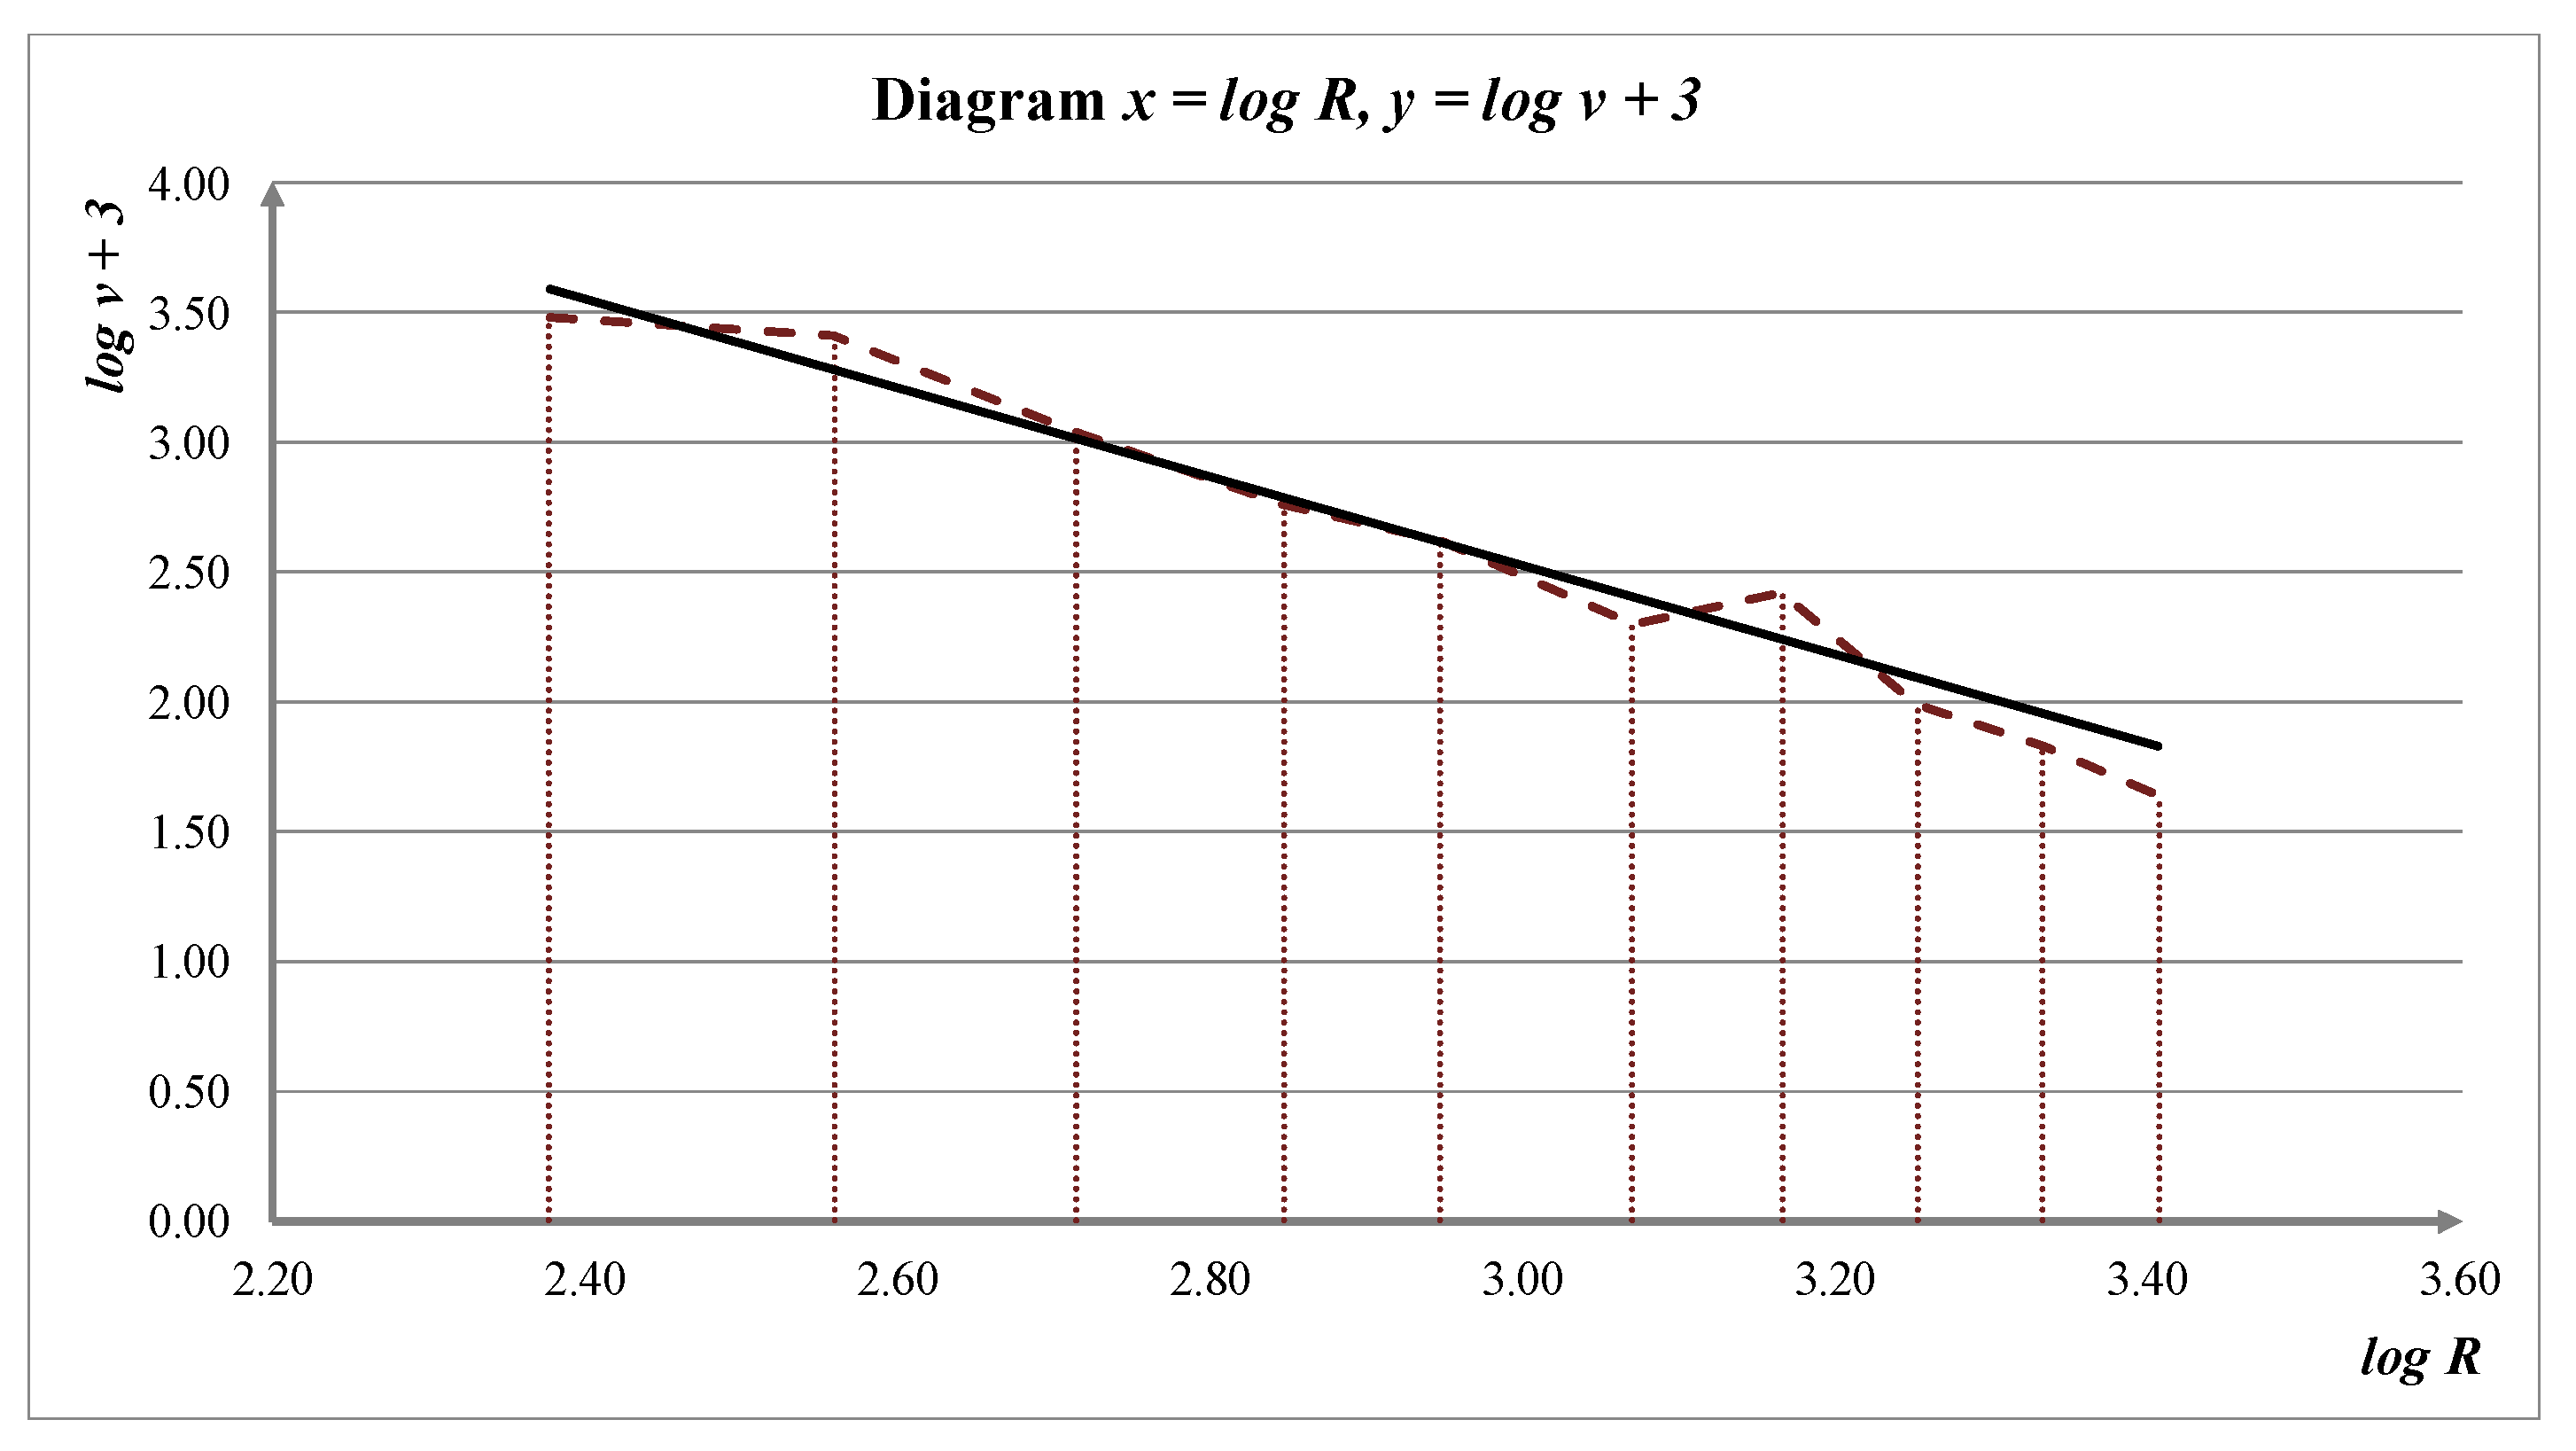
Figure 3 graphically represents the values of logarithms of the rock mass oscillation velocities and the logarithms of the reduced distances, whereby the logarithms of the rock mass oscillation velocity are increased by number 3.
In diagram shown on
Figure 3, the appropriate line is represented by Equation (50). From the Equation (50), we obtain:
Since:
then Equation (51) can be written in the form:
where from we obtain:
Based on the obtained Equations of soil oscillation (44), (45) and (54), it is possible to calculate values of rock mass oscillation velocities for corresponding reduced distances for models 1, 2 and 3.
In
Table 3, is presented the survey of reduced distances
R, recorded oscillation velocities
vr, calculated oscillation velocities
vi1,
vi2,
vi3 as well as the difference between recorded and calculated soil oscillation velocities for models 1, 2 and 3.
Based on the data in
Table 3, a statistical analysis was carried out and the following values were obtained:
for model 1:
The curved line dependency index ρ1 between the reduced distance R and rock mass oscillation velocity v is:
ρ1 = 0.9730 (there is a strong correlation between R and v, given in the Equation (44)),
for model 2:
ρ2 = 0.9694 (there is a strong correlation between R and v, given in the Equation (45)),
for model 3:
ρ3 = 0.9789 (there is a strong correlation between R and v, given in the Equation (54)).
4.2. Investigation during Mass Mining in Nepričava Open Pit
4.2.1. General Characteristics of Nepričava Open Pit
The Nepričava open pit is a part of the municipality of Lajkovac. It is situated on the left bank of the Kolubara River in Central Serbia, and belongs to Kolubara District.
The limestone deposit Nepričava consists of rock masses of sedimentary origin, not entirely homogeneous in composition. Limestones are the most important lithological members from both economic aspect and aspect of mining exploitation technology.
Physical and mechanical properties of limestone in the deposit are spatially very uneven. Examination of physical and mechanical properties of the working environment, submitted the following results:
Compressive strength 21.1–93.0 MPa
Volume weight 17.1–26.3 kN/m3
Density 0.97–0.99 kN/m3
Porosity 0.0004%–0.026%
Water suction 0.08%–0.23%
4.2.2. Blasting Method
Measurements of seismic shocks at the Nepričava open pit were performed during blasting, conducted for deposit exploitation [
18]. Three blasting operations were performed.
Balkanit 60/1000 and Videksil 65/2000 (Videks Company, Sofia, Bulgaria) were used as explosive materials. The activation of explosives in boreholes was performed using detonating fuse C-12, while initiating of detonating fuse was performed with blasting cap No. 8. decelerators between boreholes had the interval delay of 20 ms.
Basic data related to the number of boreholes
Nb, the overall explosive amount
Quk, the maximal explosive amount by deceleration interval
Qi, overall borehole depth
Luk and average stemming length
Lpc, are presented in
Table 4.
4.2.3. Calculation of Rock Mass Oscillation Equation Parameters
Values of distances from blast sites to monitoring points
r, the amount of explosive
Q, calculated values of reduced distances
R, recorded values of rock mass oscillation velocities by components
vt,
vv,
vl and resulting oscillation velocities
vrez for blasting from I to III of totally five measuring points MM are given in
Table 5.
Based on data given in
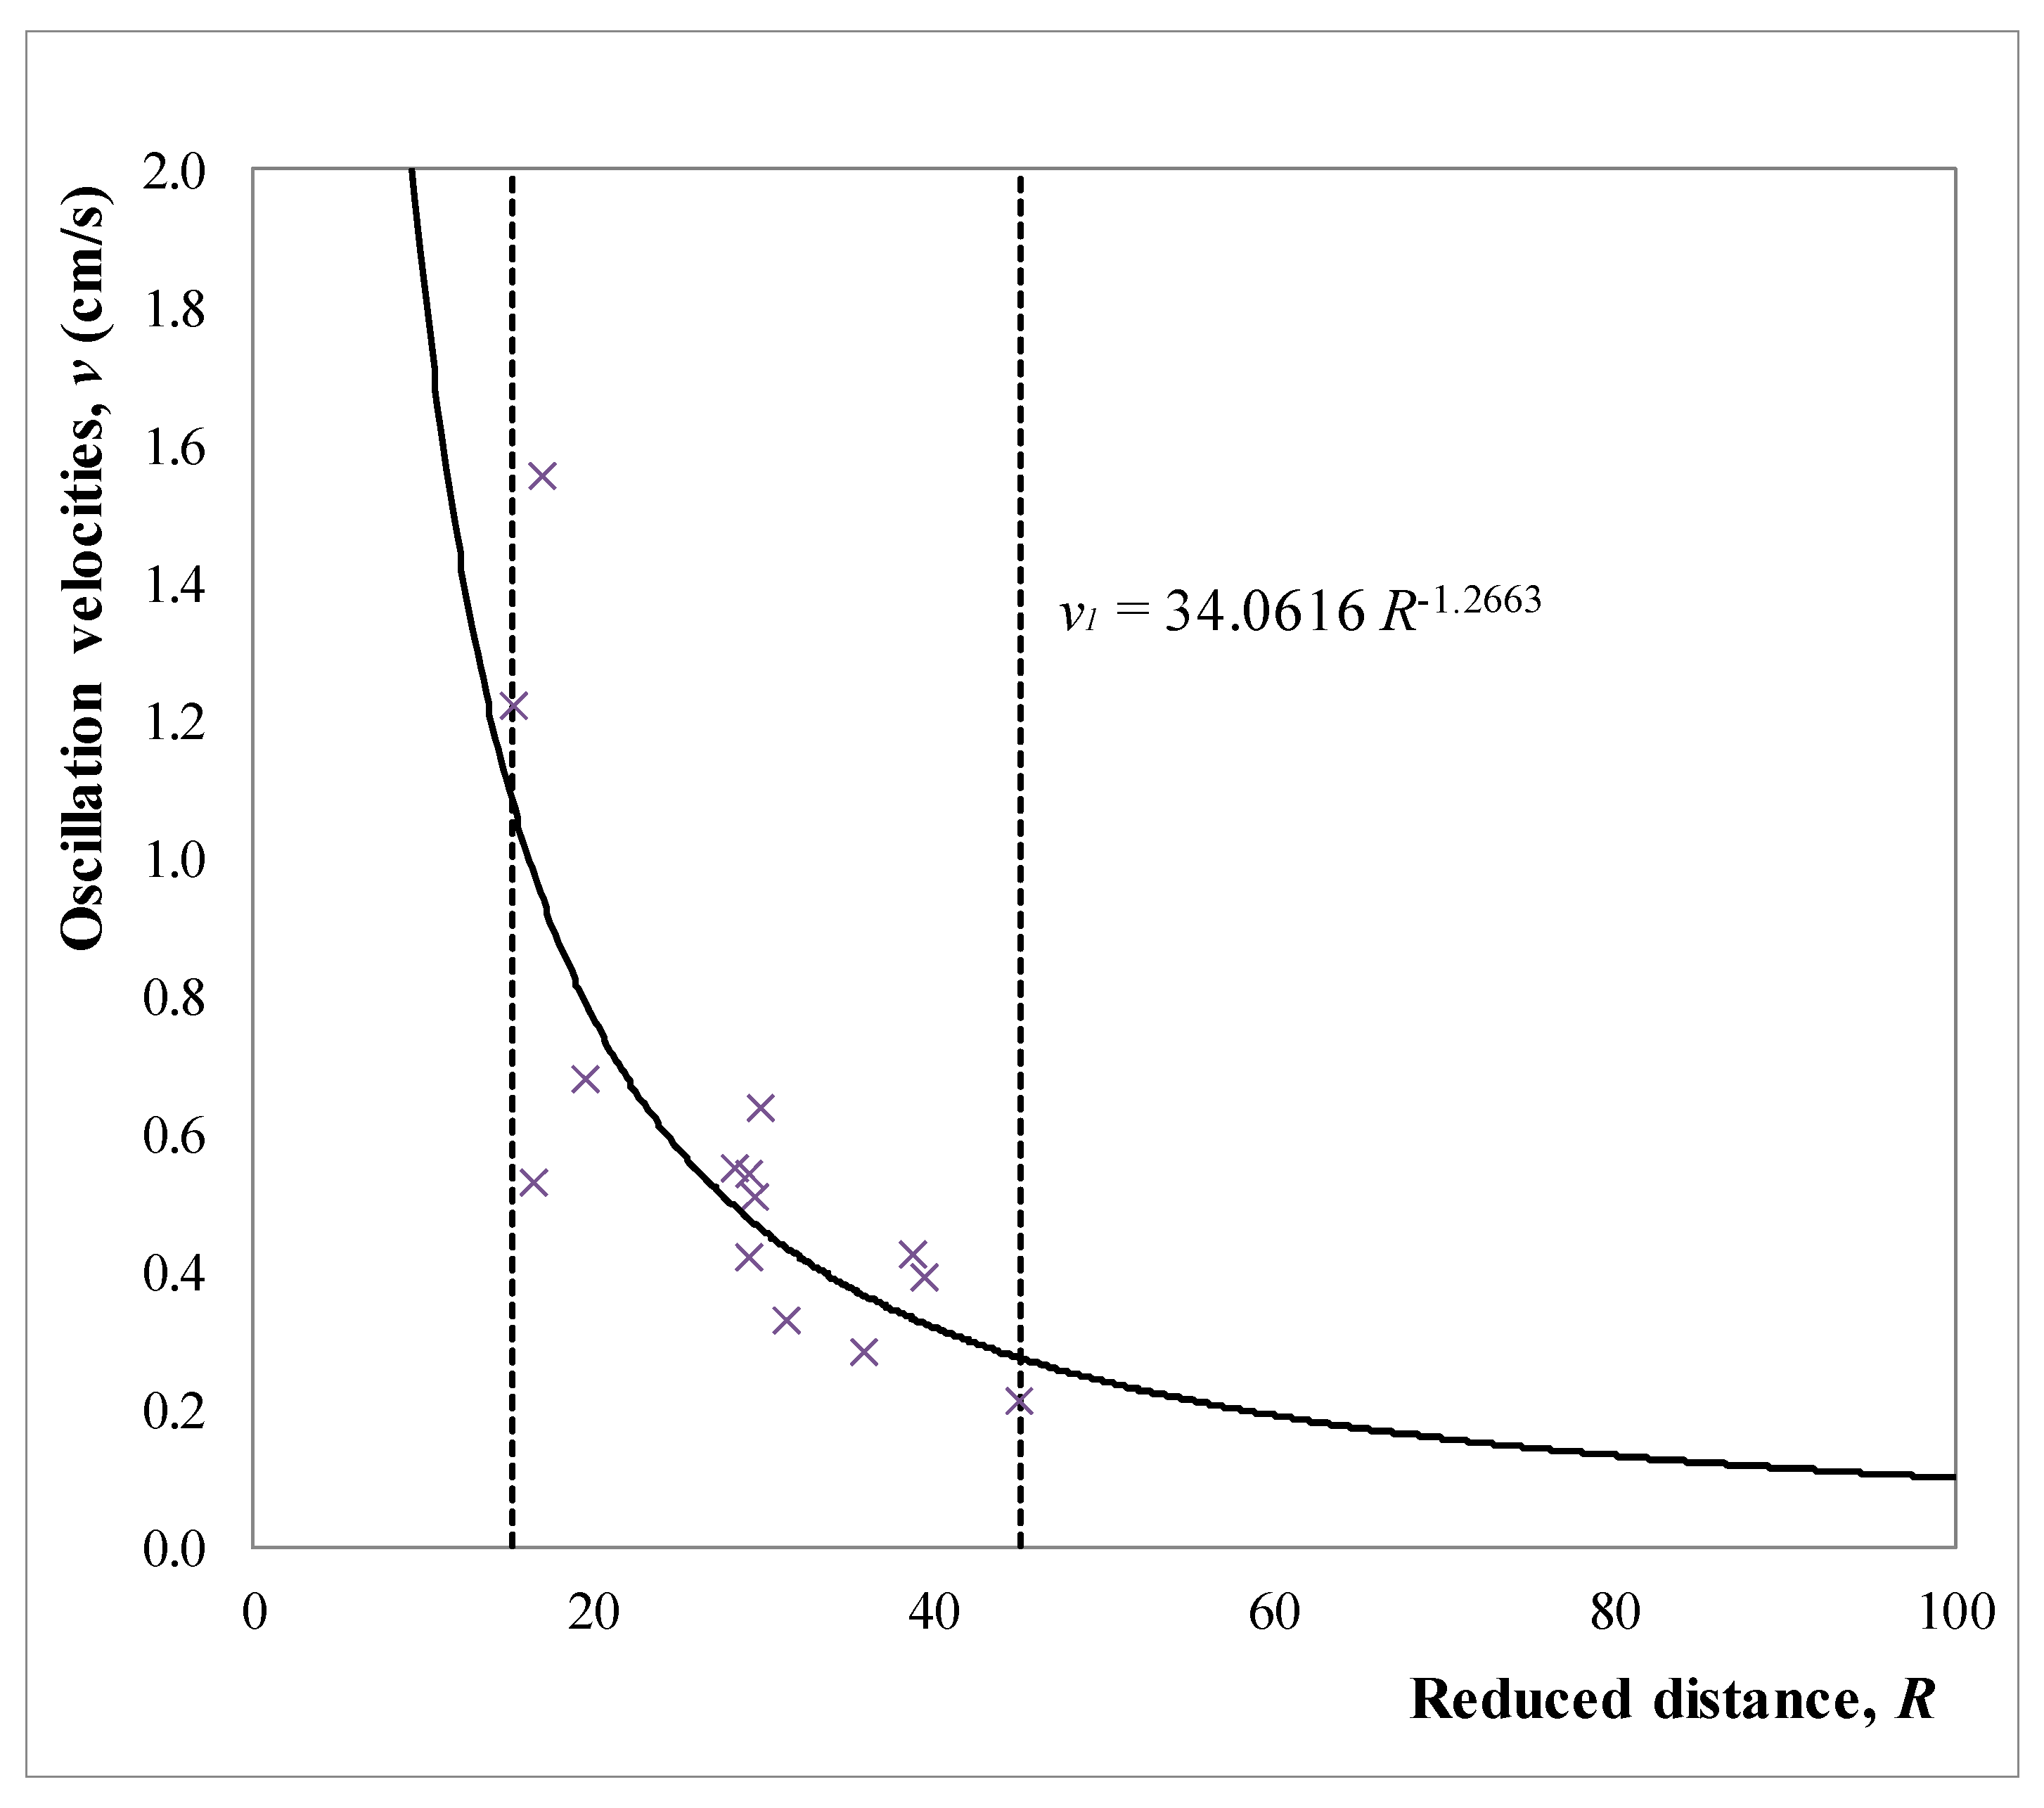
Table 5, the equation of rock mass oscillation is calculated by the Equation (1)—by the models 1, 2 and 3. The calculation of the curve was carried out for values of reduced distances from
R = 15.2808 to
R = 45.0858. Thus, curve parameters were calculated enabling us to determine the equation of rock mass oscillation in the form of:
Graphic representation of the rock masses oscillation equation in Nepričava open pit is given in
Figure 4.
● Model 3
Table 6 shows the data for calculating the parameters of rock masses oscillation equation in Nepričava open pit according to Model 3.
According to Equation (29), we obtain:
According to Equation (36), we find:
while according to Equation (33), we get:
If the obtained values of parameters
A and
B from (58) and (59) are put into Equation (27), we get:
Since
y = log
v,
x = log
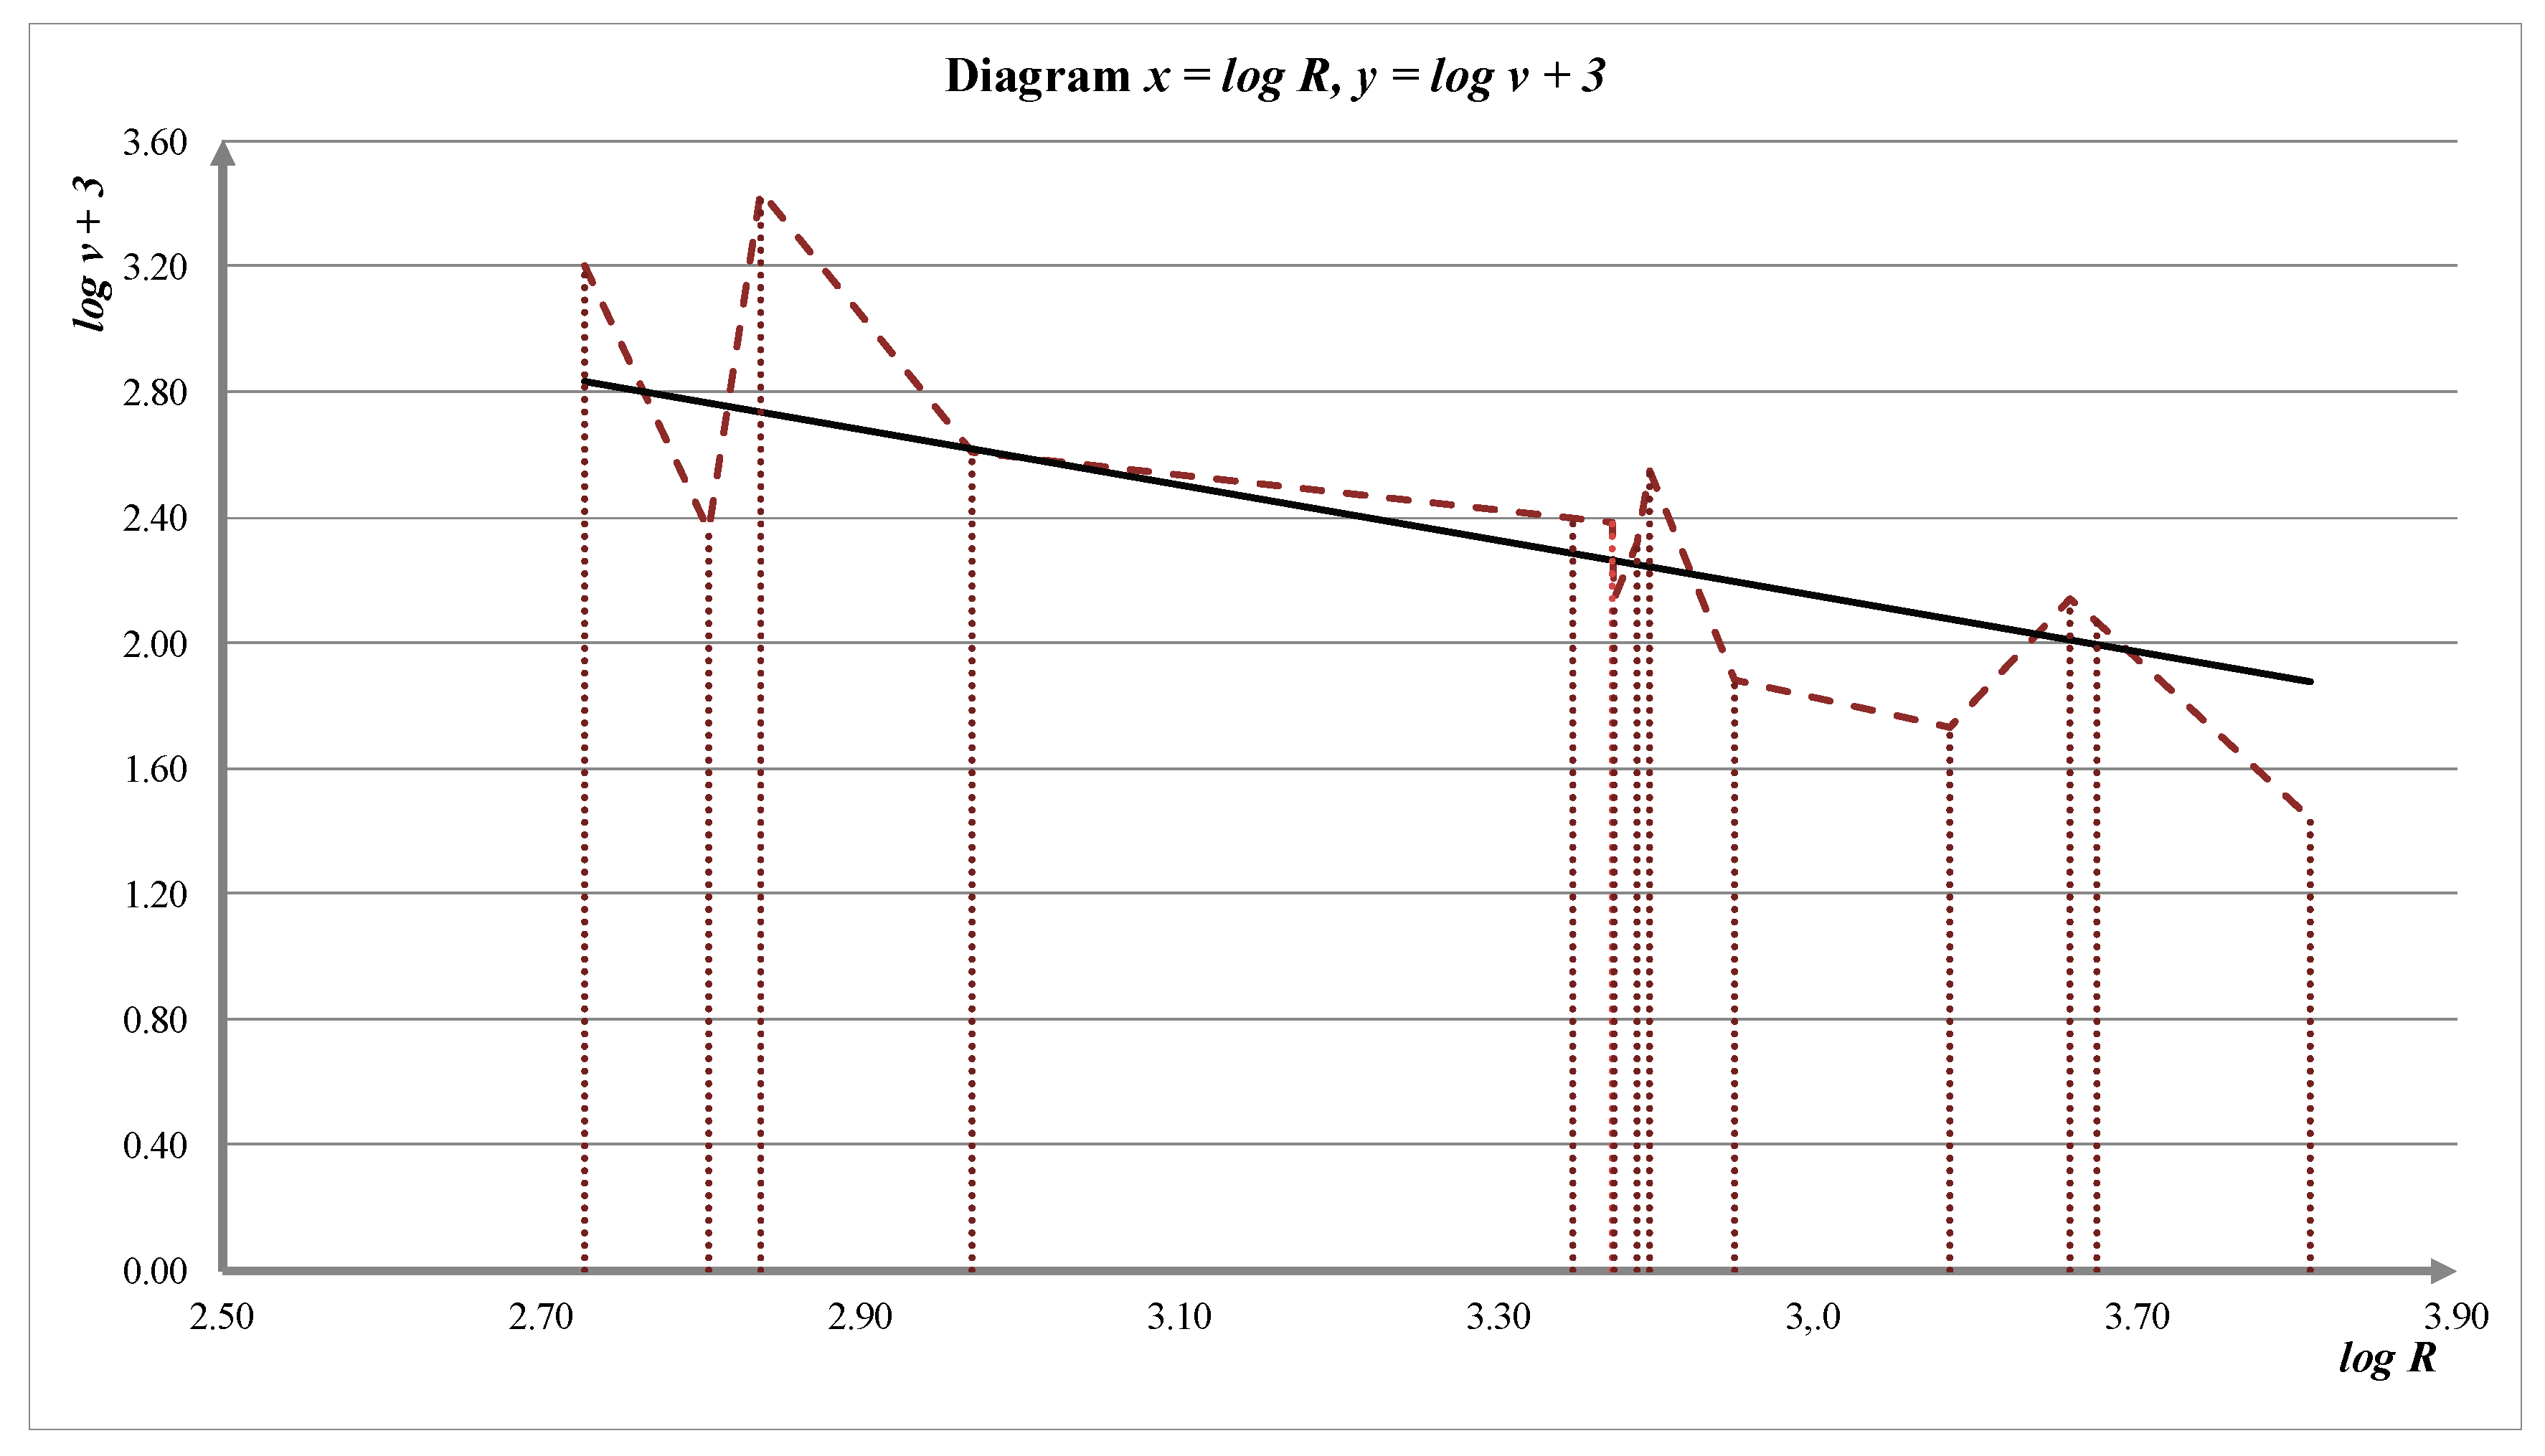
R, then the Equation (60) comes down to equation:
Figure 5 graphically represents the values of logarithms of the rock mass oscillation velocities and the logarithms of the reduced distances, whereby the logarithms of the rock mass oscillation velocity are increased by number 3.
In diagram shown on
Figure 5, the appropriate line is represented by Equation (61). From the Equation (61), we obtain:
Since:
then Equation (63) can be written in the form:
where from we obtain:
Based on the obtained equations of rock mass oscillation (55), (56) and (65), it is possible to calculate values of rock mass oscillation velocities for corresponding reduced distances for models 1, 2 and 3.
In
Table 7, there is presented the survey of reduced distances
R, recorded oscillation velocities
vr, calculated oscillation velocities
vi1,
vi2,
vi3, as well as the difference between recorded and calculated rock mass oscillation velocities for models 1, 2 and 3.
Based on the data in
Table 7, a statistical analysis was carried out and the following values were obtained:
for model 1:
The curved line dependency index ρ1 between the reduced distance R and rock mass oscillation velocity v is:
ρ1 = 0.7786 (there is a strong correlation between R and v, given in the Equation (55)).
for model 2:
ρ2 = 0.7831 (there is a strong correlation between R and v, given in the Equation (56)).
for model 3:
ρ3 = 0.6937 (there is a significant correlation between R and v, given in the Equation (65)).
5. Conclusions
To establish the relationship between the oscillation velocity of the rock mass and basic parameters affecting its magnitude, being: the amount of explosive, the distance from the blast site, characteristics of the rock mass and the type of blasting, it is the equation of M. A. Sadovskii that is used most commonly.
Significant property of the equation of rock mass oscillation velocity depending on the reduced distance, obtained in this paper, is as follows: if the reduced distance R from any level is increased (decreased) by 1%, the oscillation velocity of the rock mass v will decrease (increase) by approximately n%.
In this paper, parameters n and K from Sadovskii’s equation were determined in three ways—models in the given work environment. In addition to the usual least squares method, two new models were applied to determine the parameters. In model two, the parameters of the rock mass oscillation equation were determined through the application of quotient of products of the same number of reduced distances and oscillation velocities. With model three, the parameters of the rock mass oscillation equation were determined using the linear connection between the logarithms of reduced distances and the logarithms of the oscillation velocity. In so doing, appropriate functions were obtained which showed the rock mass oscillation velocity depending on reduced distance.
Comparing values of the recorded oscillation velocities of the rock mass with the corresponding calculated ones, they are approximately then calculated corresponding indices of curvilinear correlation show that between the reduced distance and the rock mass oscillation velocity there is a significant and very strong curvilinear relationship expressed by the functions obtained, so we conclude that all three models can be used to calculate the rock mass oscillation velocity.


