Article

Structural Characterization of the Body Frame and Spicules of a Glass Sponge

1
Faculty of Natural System, Institute of Science and Engineering, Kanazawa University, Kakuma, Kanazawa, Ishikawa 920-1192, Japan
2
Department of Molecular Chemistry and Biochemistry, Faculty of Science and Engineering, Doshisha University, 1-3 Tatara Miyakodani, Kyotanabe, Kyoto 610-0394, Japan
*
Author to whom correspondence should be addressed.
Minerals 2018, 8(3), 88; https://doi.org/10.3390/min8030088
Submission received: 6 February 2018 / Revised: 20 February 2018 / Accepted: 24 February 2018 / Published: 27 February 2018

Abstract

:
The nanostructure (atomic-scale structure) and water species in the body frame and spicules of the marine glass sponge, Euplectella aspergillum, collected from the sea floor around Cebu Island was characterized in detail by thermogravimetric differential thermal analysis, nuclear magnetic resonance spectroscopy, Raman and infrared spectroscopies, and X-ray diffraction method. The structural features of the nanostructure in the body frame and spicules were essentially similar to each other, although these were different from those of inorganic amorphous silica materials, such as silica gel and silica glass. In addition, the averaged short and medium range structures of the sponge may be similar to those of tridymite. The water content and water species included in the body frame and spicules were almost the same. More than half of the contained water was physisorbed water molecules, and the rest was attributed to Q3 and Q2 silanol groups. Most of the water species may be present at the surface and involved in hydrogen bonding.

1. Introduction

The classes of marine sponges, Demospongiae and Hexactinellida, have the biomineralized siliceous component in their body [1]. The sponges of the class Hexactinellida are commonly called glass sponges. These glass sponges can live in any ocean [2] and their skeletons are composed of hydrated amorphous silica [3]. Glass sponges have interesting silicic fibrous root-like structures, which appear to grow from the bottom of their cylindrical body frame. This root-like part is called a spicule and anchors the sponge to the soft sediment of the sea floor [2,3]. The cross-sectional scanning electron microscope (SEM) images of the glass sponge (Euplectella aspergillum) revealed that the spicules were formed from consolidated spherical silica particles with a diameter of 50–200 nm [4]. Using the X-ray small angle scattering method, Woesz et al. [5] demonstrated that the small particles were composed of even smaller particles, which were less than 3 nm in diameter. These small particles were formed around a proteinaceous axial filament in the center of the spicule [4,6]. In addition, SEM observations showed that the body frame is basically formed from a bundling spicule with an extremely intricate construction [4,6]. However, few studies have examined the silica nanostructure (atomic-scale structure) of the body frame and spicule. Gendron-Badou et al. [7] examined the sponge spicules using infrared, 29Si {1H} cross-polarization magic angle spinning (CP-MAS) as well as 1H and 29Si MAS nuclear magnetic resonance (NMR) spectroscopies, which revealed that the spicules have a Si–O–Si network structure containing single and germinal silanol (Si–OH) groups. However, details about the silica nanostructure and the water species included in the skeleton of glass sponges remained poorly understood. Cha et al. [8] reported that the proteinaceous axial filaments isolated from spicules in a Demospongiae was shown to induce the polymerization of silica from the TEOS (Si-tetraethoxide, Si[C2H5O]4) substrate when combined with TEOS and axial filament. The silica synthesis was promoted by a protein called silicatein solubilized from the axial filament [8]. Silicatein-like proteins were also identified in the hexactinellid sponges [9]. The protein “glassin” rapidly accelerates silica polycondensation over a pH range of 6–8, when combined with silicic acid solutions [9]. In addition, the spicule of Demospongiae can crystallize into cristobalite at lower temperature (850 °C), which is possibly due to the presence of silicatein [10]. These studies showed that precise structural information on the sponge spicule and body frame designed by some proteins may be essential in the synthesis of amorphous and crystalline silica materials with less environmental burden and the development of new materials.
On the other hand, the distribution of the ring structure made of SiO4 tetrahedra, which is constituted of the amorphous silica, varies greatly according to different silica materials. For example, the average structure of silica gel may be four-membered ring [11], although the silica glass may be mainly composed of a ring with more than six-membered ring [12,13,14,15]. Therefore, it is interesting to elucidate the nanostructure from the perspective of material science, especially the ring structure of biogenic silica, e.g., the skeletons of glass sponge and radiolarian and the frustule (shell) of diatom, compared with the inorganic silica materials. Namely, in order to develop and accelerate the synthesis of biological silica, it is necessary to know the specific features of the formed structure. In addition, we conceive that crystallization of spicules of Demospogiae [10] at low temperature is derived from an amorphous structural feature. The results may also give new important insight to the protein, which controls the formation of silica structure.
In this study, the body frame and spicules of the glass sponge, Euplectella aspergillum, were examined by thermogravimetric differential thermal analysis (TG-DTA), 1H static NMR and 1H–29Si CP-MAS NMR spectroscopies, Raman and infrared spectroscopies, and X-ray diffraction (XRD) analysis. Our aim was to determine precisely the nanostructure and water species in the sponge and to reveal the structural differences between the body frame and spicules.

2. Materials and Methods

2.1. Sample

The hexactinellid sponges, Euplectella aspergillum, used in this study were collected from the sea floor near Cebu Island (Philippines; Figure 1). Silica gel synthesized by a typical sol-gel method (described by [16]) and commercially available fused silica glass [17] were used as reference materials. The chemical composition of the skeletal body frame, the spicules, and silica glass were determined by X-ray fluorescence analysis (Rigaku ZXS Primus II, Tokyo, Japan) with an acceleration voltage of 50 kV and current of 20 mA (Table 1). The body frame and spicules were composed of >99% SiO2. Only spicules were found to contain PdO, but the determination of its content needs more accurate analysis.

2.2. TG-DTA

TG-DTA measurements for body frame, spicule, and silica gel were performed using a Rigaku Thermo Plus 2 TG 8120 instrument (Tokyo, Japan). Powdered samples (10 mg) were placed in a platinum pan and heated to 1400 °C at a heating rate of 10 °C/min under a nitrogen atmosphere.

2.3. NMR Spectroscopy

NMR measurements were performed using a JNM-ECX 500II (JEOL, Tokyo, Japan) spectrometer operating at resonance frequencies of 99.37 MHz and 500.16 MHz for 29Si and 1H, respectively. The powdered body frame of the sponge and silica gel were taken in a 3.2 mm zirconia rotor to perform 29Si CP-MAS and 1H static single pulse measurements. Both 29Si and 1H chemical shifts were referenced to the signal of tetramethylsilane (TMS). The 29Si CP-MAS NMR spectra were collected with a π/2 pulse (2.73 μs) and high-power decoupling (HPD) using two-pulse phase-modulated decoupling [19] with a phase modulation angle of 15°. The 1H decoupling frequency and spin-locking frequency were 73.3 kHz and 91.6 kHz, respectively. These spectra were collected using a contact time of 8 ms and a recycle delay of 1 s. A MAS speed of 10 kHz was employed for the samples. The 1H static NMR spectra were collected with a recycle delay of 10 s. To estimate the water content of the samples from 1H peak area (all 1H peaks in the samples were assumed to be due to H2O), adamantine was mixed with the sample as an internal reference. Unfortunately, the amount of spicule sample was not adequate to perform accurate NMR measurement in this study.

2.4. Raman and Infrared Spectroscopy

Raman spectra for all samples were recorded using a LabRAM HR800 spectrometer (Horiba Jobin Yvon, Kyoto, Japan) with 514.5 nm Ar laser light (Melles Griot, 43 Series Ion Laser, 543-GS-A02, Carlsbad, USA). A grating with 600 lines/nm provided a wavenumber resolution of 1.4–1.8 cm−1 and a spectral resolution of approximately ± 1.6 cm−1 in the spectral range. Spectra were accumulated for 60 s in the range of ν = 50–1500 cm−1 and 2500–3900 cm−1. The body frame and spicule were set on clay perpendicularly with a longitudinal direction for analysis of cross-sectional portions of samples. The body frame samples for Raman analysis were prepared from the top, middle, and bottom of the sample. The bottom portion is near the anchoring spicule.
The Attenuated total reflection (ATR) infrared (IR) measurements for all samples were performed using a Nicolet iN10 spectrometer (Thermo Fisher Scientific, Tokyo, Japan) equipped with a diamond crystal. The ATR-IR spectra of the body frame and spicule samples were recorded in the range of ν = 600–4000 cm−1. The band pass for all spectra was 4 cm−1.

2.5. XRD Analysis

Powder XRD measurements for all samples were recorded using a Rigaku RINT 2200 diffractometer (Tokyo, Japan) with CuKα radiation under an applied acceleration voltage of 40 kV and current of 30 mA. A θ–2θ scanning technique was used with a scan step of 0.05° with 2θ = 2–120° for sponge samples, silica gel, and silica glass. The total accumulation number was five for all measurements. For the samples after TG-DTA measurement, a θ–2θ scanning technique was adopted with a scan speed of 1.00° min−1 with 2θ = 2–60°.

3. Results

3.1. TG-DTA Curves

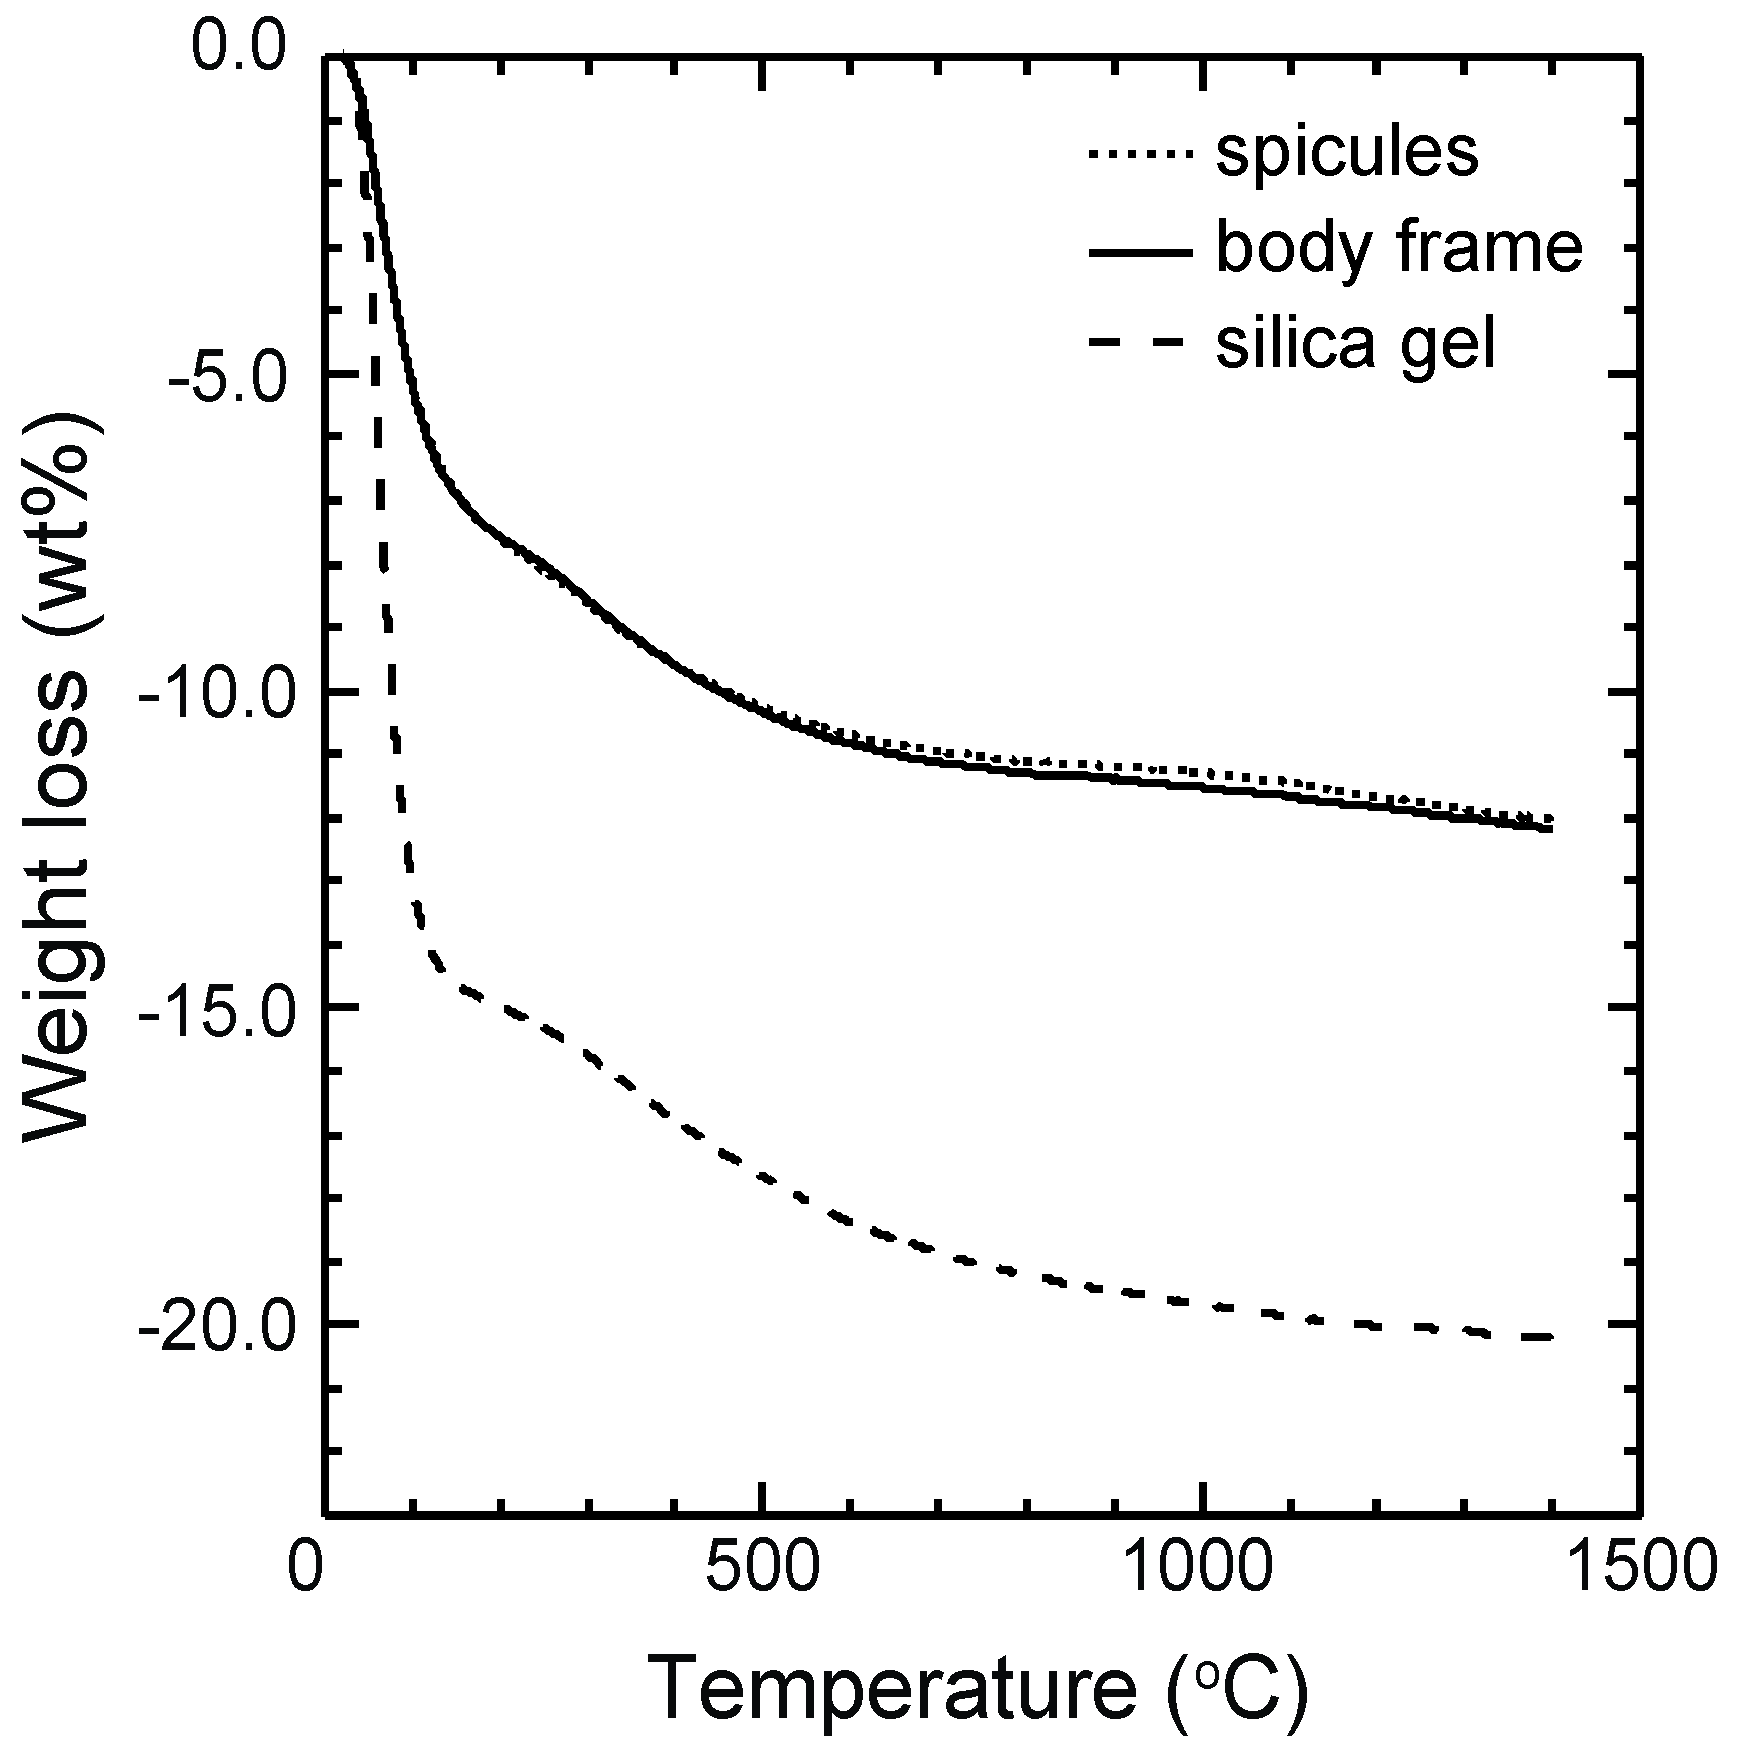
The TG curves for the sponge body frame and spicules showed that weight loss was similar for two distinct reduction steps (Figure 2) and are listed in Table 2. The total weight losses for the sponge samples were very similar. In the result of silica gel, the weight loss observed below 200 °C was about two times of those of sponge samples and the total weight loss was about 8% greater than those for the sponge samples.
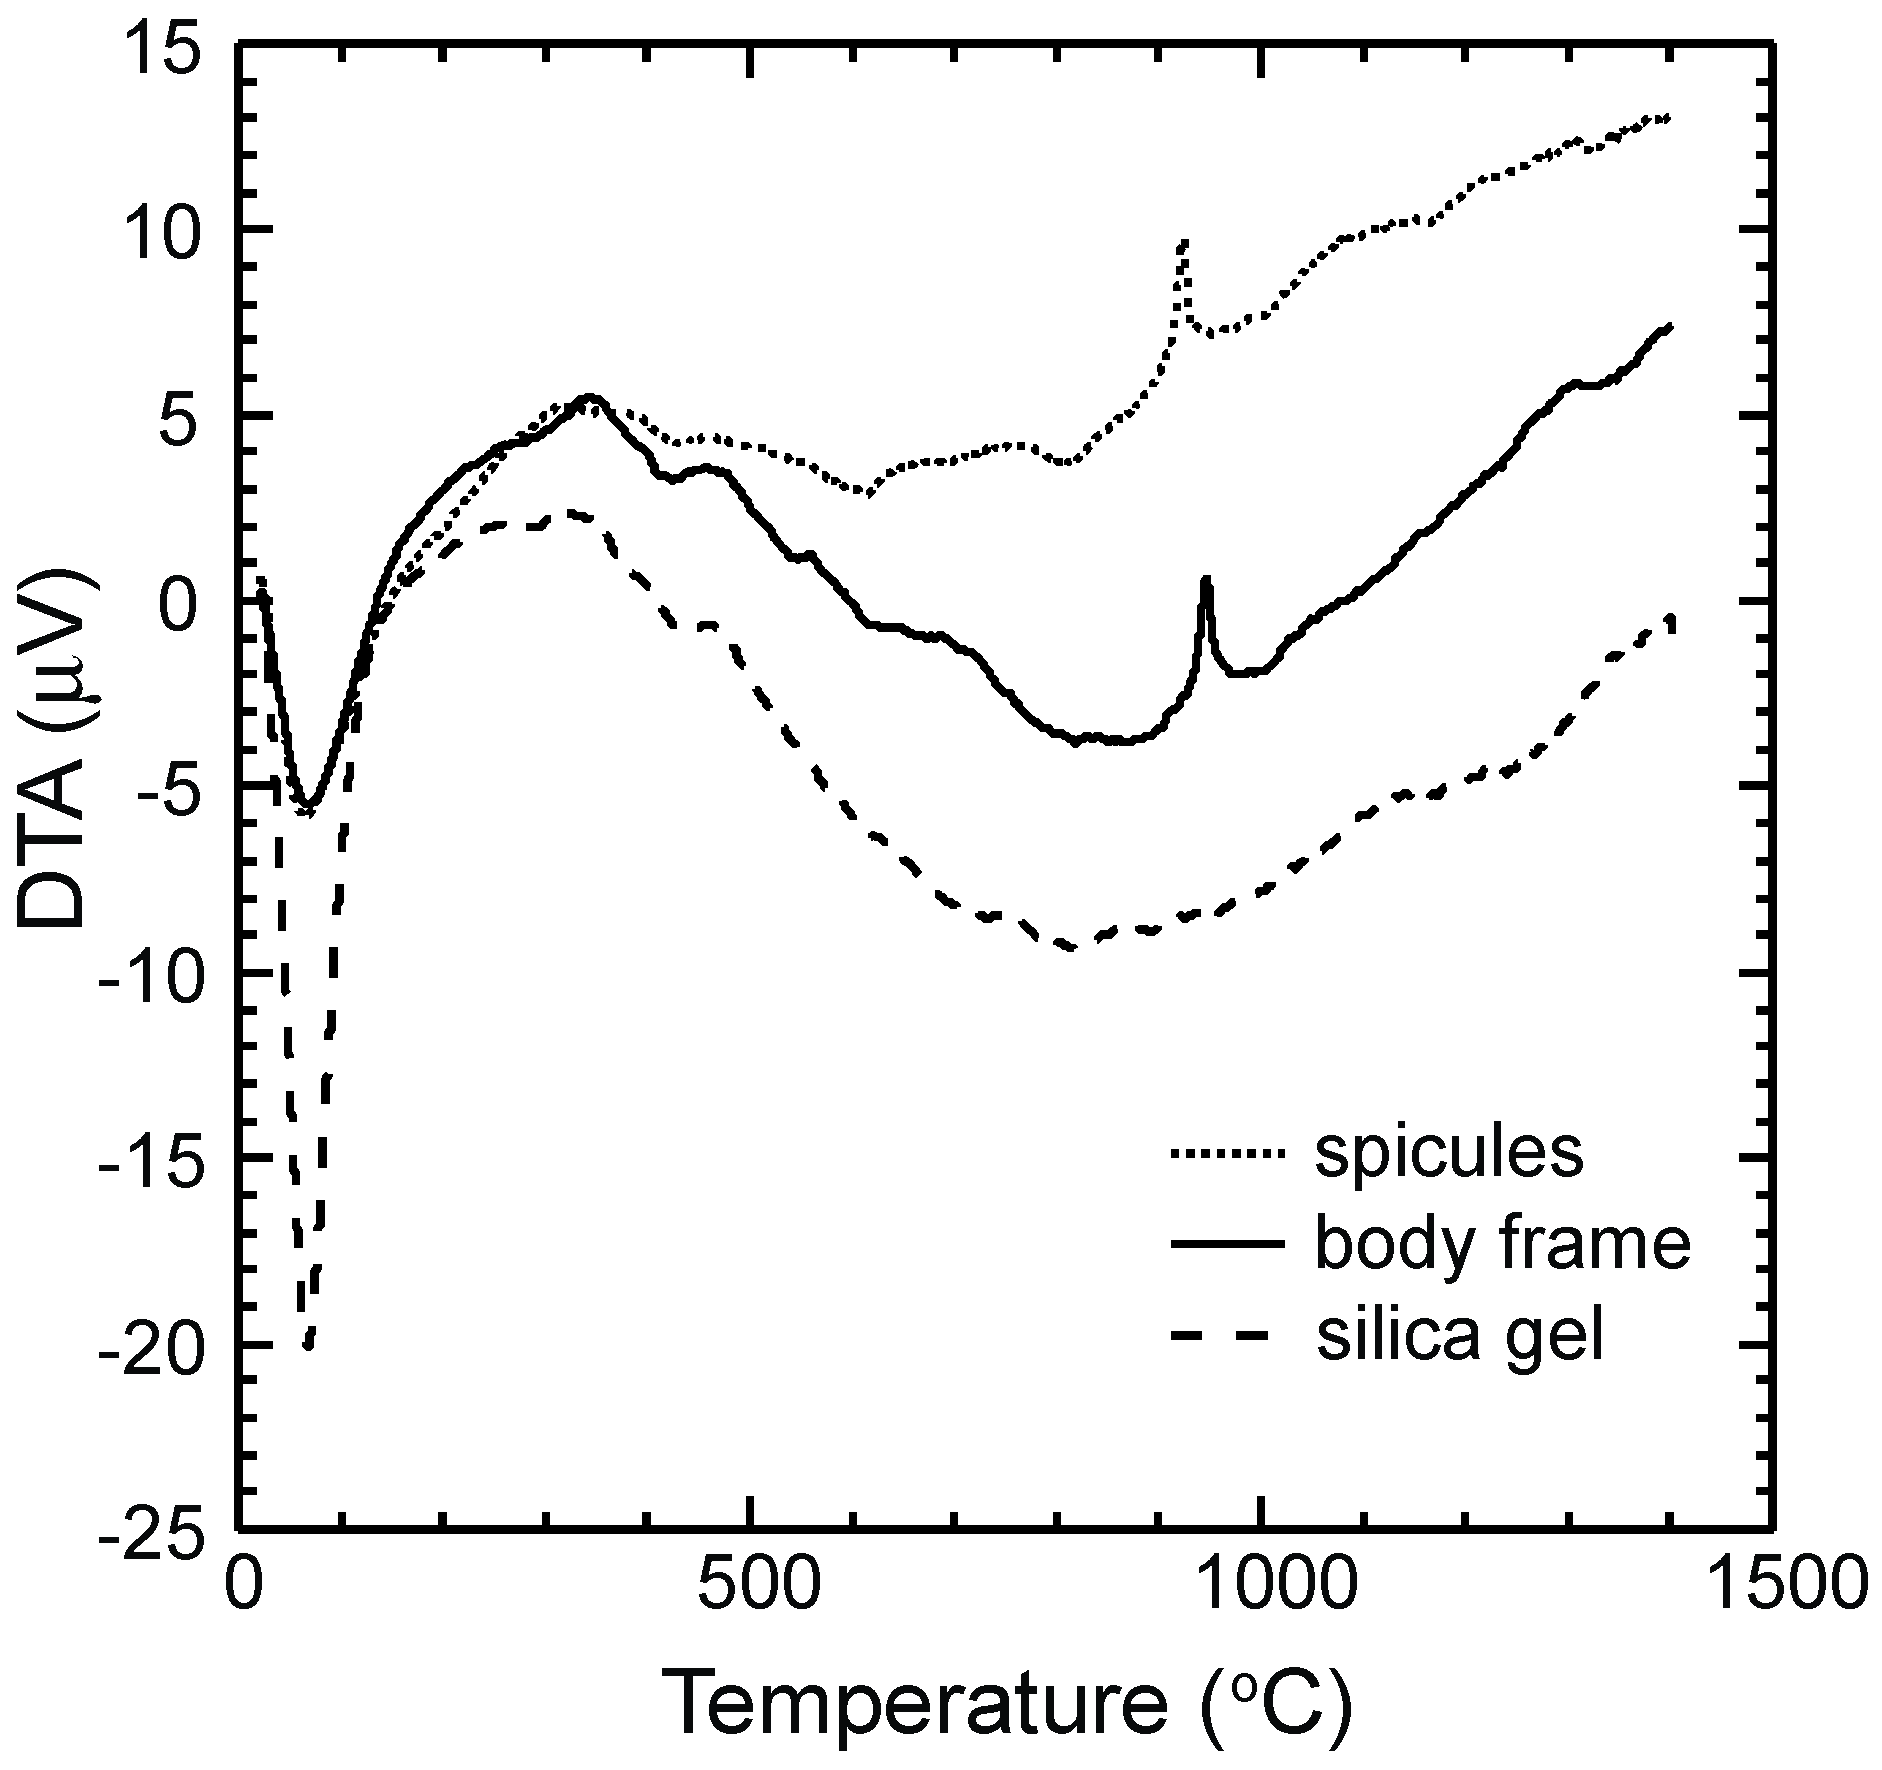
The DTA curves for the body frame and spicules have a broad endothermic band near 64–69 °C, which is similar to the intense band of silica gel observed at 67 °C (Figure 3). Strong exothermic bands were observed at 925 °C and 946 °C for the spicules and body frame, respectively. No obvious exothermic bands were observed for silica gel. In our preliminary experiment, we carried out the TG-DTA measurements for silica glass, although those curves for silica glass did not show the weight loss, the endothermic and exothermic bands.

3.2. 1H Static and 29Si {1H} CP-MAS NMR Spectra

The 1H NMR spectrum for the sponge body frame is shown in Figure 4, along with the spectrum of silica gel. The 1H NMR spectrum for the body frame had a signal at ca. 4.8 ppm, which was similar to that of silica gel. The physisorbed water molecules and/or silanol groups present on the surface of the sample were attributed to this peak [20,21,22]. The water content estimated from the 1H peak was 10.5% for the body frame and 17.2% for silica gel (Table 2).
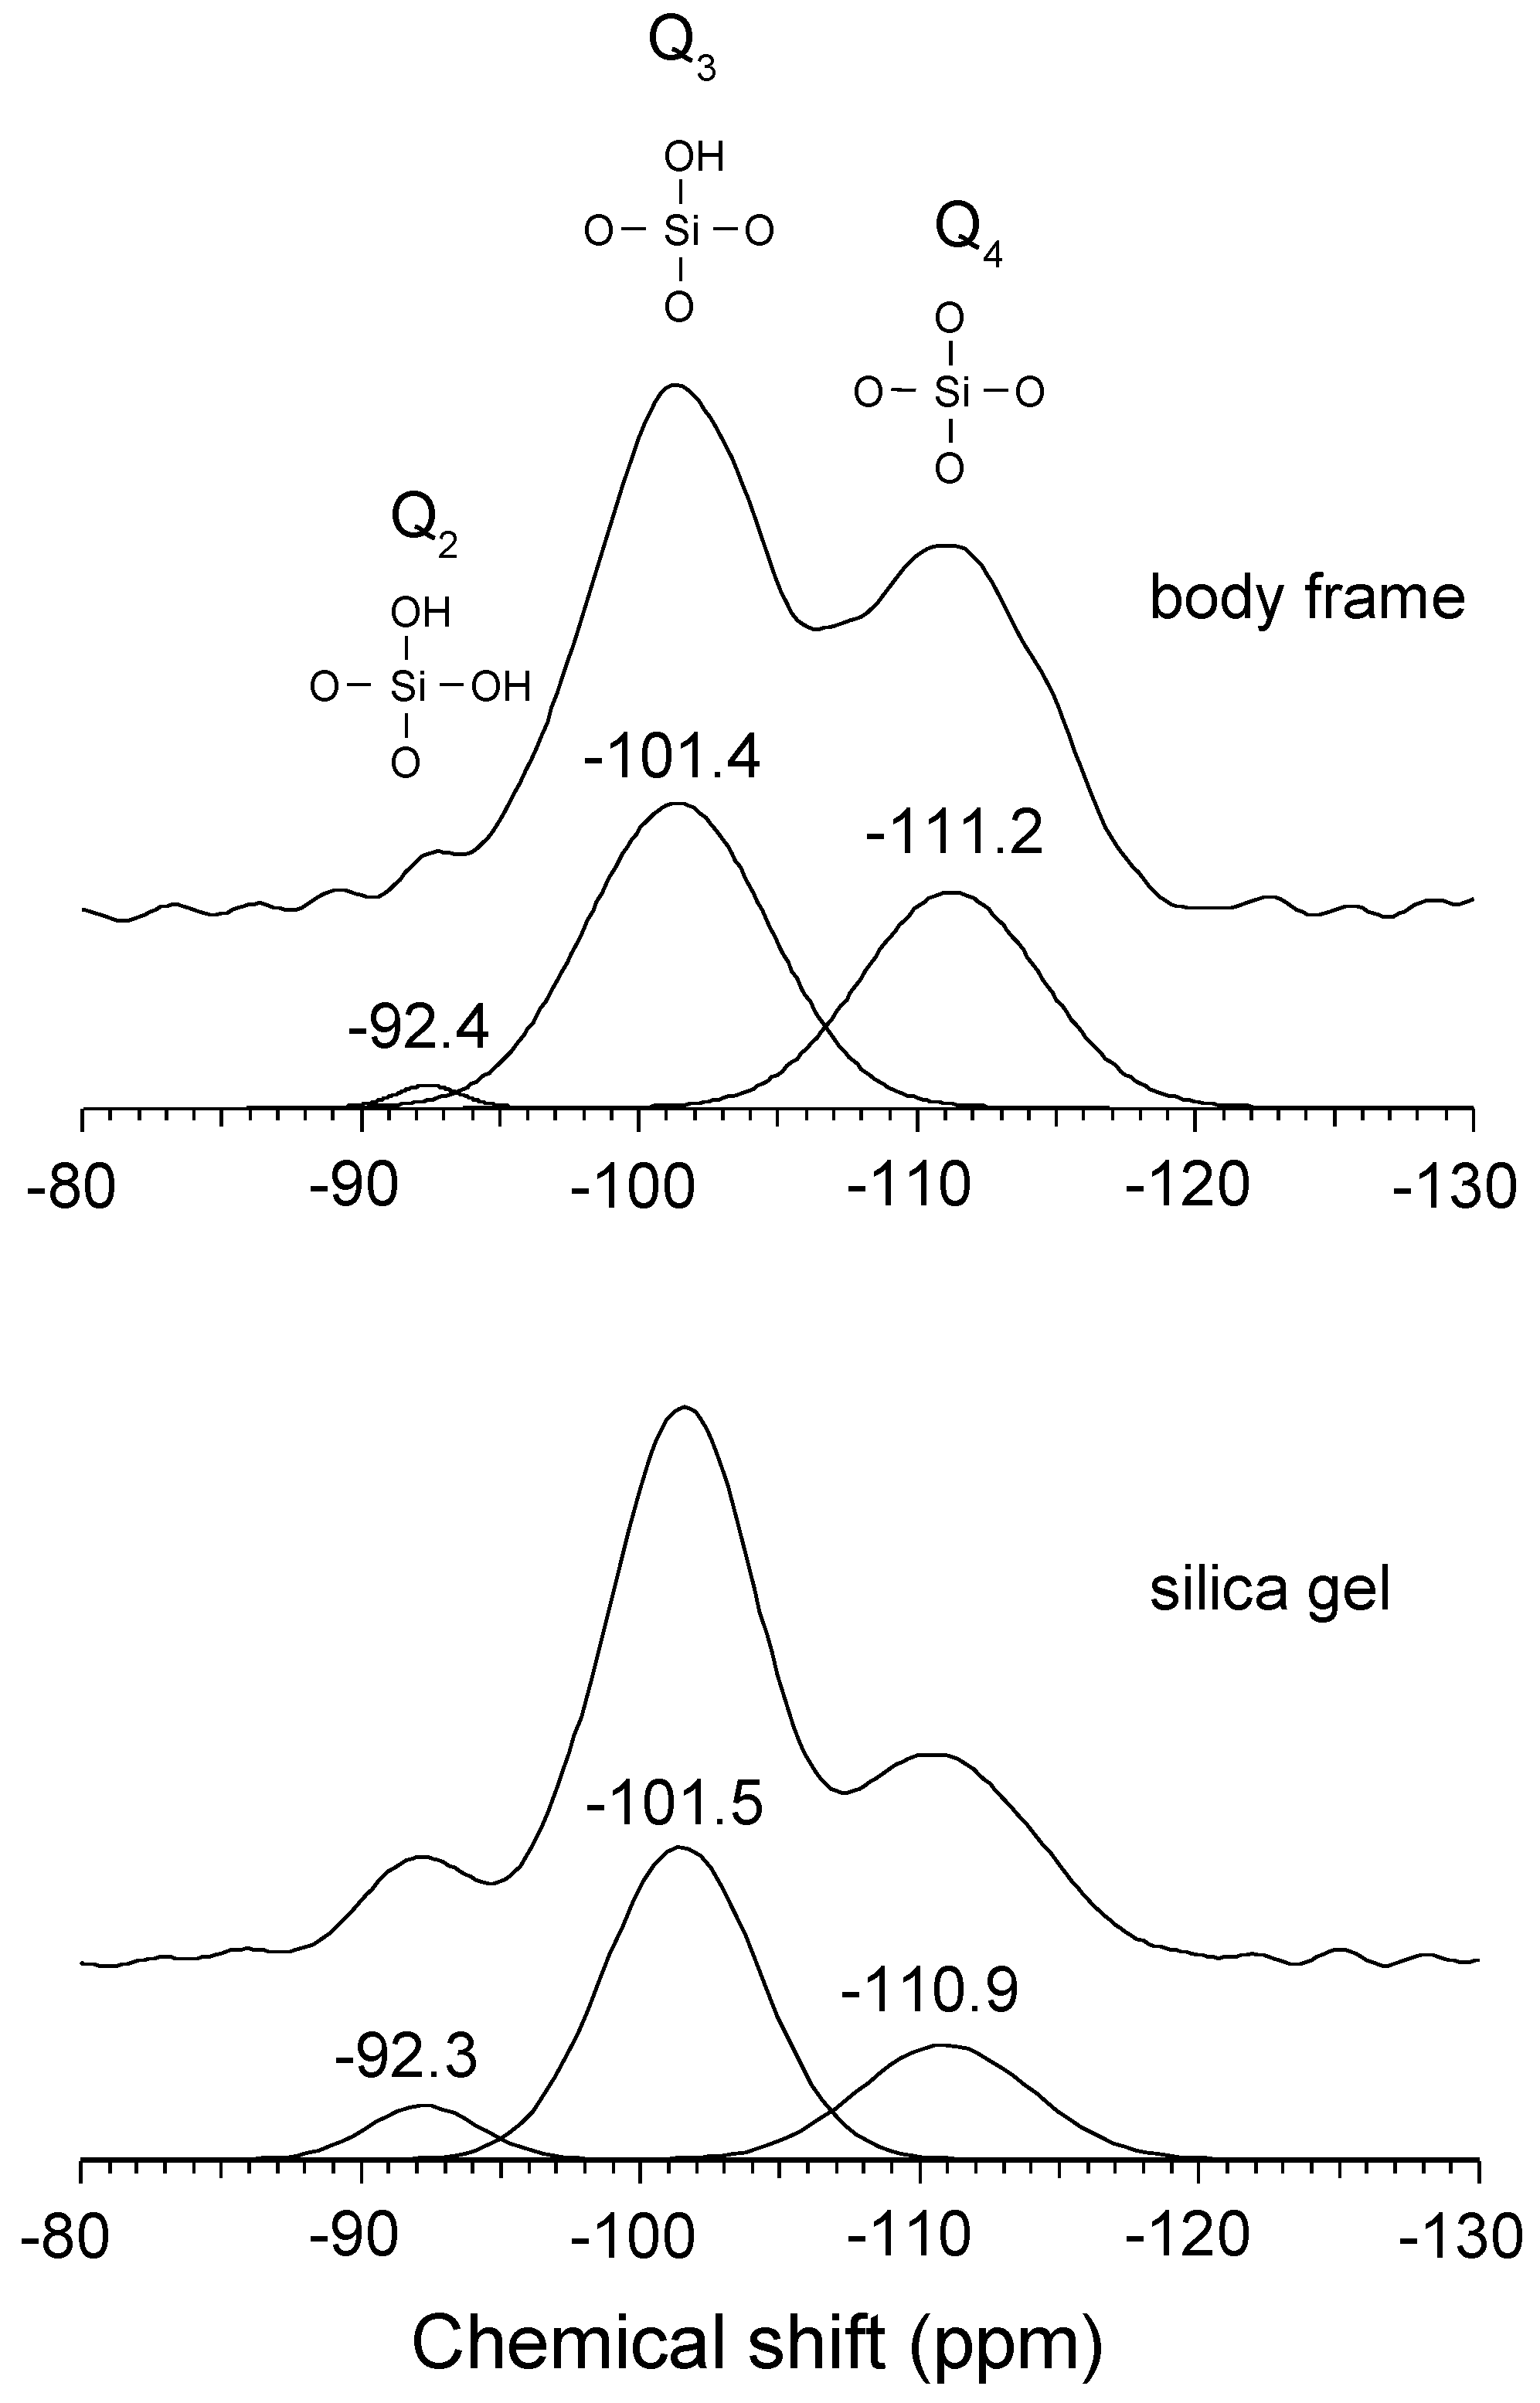
The 29Si {1H} CP-MAS NMR spectrum for the body frame had three signals at ca. –92.4, –101.4, and –111.2 ppm (Figure 5). These signals usually represent Qn species, where n is the number of bridging oxygens. These were assigned to Q2, Q3, and Q4, respectively. The positions of these signals were similar to those of the spicules reported in a previous study [7] and the silica gel measured in this study.
The Gaussian peak fitting of three signals observed in CP-MAS NMR spectra for sponge body frame and silica glass using IGOR Pro 6.3 software (Hulinks, Tokyo, Japan) showed the relative intensities of Qn species (Table 3). Although the CP-MAS NMR technique is semi-quantitative, the relative intensity of Q4/(Q2 + Q3) for the sponge sample was determined to be two times greater than that of silica gel.

3.3. Raman Spectra

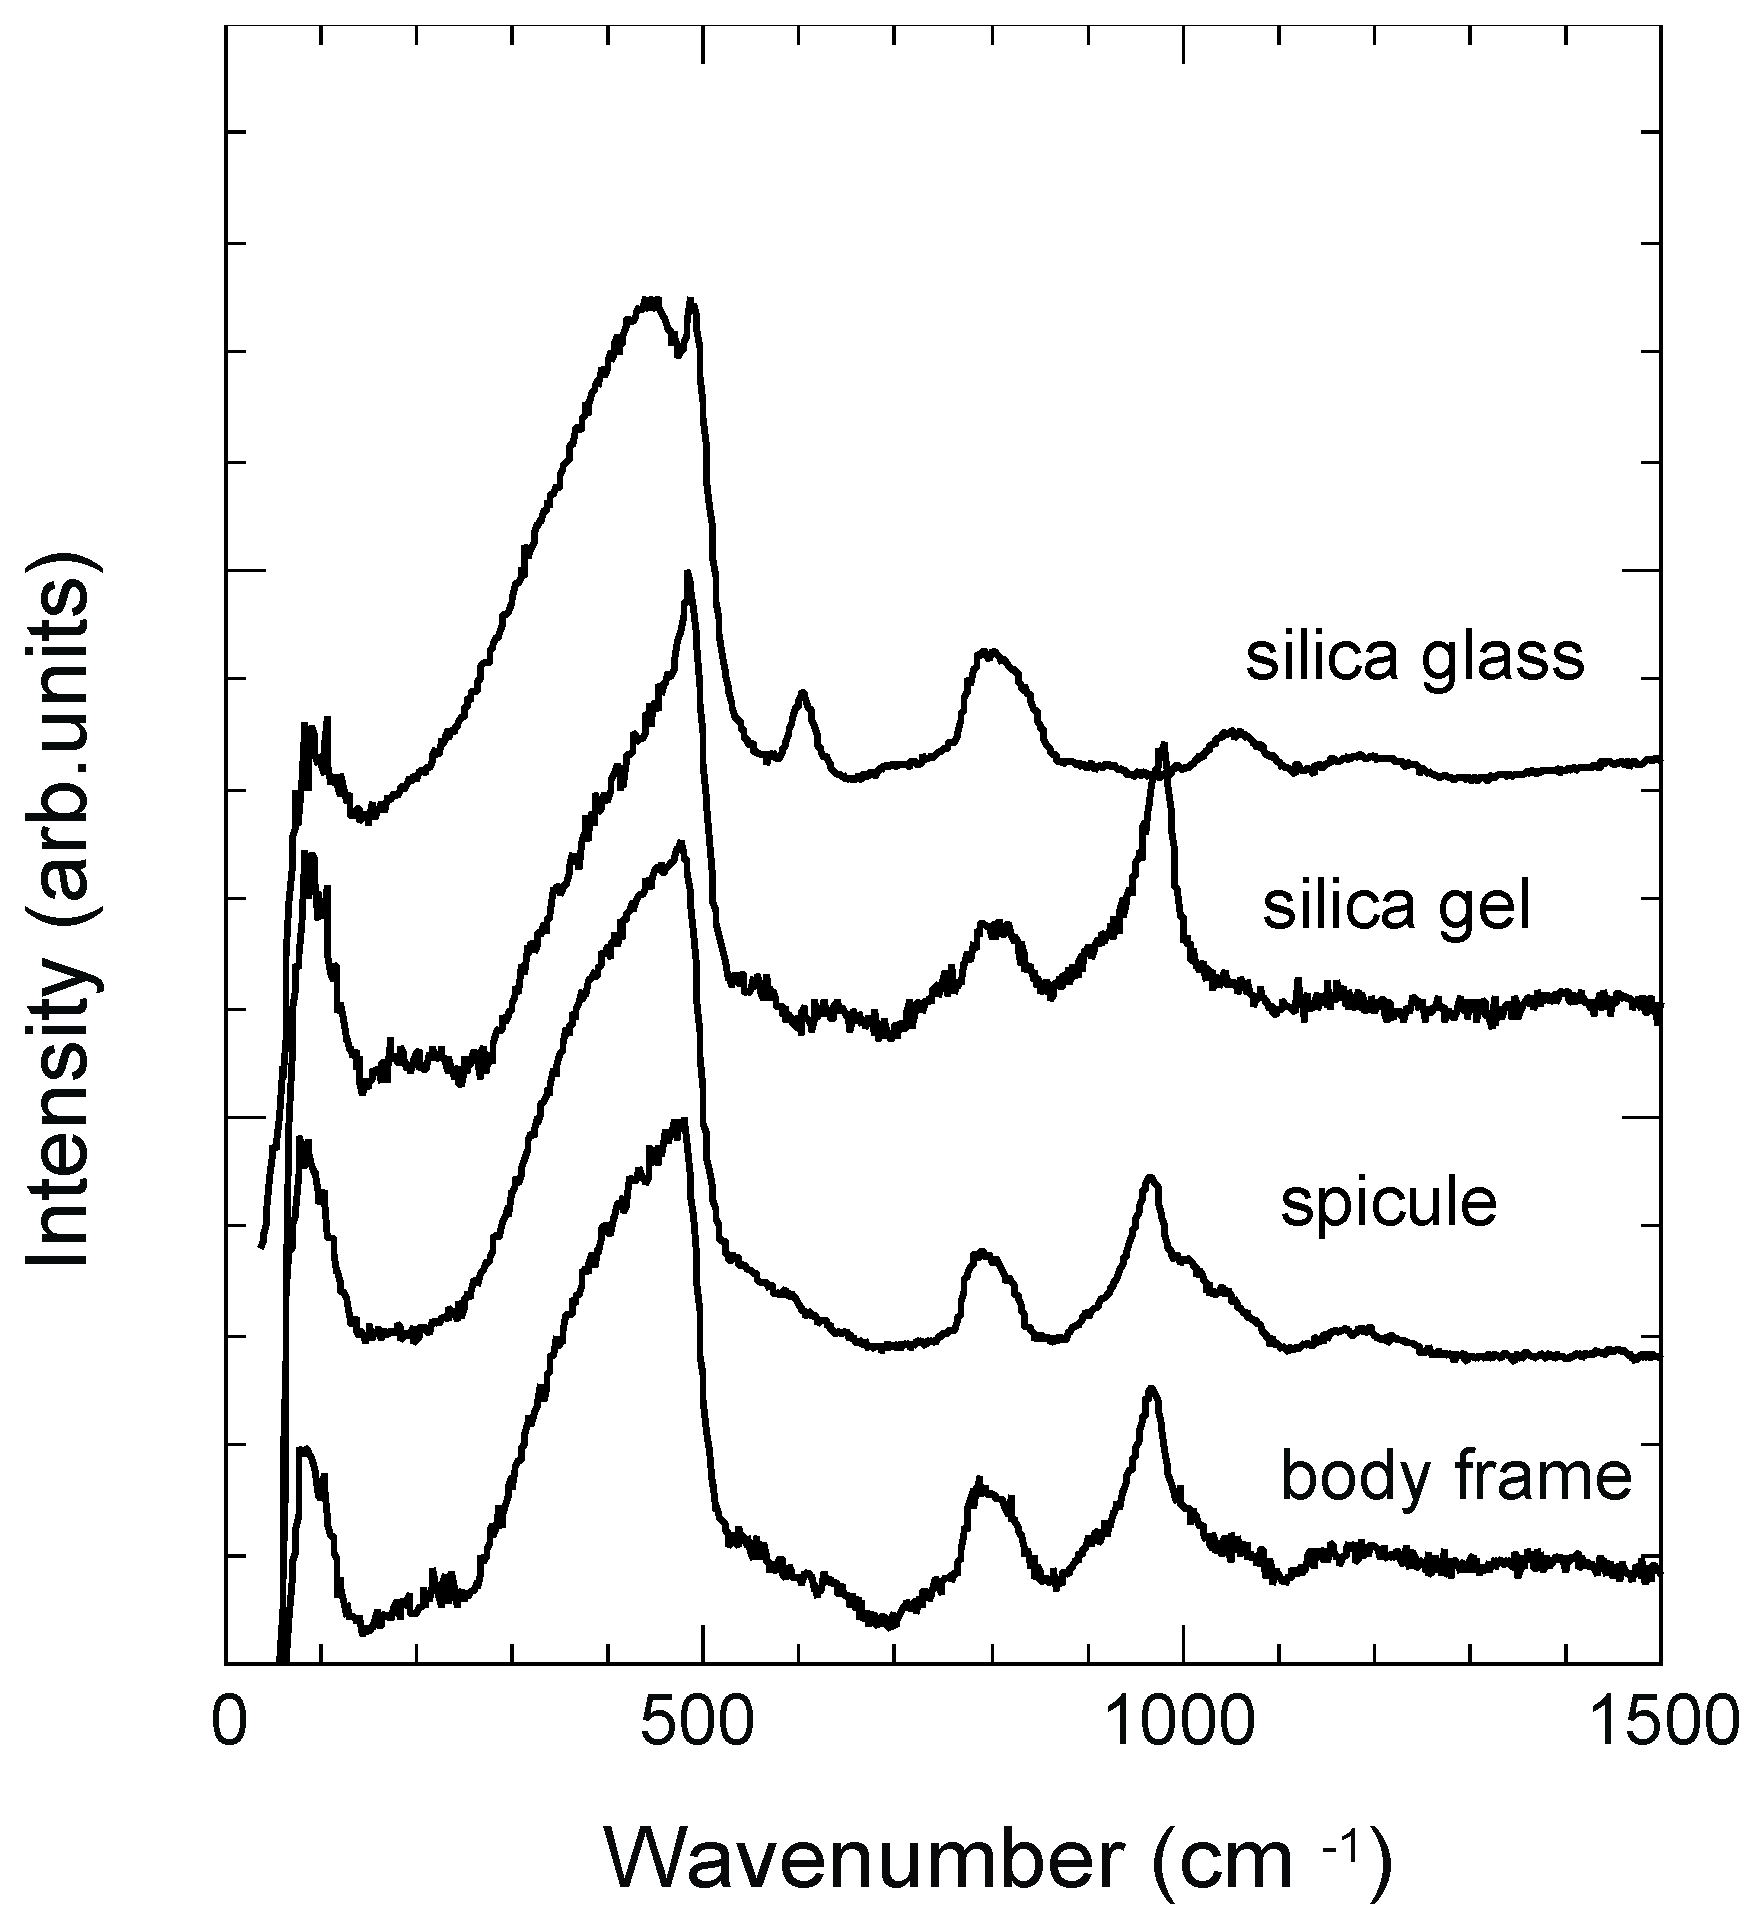
The Raman spectra for the body frame obtained from each observation position (from top, middle, and bottom of body frame) were precisely consistent. Therefore, the Raman spectra for the middle part of body frame, spicule, silica gel, and silica glass are shown in Figure 6. The Raman spectra of samples had a broad band centered at ν = 450 cm−1, which was attributed to the symmetrical Si–O–Si stretching mode and a D1 band at ν = 480–490 cm−1 due to the oxygen-breathing mode of the four-membered ring of SiO4 tetrahedra [23,24,25,26]. The spectra of sponge samples and silica gel have a relatively sharp band at ν = 960 cm−1, which may be assigned to the Q3 silanol as observed in hydrous amorphous silica materials [27,28]. The weak broad bands at ca. ν = 1060 and 1200 cm−1 were observed in the spectra of sponge samples, which were corresponded to asymmetric Si–O stretching vibrations within the fully polymerized SiO4 network [29]. A small band corresponding to the three-membered ring at ca. ν = 600 cm−1 [17] observed for silica glass was not observed in spectra of the sponge and silica gel. Since the D1 band is due to the main structure of the sponge and silica gel samples, it is assumed that the relative intensity of this band did not change significantly at the measurement point. Therefore, the intensities of spectra for all samples in Figure 6 and Figure 7 were normalized to that of the D1 band.
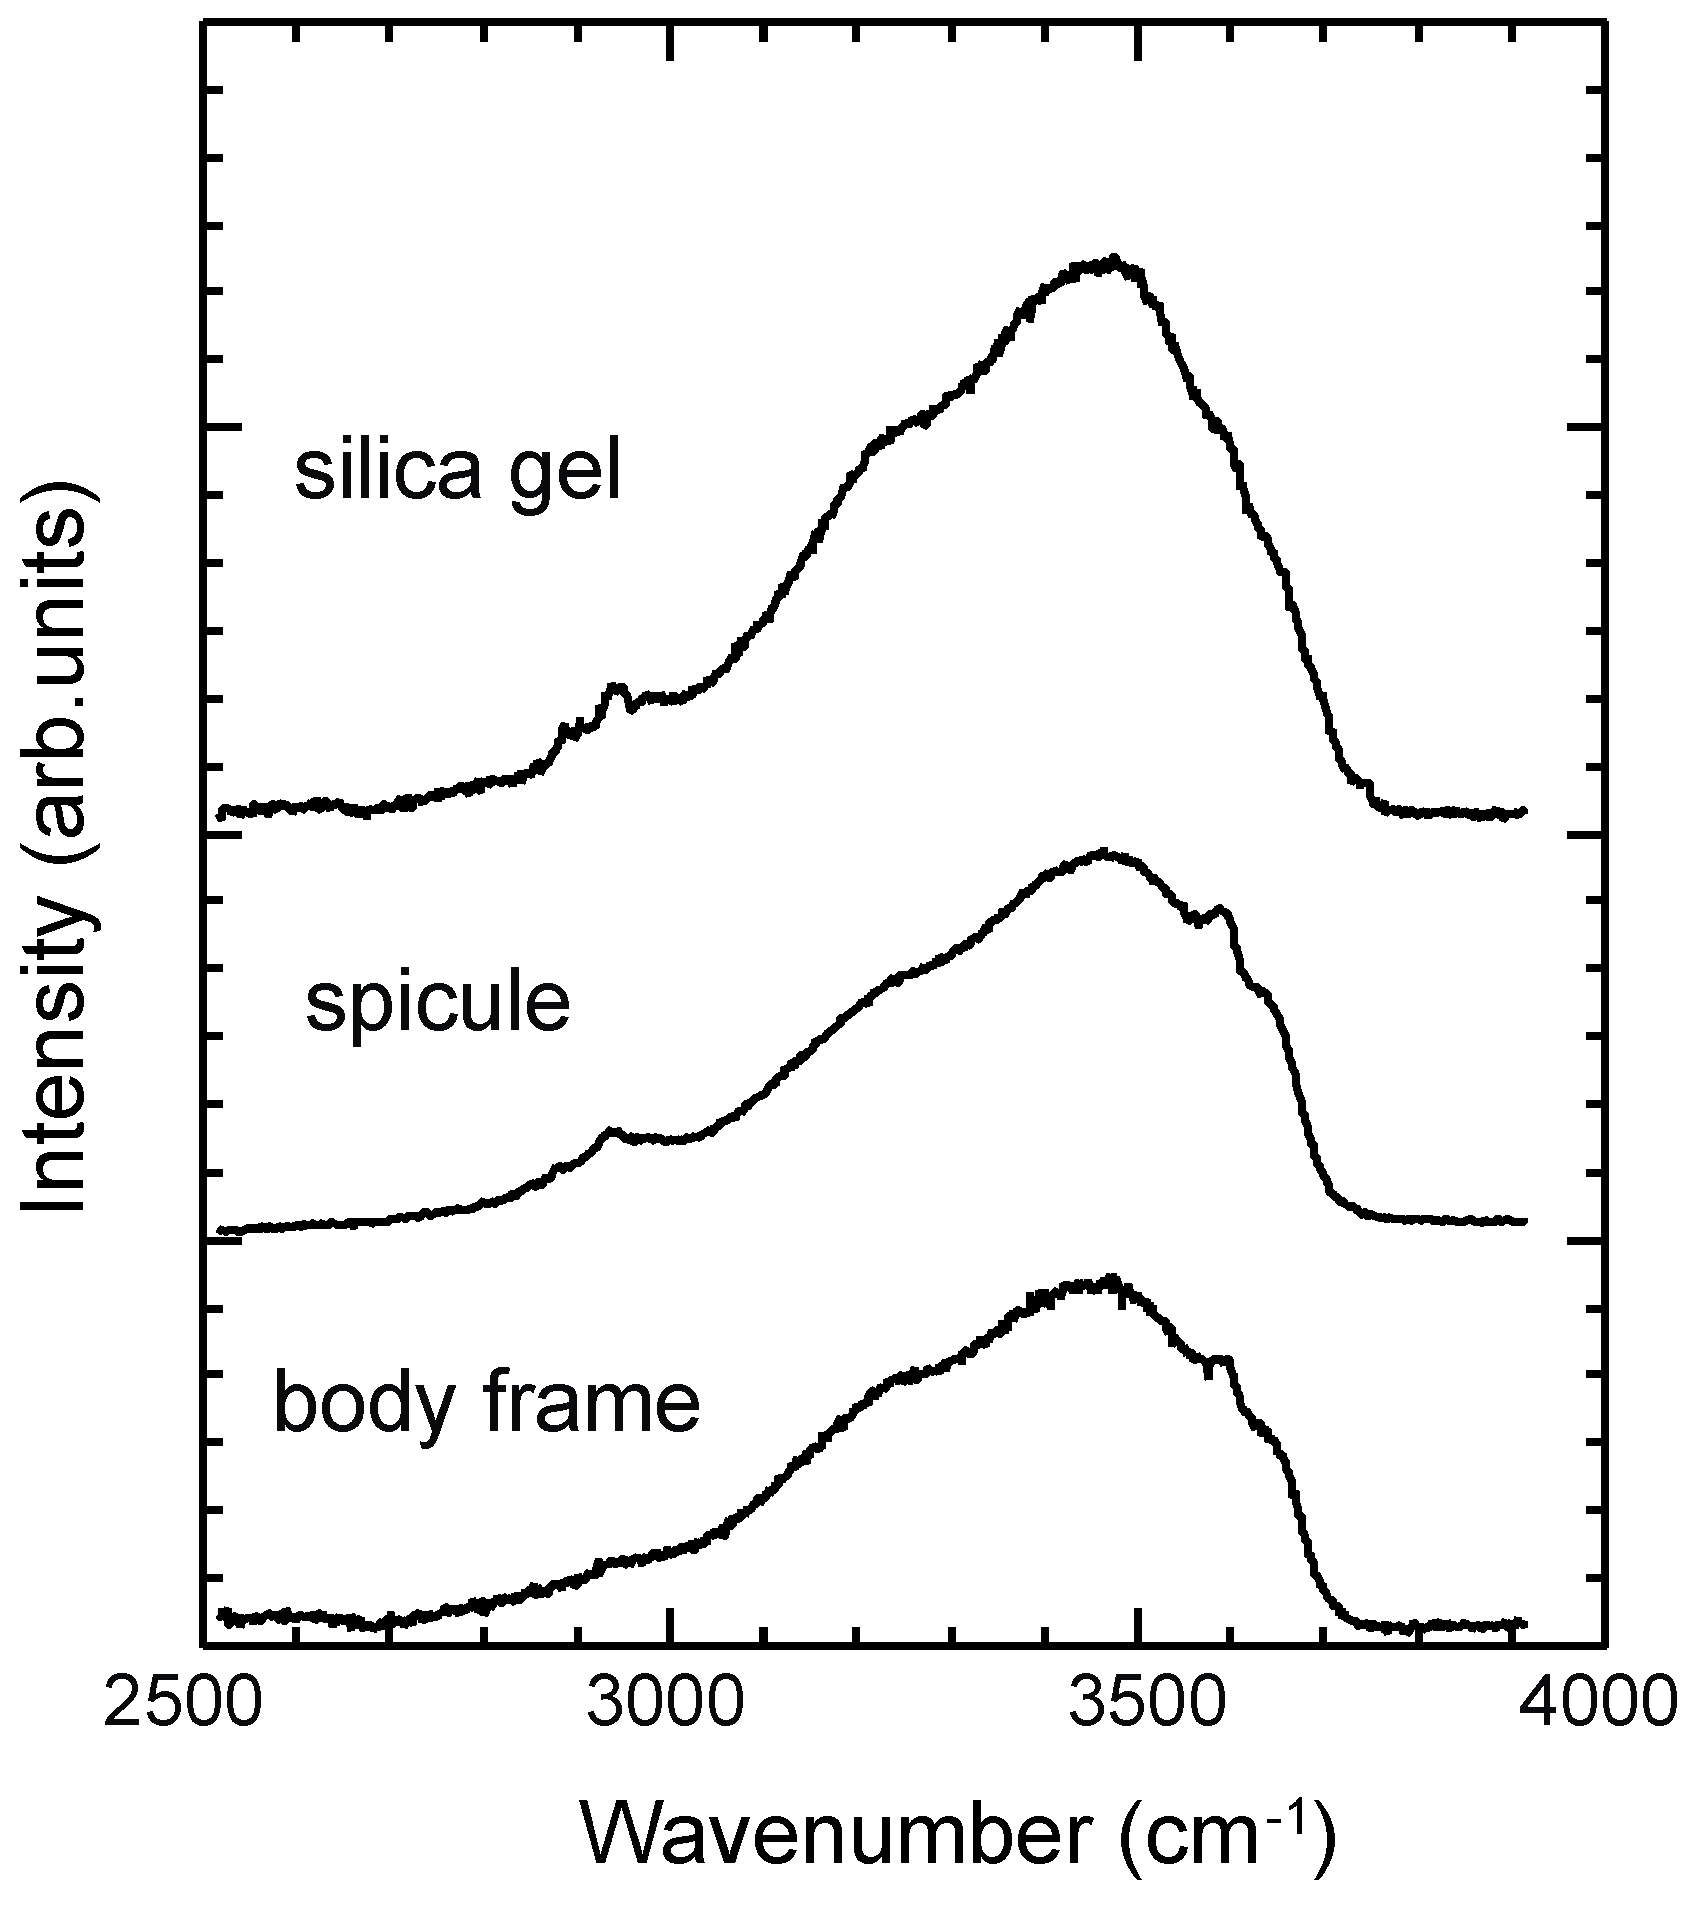
At higher wavenumbers, sponge samples and silica gel had a broad band in the range of ν = 3000–3800 cm−1 (Figure 7) due to overlap of the bands from molecular water and silanol groups [30,31]. The spectra for sponge samples were similar to each other. Compared with the spectrum of silica gel, the bands near ν = 3600 and 3650 cm−1 attributed to silanol species [32] were more prominent in the sponge samples. A very small band at ν = 3750 cm−1, attributed to the vibration of isolated silanol at the surface [30,32], was observed only for silica gel.

3.4. ATR-IR Spectra

The ATR-IR spectra for sponge samples have three distinct peaks at ν = 1050, 950, and 795 cm−1 (Figure 8). The bands at ν = 1050 and 795 cm−1 were attributed to the Si–O antisymmetric stretching band and Si–O–Si bending vibration, respectively [33]. The band that appeared in the range of ν = 1000–1300 cm−1 for silica glass was broader than other samples. The band at ν = 950 cm−1 was assigned to the stretching vibration of silanol groups [34]. A weak peak near ν = 1635 cm−1 was attributed to the H–O–H bending vibration of molecular water [35]. The IR spectra for sponge samples were basically similar to that of silica gel.
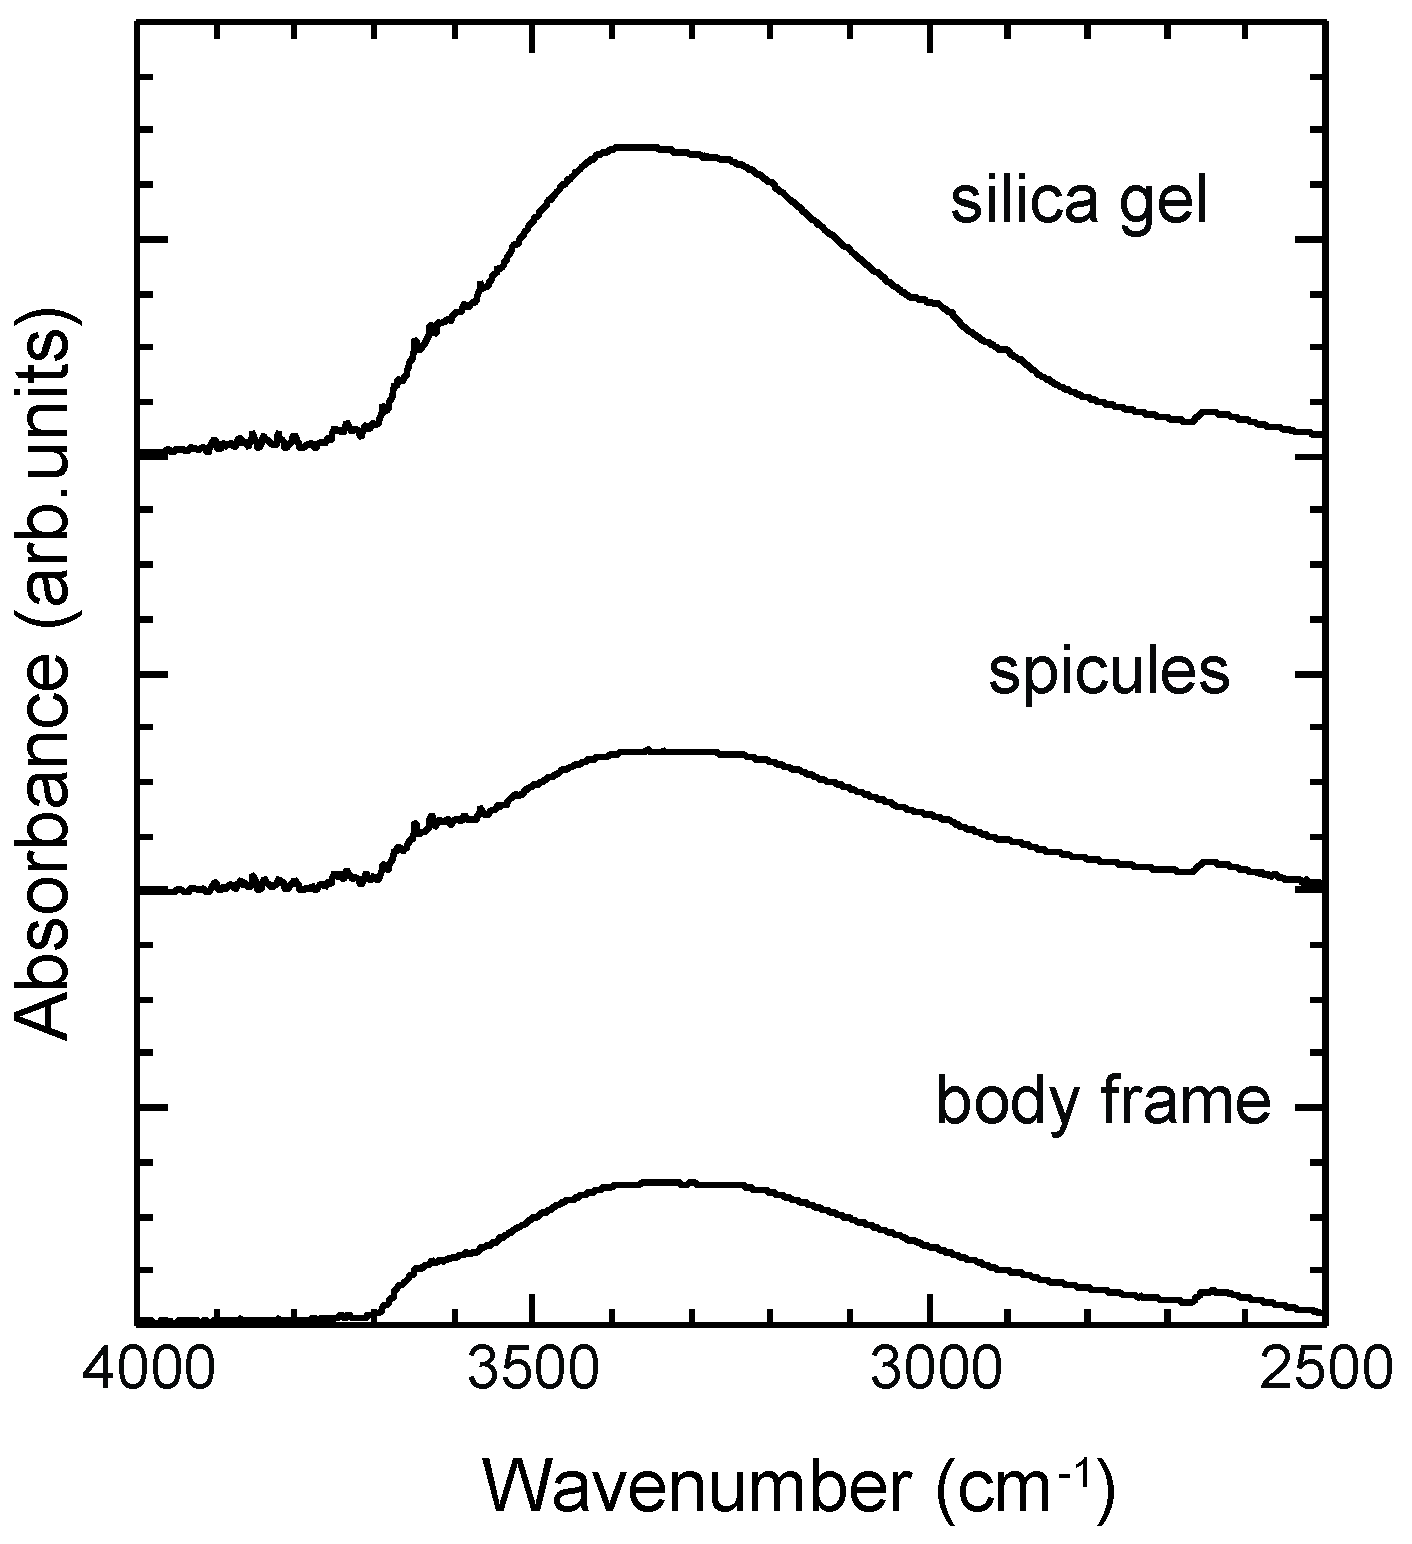
The ATR-IR spectra in the range of ν = 2500–4000 cm−1 are shown in Figure 9. ATR-IR spectra for body frame, spicules, and silica gel have bands for water molecules, which appeared at ν = 3200 and 3450 cm−1 [30,36,37], while the silanol group appeared at ν = 3600 and 3650 cm−1 [30,32]. The intensities of spectra for all samples in the Figure 8 and Figure 9 were normalized to the band intensity at ca. ν = 1050 cm−1.

3.5. XRD Analysis

The XRD patterns for the sponge body frame and spicules showed broad maxima centered at 2θ = 22.7° and 22.6°, respectively (Figure 10). This indicated that the sponge samples had no crystalline peak and thus, were similar to silica gel and silica glass.

4. Discussion

4.1. Water Content and Water Species in Sponge Samples

1H NMR spectra and TG curves revealed that the water content for both spicules and body frames were 10–12 wt %, although the water content estimated by 1H NMR was slightly less than that estimated by TG. This difference in estimated value was due to the TG curve being simply derived from sample weight loss corresponding to the release of water molecule and the dehydration of silanol, while the water content was calculated from the integrated 1H NMR peak area according only to H2O. Moreover, the weight loss estimated from the TG measurement includes ±0.2% measurement error.
The TG curves for the body frame and spicules indicated that they underwent the same dehydration step. According to Graetsch et al. [38], the large weight loss up to 200 °C can be attributed to the release of physisorbed water molecules, while the subsequent weight loss up to 600 °C is due to the dehydration of silanol. The endothermic band that appeared at 64–69 °C in the DTA curves corresponded to the release of water molecules on the sample surface. The small weight loss observed at temperatures above 600 °C may be due to the dehydration of hydroxyl group located at the structural site [38]. The water content values estimated from each dehydration step for the body frame and spicules were similar, which indicates that the water species and their amounts were similar for both samples. The TG curve for silica gel showed that the weight loss at temperatures below 200 °C was two times greater than those for sponge samples. However, the second weight loss of silica gel at 200–600 °C was similar to that of sponges, which indicates that the difference in water content of silica gel and sponge samples was mainly due to the number of water molecules located at the surface. Micropores in the structure, which affects the number of water molecules that can be absorbed, may be smaller in sponge samples than in silica gel.
Bronnimann et al. [20] reported that the 1H NMR spectrum for silica gel contained relatively sharp bands at 3.5, 3.0, and 1.7 ppm, respectively, which were attributed to physisorbed water molecules, H-bonded silanol, and isolated silanol, respectively. In the present study, the 1H NMR spectrum for sponge sample had a band at ca. 4 ppm, which was narrower and less intense at <2 ppm than that of silica gel. The Raman and ATR-IR spectra were consistent with the 1H NMR of the sponge samples, which showed no evidence of isolated surface silanol (appearing ca. ν = 3750 cm−1). Thus, the Q2 and Q3 silanol species in the sponge samples have hydrogen bonds.

4.2. Nano-Structure of Spicules and Body Frame of Glass Sponges

The Raman bands of Si–O stretching vibration at ν = 1060 and 1200 cm−1 were clearly observed in sponge samples, such as silica glass. However, the spectra of silica gel showed no evidence of these bands. This difference is also supported by the relatively greater intensity of (Q4/Q3 + Q2) of NMR signals for sponge samples compared to silica gel, which indicates the well-polymerized three-dimensional network of the sponge.
In general, the XRD patterns of amorphous silica materials show a broad scattering maximum centered at 2θ = 22°–23°, which is called the first sharp diffraction peak (FSDP). The position of the FSDP ( Q = 4 π sin θ / λ ) can be estimated from XRD data, which assists in evaluating the size of the medium range structure [39]. A low Q value means the presence of large medium range structure in the sample. The values for the FSDP positions of sponge spicules and body frame are listed in Table 4. The FSDP position for silica gel used in this study is consistent with that of silica gel (Q = 1.60–1.67 Å−1) reported in Kamiya and Nasu [11]. As also described in the introduction, the medium range structure of silica gel is composed mainly of the four-membered ring of SiO4 tetrahedra, although the structure of silica glass is made mainly of ≥ six-membered ring. These results indicate that the medium range structure of the sponge spicules and body frame were similar, while the size may be smaller than that of silica glass but larger than that of silica gel.
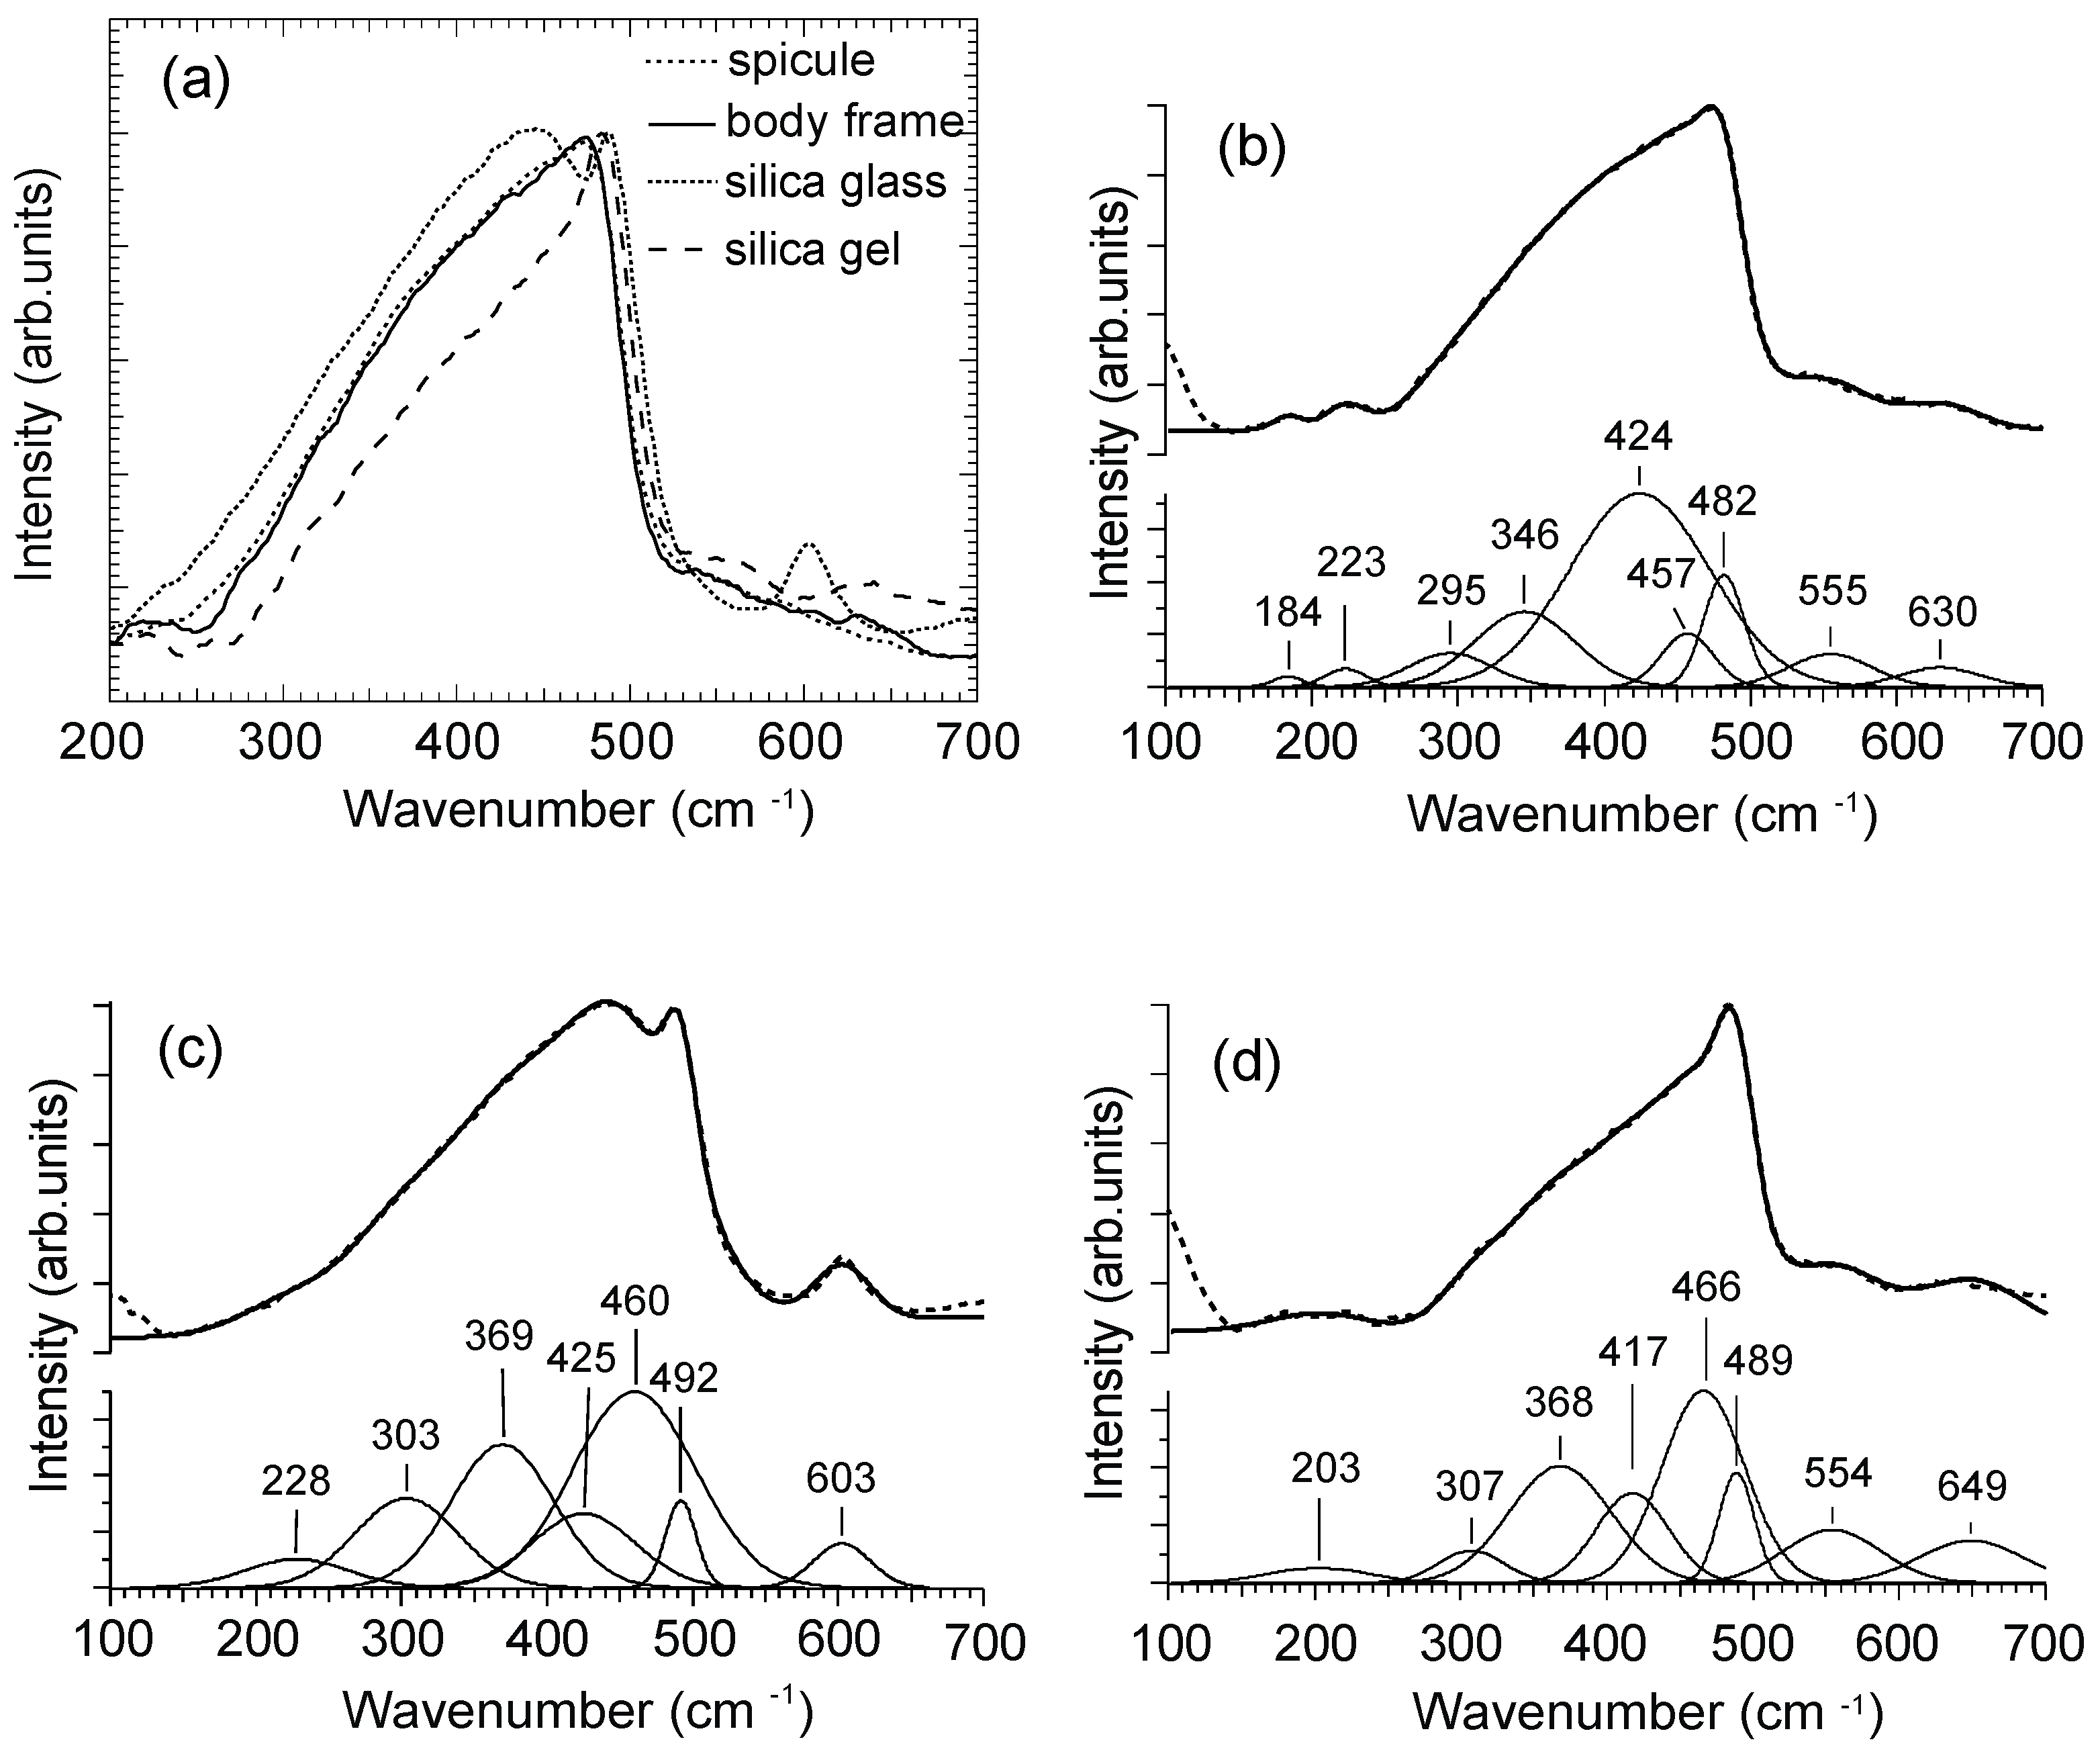
In addition, the intensity of Raman bands at ν < 600 cm−1 clearly indicate the different features of the ring structures of silica gel, silica glass, and sponge samples (Figure 11a). The band attributed to a four-membered ring at around ν = 490 cm−1 was present in all samples, although the band attributed to a three-membered ring at around ν = 600 cm−1 was observed only in spectra for silica glass. The band below ν = 470 cm−1 broadened in the order of silica glass > sponge > silica gel. This broad band may be a superposition of several bands for different ring structures and the appearance of the band at lower wavenumber may be attributed to the large ring structure [40,41]. Therefore, the result may indicate that the proportion of large ring structures included in sponge samples is less than that of silica glass. The wide distribution of ring structure in silica glass may be associated with the broad IR bands, which are attributed to the Si–O stretching mode that appears in the range of ν = 1000–1300 cm−1. This broad band is formed from the superposition of several bands of different Si–O stretching modes [42]. Therefore, the various ring structure included in the silica glass may affect the broadness for this band. In the present study, Raman bands for the sponge body frame, silica glass, and silica gel in the wavenumber region of ν = 100–700 cm−1 underwent detailed analysis based on the bands of crystalline SiO2 polymorphs, such as quartz, cristobalite, and tridymite [41] using Gaussian peak fitting with the IGOR Pro 6.3 software (Figure 11b–d). Since the Raman spectra for spicule and body frame were very similar, peak fitting was performed only on that of body frame. When compared to silica glass, the fitting results indicated that bands below ν = 300 cm−1 were weaker in the sponge sample compared with the normalized band of four-membered ring (ν = 482 cm−1). In addition, the band ca. ν = 425 cm−1 was intense for sponge samples, although the band at ca. ν = 460 cm−1 observed in spectra for silica glass and silica gel was more intense. Kingma and Hemley [41] assigned the bands <480 cm−1; low-tridymite and low-cristobalite, including a six-membered ring, produced the strongest band at wavenumbers lower than ca. ν = 420 cm−1, although the low-quartz produced an intense band near ν = 460 cm−1. Moreover, the bands that appeared ca. ν = 350 and 460 cm−1 are not observed in the spectrum of low-cristobalite, although these bands are observed in the spectrum for low-tridymite [41]. These results indicate that the medium range structure of sponges was composed mainly of six-membered rings with a disordered low-tridymite like structure.
On the other hand, the XRD patterns for the sponge samples after the TG-DTA experiments were completely consistent with that of low-cristobalite (the strongest peak located at 2θ = 22.0°, the secondary peak at 2θ = 36.1°; smaller peaks at 2θ = 28.5° and 31.5° and peaks above 40°; Figure 12). Therefore, DTA peaks at nearly 925 °C in spicules and 946 °C in the body frame may be related to this structural change into cristobalite by heating. Synthesized hydrous amorphous opal (SiO2·nH2O) with the medium range structure consisting of four-membered rings showed an exothermic band at ca. 1260 °C, corresponding to the crystallization into cristobalite [43]. In addition, Wahl et al. [44] reported that the complete crystallization of silica gel to cristobalite occurred at 1400 °C. Sponge samples crystalize into cristobalite at lower temperatures compared to silica gel and synthesized opal. In the temperature region of 870–1470 °C, high-tridymite is a stable and high-cristobalite is a metastable phase [45,46]. The metastable phase with high free energy crystallizes prior to the stable phase with lower free energy minimum. Therefore, the metastable high-cristobalite phase may be crystallized first according to Ostwald’s step rule. Moreover, high-cristobalite was converted to low-cristobalite during quenching below 250 °C. This is the reason behind the structural change of sponge sample into low-cristobalite after TG-DTA experiment. The rapid crystallization of sponge samples may be due to their structural similarity to that of low-tridymite composed mainly of six-membered rings.

5. Concluding Remarks

The nanostructure and water species of the body frames and spicules of the marine sponge, Euplectella aspergillum, were determined and compared with other amorphous silica materials, such as silica gel and silica glass.
The structural features of the nano-silica network in the body frame and spicules were essentially similar, although these were different from those of silica gel and silica glass. The six-membered ring made of SiO4 tetrahedra was the dominant component of the structure of sponge samples, which was similar to that of silica glass, although the ring size distribution was narrower than that of silica glass. In addition, the tridymite like six-membered ring structure was present in sponge samples without a long-range ordered structure.
The body frame and spicules contained similar water content and water species. The water greater than 60 wt% of the total water content in sponge samples was due to physisorbed water molecules at the surface, with the rest mainly attributed to silanol groups. In this study, silanols (Q2 and Q3) that are hydrogen-bonded to water molecules were detected at the surface. When compared to silica gel, the degree of polymerization of sponge samples appeared to be greater than that of silica gel.

Acknowledgments

One of the authors (A.A.) is grateful for the support from Career Design Laboratory for Gender Equality, Kanazawa University.

Author Contributions

A.A. performed the XRD, ATR-IR, and Raman measurements; S.F., T.E., K.T., and A.A. performed the NMR measurements; M.K., M.O., and A.A. performed TG-DTA measurements; A.A interpreted all data, and T.E. supported the interpretation of NMR data; A.A., M.O., and T.E. wrote manuscript; A.A. designed the Figures and tables.

Conflicts of Interest

The authors declare no conflicts of interest.

References

  1. Müller, W.E.G.; Wang, X.; Belikov, S.I.; Tremel, W.; Schloßmacher, U.; Natoli, A.; Brandt, D.; Boreiko, A.; Tahir, M.N.; Müller, I.M.; et al. Formation of Siliceous Spicules in Demosponges: Example Suberites domuncula. In Handbook of Biomineralization Biological Aspects and Structure Formation; Bäuerlein, E., Ed.; Wiley-VCH: Weinheim, Germany, 2007; pp. 59–82. ISBN 978-3-527-31804-9. [Google Scholar]
  2. Ehrlich, H.; Worch, W. Collagen: A huge matrix in glass sponge flexible spicules of the meter-long Hyalonema sieboldi. In Handbook of Biomineralization Biological Aspects and Structure Formation; Bäuerlein, E., Ed.; Wiley-VCH: Weinheim, Germany, 2007; pp. 23–41. ISBN 978-3-527-31804-9. [Google Scholar]
  3. Uriz, M.J.; Turon, X.; Becerro, G.; Ageli, G. Siliceous spicules and skeleton frameworks in sponges: Origin, diversity, ultrastructural patterns, and biological functions. Microsc. Res. Tech. 2003, 32, 186–193. [Google Scholar] [CrossRef] [PubMed]
  4. Aizenberg, J.; Weaver, J.C.; Thanawala, M.S.; Sundar, V.C.; Morse, D.E.; Fratzl, P. Skeleton of Euplectella sp.: Structural hierarchy from the nanoscale to the macroscale. Science 2005, 309, 275–278. [Google Scholar] [CrossRef] [PubMed]
  5. Woesz, A.; Weaver, J.C.; Kazanci, M.; Dauphin, Y.; Aizenberg, J.; Morse, D.E.; Fratzl, P. Micromechanical properties of biological silica in skeletons of deep-sea sponges. J. Mater. Res. 2006, 21, 2068–2078. [Google Scholar] [CrossRef]
  6. Weaver, J.C.; Aizenberg, J.; Fantner, G.E.; Kisailus, D.; Woesz, A.; Allen, P.; Fields, K.; Porter, M.J.; Zok, F.W.; Hansma, P.K.; et al. Hierarchical assembly of the siliceous skeletal lattice of the hexactinellid sponge Euplectella aspergillum. J. Struct. Biol. 2007, 158, 93–106. [Google Scholar] [CrossRef] [PubMed]
  7. Gendron-Badou, A.; Coradin, T.; Maquet, J.; Frohlich, F.; Livage, J. Spectroscopic characterization of biogenic silica. J. Non-Cryst. Solids 2003, 316, 331–337. [Google Scholar] [CrossRef]
  8. Cha, J.N.; Shimizu, K.; Zhou, Y.; Christiansen, S.C.; Chmelka, B.F.; Stucky, G.D.; Morse, D.E. Silicatein filaments and subunits from a marine sponge direct the polymerization of silica and silicones in vitro. Proc. Natl. Acad. Sci. USA 1999, 96, 361–365. [Google Scholar] [CrossRef] [PubMed]
  9. Shimizu, K.; Amano, T.; Bari, M.R.; Weaver, J.C.; Arima, J.; Mori, N. Glassin, a histidine-rich protein from the siliceous skeletal system of the marine sponge Euplectella, directs silica polycondensation. Proc. Natl. Acad. Sci. USA 2015, 112, 11449–11454. [Google Scholar] [CrossRef] [PubMed]
  10. Fuchs, I.; Aluma, Y.; Ilan, M.; Mastai, Y. Induced crystallization of amorphous biosilica to cristobalite by silicatein. J. Phys. Chem. B 2014, 118, 2014–2111. [Google Scholar] [CrossRef] [PubMed]
  11. Kamiya, K.; Nasu, H. Structure and thermal change of alkoxyderived silica gel fibers and films. Ceram. Trans. 1998, 81, 21–28. [Google Scholar]
  12. Pasquarello, A.; Roberto, C. Identification of Raman defect Lines as signatures of ring structures in vitreous silica. Phys. Rev. Lett. 1998, 80, 5145–5147. [Google Scholar] [CrossRef]
  13. Shimada, Y.; Okuno, M.; Syono, Y.; Kikuchi, M.; Fukuoka, K.; Ishizawa, N. An X-ray diffraction study of shock-wave-densified SiO2 glasses. Phys. Chem. Miner. 2002, 29, 233–239. [Google Scholar] [CrossRef]
  14. Huang, L.; Kieffer, J. Amorphous-amorphous transitions in silica glass. I. Reversible transitions and thermomechanical anomalies. Phys. Rev. B 2004, 69, 224203. [Google Scholar] [CrossRef]
  15. Guerette, M.; Ackerson, M.R.; Thomas, J.; Yuan, F.; Watson, E.B.; Walker, D.; Huang, L. Structure and properties of silica glass densified in cold compression and hot compression. Sci. Rep. 2015, 5, 15343. [Google Scholar] [CrossRef] [PubMed]
  16. Arasuna, A.; Okuno, M.; Chen, L.; Mashimo, T.; Okudera, H.; Mizukami, T.; Arai, S. Shock-wave compression of silica gel as a model material for comets. Phys. Chem. Miner. 2016, 43, 493–502. [Google Scholar] [CrossRef]
  17. Okuno, M.; Reynard, B.; Shimada, Y.; Syono, Y.; Willaime, C. A Raman spectroscopic study of shock-wave densification of vitreous silica. Phys. Chem. Miner. 1999, 26, 304–311. [Google Scholar] [CrossRef]
  18. Fukushima, Y. Structural Changes of Glass Sponge by Heat-Treatment and Compression. Master’s Thesis, Kanazawa University, Kanazawa, Japan, 2018. [Google Scholar]
  19. Bennett, A.E.; Rienstra, C.M.; Auger, M.; Lakshmi, K.V.; Griffin, R.G. Heteronuclear decoupling in rotating solids. J. Chem. Phys. 1995, 103, 6951. [Google Scholar] [CrossRef]
  20. Bronnimann, C.E.; Zeigler, R.C.; Maciel, G.E. Proton NMR Study of Dehydration of the Silica Gel Surface. J. Am. Chem. Soc. 1988, 110, 2023–2026. [Google Scholar] [CrossRef]
  21. Eckert, H.; Yesinowski, J.P.; Silver, L.A.; Stolper, E.M. Water in silicate glasses: Quantitation and structural studies by 1H Solid echo and MAS-NMR Methods. J. Phys. Chem. 1988, 92, 2055–2064. [Google Scholar] [CrossRef]
  22. Kinney, D.R.; Chuang, I.-S.; Marciel, G.E. Water and the silica surface as studied by variable-temperature High-Resolution 1H NMR. J. Am. Chem. Soc. 1993, 115, 6786–6794. [Google Scholar] [CrossRef]
  23. Galeener, F.L. Planar rings in vitreous silica. J. Non-Cryst. Solids 1982, 49, 53–62. [Google Scholar] [CrossRef]
  24. Galeener, F.L. Planar rings in glasses. Solid State Commun. 1982, 44, 1037–1040. [Google Scholar] [CrossRef]
  25. Galeener, F.L.; Geissberger, A.E. Vibrational dynamics in 30Sisubstituted vitreous SiO2. Phys. Rev. B 1983, 27, 6199–6204. [Google Scholar] [CrossRef]
  26. Sharma, S.K.; Matson, D.W.; Philpotts, J.A.; Roush, T.L. Raman study of the structure of glasses along the join SiO2-GeO2. J. Non-Cryst. Solids 1984, 68, 99–114. [Google Scholar] [CrossRef]
  27. Stolen, R.H.; Walrafen, G.E. Water and its relation to broken bond defects in fused silica. J. Chem. Phys. 1976, 64, 2623–2631. [Google Scholar] [CrossRef]
  28. Murray, C.A.; Greytak, T.J. Intrinsic surface phonons in amorphous silica. Phys. Rev. B 1979, 20, 3368–3387. [Google Scholar] [CrossRef]
  29. McMillan, P. Structural studies of silicate glasses and melts-applications and limitations of Raman spectroscopy. Am. Mineral. 1984, 69, 622–644. [Google Scholar]
  30. Davis, K.M.; Tomozawa, M. An infrared spectroscopic study of water-related species in silica glasses. J. Non-Cryst. Solids 1996, 201, 177–198. [Google Scholar] [CrossRef]
  31. Anedda, A.; Carbonaro, C.M.; Clemente, F.; Corda, L.; Corpino, R.; Ricci, P.C. Surface hydroxyls in porous silica: A Raman spectroscopy study. Mater. Sci. Eng. C 2003, 23, 1069–1072. [Google Scholar] [CrossRef]
  32. Bergna, H.E. Colloid chemistry of silica: An overview. In Colloidal Silica: Fundamentals and Applications; Bergna, H.E., Roberts, W.O., Eds.; CRC Press: Boca Raton, FL, USA, 2006; pp. 9–35. ISBN 0-8247-0967-5. [Google Scholar]
  33. Handke, M.; Mozgawa, W. Vibrational spectroscopy of the amorphous silicates. Vib. Spectrosc. 1993, 5, 75–84. [Google Scholar] [CrossRef]
  34. Kamiya, K.; Oka, A.; Nasu, H.; Hashimoto, T. Comparative study of structure of silica gels from different sources. J. Sol-Gel Sci. Technol. 2000, 19, 495–499. [Google Scholar] [CrossRef]
  35. Benesi, H.A.; Jones, A.C. An infrared study of the water-silica gel system. J. Phys. Chem. 1959, 63, 179–182. [Google Scholar] [CrossRef]
  36. McDonald, R.S. Surface functionality of amorphous silica by infrared spectroscopy. J. Phys. Chem. 1958, 62, 1168–1178. [Google Scholar] [CrossRef]
  37. Orcel, G.; Phalippou, J.; Hench, L.L. Structural changes of silica xerogels during low temperature dehydration. J. Non-Cryst. Solids 1986, 88, 114–130. [Google Scholar] [CrossRef]
  38. Graetsch, H.; Flörke, O.W.; Miehe, G. The nature of water in chalcedony and opal-C from Brazilian agate geodes. Phys. Chem. Miner. 1985, 12, 300–306. [Google Scholar] [CrossRef]
  39. Elliott, S.R. Medium-range structural order in covalent amorphous solids. Nature 1991, 354, 445–452. [Google Scholar] [CrossRef]
  40. Sharma, S.K.; Mammone, J.F.; Nicol, M.F. Raman investigations of ring configurations in vitreous silica. Nature 1981, 292, 140–141. [Google Scholar] [CrossRef]
  41. Kingma, K.J.; Hemley, R.J. Raman spectroscopic study of microcrystalline silica. Am. Mineral. 1994, 79, 269–273. [Google Scholar]
  42. Innocenzi, P. Infrared spectroscopy of sol-gel derived silicabased films: A spectra-icrostructure orverview. J. Non-Cryst. Solids 2003, 316, 309–319. [Google Scholar] [CrossRef]
  43. Arasuna, A.; Okuno, M.; Okudera, H.; Mizukami, T.; Arai, S.; Katayama, S.; Koyano, M.; Ito, N. Structural changes of synthetic opal by heat treatment. Phys. Chem. Miner. 2013, 40, 747–755. [Google Scholar] [CrossRef]
  44. Wahl, F.M.; Grim, R.E.; Graf, R.B. Phase transformations in silica as examined by continuous X-ray diffraction. Am. Mineral. 1961, 46, 196–208. [Google Scholar]
  45. Sosman, R.B. The Properties of Silica; The Chemical Catalog Company Inc.: New York, NY, USA, 1927; p. 856. [Google Scholar]
  46. Sosman, R.B. New and old phase of silica. Trans. Br. Ceram. Soc. 1955, 54, 655–670. [Google Scholar]
  47. Graetsch, H. Structural characteristics of opaline and microcrystalline silica minerals. Rev. Mineral. 1994, 29, 209–232. [Google Scholar]
Figure 1. Photograph of the skeleton of Euplectella aspergillum. Scale bar is 5 cm.
Minerals 08 00088 g001
Figure 2. TG curves for body frame, spicules, and silica gel.
Minerals 08 00088 g002
Figure 3. DTA curves for body frame, spicules, and silica gel.
Minerals 08 00088 g003
Figure 4. 1H NMR spectra for sponge body frame and silica gel.
Minerals 08 00088 g004
Figure 5. CP-MAS NMR spectra for sponge body frame and silica gel.
Minerals 08 00088 g005
Figure 6. Raman spectra (ν = 50–1500 cm−1) for body frame, spicule, silica gel, and silica glass.
Minerals 08 00088 g006
Figure 7. Raman spectra (ν = 2500–3900 cm−1) for body frame, spicule and silica gel. The spectrum of silica glass had no peaks in this wavenumber region.
Minerals 08 00088 g007
Figure 8. ATR-IR spectra (ν = 600–1800 cm−1) for body frame, spicules, silica gel, and silica glass.
Minerals 08 00088 g008
Figure 9. ATR-IR spectra (ν = 2500–4000 cm−1) for body frame, spicules, and silica gel. The spectrum of silica glass had no peaks in this wavenumber region.
Minerals 08 00088 g009
Figure 10. XRD patterns for body frame, spicules, silica gel, and silica glass.
Minerals 08 00088 g010
Figure 11. (a) Raman spectra (ν = 200–700 cm−1) for body frame, spicule, silica gel, and silica glass. These spectra were normalized to the D1 band at ca. ν = 480–490 cm−1. The Gaussian peak fitting results for (b) body frame, (c) silica glass, and (d) silica gel. The dashed lines show the measured Raman spectra and the solid lines are Gaussian peak fitting results.
Minerals 08 00088 g011
Figure 12. The XRD patterns for the sponge samples after TG-DTA measurements. Solid circle is the peak of cristobalite [47].
Minerals 08 00088 g012
Table 1. Chemical composition of glass sponge body frame and spicules. The PdO content is explained in the text. The values of silica glass were reported by Fukushima [18].
SamplesElement (%)
Na2OAl2O3SiO2SO3ClK2OCaOZnOPdO
body frame0.310.0299.200.080.080.140.190.02n.d.
spicules0.260.0499.30n.d.n.d.0.32n.d.n.d.0.12
silica glassn.d.0.0299.97n.d.n.d.n.d.n.d.n.d.n.d.
Table 2. Water content of samples estimated from TG results and 1H NMR spectra.
SamplesWeight Loss Estimated from TG Results (wt %)1H NMR (wt %)
RT-200200–600600–1400Total
body frame7.253.890.8812.0210.5
spicules7.373.730.9412.04-
silica gel14.844.341.0320.2117.2
Table 3. Relative intensities of Qn species.
SamplesRelative Intensities (%)
Q4Q3Q2Q4 / (Q2 + Q3)
body frame40.957.12.00.7
silica gel26.665.38.10.4
Table 4. FSDP positions Q of X-ray scattering profiles for samples (Q is 4πsinθ/λ: λ is wavelength of X-ray).
SamplesQ (Å−1)
silica glass1.51
silica gel1.63
spicule1.60
body frame1.61