Raman Micro-Spectroscopy Identifies Carbonaceous Particles Lying on the Surface of Crocidolite, Amosite, and Chrysotile Fibers


Department of Science and Technological Innovation, University of Eastern Piedmont, Viale T. Michel 11, 15121 Alessandria, Italy
*
Author to whom correspondence should be addressed.
Minerals 2018, 8(6), 249; https://doi.org/10.3390/min8060249
Submission received: 4 May 2018
/
Revised: 4 June 2018
/
Accepted: 12 June 2018
/
Published: 13 June 2018
(This article belongs to the Special Issue Occurrence, Crystal-Chemistry and Properties of Fibrous Minerals)
Abstract
:Micro-Raman spectroscopy has been applied on UICC (Union for International Cancer Control’s) crocidolite and amosite from South Africa and on UICC chrysotile from Canada. Under Optical Microscope (OM), the surface of the fibers was often characterized by areas, micrometric in size, appearing dark. The laser beam was successively focused on areas of the same sample showing different optical contrasts. On the bright zones, Raman spectra peculiar for crocidolite, amosite or chrysotile were recorded. When dark areas were optically identified, the laser beam was addressed onto these regions and, in the Raman patterns, in addition to the bands produced by the mineral fiber, bands ascribing to substituted carbonaceous phases were observed. These bands were lying in the 4000–1100 cm−1 spectral range. On the basis of the shape of the bands and their relative intensities, suggestions about the order-disorder of the carbonaceous particles could be proposed, and they appeared more ordered on amosite than on crocidolite and chrysotile. From the exposed data, crocidolite and amosite fibers from South Africa, and chrysotile fibers from Canada, largely used in industry in the past, are characterized by many carbonaceous micrometric particles, lying on the fiber surfaces. Based on the noxiousness of the carbon particles on human health, their presence on asbestos fibers may play a role in increasing the carcinogenic effects of the analyzed fibrous minerals.
1. Introduction
There are six fibrous mineral phases regulated by Law as “asbestos”, five belonging to the amphibole family including tremolite asbestos, actinolite asbestos, anthophyllite asbestos, cummingtonite-grunerite asbestos (amosite), riebeckite asbestos (crocidolite), and one belonging to serpentine, which is chrysotile [1,2,3,4,5,6]. Certainly, chrysotile, crocidolite, and amosite have been the most intensively used for production of different kinds of materials. Their extensive usage has determined severe diseases affecting human respiratory tract, ranging from asbestosis to Malignant Mesothelioma [7,8,9,10]. Despite the “asbestos ban” in the 1980s and the early 1990s in most of the EU and American countries [11], people are still suffering from asbestos-related diseases and will probably continue so because of disease latency time up to approximately 40 years. In fact, Peto et al., 1999, and Pelucchi et al., 2004, provided for a mortality peak in the period 2015–2019, estimating 250,000 male deaths for pleural cancer in the whole Western Europe during the period 1995–2029 [12,13].
Many researches have been addressing the issue with studies about the relationships between the biological media and these inorganic fibers. Studies have dealt with the toxicological aspects in vivo and/or in vitro and fiber characterization, trying to understand the reasons of fiber carcinogenicity [14,15,16,17,18,19,20,21,22,23,24,25,26,27,28,29]. The fibrous habit certainly plays an important role: it is known that Stanton et al., 1981, identified fibers showing length >8 μm and diameter ≤0.25 μm as being related to the probability of pleural sarcoma [30]. After, the World Health Organization (WHO) and the US Occupational Safety and Health Administration (OSHA) have defined “breathable fibers” as crystals with length (l) > 5 μm, diameter (d) < 3 μm, and l/d ≥ 3:1, and “index fibers” as crystals with l ≥ 5 μm and l/d ≥ 3:1, respectively [26,31,32]. In addition, the fiber biopersistence, a supplementary potential source of tissue inflammation [27,33,34], and the specific iron active sites on fiber surfaces have been recognized as important factors [15,35,36,37].
Although the minerals defined as “asbestos” have been extensively studied as it concerns their outcrops, paragenesis, crystal-chemistry and crystal structure, we propose here a deep characterization of crocidolite, amosite and chrysotile, the most used asbestos types in industry, to identify if crystallites of other mineral/inorganic phases lie on the fiber surface. The selected technique was micro-Raman spectroscopy, which allows analysis of unprepared samples and is, therefore, applicable directly on single fibers or bundles of fibers. Moreover, by focusing the laser beam in different areas of the same sample, heterogeneity in the same crystal [38], or presence of particles/crystallites lying on the crystal surface can be highlighted [39]. As it concerns this last application of micro-Raman spectroscopy, our research group recently proved the presence of many particles of goethite FeO(OH), hematite Fe2O3, and jarosite KFe33+(SO4)2(OH)6 on the surface of erionite (zeolite, not regulated by Law as “asbestos”, with ideal chemical formula K2(Na,Ca0.5)7[Al9Si27O72]·28H2O) fibers from Oregon (USA) and Karlik (Cappadocia, Turkey) [35]. In the chemical formula of erionite, iron may be present only as impurity, nevertheless the large amount of iron-mineral particles lying on erionite surface may contribute to the carcinogenicity of this mineral defined, as proposed by Hill et al., 1990, for the first time, and by IARC, 2012, more carcinogenic than “asbestos” [40,41].
The main goal of this study is the identification and localization of foreign carbonaceous material on the considered asbestos fibers by a technique that allows sample analyses without pre-treatment. Their observation might be of interest in future carcinogenic studies, considering also the possible synergistic effects of asbestos and carbonaceous phases on the human health [42,43,44].
2. Materials and Methods
The studied crocidolite samples were purchased from Union for International Cancer Control’s (UICC, Geneva, Switzerland), which provides reference standard samples of this amphibole asbestos from South Africa. They appear as fibers/bundles of fibers showing different lengths, ranging from fibrils (few micrometers) to well-developed elongated morphologies (tens to hundreds micrometers). Rinaudo et al., 2004, Croce et al., 2013, and Gualtieri et al., 2013 defined their Raman spectra in the 1200–100 cm−1 spectral range, where the vibrational modes produced by the amphibolic lattice vibrations occur [5,45,46]. In the present work, the 4000–100 cm−1 spectral range was considered.
Similarly, the studied amosite samples were original of South Africa and they were composed by fibers/bundles of fibers with comparable lengths to those of crocidolite samples. Also for this mineral, the Raman spectra in the low wavenumber region have been previously described in Rinaudo et al., 2004 [5].
The chemical compositions of these two mineral phases were determined under analytical electron microscopy (AEM Philips CM12, Andover, MA, USA) and reported in Rinaudo et al., 2004 [5].
Chrysotile samples were UICC standard chrysotile asbestos “B” Canadian (NB #4173-111-1), from Quebec, Canada, whose crystal structure and chemistry has been reported in Pollastri et al., 2016 [47].
Micro-Raman analyses were carried out using a Jobin Yvon HR800 LabRam μ-spectrometer (HORIBA Jobin Yvon, Paris, France), equipped with an Olympus BX41 microscope (Olympus, Tokyo, Japan) and a rotating stage, a HeNe 20mW laser working at 632.8 nm, and a charge-coupled device air-cooled detector. Instrument calibration was carried out before each analysis by checking the position and intensity of the Si band at 520.65 ± 0.05 cm−1. In order to balance signal against noise, at least two cycles of 200 s were performed. A D06 filter allowed preventing damages to the samples and the confocal hole was maintained at 200 μm to collect signal from the surface of the fibers. All the spectra were collected with an 80x objective, with a 0.75 Numerical Aperture (N/A), and a 1800 gr/mm diffraction grating. All the physical parameters were fixed during every analysis. Spectral resolution of the instrument was about 2 cm−1. The registered spectra were processed by means of the ORIGIN software v. 6.0. On asymmetric bands, fitting process was applied using OPUS software v. 5.5. Band fitting was performed after 13 points FFT smoothing of the spectrum, using a Gaussian function and a minimum number of component bands to obtain reproducible results with the minimal residual error.
For each mineral phase, about 30 fibers/bundles of fibers were studied. Each fiber/bundle of fibers was at first observed under the Optical Microscope (OM), annexed to spectrometer. Afterward, several spectra were recorded in the range of 4000–100 cm−1, addressing the laser beam on areas characterized by different optical contrasts. Same fiber orientation with respect to the laser beam was maintained thanks to the rotating stage, in order to avoid relative intensity ratio variations of the Raman bands. A mean of 30 analyses per sample were provided in this study.
During analyses, no particle or fiber damage was observed.
3. Results
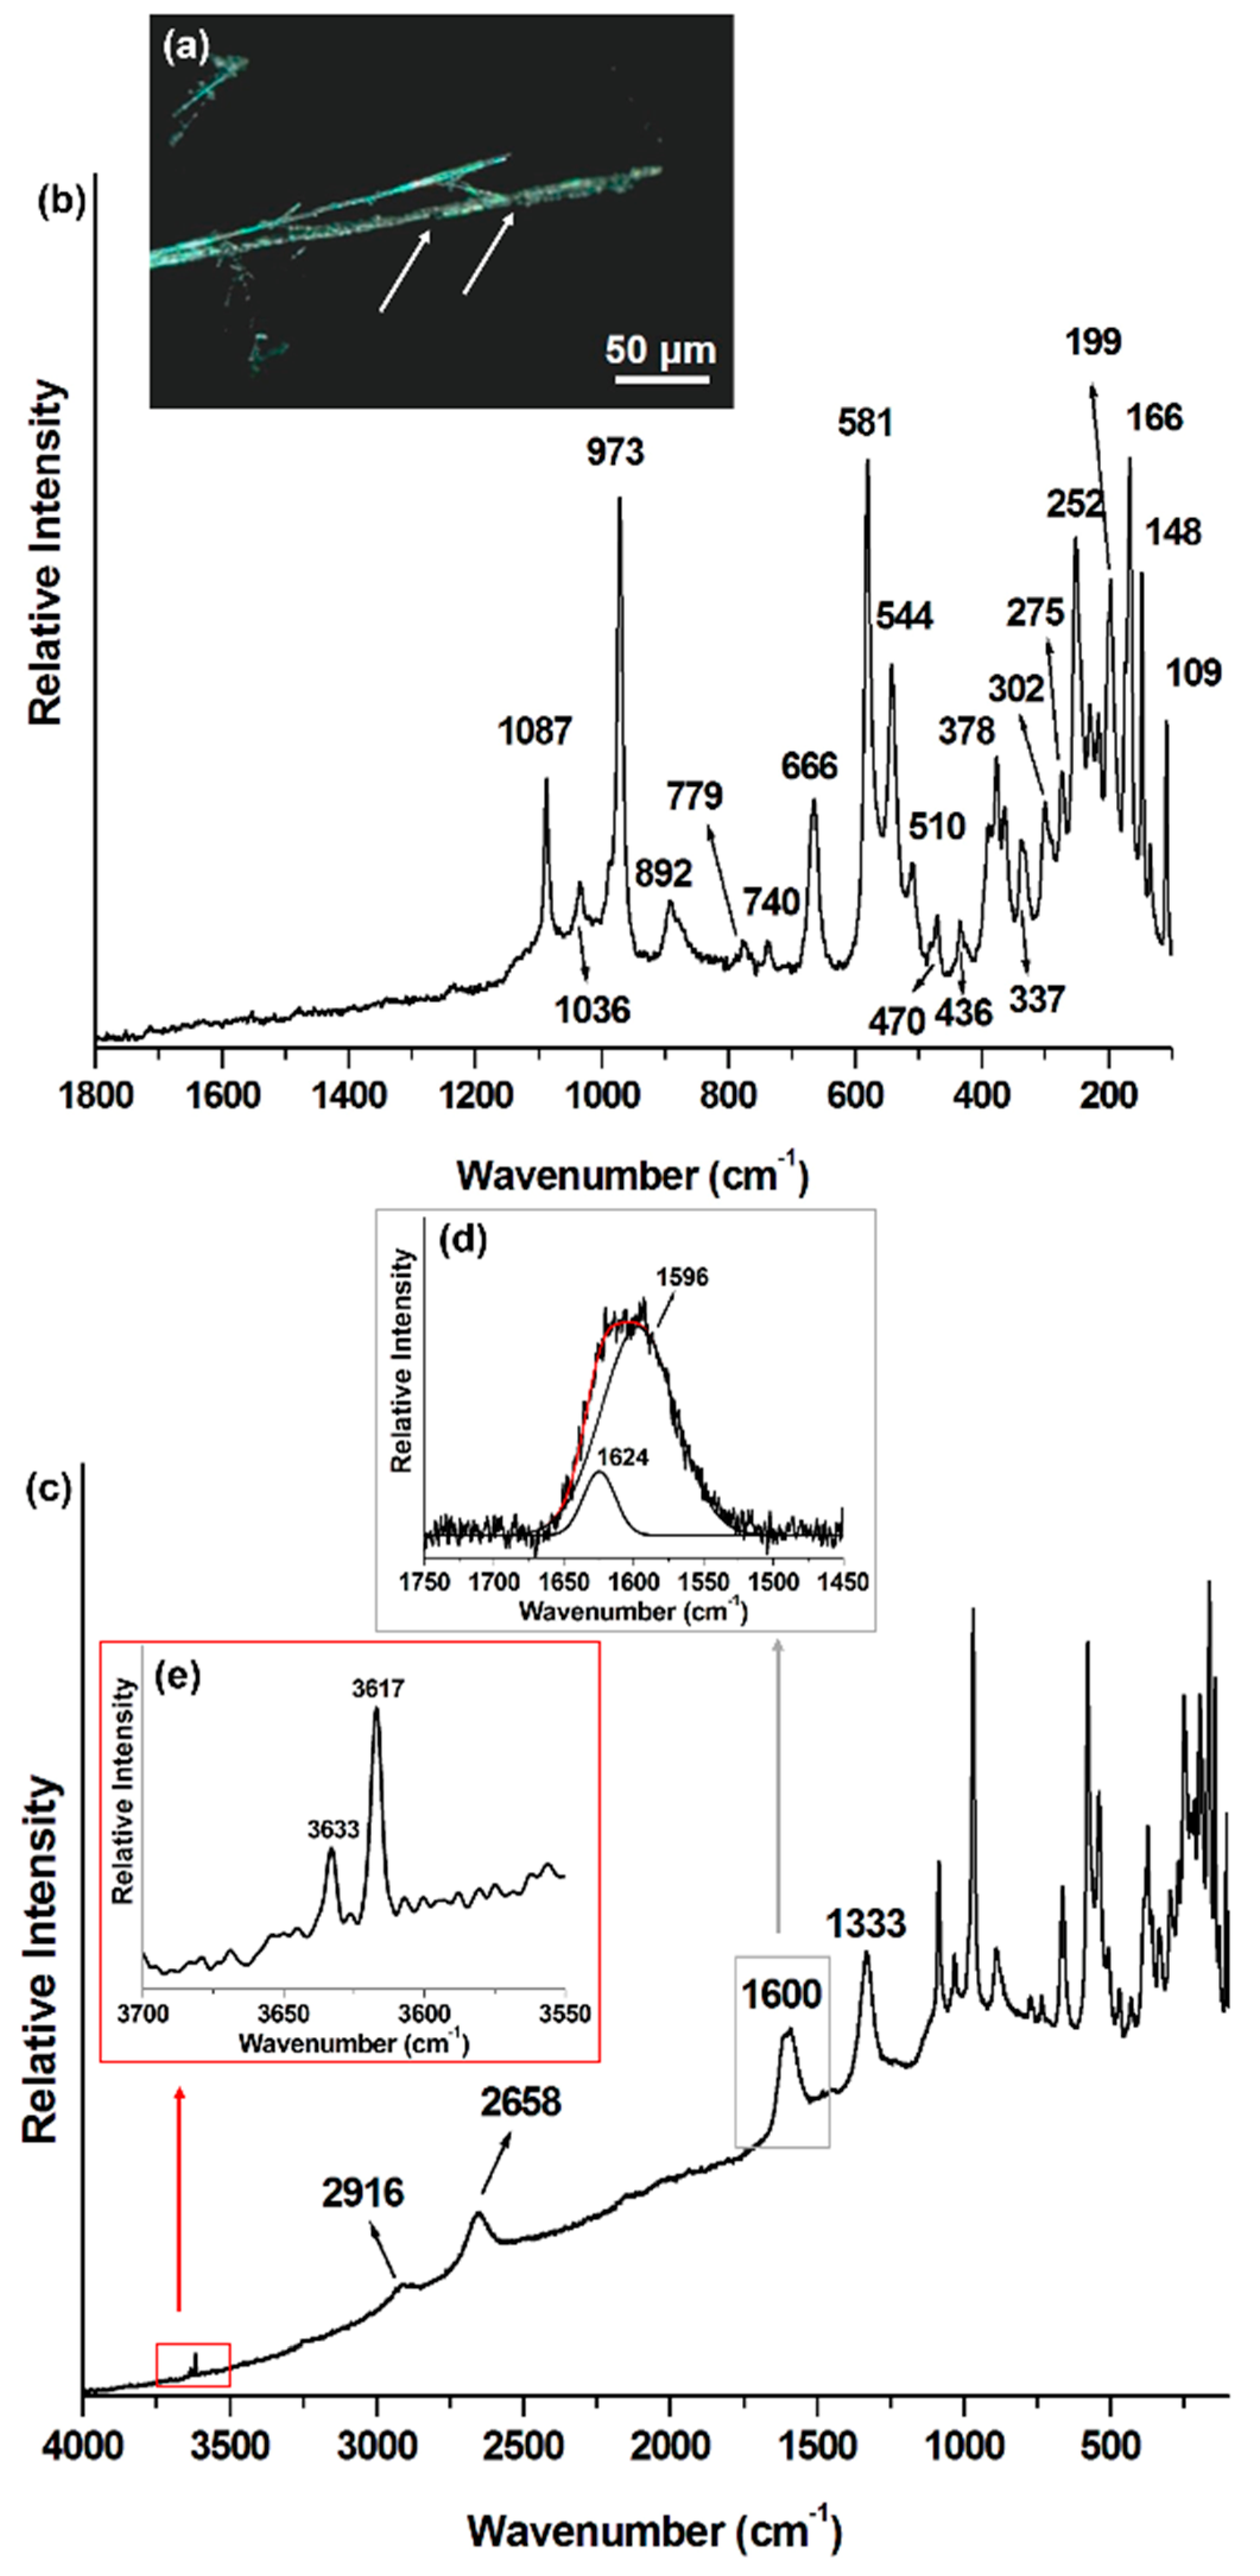
The crocidolite fibers observed under OM showed very often, but not always, a surface characterized by different color contrasts: bluish colored and dark areas, micrometric in size, Figure 1a. When the laser beam of the spectroscope was directed onto the bluish areas, Raman spectra as that reported in Figure 1b were recorded. Only Raman bands with relative intensities peculiar for crocidolite were detected. The results were in agreement with those reported in Rinaudo et al., 2004, where also the attribution of the Raman bands to the different vibrational modes was described [5]. Note that in these spectra, as that one in Figure 1b, no Raman band was detected in the spectral region 4000–1200 cm−1.
When the laser beam was otherwise directed onto the dark areas, maintaining, as specified before, the same orientation of the fibrous phases under the OM, Raman spectra as that shown in Figure 1c were collected. In these spectra, in addition to the bands produced by crocidolite in the spectral region 1200–100 cm−1, new bands at 1333 and 1600 cm−1 were observed, with the first band exhibiting higher intensity with respect to the second one. Other four minor bands at 2658, 2916, 3617, and 3633 cm−1 were detected. By literature data, specific bands in the spectral region 3500–1200 cm−1 are produced by carbonaceous phases, which may be characterized by different degrees of reticular order-disorder [48,49,50,51,52,53,54,55,56]. Fitting program has been applied on the band at 1600 cm−1, which appears large and formed by more than one component. Two resulting components were identified at 1596 and 1624 cm−1, the first band showing higher intensity than the second one, Figure 1d.
No significant difference between the two studied samples of crocidolite was observed.
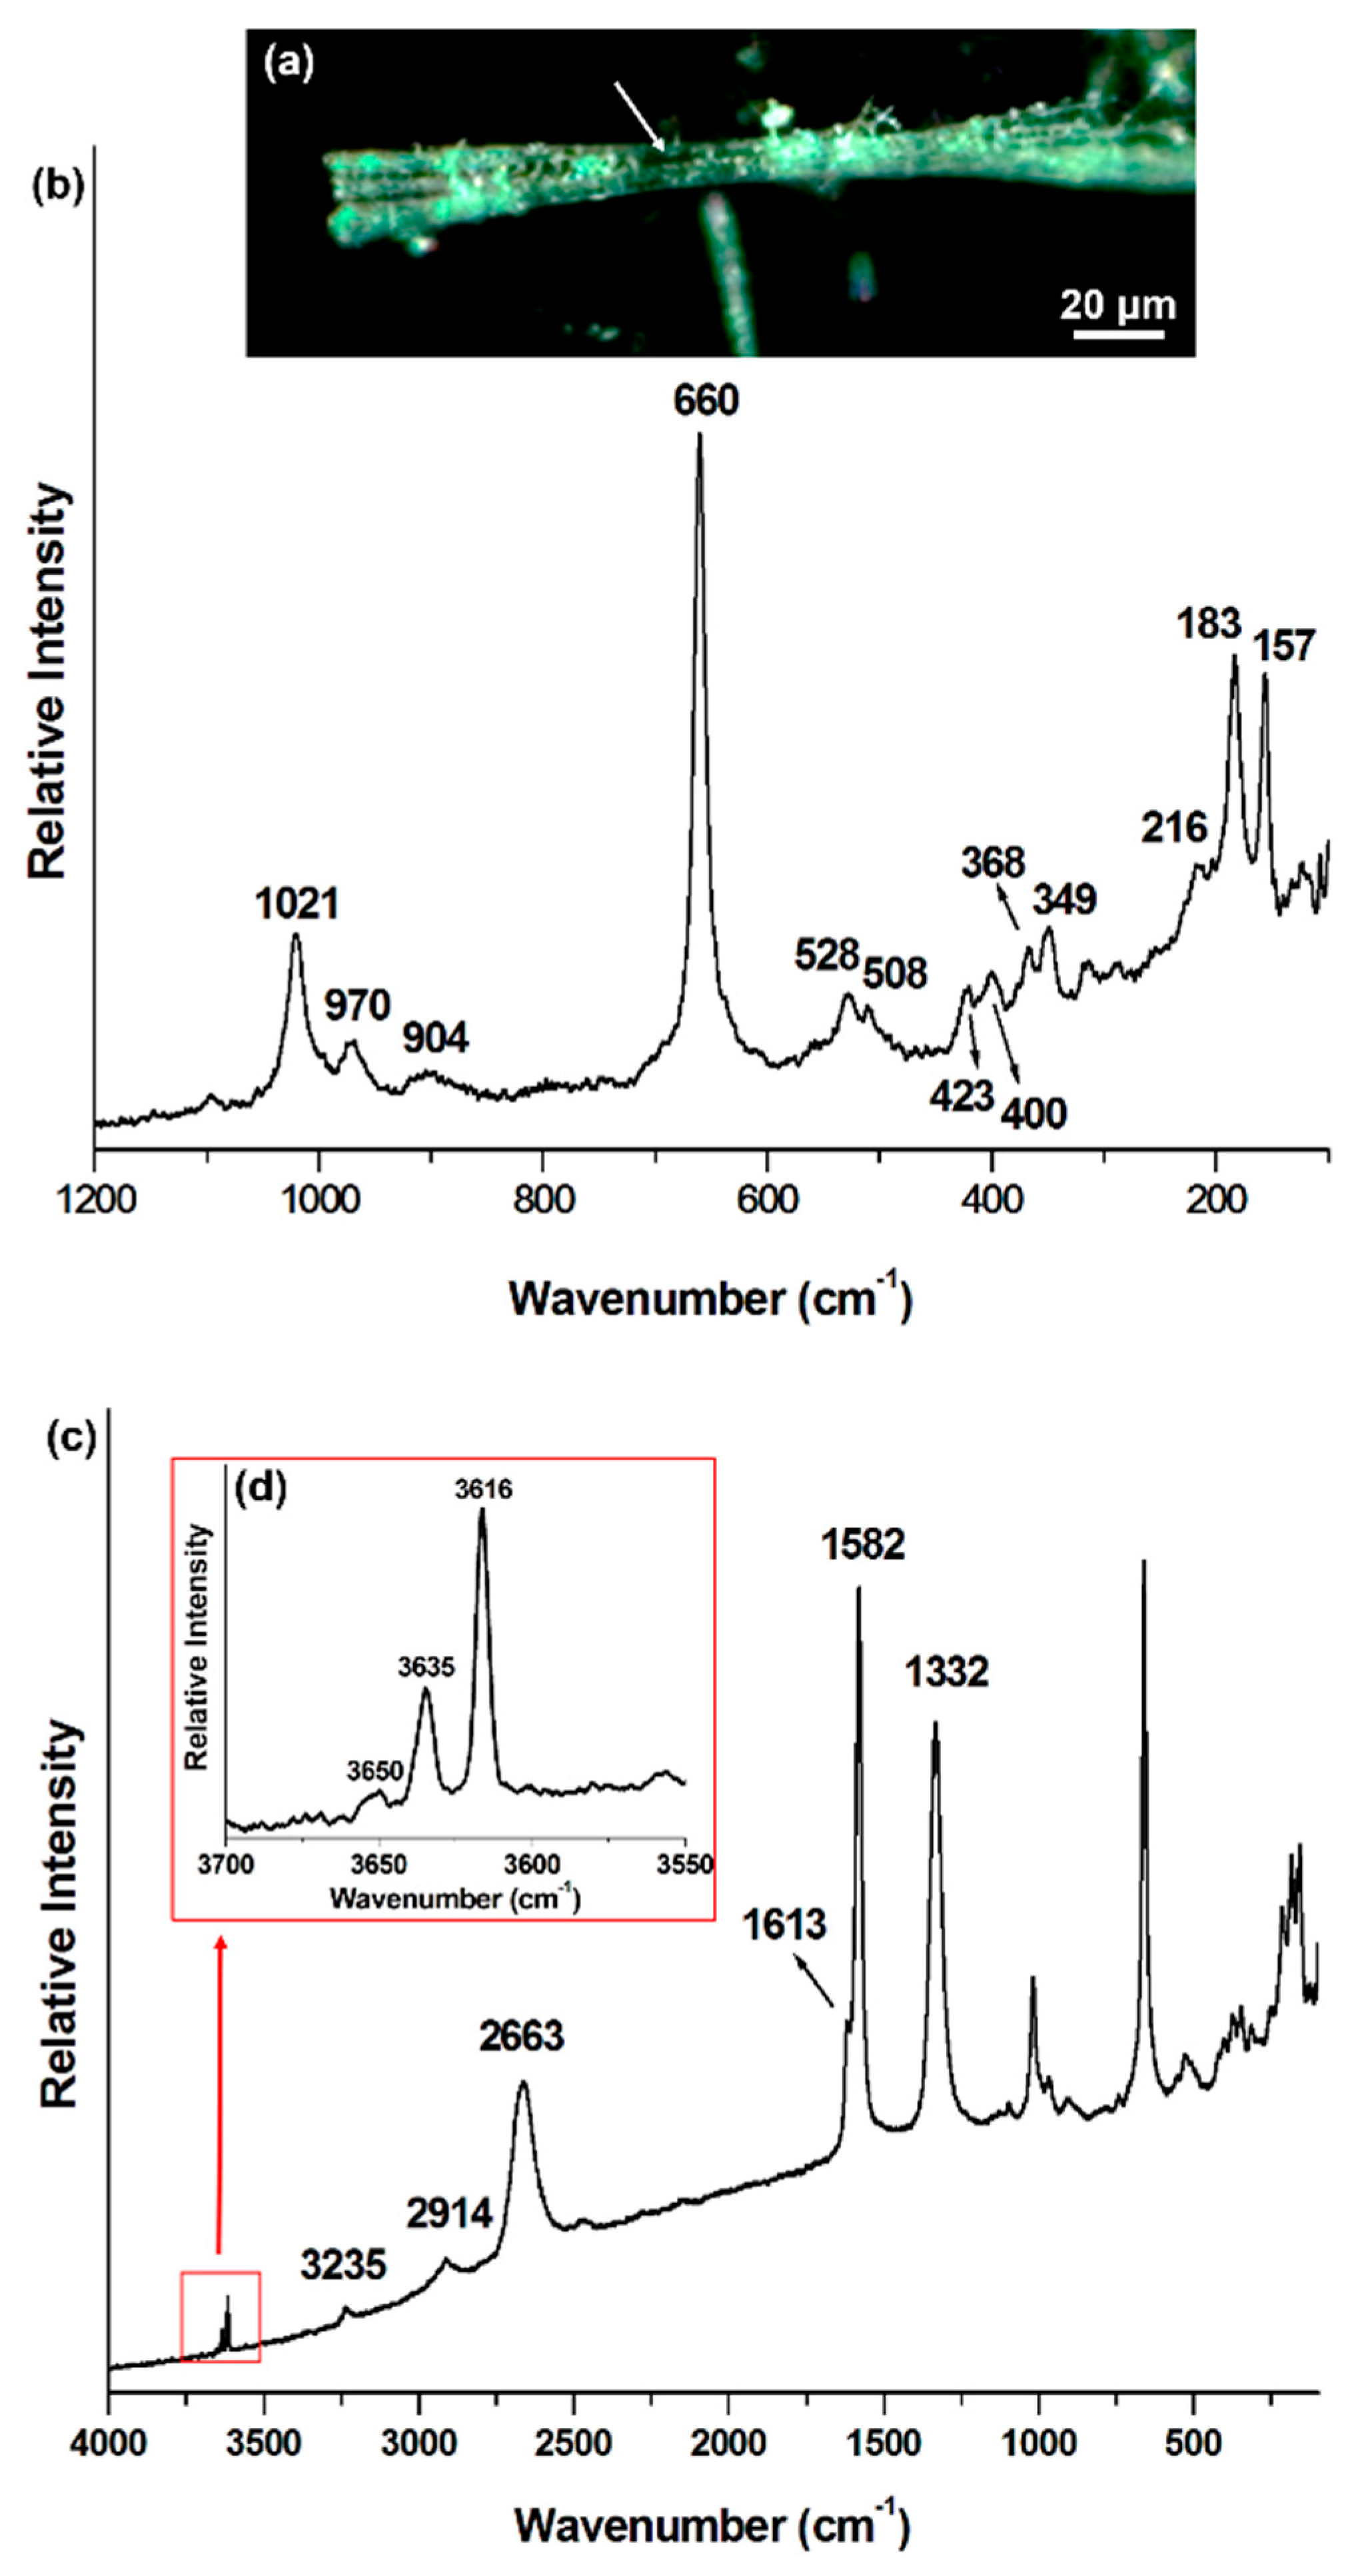
Under OM, also the amosite fibers/bundles of fibers show dark areas, Figure 2a. In Figure 2b, the Raman bands produced by amosite reticular lattice are shown. The data agree with those reported by Rinaudo et al., 2004, where also the attribution of the Raman bands to the different vibrational modes has been described [5]. In the spectral region of 4000–1200 cm−1, results as those described previously for carbonaceous phases on crocidolite were seldom observed. More frequently, Raman spectra as that reported in Figure 2c were recorded. On these spectra, the bands at 1332 and 1582 cm−1 appear narrower than those observed on crocidolite and overall the band at 1582 cm−1 showed higher intensity, displaying a component at 1613 cm−1. Other six minor bands were observed at 2663, 2914, 3235, 3613, 3635, and 3650 cm−1.
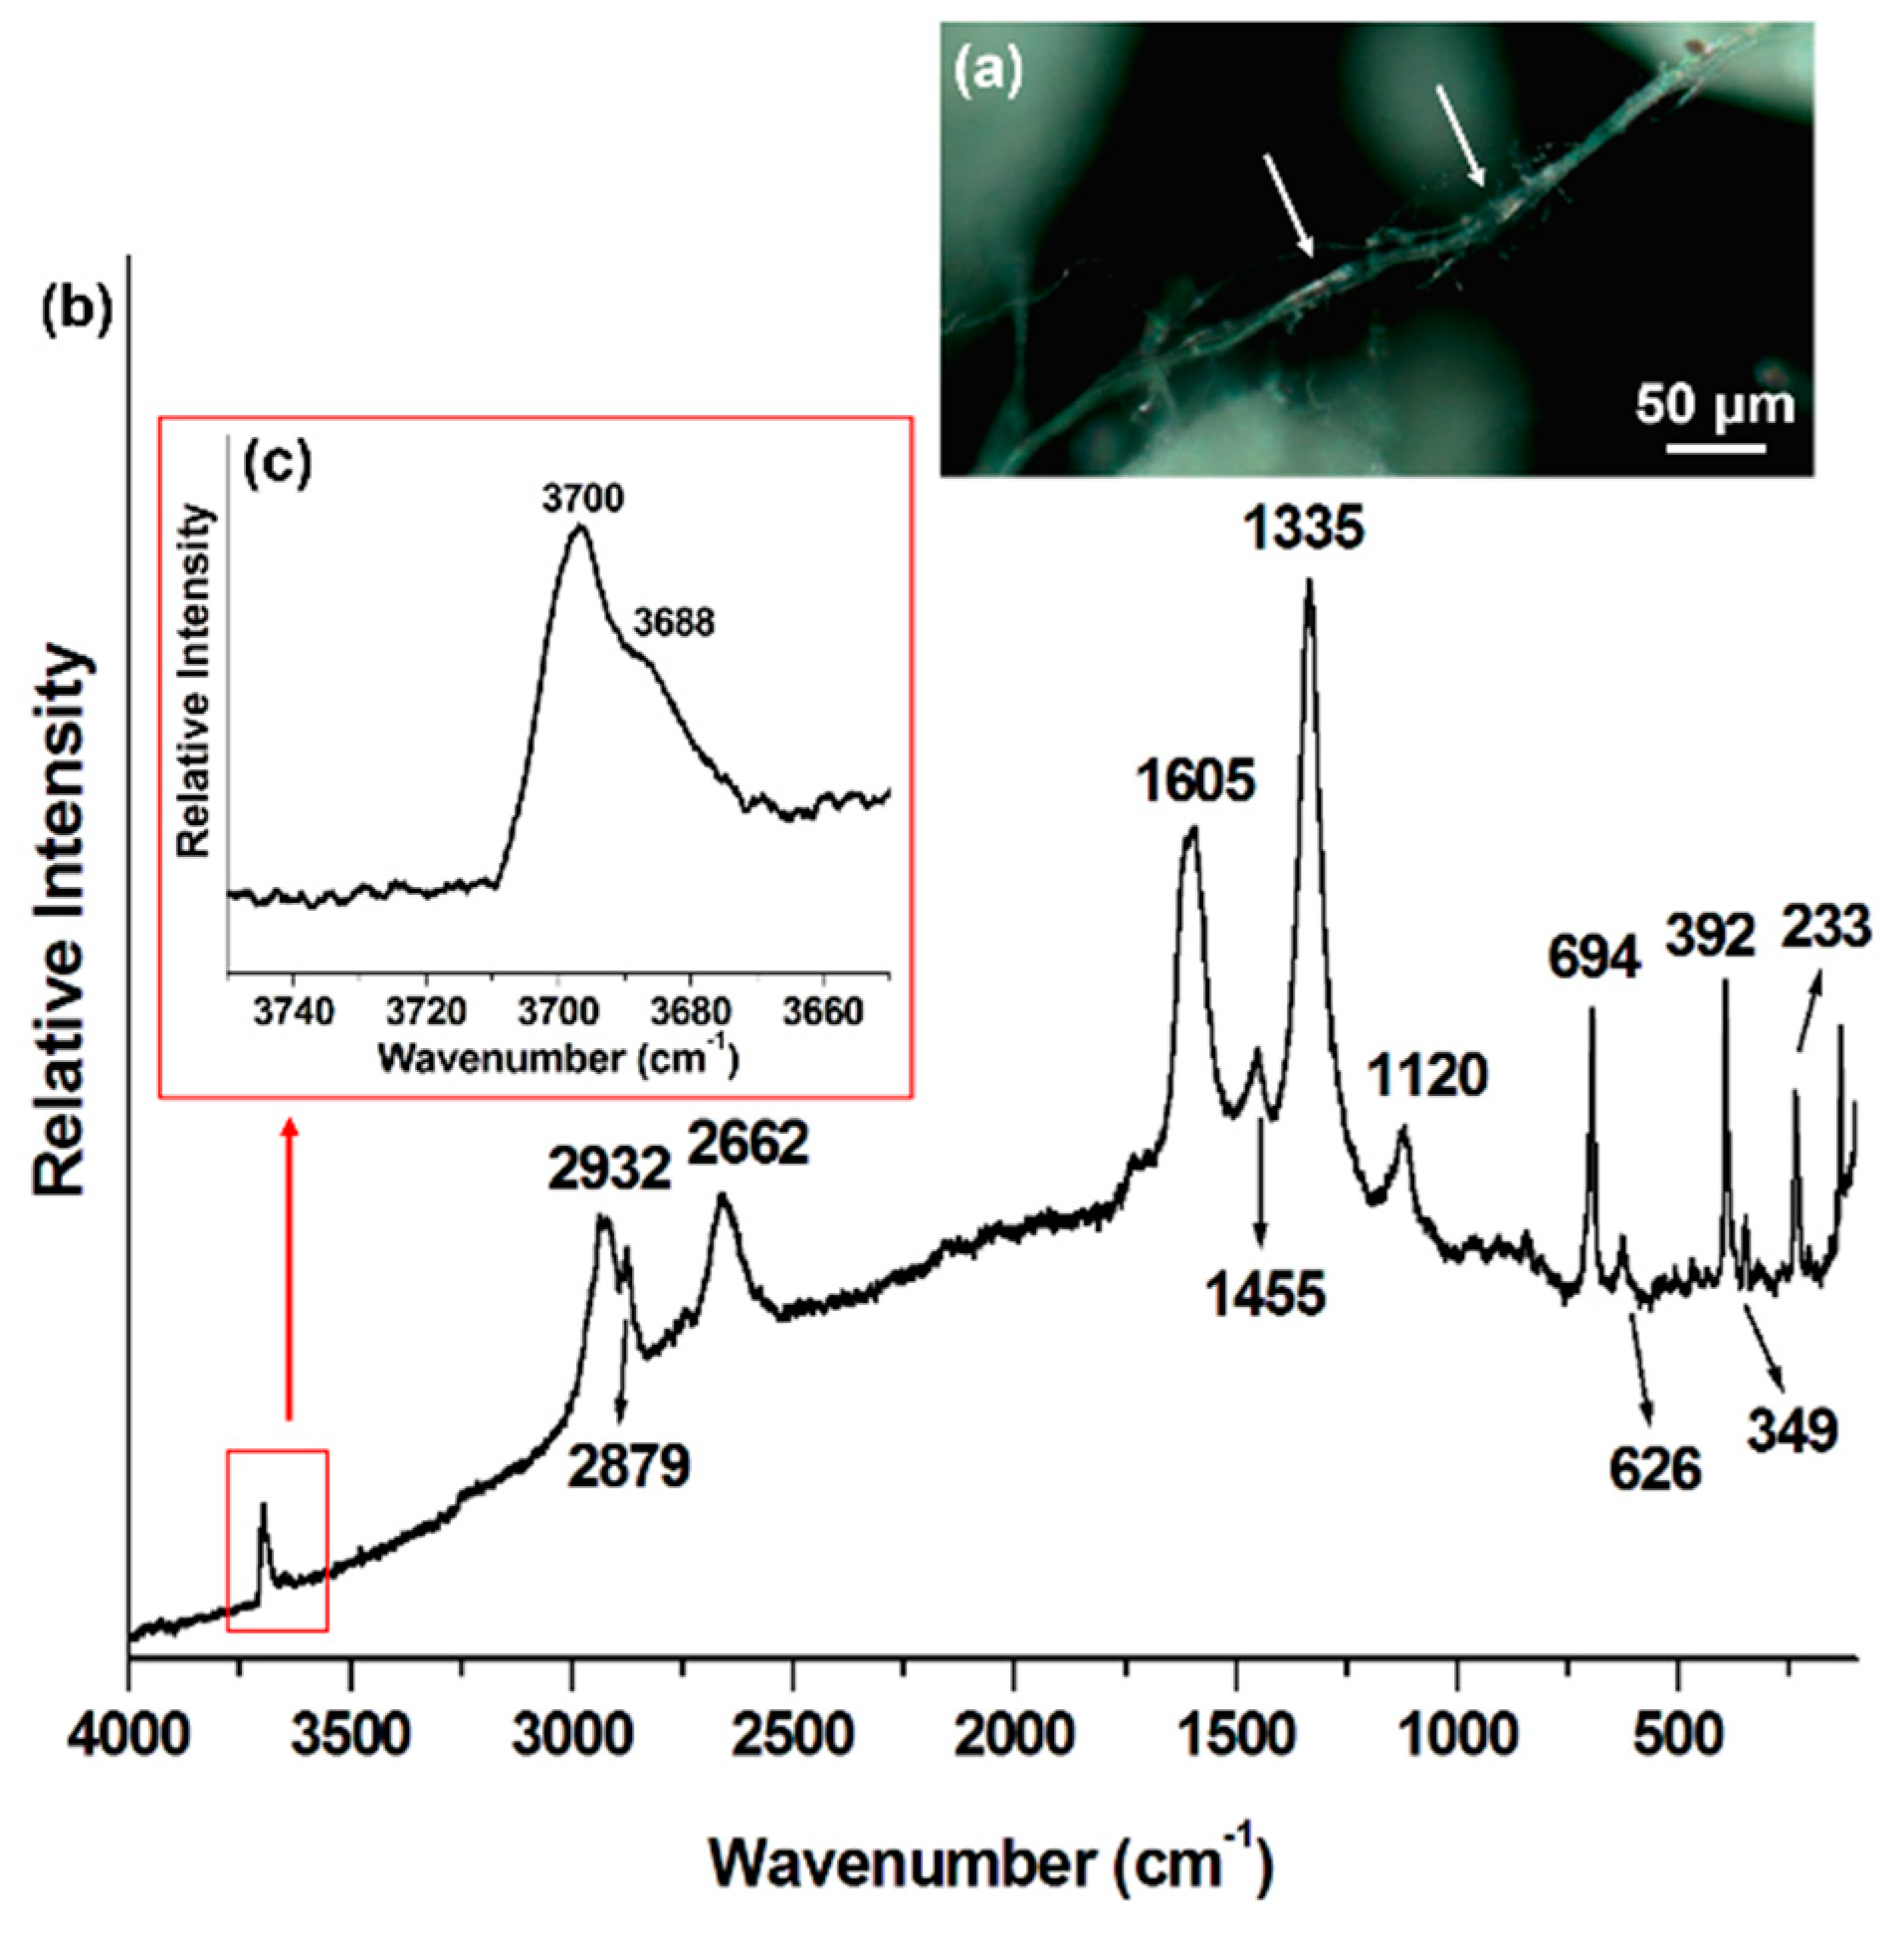
As it concerns the case of UICC Canadian chrysotile, dark areas are also observed on the bundles of fibers of these samples, as shown in Figure 3a. Figure 3b shows a typical collected Raman spectrum. The bands detected in the 1200–100 cm−1 spectral range, except the band at 1120 cm−1, agree with the data in Rinaudo et al., 2003 and Groppo et al., 2006 [6,57]. Directing the laser beam onto the dark areas, specific bands ascribable to carbonaceous phases were detected, Figure 3b. On chrysotile, in addition to the bands detected on crocidolite or amosite samples related to the carbonaceous phases, Figure 1c and Figure 2c, additional bands, lying at 1455 and 2879 cm−1, were observed. Another peculiarity was the wavenumber and intensity of the band at 2932 cm−1 and the detection of only one band at 3700 cm−1, with a shoulder at 3688 cm−1.
4. Discussion
In this work, the potential of Raman micro-spectroscopy in the identification of small particles/crystallites lying on the surface of mineral phases is clearly demonstrated. In fact, analyzing different regions of the same bundle of crocidolite, amosite, and chrysotile fibers, showing different colors under OM, the presence of particles, micrometric in size, showing different chemical composition and lying on the fiber surface could be proved. Considering the Raman spectra recorded in dark regions, for the spectral range corresponding to lattice vibrations of the crocidolite, amosite, and chrysotile minerals 1200–100 cm−1, the observed data (Table 1) agree with those described in Rinaudo et al., 2003, Rinaudo et al., 2004, and Groppo et al., 2006 [5,6,57], except for the band at 1120 cm−1 on chrysotile spectra, Figure 1b, Figure 2b and Figure 3b. New bands were observed in the spectral range of 4000–1200 cm−1, where bands produced by carbonaceous phases occur [48,49,50,51,52,53,54,55,56]. In fact, these phases exhibit on the Raman spectra a mixture of D bands (diamond-like), provided by defective graphitic layers and by different sp3 C-bonds, and G bands (graphite-like), due to sp2 C-frameworks. The D band lies in the diagnostic range of 1330–1350 cm−1, whereas the G band is detected in the diagnostic range of 1550–1600 cm−1 [50,52]. The different wavenumbers observed for the same vibrational mode are related to different order-disorder combinations in the lattice and higher wavenumbers corresponding to higher disorder degree [52]. Also, the relative intensities of the D and G bands are related to the reticular characteristics: higher intensity of the D band with respect to the G band indicates a higher degree of disorder in the structure of the carbonaceous phases, with the D vibrational modes Raman active only in defective graphitic samples [50,51]. In the Raman spectra recorded on crocidolite samples studied during this work, the D band, detected at 1333 cm−1, showed higher intensity than the G band observed at 1600 cm−1, Figure 1c. This feature suggests carbonaceous particles characterized by important reticular disorder, confirmed by the shape of the G band at 1600 cm−1, which appears large and formed by more than one component, Figure 1c. Fitting process applied to it revealed two bands: one, more intense, at 1596 cm−1, corresponding to G band and another one at 1624 cm−1 (D′ band, Figure 1d).
Also, the G′ band, corresponding to the second order Raman scattering is detected at 2658 cm−1 [51]. Noteworthy, in the 3000–2900 cm−1 spectral range, Raman νCH stretching mode diagnostic peaks account for different C–H aliphatic groups embedded in carbon substrates. They are related to complex carbonaceous materials, resembling morphologies of humic acid-like substances, where different aliphatic sp3 C moieties are substituents of different graphitized carbon layered pillars [58]. From all the above considerations, and also from the width of the Raman bands associated to the carbonaceous phases in our spectra, a poor structural order of C particles lying on the crocidolite surface can be suggested.
The same result is obtained following the methodology proposed by Marshall et al., 2007, to highlight disorder in the C crystallites [59]. The Authors consider that carbonaceous solid materials (e.g., coals, kerogens, cokes, oils) contain crystalline particles (crystallites), nanometers in size, constituted by substituted graphite-like layers and aromatic clusters. The Authors propose to relate the disorder to the ratios of ID/IG and ID/(ID + IG), higher values of the ID/(ID + IG) ratio corresponding to higher degree of structural disorder. Applying the method proposed by Marshall et al., 2007 [59], in our experimental case [60], we obtain ID/IG = 392/275 = 1.42 and ID/(ID + IG) = 392/(392 + 275) = 0.59, values indicating high structural disorder in the carbonaceous materials lying on crocidolite asbestos fibers.
The sharp bands at 3617 and 3633 cm−1 appeared in the range of stretching vibration of OH− groups and are related to the values obtained by Lewis et al., 1996 on crocidolite studied using infrared (IR) spectroscopy [61]. Nevertheless, these bands were not detected on the spectra from non-dark areas, where a minor polarizability occurs for the absence of C-rich phases and only the bands provided by crocidolite in the low spectral range could be observed.
On amosite samples, analyzed with the same fiber orientation with respect to the laser beam, the Raman spectra indicated more ordered carbonaceous phases. Actually, the D and G bands showed a narrower shape, lying at 1332 and 1582 cm−1, with the G band lying at lower wavenumbers and characterized by higher intensity than the D band. Nevertheless, a certain degree of disorder could yet be hypothesized by the presence of the satellite D′ band at 1613 cm−1 and by the weak CH-aliphatic broad band at 2914 cm−1 [58]. The band lying at 3235 cm−1, harmonic 2D′ band [51], is peculiar for carbonaceous materials on amosite, and the three bands at 3613, 3635 and 3650 cm−1 are assigned to crystalline stretching vibrations of OH− groups, values matching with the data reported in Bard et al., 1997, and Lewis et al., 1996 [61,62].
The results described on the amphibole phases studied by micro-Raman spectroscopy agree with the data in Miyano and Beukes, 1997 [63]. These authors, by mineralogical and petrological study of Penge Iron Formation of South Africa, defined the constituting minerals and identified presence of carbonaceous phases. A technique used in that work for mineral identification was X-ray powder diffraction (XRPD). The fact that no X-ray peak ascribing to carbonaceous phases was observed by XRPD led the Authors to define the carbonaceous phases as amorphous kerogen. The Raman spectra recorded during this work on the particles lying on the fibers demonstrate that the carbonaceous phases are characterized by different degrees of disorder, but are not completely amorphous.
On chrysotile samples, carbonaceous phases displaying relative intensities of D and G bands comparable to those detected on crocidolite, appeared to be characterized by important reticular disorder. The band at 2932 cm−1, lying at higher wavenumber with respect to the band at about 2910 cm−1 detected on the spectra from carbonaceous phases lying on crocidolite and amosite (Figure 1c and Figure 2c) showed a higher intensity. This behavior indicates higher presence of aliphatic groups in the carbonaceous material. Also, the presence of the bands at 1455 and 2879 cm−1 can be ascribed, respectively, to stretching and scissoring modes of aliphatic sp3 C–H bonds in the carbonaceous phases [64]. Moreover, the band lying at 1120 cm−1 may be ascribed to a symmetric stretching of C–O–C bonds [64] provided by incompletely graphitized materials. According to our data, the carbonaceous particles lying on chrysotile exhibit spectroscopic behavior indicating an important reticular disorder and vibrational heterogeneity, higher than in C phases lying on crocidolite and amosite fibers. On the other hand, Gibbs, 1971, and Hilborn et al., 1974, demonstrated by IR and chromatographic studies that n-alkanes and polycyclic aromatic hydrocarbons (PAHs) may be found with predominant molecular weights between C16 and C36 in Canadian chrysotile from Eastern Townships of Quebec [65,66]. The features detected in the Raman spectra recorded from carbon materials on chrysotile samples might be related to the presence of these phases.
5. Conclusions
In all the asbestos phases analyzed in this work, micro-Raman spectroscopy identified micrometric carbonaceous phases lying on the fiber surfaces. Their presence in UICC crocidolite, amosite, and chrysotile asbestos reference samples was already highlighted using gas chromatographic, UV spectrophotometry, IR, and mass spectroscopy techniques, after sample solubilization pre-treatment [65,66,67,68,69]. Nevertheless, the carbonaceous phases could not be localized in the samples by the used technique. Carbonaceous phases, following the literature data [63,65], have been recognized in the Penge formation and in chrysotile from Quebec; their origin described mainly as biogenic. Micro-Raman spectroscopy, which allows sample characterization with no manipulation, and hence avoiding any source of contamination, proved that they are lying on the fiber surfaces. As demonstrated by many scientific works, the carbonaceous phases are not harmless to human health [42,43,44]. Considering that crocidolite and amosite are the amphibole asbestos phases showing the highest carcinogenic effects [15,35,36,37] and that these two mineral phases have been the most used asbestos types with chrysotile, the presence of many micrometric carbonaceous particles on fiber surfaces can indeed play a role in increasing the carcinogenic effect of these fibrous minerals.
Moreover, micro-Raman spectroscopy can support a widespread characterization of the minerals. Actually, this technique: (a) can be applied directly on the samples, at room temperature without manipulation, (b) is sensitive to the presence of very small amounts of material, (c) allows to distinguish phases with close chemical composition but different three-dimensional configuration; hence, it provides complementary information with respect to those acquired by the techniques normally used by mineralogist/crystallographers/petrologists, e.g., SEM/EDS, XRPD, TEM.
Author Contributions
Conceptualization, A.C. and C.R.; Methodology, A.C., A.A. and C.R.; Software, A.C. and C.R.; Validation, C.R., A.A. and A.C.; Formal Analysis, A.C., A.A. and C.R.; Investigation, A.C.; Resources, C.R.; Data Curation, A.C., A.A. and C.R.; Writing-Original Draft Preparation, A.C. and C.R.; Writing-Review & Editing, A.A. and A.C.; Visualization, A.C.; Supervision, C.R.; Project Administration, C.R.; Funding Acquisition, C.R.
Funding
This research received no external funding.
Acknowledgments
This work was supported by UPO (“Integrated system for the fibre pollution assessment in air and characterization of the fibrous phases in different matrixes”). The authors wish to thank the Editors and the anonymous referees for their work.
Conflicts of Interest
The authors declare no conflict of interest.
References
- International Agency for Research on Cancer (IARC). Asbestos (chrysotile, amosite, crocidolite, tremolite, actinolite, and anthophyllite). In IARC Monographs on the Evaluation of Carcinogenic Risks to Humans; IARC: Lyon, France, 2012; Volume 100C, pp. 219–309. ISBN 978 92 832 1320 8. [Google Scholar]
- Hawthorne, F.C.; Oberti, R.; Harlow, G.E.; Maresch, W.V.; Martin, R.F.; Schumacher, J.C.; Welch, M.D. Nomenclature of the amphibole supergroup. Am. Mineral. 2012, 97, 2031–2048. [Google Scholar] [CrossRef]
- Italian Government, Legislative Decree No. 277 of 15 August 1991, Implementing EU Directives No. 80/1107/EEC, No. 82/605/EEC, No. 83/477/EEC, No. 86/188/EEC, and No. 88/642/EEC, on the Protection of Workers from the Risks Related to Exposure to Chemical, Physical and Biological Agents at Work. Gazzetta Ufficiale Supplemento Ordinario no. 200, 27 August 1991.
- Leake, B.E.; Woolley, A.R.; Arps, C.E.S.; Birch, W.D.; Gilbert, M.C.; Grice, J.D.; Hawthorne, F.C.; Kato, A.; Kisch, H.J.; Krivovichev, V.G.; et al. Nomenclature of amphiboles: Report of the Subcommittee on amphiboles of the International Mineralogical Association, Commission on New Minerals and Mineral Names. Can. Mineral. 1997, 35, 219–246. [Google Scholar]
- Rinaudo, C.; Belluso, E.; Gastaldi, D. Assessment of the use of Raman spectroscopy for the determination of amphibole asbestos. Mineral. Mag. 2004, 68, 455–465. [Google Scholar] [CrossRef]
- Rinaudo, C.; Gastaldi, D.; Belluso, E. Characterization of chrysotile, antigorite and lizardite by FT-Raman spectroscopy. Can. Mineral. 2003, 41, 883–890. [Google Scholar] [CrossRef]
- Cooke, W.E. Pulmonary asbestosis. Br. Med. J. 1927, 2, 1024–1025. [Google Scholar] [CrossRef] [PubMed]
- Cooke, W.E. Asbestos dust and the curious bodies found in pulmonary asbestosis. Br. Med. J. 1929, 2, 578–580. [Google Scholar] [CrossRef] [PubMed]
- Donaldson, K.; Seaton, A. A short history of the toxicology of inhaled particles. Part. Fibre Toxicol. 2012, 9, 13. [Google Scholar] [CrossRef] [PubMed] [Green Version]
- Wachowski, L.; Domka, L. Sources and effects of asbestos and other mineral fibres present in ambient air. Pol. J. Environ. Stud. 2000, 9, 443–454. [Google Scholar]
- Spasiano, D.; Pirozzi, F. Treatments of asbestos containing wastes. J. Environ. Manag. 2017, 204, 82–91. [Google Scholar] [CrossRef] [PubMed]
- Pelucchi, C.; Malvezzi, M.; La Vecchia, C.; Levi, F.; Decarli, A.; Negri, E. The mesothelioma epidemic in Western Europe: An update. Br. J. Cancer 2004, 90, 1022–1024. [Google Scholar] [CrossRef] [PubMed]
- Peto, J.; Decarli, A.; La Vecchia, C.; Levi, F.; Negri, E. The European mesothelioma epidemic. Br. J. Cancer 1999, 79, 666–672. [Google Scholar] [CrossRef] [PubMed] [Green Version]
- Andolfi, L.; Trevisan, E.; Zweyer, M.; Prato, S.; Troian, B.; Vita, F.; Borelli, V.; Soranzo, M.R.; Melato, M.; Zabucchi, G. The crocidolite fiber interaction with human mesothelial cells as investigated by combining electron microscopy, atomic force and scanning near-field optical microscopy. J. Microsc. 2013, 249, 173–183. [Google Scholar] [CrossRef] [PubMed]
- Aust, A.E.; Cook, P.M.; Dodson, R.F. Morphological and chemical mechanisms of elongated mineral particle toxicities. J. Toxicol. Environ. Health Part B 2011, 14, 40–75. [Google Scholar] [CrossRef] [PubMed]
- Carbone, M.; Ly, B.H.; Dodson, R.F.; Pagano, I.; Morris, P.T.; Dogan, U.A.; Gazdar, A.F.; Pass, H.I.; Yang, H. Malignant mesothelioma: Facts, myths, and hypotheses. J. Cell. Physiol. 2012, 227, 44–58. [Google Scholar] [CrossRef] [PubMed]
- Crawford, D. Electron microscopy applied to studies of the biological significance of defects in crocidolite asbestos. J. Microsc. 1980, 120, 181–192. [Google Scholar] [CrossRef] [PubMed]
- Fubini, B.; Mollo, L. Role of iron in the reactivity of mineral fibers. Toxicol. Lett. 1995, 82–83, 951–960. [Google Scholar] [CrossRef]
- Goodglick, L.A.; Kane, A.B. Cytotoxicity of long and short crocidolite asbestos fibers in vitro and in vivo. Cancer Res. 1990, 50, 5153–5163. [Google Scholar] [PubMed]
- Hearne, G.R.; Kolk, B.; Pollak, H.; van Wyk, J.A.; Gulumian, M. Bulk and surface modifications in detoxified crocidolite. J. Inorg. Biochem. 1993, 50, 145–156. [Google Scholar] [CrossRef]
- Martra, G.; Chiardola, E.; Coluccia, S.; Marchese, L.; Tomatis, M.; Fubini, B. Reactive sites at the surface of crocidolite asbestos. Langmuir 1999, 15, 5742–5752. [Google Scholar] [CrossRef]
- Mossman, B.; Light, W.; Wei, E. Asbestos: Mechanisms of toxicity and carcinogenicity in the respiratory tract. Annu. Rev. Pharmacol. 1983, 23, 595–615. [Google Scholar] [CrossRef] [PubMed]
- Pacella, A.; Fantauzzi, M.; Turci, F.; Cremisini, C.; Montereali, M.R.; Nardi, E.; Atzei, D.; Rossi, A.; Andreozzi, G.B. Dissolution reaction and surface iron speciation of UICC crocidolite in buffered solution at pH 7.4: A combined ICP-OES, XPS and TEM investigation. Geochim. Cosmochim. Acta 2014, 127, 221–232. [Google Scholar] [CrossRef]
- Rihn, B.; Coulais, C.; Kauffer, E.; Bottin, M.C.; Martin, P.; Yvon, F.; Vigneron, J.C.; Binet, S.; Monhoven, N.; Steiblen, G.; et al. Inhaled crocidolite mutagenicity in lung DNA. Environ. Health Perspect. 2000, 108, 341–346. [Google Scholar] [CrossRef] [PubMed]
- Wagner, J.C.; Berry, G.; Timbrell, V. Mesotheliomata in rats after inoculation with asbestos and other materials. Br. J. Cancer 1973, 28, 173–185. [Google Scholar] [CrossRef] [PubMed]
- Wagner, J.C.; Griffiths, D.M.; Hill, R.J. The effect of fiber size on the in vivo activity of UICC crocidolite. Br. J. Cancer 1984, 49, 453–458. [Google Scholar] [CrossRef] [PubMed]
- Werner, A.J.; Hochella, M.F., Jr.; Guthrie, G.D.; Hardy, J.A.; Aust, A.E.; Rimstidt, J.D. Asbestiform riebeckite (crocidolite) dissolution in presence of Fe chelators: Implications for mineral-induced disease. Am. Mineral. 1995, 80, 1093–1103. [Google Scholar] [CrossRef]
- Yao, S.; Della Ventura, G.; Petibois, C. Analytical characterization of cell-asbestos fiber interactions in lung pathogenesis. Anal. Bioanal. Chem. 2010, 397, 2079–2089. [Google Scholar] [CrossRef] [PubMed]
- Zucali, P.A.; Ceresoli, G.L.; De Vincenzo, F.; Simonelli, M.; Lorenzi, E.; Gianoncelli, L.; Santoro, A. Advances in the biology of malignant pleural mesothelioma. Cancer Treat. Rev. 2011, 37, 543–558. [Google Scholar] [CrossRef] [PubMed]
- Stanton, M.F.; Layard, M.; Tegeris, A.; Miller, E.; May, M.; Morgan, E.; Smith, A. Relation of particle dimension to carcinogenicity in amphibole asbestoses and other fibrous minerals. J. Natl. Cancer Inst. 1981, 67, 965–975. [Google Scholar] [CrossRef] [PubMed]
- Occupational Safety and Health Administration (OSHA). Occupational Exposure to Asbestos, Tremolite, Anthophyllite and Actinolite; [Docket No. H-033-d]; 29 CFR Parts 1910 and 1926; Federal Register 1992; OSHA: Washington, DC, USA, 1992; Volume 57, pp. 24310–24331. ISSN USA-1986-R-2725.
- World Health Organization (WHO). Environmental Health Criteria 53—Asbestos and Other Natural Mineral Fibres; International Programme for Chemical Safety: Geneva, Switzerland, 1986; ISBN 92 4 154193 8. [Google Scholar]
- Bernstein, D.; Castranova, V.; Donaldson, K.; Fubini, B.; Hadley, J.; Hesterberg, T.; Kane, A.; Lai, D.; McConnell, E.E.; Muhle, H.; et al. Testing of fibrous particles: Short-term assays and strategies. Report of an ILSI Risk Science Institute Working Group. Inhal. Toxicol. 2005, 17, 497–537. [Google Scholar] [CrossRef] [PubMed]
- Qi, F.; Okimoto, G.; Jube, S.; Napolitano, A.; Pass, H.I.; Laczko, R.; DeMay, R.M.; Khan, G.; Tiirikainen, M.; Rinaudo, C.; et al. Continuous exposure to chrysotile asbestos can cause transformation of human mesothelial cells via HMGB1 and TNF-α signaling. Am. J. Pathol. 2013, 183, 1654–1666. [Google Scholar] [CrossRef] [PubMed]
- Lund, L.G.; Aust, A.E. Iron mobilization from crocidolite asbestos greatly enhances crocidolite-dependent formation of DNA single-strand breaks in ϕ X174 RFI DNA. Carcinogenesis 1992, 13, 637–642. [Google Scholar] [CrossRef] [PubMed]
- Lund, L.G.; Williams, M.G.; Dodson, R.F.; Aust, A.E. Iron associated with asbestos bodies is responsible for the formation of single strand breaks in ϕ X174 RFI DNA. Occup. Environ. Med. 1994, 51, 200–204. [Google Scholar] [CrossRef] [PubMed]
- Prandi, L.; Tomatis, M.; Penazzi, N.; Fubini, B. Iron cycling mechanisms and related modifications at the asbestos surface. Ann. Occup. Hyg. 2002, 46 (suppl. I), 140–143. [Google Scholar] [CrossRef]
- Rinaudo, C.; Gastaldi, D.; Belluso, E.; Capella, S. Application of Raman spectroscopy on asbestos fibre identification. Neues Jahrbuch Fur Mineralogie Monatshefte 2005, 182, 31–36. [Google Scholar] [CrossRef]
- Croce, A.; Allegrina, M.; Rinaudo, C.; Gaudino, G.; Yang, H.; Carbone, M. Numerous iron-rich particles lie on the surface of erionite fibers from Rome (Oregon, USA) and Karlik (Cappadocia, Turkey). Microsc. Microanal. 2015, 21, 1341–1347. [Google Scholar] [CrossRef] [PubMed]
- Hill, R.J.; Edwards, R.E.; Carthew, P. Early changes in the pleural mesothelium following intrapleural inoculation of the mineral fibre erionite and the subsequent development of mesotheliomas. J. Exp. Pathol. 1990, 71, 105–118. [Google Scholar]
- International Agency for Research on Cancer (IARC). Erionite. In IARC Monographs on the Evaluation of Carcinogenic Risks to Humans; IARC: Lyon, France, 2012; Volume 100C, pp. 311–316. ISBN 978 92 832 1320 8. [Google Scholar]
- DiPaolo, J.A.; DeMarinis, A.J.; Doniger, J. Asbestos and benzo(a)pyrene synergism in the transformation of Syrian hamster embryo cells. Pharmacology 1983, 27, 65–73. [Google Scholar] [CrossRef] [PubMed]
- Eastman, A.; Mossman, B.T.; Bresnick, E. Influence of asbestos on the uptake of benzo(a)pyrene and DNA alkylation in hamster tracheal epithelial cells. Cancer Res. 1983, 43, 1251–1255. [Google Scholar] [PubMed]
- Kimizuka, G.; Azuma, M.; Ishibashi, M.; Shinozaki, K.; Hayashi, Y. Co-carcinogenic effect of chrysotile and amosite asbestos with benzo(a) pyrene in the lung of hamsters. Pathol. Int. 1993, 43, 149–153. [Google Scholar] [CrossRef]
- Croce, A.; Musa, M.; Allegrina, M.; Rinaudo, C.; Baris, Y.I.; Dogan, A.U.; Powers, A.; Rivera, Z.; Bertino, P.; Yang, H.; et al. Micro-Raman spectroscopy identifies crocidolite and erionite fibers in tissue sections. J. Raman Spectrosc. 2013, 44, 1440–1445. [Google Scholar] [CrossRef]
- Gualtieri, A.F.; Giacobbe, C.; Rinaudo, C.; Croce, A.; Allegrina, M.; Gaudino, G.; Yang, H.; Carbone, M. Preliminary results of the spectroscopic and structural characterization of mesothelioma inducing crocidolite fibers injected in mice. Period. Mineral. 2013, 82, 299–312. [Google Scholar] [CrossRef]
- Pollastri, S.; Perchiazzi, N.; Lezzerini, M.; Plaisier, J.R.; Cavallo, A.; Dalconi, M.C.; Bursi Gandolfi, N.; Gualtieri, A.F. The crystal structure of mineral fibres 1. Chrysotile. Period. Mineral. 2016, 85, 249–259. [Google Scholar] [CrossRef]
- Beyssac, O.; Goffé, B.; Chopin, C.; Rouzaud, J.N. Raman spectra of carbonaceous material in metasediments: A new geothermometer. J. Metamorph. Geol. 2002, 20, 859–871. [Google Scholar] [CrossRef]
- Beyssac, O.; Goffé, B.; Petitet, J.P.; Froigneux, E.; Moreau, M.; Rouzaud, J.N. On the characterization of disordered and heterogeneous carbonaceous materials by Raman spectroscopy. Spectrochim. Acta Part A 2003, 59, 2267–2276. [Google Scholar] [CrossRef]
- Boccaleri, E.; Arrais, A.; Frache, A.; Gianelli, W.; Fino, P.; Camino, G. Comprehensive spectral and instrumental approaches for the easy monitoring of features and purity of different carbon nanostructures for nanocomposite applications. Mater. Sci. Eng. B Solid 2006, 131, 72–82. [Google Scholar] [CrossRef]
- Bokobza, L.; Bruneel, J.L.; Couzi, M. Raman spectra of Carbon-based materials (from graphite to carbon black) and of some silicone composites. C 2015, 1, 77–94. [Google Scholar] [CrossRef]
- Ferrari, A.C.; Robertson, J. Interpretation of Raman spectra of disordered and amorphous carbon. Phys. Rev. B 2000, 61, 95–107. [Google Scholar] [CrossRef]
- Jehlička, J.; Beny, C. First and second order Raman spectra of natural highly carbonified organic compounds from metamorphic rocks. J. Mol. Struct. 1999, 480–481, 541–545. [Google Scholar] [CrossRef]
- Lespade, P.; Al-Jishi, R.; Dresselhaus, M.S. Model for Raman scattering from incompletely graphitized carbons. Carbon 1982, 20, 427–431. [Google Scholar] [CrossRef]
- Lespade, P.; Marchand, A.; Couzi, M.; Cruege, F. Caracterisation de materiaux carbones par microspectrometrie Raman. Carbon 1984, 22, 375–385. [Google Scholar] [CrossRef]
- Nakamizo, M. Raman spectra of iron-containing glassy carbons. Carbon 1991, 29, 757–761. [Google Scholar] [CrossRef]
- Groppo, C.; Rinaudo, C.; Cairo, S.; Gastaldi, D.; Compagnoni, R. Micro-Raman spectroscopy for a quick and reliable identification of serpentine minerals from ultramafics. Eur. J. Mineral. 2006, 18, 319–329. [Google Scholar] [CrossRef]
- Arrais, A.; Diana, E.; Boccaleri, E. A study on the carbon soot derived from the wood combustion and on the relative alkali-extractable fraction. J. Mater. Sci. 2006, 41, 6035–6045. [Google Scholar] [CrossRef]
- Marshall, C.P.; Love, G.D.; Snape, C.E.; Hill, A.C.; Allwood, A.C.; Walter, M.R.; Van Kranendonk, M.J.; Bowden, S.A.; Sylva, S.P.; Summons, R.E. Structural characterization of kerogen in 3.4 Ga Archaean cherts from the Pilbara Craton, Western Australia. Precambrian Res. 2007, 155, 1–23. [Google Scholar] [CrossRef]
- Tuschel, D. The effect of microscope objectives on the Raman spectra of crystals. Spectroscopy 2017, 32, 14–23. [Google Scholar]
- Lewis, I.R.; Chaffin, N.C.; Gunter, M.E.; Griffiths, P.R. Vibrational spectroscopic studies of asbestos and comparison of suitability for remote analysis. Spectrochim. Acta A 1996, 52, 315–328. [Google Scholar] [CrossRef]
- Bard, D.; Yarwood, J.; Tylee, B. Asbestos fibre identification by Raman microspectrometry. J. Raman Spectrosc. 1997, 28, 803–809. [Google Scholar] [CrossRef]
- Miyano, T.; Beukes, N.J. Mineralogy and petrology of the contact metamorphosed amphibole asbestos-bearing Penge iron formation, Eastern Transvaal, South Africa. J. Petrol. 1997, 38, 651–676. [Google Scholar] [CrossRef]
- Socrates, G. Infrared and Raman Characteristic Group Frequencies, 3rd ed.; John Wiley and Sons: Chichester, NY, USA, 2001; ISBN 0-471-85298-8. [Google Scholar]
- Gibbs, G.W. The organic geochemistry of chrysotile asbestos from the Eastern Township, Quebec. Geochim. Cosmochim. Acta 1971, 35, 485–502. [Google Scholar] [CrossRef]
- Hilborn, J.J.; Thomas, R.S.; Lao, R.C. The organic content of the international reference samples of asbestos. Sci. Total Environ. 1974, 3, 129–140. [Google Scholar] [CrossRef]
- Bowes, D.R.; Farrow, C.M. Major and trace element composition of the UICC standard asbestos samples. Am. J. Ind. Med. 1997, 32, 592–594. [Google Scholar] [CrossRef]
- Commins, B.T.; Gibbs, G.W. Contaminating organic material in asbestos. Br. J. Cancer 1969, 23, 358–362. [Google Scholar] [CrossRef] [PubMed]
- Harington, J.S. Chemical studies of asbestos. Ann. N. Y. Acad. Sci. 1965, 132, 31–47. [Google Scholar] [CrossRef] [PubMed]
Figure 1.
(a) OM image, collected before analysis, of a bundle of crocidolite fibers on which Raman analyses were performed; dark areas are indicated by arrows; (b) Typical Raman spectrum acquired on a bundle of crocidolite fibers, focusing the laser beam onto the fiber surface. The wavenumbers of the observed bands (Table 1) agree with the results described in Rinaudo et al., 2004 [5]. No Raman band was detected in the 4000–1200 cm−1 spectral range; (c) Raman spectrum recorded addressing the laser beam onto a dark area of the bundle surface. In addition to the bands produced by crocidolite and appearing in the 1200–100 cm−1 spectral range, bands at 1333, 1600, 2658, and 2916 cm−1 were detected: these bands can be ascribed to carbonaceous phases; (d) Fitting process of the band at 1600 cm−1 in Figure 1c: two components, at 1596 and 1624 cm−1, were identified; (e) Magnification of the 3700–3550 cm−1 spectral range, where crocidolite OH− vibrational modes lie.

Figure 2.
(a) OM image, collected before analysis, of a bundle of amosite fibers on which Raman analyses were carried out; dark area is indicated by arrow; (b) Raman spectrum of amosite fiber in the spectral region where the lattice vibrational modes lie. The wavenumbers of the observed bands (Table 1) agree with the results described in Rinaudo et al., 2004 [5]; (c) Raman spectrum recorded addressing the laser beam onto a dark area of the bundle surface. In addition to the bands produced by amosite in the 1200–100 cm−1 spectral range, bands at 1332, 1582, 1613, 2663, 2914, and 3235 cm−1 were detected: these spectrum features indicate a carbonaceous phase more ordered than on crocidolite samples; (d) Magnification of the 3700–3550 cm−1 spectral range, where amosite OH− vibrational modes lie.

Figure 3.
(a) OM image, collected before analysis, of a bundle of chrysotile fibers on which Raman spectra were recorded; dark areas are indicated by arrows; (b) Raman spectrum obtained addressing the laser beam onto a dark area of the bundle surface. Bands < 1000 cm−1 are ascribed to chrysotile crystal lattice, while the 3000 cm−1 < bands < 1000 cm−1 are produced by the carbonaceous phases (Table 1); (c) Magnification of the 3750–3650 cm−1 spectral range, where the chrysotile OH− vibrational modes lie.


Table 1.
Comparison of the Raman spectra obtained in this work and those reported in Rinaudo et al., 2003, and Rinaudo et al., 2004 [5,6].
| Mineral Phase | Crocidolite This Work | Crocidolite Rinaudo et al., 2004 [5] | Amosite This Work | Amosite Rinaudo et al., 2004 [5] | Chrysotile This Work | Chrysotile Rinaudo et al., 2003 [6] |
|---|---|---|---|---|---|---|
| Mineral Raman Bands (cm−1) | 109 | 157 | 155 | 233 | 231 | |
| 148 | 183 | 182 | 349 | 345 | ||
| 166 | 162 | 216 | 216 | 392 | 389 | |
| 199 | 195 | 252 | 626 | 620 | ||
| 252 | 246 | 289 | 694 | 692 | ||
| 275 | 272 | 307 | 1105 | |||
| 302 | 300 | 349 | 348 | |||
| 337 | 331 | 368 | 368 | |||
| 360 | 400 | 400 | ||||
| 378 | 374 | 423 | 423 | |||
| 436 | 428 | 508 | 507 | |||
| 470 | 470 | 528 | 528 | |||
| 510 | 506 | 660 | 659 | |||
| 544 | 537 | 904 | 904 | |||
| 581 | 577 | 970 | 968 | |||
| 666 | 664 | 1021 | 1020 | |||
| 740 | 733 | 1093 | ||||
| 779 | 771 | |||||
| 892 | 889 | |||||
| 973 | 967 | |||||
| 1036 | 1030 | |||||
| 1087 | 1082 | |||||
| Carbonaceous phase Raman bands (cm−1) | n. a. * | n. a. | 1120 (C–O–C) | n. a. | ||
| 1333 (D) | 1332 (D) | 1335 (D) | ||||
| 1455 (C–H) | ||||||
| 1596 (G) | 1582 (G) | |||||
| 1624 (D′) | 1613 (D′) | 1605 (G) | ||||
| 2658 (G′) | 2663 (G′) | 2662 (G′) | ||||
| 2879 (C–H) | ||||||
| 2916 (C–H) | 2914 (C–H) | 2932 (C–H) | ||||
| 3235 (2D′) | ||||||
| OH− mineral Raman bands (cm−1) | 3617 | n. a. | 3616 | n. a. | 3668 | n. a. |
| 3633 | 3635 | 3670 | ||||
| 3650 | ||||||
* n. a. = not available.
© 2018 by the authors. Licensee MDPI, Basel, Switzerland. This article is an open access article distributed under the terms and conditions of the Creative Commons Attribution (CC BY) license (http://creativecommons.org/licenses/by/4.0/).
Share and Cite
MDPI and ACS Style
Croce, A.; Arrais, A.; Rinaudo, C. Raman Micro-Spectroscopy Identifies Carbonaceous Particles Lying on the Surface of Crocidolite, Amosite, and Chrysotile Fibers. Minerals 2018, 8, 249. https://doi.org/10.3390/min8060249
AMA Style
Croce A, Arrais A, Rinaudo C. Raman Micro-Spectroscopy Identifies Carbonaceous Particles Lying on the Surface of Crocidolite, Amosite, and Chrysotile Fibers. Minerals. 2018; 8(6):249. https://doi.org/10.3390/min8060249
Chicago/Turabian StyleCroce, Alessandro, Aldo Arrais, and Caterina Rinaudo. 2018. "Raman Micro-Spectroscopy Identifies Carbonaceous Particles Lying on the Surface of Crocidolite, Amosite, and Chrysotile Fibers" Minerals 8, no. 6: 249. https://doi.org/10.3390/min8060249
Note that from the first issue of 2016, this journal uses article numbers instead of page numbers. See further details here.