1. Introduction
Chlorites are a group of minerals that form in geological environments predominantly during either low-grade metamorphism or hydrothermal alteration. In these systems, chlorite occurs as a secondary mineral that grows during solid state reactions or precipitates directly from solution [
1]. Geological conditions, such as oxygen fugacity (
fO
2), acidity (pH), bulk rock composition, fluid composition and temperature can alter the chemical composition of chlorite [
2], which can then be used to estimate its formation history.
Near-infrared (NIR) spectroscopy can be used to identify hydrated minerals which have absorption features in the spectral range of 800–2500 nm that relate to vibrational bonding of hydroxyl and water [
3]. As a hydrated mineral group, chlorites have specific spectral signatures, which makes it possible to use NIR spectroscopy to identify its presence in rocks. In previous studies it was found that the spectrum of chlorite is sensitive to variation in the magnesium-to-iron ratio (magnesium number: MgO/MgO + FeO), for which the absorption wavelength decreases with increasing magnesium number [
4,
5,
6]. The exchange reaction of iron and magnesium in the octahedral sheets is a common substitution reaction together with di-tri substitution and the Tschermak substitution [
1].
Mapping the abundance of chlorites, as well as their composition, has proven useful for the exploration of mineral deposits [
5,
6,
7], in planetary science [
8,
9], and in archeology [
10]. The use of spectral characteristics in hydrothermal alteration zones provides valuable information for mapping such zones [
11,
12] and fluid pathways [
13] in the Panorama district of Western Australia [
14]. A spectral study on metamorphic rocks containing chlorite was performed by [
15]. This study showed that the chlorite specific, Mg-OH absorption feature, near 2350 nm, can be used to distinguish rocks formed under greenschist facies versus amphibolite facies conditions.
In this study, we assess the applicability of NIR spectroscopy to determine differences between chlorites formed during either low-grade metamorphism or by hydrothermal alteration. Chlorites were measured in a single lithology to avoid the influence of differences in bulk chemical composition. Basalts were chosen because of the ready availability of a large number of samples containing absorption features specific to chlorite. Samples were investigated from the Pilbara Craton, Western Australia, a region containing abundant chlorite in multiple greenstone belts positioned between granitic domes. Variations in metamorphic grade and the degree of hydrothermal alteration have led to variable degrees of chlorite formation [
16,
17]. The two different formation pathways for chlorite are expected to have led to different chemical compositions, which should be visible in the NIR data [
5,
6,
15]. We validate the NIR spectroscopy results against previously published bulk rock data [
16,
17] for the same rocks.
2. Materials and Methods
2.1. Samples
Samples were investigated from the Pilbara Craton, Western Australia, a region formed by a combination of vertical and horizontal tectonic processes [
18]. Despite its age, the craton has experienced little deformation and stayed relatively stable for a long time [
19]. The craton can be divided into multiple terranes, basins, granitic complexes, and greenstone belts [
20]. The rocks used in this study were taken from greenstone belts that have been metamorphosed from lower greenschist up to amphibolite facies [
16]. The hydrothermally altered rocks are from a volcanogenic massive-sulfide (VMS) deposit in the Panorama district in the Soanesville greenstone belt. Alteration processes involving seawater and heat from the granitic intrusion modified the rocks and formed the VMS deposits [
17].
The rocks used in the metamorphic dataset of this study were originally collected by [
16] as transects in seven different greenstone belts in the Pilbara Craton. In total 243 samples of metamorphic rocks were sampled from 19 different transects. For the hydrothermally altered dataset, we used samples collected by Brauhart [
21]. They include 445 outcrop samples from the Panorama district in the Soanesville greenstone belt.
2.2. Geochemical Methods
Bulk rock geochemical data, chlorite compositions as well as spectral measurements are taken from previously published studies [
13,
15,
16,
21,
22]. The hydrothermally altered dataset contains bulk rock major and trace element measurements determined by X-ray fluorescence (XRF) [
22], chlorite compositions measured by electron microprobe microanalysis (EMP) [
21], and spectral analysis [
13]. In addition to the elemental and spectral measurements, the hydrothermally altered dataset contains temperature estimates for a selection of the rocks [
23]. The metamorphic dataset contains measurement of the bulk rock composition (XRF) [
16] and spectral analysis [
15].
Since the metamorphic dataset lacked comprehensive chlorite compositional data, a selection of 13 representative rocks were measured using a JEOL JXA-8530F HyperProbe (JEOL, Akishima, Tokyo, Japan) equipped with a Field Emission gun, at a beam current of 15 keV at the Faculty of Geosciences, Utrecht University. The selection contains two samples per lithology, that all contained chlorite as dominant mineral in the spectrum. One ultra-mafic sample, metamorphosed in the amphibolite-facies, was included to test the influence of amphibole minerals on the spectrum and bulk rock composition. The number of measurements per sample varies from 4 to 53, without preference for specific chlorite minerals in thin section. The variation in measurements per samples can be explained by the differences in chlorite content per sample as well as variations across mineral transects. These transect measurements measure multiple points from the core to the rim of the chlorite mineral, which would make it possible to study element variation inside individual chlorite minerals.
2.3. Data Analysis
Major elements were used to create alteration boxplots to test if the assumptions for making one altered and one non-altered dataset were correct. The formulas of the indices on both the axes of the alteration boxplots can be found below [
24]:
Relative contributions of the alkali elements (Na2O + K2O), iron (FeO + Fe2O3), and magnesium (MgO) were visualized in an alkali-iron-magnesium (AFM) diagram. Depending on the magma series, the different volcanic lithologies will plot as separate clusters. Volcanic rocks crystallized according to a tholeiitic magma series will plot the in the magnesium corner for the ultra-mafic rocks. More felsic rocks follow a trend towards the iron corner of the diagram and end at the alkali corner for the most felsic rocks. The calc-alkaline magma series shows a similar trend but has a lower contribution of iron.
The magnesium number, used for several plots, was calculated from the weight-percentages of magnesium- and iron-oxides: MgO/(MgO + FeO). This magnesium number was calculated for the chlorite minerals from the EMP-measurements, and for the bulk rock composition from the XRF-measurements.
Plots of the immobile element ratios, Zr/TiO
2 and Nb/Y, were used to test if both groups of basalts are lithologically similar. Because these elements are generally immobile it is possible to compare the original composition of similar lithologies from hydrothermally altered and metamorphic rocks [
25].
The concentration of major elements as measured by the electron microprobe were converted to cation abundances, using the method described by Foster [
26]. All iron was assumed to be ferrous, occupying octahedral sites. The cation abundances were used to define the end-members of chlorite according to the chemical formula described in the International Mineralogical Association Commission on Minerals and Mineral Names [
27]. The EMP-measurements were compared with the bulk rock composition as measured by XRF to test for correlation between mineral and whole rock compositions.
2.4. Reflectance Spectroscopy
Each rock from the hydrothermally altered dataset was measured three times using a portable infrared mineral analyzer (PIMA, Arvada, CO, USA) in a wavelength range from 1300–2500 nm [
13]. For the metamorphic dataset, an Analytical Spectral Devices (ASD, Cambridge, UK) FieldSpec Pro spectrometer was used, measuring in the range from 350–2500 nm, with a spectral resolution of 3–10 nm, with three repetitions. During processing, the spectra were splice-corrected by the ViewSpecPro software before conversion to ASCII files [
15].
The characteristics of specific absorption features in chlorite were calculated after a continuum removal subtraction using the Hyperspectral Python open access software HypPy3 [
28]. The relative abundances of minerals in each spectrum were determined by comparing absorption depths of the characteristic absorption features of the minerals, chlorite (2350 nm), sericite (2200 nm) and amphibole (2450 nm).
3. Results
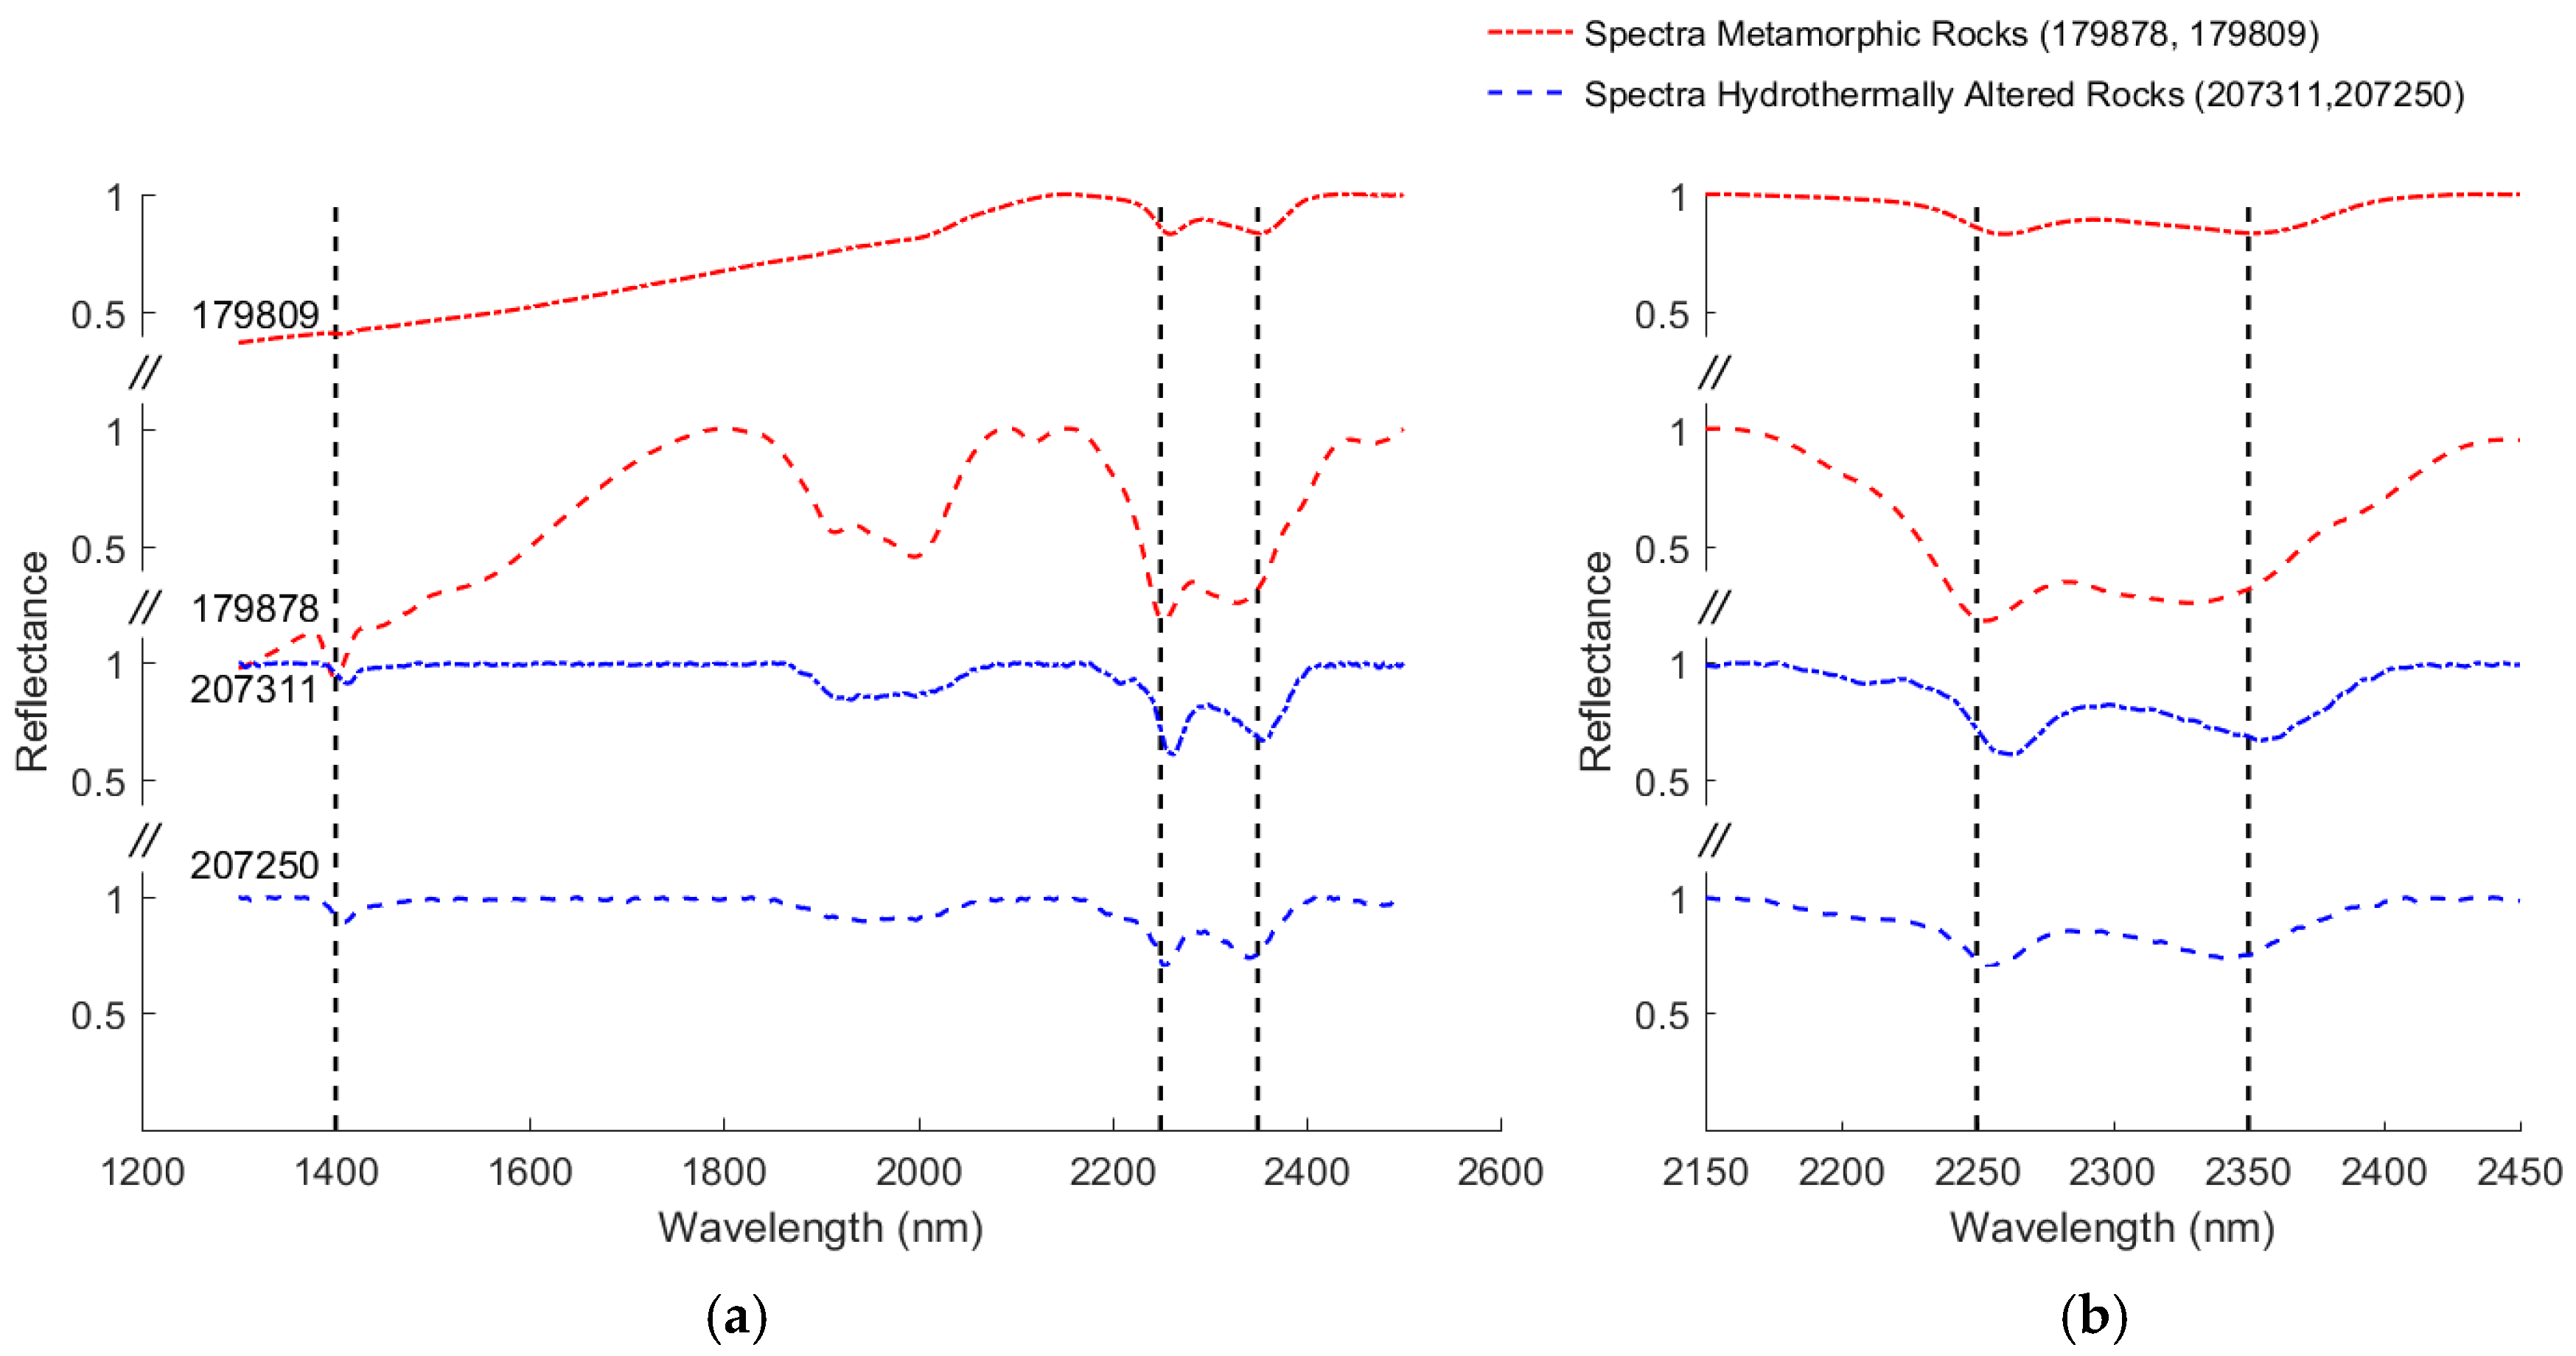
Two examples of chlorite reflection spectra were selected from both datasets based on the highest and lowest magnesium number, as measured by [
11,
15], and are shown in
Figure 1. The vertical lines show the characteristic absorption features of chlorite, including: 1400 nm OH, 2250 nm Fe-OH, and 2350 nm Mg-OH absorption. Comparing these chlorite reflection spectra in
Figure 1, shows some shifts in the absorption depth and wavelength.
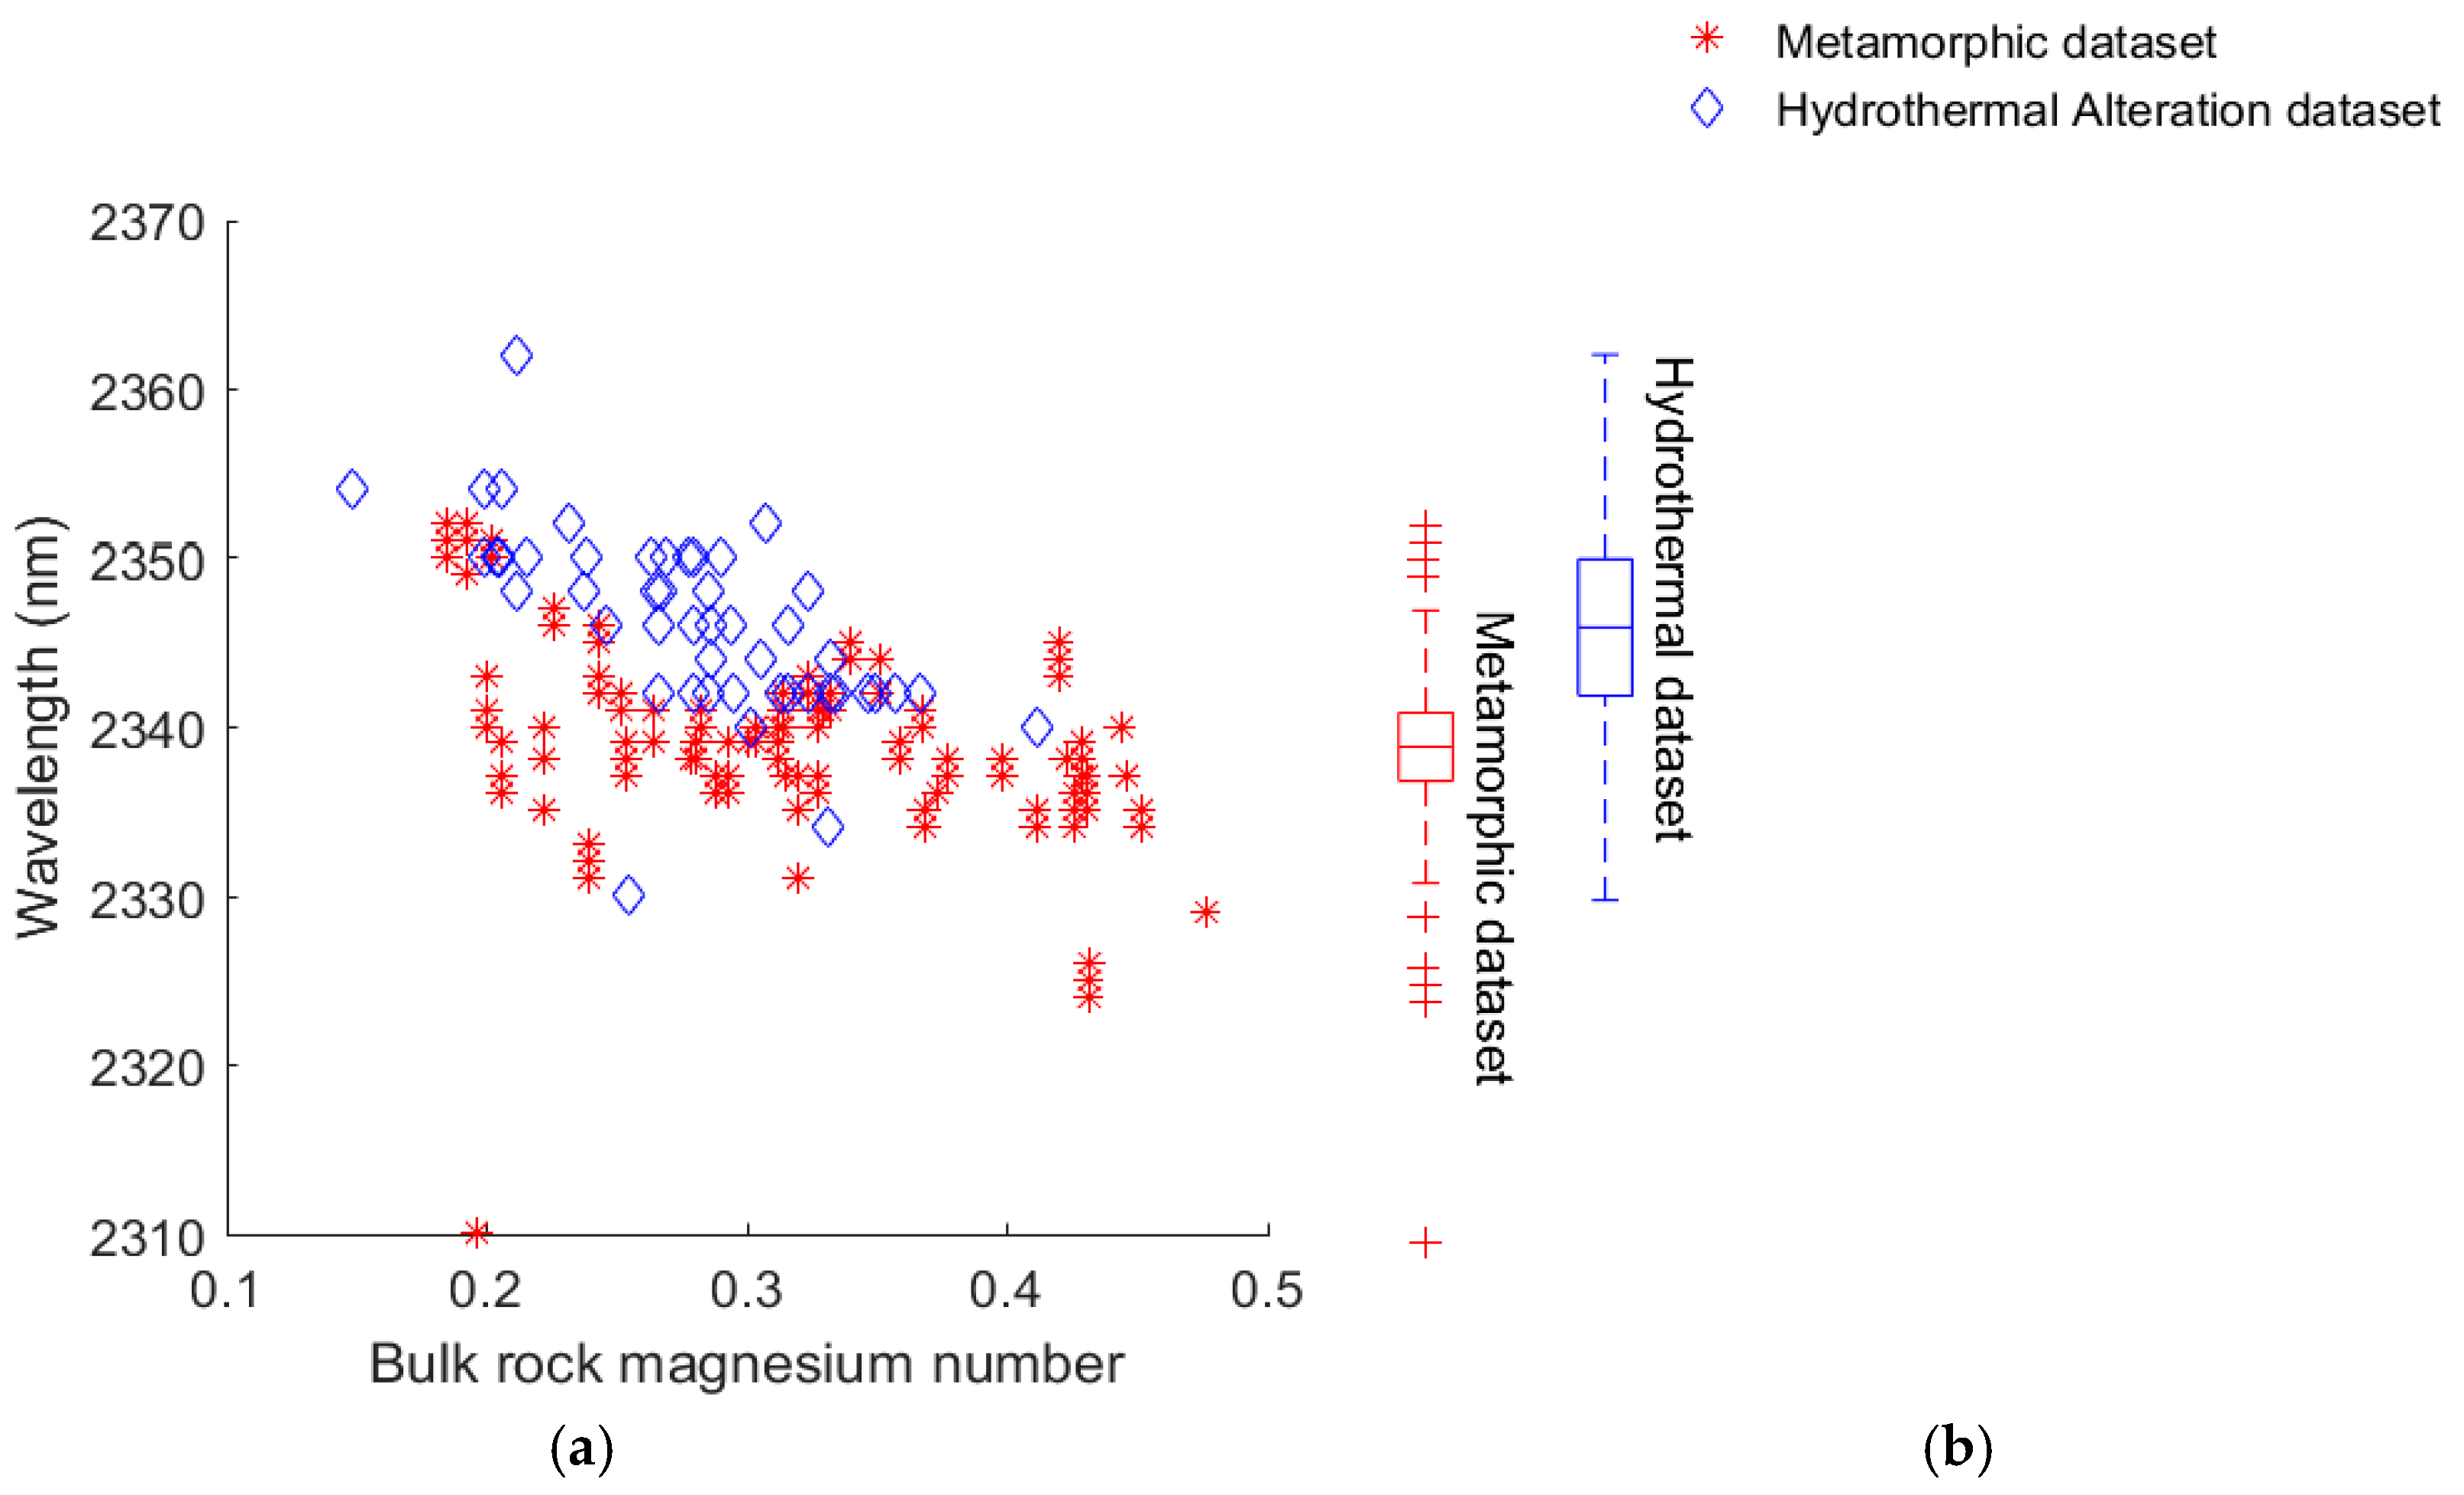
To test these variations in spectral features, all reflection spectra from basaltic rocks containing chlorite have been compared. The results show that there is a significant difference,
p < 0.001 for the Wilcoxon signed rank test, between the Mg-OH absorption wavelength near 2350 nm of the metamorphic rocks and the hydrothermally altered rocks.
Figure 2 shows a scatter plot including a corresponding boxplot in which the spectral features are compared with the magnesium number calculated from the bulk rock composition.
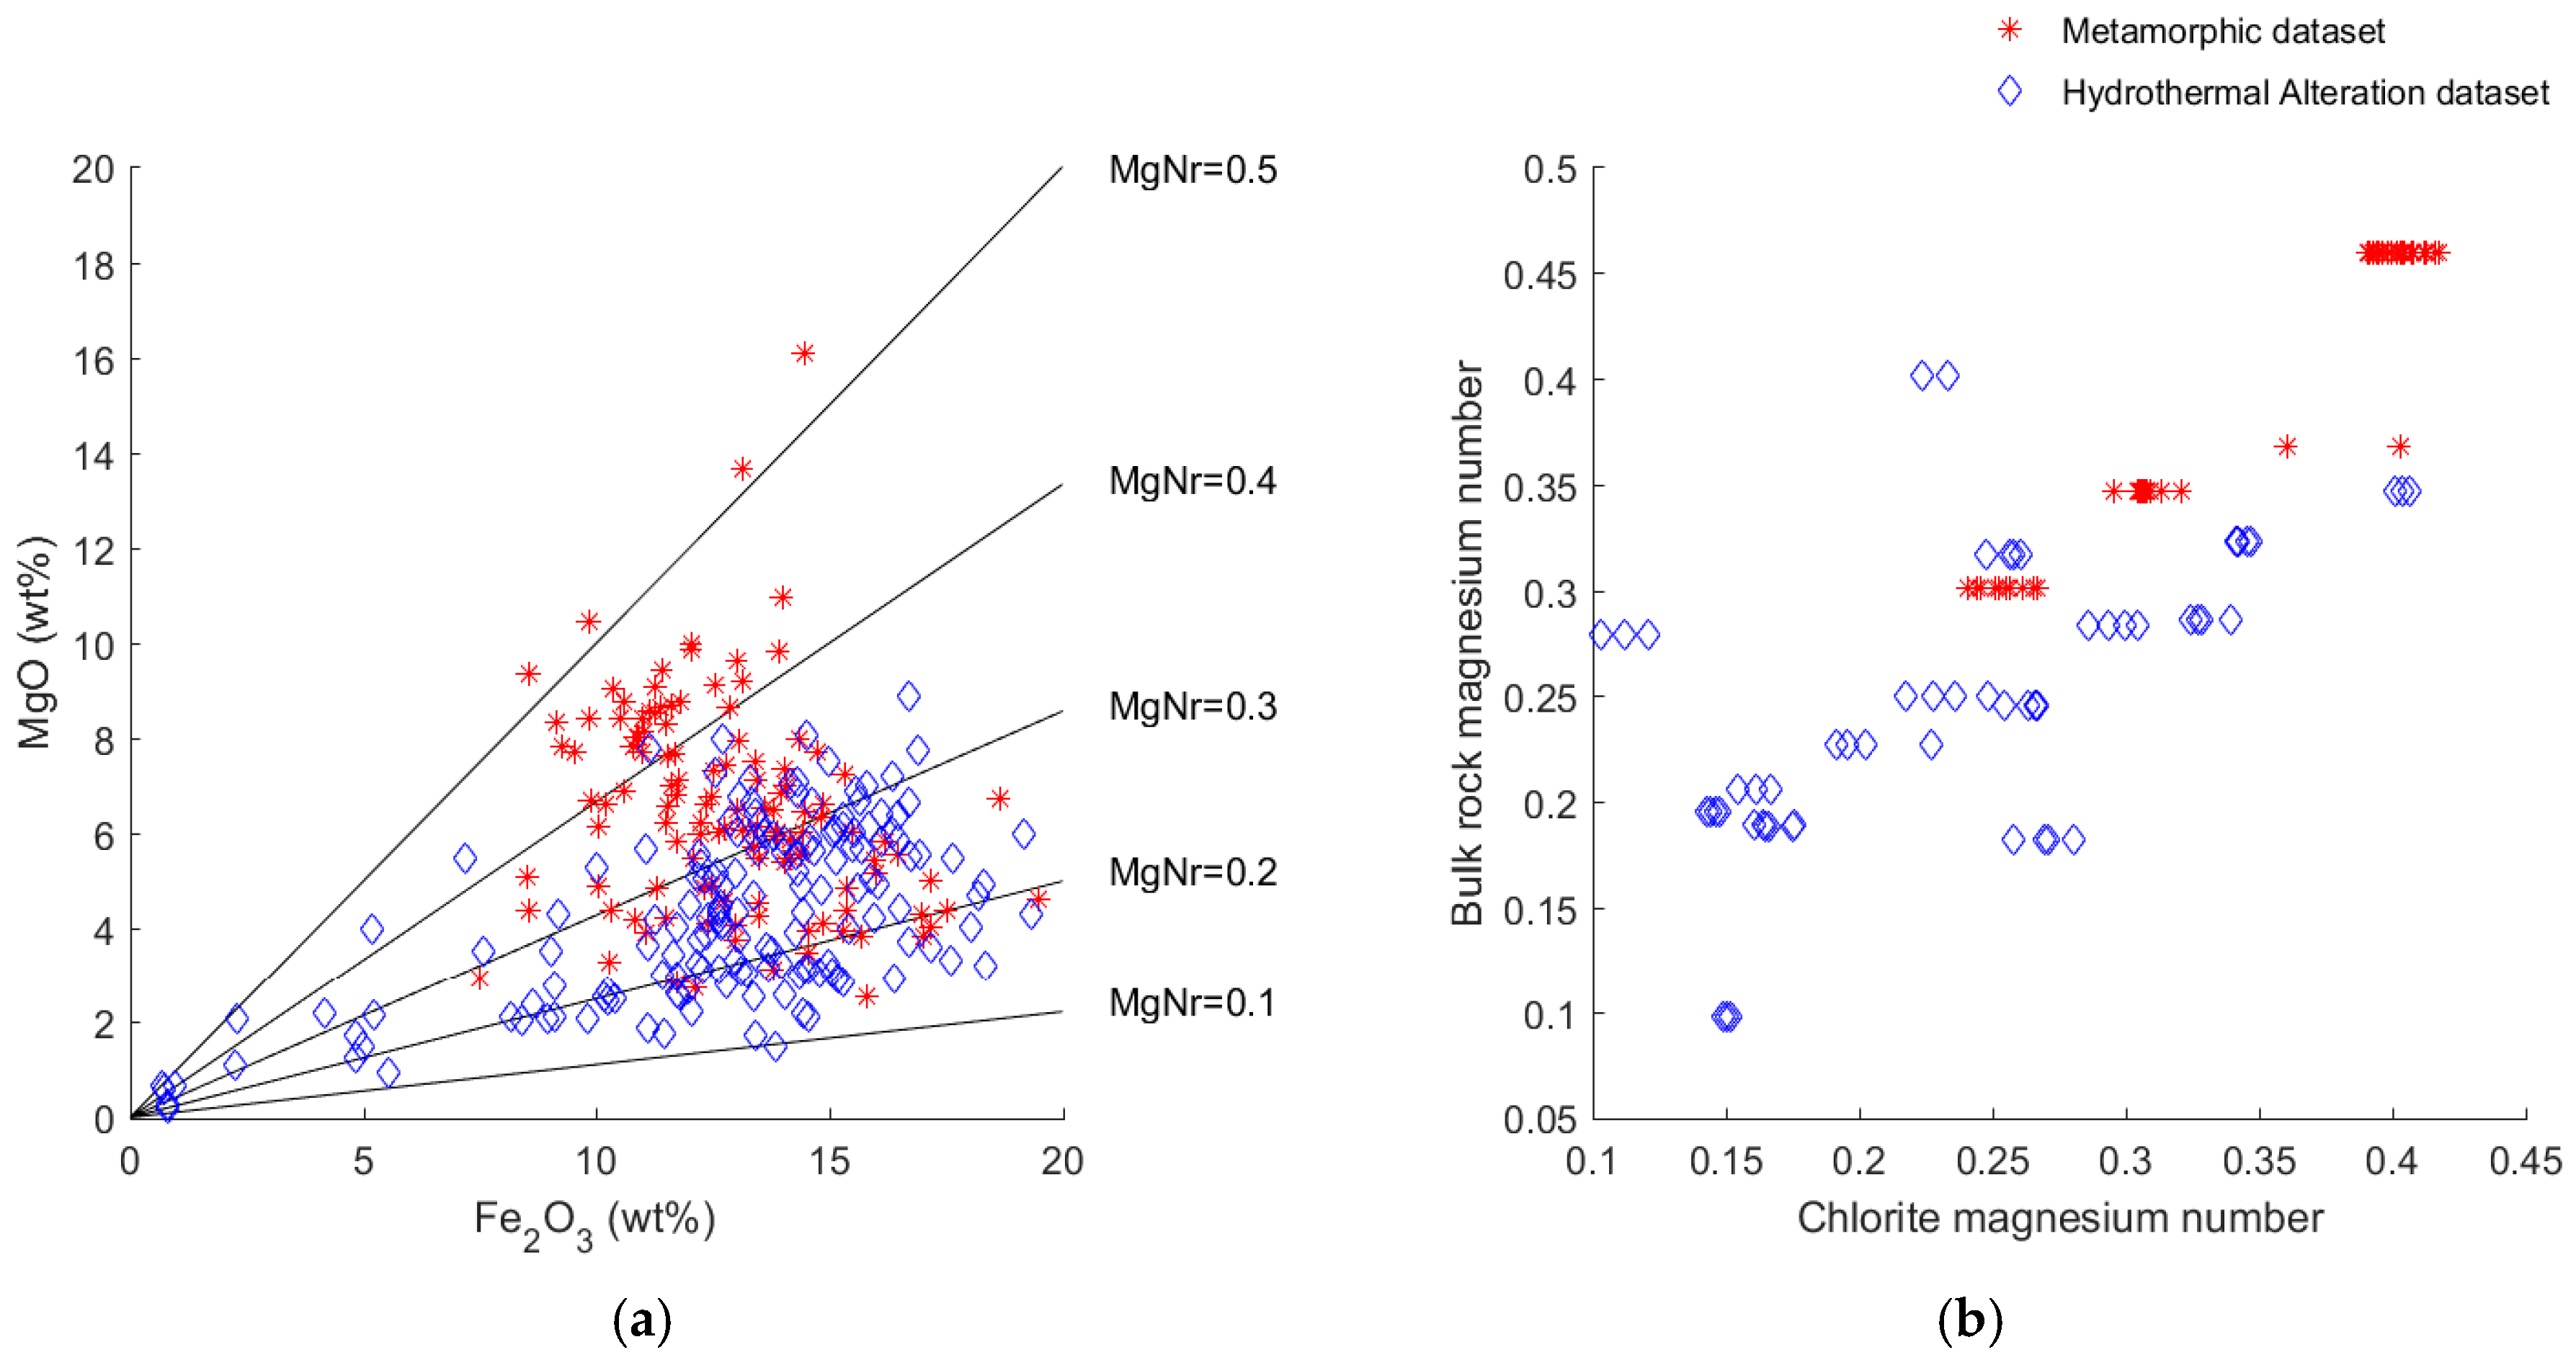
To gain a better understanding of the absolute concentration of magnesium and iron, these elements are plotted in
Figure 3a. It can be seen that the variation in magnesium content is greater for the metamorphic dataset, while the hydrothermal dataset shows a greater variation for iron. These differences must be taken into account when comparing the magnesium numbers of both datasets.
When the bulk rock magnesium number is compared with the magnesium number calculated for the chlorite minerals in the same sample, a linear trend can be observed (
Figure 3b). Two theories can explain this observation. First, chlorite is the only ferro-magnesium mineral in the rock. Second, chlorite is a secondary mineral and has overgrown prior ferro-magnesium minerals, and therefore has a similar magnesium to iron ratio as that for the initial bulk rock composition.
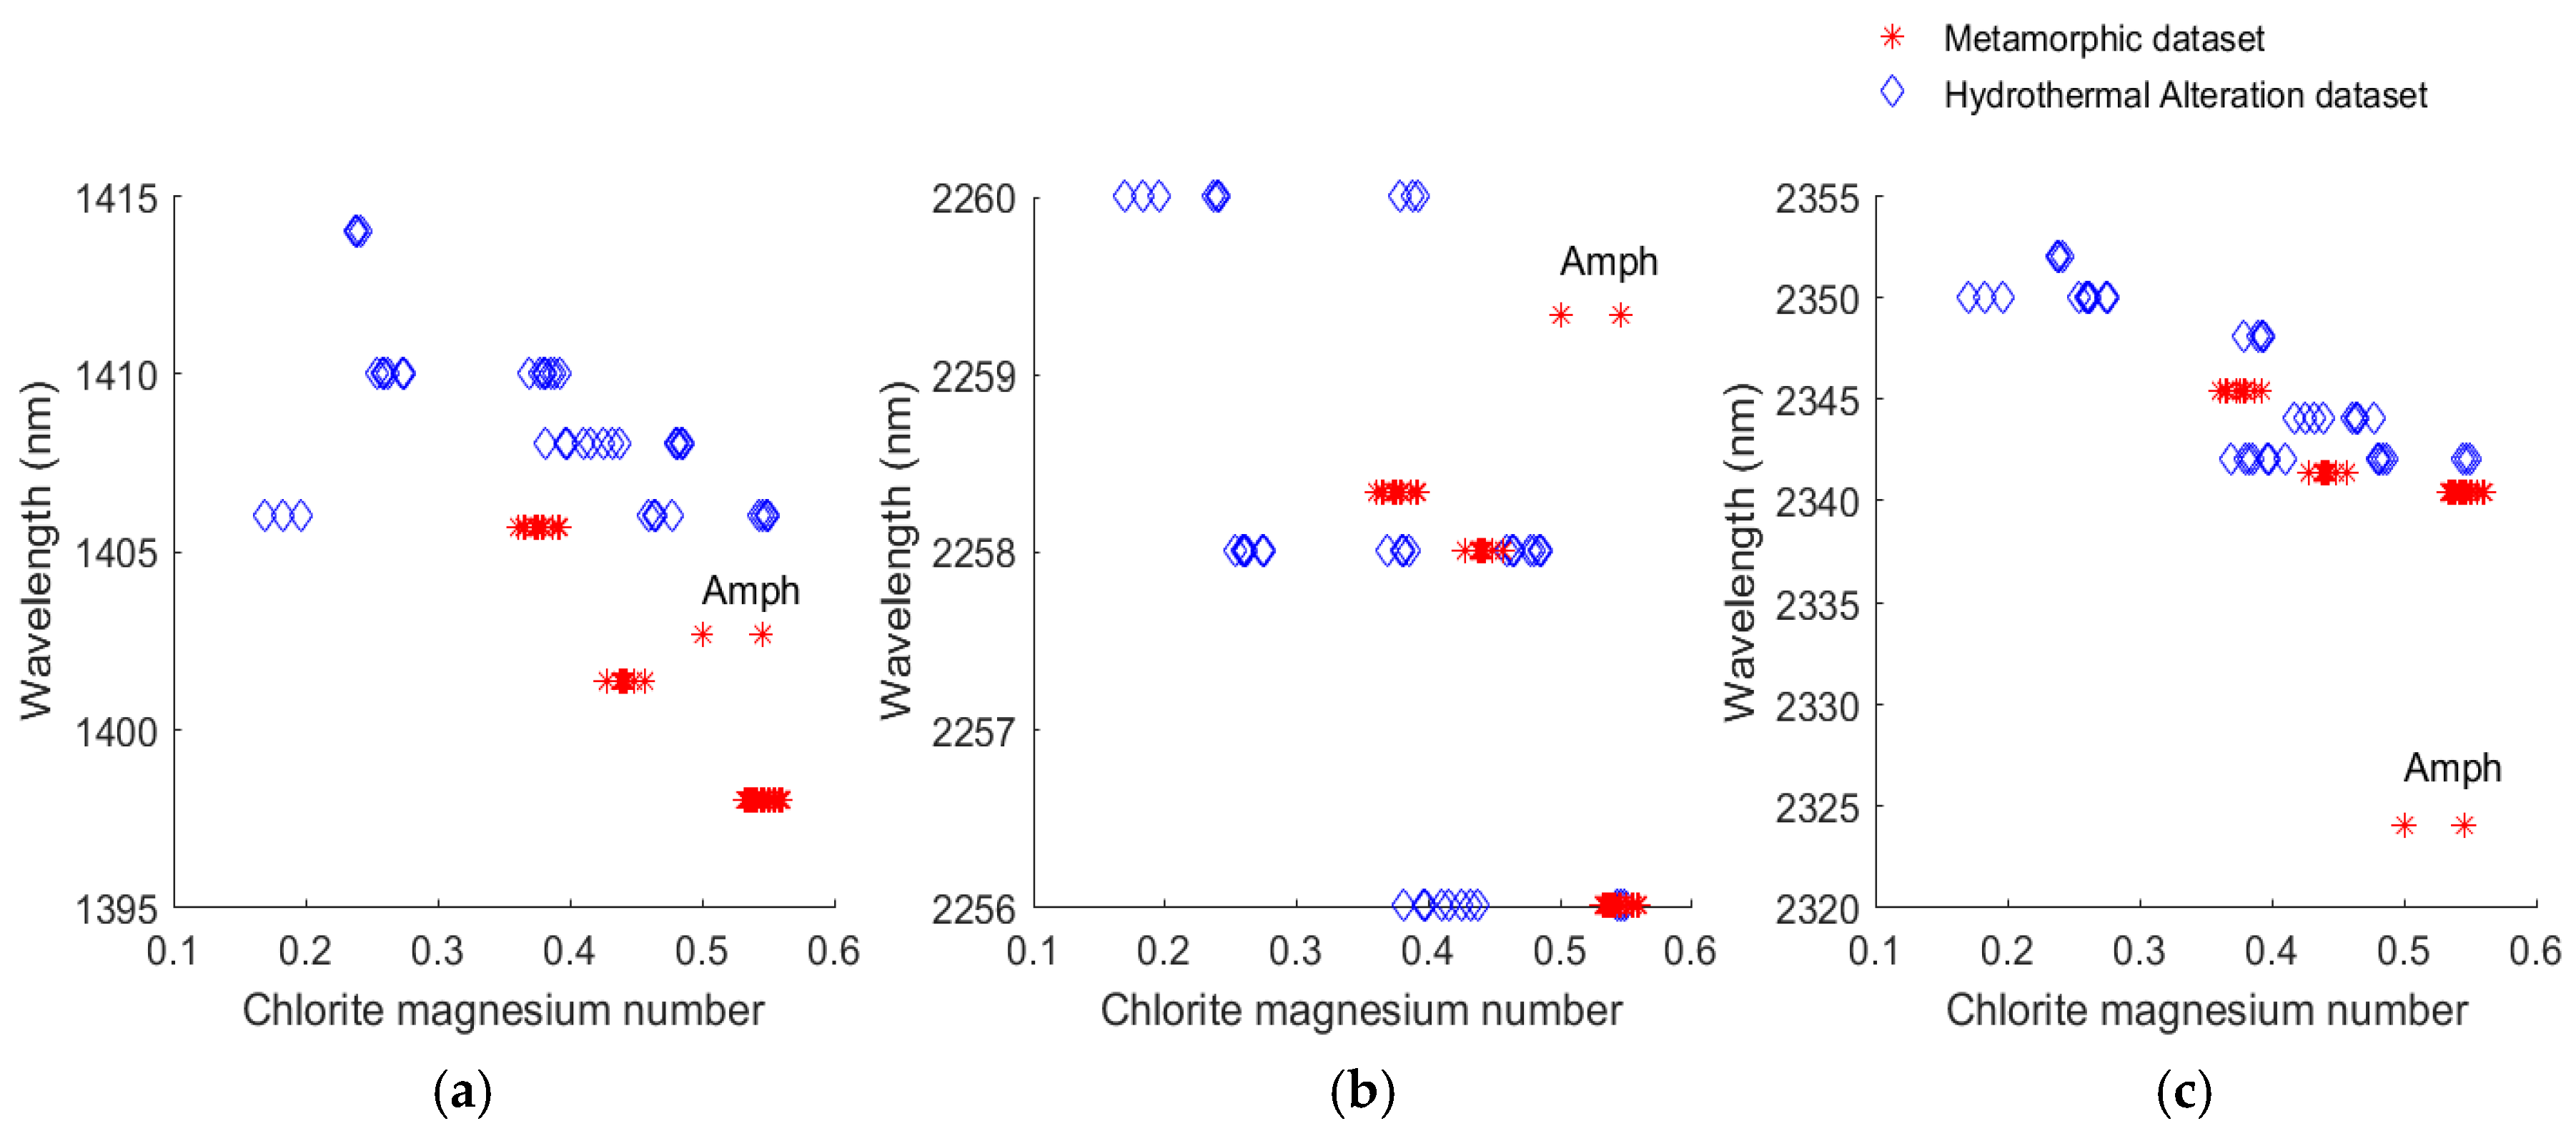
The results of the comparison of chlorite’s spectral features and its mineral composition is shown in
Figure 4. It was hypothesized that a similar trend to the one from
Figure 2, with a decrease in absorption wavelength with an increase of the magnesium number, would be observed, because the magnesium number of chlorite relates to the bulk rock magnesium number. This hypothesis is supported by the results from
Figure 4. The Mg-OH absorption feature near 2350 nm shows the highest correlation, that is why it is used for the other plots in this study. One of the samples selected for the EMP measurements mainly contains amphibole minerals, and is marked with the text “Amph” in
Figure 4. This sample will be discussed later in this section.
For the calculations of the magnesium number in
Figure 4, it was assumed that the octahedral sites of chlorite are occupied by either magnesium or iron. However, there are 10 different end-members of the chlorite group recognized as named minerals in the official classification published by the International Mineralogical Association Commission on Minerals and Mineral Names [
27]. Chamosite and clinochlore, respectively, are the iron and magnesium end-members [
1].
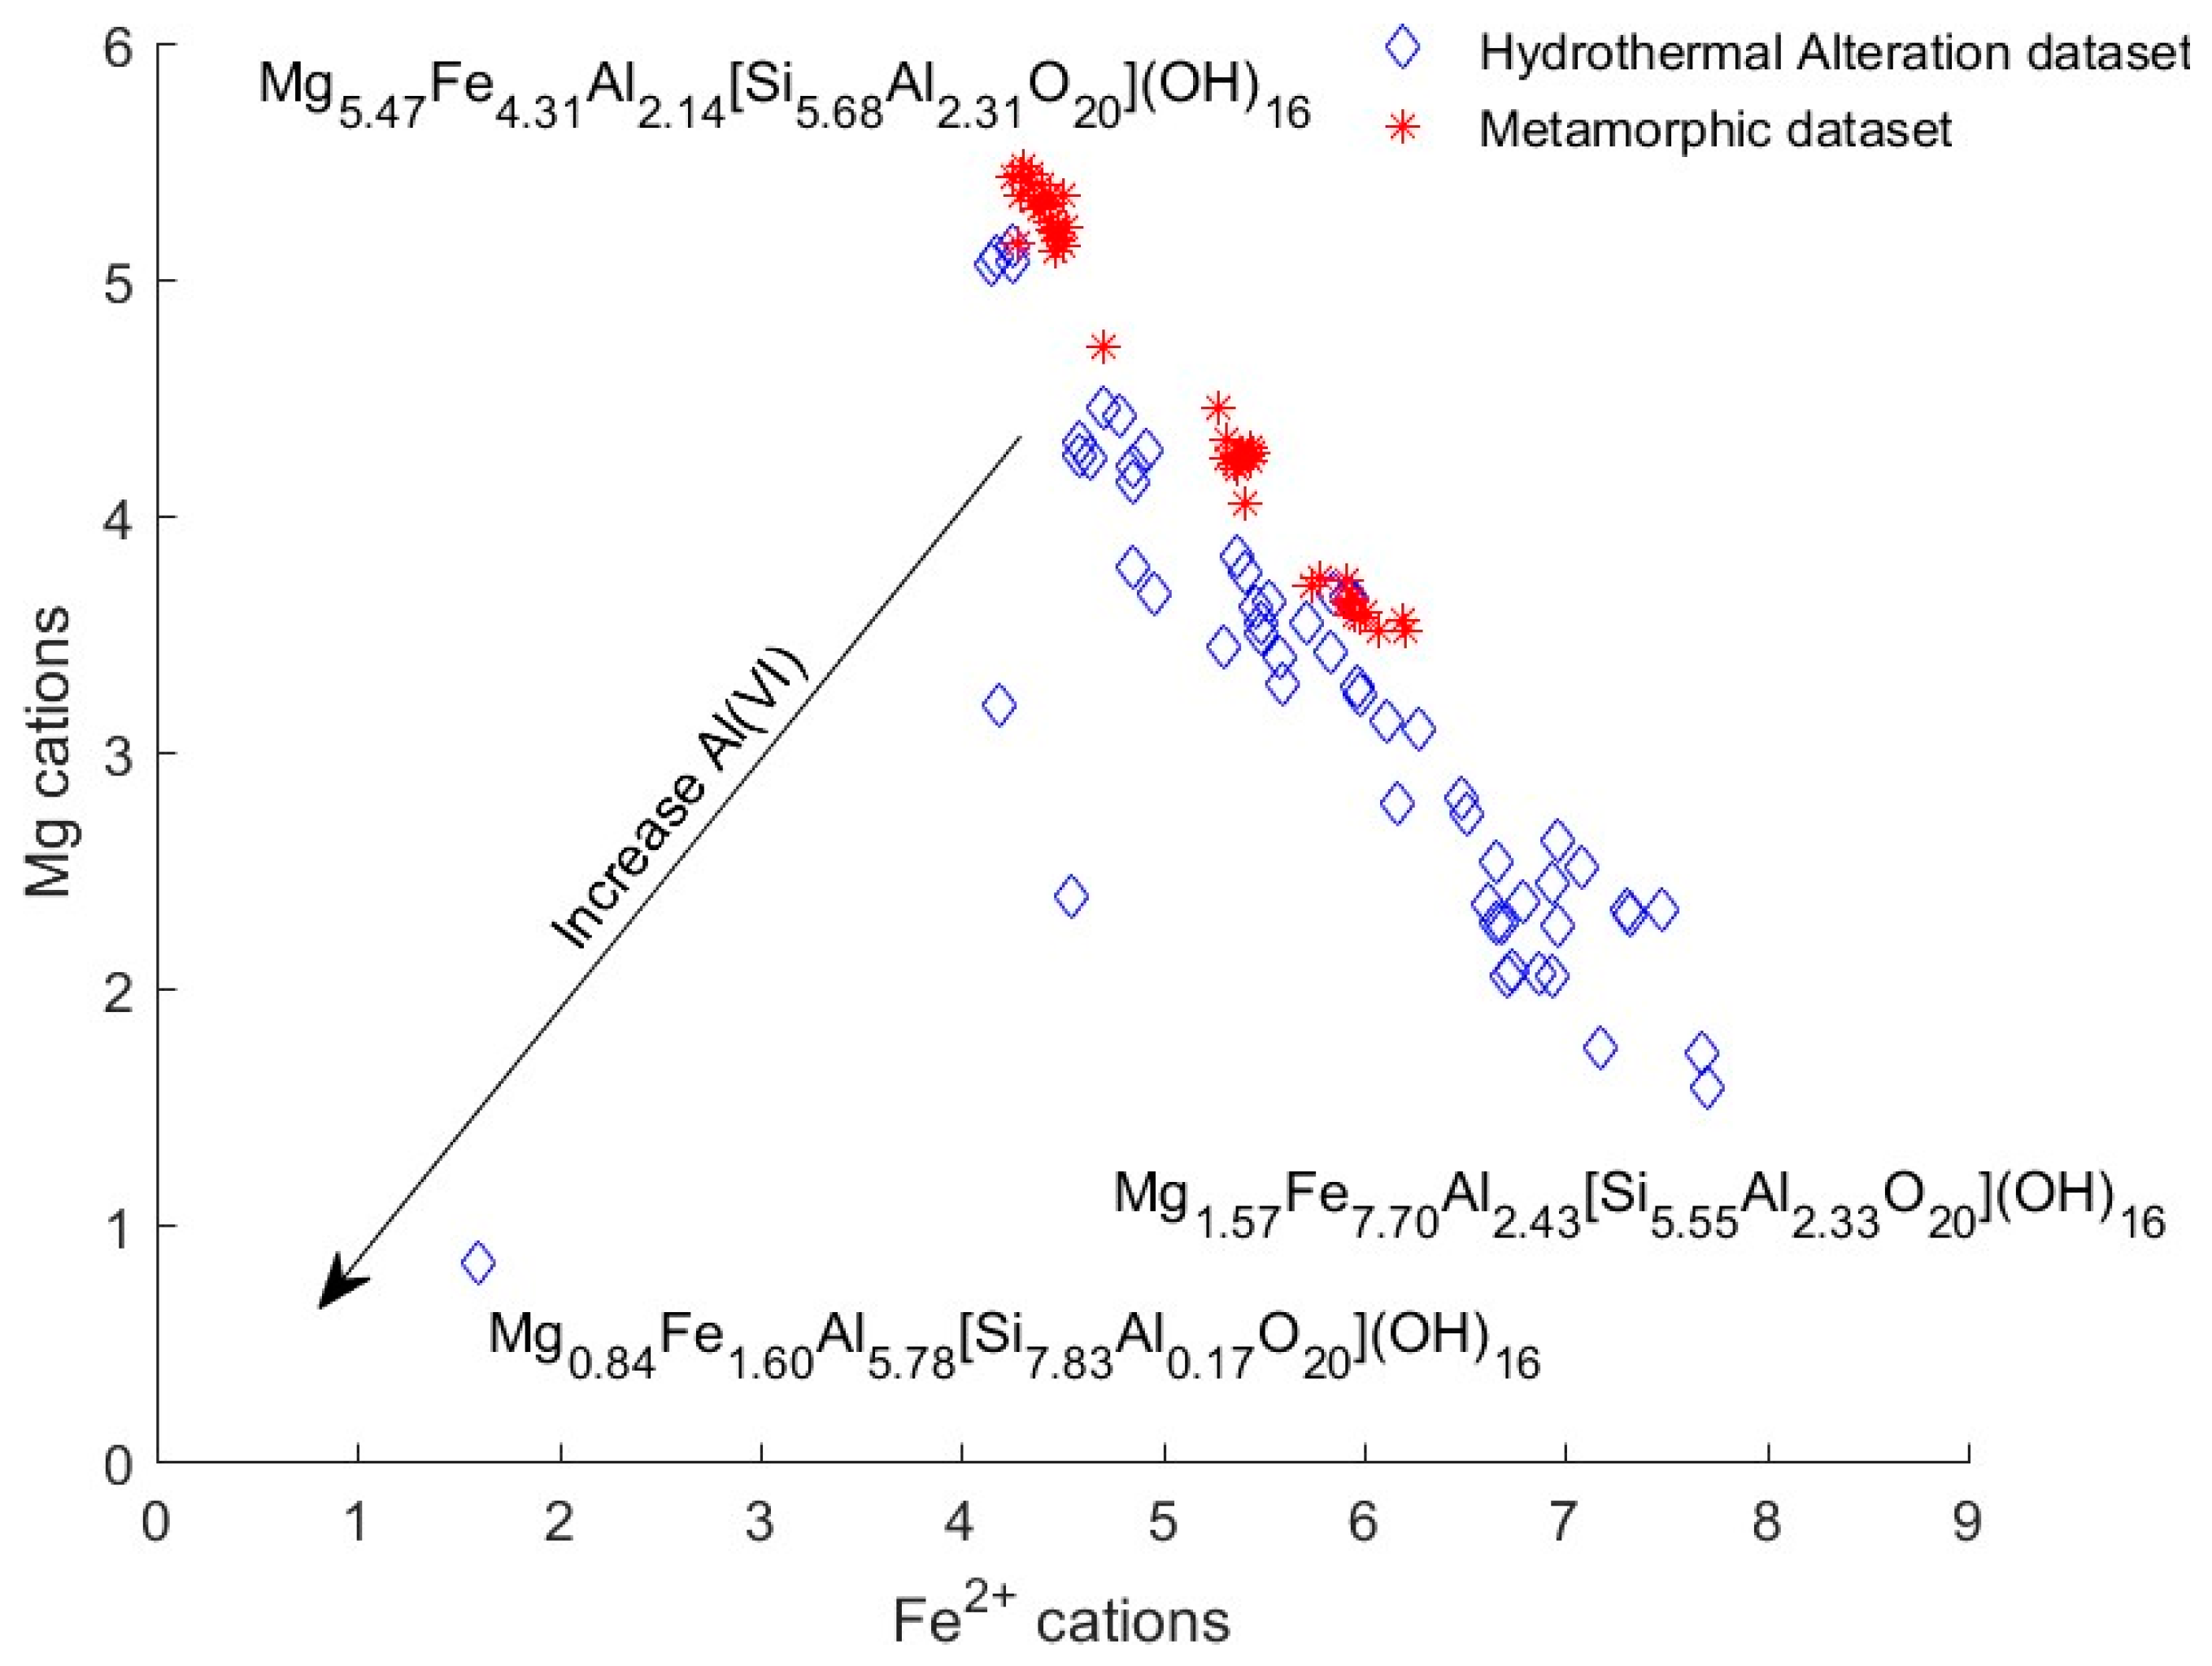
Figure 5 shows the relation between the Fe and Mg cations in chlorite. Both groups of data show a linear correlation between the magnesium and iron cation concentration, where the hydrothermal altered rocks plot closer to the origin than the metamorphic rocks. According to published data, which is supported by our measurements, this is because these hydrothermal altered chlorites have more octahedral aluminum compared to the metamorphic chlorites [
1]. Cation calculations show that iron and magnesium are the most dominant elements in the octahedral sheet which results in vibrations which can be observed in the NIR spectrum.
The plots shown as
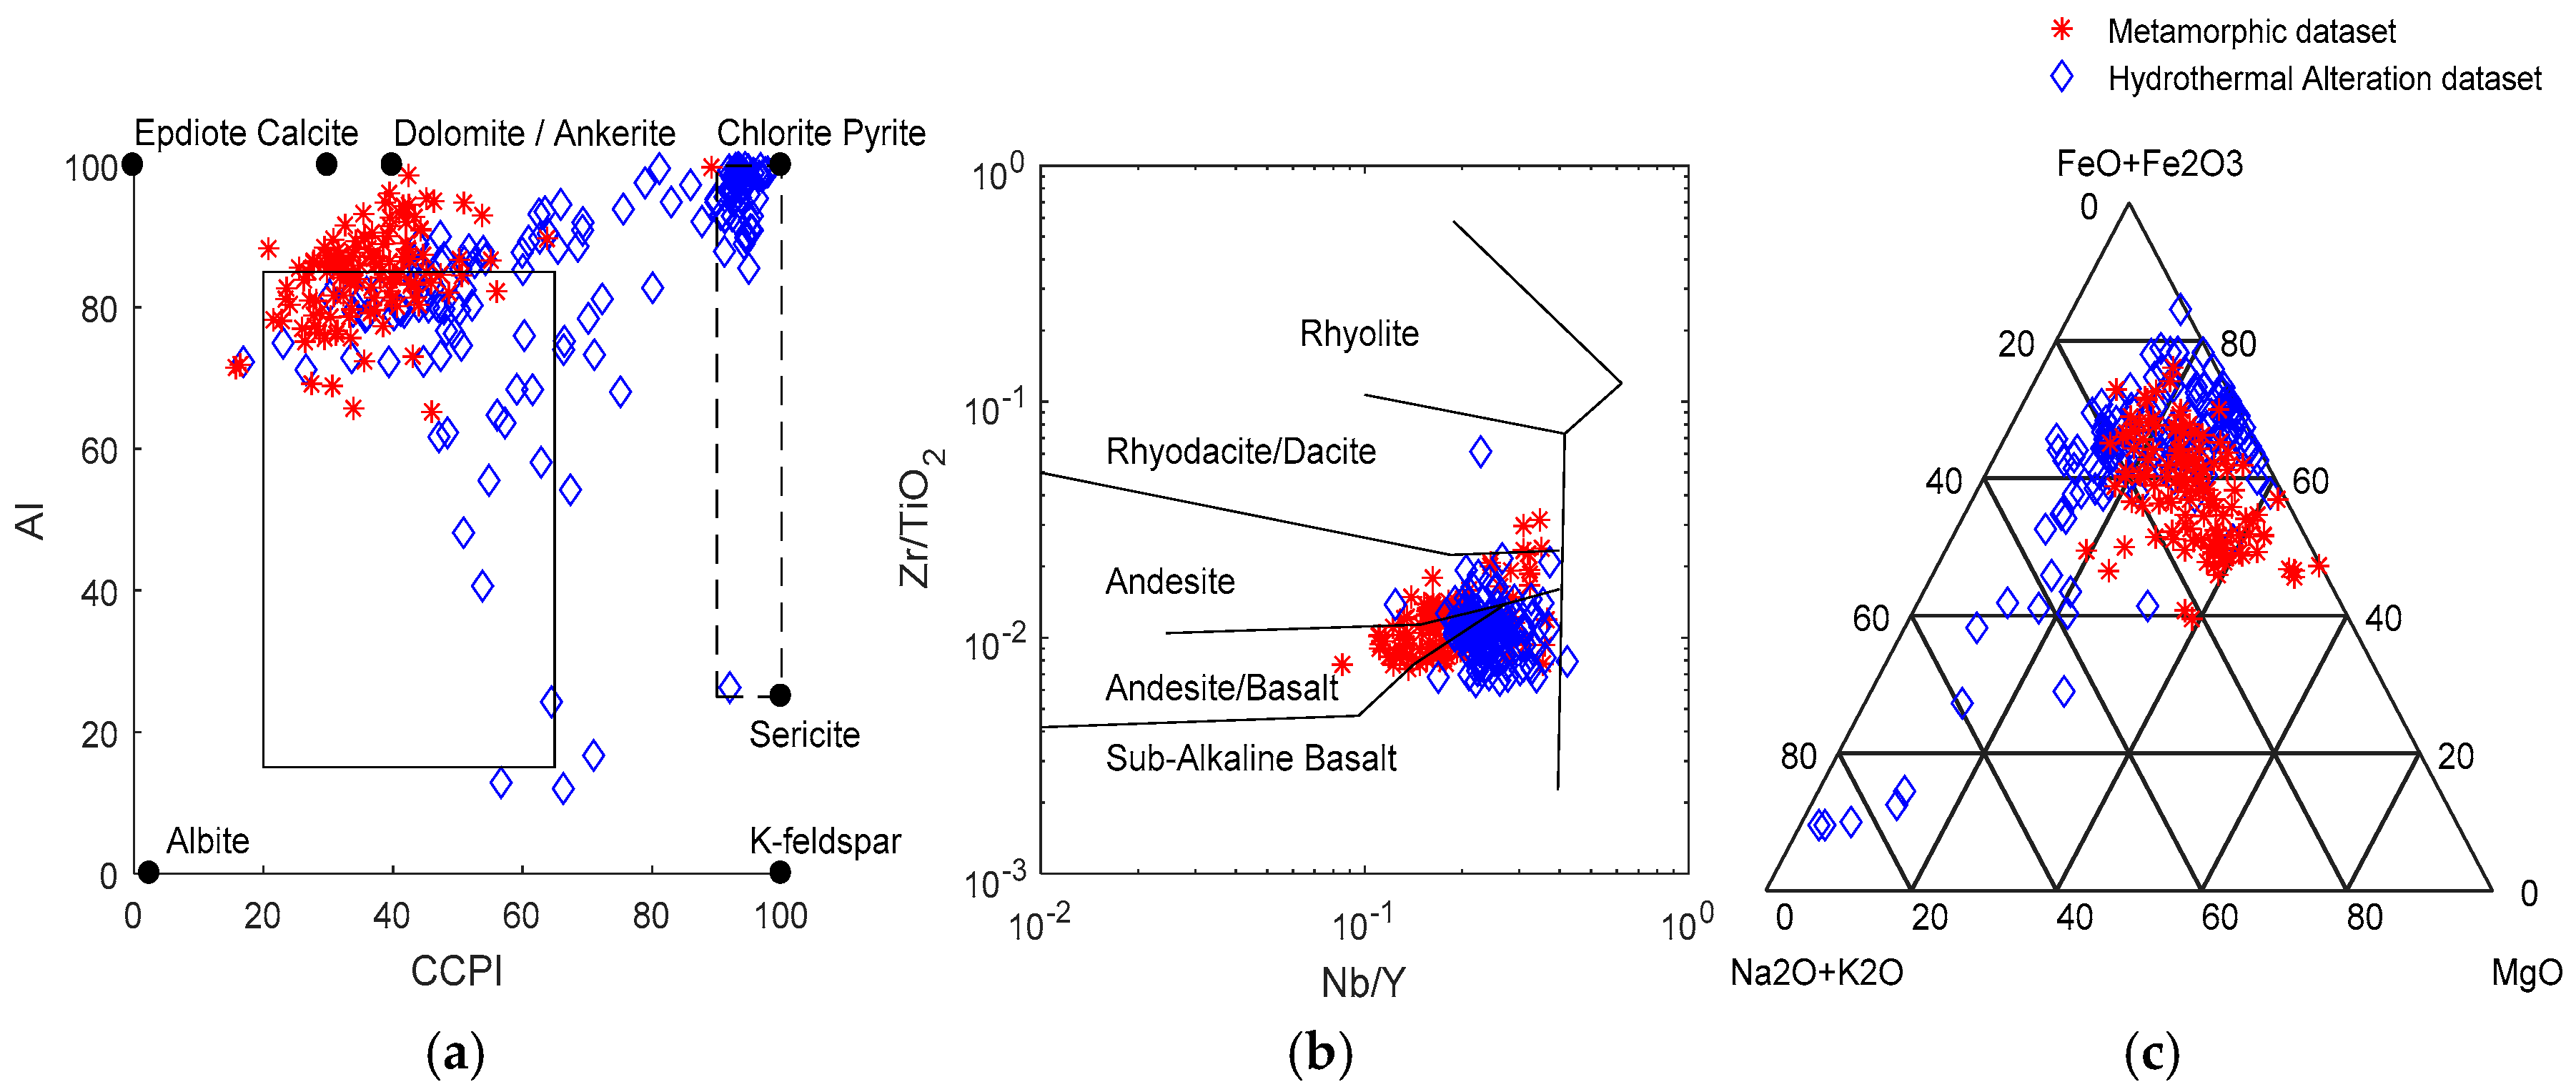
Figure 6 were used to compare the rock composition of both datasets and test the hypothesis made for this analysis. The first hypothesis is that both groups of basalts are the same and therefore can be compared. The second hypothesis addresses the difference between both datasets, and whether one group is indeed altered by hydrothermal alteration and the other by low-grade metamorphism.
Figure 6a is a so-called alteration-boxplot first described by Large et al. [
24]. The solid line box shows where non-altered samples should appear on the plot. The more felsic the volcanic rocks, the lower the CCPI. Other than some outliers the data from the metamorphic datasets cluster on top of the non-alteration box. Clustering of the hydrothermal alteration dataset is in the upper-right corner where chlorite–pyrite alteration products are expected [
24].
Figure 6b is a Winchester plot with two ratios of incompatible elements. The rocks plot around the same Zr/TiO
2 ratio, which was reported by Winchester and Floyd [
25] as sub-alkaline basalt to andesitic rocks. Some variation can be found in the Nb/Y ratio at which samples from the metamorphic dataset have a lower ratio compared to the hydrothermal alteration dataset.
The AFM-diagram (
Figure 6c) shows that the basalts from the metamorphic dataset cluster where the proportion of the alkaline elements Na
2O and K
2O is lower than 20%. However, the hydrothermal alteration data shows more variation in the alkaline elements relative to Fe and Mg.
4. Discussion
Our results show that there is a significant difference between the Mg-OH absorption wavelengths of hydrothermal and metamorphic rocks. Earlier studies [
5] concluded that the absorption wavelengths of chlorite are dependent on the magnesium number of chlorite. A similar trend was observed in our samples where the Mg-OH absorption wavelength, from all chlorite-specific absorption features, shows the highest inverse correlation with the magnesium number of chlorite. Therefore, based on the higher absorption wavelengths for the hydrothermal dataset, we conclude that chlorites from the hydrothermal dataset are richer in iron than those from the metamorphic dataset.
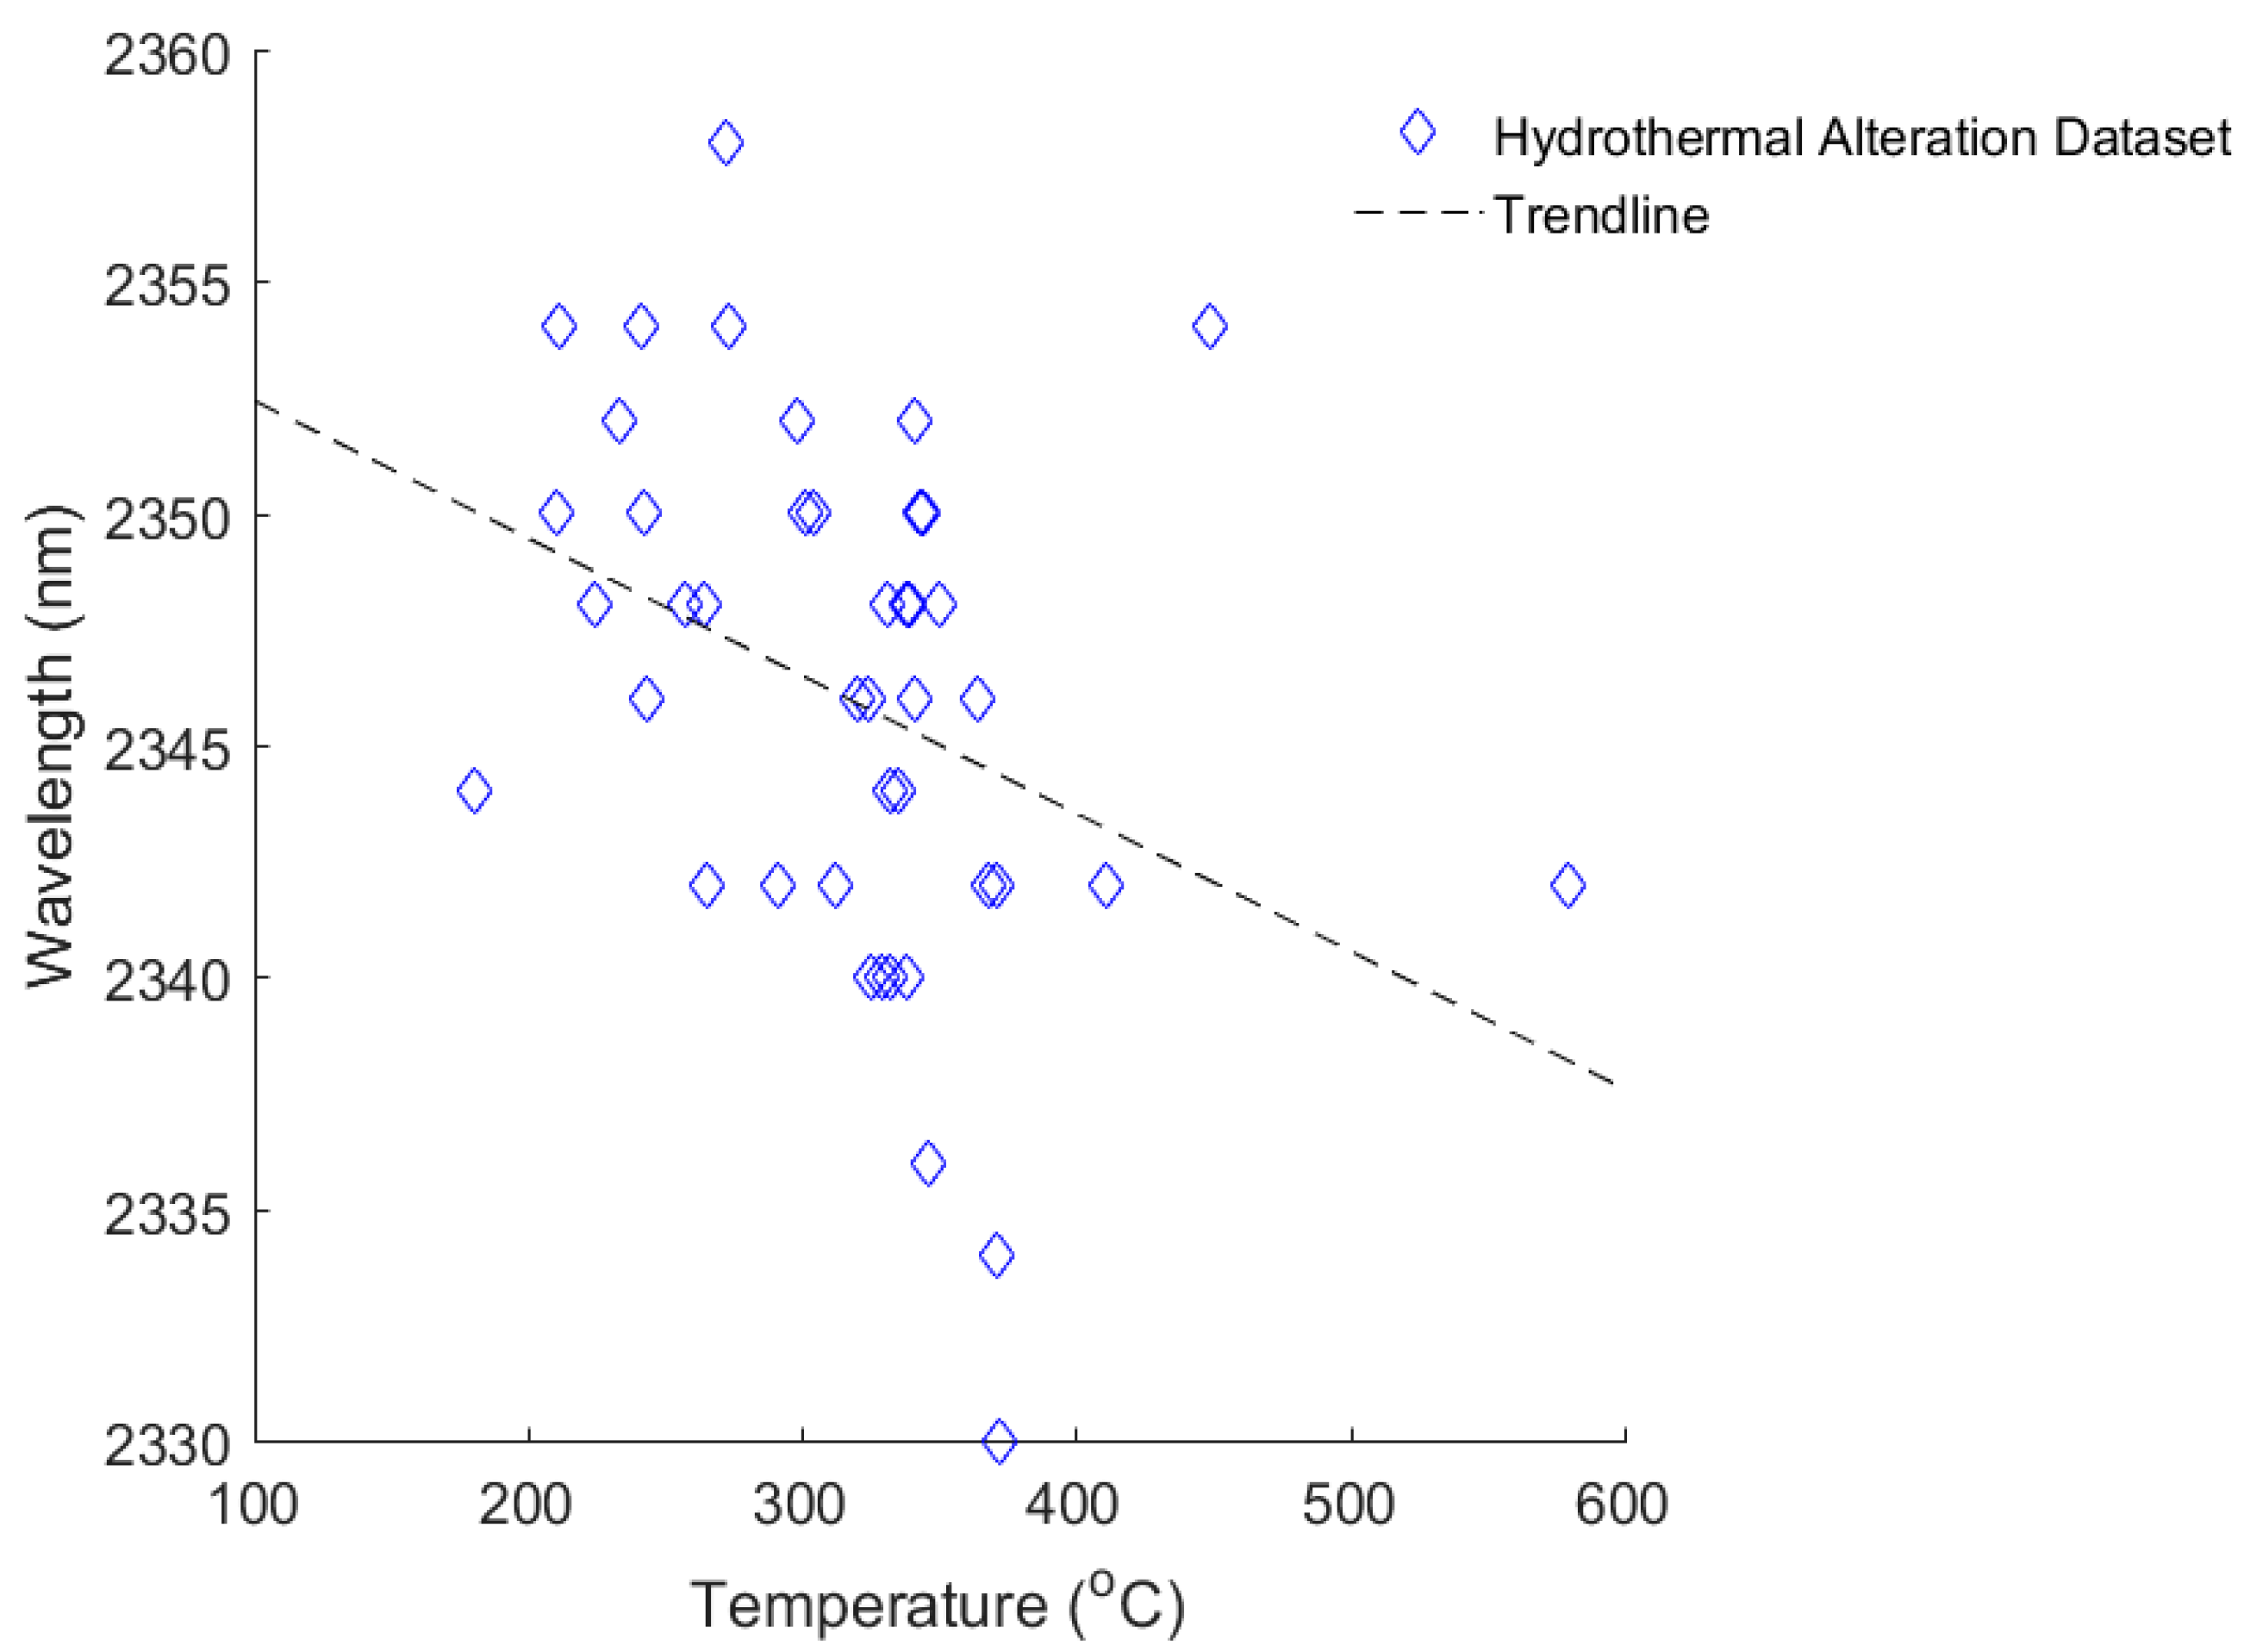
The Mg-OH absorption feature was also compared with temperature estimates from Brauhart et al. [
23]. As can be seen in
Figure 7, the absorption wavelength shows, other than two outliers, a weak negative correlation with temperature. Based on these results we suggest that the hydrothermal chlorites formed at lower temperatures than the chlorites from the metamorphic dataset. However, this cannot be tested as temperature estimates are not available for the metamorphic dataset. Three theories to explain the difference between the two groups of basalts, and the relation between the Mg-OH absorption wavelength, are discussed below.
4.1. Precursor Bulk Rock Composition
Although the lithologies used in both datasets are the same, the basalts may have had differences in their initial bulk rock composition. This is one possible explanation for the observed difference in absorption wavelengths between chlorites from the two groups. If this was the case, it would suggest that the protolith of the metamorphic rocks was richer in Mg than the hydrothermal rocks. This could have been caused by differences in magma source, or crystallization in a different magma series. Based on the Winchester plot of incompatible elements (
Figure 6b), we conclude that the initial composition of the basalts of both datasets was similar. The clustering of both basalts in the AFM-diagram in
Figure 6c supports the rock descriptions of Smithies et al. and Brauhart [
16,
21] that the volcanic rocks were formed from the tholeiitic magma series [
29]. However, the hydrothermal dataset shows a larger scattering towards the alkali corner. This suggests that a process other than magmatic crystallization was involved, which resulted in the current rock compositions. This is supported by the alteration boxplot on
Figure 6 in which the chlorite–carbonate–pyrite index differentiates the hydrothermal rocks from the metamorphic rocks.
4.2. Temperature
Although there are no independent temperature estimates for the metamorphic dataset, the metamorphic facies in which the rocks were formed have a similar temperature range to that reported by Brauhart et al. [
23] for the hydrothermal dataset. Literature shows that depending on the pressure, the temperature of peak metamorphism under greenschist and amphibolite facies ranges between circa 350–750 °C [
30]. Based on these observations, it is expected that chlorites formed at amphibolite facies (at higher temperatures) will have lower absorption wavelengths than those in greenschist facies rocks. This coincides with the observations of Abweny et al. [
15], who concluded that amphibolite facies rocks can be distinguished from greenschist facies rocks because the latter have a lower absorption wavelength near 2350 nm. Doublier et al. [
4] concluded that spectral features of chlorite could be used to differentiate low-grade metamorphic grades. Furthermore, the use of compositional or structural changes in chlorite as a response to changing temperature has been discussed in several previous studies [
2,
7,
31,
32,
33].
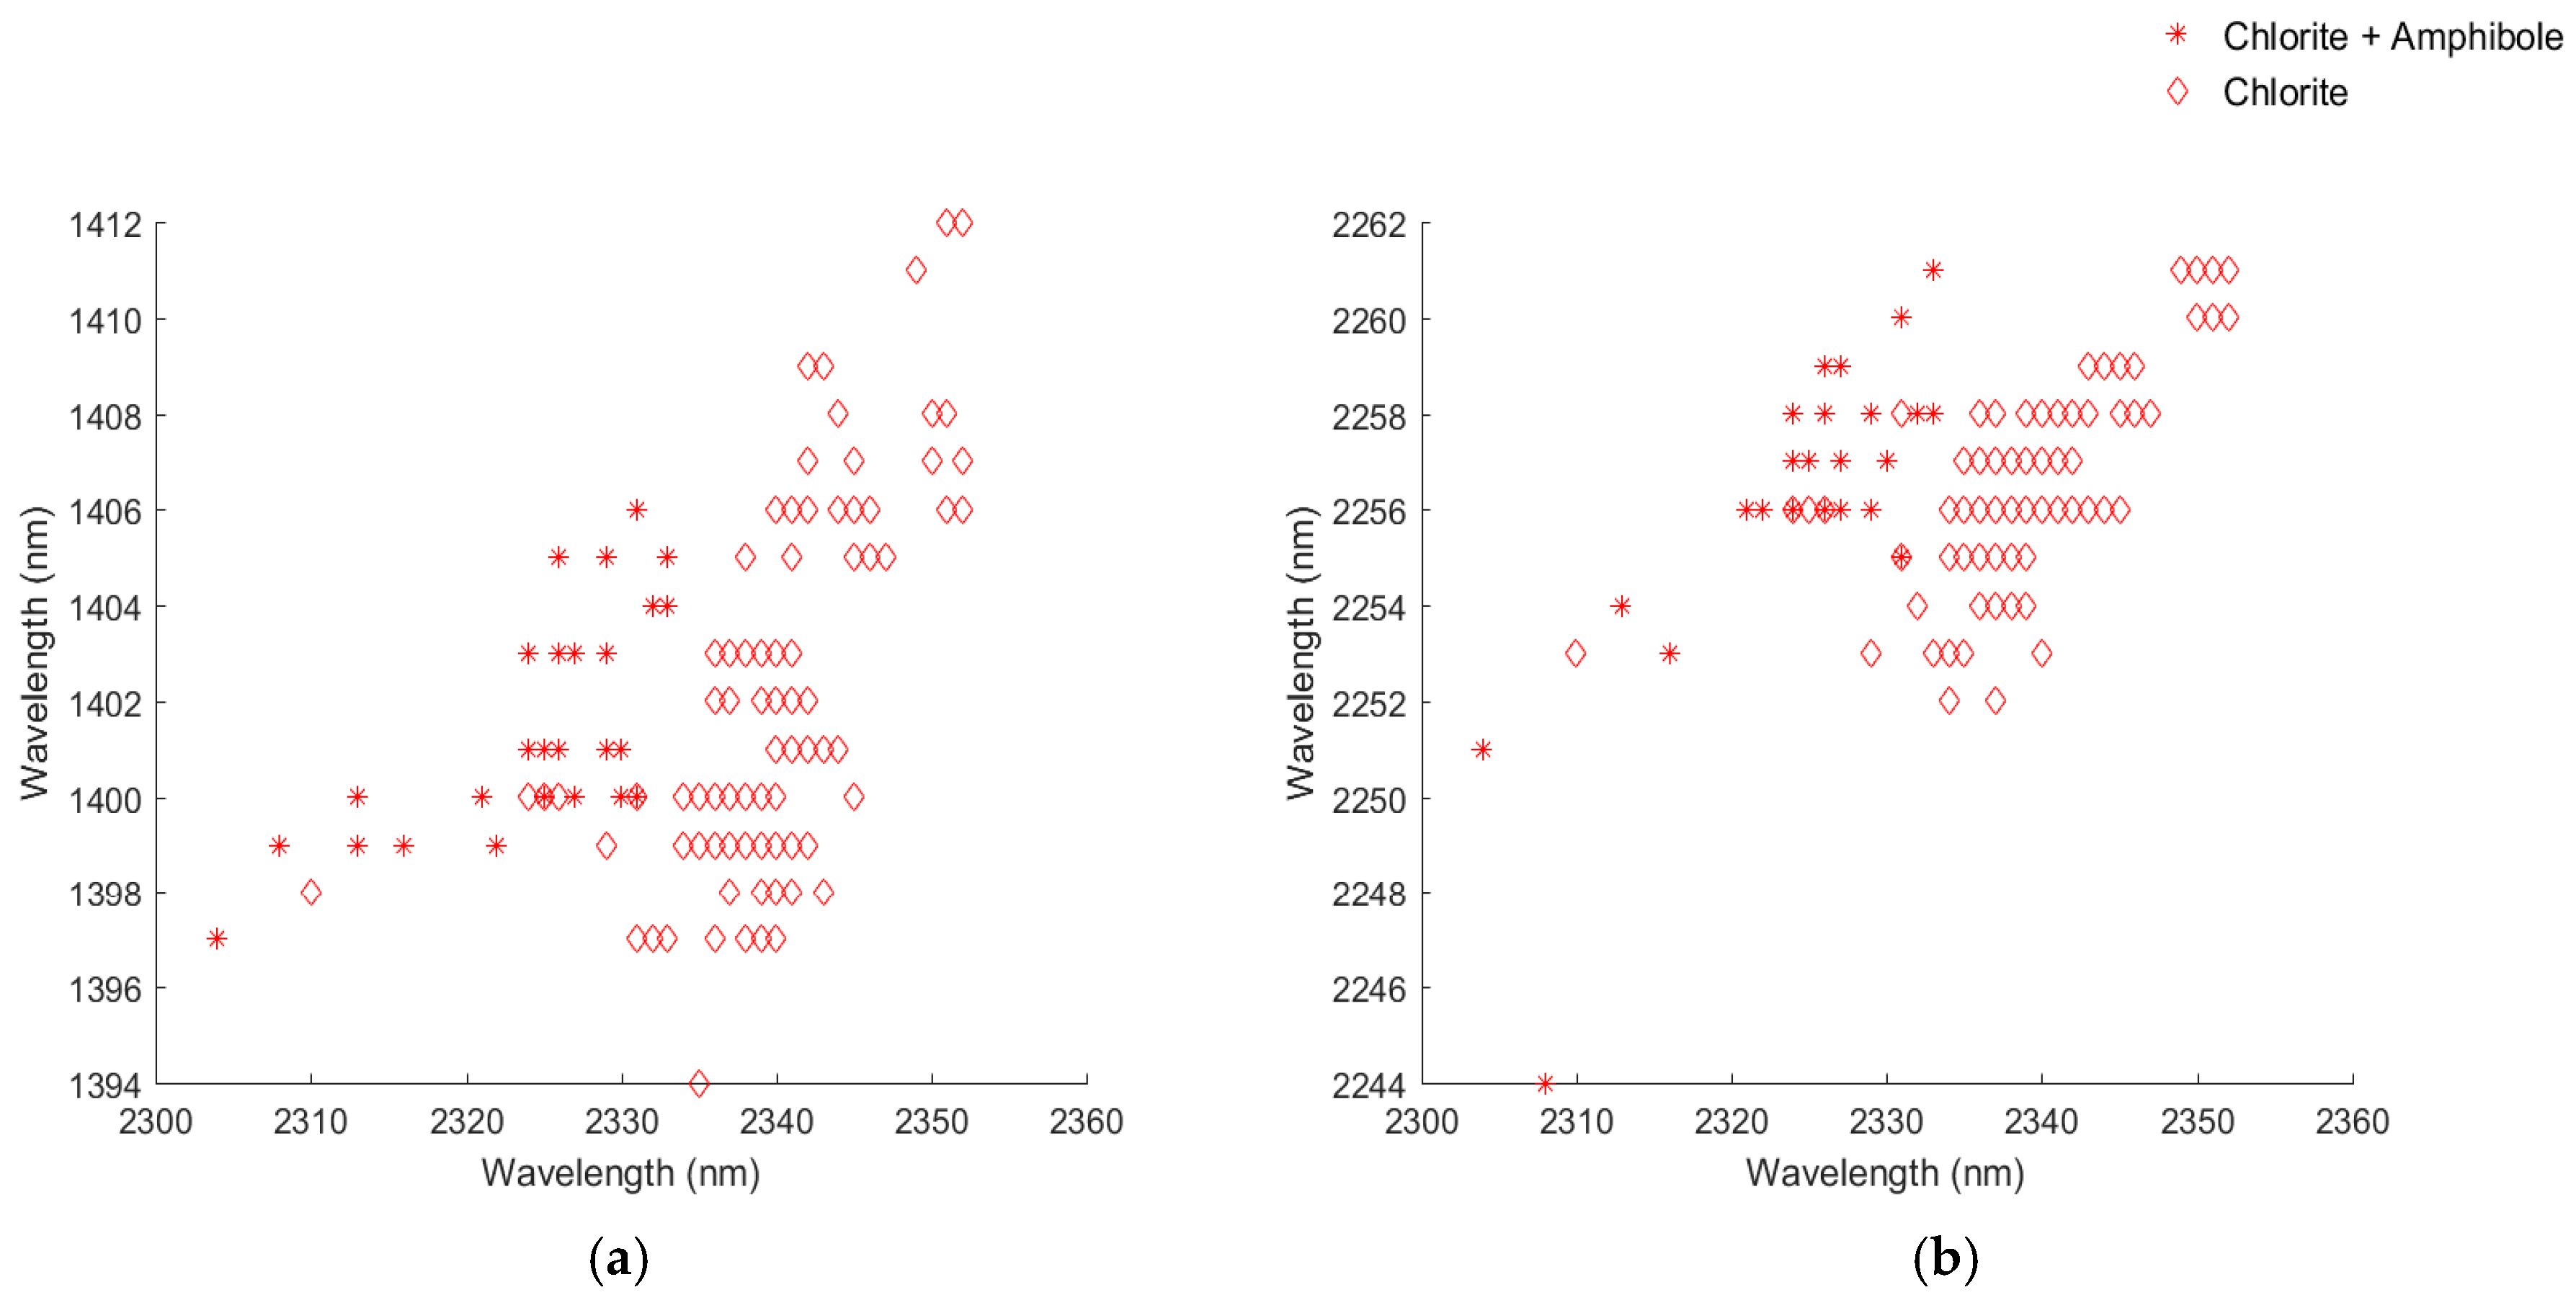
The investigation of EMP measurements in the metamorphic rocks made it possible to test the influence of spectral features of amphibole on the relation between the spectral features of chlorite and its magnesium number. One rock, used for the EMP analysis, contains a mixture of amphibole and chlorite minerals.
Figure 4 shows that this sample fits the linear trends of both the -OH and Fe-OH absorption feature but is a clear outlier for the Mg-OH absorption feature (
Figure 4). A comparison of chlorite reflection spectra both with and without the presence of amphibole (
Figure 8) shows that only the Mg-OH absorption feature displays any spectral difference. This coincides with the observation resulting from the EMP measurement. Therefore, it is thought that amphibole minerals, which share the Mg-OH absorption feature with chlorite, cause the difference in absorption wavelengths between the two metamorphic facies. If either the mineral composition or the temperature influenced the difference, then the amphibolite facies rocks would be expected to be outliers in all the absorption features and not only for the Mg-OH absorption feature.
4.3. Metasomatism
Another process that can explain the difference in absorption wavelengths between the two basalt groups is the difference in mass transfer. In a previous section, that discussed the influence of the precursor bulk rock composition, it was mentioned that there are differences in element concentration between the two datasets.
Figure 3 shows that the magnesium number of chlorite and the bulk rock composition are related. Brauhart et al. [
22] showed that mass-transfer of major elements resulted from hydrothermal circulation.
Figure 6a,c support these observations because the data from the hydrothermal dataset plots outside the area where non-altered data are expected. In the ternary diagram, the data for the hydrothermal dataset is dispersed whereas the basalts of the metamorphic dataset cluster together in one corner. Brauhart [
21] also described variations of the magnesium number of chlorite and found that there is a difference between the magnesium number of chlorite in the ground mass and larger chlorites associated with other ferromagnesian phases.
In the same study, Brauhart [
21] concluded that the larger chlorite crystals did not reach equilibrium with the hydrothermal fluid, which resulted in differences in magnesium numbers inside the rocks. So, the influence of precursor lithologies was excluded based on the observations. For the metamorphic dataset there are no indicators that the element concentrations had changed from the precursor composition. An interaction between temperature and metasomatism is likely, although it was not specifically mentioned by Brauhart and co-workers [
22,
23].
The difference between mass transfer in the hydrothermal rocks and no mass transfer shown in the metamorphic dataset seems the most likely explanation for the observed spectral differences. However, it is possible that temperature and mass transfer are related to each other in the hydrothermal dataset. This is difficult to conclude from the spectral data, because these describe ratios rather than absolute element concentrations. It was emphasized by Cathelineau [
33] that various geological processes and variables can influence the chlorite composition. Not all of these can be studied here because of the data availability.
The results show that the Mg-OH absorption wavelength is defined by the magnesium number of both chlorite and the bulk rock. The absorption wavelength also shows a relationship with alteration temperature. This suggests that the alteration temperature and magnesium number of chlorite and bulk rock are correlated. Since the variation in magnesium number is caused by metasomatic processes, it is likely that alteration temperature and type and degree of metasomatism are related, where more intense metasomatism occurs at higher temperatures. This relationship was not addressed by Brauhart and co-workers [
22,
23], and should therefore be studied in more detail to with more data to test this hypothesis.
Although there were spectral differences between the metamorphic facies of the rocks, it seems more likely that this was strongly influenced by the presence of amphibole minerals, and less by the composition of chlorite. Zane et al. [
34] attempted to use the composition of chlorite as an indicator for the metamorphic grade, but concluded that the composition of chlorite was instead defined by bulk rock composition.
Results of this study will be applicable to greenstone belts in other areas if: (i) the precursor of the metamorphic rocks are of a similar basaltic composition; and (ii) the type and intensity of metasomatism of chlorite–quartz alteration zones of the hydrothermally altered rocks are similar to those identified in this study.


