Trace Element Analysis of Pyrite from the Zhengchong Gold Deposit, Northeast Hunan Province, China: Implications for the Ore-Forming Process

Abstract
:1. Introduction
2. Geological Setting
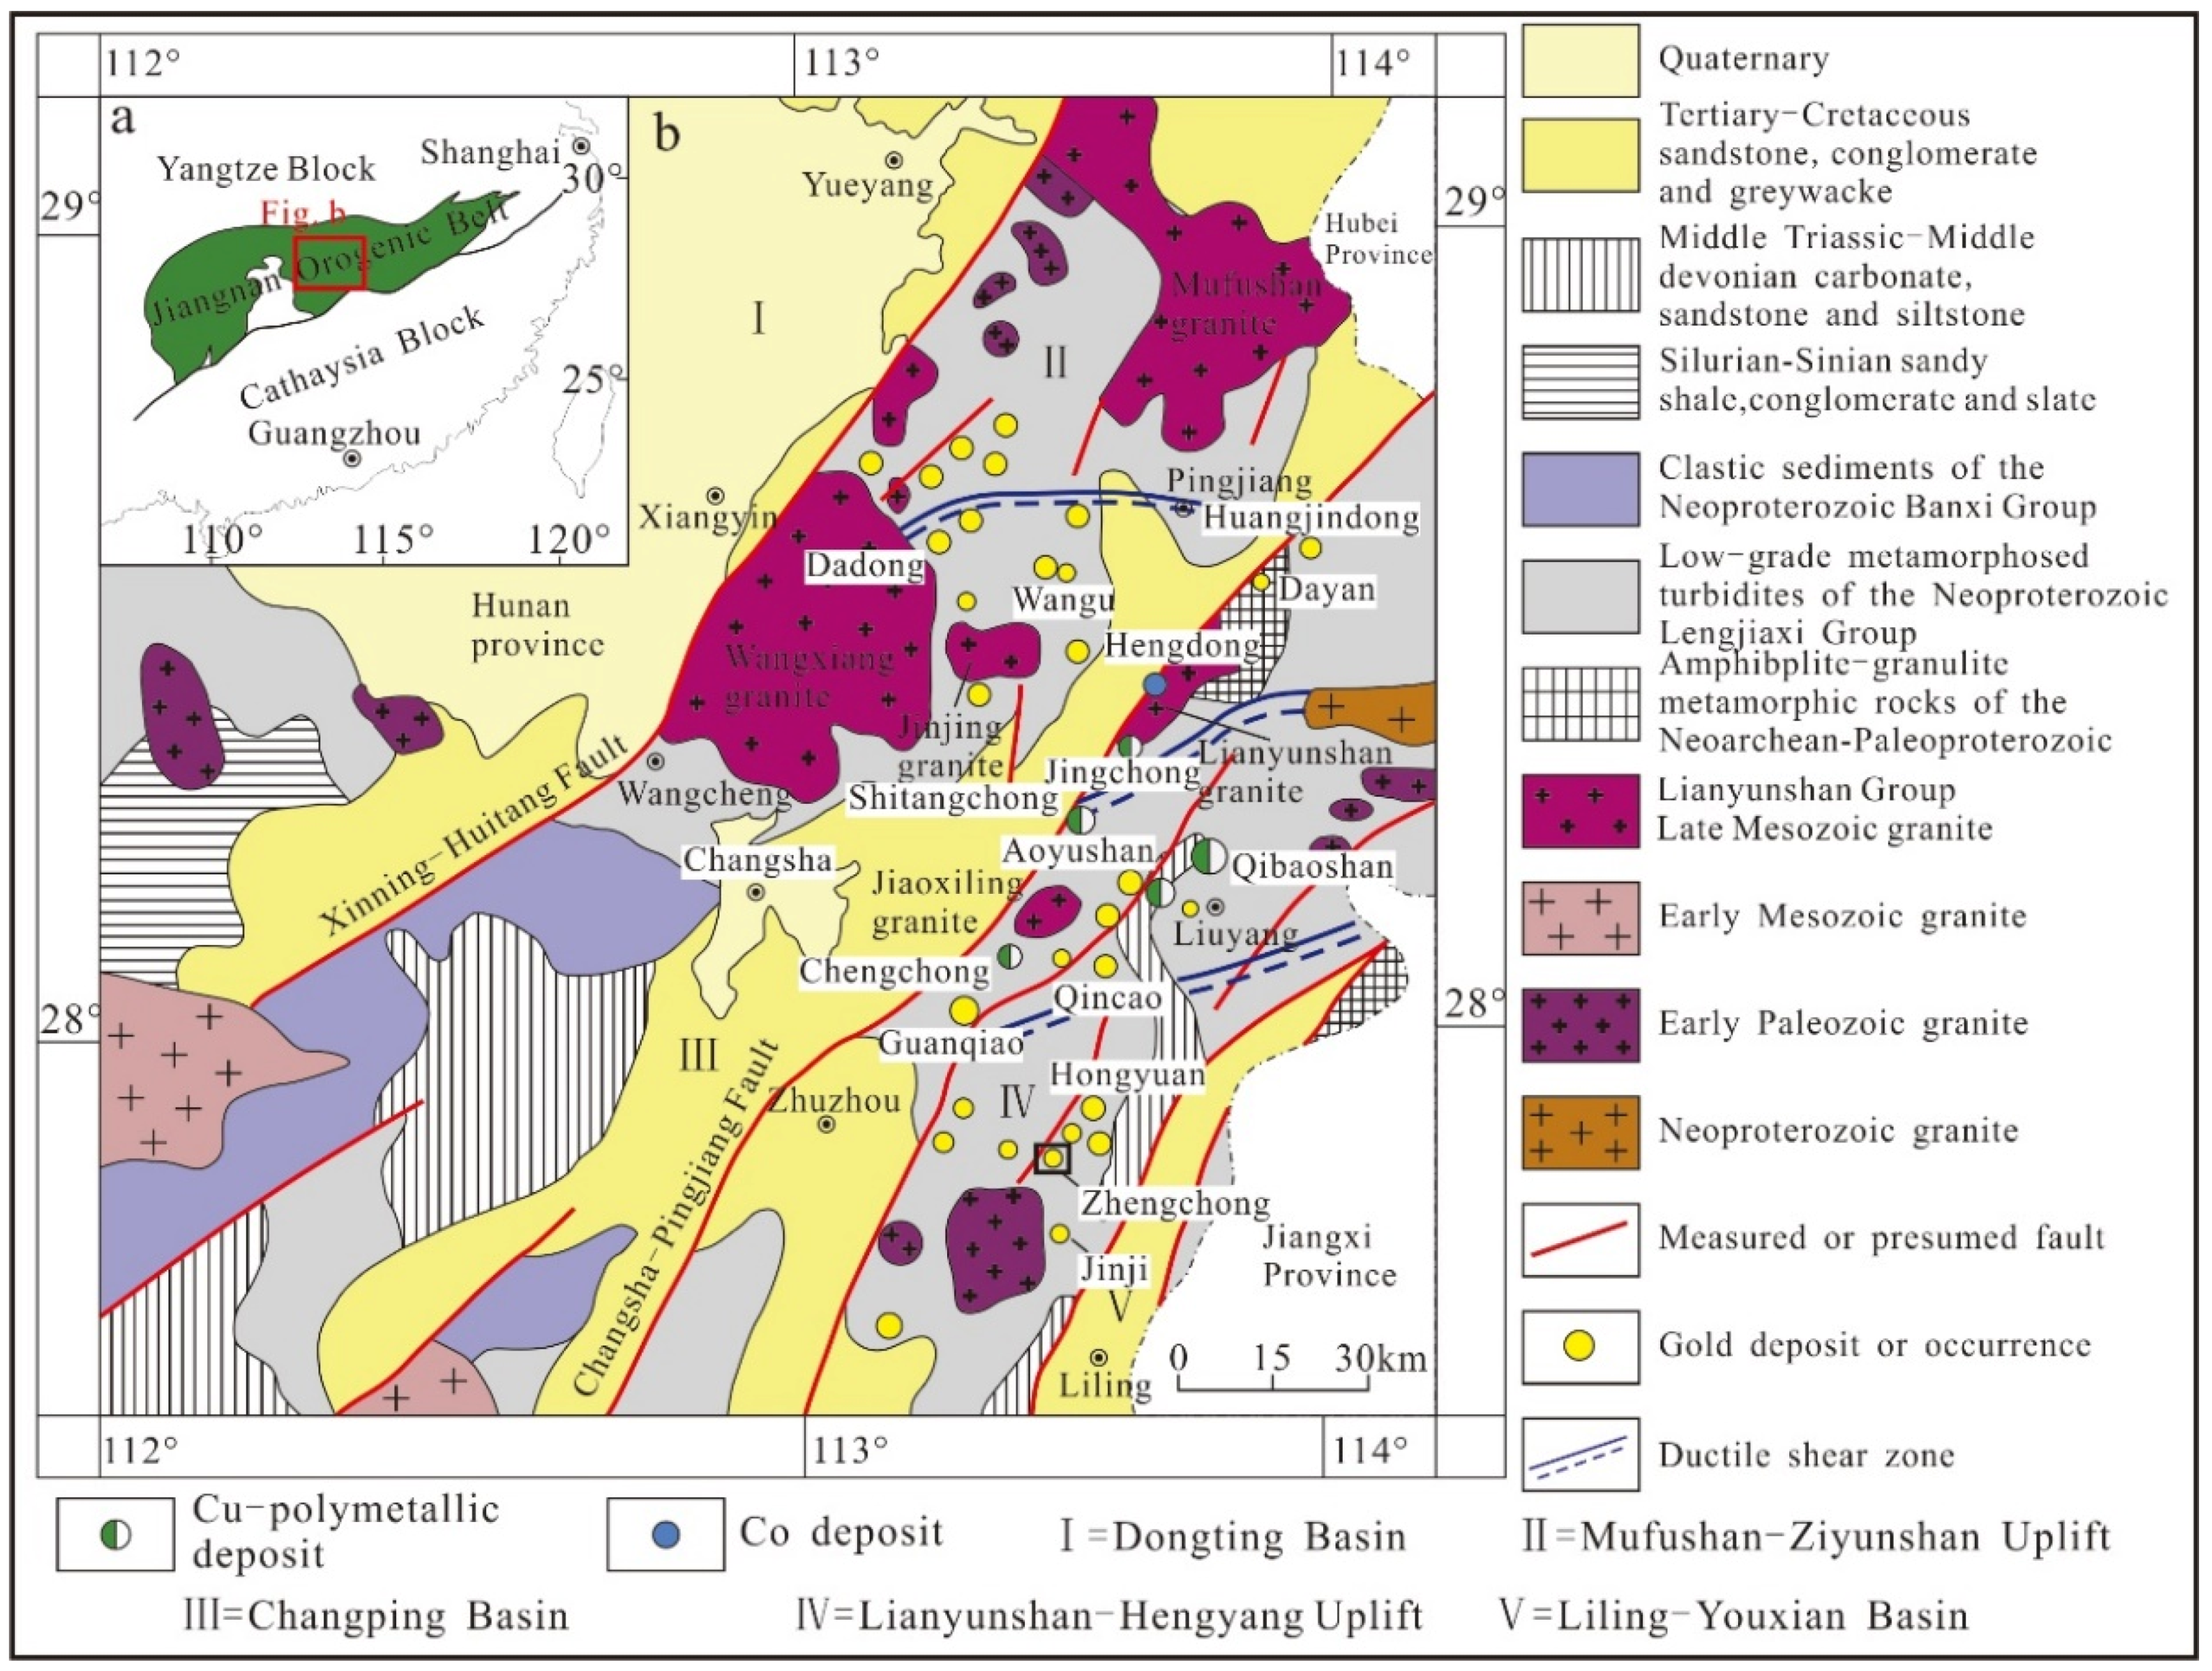
2.1. Regional Geology
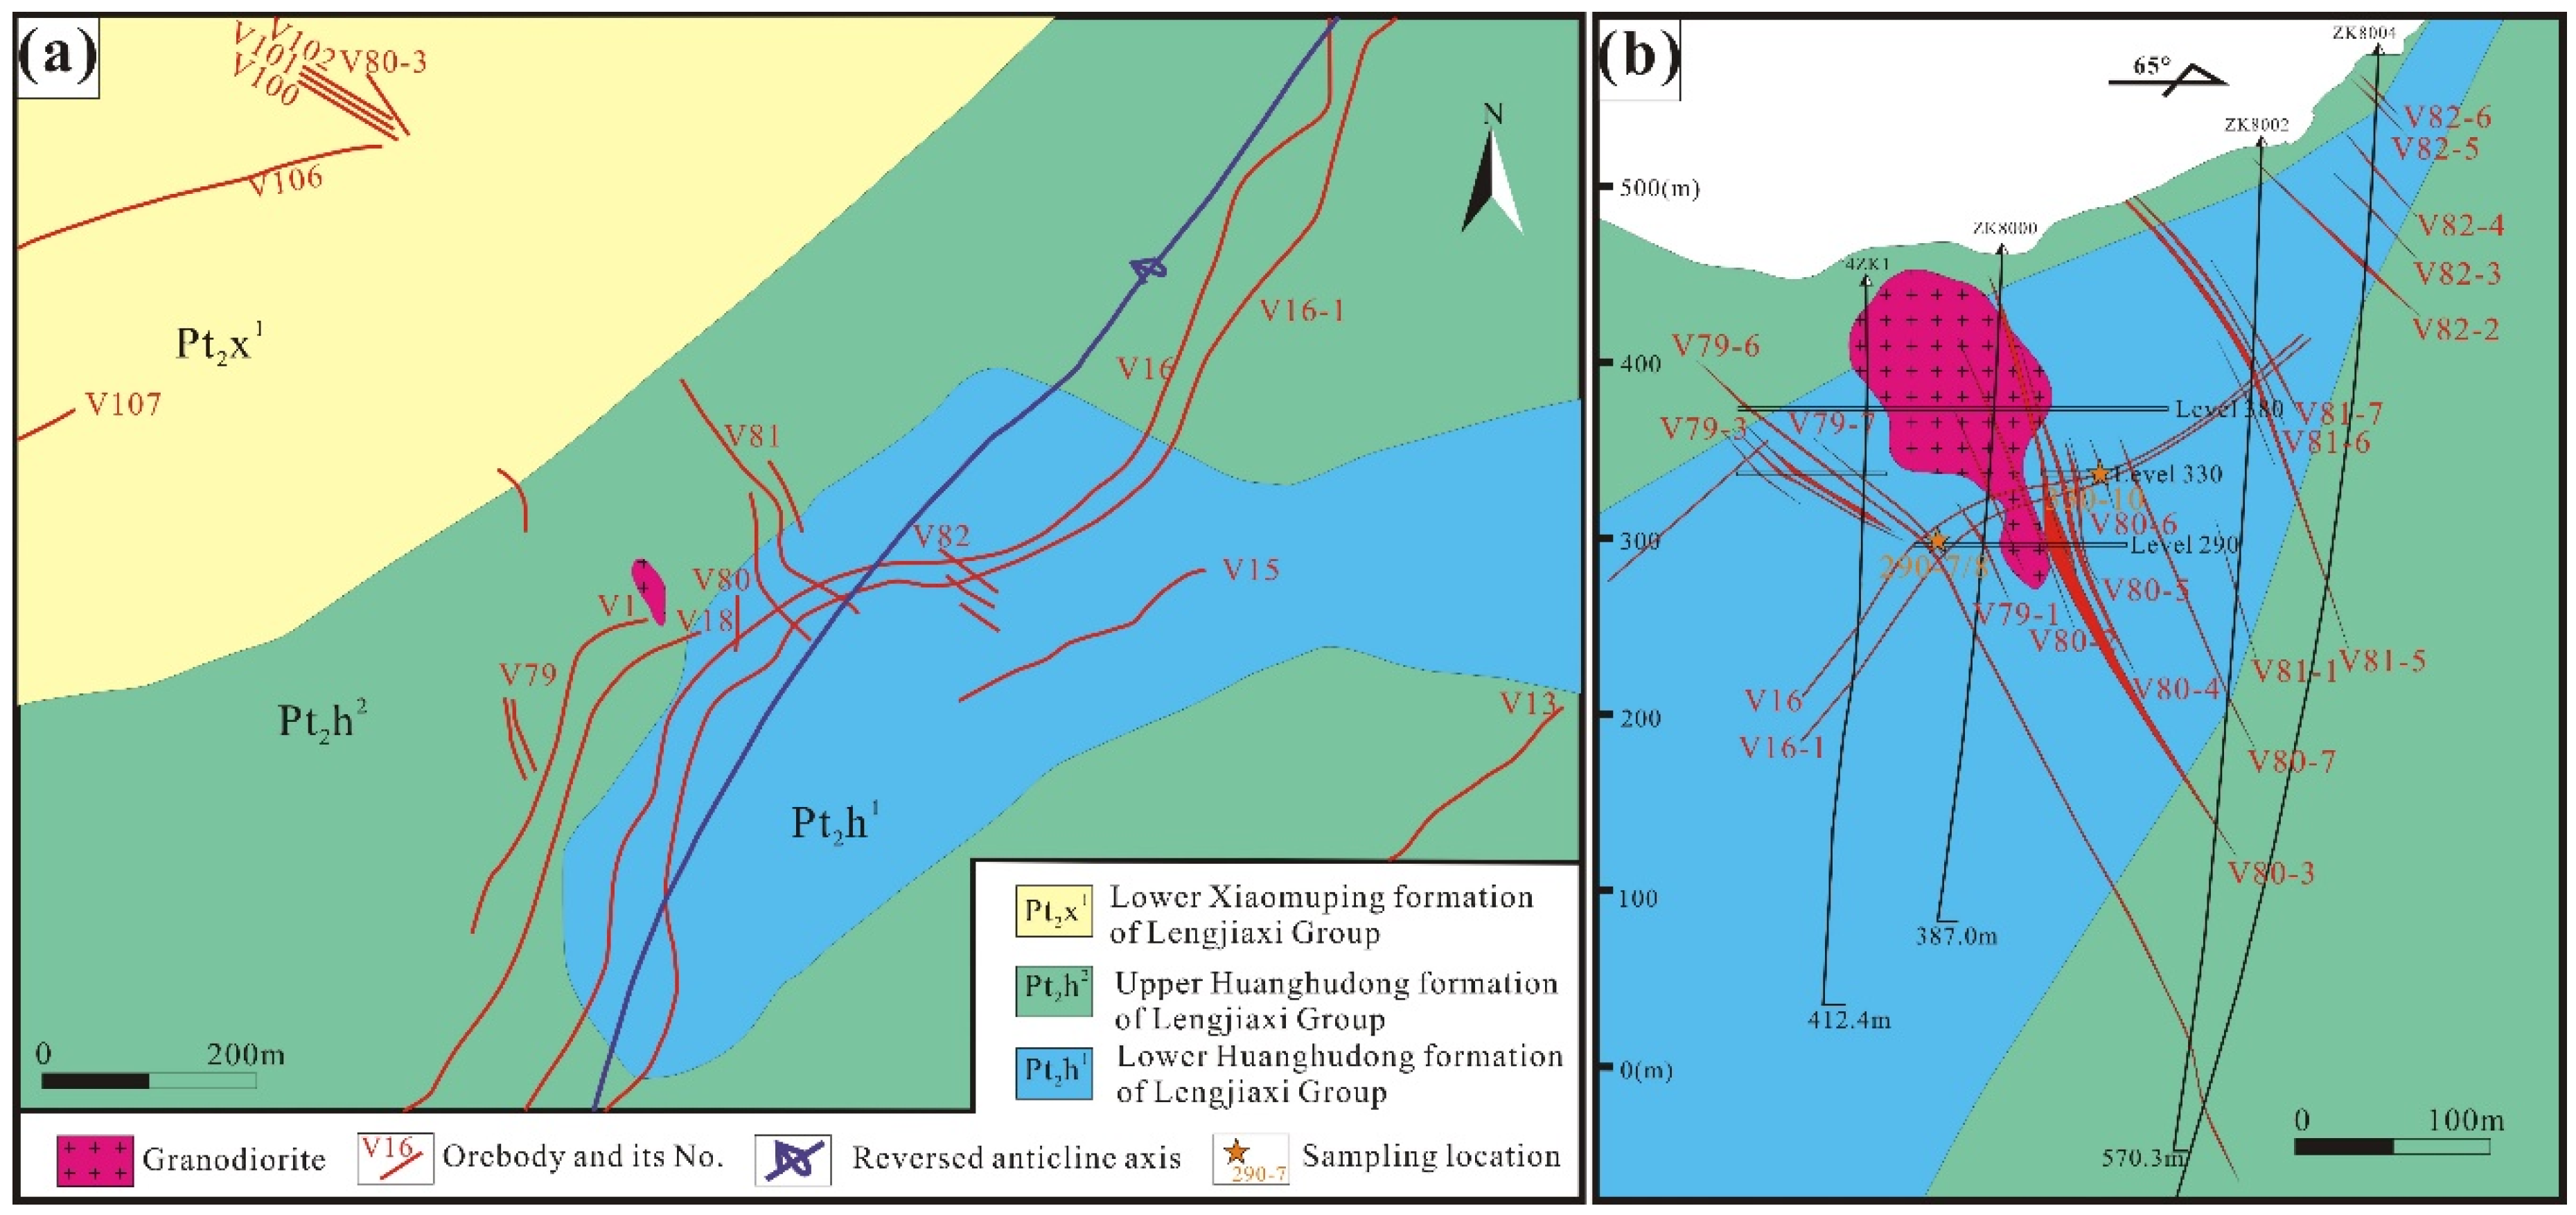
2.2. Deposit Geology
3. Samples and Analytical Methods
3.1. Sample Sites
3.2. Electron-Probe Microanalyses
3.3. LA-ICP-MS Analysis
4. Results
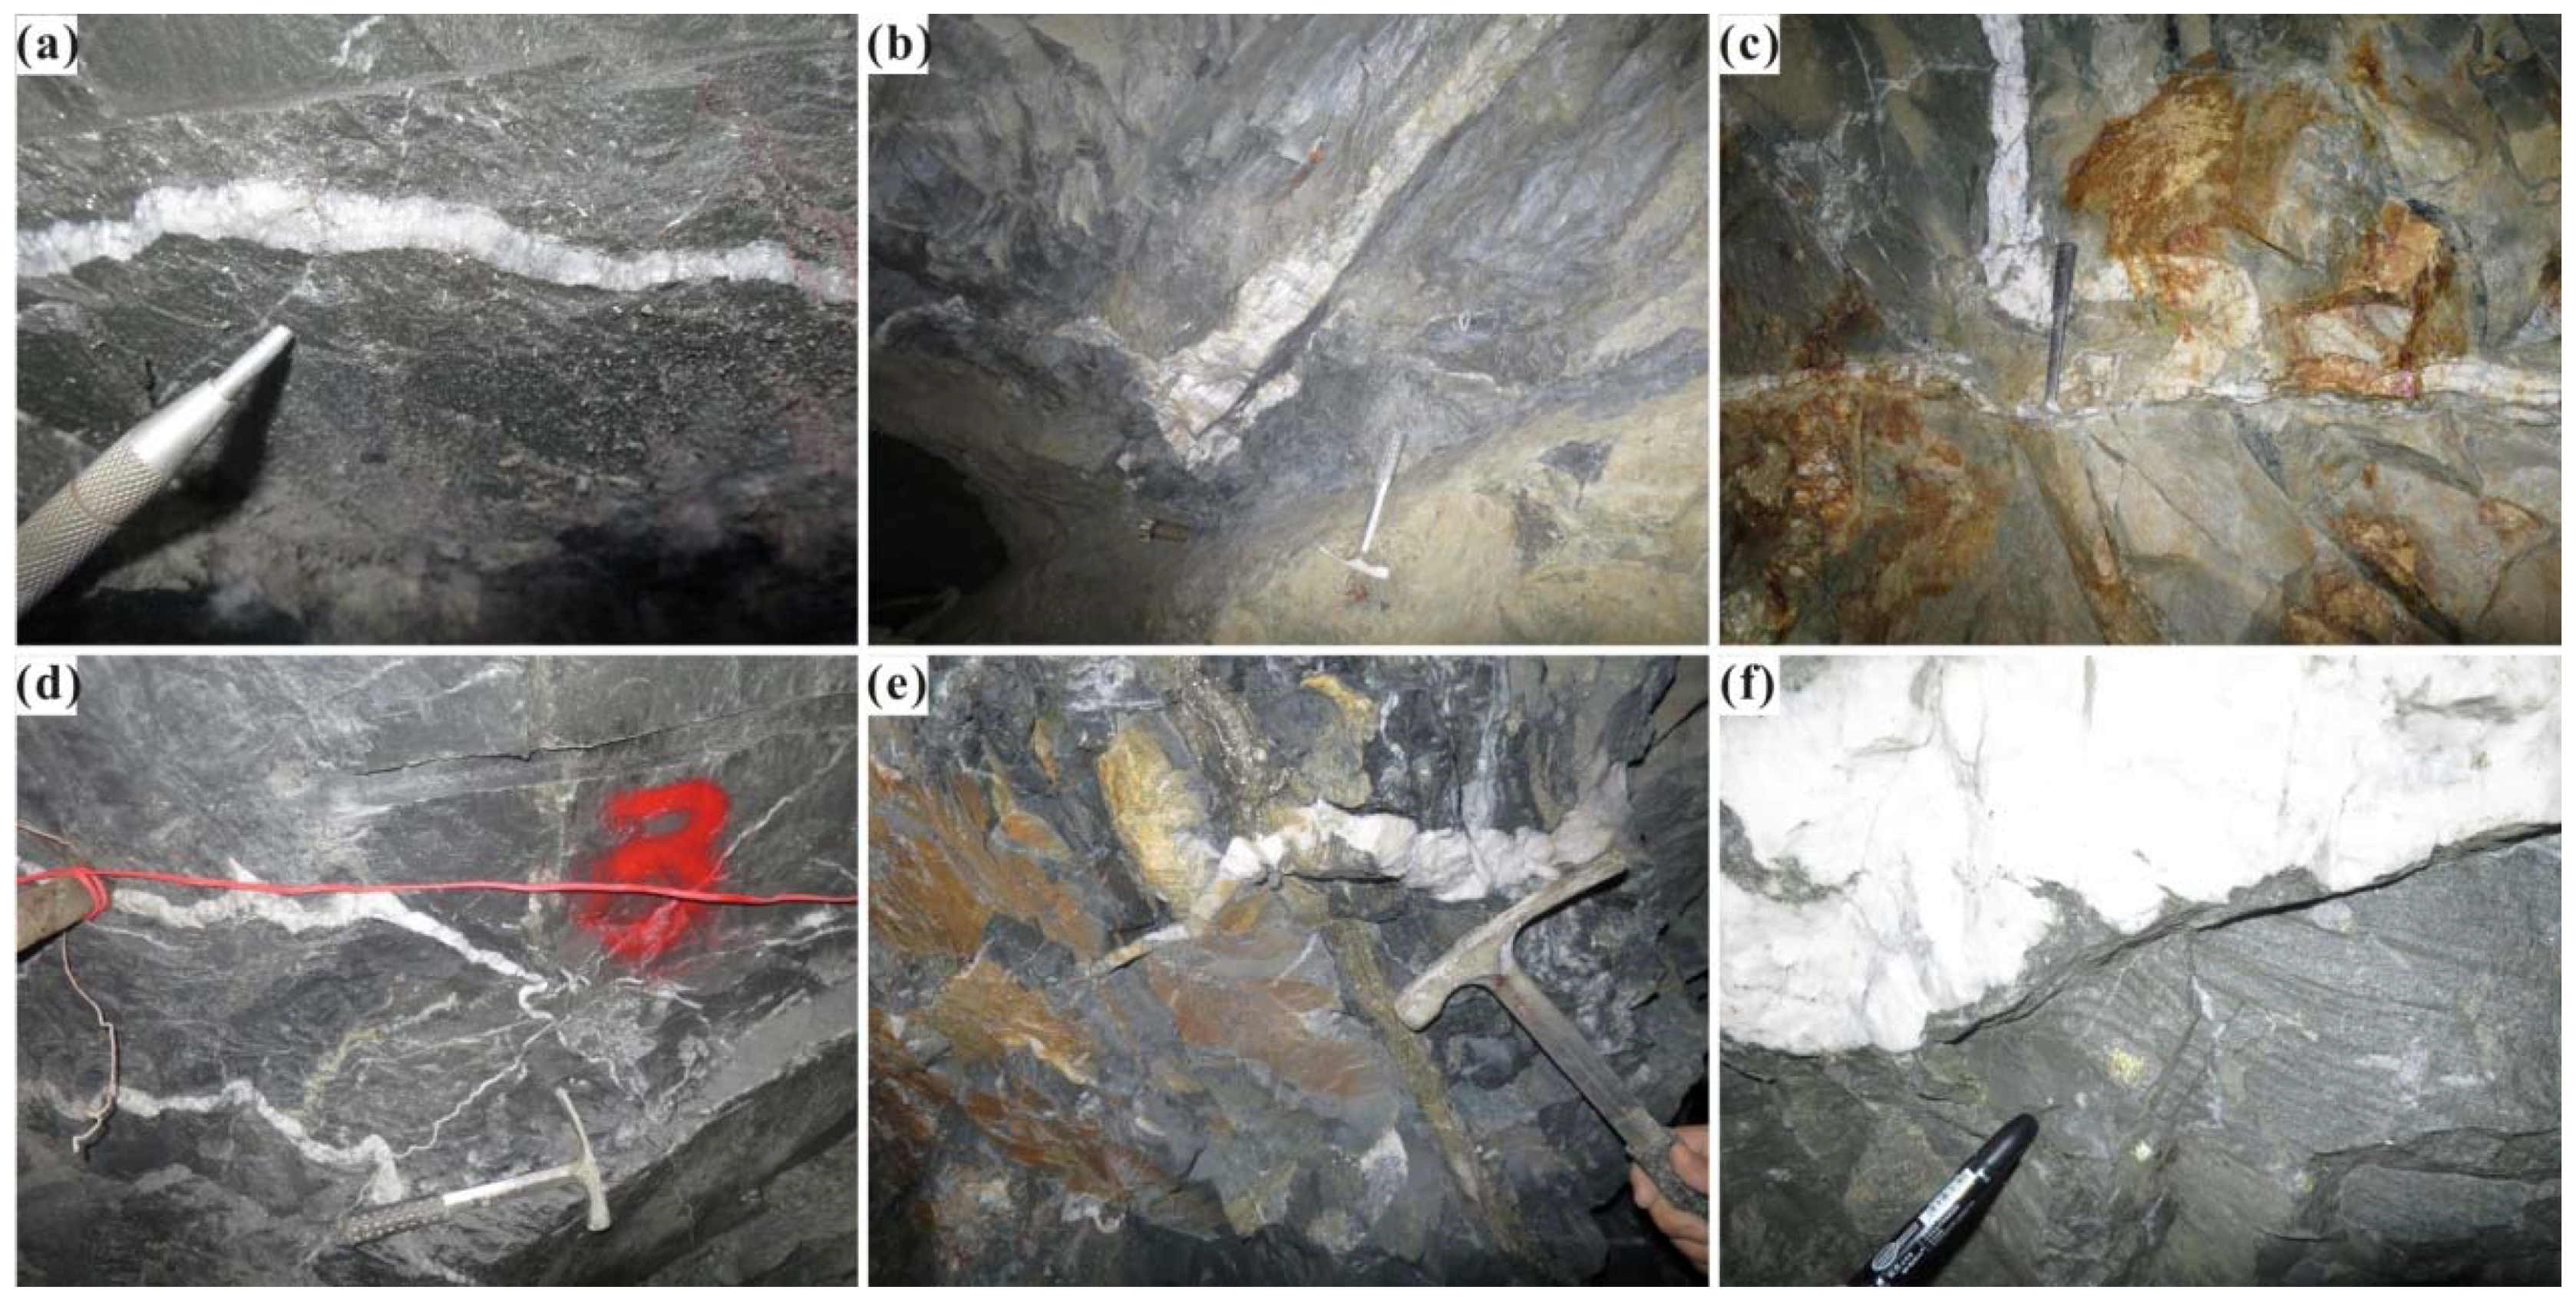
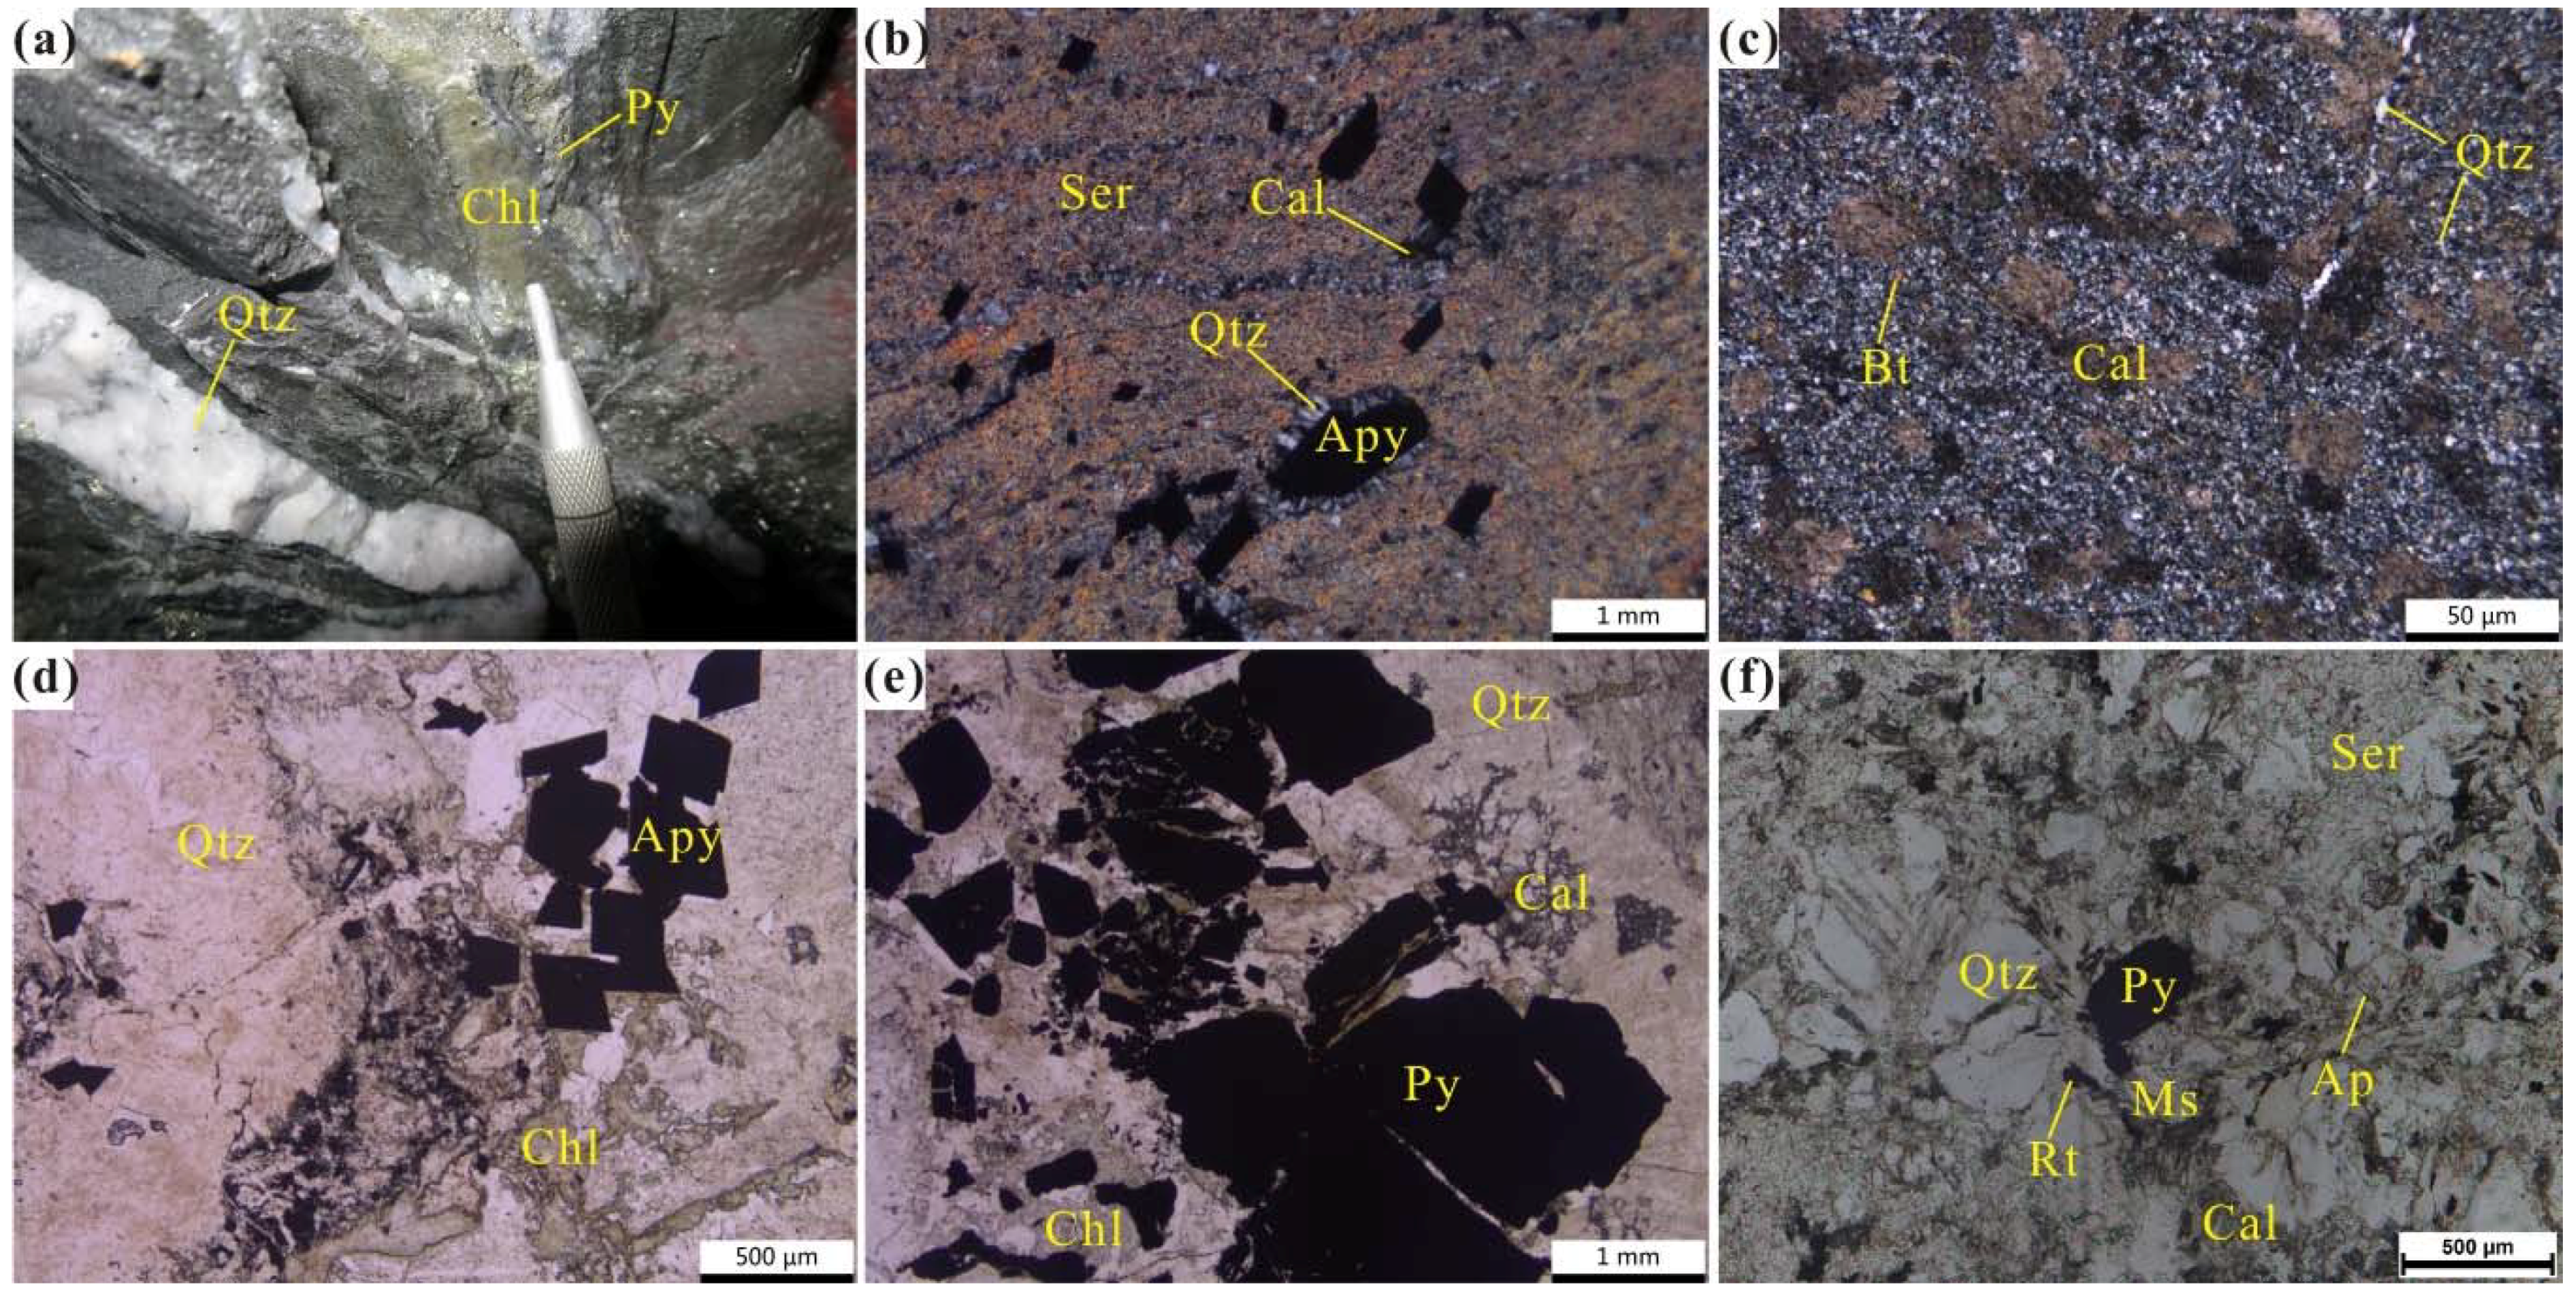
4.1. Petrography and Mineralogy
4.2. EPMA Data
4.3. Trace Element Contents in Pyrites
5. Discussion
5.1. Distribution and Correlations of Trace Elements in Pyrites
5.2. Gold in Pyrite
5.3. Implications for Fluid Evolution
6. Conclusions
- (1)
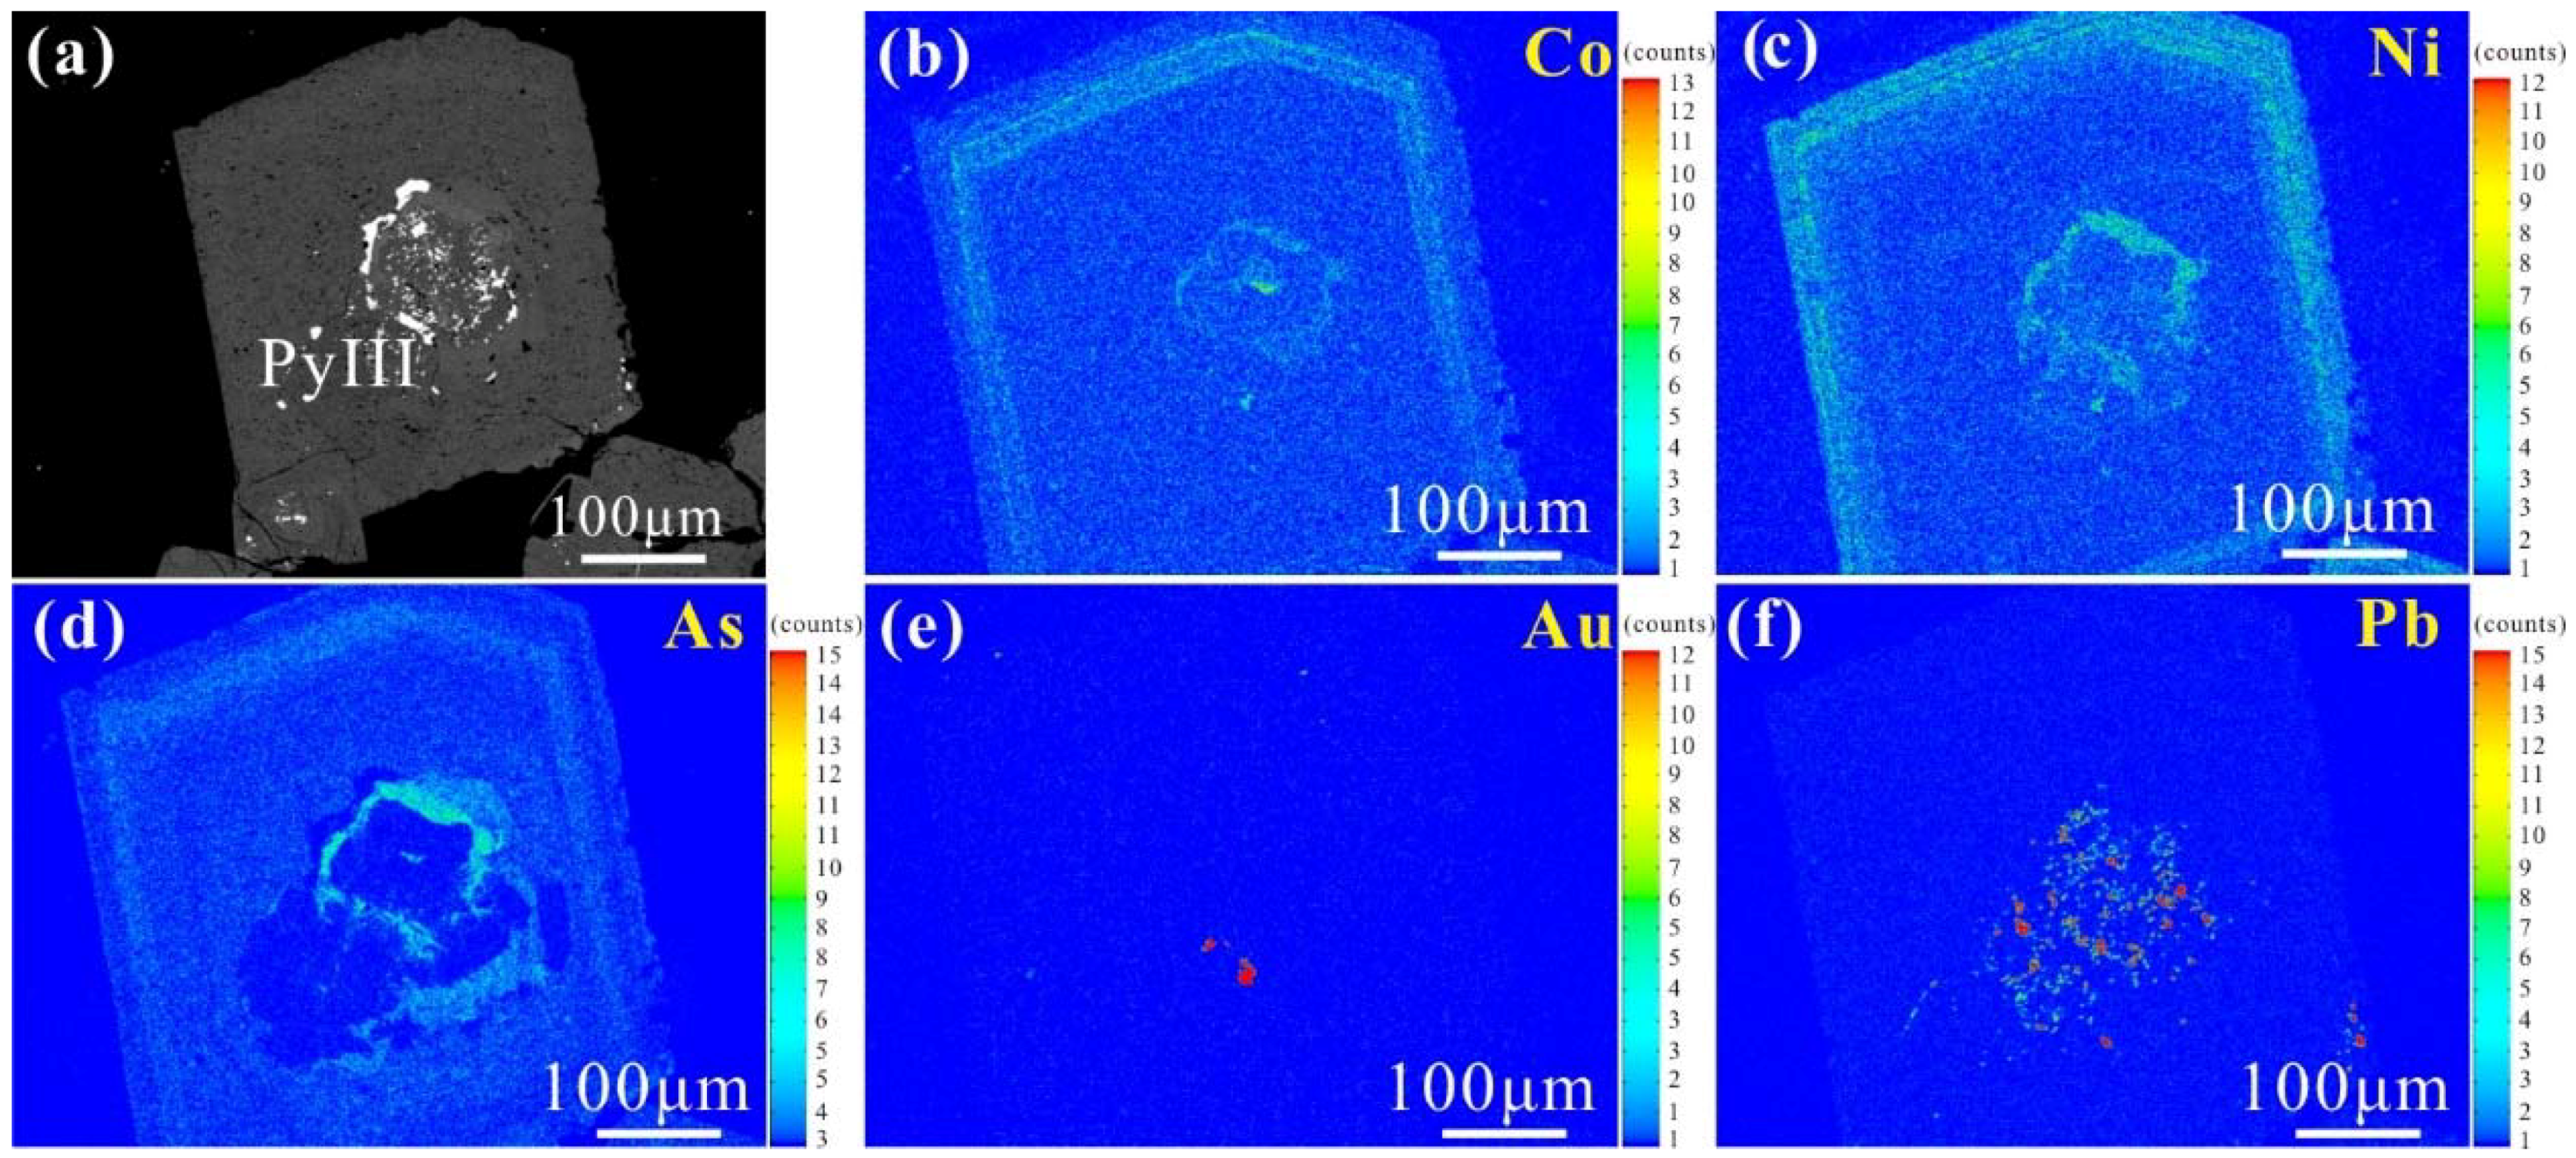
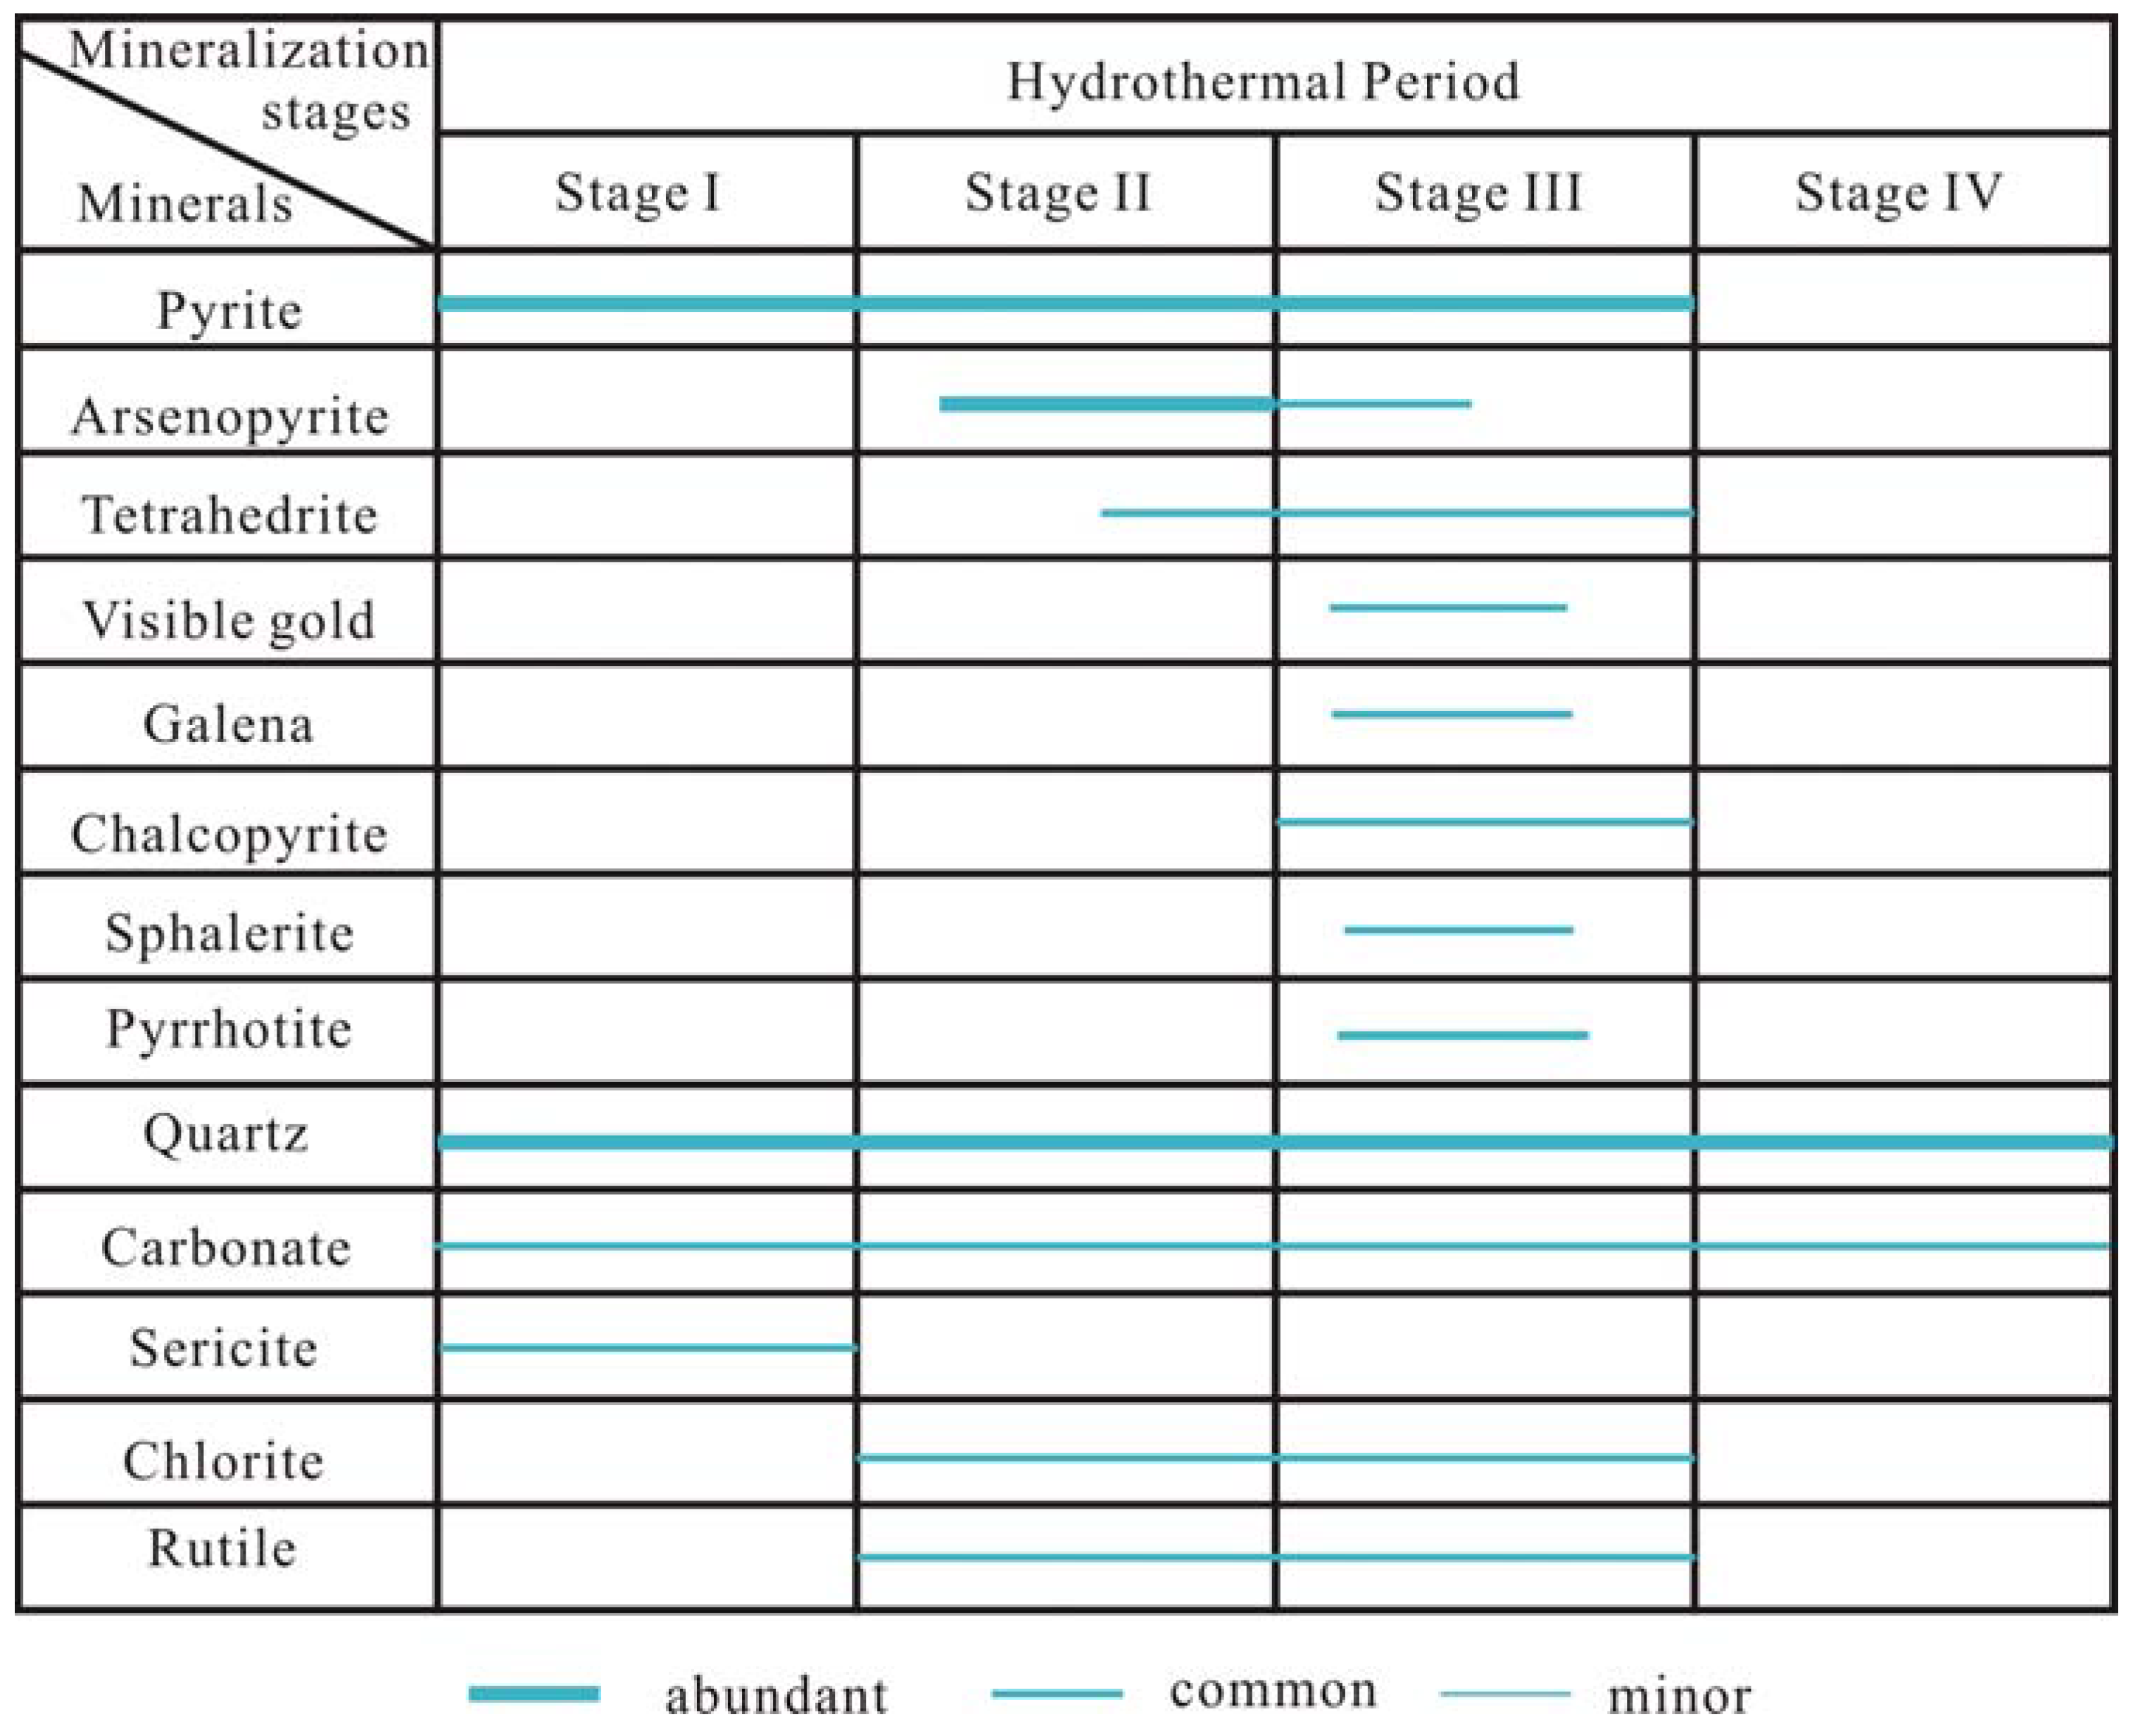
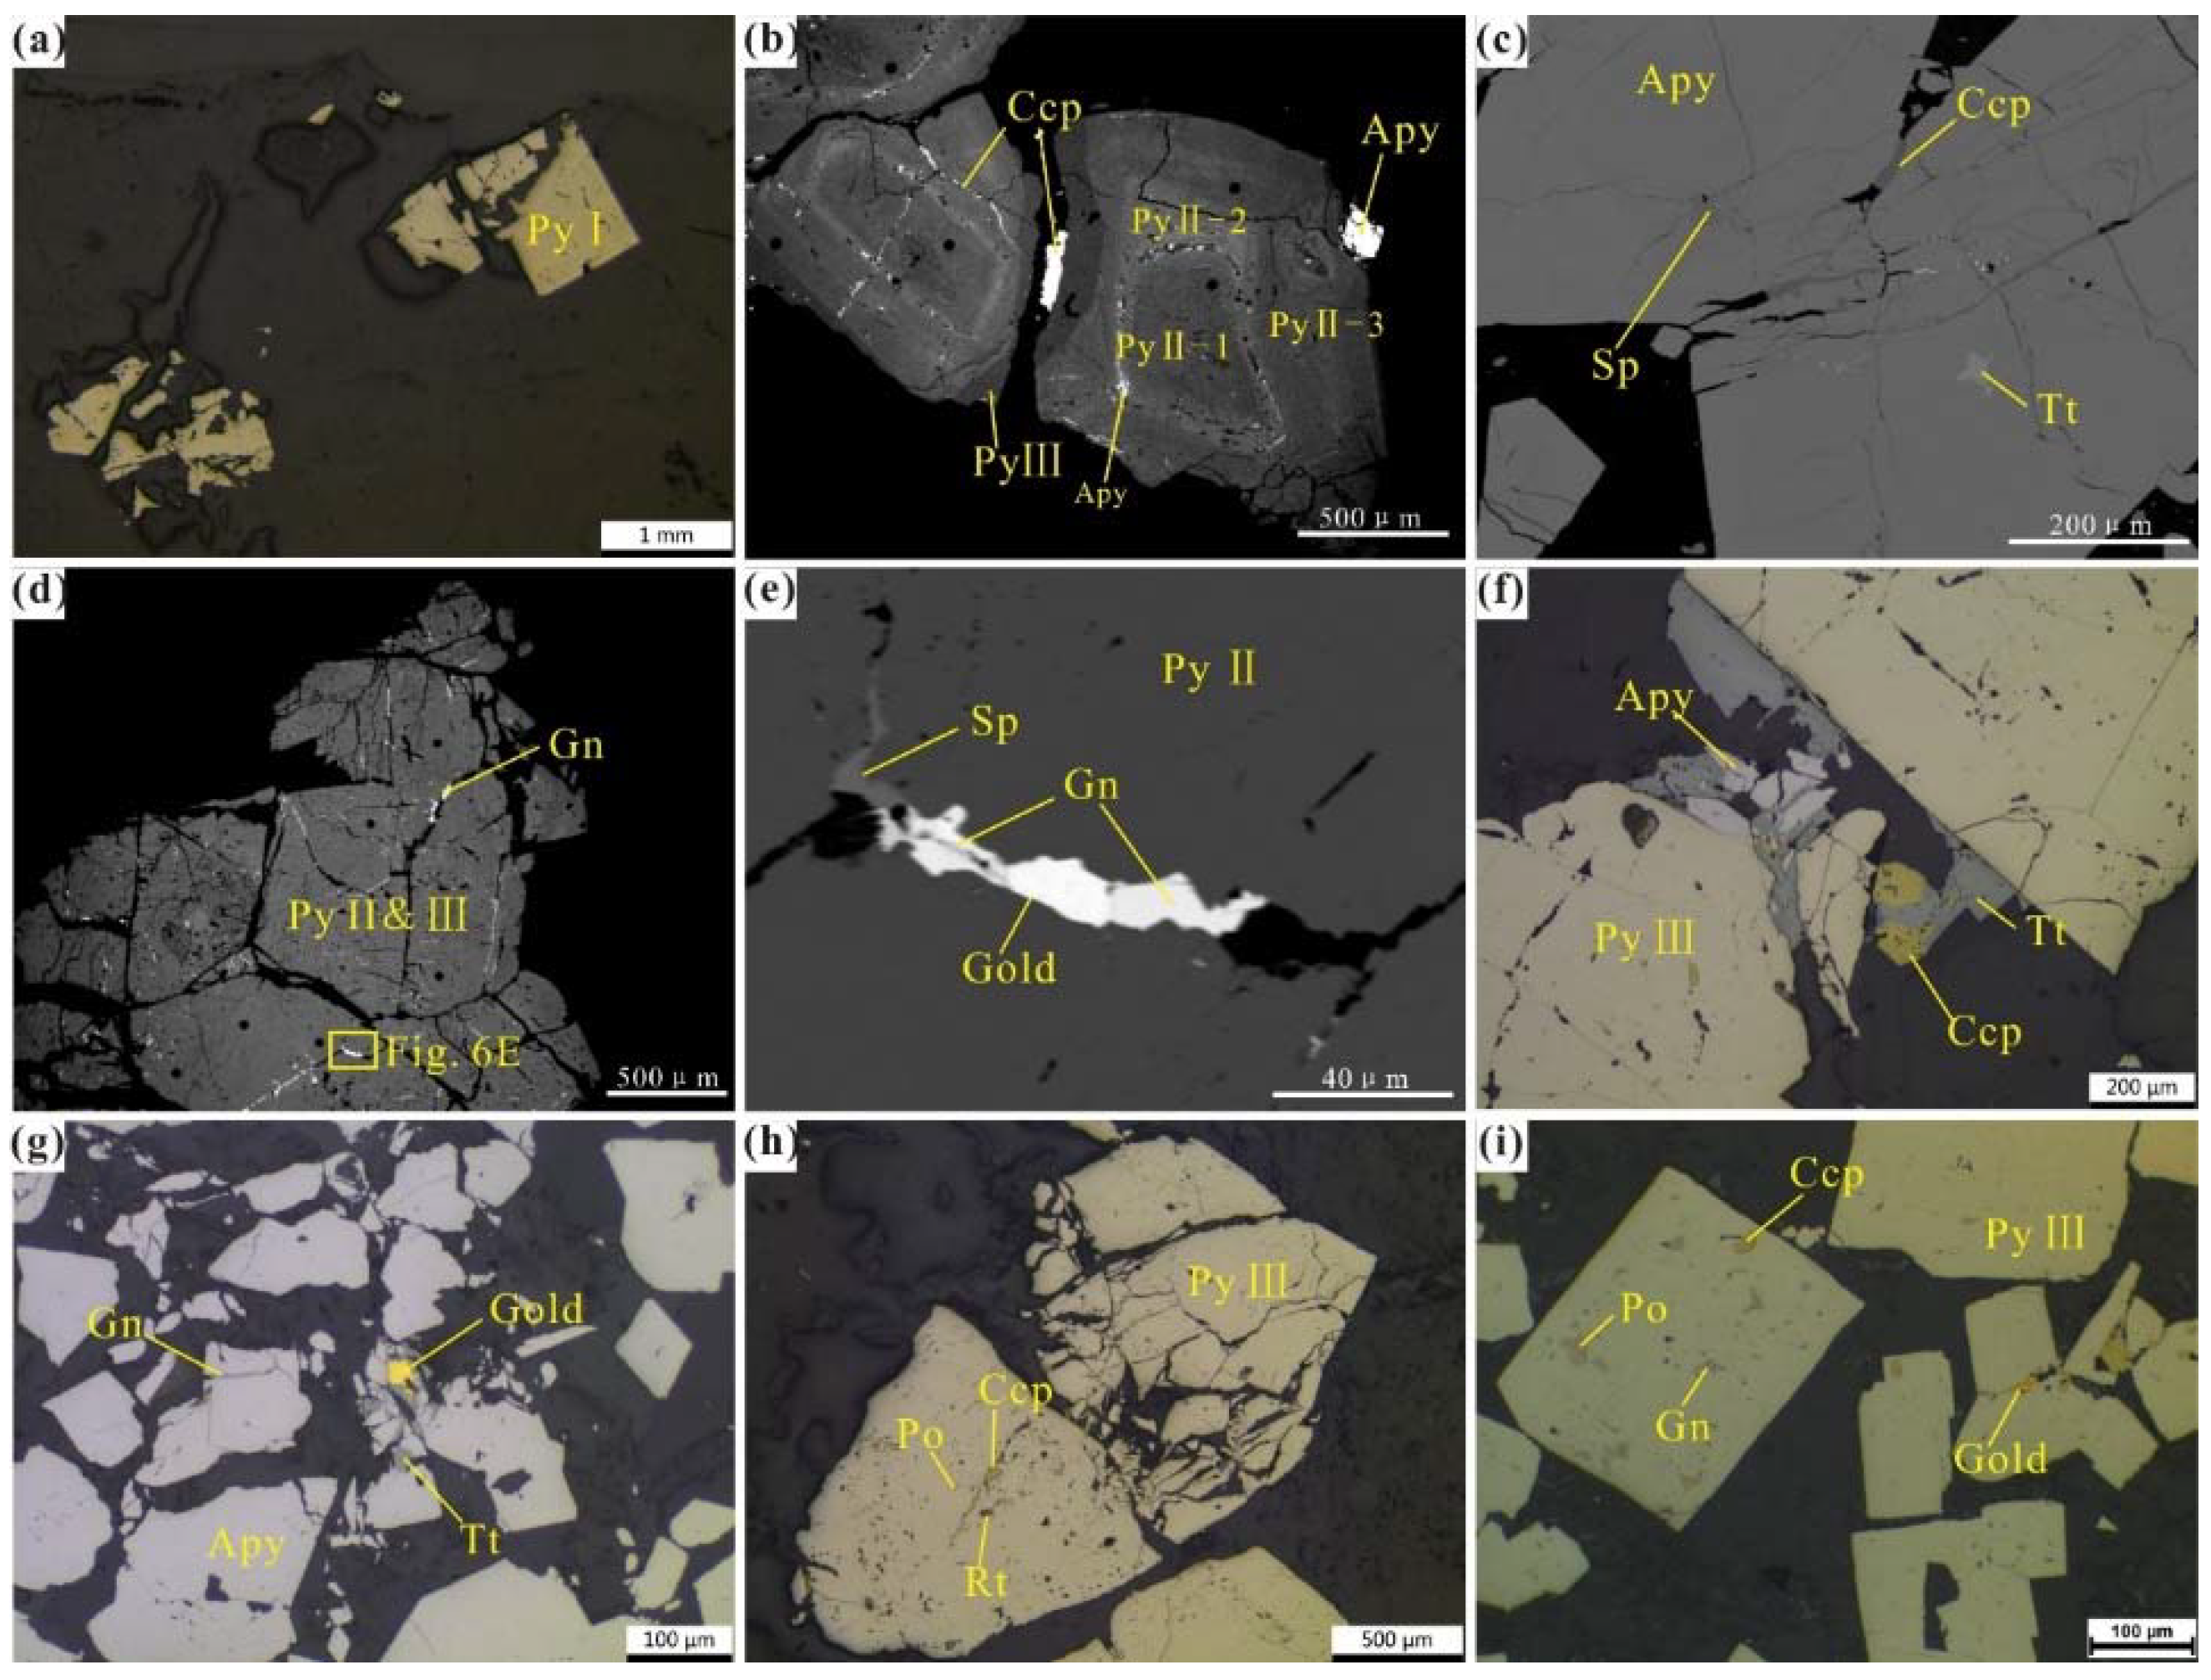
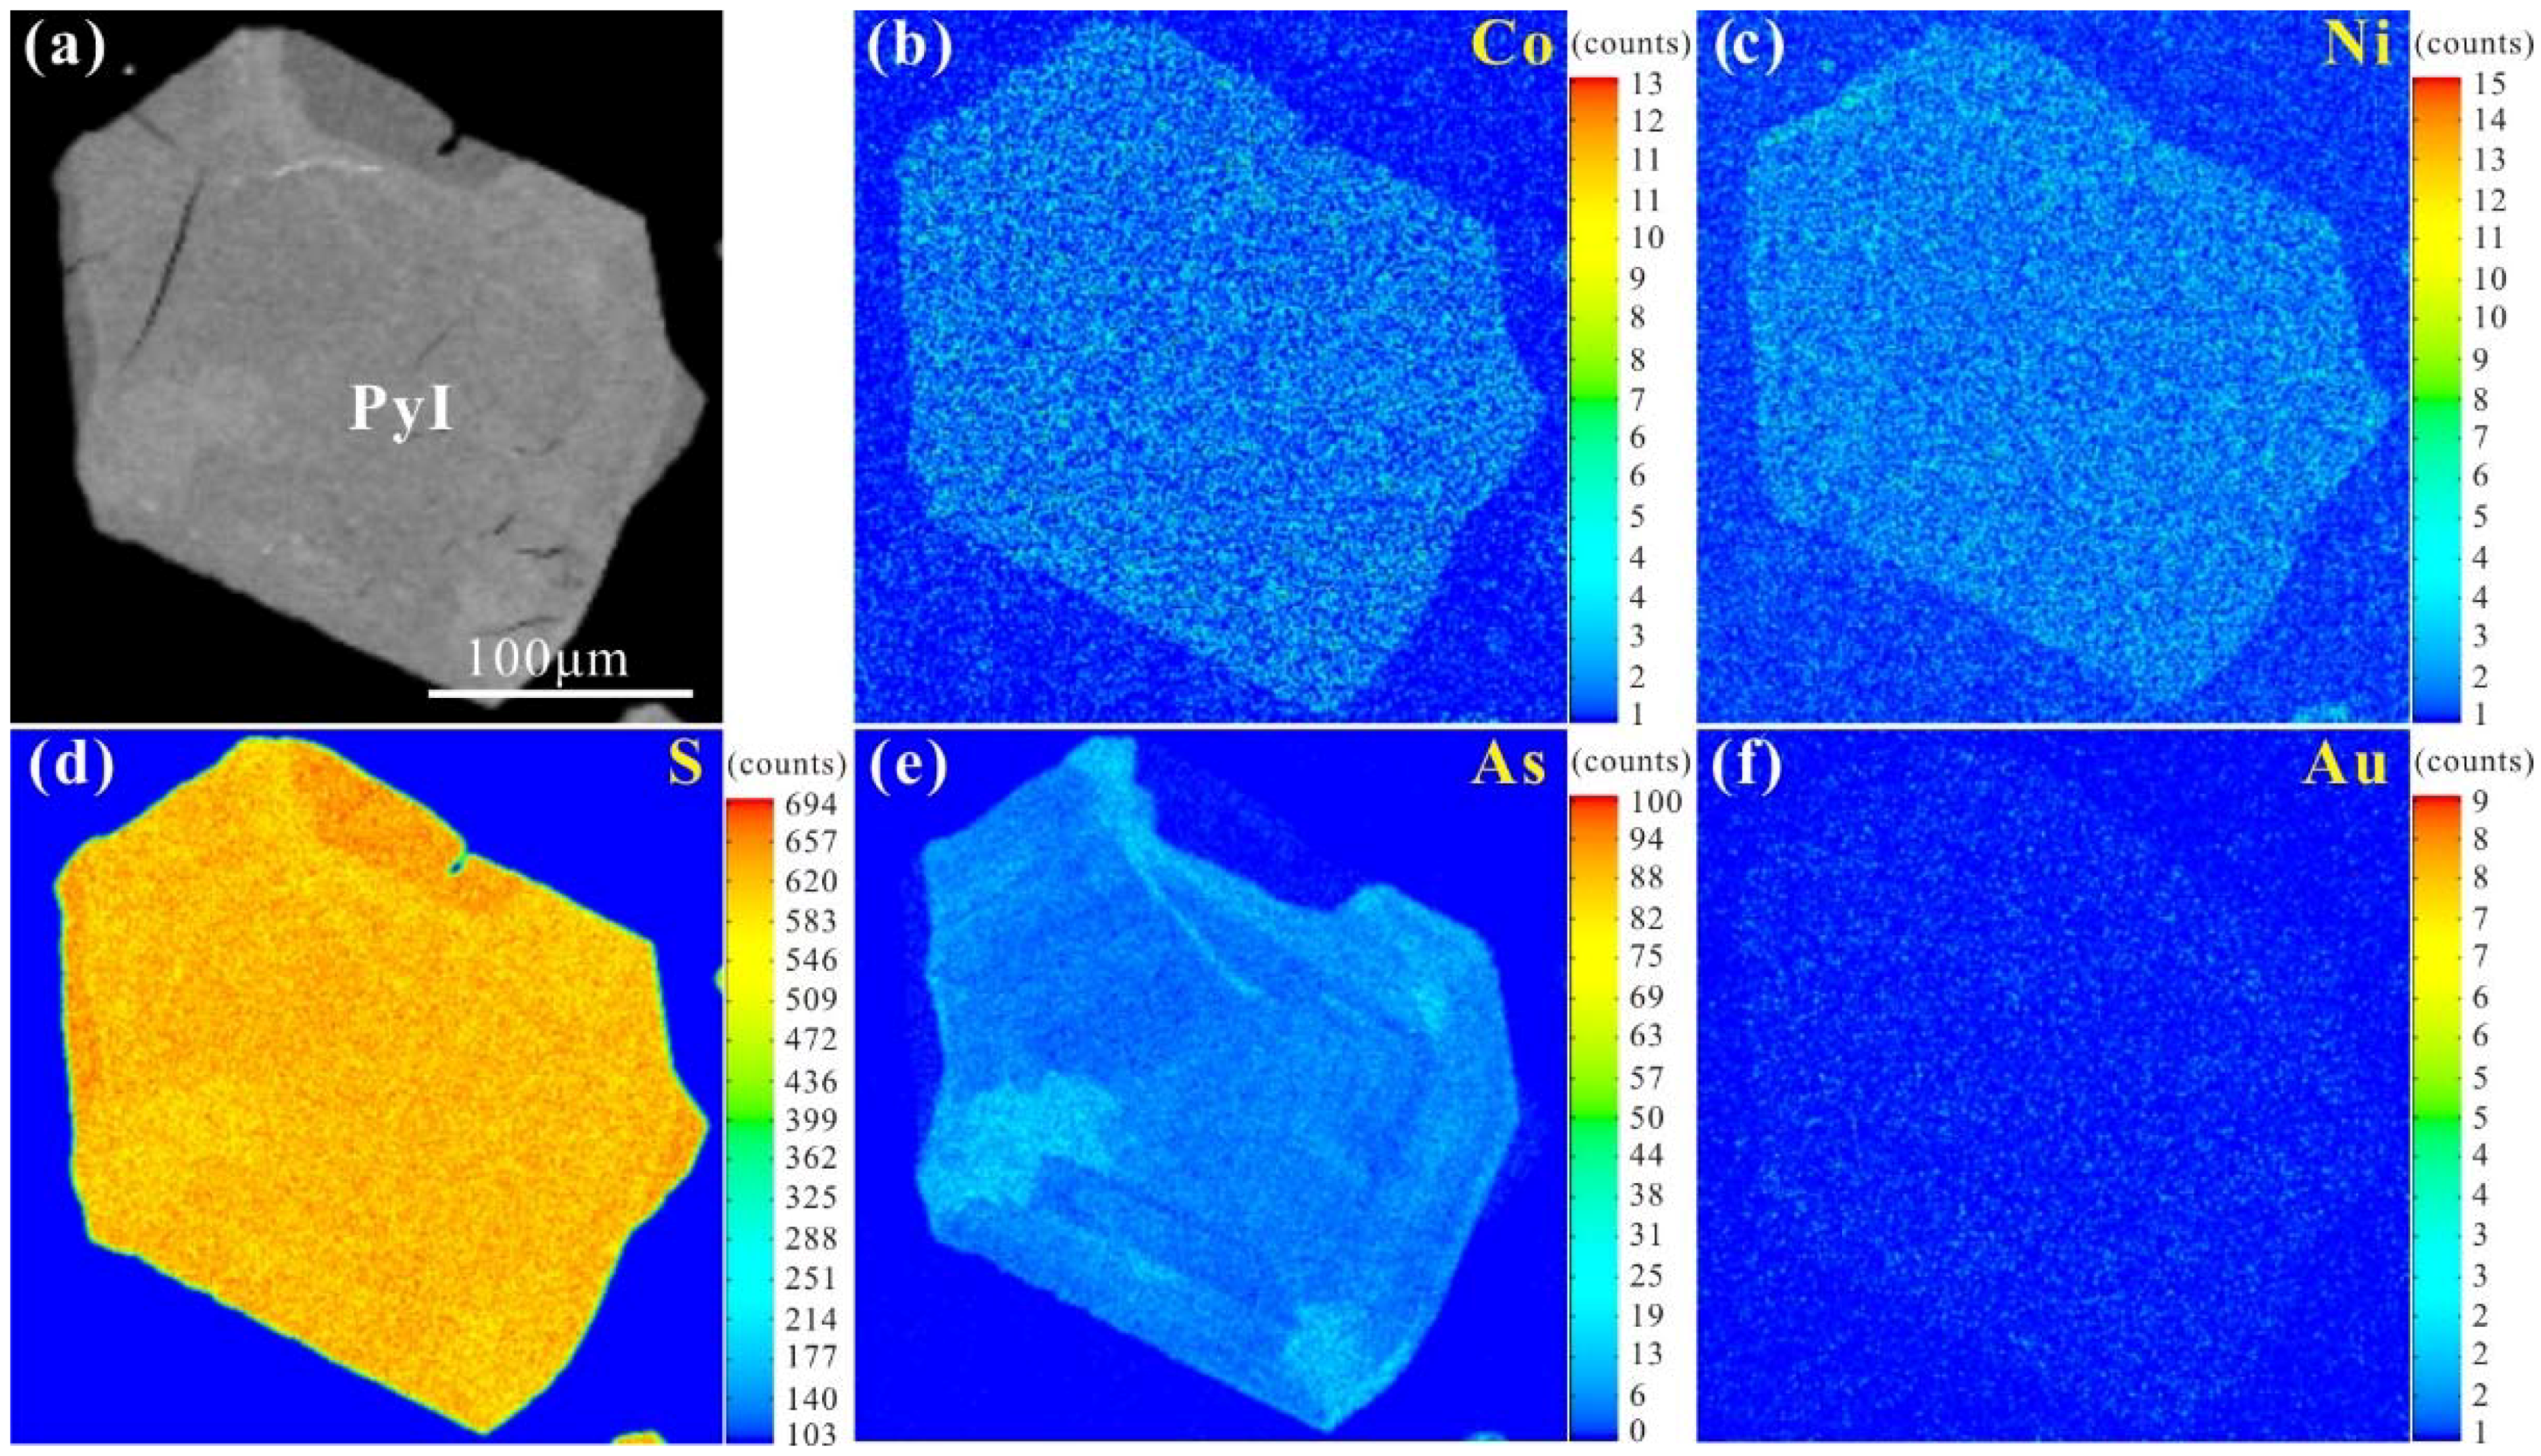
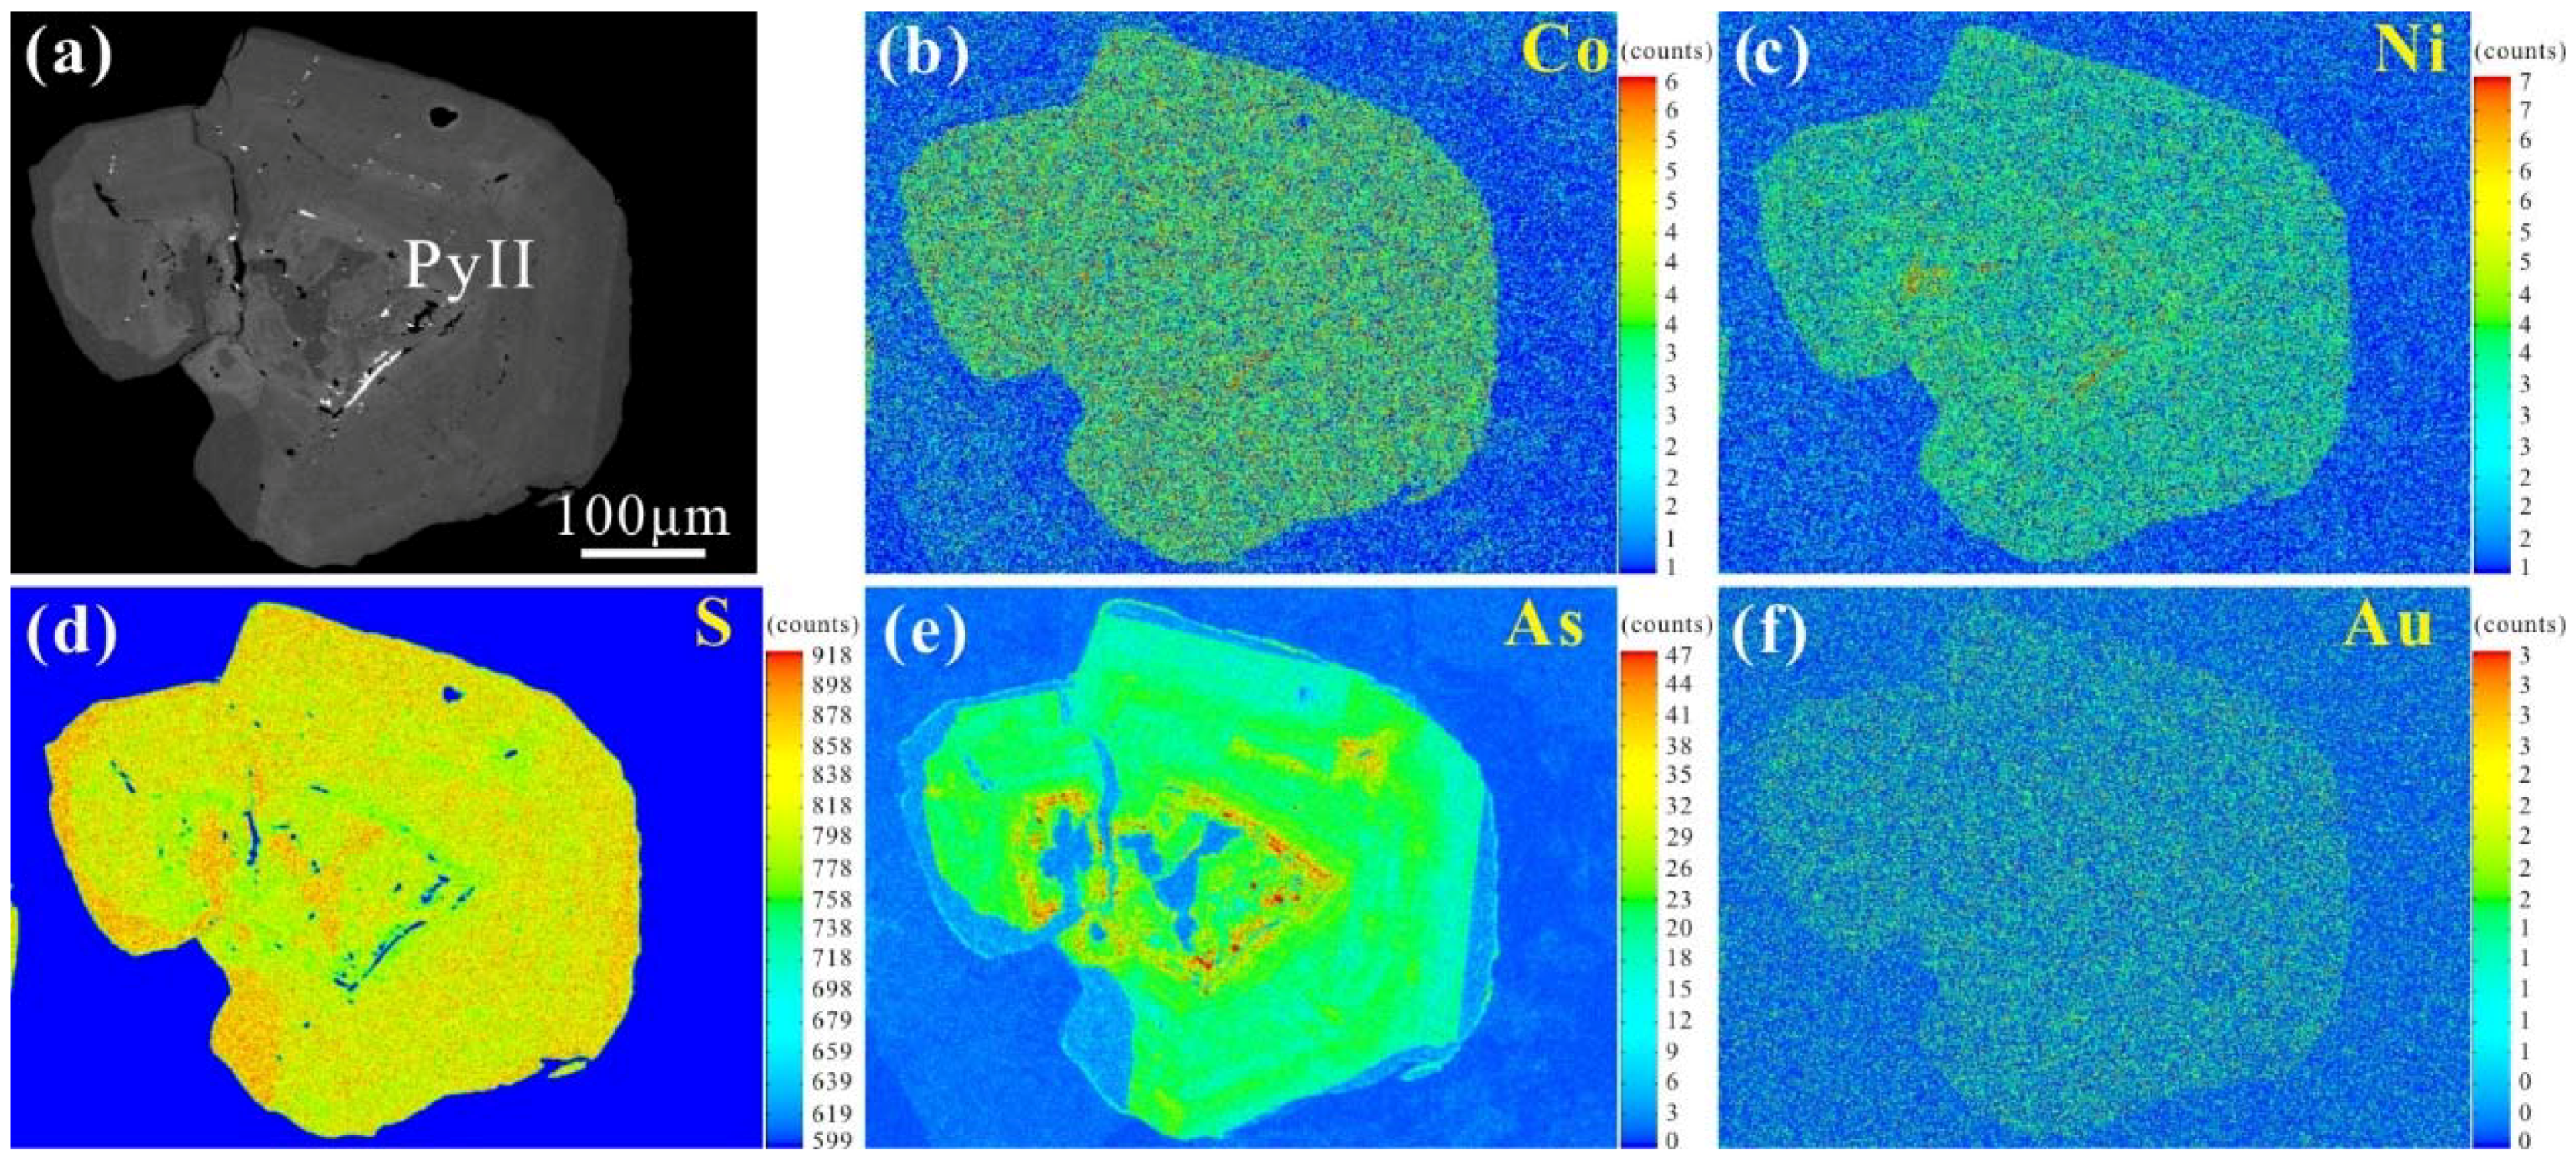
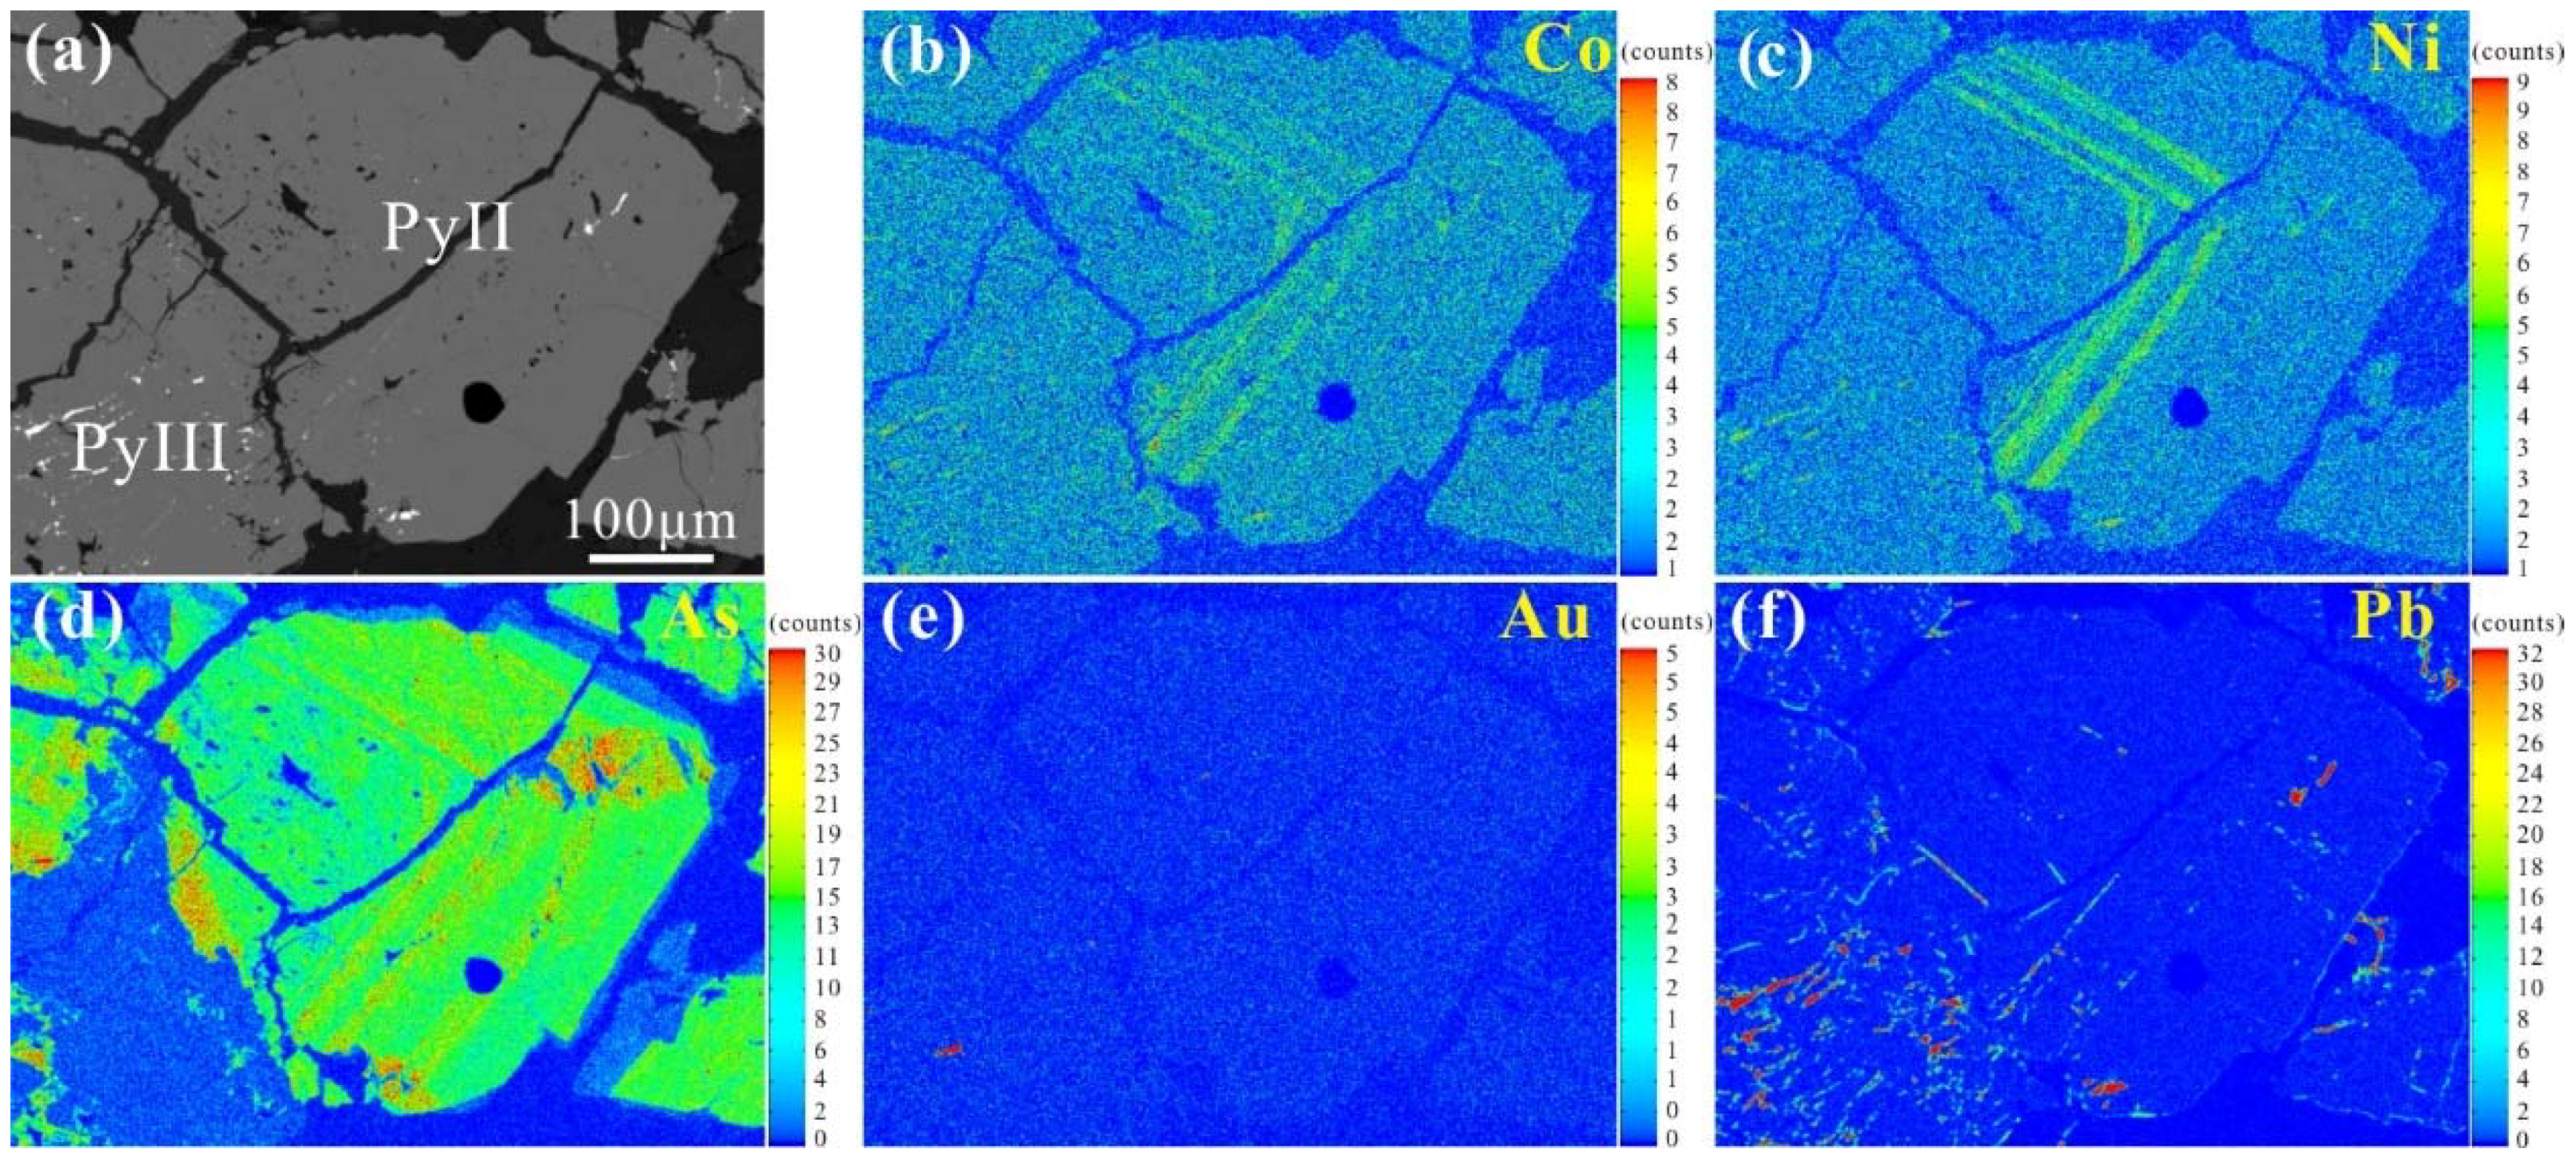
- Four stages and three generations of pyrite can be distinguished at Zhengchong. The earliest sulfide mineralization produced unzoned, trace element-poor pyrite (PyI). Significant amounts of oscillatory zoned and As-, Co-, and Ni-rich pyrite (PyII) formed coevally with arsenopyrite and tetrahedrite mineralization. PyII is overprinted by later hydrothermal fluids. Then, inclusion-rich PyIII precipitated in massive sulfide veins or veinlets. PyII and PyIII are arsenian pyrite and represent the main Au-bearing minerals.
- (2)
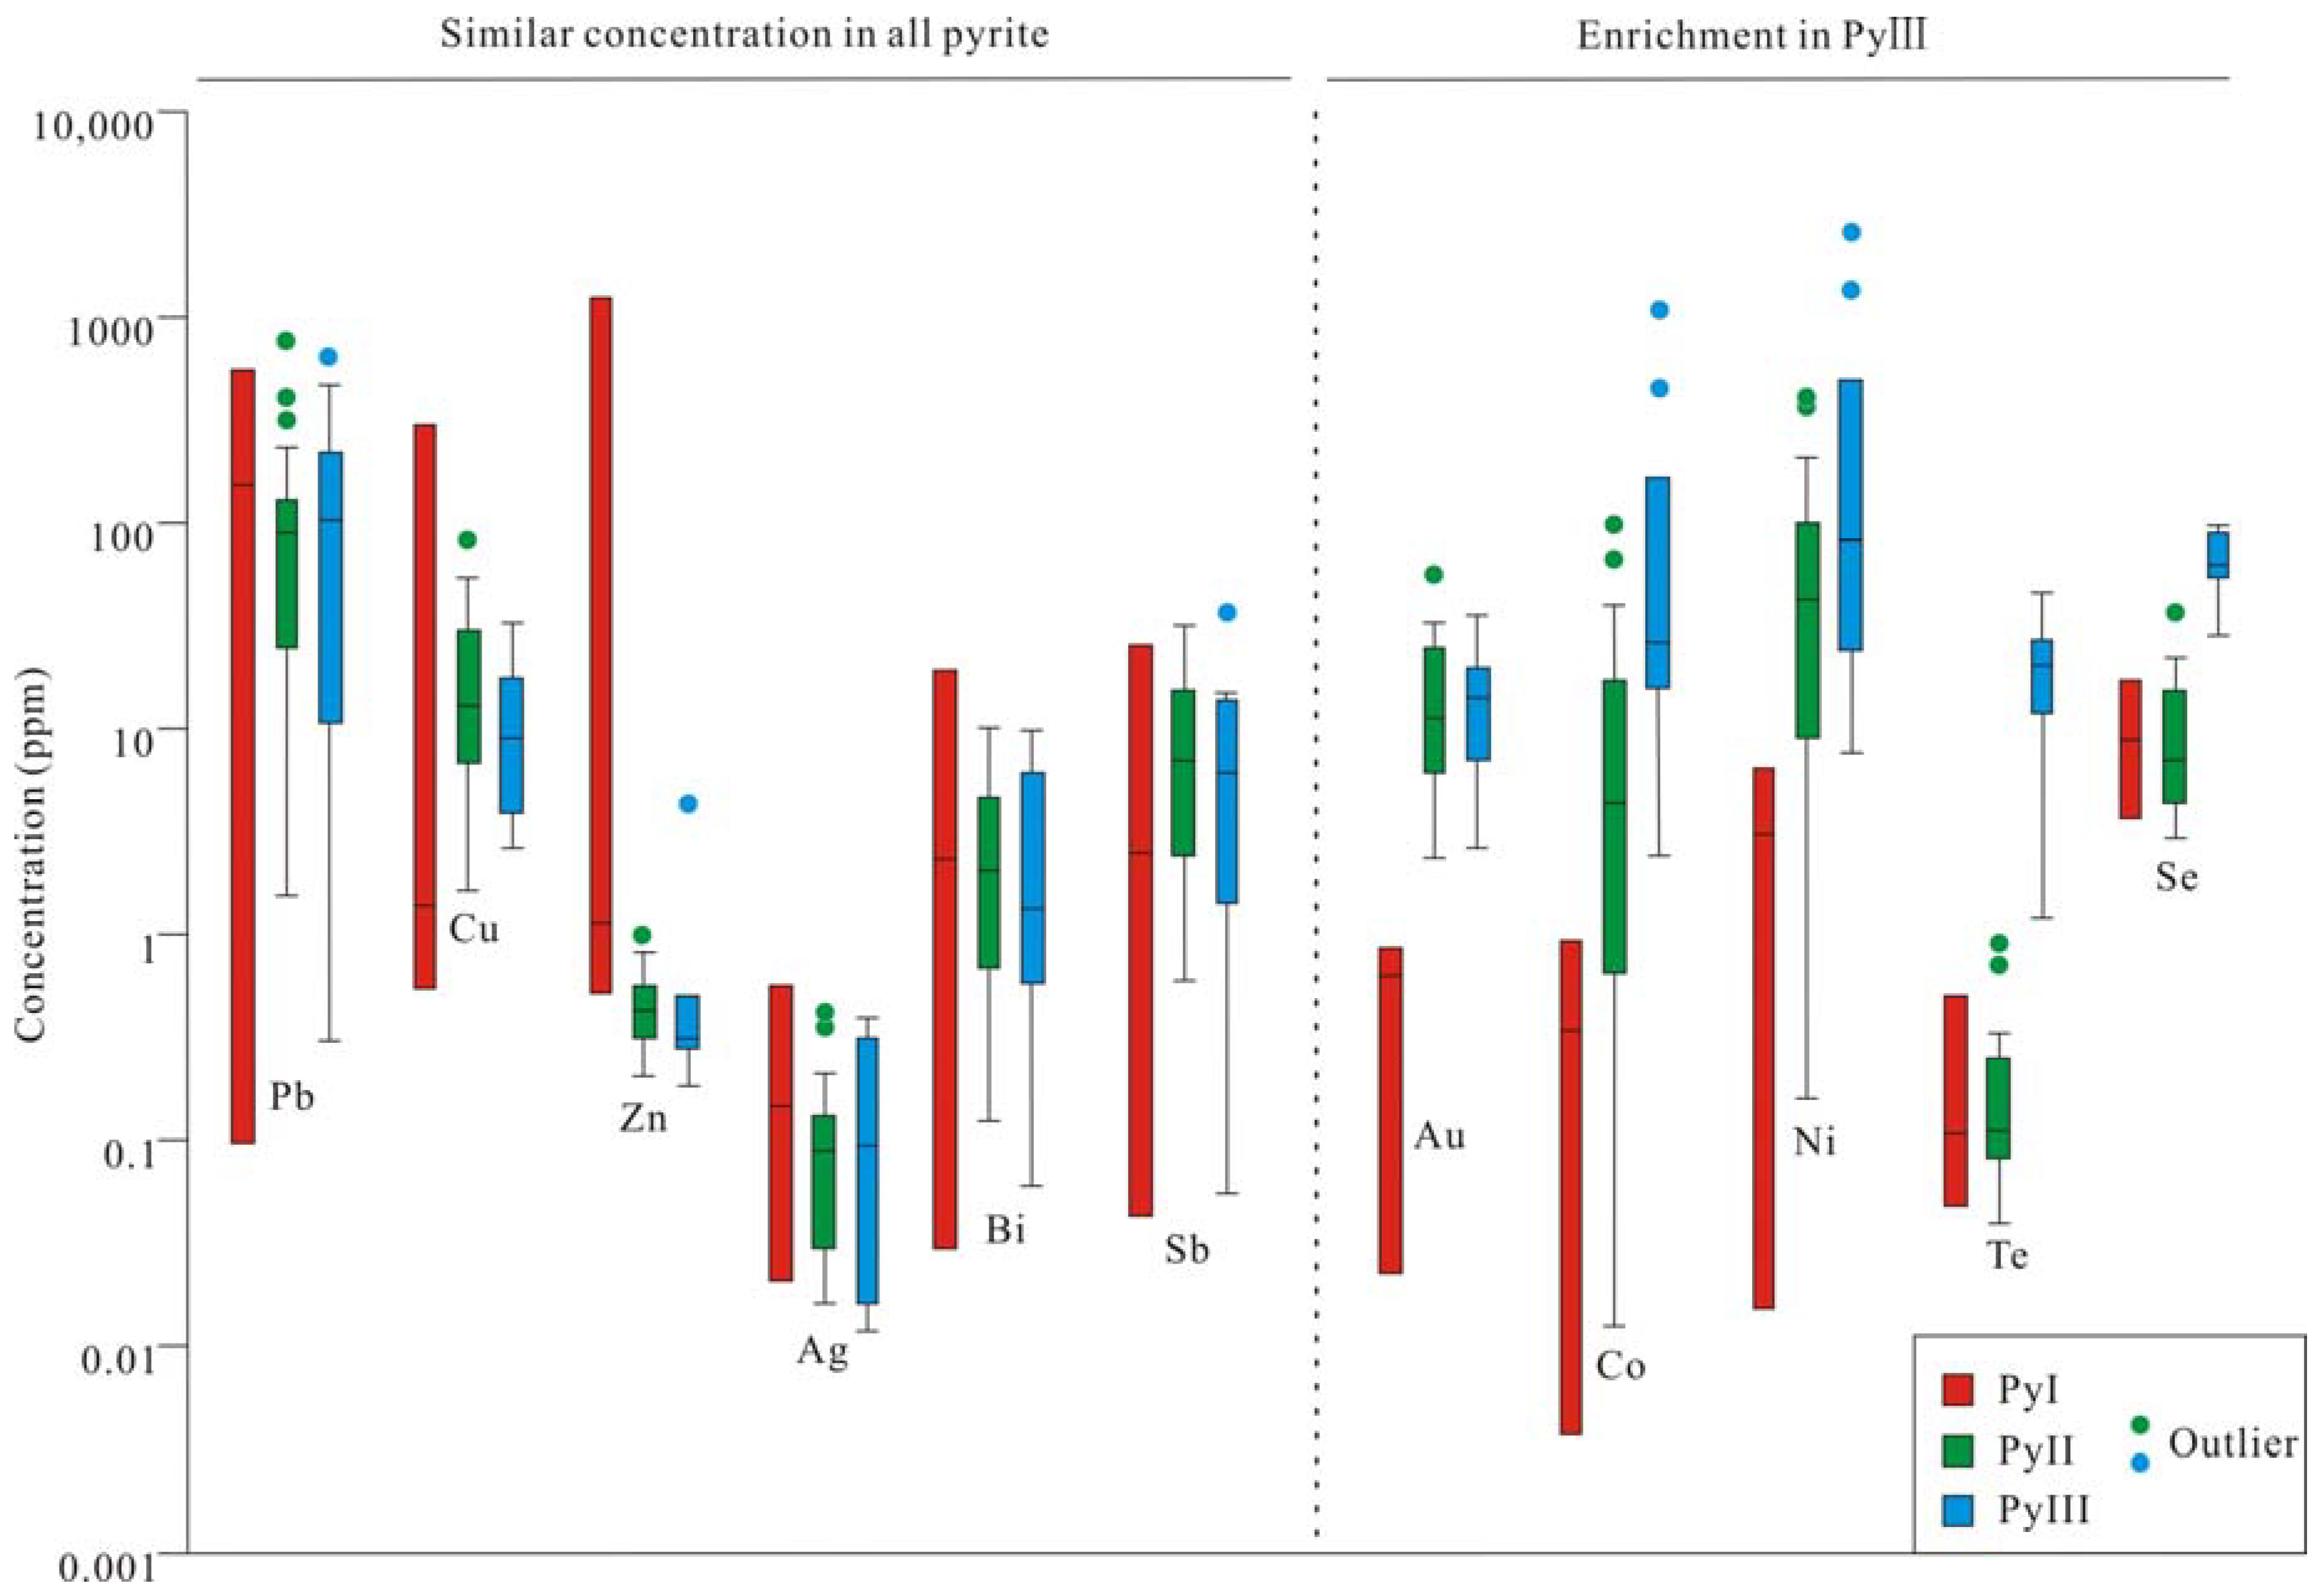
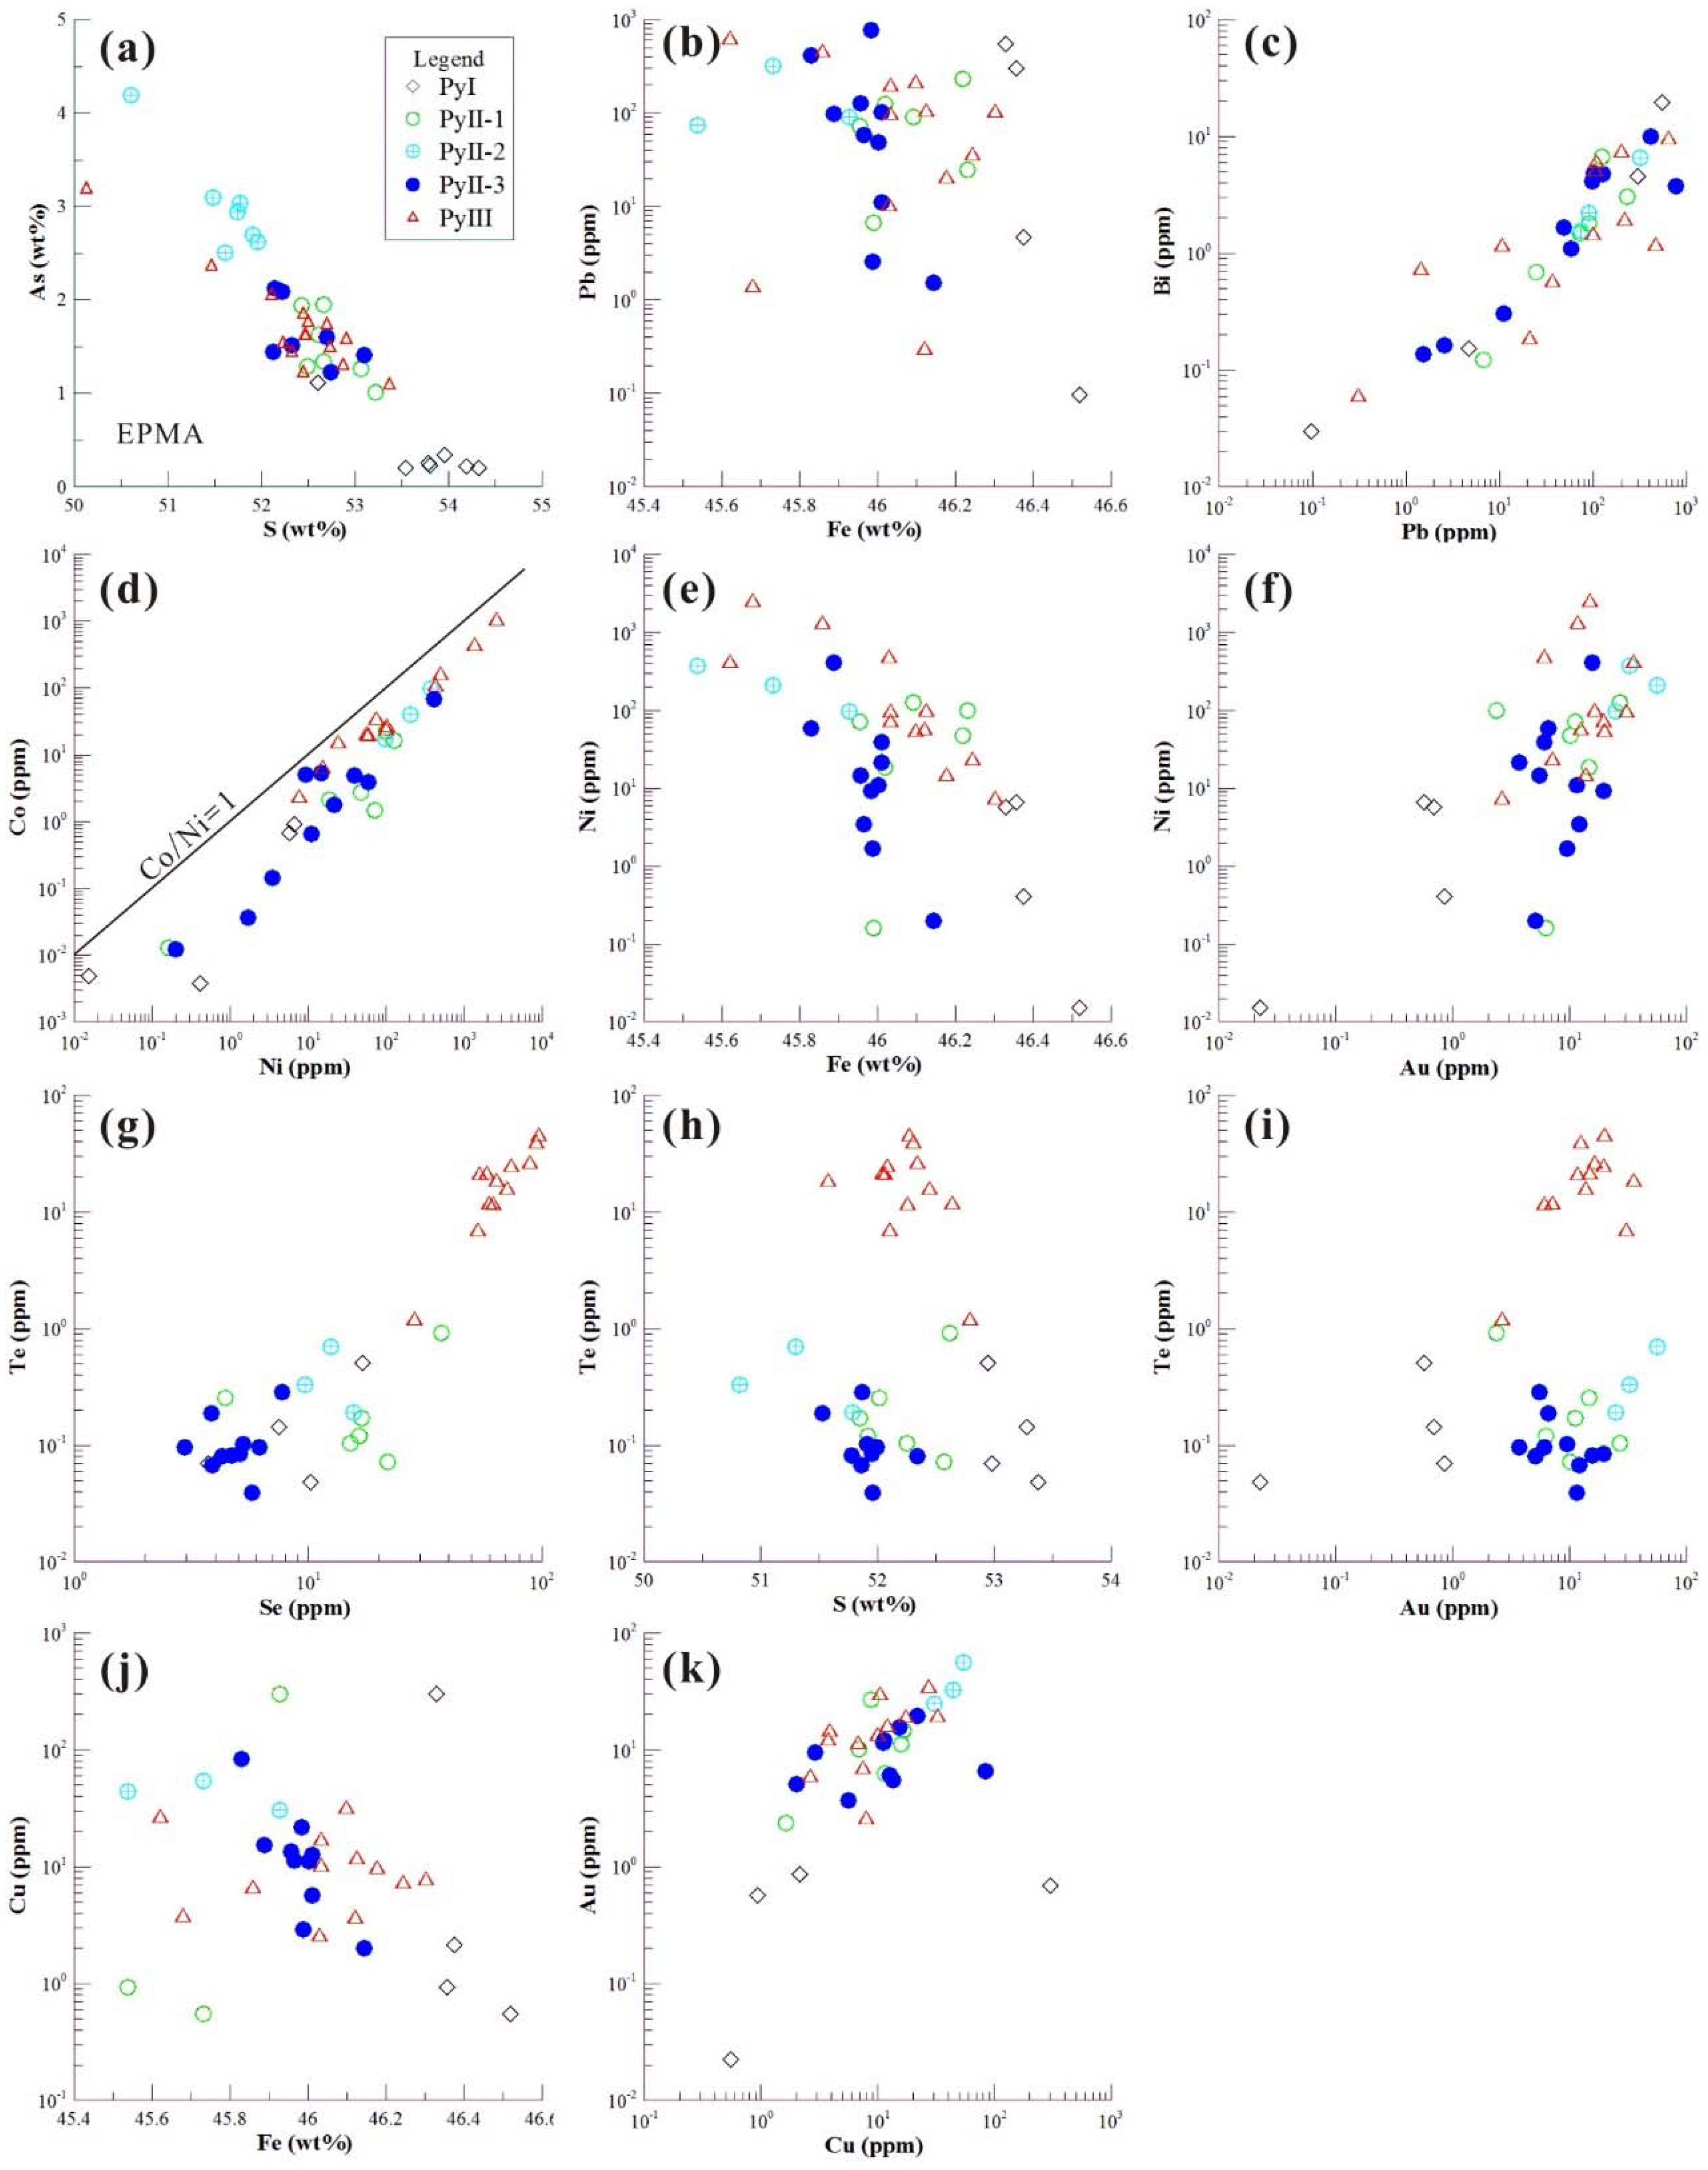
- PyI records the lowest concentrations of Au. PyII and PyIII have similar amounts of Au, Cu, Pb, Zn, and Bi, but PyIII is more enriched in Co, Ni, Te, and Se. The substitution of As, Se and Te for S and that of Co and Ni for Fe occurred by direct-ion exchange.
- (3)
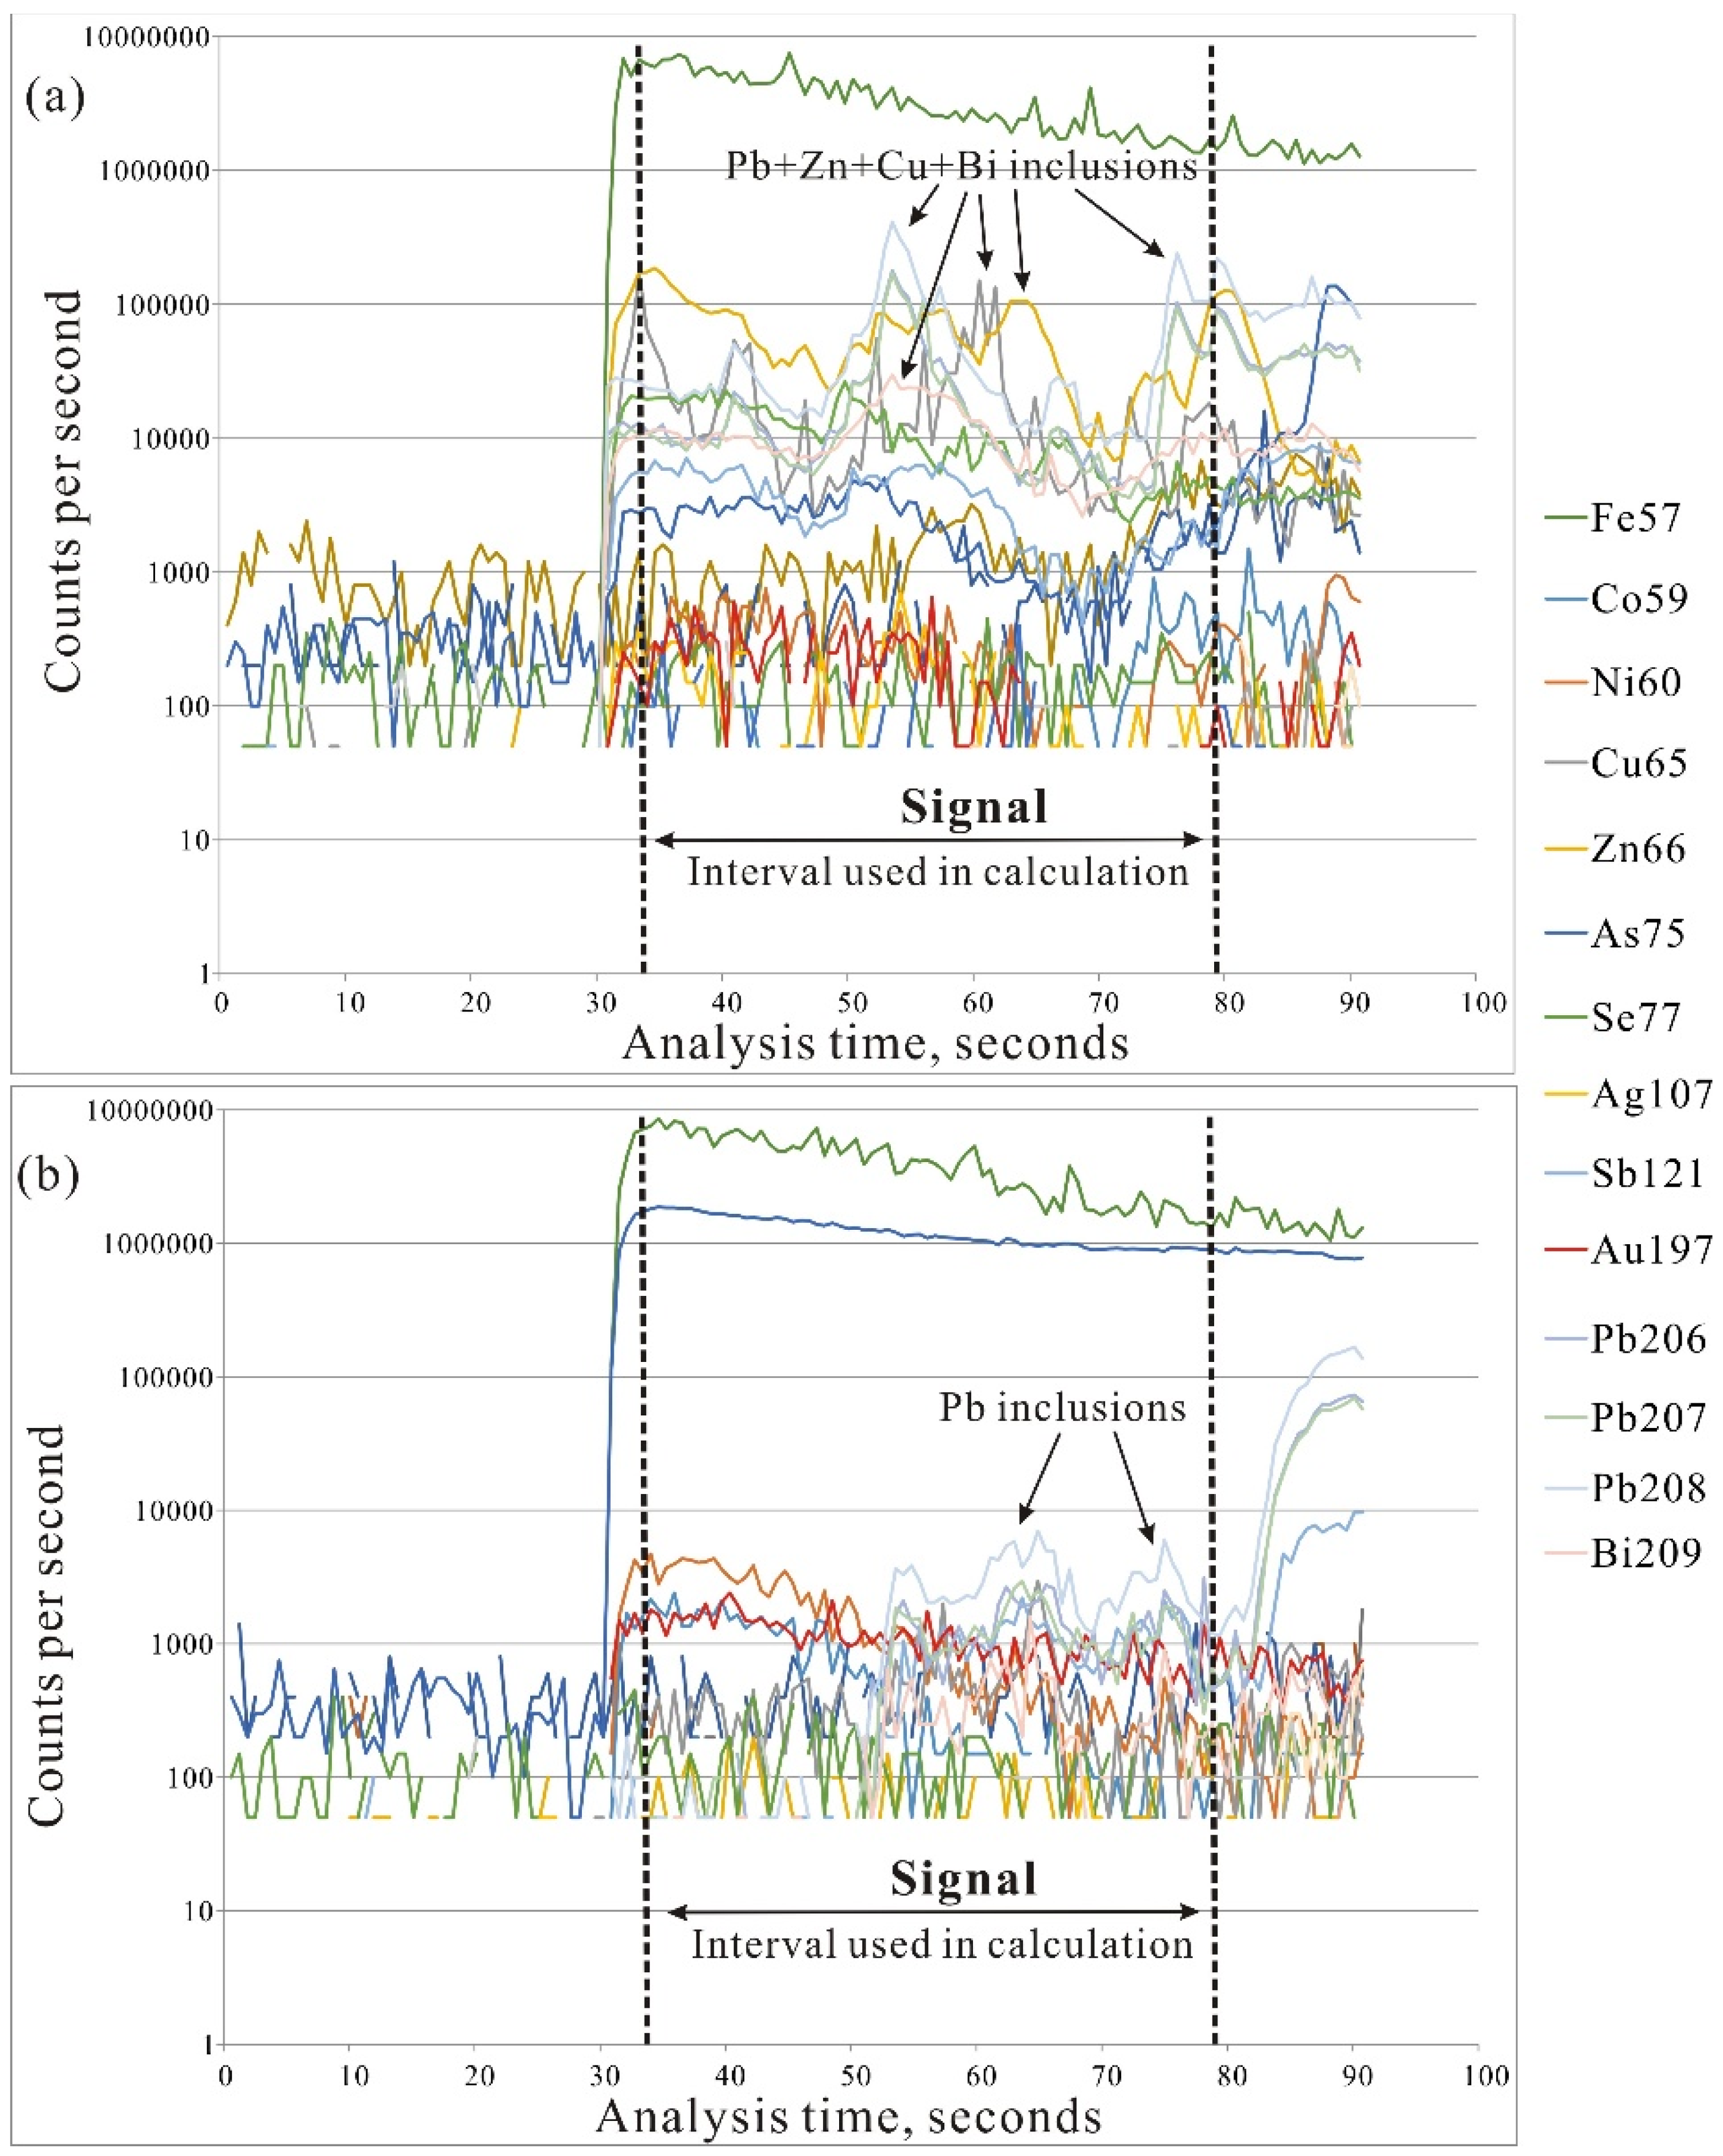
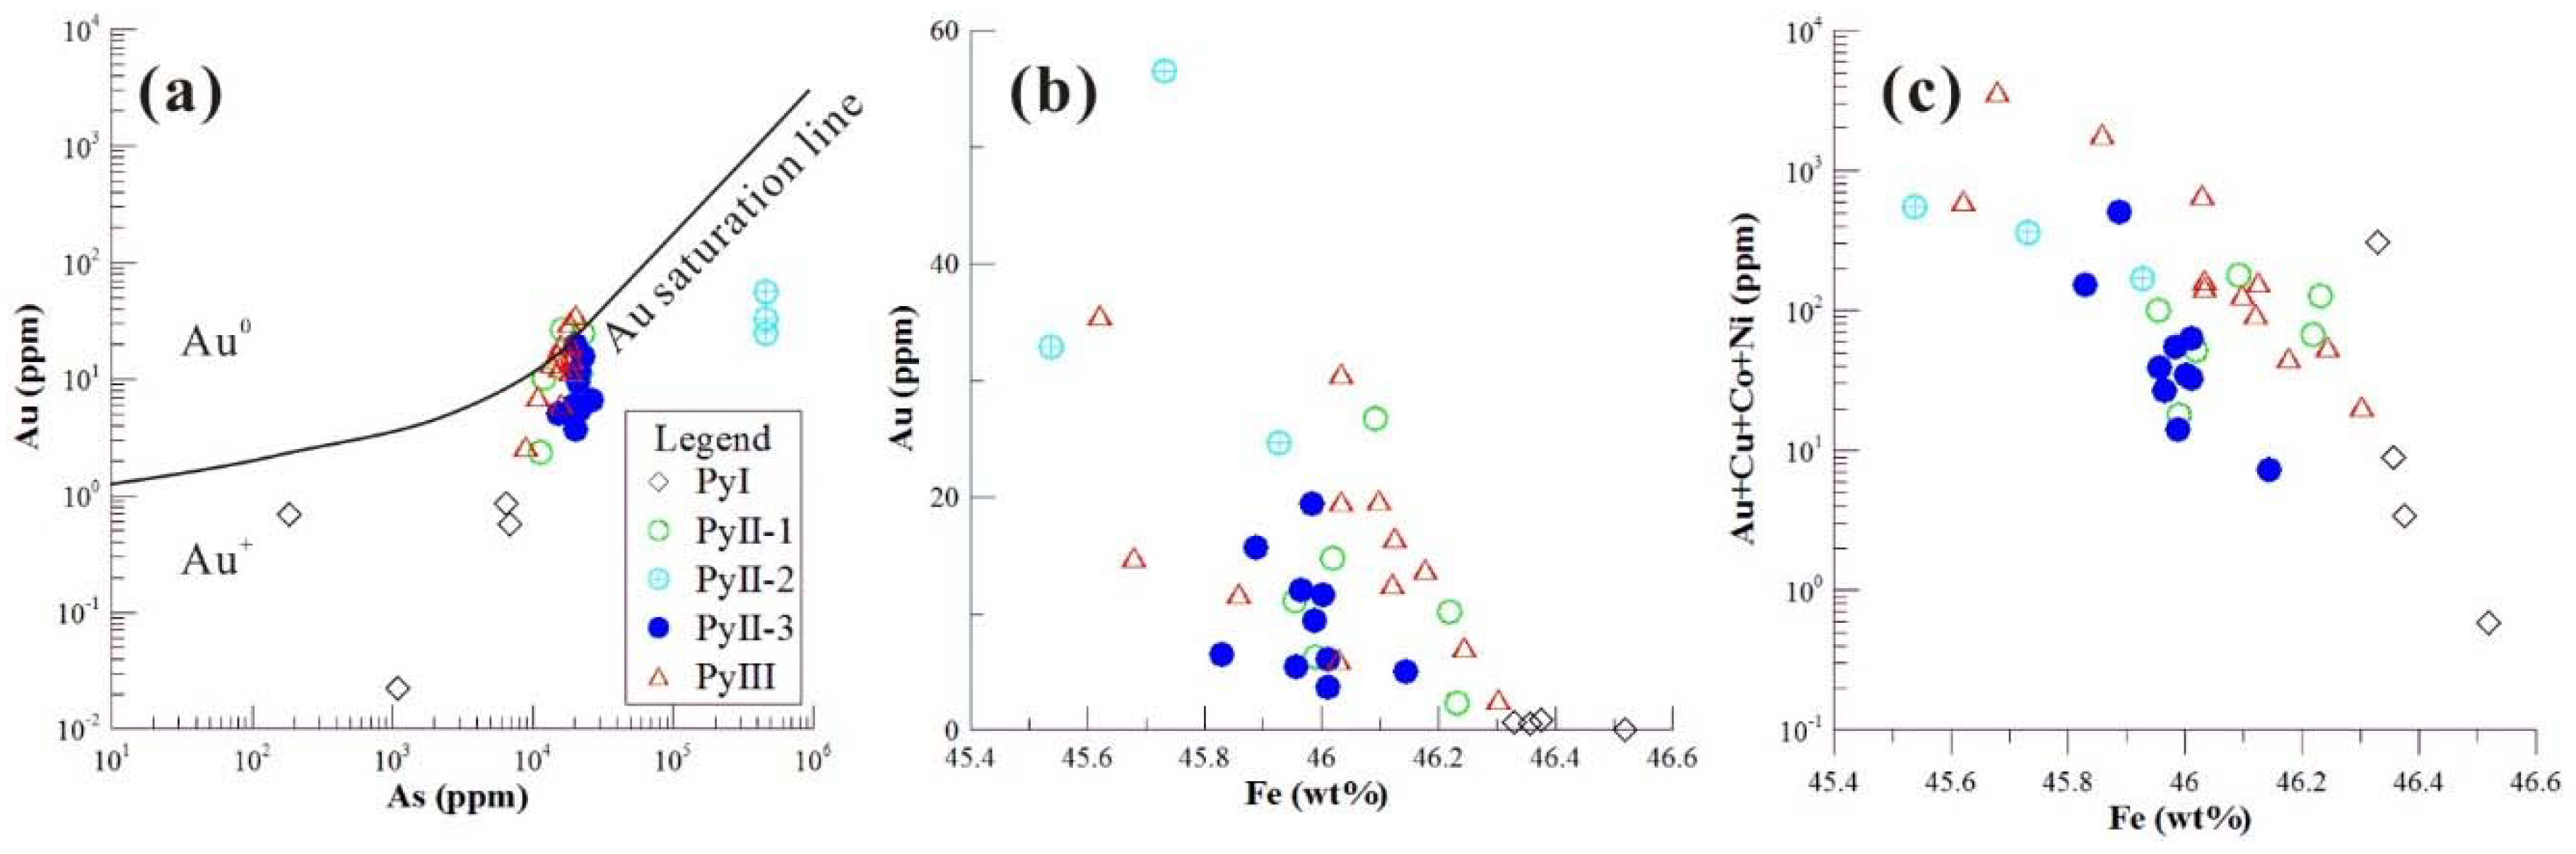
- The EPMA X-ray elemental maps and LA-ICP-MS point analyses show that invisible gold is uniformly distributed within the arsenian pyrite and that visible gold fills microfractures in PyII or occurs as inclusions in PyIII. Co, Ni, Cu exhibit positive correlations with Au and a negative correlation between Au + Cu + Co + Ni and Fe reflect that Fe vacancies may have been a major cause of the precipitation of invisible Au and other metal elements in pyrite structure.
- (4)
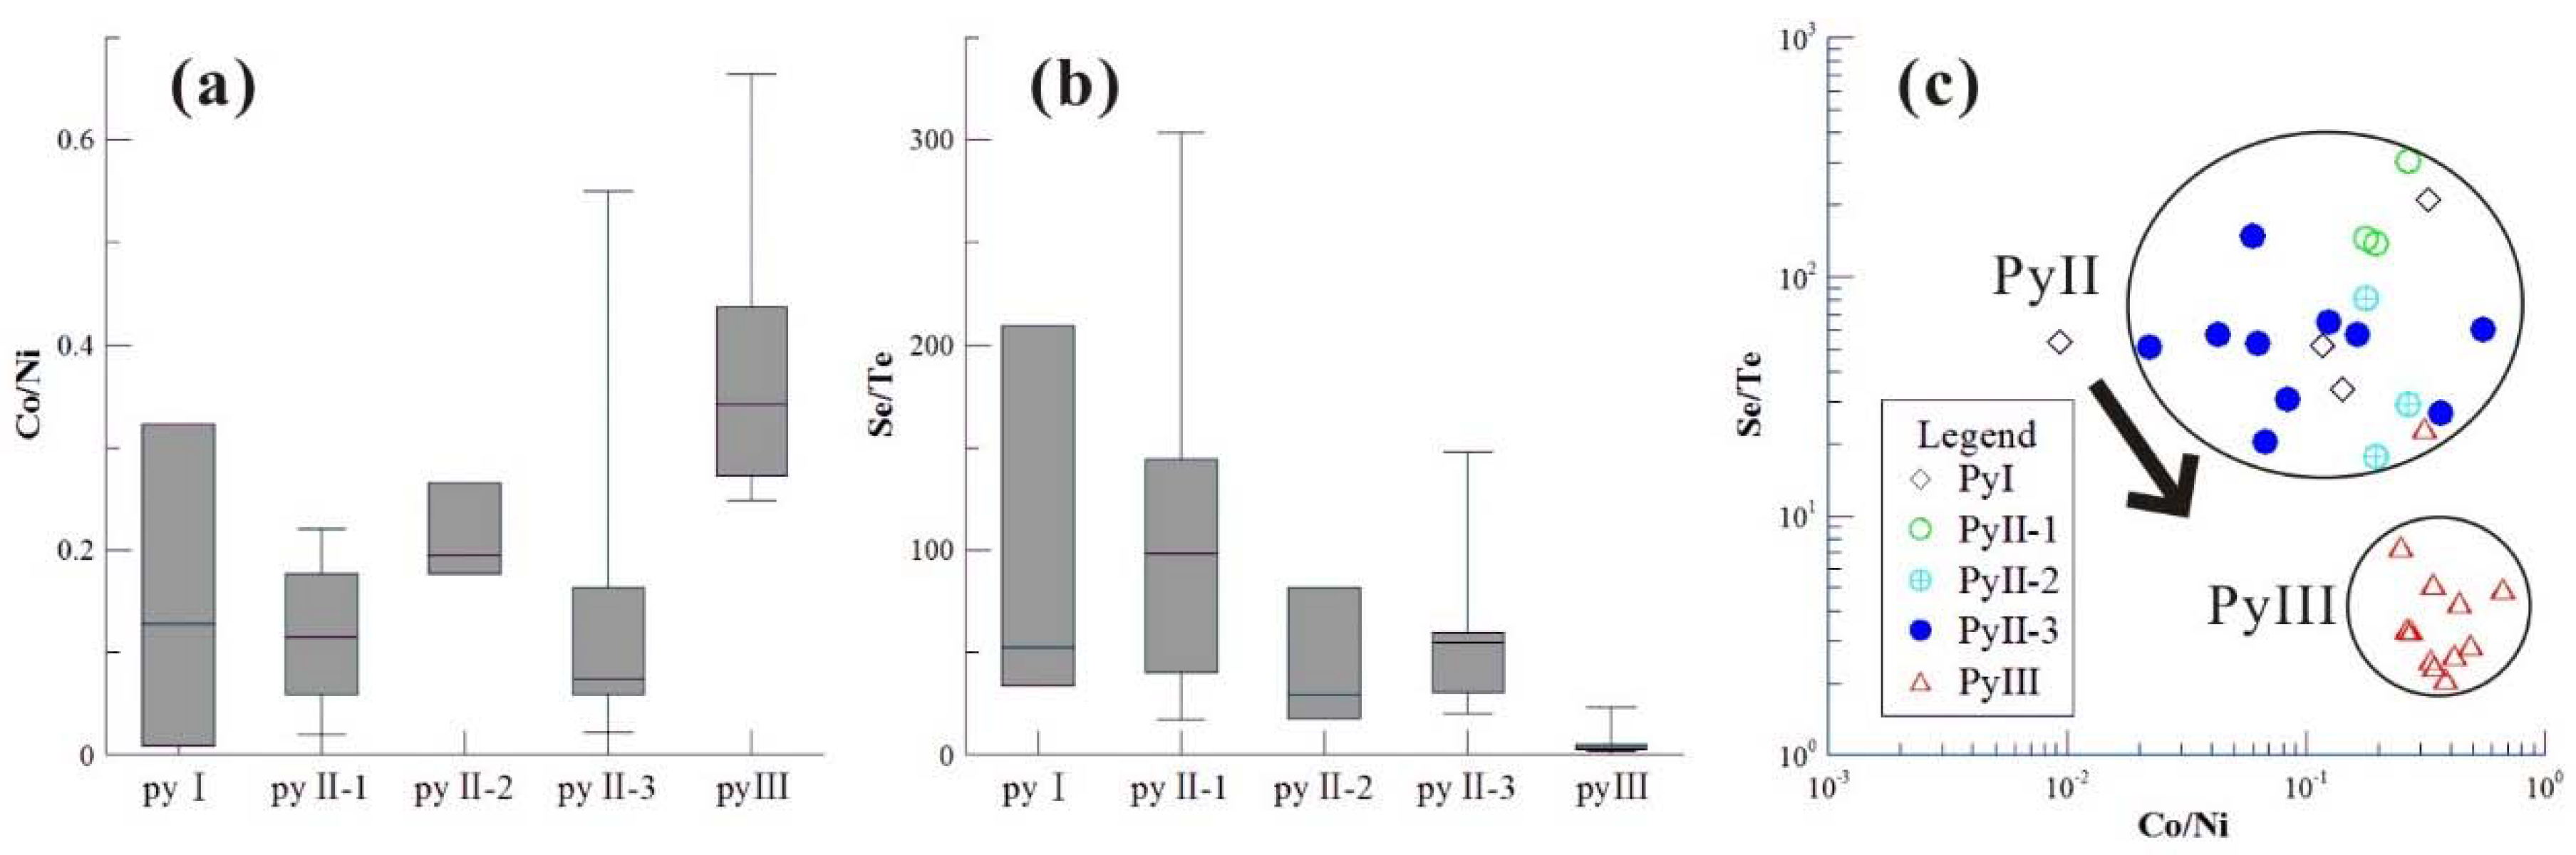
- There are systematic trace element differences between the three generations of pyrite (PyI, PyII, PyIII). The more Co, Ni and Se, Te substitutions that occurred for Fe and S, respectively, the greater the increase in the Co/Ni ratio (<1) and decrease in the Se/Te ratio (<10) in stage III, respectively, indicating that more reduced, lower-temperature metamorphic hydrothermal fluid was present in stage III.
Author Contributions
Funding
Acknowledgments
Conflicts of Interest
References
- Groves, D.I.; Goldfarb, R.J.; Gebre-Mariam, M.; Hagemann, S.G.; Robert, F. Orogenic gold deposits: A proposed classification in the context of their crustal distribution and relationship to other gold deposit types. Ore Geol. Rev. 1998, 13, 7–27. [Google Scholar] [CrossRef]
- Lang, J.R.; Baker, T. Intrusion-related gold systems: The present level of understanding. Miner. Depos. 2001, 36, 477–489. [Google Scholar] [CrossRef]
- Groves, D.I.; Goldfarb, R.J.; Robert, F.; Hart, C.J.R. Gold Deposits in Metamorphic Belts: Overview of Current Understanding, Outstanding problems, future research, and exploration signifcance. Econ. Geol. 2003, 98, 1–29. [Google Scholar]
- Groves, D.I.; Vielreicher, R.M.; Goldfarb, R.J.; Condie, K.C. Controls on the heterogeneous distribution of mineral deposits through time. Geol. Soc. Lond. Spec. Publ. 2005, 248, 11–14. [Google Scholar] [CrossRef]
- Goldfarb, R.J.; Groves, D.I.; Gardoll, S. Orogenic gold and geologic time: A global synthesis. Ore Geol. Rev. 2001, 18, 1–75. [Google Scholar] [CrossRef]
- Hart, C.J. Reduced Intrusion-related Gold Systems. In Mineral Deposits of Canada: A Synthesis of Major Deposit-Types, District Metallogeny, the Evolution of Geological Provinces, and Exploration Methods; Goodfellow, W.D., Ed.; Geological Association of Canada, Mineral Deposits Division: St. John’s, NL, Canada, 2007; pp. 95–112. [Google Scholar]
- Phillips, G.N.; Powell, R. Formation of gold deposits: Review and evaluation of the continuum model. Earth-Sci. Rev. 2009, 94, 1–21. [Google Scholar] [CrossRef]
- Tomkins, A.G. On the source of orogenic gold. Geology 2013, 41, 1255–1256. [Google Scholar] [CrossRef] [Green Version]
- Micklethwaite, S.; Cox, S.F. Progressive fault triggering and fluid flow in aftershock domains: Examples from mineralized Archaean fault systems. Earth Planet. Sci. Lett. 2006, 250, 318–330. [Google Scholar] [CrossRef]
- Weatherley, D.K.; Henley, R.W. Flash vaporization during earthquakes evidenced by gold deposits. Nat. Geosci. 2013, 6, 294–298. [Google Scholar] [CrossRef]
- Stefánsson, A.; Seward, T.M. Gold(I) complexing in aqueous sulphide solutions to 500 °C at 500 bar. Geochim. Cosmochim. Acta 2004, 68, 4121–4143. [Google Scholar] [CrossRef]
- Goryachev, N.A.; Pirajno, F. Gold deposits and gold metallogeny of Far East Russia. Ore Geol. Rev. 2014, 59, 123–151. [Google Scholar] [CrossRef]
- Molnár, F.; Mänttäri, I.; O’Brien, H.; Lahaye, Y.; Pakkanen, L.; Bo, J.; Käpyaho, A.; Sorjonen-Ward, P.; Whitehouse, M.; Sakellaris, G. Boron, sulphur and copper isotope systematics in the orogenic gold deposits of the Archaean Hattu schist belt, eastern Finland. Ore Geol. Rev. 2016, 77, 133–162. [Google Scholar] [CrossRef]
- Harlan, S.S.; Vielreicher, R.M.; Mortensen, J.M.; Bradley, D.C.; Goldfarb, R.J.; Snee, L.W.; Till, A.B. Geology and timing of ore formation in the willow creek gold district, Talkeetna mountains, Southern Alaska. Econ. Geol. 2017, 112, 1177–1204. [Google Scholar] [CrossRef]
- Craig, J.R.; Vokes, F.M.; Solberg, T.N. Pyrite: Physical and chemical textures. Miner. Depos. 1998, 34, 82–101. [Google Scholar] [CrossRef]
- Cook, N.J.; Ciobanu, C.L.; Spry, P.G.; Voudouris, P.; Ofigcp, T.P. Understanding gold-(silver)–telluride-(selenide) mineral deposits. Episodes 2009, 32, 249–263. [Google Scholar]
- Zhao, H.X.; Frimmel, H.E.; Jiang, S.Y.; Dai, B.Z. LA-ICP-MS trace element analysis of pyrite from the Xiaoqinling gold district, China: Implications for ore genesis. Ore Geol. Rev. 2011, 43, 142–153. [Google Scholar] [CrossRef]
- Zhang, J.; Deng, J.; Chen, H.Y.; Yang, L.Q.; Cooke, D.; Danyushevsky, L.; Gong, Q.J. LA-ICP-MS trace element analysis of pyrite from the Chang’an gold deposit, Sanjiang region, China: Implication for ore-forming process. Gondwana Res. 2014, 26, 557–575. [Google Scholar] [CrossRef]
- Fleet, M.E.; Chryssoulis, S.L.; Davidson, R.; Weisener, C.G.; Maclean, P.J. Arsenian pyrite from gold deposits: Au and as distribution investigated by SIMS and EPM, and color staining and surface oxidation by XPS and LIMS. Can. Mineral. 1993, 31, 1–17. [Google Scholar]
- Agangi, A.; Axel, H.; Sser, W.U. Pyrite Zoning as a Record of Mineralization in the Ventersdorp Contact Reef, Witwatersrand Basin, South Africa. Econ. Geol. 2013, 108, 1243–1273. [Google Scholar] [CrossRef]
- Mumin, A.H.; Fleet, M.E.; Chryssoulis, S.L. Gold mineralization in As-rich mesothermal gold ores of the Bogosu-Prestea mining district of the Ashanti Gold Belt, Ghana: Remobilization of “invisible” gold. Miner. Depos. 1994, 29, 445–460. [Google Scholar] [CrossRef]
- Zhu, Y.F.; Fang, A.; Tan, J.J. Geochemistry of hydrothermal gold deposits: A review. Geosci. Front. 2011, 02, 367–374. [Google Scholar] [CrossRef]
- Deng, T.; Xu, D.R.; Chi, G.X.; Wang, Z.L.; Jiao, Q.Q.; Ning, J.T.; Dong, G.J.; Zou, F.H. Geology, geochronology, geochemistry and ore genesis of the Wangu gold deposit in northeastern Hunan province, Jiangnan Orogen, South China. Ore Geol. Rev. 2017, 88, 619–637. [Google Scholar] [CrossRef]
- Xu, D.R.; Deng, T.; Chi, G.X.; Wang, Z.L.; Zou, F.H.; Zhang, J.L.; Zou, S.H. Gold mineralization in the Jiangnan orogenic belt of south china: Geological, geochemical and geochronological characteristics, ore deposit-type and geodynamic setting. Ore Geol. Rev. 2017, 88, 565–618. [Google Scholar] [CrossRef]
- Mao, J.; Li, H. Research on genesis of the gold deposits in the Jiangnan terrain. Geochimica 1997, 26, 71–81, (In Chinese with English abstract). [Google Scholar]
- Peng, B.; Frei, R. Nd–Sr–Pb isotopic constraints on metal and fluid sources in W–Sb–Au mineralization at Woxi and Liaojiaping (Western Hunan, China). Miner. Depos. 2004, 39, 313–327. [Google Scholar] [CrossRef]
- Gu, X.; Schulz, O.; Vavtar, F.; Liu, J.; Zheng, M.; Fu, S. Rare earth element geochemistry of the Woxi W–Sb–Au deposit, Hunan province, South China. Ore Geol. Rev. 2007, 31, 319–336. [Google Scholar] [CrossRef]
- Gu, X.; Zhang, Y.; Schulz, O.; Vavtar, F.; Liu, J.; Zheng, M.; Zheng, L. The Woxi W–Sb–Au deposit in Hunan, South China: An example of Late Proterozoic sedimentary exhalative (SEDEX) mineralization. J. Asian Earth Sci. 2012, 57, 54–75. [Google Scholar] [CrossRef]
- Dong, G.J.; Xu, D.R.; Wang, L.; Chen, G.H.; He, Z.L.; Fu, G.G.; Wu, J.; Wang, Z.L. Determination of mineralizing age on gold ore deposits in the eastern Hunan province, south China and isotopic tracking on ore-forming fluids–re-discussion gold ore deposit type. Geotecton. Metallog. 2008, 32, 482–491, (In Chinese with English abstract). [Google Scholar]
- Zhao, C.; Ni, P.; Wang, G.G.; Ding, J.Y.; Chen, H.; Zhao, K.D.; Cai, Y.T.; Xu, Y.F. Geology, fluid inclusion, and isotope constraints on ore genesis of the Neoproterozoic Jinshan orogenic gold deposit, South China. Geofluids 2013, 13, 506–527. [Google Scholar] [CrossRef]
- Goldfarb, R.J.; Taylor, R.D.; Collins, G.S.; Goryachev, N.A.; Orlandini, O.F. Phanerozoic continental growth and gold metallogeny of Asia. Gondwana Res. 2014, 25, 48–102. [Google Scholar] [CrossRef]
- Deng, J.; Wang, Q. Gold mineralization in China: Metallogenic provinces, deposit types and tectonic framework. Gondwana Res. 2015, 36, 219–274. [Google Scholar] [CrossRef]
- Zhu, Y.; Peng, J. Infrared microthermometric and noble gas isotope study of fluid inclusions in ore minerals at the Woxi orogenic Au–Sb–W deposit, western Hunan, South China. Ore Geol. Rev. 2015, 65, 55–69. [Google Scholar] [CrossRef]
- Li, X.H. U-Pb zircon ages of granites from the southern margin of the Yangtze Block: Timing of Neoproterozoic Jinning Orogeny in SE China and implications for Rodinia assembly. Precambr. Res. 1999, 97, 43–57. [Google Scholar] [CrossRef]
- Zhou, M.F.; Yan, D.P.; Kennedy, A.K.; Li, Y.; Ding, J. SHRIMP U–Pb zircon geochronological and geochemical evidence for Neoproterozoic arc-magmatism along the western margin of the Yangtze Block, South China. Earth Planet. Sci. Lett. 2002, 196, 51–67. [Google Scholar] [CrossRef]
- Zhou, M.F.; Kennedy, A.K.; Sun, M.; Malpas, J.; Lesher, C.M. Neoproterozoic arcrelated mafic intrusions along the northern margin of South China: Implications for the accretion of Rodinia. J. Geol. 2002, 110, 611–618. [Google Scholar] [CrossRef] [Green Version]
- Yao, J.L.; Shu, L.S.; Santosh, M.; Zhao, G.C. Neoproterozoic arc-related mafic–ultramafic rocks and syn-collision granite from the western segment of the Jiangnan Orogen, South China: Constraints on the Neoproterozoic assembly of the Yangtze and Cathaysia Blocks. Precambr. Res. 2014, 243, 39–62. [Google Scholar] [CrossRef]
- Zhao, G.C. Jiangnan Orogen in South China: Developing from divergent double subduction. Gondwana Res. 2015, 27, 1173–1180. [Google Scholar] [CrossRef]
- Zhou, X.M.; Sun, T.; Shen, W.Z.; Shu, L.S.; Niu, Y.L. Petrogenesis of Mesozoic granitoids and volcanic rocks in South China: A response to tectonic evolution. Episodes 2006, 29, 26–33. [Google Scholar]
- Li, Z.X.; Li, X.H. Formation of the 1300-km-wide intracontinental orogen and postorogenic magmatic province in Mesozoic South China: A flat-slab subduction model. Geology 2007, 35, 179–182. [Google Scholar] [CrossRef]
- Zhu, K.Y.; Li, Z.X.; Xu, X.S.; Wilde, S.A. A Mesozoic Andean-type orogenic cycle in southeastern China as recorded by granitoid evolution. Am. J. Sci. 2014, 314, 187–234. [Google Scholar] [CrossRef]
- Wang, Z.L.; Xu, D.R.; Chi, G.X.; Shao, Y.J.; Lai, J.Q.; Deng, T.; Guo, F.; Wang, Z.; Dong, G.J.; Ning, J.T.; et al. Mineralogical and isotopic constraints on the genesis of the Jingchong Co–Cu polymetallic ore deposit in northeastern Hunan Province, South China. Ore Geol. Rev. 2017, 88, 638–654. [Google Scholar] [CrossRef]
- Large, R.R.; Danyushevsky, L.; Hollit, C.; Maslennikov, V.; Meefre, S.; Gilbert, S.; Bull, S.; Scott, R.; Emsbo, P.; Thomas, H.; et al. Gold and trace element zonation in pyrite using a laser imaging technique: Implications for the timing of gold in orogenic and Carlin-style sediment-hosted deposits. Econ. Geol. 2009, 104, 635–668. [Google Scholar] [CrossRef]
- Longerich, H.P.; Jackson, S.E.; Gunther, D. Laser ablation inductively coupled plasma mass spectrometric transient signal data acquisition and analyte concentration calculation. J. Anal. At. Spectrom. 1996, 11, 899–904. [Google Scholar] [CrossRef]
- Danyushevsky, L.V.; Robinson, P.; Gilbert, S.; Norman, M.; Large, R.; McGoldrick, P.; Shelly, J.M.G. Routine quantitative multi-element analysis of sulphide minerals by laser ablation ICPMS: Standard development and consideration of matrix effects. Geochem. Explor. Environ. Anal. 2011, 11, 51–60. [Google Scholar] [CrossRef]
- Thomas, H.V.; Large, R.R.; Bull, S.W.; Maslennikov, V.; Berry, R.F.; Fraser, R.F.; Froud, S.; Moye, R. Pyrite and pyrrhotite textures and composition in sediments, laminated quartz veins, and reefs at Bendigo gold mine, Australia: Insights for ore genesis. Econ. Geol. 2011, 106, 1–31. [Google Scholar] [CrossRef]
- Deol, S.S.; Deb, M.M.; Large, R.R.; Gilbert, S. LA-ICPMS and EPMA studies of pyrite, arsenopyrite and loellingite from the Bhukia-Jagpura gold prospect, southern Rajasthan, India: Implications for ore genesis and gold remobilization. Chem. Geol. 2012, 326–327, 72–87. [Google Scholar] [CrossRef]
- Li, N.; Deng, J.; Yang, L.Q.; Goldfarb, R.J.; Zhang, C.; Marsh, E.; Lei, S.B.; Koenig, A.; Lowers, H. Paragenesis and geochemistry of ore minerals in the epizonal gold deposits of the Yangshan gold belt, West Qinling, China. Miner. Depos. 2014, 49, 427–449. [Google Scholar] [CrossRef]
- Fleet, M.E.; Mumin, A.H. Gold-bearing arsenian pyrite and marcasite and arsenopyrite from Carlin Trend gold deposits and laboratory synthesis. Am. Mineral. 1997, 82, 182–193. [Google Scholar] [CrossRef]
- Reich, M.; Kesler, S.E.; Utsunomiya, S.; Palenik, C.S.; Chryssoulis, S.L.; Ewing, R.C. Solubility of gold in arsenian pyrite. Geochim. Cosmochim. Acta 2005, 69, 2781–2796. [Google Scholar] [CrossRef]
- Cook, N.J.; Spry, P.G.; Vokes, F.M. Mineralogy and textural relationships among sulphosalts and related minerals in the Bleikvassli Zn–Pb–(Cu) deposit, Nordland, Norway. Miner. Depos. 1998, 34, 35–56. [Google Scholar] [CrossRef]
- Chouinard, A.; Paquette, J.; Williams-Jones, A.E. Crystallographic controls on trace-element incorporation in auriferous pyrite from the Pascua epithermal high-sulfidation deposit, Chile-Argentina. Can. Mineral. 2005, 43, 951–963. [Google Scholar] [CrossRef]
- Keith, M.; Smith, D.J.; Jenkin, G.R.T.; Holwell, D.A.; Dye, M.D. A review of Te and Se systematics in hydrothermal pyrite from precious metal deposits: Insights into ore-forming processes. Ore Geol. Rev. 2017, 96, 269–282. [Google Scholar] [CrossRef]
- Deditius, A.P.; Reich, M.; Kesler, S.E.; Utsunomiya, S.; Chryssoulis, S.L.; Walshe, J.; Ewing, R.C. The coupled geochemistry of Au and As in pyrite from hydrothermal ore deposits. Geochim. Cosmochim. Acta 2014, 140, 644–670. [Google Scholar] [CrossRef] [Green Version]
- Tomkins, A.G. Mobilization of Gold as a Polymetallic Melt during Pelite Anatexis at the Challenger Deposit, South Australia: A Metamorphosed Archean Gold Deposit. Econ. Geol. 2002, 97, 1249–1271. [Google Scholar] [CrossRef]
- Wagner, T.; Klemd, R.; Wenzel, T.; Mattsson, B. Gold upgrading in metamorphosed massive sulfide ore deposits: Direct evidence from laser-ablation-inductively coupled plasma-mass spectrometry analysis of invisible gold. Geology 2007, 35, 775–778. [Google Scholar] [CrossRef]
- Morey, A.A.; Tomkins, A.G.; Bierlein, F.P.; Weinberg, R.F.; Davidson, G.J. Bimodal distribution of gold in pyrite and arsenopyrite: Examples from the Archean Boorara and Bardoc shear systems, Yilgarn craton, Western Australia. Econ. Geol. 2008, 10, 599–614. [Google Scholar] [CrossRef]
- Putnis, A. Mineral replacement reactions: From macroscopic observations to microscopic mechanisms. Mineral. Mag. 2002, 66, 689–708. [Google Scholar] [CrossRef]
- Xia, F.; Brugger, J.; Chen, G.; Ngothai, Y.; O’Neill, B.; Putnis, A.; Ping, A. Mechanism and kinetics of pseudomorphic mineral replacement reactions: A case study of the replacement of pentlandite by violarite. Geochim. Cosmochim. Acta 2009, 73, 1945–1969. [Google Scholar] [CrossRef]
- Sung, Y.H.; Brugger, J.; Ciobanu, C.L.; Pring, A.; Skinner, W.; Nugus, M. Invisible gold in arsenian pyrite and arsenopyrite from a multistage archaean gold deposit: Sunrise Dam, eastern goldfields province, western Australia. Miner. Depos. 2009, 44, 765. [Google Scholar] [CrossRef]
- Reich, M.; Deditius, A.; Chryssoulis, S.; Li, J.W.; Ma, C.Q.; Parada, M.A.; Barra, F.; Mittermayr, F. Pyrite as a record of hydrothermal fluid evolution in a porphyry copper system: A sims/empa trace element study. Geochim. Cosmochim. Acta 2013, 104, 42–62. [Google Scholar] [CrossRef]
- Wohlgemuth-Ueberwasser, C.C.; Viljoen, F.; Petersen, S.; Vorster, C. Distribution and solubility limits of trace elements in hydrothermal black smoker sulfides: An in-situ LA-ICP-MS study. Geochim. Cosmochim. Acta 2015, 159, 16–41. [Google Scholar] [CrossRef]
- Heinrich, C.A.; Eadington, P.J. Thermodynamic predictions of hydrothermal chemistry of arsenic and their significance for the paragenic sequence of some cassiterite-arsenopyrite-base metal sulfide deposits. Econ. Geol. 1986, 81, 511–529. [Google Scholar] [CrossRef]
- Pokrovski, G.S.; Kara, S.; Roux, J. Stability and solubility of arsenopyrite, FeAsS, in crustal fluids. Geochim. Cosmochim. Acta 2002, 66, 2361–2378. [Google Scholar] [CrossRef] [Green Version]
- Ferry, J.M. Petrology of graphitic sulfide-rich schists from South- Central Maine- an example of desulfidation during prograde regional metamorphism. Am. Mineral. 1981, 66, 908–931. [Google Scholar]
- Hoschek, G. Alpine metamorphism of calcareous metasediments in the Western Hohe Tauern, tyrol: Mineral equilibria in COHS fluids. Contrib. Mineral. Petrol. 1984, 87, 129–137. [Google Scholar] [CrossRef]
- Hall, A.J. Pyrite-Pyrrhotine Redox Reactions in Nature. Mineral. Mag. 1986, 50, 223–229. [Google Scholar] [CrossRef]
- Phillips, G.N.; Powell, R. Formation of gold deposits: A metamorphic devolatilization model. J. Metamorph. Geol. 2010, 28, 689–718. [Google Scholar] [CrossRef]
- Finch, E.G.; Tomkins, A.G. Pyrite-pyrrhotite stability in a metamorphic aureole: Implications for orogenic gold genesis. Econ. Geol. 2017, 112, 661–674. [Google Scholar] [CrossRef]
- Bralia, A.; Sabatini, G.; Troja, F. A revaluation of the Co/Ni ratio in pyrite as geochemical tool in ore genesis problems. Miner. Depos. 1979, 14, 353–374. [Google Scholar] [CrossRef]
- Raymond, O.L. Pyrite composition and ore genesis in the Prince Lyell copper deposit, Mt Lyell mineral field, western Tasmania, Australia. Ore Geol. Rev. 1996, 10, 231–250. [Google Scholar] [CrossRef]
- Clark, C.; Grguric, B.; Mumm, A.S. Genetic implications of pyrite chemistry from the Palaeoproterozoic Olary Domain and overlying Neoproterozoic Adelaidean sequences, northeastern South Australia. Ore Geol. Rev. 2004, 25, 237–257. [Google Scholar] [CrossRef]
- Cook, N.J.; Ciobanu, C.L.; Mao, J. Textural control on gold distribution in As-free pyrite from the Dongping, Huangtuliang and Hougou gold deposits, North China Craton (Hebei Province, China). Chem. Geol. 2009, 264, 101–121. [Google Scholar] [CrossRef]
- Keith, M.; Häckel, F.; Haase, K.M.; Schwarz-Schampera, U.; Klemd, R. Trace element systematics of pyrite from submarine hydrothermal vents. Ore Geol. Rev. 2016, 72, 728–745. [Google Scholar] [CrossRef]
- Keith, M.; Haase, K.M.; Klemd, R.; Krumm, S.; Strauss, H. Systematic variations in the trace element and sulphur isotope composition of pyrite with stratigraphic depth in the Skouriotissa volcanic-hosted massive sulphide deposit, Troodos ophiolite, Cyprus. Chem. Geol. 2016, 423, 7–18. [Google Scholar] [CrossRef]
- Gao, S.; Xu, H.; Li, S.G.; Santosh, M.; Zhang, D.S.; Yang, L.J.; Quan, A.L. Hydrothermal alteration and ore-forming fluids associated with gold-tellurium mineralization in the Dongping gold deposit, China. Ore Geol. Rev. 2017, 80, 166–184. [Google Scholar] [CrossRef]
- Grundler, P.V.; Brugger, J.; Etschmann, B.E.; Helm, L.; Liu, W.; Spry, P.G.; Tian, Y.; Testemale, D.; Pring, A. Speciation of aqueous tellurium(IV) in hydrothermal solutions and vapors, and the role of oxidized tellurium species in Te transport and gold deposition. Geochim. Cosmochim. Acta 2013, 120, 298–325. [Google Scholar] [CrossRef]
- Liu, W.; Etschmann, B.; Testemale, D.; Hazemann, J.L.; Rempel, K.; Müller, H.; Brugger, J. Gold transport in hydrothermal fluids: Competition among the Cl−, Br−, HS−, and NH3 (aq), ligands. Chem. Geol. 2014, 376, 11–19. [Google Scholar] [CrossRef]
- Huston, D.L.; Sie, S.H.; Suter, G.F.; Cooke, D.R.; Both, R.A. Trace elements in sulfide minerals from eastern australian volcanic-hosted massive sulfide deposits; part I, proton microprobe analyses of pyrite, chalcopyrite, and sphalerite, and part II, selenium levels in pyrite; comparison with δ34S values and implic. Econ. Geol. 1995, 90, 1167–1196. [Google Scholar] [CrossRef]
- Goldfarb, R.J.; Baker, T.; Dubé, B.; Groves, D.I.; Hart, C.J.R.; Gosselin, P. Distribution, character, and genesis of gold deposits in metamorphic terranes. In Economic Geology 100th Anniversary Volume; Society of Economic Geologists: Littleton, CO, USA, 2005; pp. 407–450. [Google Scholar]
- Belousov, I.; Large, R.R.; Meffre, S.; Danyushevsky, L.V.; Steadman, J.; Beardsmore, T. Pyrite compositions from VHMS and orogenic Au deposits in the Yilgarn Craton, Western Australia: Implications for gold and copper exploration. Ore Geol. Rev. 2016, 79, 474–499. [Google Scholar] [CrossRef]


| Sample No. | Location | Host Rock | General Description | Oxide and Sulfide Minerals | Associated Gangue |
|---|---|---|---|---|---|
| 290-7 | 290 m Level | granodiorite | Coarse-grained pyrite in veinlet (0.5 cm) | Au, Py, Apy, Gn, Sp | Qtz, Cal |
| 290-8 | 290 m Level | granodiorite | Quart-carbonate vein, pyrite alone the boundary | Py, Apy, Tt | Qtz, Cal |
| D036-1 | 290 m Level | slate | Coarse-grained pyrite in veinlet (2 cm) | Py, Po, Ccp, Rt | Qtz, Dol, Sd, Chl |
| 240-3 | 240 m Level | slate | Quartz veins, including residual slate | Py, Apy | Qtz, Sd, Dol, Chl |
| 330-9 | 330 m Level | slate | Disseminated Sulfides in slate | Py, Apy, Tt | Qtz, Sd, Ser |
| 330-10 | 330 m Level | granodiorite | Disseminated Sulfides in granodiorite | Au, Py, Apy, Sp, Gn, Tt, Rt | Qtz, Ms, Ap, Ser, Cal |
| 330-11 | 330 m Level | slate | Massive pyrite vein | Au, Py, Po, Ccp, Sp, Gn | Qtz, Ser |
| 330-12 | 330 m Level | slate | Quart-pyrite vein from stockwork, Pyrite as a line within vein. | Au, Py, Apy, Ccp, Sp, Gn, Tt | Qtz, Cal |
| Pyrite Type | As | S | Fe | Co | Ni | Au | Pb | |
|---|---|---|---|---|---|---|---|---|
| PyI | Min. | 0.20 | 52.60 | 46.77 | 0.03 | 0.02 | 0.06 | 0.05 |
| Max. | 1.12 | 54.32 | 47.80 | 0.07 | 0.08 | 0.11 | 0.24 | |
| SD | 0.34 | 0.57 | 0.35 | 0.02 | 0.02 | 0.03 | 0.07 | |
| n = 7 | Av. | 0.37 | 53.74 | 47.18 | 0.05 | 0.03 | 0.08 | 0.14 |
| PyII-1 | Min. | 1.01 | 52.43 | 46.64 | 0.04 | 0.02 | 0.08 | 0.05 |
| Max. | 1.95 | 53.22 | 47.21 | 0.12 | 0.08 | 0.16 | 0.12 | |
| SD | 0.36 | 0.29 | 0.24 | 0.03 | 0.03 | 0.06 | 0.03 | |
| n = 7 | Av. | 1.49 | 52.73 | 46.96 | 0.07 | 0.04 | 0.12 | 0.09 |
| PyII-2 | Min. | 2.51 | 50.60 | 45.70 | 0.04 | 0.02 | 0.15 | 0.04 |
| Max. | 4.19 | 51.96 | 47.00 | 0.08 | 0.08 | 0.15 | 0.20 | |
| SD | 0.56 | 0.46 | 0.40 | 0.02 | 0.03 | 0.05 | ||
| n = 7 | Av. | 3.01 | 51.58 | 46.40 | 0.06 | 0.05 | 0.15 | 0.10 |
| PyII-3 | Min. | 1.23 | 52.12 | 46.55 | 0.04 | 0.04 | 0.05 | |
| Max. | 2.12 | 53.10 | 47.46 | 0.09 | 0.04 | 0.31 | ||
| SD | 0.34 | 0.37 | 0.30 | 0.02 | 0.10 | |||
| n = 7 | Av. | 1.63 | 52.48 | 46.90 | 0.06 | 0.04 | 0.11 | |
| PyIII | Min. | 1.09 | 50.13 | 46.03 | 0.03 | 0.01 | 0.07 | 0.04 |
| Max. | 3.18 | 53.37 | 47.35 | 0.14 | 0.15 | 0.12 | 0.20 | |
| SD | 0.52 | 0.75 | 0.38 | 0.03 | 0.05 | 0.02 | 0.05 | |
| n = 15 | Av. | 1.72 | 52.34 | 46.72 | 0.06 | 0.06 | 0.10 | 0.11 |
| Pyrite Type | S, As, Se (wt %) | Fe (wt %) | As (ppm) | Au (ppm) | Co (ppm) | Ni (ppm) | Cu (ppm) | Zn (ppm) | Pb (ppm) | Ag (ppm) | Se (ppm) | Te (ppm) | Sb (ppm) | Bi (ppm) | Co/Ni | Se/Te | |
|---|---|---|---|---|---|---|---|---|---|---|---|---|---|---|---|---|---|
| PyI | Min. | 52.94 | 46.33 | 183.04 | 0.02 | 0.00 | 0.02 | 0.55 | 0.53 | 0.10 | 0.02 | 3.72 | 0.05 | 0.04 | 0.03 | 0.01 | 33.74 |
| Max. | 53.37 | 46.52 | 6869.63 | 0.86 | 0.92 | 6.55 | 300.61 | 1241.20 | 552.96 | 0.57 | 17.13 | 0.51 | 25.60 | 19.57 | 0.32 | 107.37 | |
| SD | 0.21 | 0.08 | 3501.40 | 0.36 | 0.47 | 3.45 | 149.70 | 620.13 | 265.99 | 0.26 | 5.66 | 0.21 | 12.08 | 9.24 | 0.13 | 30.19 | |
| n = 4 | Av. | 53.14 | 46.39 | 3647.71 | 0.53 | 0.40 | 3.18 | 76.06 | 311.00 | 214.99 | 0.22 | 9.63 | 0.19 | 7.65 | 6.08 | 0.15 | 72.08 |
| PyII-1 | Min. | 51.84 | 45.95 | 11,324.34 | 2.35 | 0.01 | 0.16 | 1.64 | 0.21 | 6.72 | 0.03 | 4.42 | 0.07 | 0.80 | 0.12 | 0.05 | 40.50 |
| Max. | 52.62 | 46.23 | 21,855.37 | 26.72 | 22.20 | 125.99 | 16.68 | 0.57 | 231.59 | 0.21 | 36.99 | 0.91 | 20.74 | 6.66 | 0.22 | 144.50 | |
| SD | 0.33 | 0.12 | 4554.95 | 8.41 | 9.35 | 48.17 | 5.68 | 0.13 | 80.96 | 0.07 | 10.67 | 0.32 | 6.88 | 2.36 | 0.06 | 41.08 | |
| n = 6 | Av. | 52.20 | 46.08 | 16,986.38 | 11.91 | 7.48 | 60.62 | 10.20 | 0.40 | 91.81 | 0.07 | 18.66 | 0.27 | 7.45 | 2.30 | 0.12 | 94.67 |
| PyII-2 | Min. | 50.82 | 45.54 | 22,663.61 | 24.67 | 17.13 | 97.02 | 30.44 | 0.48 | 74.44 | 0.06 | 9.68 | 0.19 | 2.40 | 1.56 | 0.18 | 14.13 |
| Max. | 51.78 | 45.93 | 35,709.79 | 56.51 | 98.69 | 371.70 | 54.59 | 1.00 | 319.26 | 0.17 | 15.66 | 0.70 | 22.17 | 6.63 | 0.27 | 50.48 | |
| SD | 0.48 | 0.19 | 6523.10 | 16.54 | 42.02 | 138.26 | 12.10 | 0.28 | 136.70 | 0.06 | 2.99 | 0.26 | 10.35 | 2.76 | 0.05 | 14.13 | |
| n = 3 | Av. | 51.30 | 45.73 | 29,191.95 | 38.01 | 52.07 | 225.19 | 42.98 | 0.68 | 161.72 | 0.12 | 12.62 | 0.41 | 10.51 | 3.47 | 0.21 | 36.86 |
| PyII-3 | Min. | 51.52 | 45.83 | 15,167.92 | 3.69 | 0.01 | 0.20 | 1.99 | 0.26 | 1.54 | 0.02 | 2.95 | 0.04 | 0.59 | 0.14 | 0.04 | 26.97 |
| Max. | 52.34 | 46.14 | 26,128.99 | 19.44 | 67.41 | 411.14 | 83.87 | 0.83 | 762.91 | 0.43 | 7.73 | 0.29 | 31.84 | 10.05 | 0.55 | 75.62 | |
| SD | 0.20 | 0.08 | 2730.29 | 5.13 | 20.67 | 125.76 | 23.89 | 0.19 | 242.90 | 0.15 | 1.37 | 0.07 | 9.69 | 3.11 | 0.16 | 13.41 | |
| n = 10 | Av. | 51.92 | 45.98 | 20,838.69 | 9.50 | 8.92 | 57.01 | 18.01 | 0.44 | 162.75 | 0.13 | 4.97 | 0.11 | 10.38 | 3.10 | 0.20 | 51.16 |
| PyIII | Min. | 51.58 | 45.62 | 8862.14 | 2.66 | 2.40 | 7.67 | 2.62 | 0.19 | 0.31 | 0.01 | 28.40 | 1.22 | 0.05 | 0.06 | 0.26 | 2.10 |
| Max. | 52.79 | 46.30 | 20,429.36 | 35.58 | 1083.30 | 2599.41 | 32.55 | 4.31 | 644.37 | 0.39 | 97.17 | 46.28 | 36.83 | 9.75 | 0.67 | 23.23 | |
| SD | 0.31 | 0.21 | 3447.75 | 9.60 | 316.16 | 782.05 | 9.42 | 1.15 | 202.70 | 0.14 | 19.62 | 12.88 | 10.22 | 3.29 | 0.10 | 5.82 | |
| n = 12 | Av. | 52.24 | 46.03 | 15,870.44 | 15.92 | 164.57 | 444.62 | 11.87 | 0.67 | 159.95 | 0.13 | 66.97 | 20.80 | 8.49 | 3.01 | 0.37 | 5.31 |
© 2018 by the authors. Licensee MDPI, Basel, Switzerland. This article is an open access article distributed under the terms and conditions of the Creative Commons Attribution (CC BY) license (http://creativecommons.org/licenses/by/4.0/).
Share and Cite
Shao, Y.-J.; Wang, W.-S.; Liu, Q.-Q.; Zhang, Y. Trace Element Analysis of Pyrite from the Zhengchong Gold Deposit, Northeast Hunan Province, China: Implications for the Ore-Forming Process. Minerals 2018, 8, 262. https://doi.org/10.3390/min8060262
Shao Y-J, Wang W-S, Liu Q-Q, Zhang Y. Trace Element Analysis of Pyrite from the Zhengchong Gold Deposit, Northeast Hunan Province, China: Implications for the Ore-Forming Process. Minerals. 2018; 8(6):262. https://doi.org/10.3390/min8060262
Chicago/Turabian StyleShao, Yong-Jun, Wen-Shu Wang, Qing-Quan Liu, and Yu Zhang. 2018. "Trace Element Analysis of Pyrite from the Zhengchong Gold Deposit, Northeast Hunan Province, China: Implications for the Ore-Forming Process" Minerals 8, no. 6: 262. https://doi.org/10.3390/min8060262