Synthesis of 4A Zeolite from Kaolinite-Type Pyrite Flotation Tailings (KPFT)

1
School of Environment and Resource, Southwest University of Science and Technology, Mianyang 621010, China
2
Key Laboratory of Solid Waste Treatment and Resource Recycle, Ministry of Education, Southwest University of Science and Technology, Mianyang 621010, China
*
Author to whom correspondence should be addressed.
Minerals 2018, 8(8), 338; https://doi.org/10.3390/min8080338
Submission received: 15 July 2018
/
Revised: 21 July 2018
/
Accepted: 21 July 2018
/
Published: 7 August 2018
Abstract
:As a solid waste, kaolinite-type pyrite flotation tailings (KPFT) are a type of low-quality kaolin that contain impurities, such as iron and titanium. In this study, KPFT were calcined at 800 °C for two hours. The calcined production (CKPFT), which is mainly metakaolin, was used as the silicon and aluminum source to synthesize 4A zeolite (Na12[(AlO2)12(SiO2)12]·27H2O) via hydrothermal synthesis. The optimal hydrothermal synthesis conditions were determined from X-ray diffraction phase analysis, relative crystallinity (RC), and cation ion exchange capacity (CEC). The optimal hydrothermal synthesis conditions were determined to be a ratio of 5 g CKPFT, 6.5 g NaOH, 65 mL H2O, crystallization temperature 110 °C, and crystallization time of three hours. Under the optimal hydrothermal synthesis conditions, the RC and CEC of the synthesized 4A zeolite were 40.77% and 210.32 mg CaCO3·g−1, respectively. Further characterizations including pore size distribution, scanning electron microscopy, energy dispersive X-ray, thermogravimetry-differential scanning calorimetry, and Fourier transform infrared spectroscopy were performed. The results revealed that impurities in KPFT do not affect the synthesis of 4A zeolite. The surface morphology of the synthesized 4A zeolite was composed of chamfered-edged cubes with a particle size of one to three μm that was thermally stable up to approximately 890 °C.
1. Introduction
Zeolites are crystalline aluminosilicate materials formed by the sharing of oxygen atoms in the aluminum and silicate tetrahedral framework [1,2]. Zeolites possess regular, microscopic interconnected pores and windows that can selectively adsorb molecules like sieves [3,4]. Among zeolites, 4A zeolite, Na12[(AlO2)12(SiO2)12]·27H2O, possesses an α-cavity with a 0.41 nm diameter comprised of eight β-cages linked by 12 4-rings, which create its adsorption, screening, and ion exchange performance [5,6]. Thus, 4A zeolite has been widely used as an adsorbent [7], catalyst [8,9], ion-exchanger [10,11], and detergent builders [12,13,14]. Among more than 200 different types of zeolites, 4A zeolite is one of the most important microporous materials due to its widespread industrial use [15].
4A zeolite synthesis methods include microwave [16], vapor [17], and hydrothermal synthesis [18,19]. However, the hydrothermal synthesis method is the most promising and is used frequently [20]. When the hydrothermal synthesis method is used, the initial raw materials for the synthesis of 4A zeolite are chemical raw materials with different sources of Si and Al, such as Al(OH)3, Na2SiO3, and NaAlO2 [21]. However, the production is expensive and the raw materials are limited [22]. Thus, the most current raw materials for the synthesis of 4A zeolite are inexpensive minerals with wide distribution, such as kaolin [23,24], attapulgite [25], and bentonite [26]. Among these natural minerals, kaolin (Al2O3·2SiO2·2H2O), which has an Al/Si mole ratio of one—the same as 4A zeolite—has been typically used as the raw material for the synthesis of 4A zeolite [27]. Kaolin should be calcined at high temperatures to convert it into the highly active material metakaolin before hydrothermal synthesis treatment. Calcination, also known as “metakaolinization”, is usually performed at 600–900 °C [28]. With the increasing demand for 4A zeolite and the shortage of high-quality kaolin, the problems created by the use of traditional raw materials and costs have become more prominent. Thus, larger amounts of cheaper solid wastes rich in Si and Al components, such as coal fly ash [12,20], bauxite tailings [29], or kaolinite type pyrite cinder [17], have been examined as raw materials. The use of solid waste as a raw material for the synthesis of 4A zeolite may solve the environmental pollution problem caused by the accumulation of solid waste.
In Southwest China, pyrite is extremely abundant. Pyrite exists in the sediments of kaolin, with the proportion of pyrite ranging from 25% to 30% and the proportion of kaolin ranging from 70% to 75%. Hundreds of millions of tons of tailings have been produced during the mining and processing of pyrite over the past 60 years [30]. However, the tailings are not yet being effectively used, resulting in the occupation of large amounts of land and causing adverse effects on the local ecological environment. This is also a waste of resources. Therefore, finding a method for the large-scale resource use of the tailings is essential. Kaolinite-type pyrite tailings include kaolinite-type pyrite gravity separation tailings and kaolinite-type pyrite flotation tailings (KPFT). KPFT are a type of low-quality kaolin with impurities such as iron and titanium. Therefore, synthesizing 4A zeolite using KPFT as the raw material is possible. However, no studies have reported the synthesis of 4A zeolite using KPFT as the main raw material. If we can use KPFT to produce 4A zeolite, it will not only reduce production costs and create high value-added products, but also result in considerable social and environmental benefits.
The synthesis of 4A zeolite is affected by many parameters, such as crystallization temperature and time and the NaOH/H2O dosage. To obtain a higher quality 4A zeolite, these parameters should be optimized. Generally, the orthogonal test design method is an effective methodology for investigating the effects of multiple factors, which can reduce the overall experimental cost and consumption time [31]. Using the orthogonal array specially designed for zeolite synthesis, the optimum experimental conditions can be easily determined. Therefore, the orthogonal test method is widely used in the study of the synthesis of 4A zeolite.
In this study, KPFT were used as the main raw material to synthesize 4A zeolite using the hydrothermal synthesis method. The optimum conditions of the 4A zeolite synthesis were determined by orthogonal tests. X-ray diffraction (XRD) phase analysis, relative crystallinity (RC), and cation ion exchange capacity (CEC) were used as the basis for the selection of optimum hydrothermal synthesis conditions. Then, the synthesized 4A zeolite in optimum conditions were characterized using Fourier transform infrared (FTIR) spectroscopy, scanning electron microscopy (SEM), energy dispersive X-ray (EDX), Brunauer-Emmett-Teller (BET) specific surface area measurements, and thermogravimetry-differential scanning calorimetry (TG-DSC).
2. Materials and Methods
2.1. Chemical and Materials
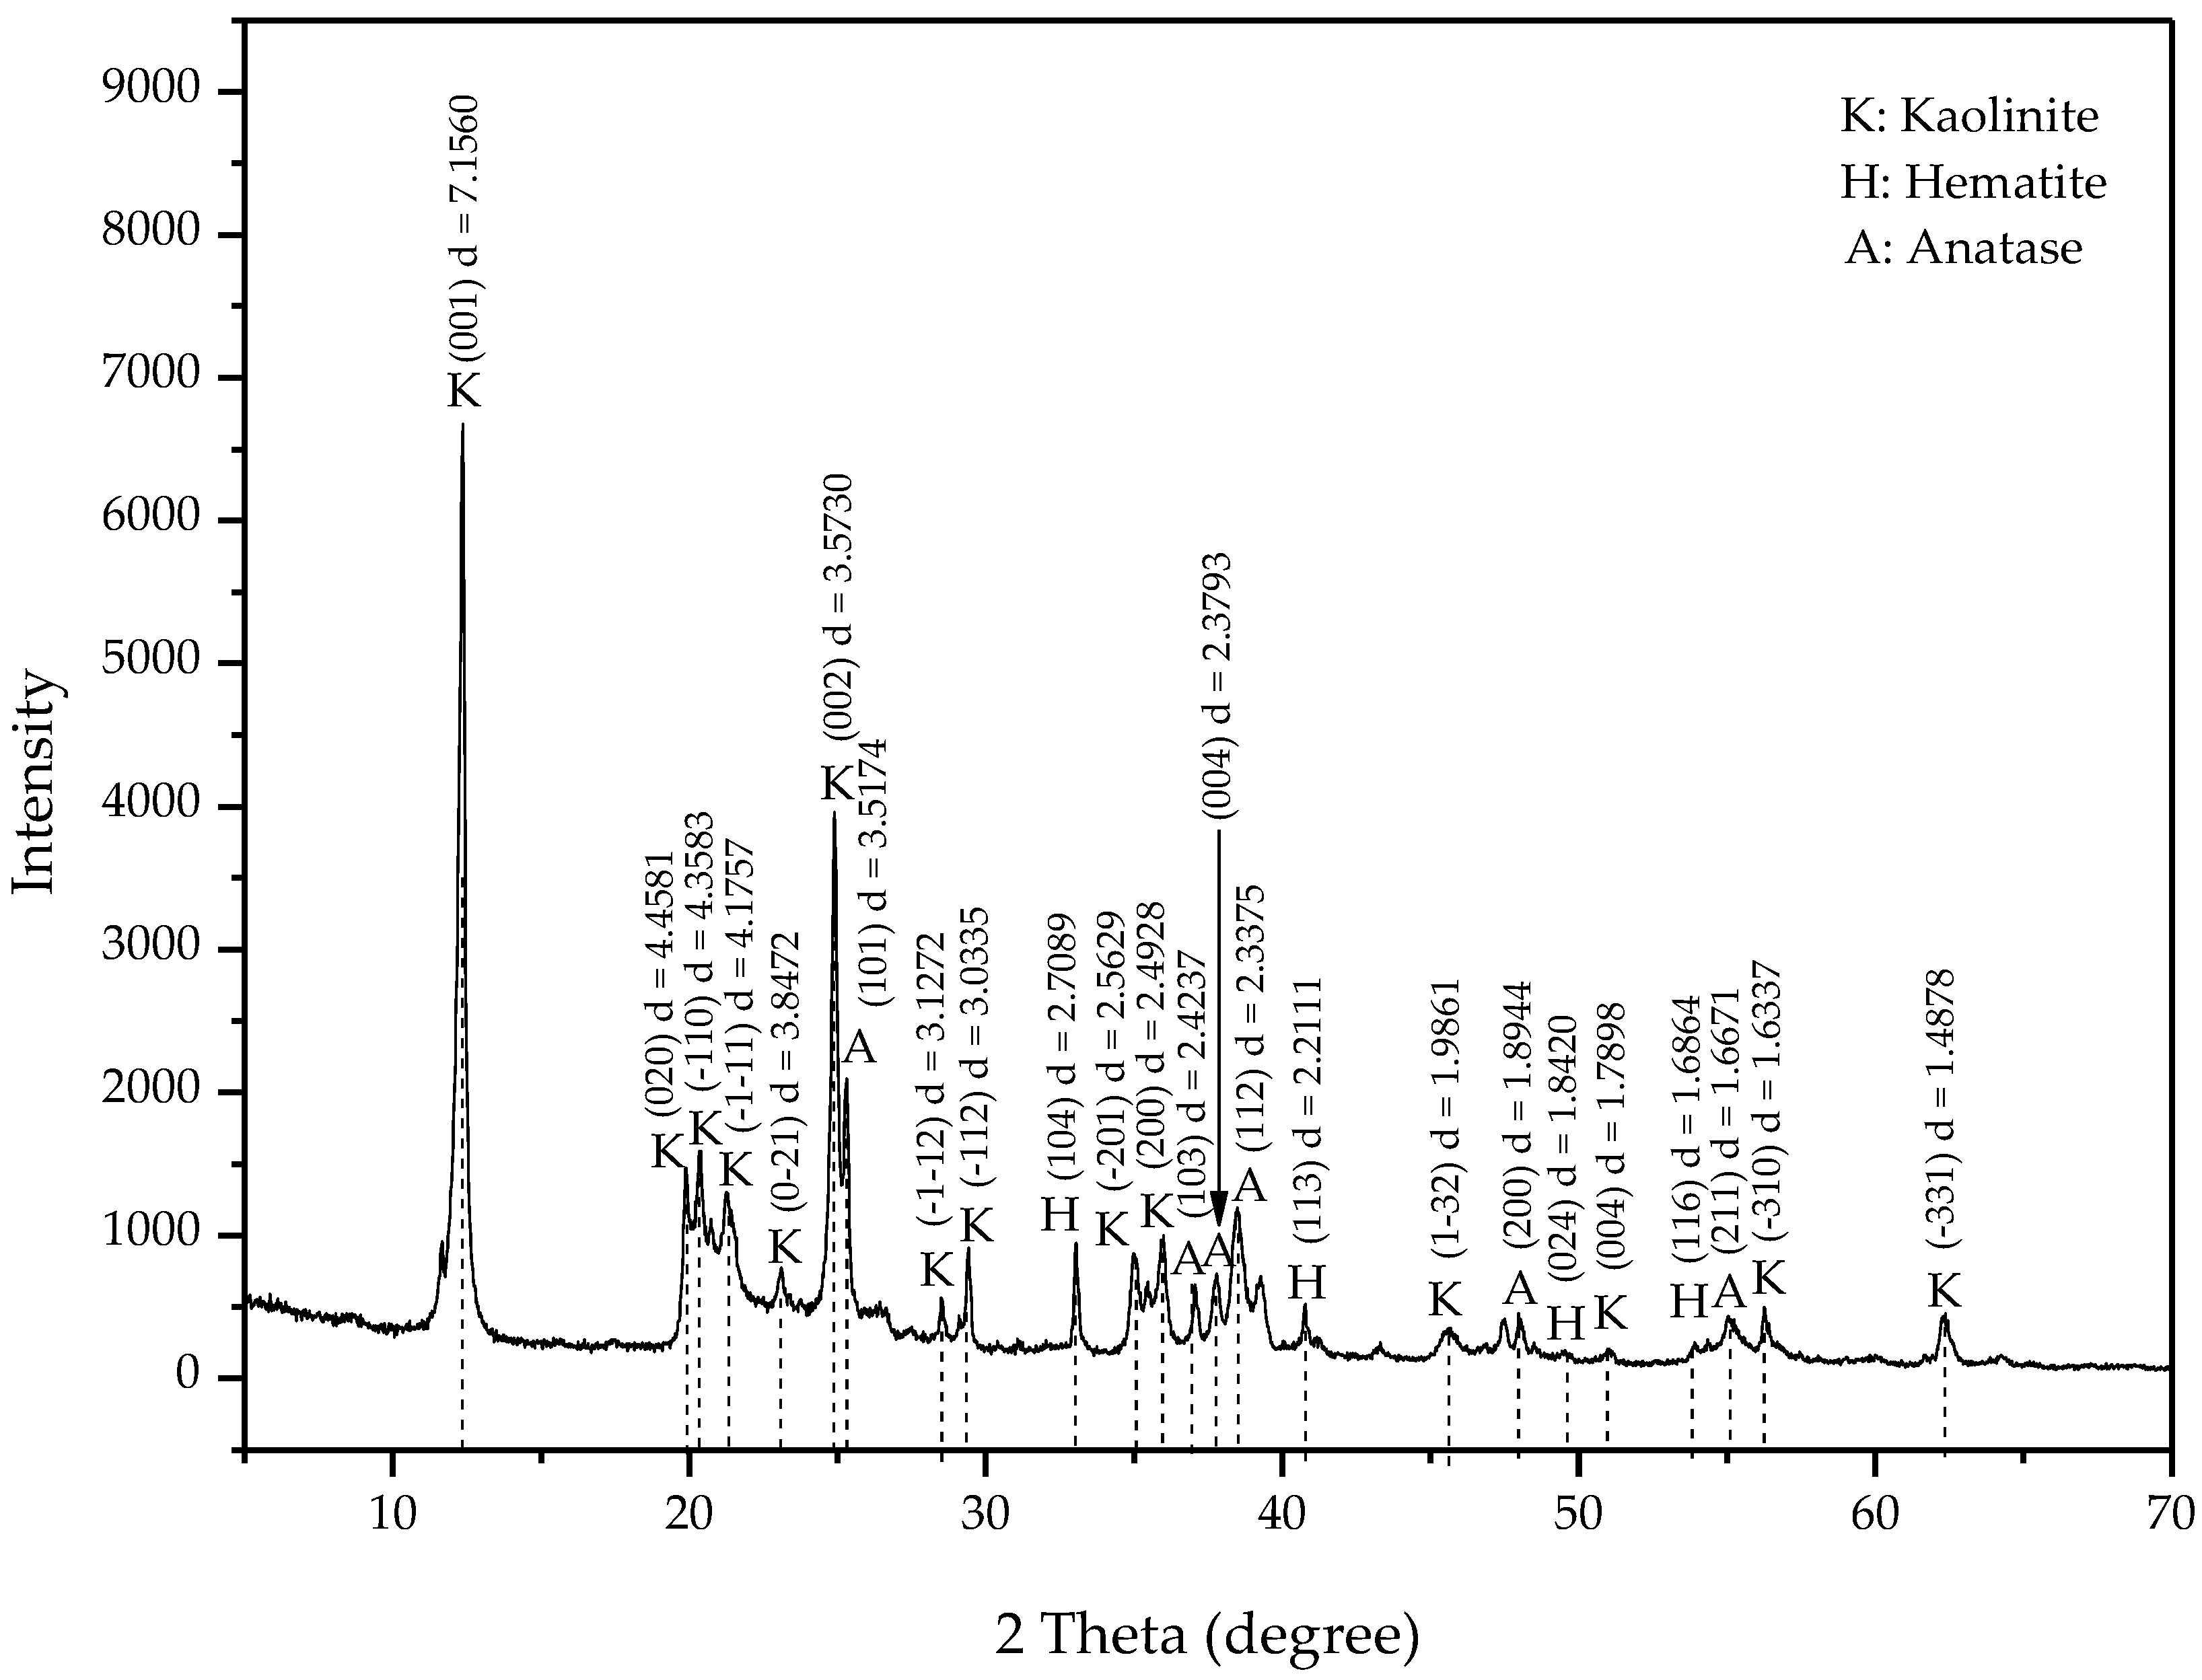
The KPFT used in this study was supplied by a Lianghe pyrite mineral processing plant in Luzhou, Sichuan province, China. Figure 1 shows the XRD pattern of KPFT. According to the XRD pattern, the main mineral component of KPFT was kaolinite and the minor components were hematite and anatase. Table 1 shows the chemical composition of KPFT examined by X-ray fluorescence spectroscopy (XRF); the results indicate that the main chemical compositions of KPFT were SiO2, Al2O3, and Fe2O3. Thus, the kaolin was of low-quality, containing impurities such as iron and titanium. Further chemical analysis of KPFT showed that the SiO2, Al2O3, and total iron (TFe) contents were 41.25%, 33.33%, and 3.79%, respectively. Therefore, the Si/Al mole ratio was 1.05 (close to 1), which meets the requirements for the conditions for 4A zeolite synthesis.
Commercial 4A zeolite was purchased from Aladdin Industrial Corporation (Shanghai, China). Analytical grade NaOH pellets and anhydrous CaCl2 were purchased from Kemiou Chemical Reagent Co., Ltd. (Tianjin, China). The water used for all tests was deionized water with a resistivity of 18.25 MΩ·cm.
2.2. Calcination (Metakaolinization)
Calcination plays a key part in the synthesis of 4A zeolite from kaolinite. Calcination destroys the lattice structure of kaolinite and transforms it into an amorphous material (i.e., metakaolin). This process is usually performed between 600 and 900 °C. The transition of kaolin to metakaolin starts at about 600 °C [32]. When the calcination temperature reaches about 800 °C, the kaolin completely transforms to metakaolin. Thus, the KPFT were calcined in a muffle furnace at 800 °C for two hours to obtain CKPFT [5]. The XRD pattern of CKPFT is shown in Figure 2. Compared to KPFT, the XRD pattern of CKPFT showed an expected change: the diffraction peaks of kaolinite disappeared, but the diffraction peaks of anatase and hematite were retained. This indicated that the kaolinite in KPFT was converted to metakaolin, which was amorphous and chemically reactive. The chemical analysis of CKPFT was tested. The results showed that the contents of SiO2, Al2O3, and total iron (TFe) were 43.62%, 35.43%, and 3.96% respectively. The Si/Al mole ratio of CKPFT was 1.05 (close to 1), which meets the requirements for synthesizing 4A zeolite.
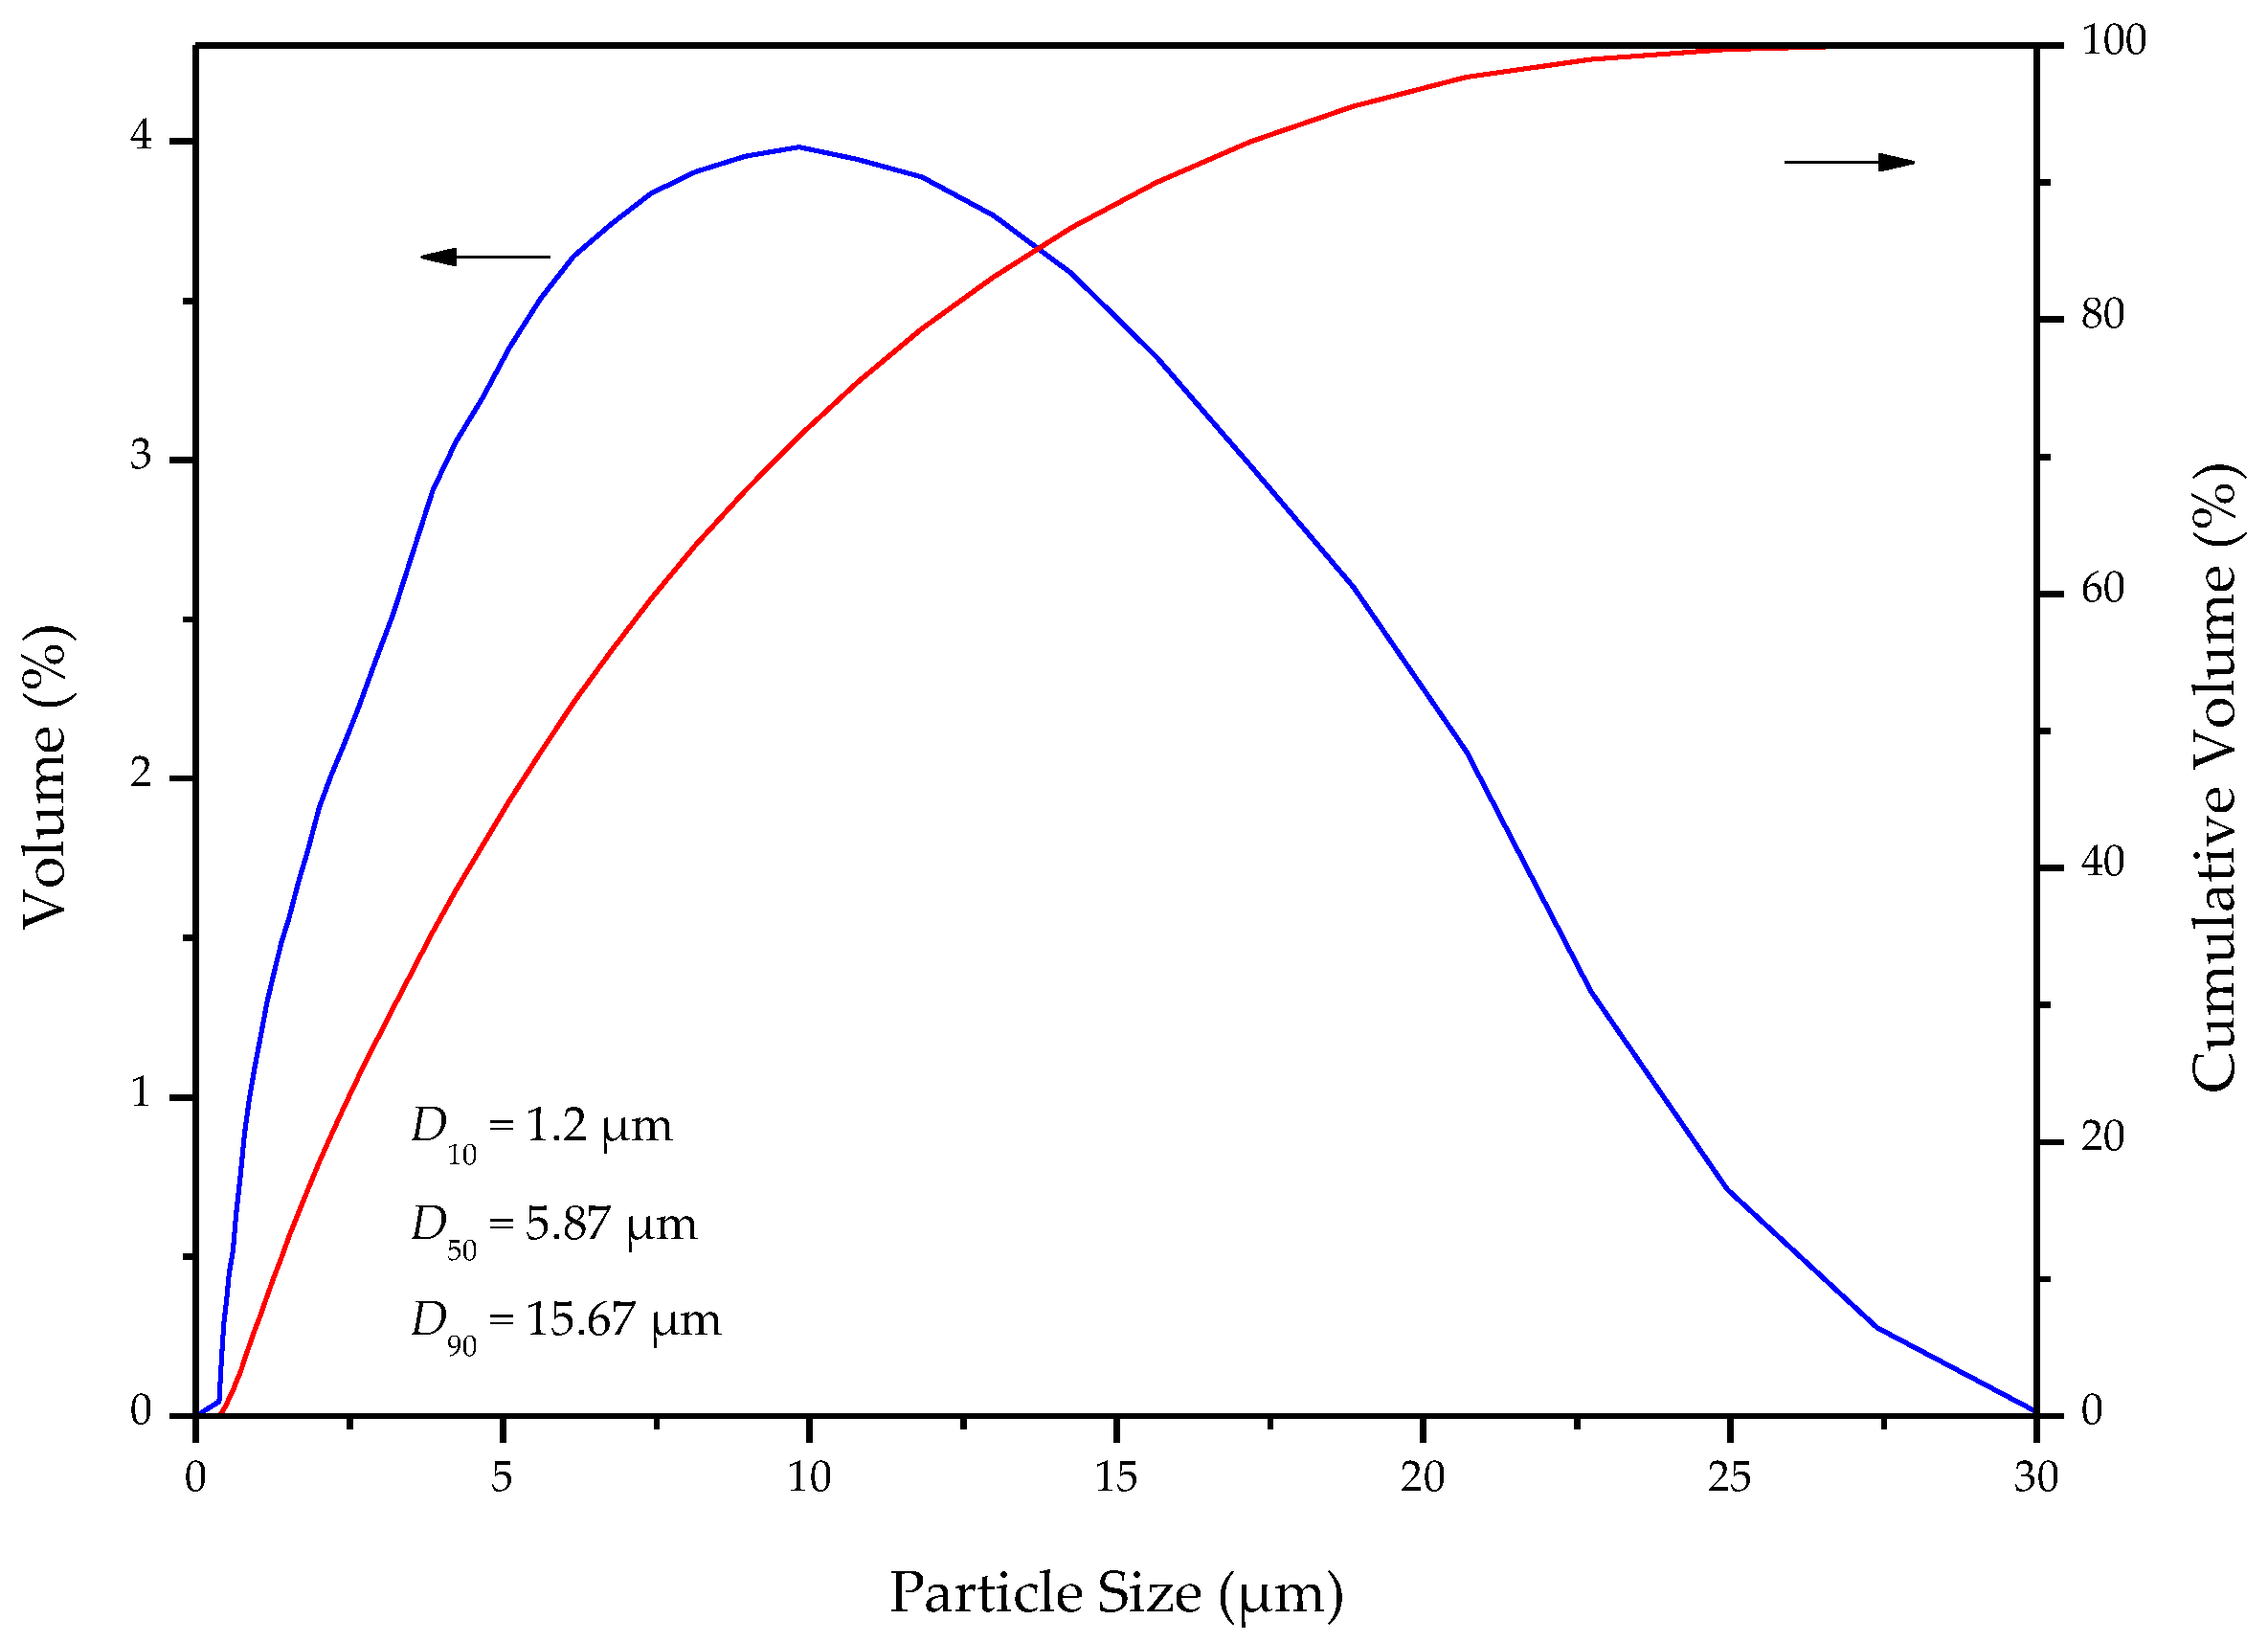
In order to improve the reactivity of the CKPFT, CKPFT were ground using an ultrafine stirring mill. The grain size distribution curve of CKPFT powder, measured by a laser diffraction particle size analyzer (Beckman Coulter, LS 13–320, Brea, CA, USA), showed that the D10, D50 and D90 were 1.28 μm, 5.87 μm, and 15.67 μm, respectively (Figure 3).
2.3. Synthesis of 4A Zeolite
4A zeolite was synthesized using the traditional hydrothermal synthesis method. The key determined parameters for 4A zeolite synthesis include the crystallization temperature and time, and the NaOH/H2O dosage. According to Table 2, 5.0 g of CKPFT were added together with NaOH and H2O into a glass beaker, stirred for 10 min using a magnetic stirrer, and pretreated for 1 h using ultrasonic (ultrasound power 80 W, ultrasonic frequency 50 kHz). Then, the slurry was placed in a 100-mL sealed Teflon-lined stainless steel autoclave. The autoclave was maintained at the setting temperature (T) for the setting time (t) and then water cooled to room temperature. The hydrothermally synthesized samples were collected by filtration. Then, these samples were washed with water several times to remove soluble impurities. After centrifugation and vacuum drying at 105 °C for 5 h, the final products were ground into powder in the mortar and screened by a 200-mesh sieve, and then stored in the desiccator until required for further experiments.
2.4. Characterization and Relative Crystallinity Calculation (RC)
The XRD patterns of products were recorded using an X-ray diffractometer (Panalytical, X’Pert PRO, Almelo, The Netherlands) with a Cu-Kα (λ = 0.15418 nm) radiation source. The voltage of the source was 40 kV and the current of the source was 40 mA. The scanning 2θ range was 5°–70° and the scanning speed was 10°/min. The RC of the final product was calculated by comparing the sum of peak intensity of the most five characteristic peak of the products and commercial 4A zeolite in the XRD patterns (d442 at 21.67°, d622 at 23.99°, d642 at 27.11°, d820 at 29.94°, and d664 at 34.18°) [32]. The equation is shown in Equation (1).
RC (%) = 100 × Sum of peak intensities of product/Sum of peak intensities of commercial 4A zeolite
FTIR spectra were recorded with a FT-IR spectrometer (PE, Spectrum One, Stamford, CT, USA) using the KBr matrix technique over the range of 4000 cm−1 to 400 cm−1. A surface area and pore size analyzer (Quantachrome, Autosorb-1MP, Boynton Beach, FL, USA) was used to record the N2 adsorption-desorption isotherm at 77 K, and the samples were degassed at 105 °C for 6 h before the measurements. The BET specific surface area was calculated using the standard BET method for adsorption data in the relative adsorption range of 0.05 to 0.5. The mesopore size distribution was estimated using the Barrett-Joyner-Halenda (BJH) method applied to the desorption branch of the isotherm, and the micropore size distribution was determined by the Saito-Foley (SF) method; both the BJH and SF methods are incorporated in the ASiQwin analysis package (Version 3.0). SEM images were obtained and EDX was performed using a scanning electron microscope (Zeiss, Ultra 55, Oberkochen, Germany). The samples for SEM imaging were coated with gold. The TG-DSC curves were recorded using a thermal analyzer (TA Instruments, SDT Q600, Eden Prairie, MN, USA) by applying a 20.0 °C/min heating rate from room temperature up to 1200 °C under air atmosphere.
2.5. Cation Exchange Capacity (CEC)
The CEC is an important parameter for characterizing zeolites. Calcium ion exchange capacity was used to characterize the CEC of products. The products were tested using a PCa-1-01 Ca ion selective electrode. In this test, 0.1 g of the sample was dried at 105 °C, then cooled to room temperature in a desiccator and precisely weighed. The weighed sample was placed in a conical flask containing a 50 mL of 0.01 M CaCl2 solution. The conical flask was shaken in a constant-temperature shaker for 24 h (system temperature 25 °C, system rotational speed 150 r/min). After the solid was filtered off, the Ca2+ ion concentrations in the filtrate and the original solution were tested. The CEC was calculated using Equation (2):
where CEC is the calcium ion exchange capacity of product (mg CaCO3·g−1); 100.08 is the molar mass of CaCO3 (g/mol or mg/mmol), C0 is the Ca2+ ion concentration of CaCl2 original solution (mol/L), C1 is the Ca2+ ion concentration of filtrate (mol/L), V is the volume of CaCl2 solution (mL), and m is the mass weight of product (g).
CEC = 100.08V(C0 − C1)/m
3. Results and Discussion
3.1. Orthogonal Tests Results Analysis
3.1.1. XRD Phase Analysis
Figure 4 shows the XRD patterns of the synthesized samples and commercial 4A zeolite under the different conditions (Table 2). Figure 4a shows that samples synthesized at 50 °C have no zeolite crystal phase, so 4A zeolite cannot be synthesized at 50 °C. As shown in Figure 4b, 4A zeolite can be synthesized at 70 °C, but the crystallization time must exceed nine hours (Nos. 07 and 08). Figure 4c shows that the 4A zeolite can be crystallized at 90 °C, but the crystallization time must be longer than seven hours (Nos. 11, 14, and 15). As can be seen from Figure 4d,e, the 4A zeolite crystals can be synthesized at 110 °C or 130 °C, but sodalite crystals were found in samples at 9 and 11 h at 110 °C (Nos. 18, 19) and all samples at 130 °C (Nos. 21–25). Analysis of the five figures showed that crystallization temperature was the key factor for the synthesis of 4A zeolite. Additionally, the suitable crystallization temperature for 4A zeolite synthesis was 70–110 °C. When the crystallization temperature was within this range, the appropriate crystallization time decreased with increasing crystallization temperature, but excessive crystallization temperature or time crystallized the sodalite. The 4A zeolite peaks of the synthesized samples coincided with the peaks of commercial 4A zeolite (Figure 4f). In addition, the peak of hematite near 24° in Figure 4 was significantly enhanced because it essentially coincided with one of the 4A zeolite peaks.
3.1.2. RC and CEC Results Analysis
We completed 25 experiments using orthogonal array L25 with four factors including: crystallization temperature and time, and five levels of NaOH/H2O dosage. RC and CEC were key parameters for the selection of hydrothermal synthesis conditions in this paper. Therefore, RC and CEC were selected as the response variables to study the effect of parameters on optimization. The results and details of the L25 design are presented in Table 3.
Figure 5 presents the obtained curves corresponding to the CEC and RC for each level of investigated parameters. The graphs in Figure 5 show the variations in CEC and RC of synthesized 4A zeolite by changing the level of investigated variables. We found a good correlation between the RC and CEC. Through further calculations, the influence ranges of the four factors on CEC were 102.38, 42.36, 50.57, and 59.25, and the influence ranges of the four factors on RC were 24.80, 12.53, 11.92, and 17.89. Therefore, among these factors, the crystallization temperature had the greatest influence on the CEC and RC of the synthesized sample; the crystallization time and alkalinity had the less influence.
The crystallization temperature at 110 °C in optimum level significantly affected the process response. Figure 5a shows that the CEC and RC increased with increasing crystallization temperature from 50 °C to 110 °C. This phenomenon can be explained by the increase in temperature in a certain range having a positive effect on the synthesized CEC and RC of 4A zeolite. With more increases in the levels of this factor (from 110 to 130 °C), the CEC and RC decreased. This may be attributed to the fact that the appearance of sodalite occurred at higher crystallization temperatures.
The crystallization time was one of the investigated factors that did not clearly play a role in the variation of the response. The worst level for this factor was five hours, and the other crystallization times had no significant effect on the CEC and RC of the synthesized samples (Figure 5b).
The effects of NaOH or H2O dosage alone on the CEC and RC of the synthesized samples are shown in Figure 5c,d, respectively. As can be seen from the figures, the optimal NaOH and H2O dosages were 6.5 g and 65 mL, respectively. However, it is well known that in hydrothermal synthesis tests, little value is obtained by studying the effects of NaOH and H2O dosage alone. Therefore, the NaOH and H2O dosages were converted into alkalinity and NaOH concentration for research (Figure 5e,f, respectively).
Alkalinity (n(Na2O)/n(SiO2)) is one of the most important parameters for controlling zeolite crystallization. However, it did not clearly play a role in the variation of the response. This may be attributed to the proximity of the values of the selected levels, which restrict the choice of alkalinity range due to the sensitivity of synthesized 4A zeolite between temperature and alkalinity. The best level for this factor was 2.24 (i.e., 6.5 g NaOH:5 g CKPFT; Figure 5e).
As shown in Figure 5f, with increasing NaOH concentration, the CEC and RC decreased at first and then increased. The minimum and maximum values of CEC and RC appeared at 80–89.99 and 100–109.99 g/L, respectively. Thus, the best achieved value for this factor was 100–109.99 g/L.
As such, the optimal conditions were 6.5 g NaOH, 65 mL H2O, and 110 °C crystallization temperature. According to the phase analysis results, when the crystallization temperature was 110 °C, a longer crystallization time led to sodalite synthesis, whereas 4A zeolite synthesis was better under shorter crystallization time (three hours). Thus, the optimal hydrothermal synthesis conditions were determined as a ratio of 5 g CKPFT, 6.5 g NaOH, 65 mL H2O, crystallization temperature 110 °C, and crystallization time three hours (No. 20). The RC and CEC of No. 20 were 40.77% and 210.32 mg CaCO3·g−1, respectively.
3.2. Characterization of 4A Zeolite Synthesized in Optimum Conditions (No. 20)
3.2.1. FTIR Analysis
The FTIR spectra of No. 20 and commercial 4A zeolite are shown in Figure 6. According to the comparison of the two spectra, the bands of No. 20 were close to the commercial grade 4A zeolite. The bands at 463 cm−1, 552 cm−1, and 1003 cm−1 were attributed to T-O bending, double-loop bending, and TO4 asymmetric stretching vibration, respectively (T = Si or Al). The bands at 3000–3600 cm−1 and 1648 cm−1 were related to intra- and inter-molecular hydrogen bonding, and interstitial bonded water, respectively. The FTIR analysis results confirmed that the 4A zeolite had been successfully synthesized from KPFT under the optimal synthesis conditions (No. 20).
3.2.2. SEM and EDX Analysis
As shown in Figure 7, the surface morphology of No. 20 was mainly composed of chamfered-edged cubes with a particle size of one to three μm. This conforms to the crystal structure of 4A zeolite. High-magnification SEM images showed the presence of irregular particles on the surface of cube or between the cubes. The area marked with a green square in Figure 7 was scanned by EDX. The EDX spectrum of No. 20 in Figure 8 indicates that the main chemical composition of No. 20 included Na, Al, Si, Fe, and some trace quantities of Ti and Ca derived from KPFT. Further EDX analysis showed the detailed chemical compositions of chamfered-edged cubes. These results indicated that 4A zeolite can be synthesized by hydrothermal synthesis using KPFT as the raw material. This was consistent with the observation from FTIR analysis.
3.2.3. BET Specific Surface Area and Pore Size Analysis
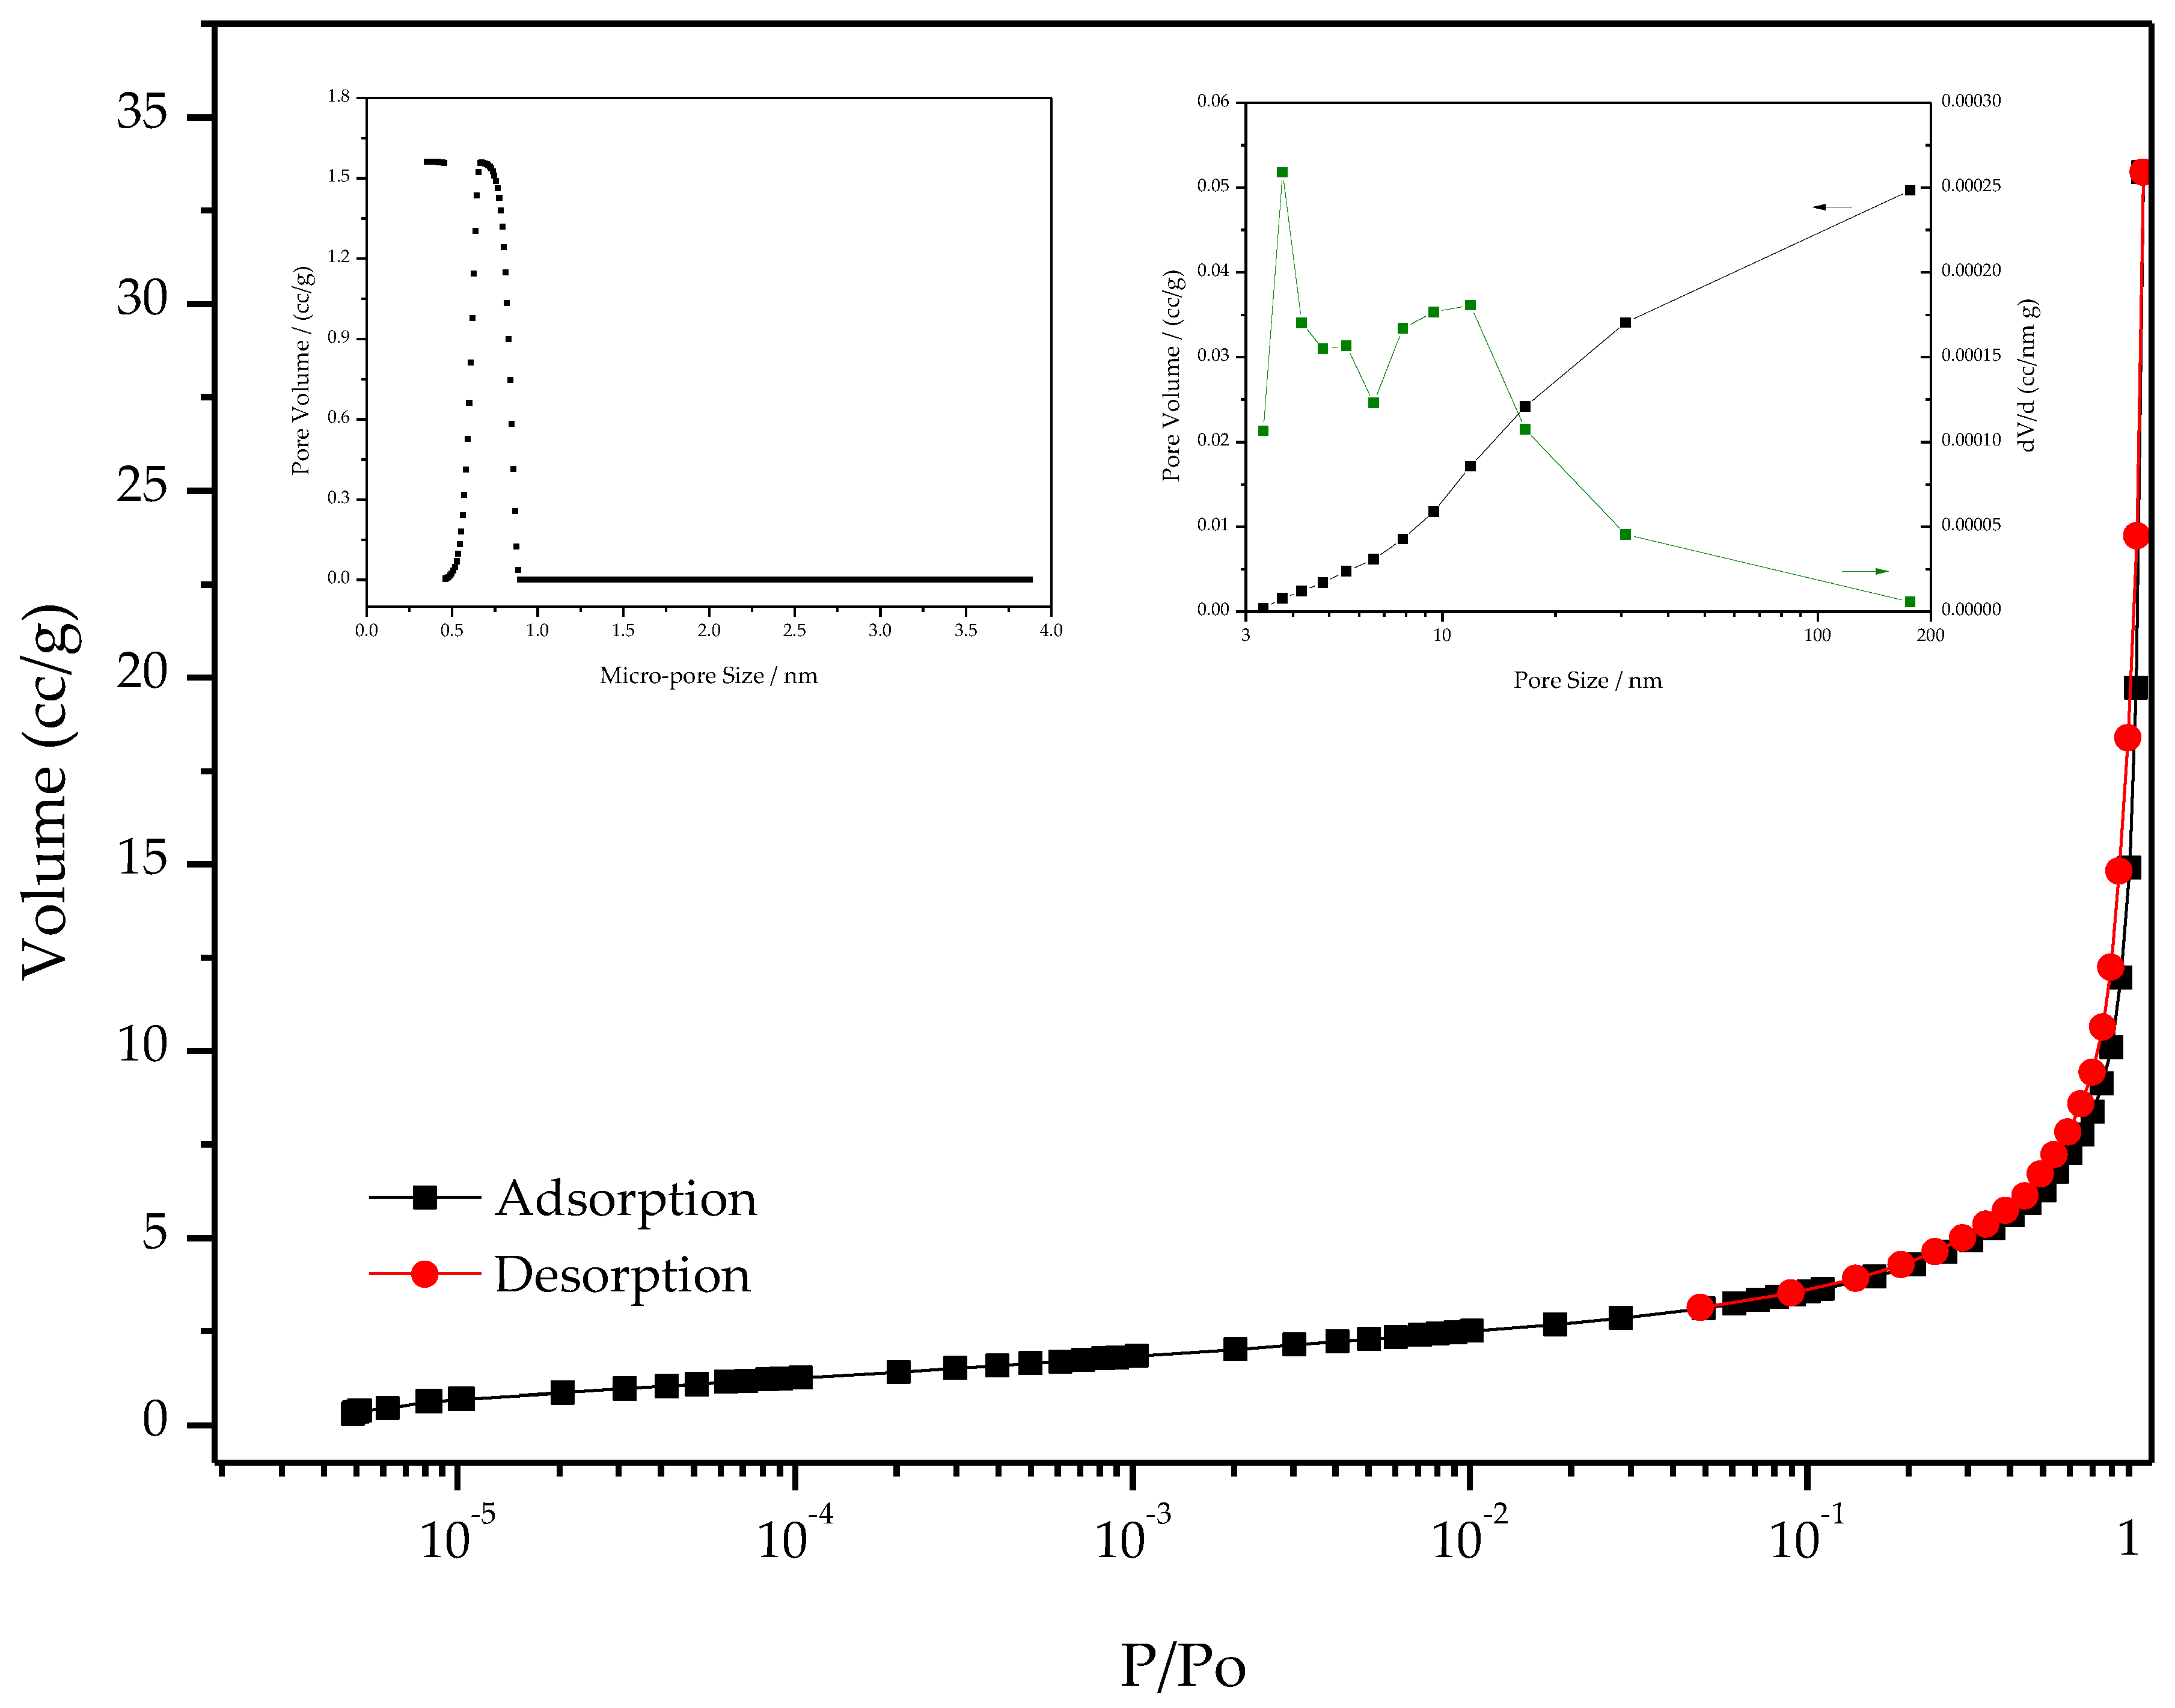
The BET specific surface area of No. 20 was 11.60 m2/g. This smaller value may be due to the fact that some of the pores were blocked by impurities in the KPFT; the phenomenon has also appeared in other studies [17]. The adsorption-desorption isotherms of No. 20 and further analysis of the pore size distribution of the micropores and mesopores are shown in Figure 9. The total pore volume was 0.052 cm3/g. According to the SF method, the micropore volume was 0.004 cm3/g, the micropore size ranged from 0.4 to 0.9 nm, and its equivalent size was 0.351 nm. According to the BJH model, the mesopore volume was 0.050 cm3/g, the mesopore size was in the range of 3.3 to 176.4 nm, and its equivalent size was 3.754 nm.
3.2.4. TG-DSC Measurements
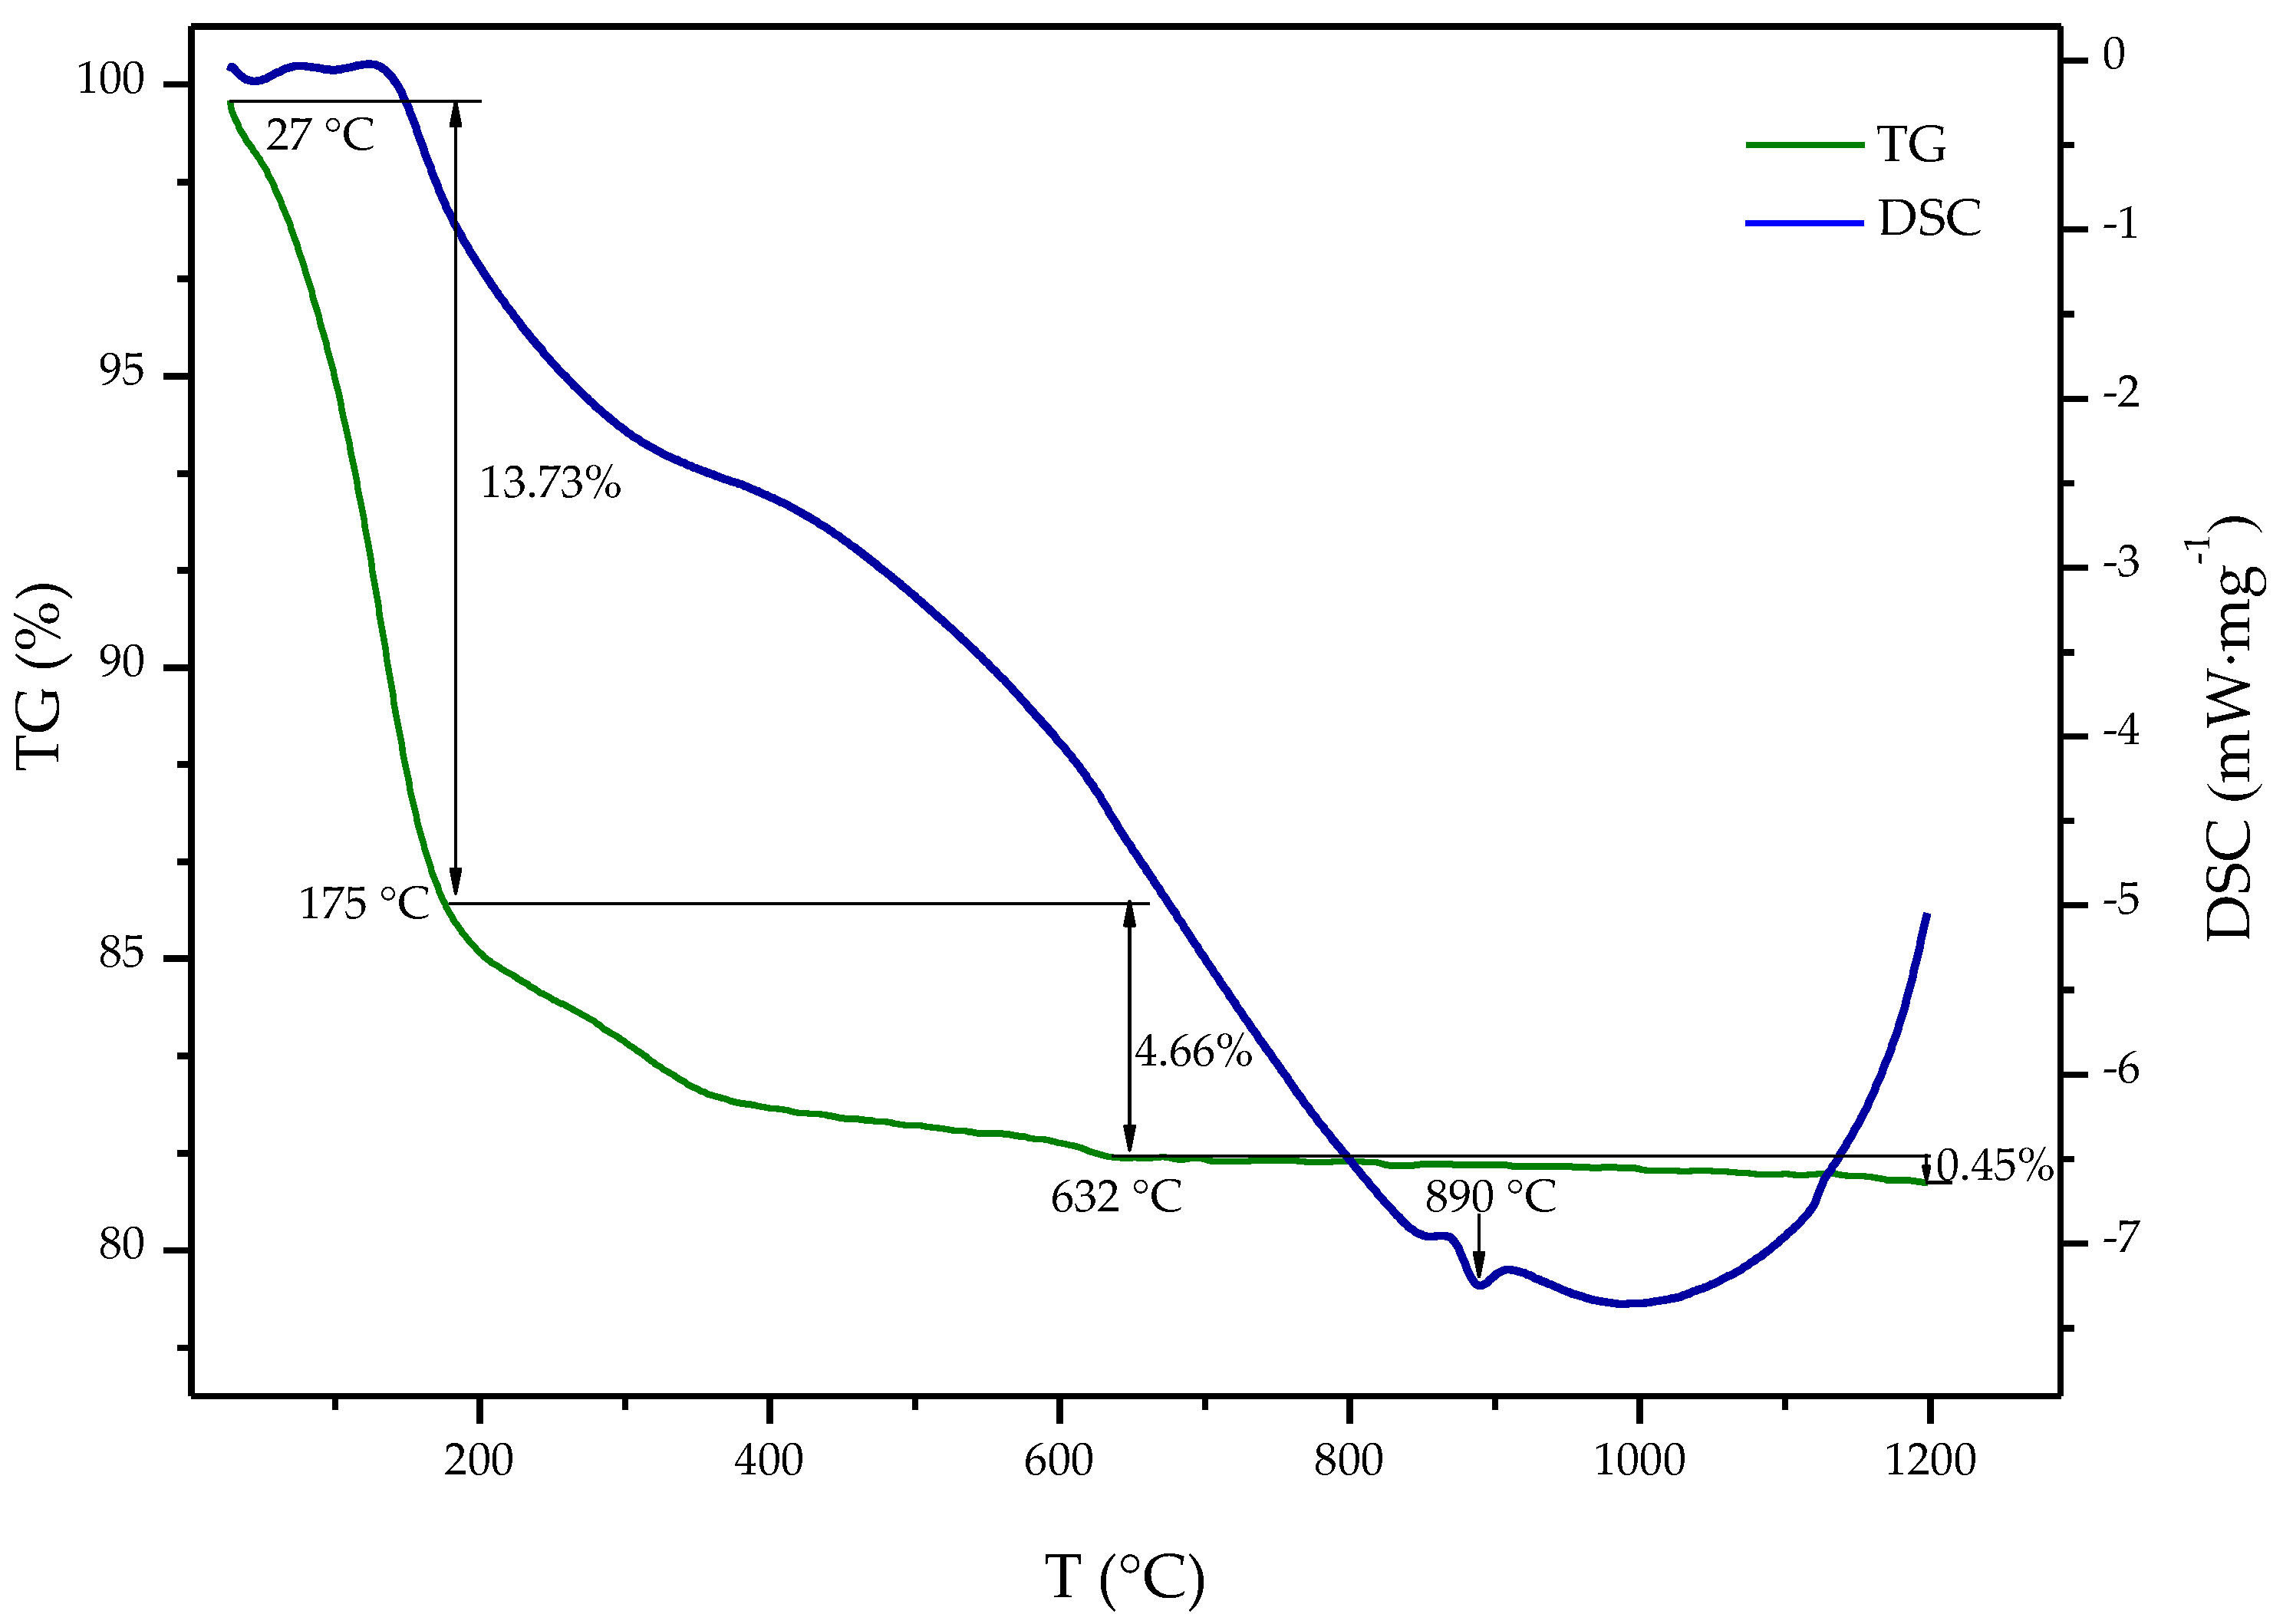
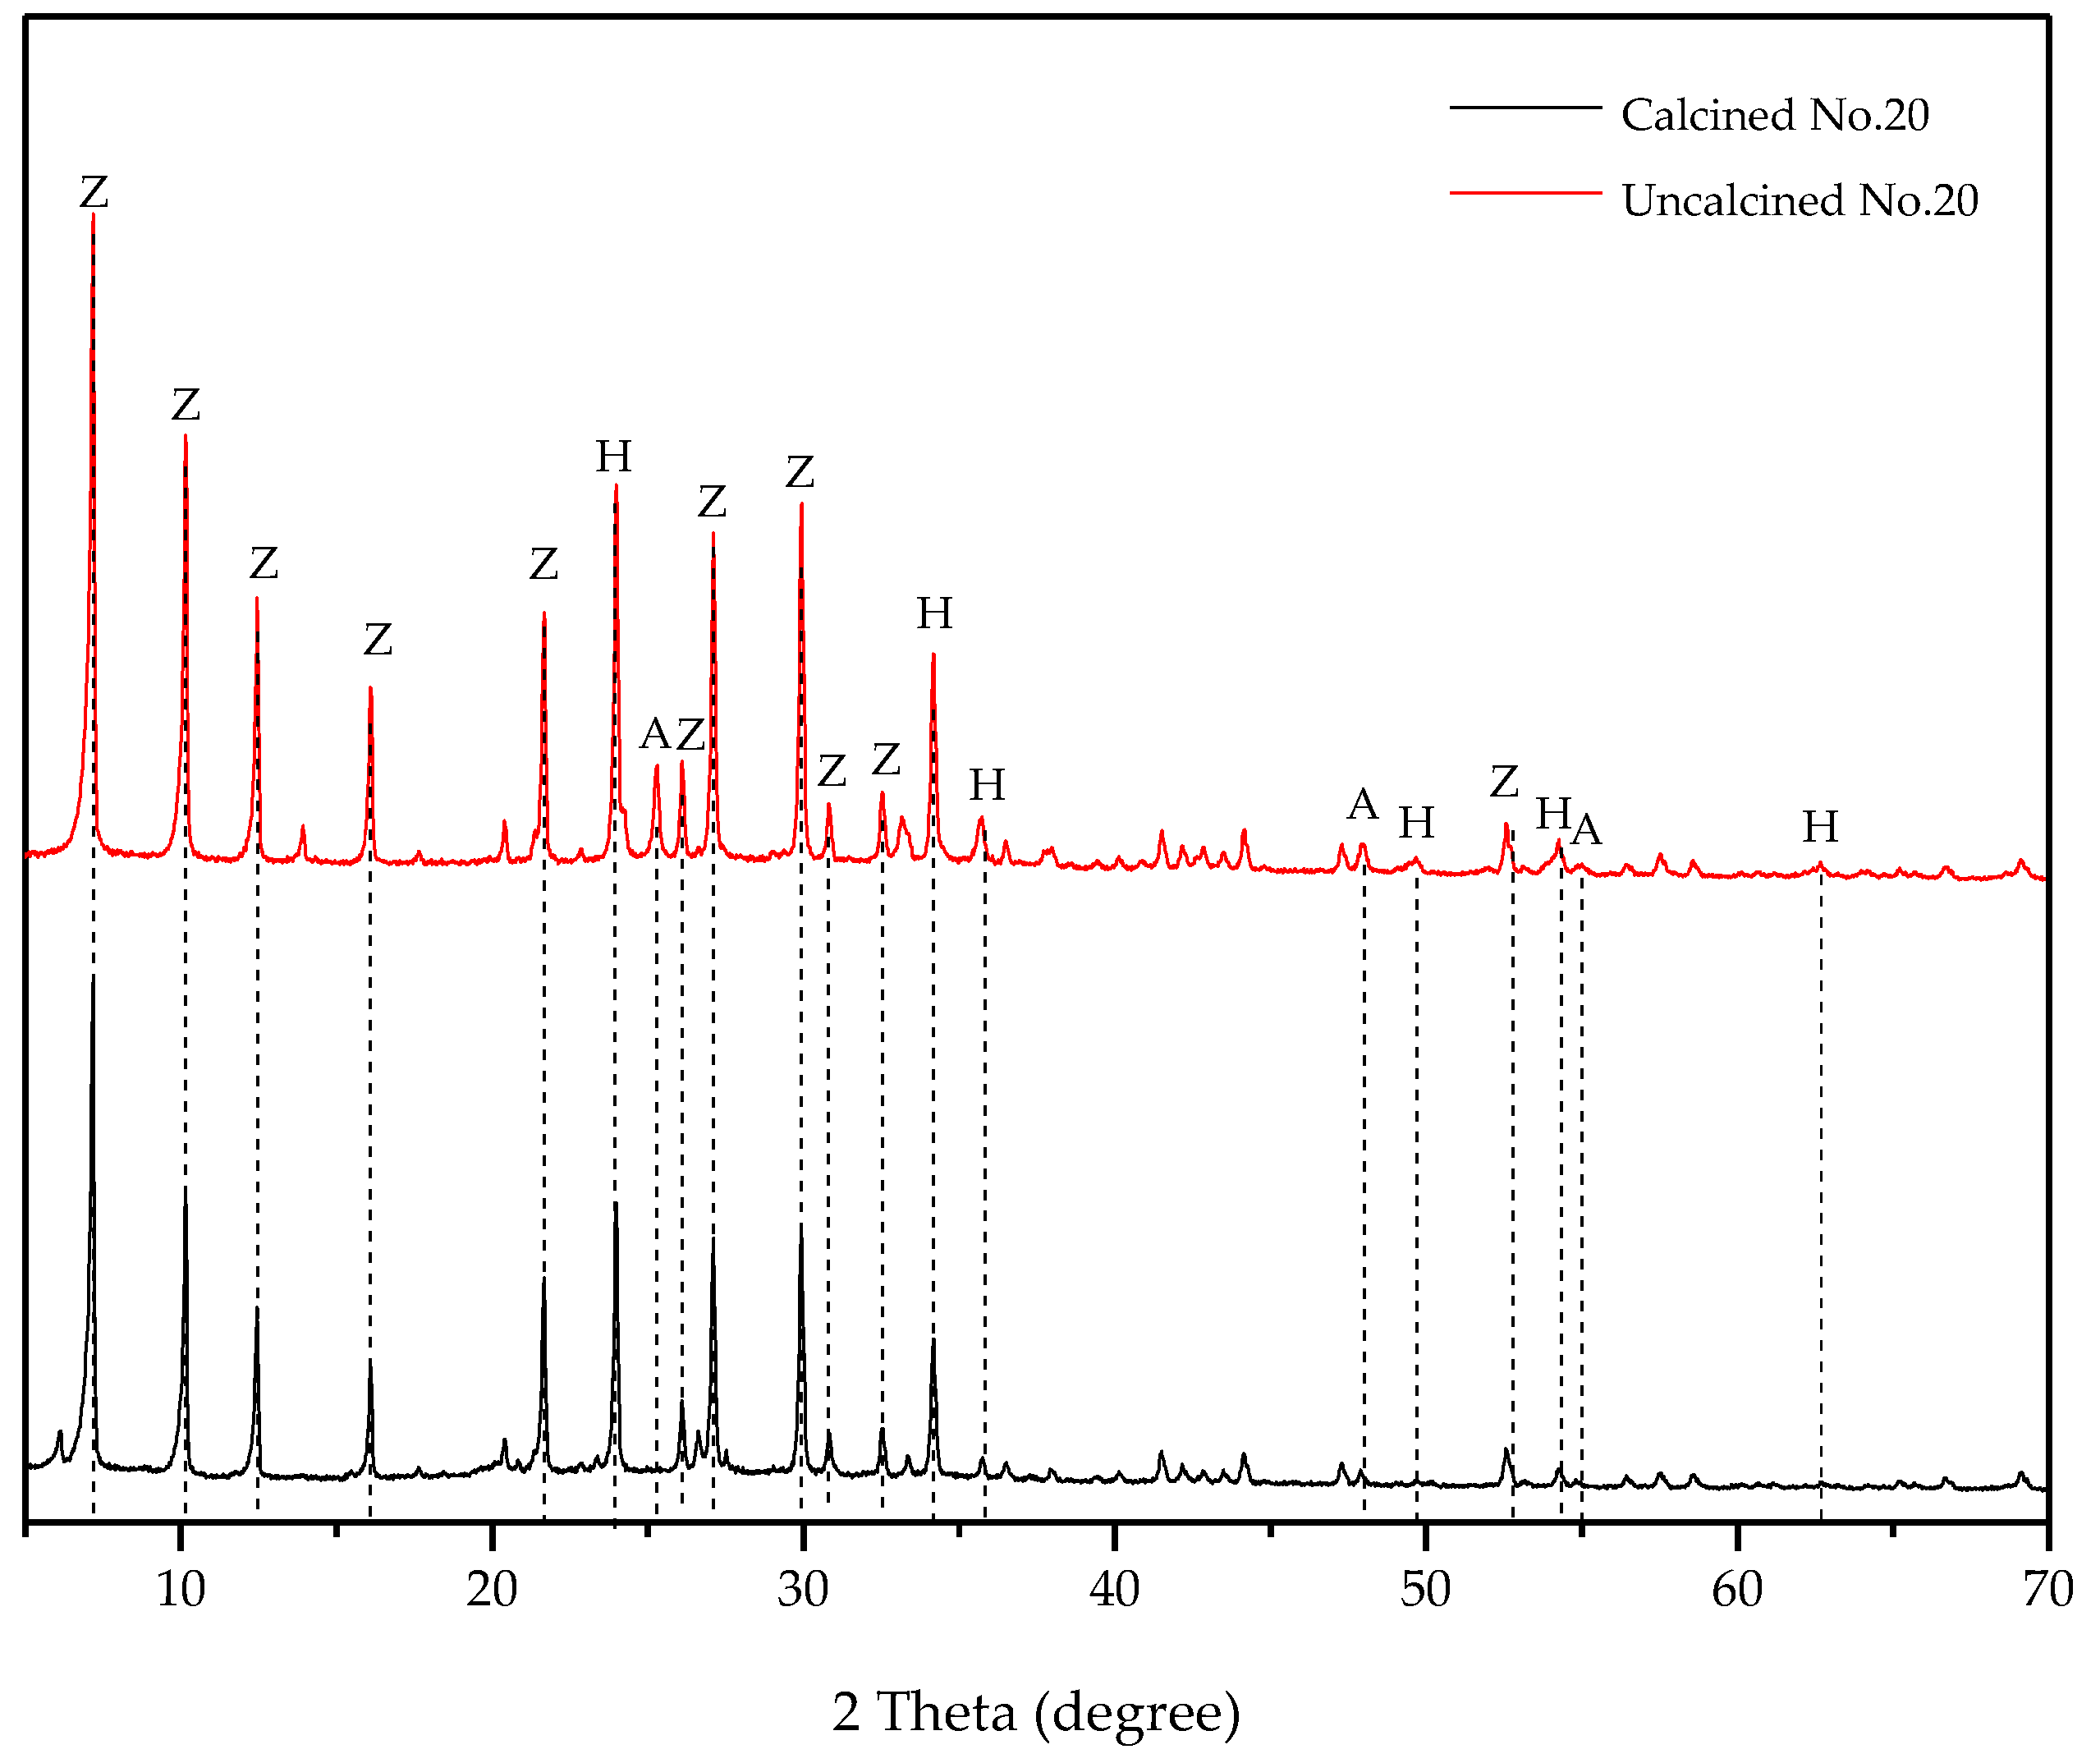
The TG-DSC measurement results are shown in Figure 10. According to the TG-DSC curves, a total mass loss of 18.84% was observed in several stages. First, a loss of 13.73% was observed from room temperature to 175 °C, a second mass loss of 4.66% was observed from 175 to approximately 632 °C, and a final loss of 0.45% was observed in the range of 632 to 1200 °C. These losses of 13.73%, and 8.07% were respectively attributed to the water losses from the surface and the pores of 4A zeolite. Above 632 °C, mass loss was only 0.45%, which means that the synthesized 4A zeolite was structurally stable. From the DSC curve, a significant endothermic peak was determined at 890 °C; the peak indicated structural damage of the 4A zeolite. The TG-DSC measurement results indicated that the synthesized 4A zeolite (No. 20) was thermally stable up to approximately 890 °C. The XRD patterns of the calcined and uncalcined No. 20 samples at 850 °C are shown in Figure 11. As can be seen from the XRD patterns, after calcination at 850 °C, there was no significant change in the sample phase. This was consistent with the observation from TG-DSC.
4. Conclusions
KPFT are a type of low-quality kaolin that contain impurities, and the main chemical compositions of KPFT are SiO2, Al2O3 and Fe2O3. KPFT were calcined at 800 °C for two hours to produce CKPFT. The main component of CKPFT was metakaolin.
4A zeolite was synthesized through the hydrothermal method using CKPFT as the silicon and aluminum source. The optimal hydrothermal synthesis conditions were determined to be a ratio of 5 g CKPFT, 6.5 g NaOH, 65 mL H2O, a crystallization temperature 110 °C, and a crystallization time three hours. The RC and CEC of the 4A zeolite that was synthesized under the optimal hydrothermal synthesis conditions were 40.77% and 210.32 mg CaCO3·g−1, respectively. The synthesized 4A zeolite was thermally stable up to approximately 890 °C.
The analysis results of FTIR, SEM, and EDX indicated that KPFT can be used as a feasible and economical raw material for the practical industrial applications of 4A zeolite.
Author Contributions
Y.C. and W.W. conceived and designed the experiments; Y.Z. performed the experiments and analyzed the data; W.W. contributed reagents and materials; Y.C. wrote the paper.
Funding
This study was financially supported by Postgraduate Innovation Fund Project by Southwest University of Science and Technology (18ycx052).
Conflicts of Interest
The authors declare no conflict of interest.
References
- Kosanović, C.; Subotić, B.; Ristić, A. Kinetic analysis of temperature-induced transformation of zeolite 4A to low-carnegieite. Mater. Chem. Phys. 2004, 86, 390–398. [Google Scholar] [CrossRef]
- Liu, H.; Peng, S.; Shu, L.; Chen, T.; Bao, T.; Frost, R.L. Magnetic zeolite NaA: Synthesis, characterization based on metakaolin and its application for the removal of Cu2+, Pb2+. Chemosphere 2013, 91, 1539–1546. [Google Scholar] [CrossRef] [PubMed]
- Hasan, F.; Singh, R.; Li, G.; Zhao, D.; Webley, P.A. Direct synthesis of hierarchical LTA zeolite via a low crystallization and growth rate technique in presence of cetyltrimethylammonium bromide. J. Colloid Interface Sci. 2012, 382, 1–12. [Google Scholar] [CrossRef] [PubMed]
- Mousavi, S.F.; Jafari, M.; Kazemimoghadam, M.; Mohammadi, T. Template free crystallization of zeolite Rho via hydrothermal synthesis: Effects of synthesis time, synthesis temperature, water content and alkalinity. Ceram. Int. 2013, 39, 7149–7158. [Google Scholar] [CrossRef]
- Wang, J.-Q.; Huang, Y.-X.; Pan, Y.; Mi, J.-X. Hydrothermal synthesis of high purity zeolite A from natural kaolin without calcination. Microporous Mesoporous Mater. 2014, 199, 50–56. [Google Scholar] [CrossRef]
- Covarrubias, C.; Arriagada, R.; Yáñez, J.; García, R.; Angélica, M.; Barros, S.D.; Arroyo, P.; Sousa-Aguiar, E.F. Removal of chromium(III) from tannery effluents, using a system of packed columns of zeolite and activated carbon. J. Chem. Technol. Biotechnol. 2005, 80, 899–908. [Google Scholar] [CrossRef]
- Ali Khan, I.; Loughlin, K.F. Kinetics of sorption in deactivated zeolite crystal adsorbents. Comput. Chem. Eng. 2003, 27, 689–696. [Google Scholar] [CrossRef]
- Dornath, P.; Fan, W. Dehydration of fructose into furans over zeolite catalyst using carbon black as adsorbent. Microporous Mesoporous Mater. 2014, 191, 10–17. [Google Scholar] [CrossRef]
- Li, G.Q.; Xiong, L.; Lin, H.Q.; Qu, M.Z. Controlled synthesis of large inner diameter carbon nanotubes by Ni-Fe/zeolite 4A catalyst. J. Inorg. Chem. 2009, 25, 1330–1335. (In Chinese) [Google Scholar]
- Sherry, H.S.; Walton, H.F. The ion-exchange properties of zeolites. II. Ion exchange in the synthetic Zeolite Linde 4A. J. Phys. Chem. 1967, 71, 1457–1465. [Google Scholar] [CrossRef]
- Ayele, L.; Pérez, E.; Mayoral, Á.; Chebude, Y.; Díaz, I. Synthesis of zeolite A using raw kaolin from Ethiopia and its application in removal of Cr(III) from tannery wastewater. J. Chem. Technol. Biotechnol. 2018, 93, 146–154. [Google Scholar] [CrossRef]
- Hui, K.S.; Chao, C.Y.H. Pure, single phase, high crystalline, chamfered-edge zeolite 4A synthesized from coal fly ash for use as a builder in detergents. J. Hazard. Mater. 2006, 137, 401–409. [Google Scholar] [CrossRef] [PubMed]
- Liu, T.; Wang, Y.; Dong, H.; Dong, J.; Qinhua, X.U.; Han, S. Synthesis of detergent-used zeolite 4A from Montmorillonite. J. Naijing Univ. 2001, 37, 97–103. (In Chinese) [Google Scholar]
- Dufour, J.; Gonzã¡Lez, V.; Iglesia, A.L. Optimization of 4A zeolite synthesis as recovery of wastes from aluminum finishing. J. Environ. Sci. Health Part A Toxic/Hazard. Subst. Environ. Eng. 2001, 36, 1257–1269. [Google Scholar] [CrossRef]
- Lei, P.-C.; Shen, X.-J.; Li, Y.; Guo, M.; Zhang, M. An improved implementable process for the synthesis of zeolite 4A from bauxite tailings and its Cr3+ removal capacity. Int. J. Min. Met. Mater. 2016, 23, 850–857. [Google Scholar] [CrossRef]
- Ohgushi, T.; Komarneni, S.; Bhalla, A.S. Mechanism of microwave heating of zeolite A. J. Porous Mater. 2001, 8, 23–35. [Google Scholar] [CrossRef]
- Wang, W.; Feng, Q.; Liu, K.; Zhang, G.; Liu, J.; Huang, Y. A novel magnetic 4A zeolite adsorbent synthesised from kaolinite type pyrite cinder (KTPC). Solid State Sci. 2015, 39, 52–58. [Google Scholar] [CrossRef]
- Shen, X.; Qiu, G.; Yue, C.; Guo, M.; Zhang, M. Multiple copper adsorption and regeneration by zeolite 4A synthesized from bauxite tailings. Environ. Sci. Pollut. Res. Int. 2017, 24, 21829–21835. [Google Scholar] [CrossRef] [PubMed]
- Seliem, M.K.; Komarneni, S. Equilibrium and kinetic studies for adsorption of iron from aqueous solution by synthetic Na-A zeolites: Statistical modeling and optimization. Microporous Mesoporous Mater. 2016, 228, 266–274. [Google Scholar] [CrossRef]
- Hui, K.S.; Chao, C.Y.H. Effects of step-change of synthesis temperature on synthesis of zeolite 4A from coal fly ash. Microporous Mesoporous Mater. 2006, 88, 145–151. [Google Scholar] [CrossRef]
- Davis, M.E.; Lobo, R.F. Zeolite and molecular sieve synthesis. Chem. Mater. 1992, 4, 756–768. [Google Scholar] [CrossRef]
- Alkan, M.; Hopa, C.; Yilmaz, Z.; Güler, H. The effect of alkali concentration and solid/liquid ratio on the hydrothermal synthesis of zeolite NaA from natural kaolinite. Microporous Mesoporous Mater. 2005, 86, 176–184. [Google Scholar] [CrossRef]
- Zayed, A.M.; Selim, A.Q.; Mohamed, E.A.; Abdel Wahed, M.S.M.; Seliem, M.K.; Sillanpää, M. Adsorption characteristics of Na-A zeolites synthesized from Egyptian kaolinite for manganese in aqueous solutions: Response surface modeling and optimization. Appl. Clay Sci. 2017, 140, 17–24. [Google Scholar] [CrossRef]
- Maia, A.Á.B.; Neves, R.F.; Angélica, R.S.; Pöllmann, H. Synthesis, optimisation and characterisation of the zeolite NaA using kaolin waste from the Amazon region. Production of zeolites KA, MgA and CaA. Appl. Clay Sci. 2015, 108, 55–60. [Google Scholar] [CrossRef]
- Jiang, J. Study on synthesis of pure 4A-zeolite from attapulgite clay by calcination and alkali-leaching. Non-Met. Mines 2009, 32, 13–15, 17. (In Chinese) [Google Scholar]
- Lu, P.N. Preparation of 4A zeolite as detergent builder from bentonite. China Surfactant Deterg. Cosmet. 1991, 4, 1–6. (In Chinese) [Google Scholar]
- Miao, Q.; Zhou, Z.; Yang, J.; Lu, J.; Yan, S.; Wang, J. Synthesis of NaA zeolite from kaolin source. Front. Chem. Eng. China 2009, 3, 8–11. [Google Scholar] [CrossRef]
- Costa, E.; Lucas, A.D.; Uguina, M.A.; Ruiz, J.C. Synthesis of 4A zeolite from calcined kaolins for use in detergents. Ind. Eng. Chem. Res. 1988, 27, 1291–1296. [Google Scholar] [CrossRef]
- Ma, D.; Wang, Z.; Guo, M.; Zhang, M.; Liu, J. Feasible conversion of solid waste bauxite tailings into highly crystalline 4A zeolite with valuable application. Waste Manag. 2014, 34, 2365–2372. [Google Scholar] [CrossRef] [PubMed]
- Guo, Z.; Feng, Q.; Wang, W.; Huang, Y.; Deng, J.; Xu, Z. Study on flotation tailings of kaolinite-type pyrite when used as cement admixture and concrete admixture. Procedia Environ. Sci. 2016, 31, 644–652. [Google Scholar] [CrossRef]
- Azizi, H.R.; Pakdehi, S.G.; Babaee, S. Thermodynamic study and optimization a nano-zeolitefor dehydration liquid fuel (DMAZ) using taguchi L16 orthogonal array. Arab. J. Sci. Eng. 2017, 1, 1–8. [Google Scholar] [CrossRef]
- Ayele, L.; Pérez-Pariente, J.; Chebude, Y.; Díaz, I. Synthesis of zeolite A from Ethiopian kaolin. Microporous Mesoporous Mater. 2015, 215, 29–36. [Google Scholar] [CrossRef]
Figure 1.
The X-ray diffraction (XRD) pattern of kaolinite-type pyrite flotation tailings (KPFT).

Figure 2.
XRD pattern of calcinated KPFT (CKPFT).

Figure 3.
Grain size distribution curve of CKPFT powder.

Figure 4.
XRD patterns of the samples synthesized at different temperatures: (a) 50 °C, (b) 70 °C, (c) 90 °C, (d) 110 °C, and (e) 130 °C, and (f) commercial 4A zeolite. (Z: 4A zeolite, A: anatase, H: hematite, and S: sodalite).
Figure 4.
XRD patterns of the samples synthesized at different temperatures: (a) 50 °C, (b) 70 °C, (c) 90 °C, (d) 110 °C, and (e) 130 °C, and (f) commercial 4A zeolite. (Z: 4A zeolite, A: anatase, H: hematite, and S: sodalite).


Figure 5.
Effects of level variation for studied parameters process on the cation exchange capacity (CEC) and relative crystallinity (RC) of synthesized 4A zeolite.
Figure 5.
Effects of level variation for studied parameters process on the cation exchange capacity (CEC) and relative crystallinity (RC) of synthesized 4A zeolite.

Figure 6.
Fourier transform infrared (FTIR) spectrum of No. 20 and commercial 4A zeolite.

Figure 7.
Scanning electron microscope (SEM) image of No. 20.

Figure 8.
Energy dispersive X-ray (EDX) spectrum of No. 20.

Figure 9.
N2 adsorption-desorption isotherms of No. 20. The inset figures show the pore size distributions of the micropores and mesopores.
Figure 9.
N2 adsorption-desorption isotherms of No. 20. The inset figures show the pore size distributions of the micropores and mesopores.

Figure 10.
Thermogravimetry-differential scanning calorimetry (TG-DSC) curves of No. 20 from room temperature up to 1200 °C.
Figure 10.
Thermogravimetry-differential scanning calorimetry (TG-DSC) curves of No. 20 from room temperature up to 1200 °C.

Figure 11.
X-ray diffraction (XRD) patterns of the calcined and uncalcined No. 20 samples at 850 °C (Z: 4A zeolite, A: anatase, and H: hematite).
Figure 11.
X-ray diffraction (XRD) patterns of the calcined and uncalcined No. 20 samples at 850 °C (Z: 4A zeolite, A: anatase, and H: hematite).


Table 1.
The chemical composition of kaolinite-type pyrite flotation tailings (KPFT) examined by X-ray fluorescence spectroscopy (XRF).
Table 1.
The chemical composition of kaolinite-type pyrite flotation tailings (KPFT) examined by X-ray fluorescence spectroscopy (XRF).
| Component | Na2O | K2O | SiO2 | Al2O3 | Fe2O3 | TiO2 |
| Mass Fraction (%) | 0.19 | 0.21 | 48.23 | 38.61 | 3.67 | 5.57 |
| Component | CaO | MgO | SO3 | ZrO2 | Cr2O3 | P2O5 |
| Mass Fraction (%) | 1.23 | 0.26 | 1.44 | 0.17 | 0.10 | 0.13 |
Table 2.
The orthogonal array of the 4A zeolite synthesis.
| No. | T (°C) | t (h) | NaOH (g) | H2O (mL) | No. | T (°C) | t (h) | NaOH (g) | H2O (mL) |
|---|---|---|---|---|---|---|---|---|---|
| 01 | 50 | 3 | 4.5 | 5 | 14 | 90 | 7 | 6.0 | 55 |
| 02 | 50 | 5 | 5.0 | 60 | 15 | 90 | 9 | 6.5 | 60 |
| 03 | 50 | 7 | 5.5 | 65 | 16 | 110 | 5 | 4.5 | 70 |
| 04 | 50 | 9 | 6.0 | 70 | 17 | 110 | 7 | 5.0 | 75 |
| 05 | 50 | 11 | 6.5 | 75 | 18 | 110 | 9 | 5.5 | 55 |
| 06 | 70 | 7 | 4.5 | 60 | 19 | 110 | 11 | 6.0 | 60 |
| 07 | 70 | 9 | 5.0 | 65 | 20 | 110 | 3 | 6.5 | 65 |
| 08 | 70 | 11 | 5.5 | 70 | 21 | 130 | 9 | 4.5 | 75 |
| 09 | 70 | 3 | 6.0 | 75 | 22 | 130 | 11 | 5.0 | 55 |
| 10 | 70 | 5 | 6.5 | 55 | 23 | 130 | 3 | 5.5 | 60 |
| 11 | 90 | 11 | 4.5 | 65 | 24 | 130 | 5 | 6.0 | 65 |
| 12 | 90 | 3 | 5.0 | 70 | 25 | 130 | 7 | 6.5 | 70 |
| 13 | 90 | 5 | 5.5 | 75 |
Table 3.
Relative crystallinity (RC) and cation exchange capacity (CEC) of synthesized samples.
| No. | RC (%) | CEC (mg CaCO3·g−1) | No. | RC (%) | CEC (mg CaCO3·g−1) |
|---|---|---|---|---|---|
| 01 | 0.48 | 23.04 | 14 | 38.83 | 173.21 |
| 02 | 0.36 | 34.20 | 15 | 37.16 | 188.78 |
| 03 | 0.49 | 44.96 | 16 | 10.90 | 105.31 |
| 04 | 0.56 | 44.96 | 17 | 19.12 | 132.46 |
| 05 | 0.51 | 45.01 | 18 | 34.92 | 132.21 |
| 06 | 0.38 | 55.57 | 19 | 20.61 | 123.75 |
| 07 | 2.55 | 75.99 | 20 | 40.77 | 210.32 |
| 08 | 11.73 | 105.01 | 21 | 5.61 | 105.31 |
| 09 | 0.47 | 24.32 | 22 | 21.18 | 114.57 |
| 10 | 0.58 | 45.01 | 23 | 36.30 | 165.71 |
| 11 | 47.94 | 195.73 | 24 | 25.45 | 132.06 |
| 12 | 0.44 | 11.66 | 25 | 24.21 | 132.61 |
| 13 | 2.05 | 55.69 |
© 2018 by the authors. Licensee MDPI, Basel, Switzerland. This article is an open access article distributed under the terms and conditions of the Creative Commons Attribution (CC BY) license (http://creativecommons.org/licenses/by/4.0/).
Share and Cite
MDPI and ACS Style
Cui, Y.; Zheng, Y.; Wang, W. Synthesis of 4A Zeolite from Kaolinite-Type Pyrite Flotation Tailings (KPFT). Minerals 2018, 8, 338. https://doi.org/10.3390/min8080338
AMA Style
Cui Y, Zheng Y, Wang W. Synthesis of 4A Zeolite from Kaolinite-Type Pyrite Flotation Tailings (KPFT). Minerals. 2018; 8(8):338. https://doi.org/10.3390/min8080338
Chicago/Turabian StyleCui, Yating, Yu Zheng, and Weiqing Wang. 2018. "Synthesis of 4A Zeolite from Kaolinite-Type Pyrite Flotation Tailings (KPFT)" Minerals 8, no. 8: 338. https://doi.org/10.3390/min8080338
Note that from the first issue of 2016, this journal uses article numbers instead of page numbers. See further details here.