High-Pressure Phase Diagrams of Na2CO3 and K2CO3

 , , , , , , , ,
Abstract
:1. Introduction
2. Methods
2.1. Experimental Techniques
2.1.1. MA Experiments
2.1.2. DAC-APS
2.1.3. DAC-SSTRC
2.2. Details of Ab Initio Calculations
2.3. Indexing
3. Results And Discussion
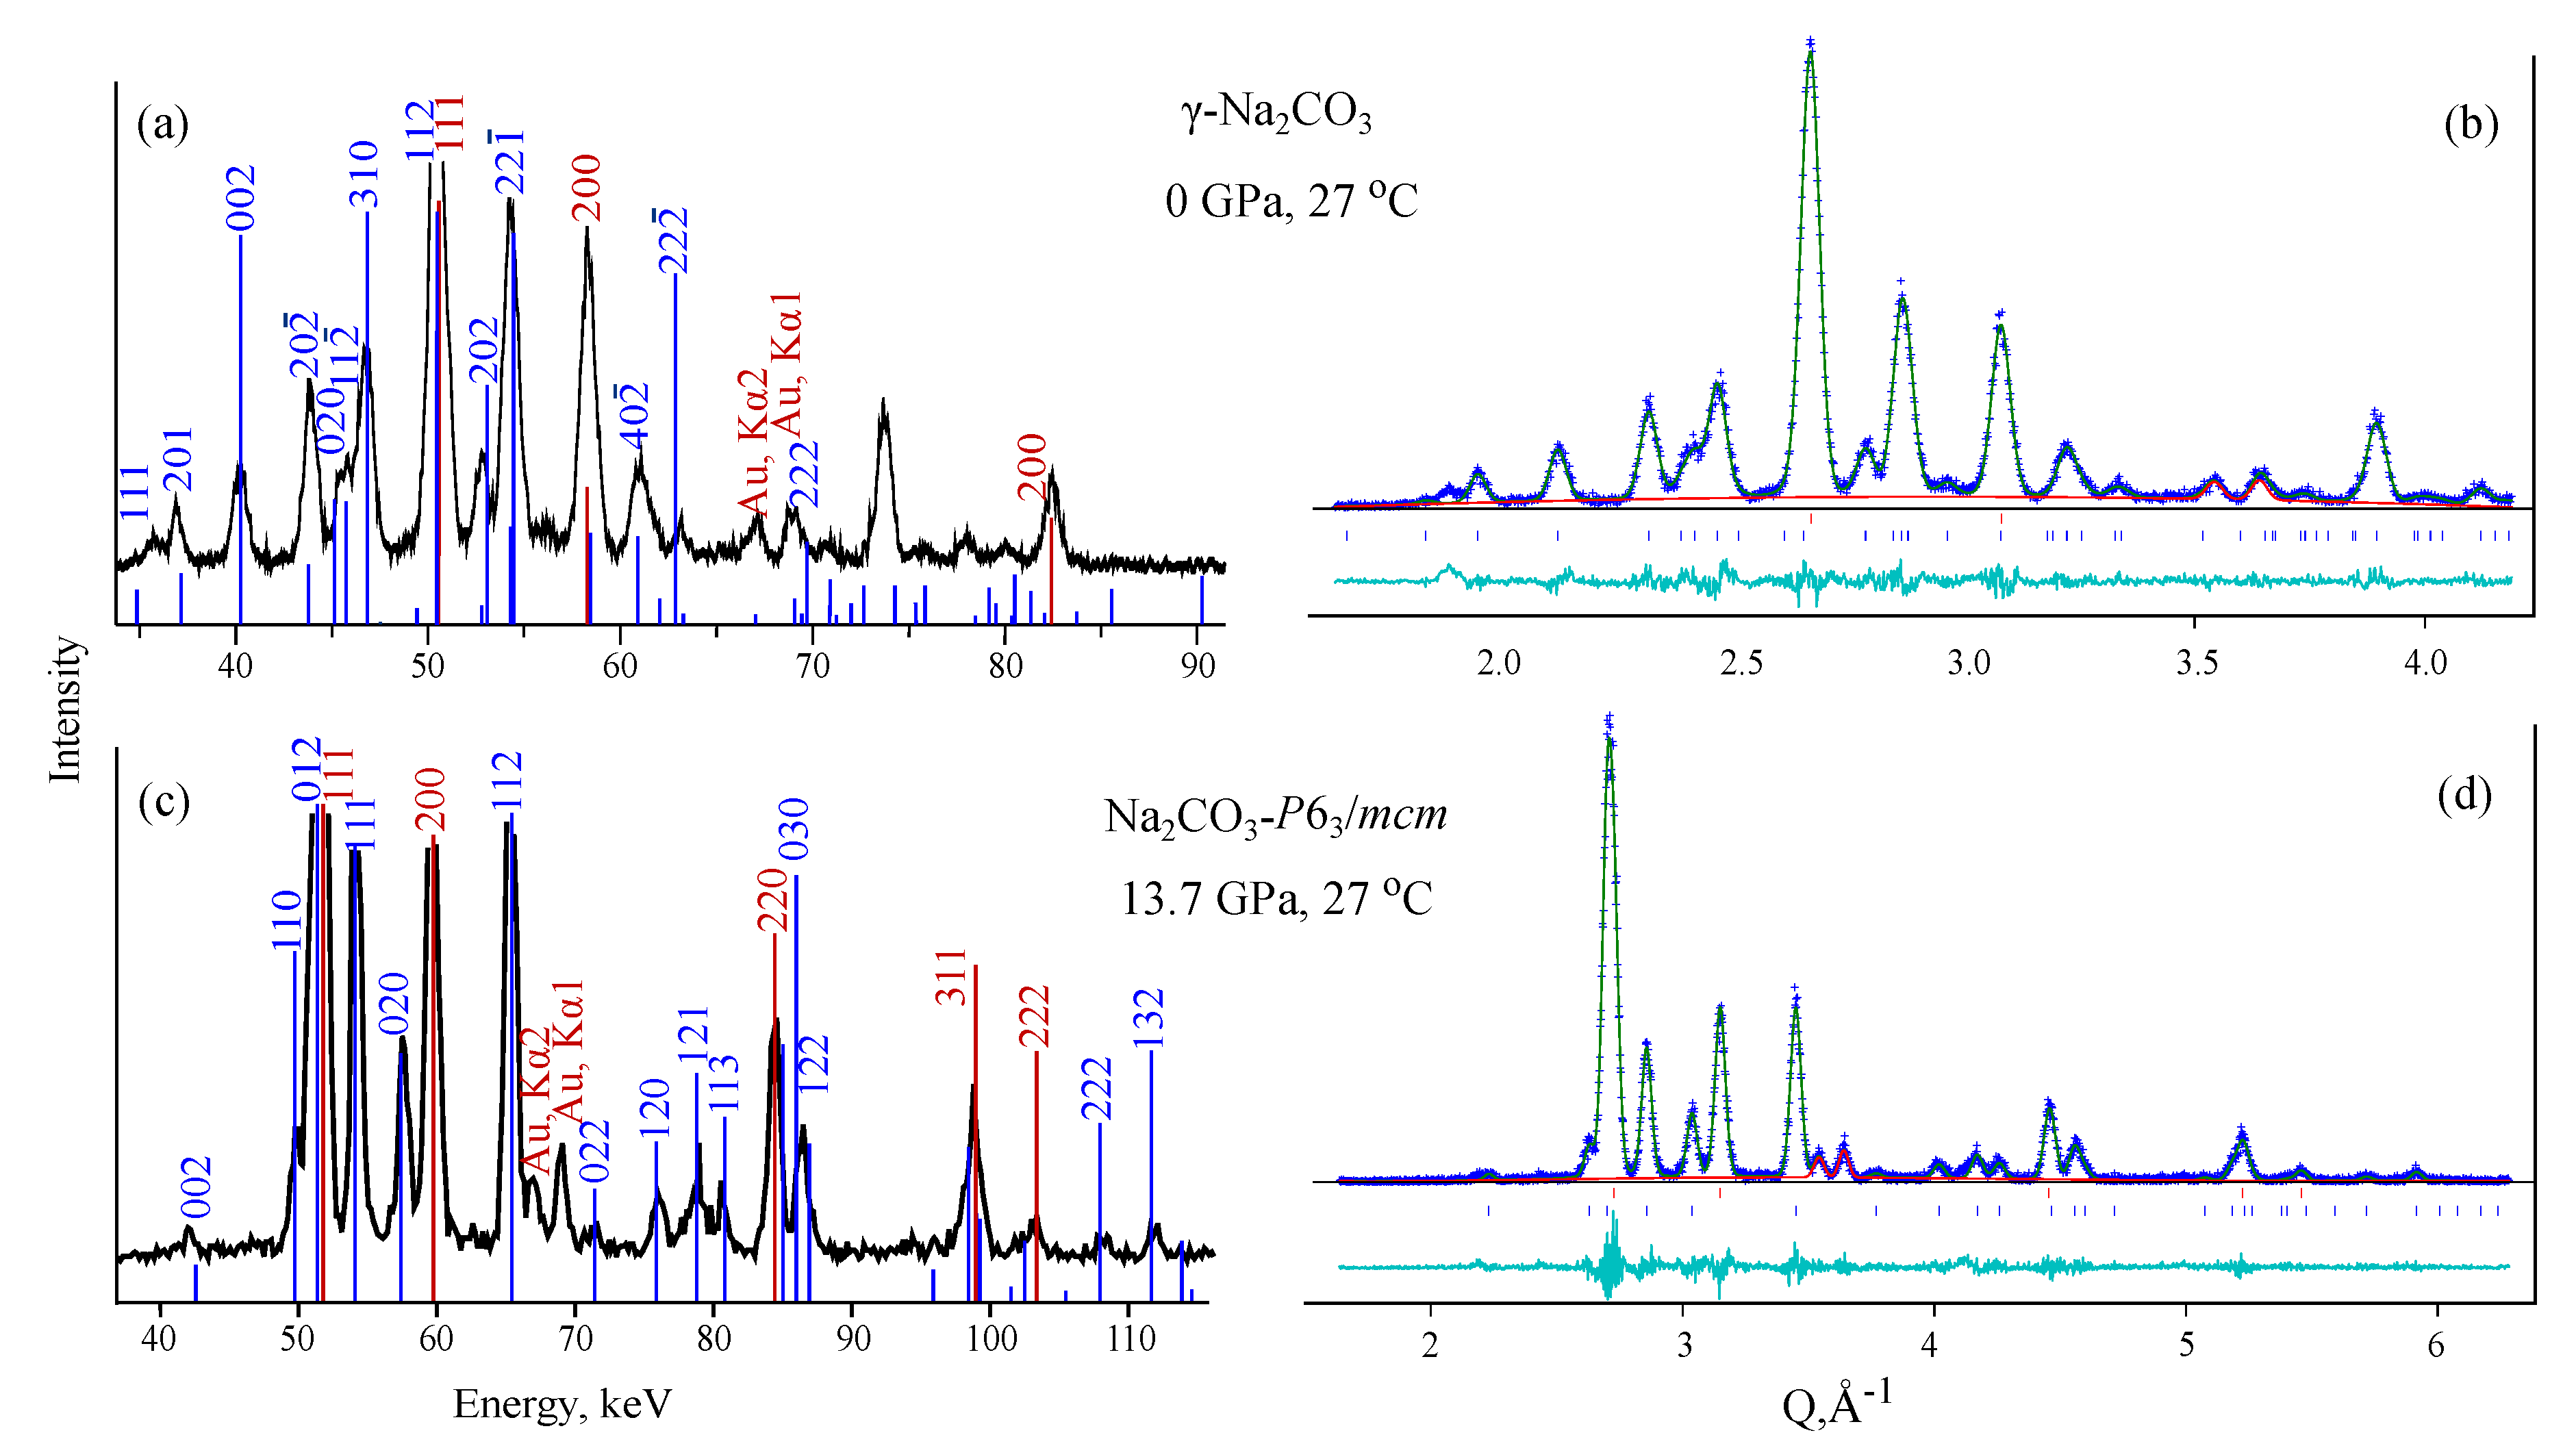
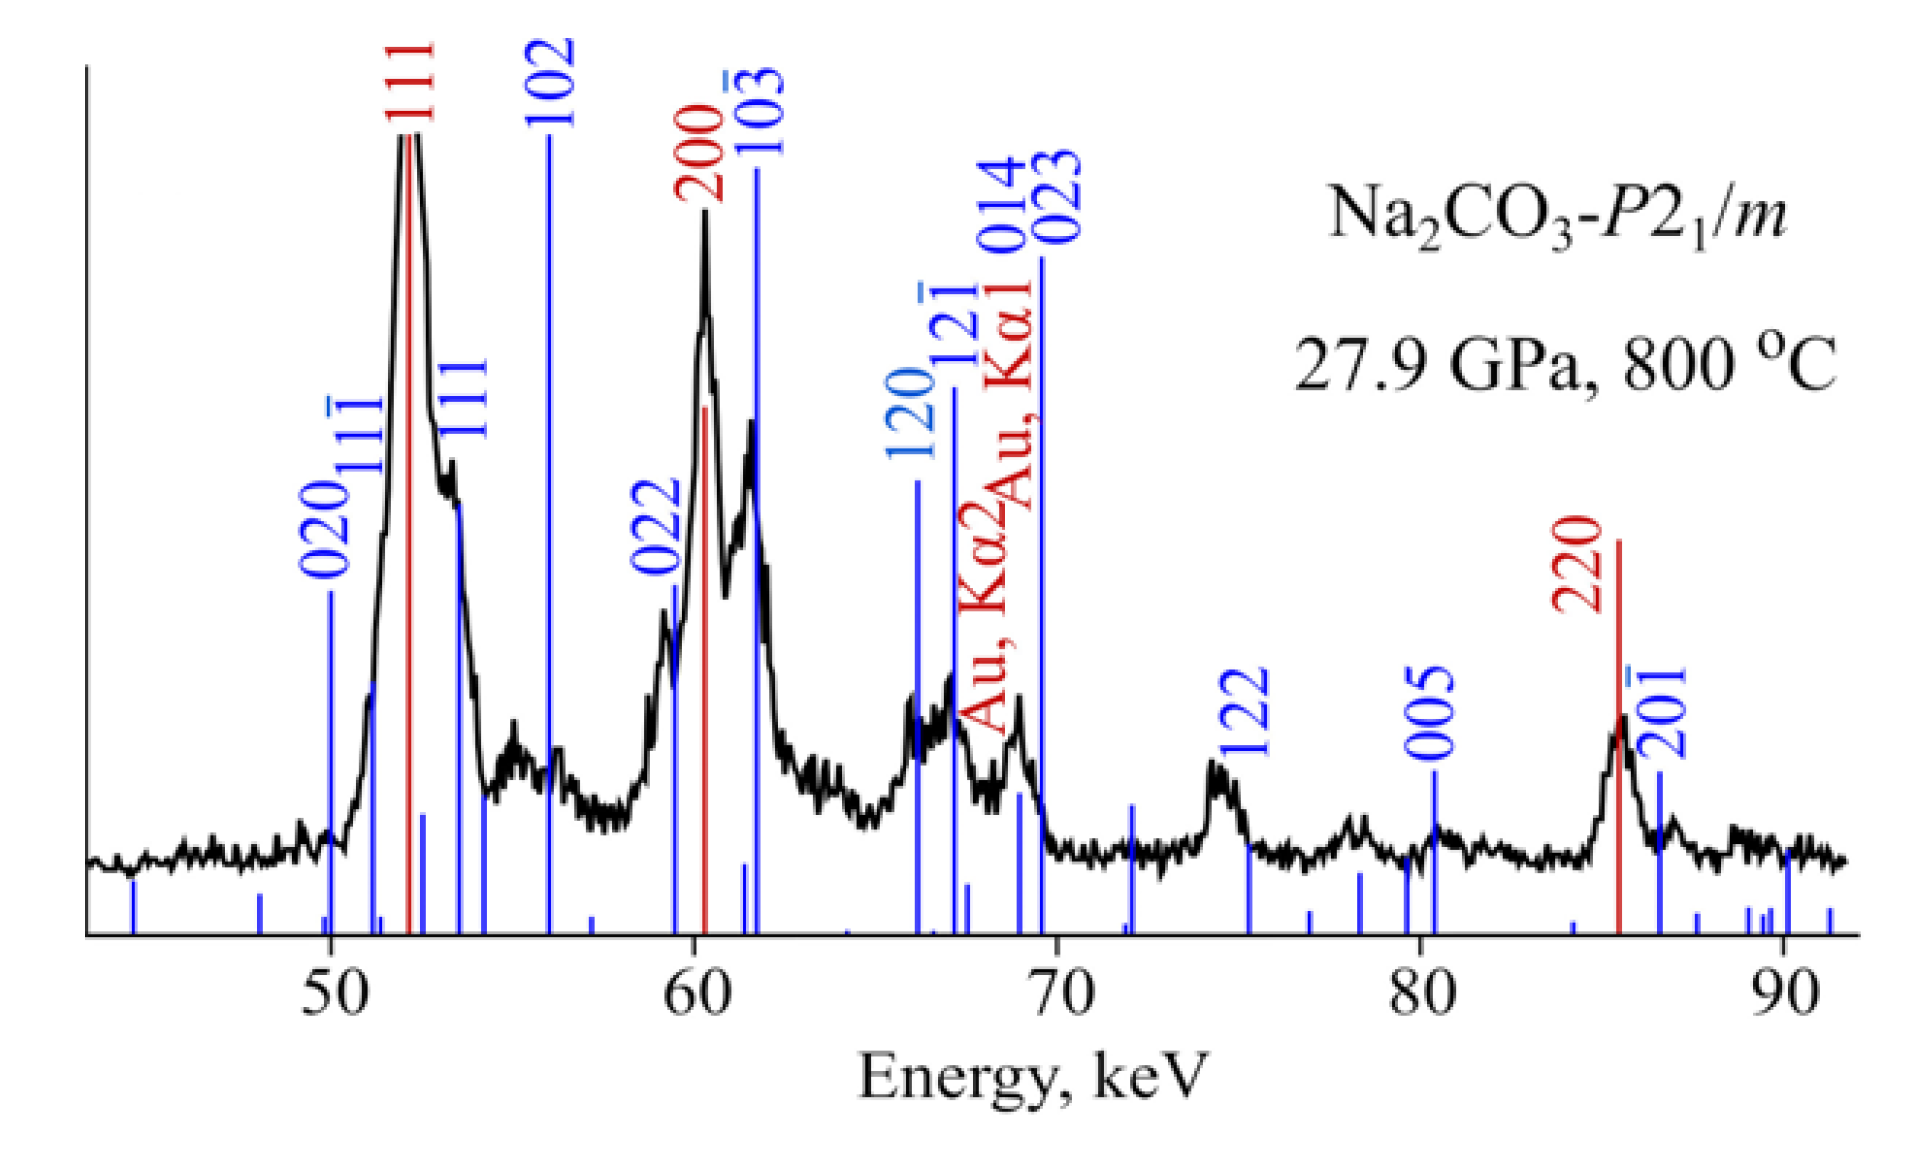
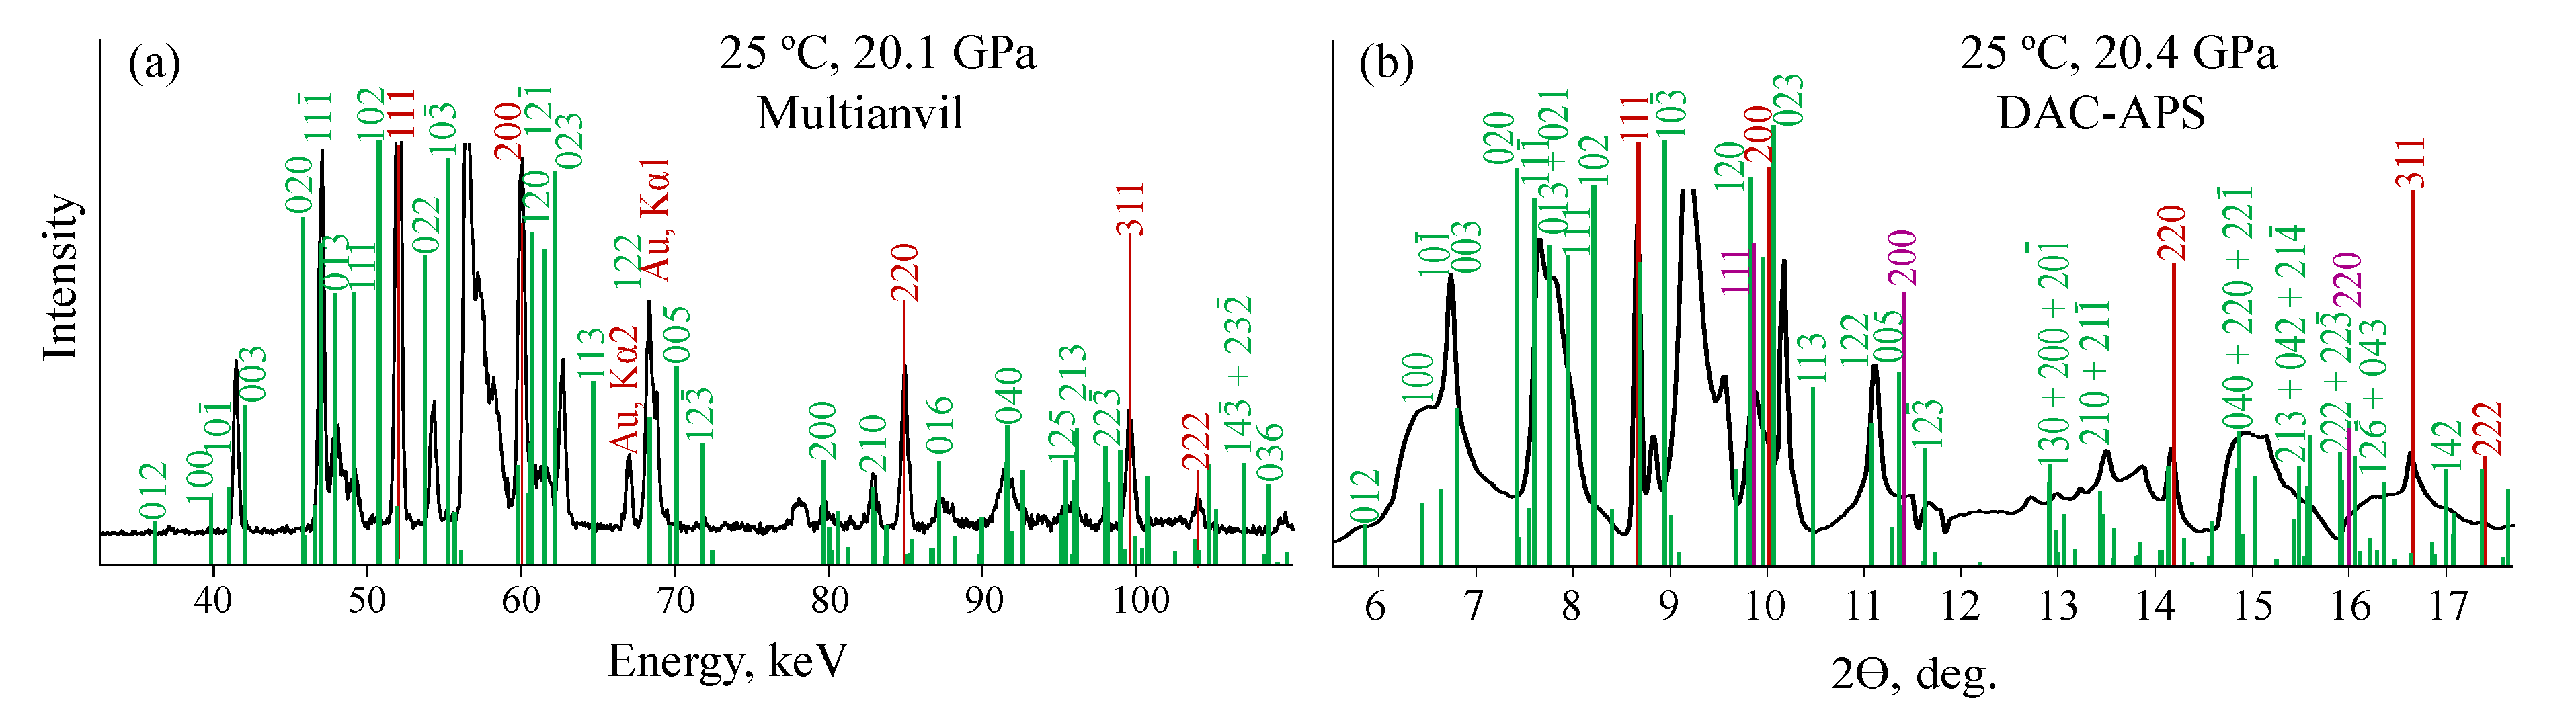
3.1. NaCO
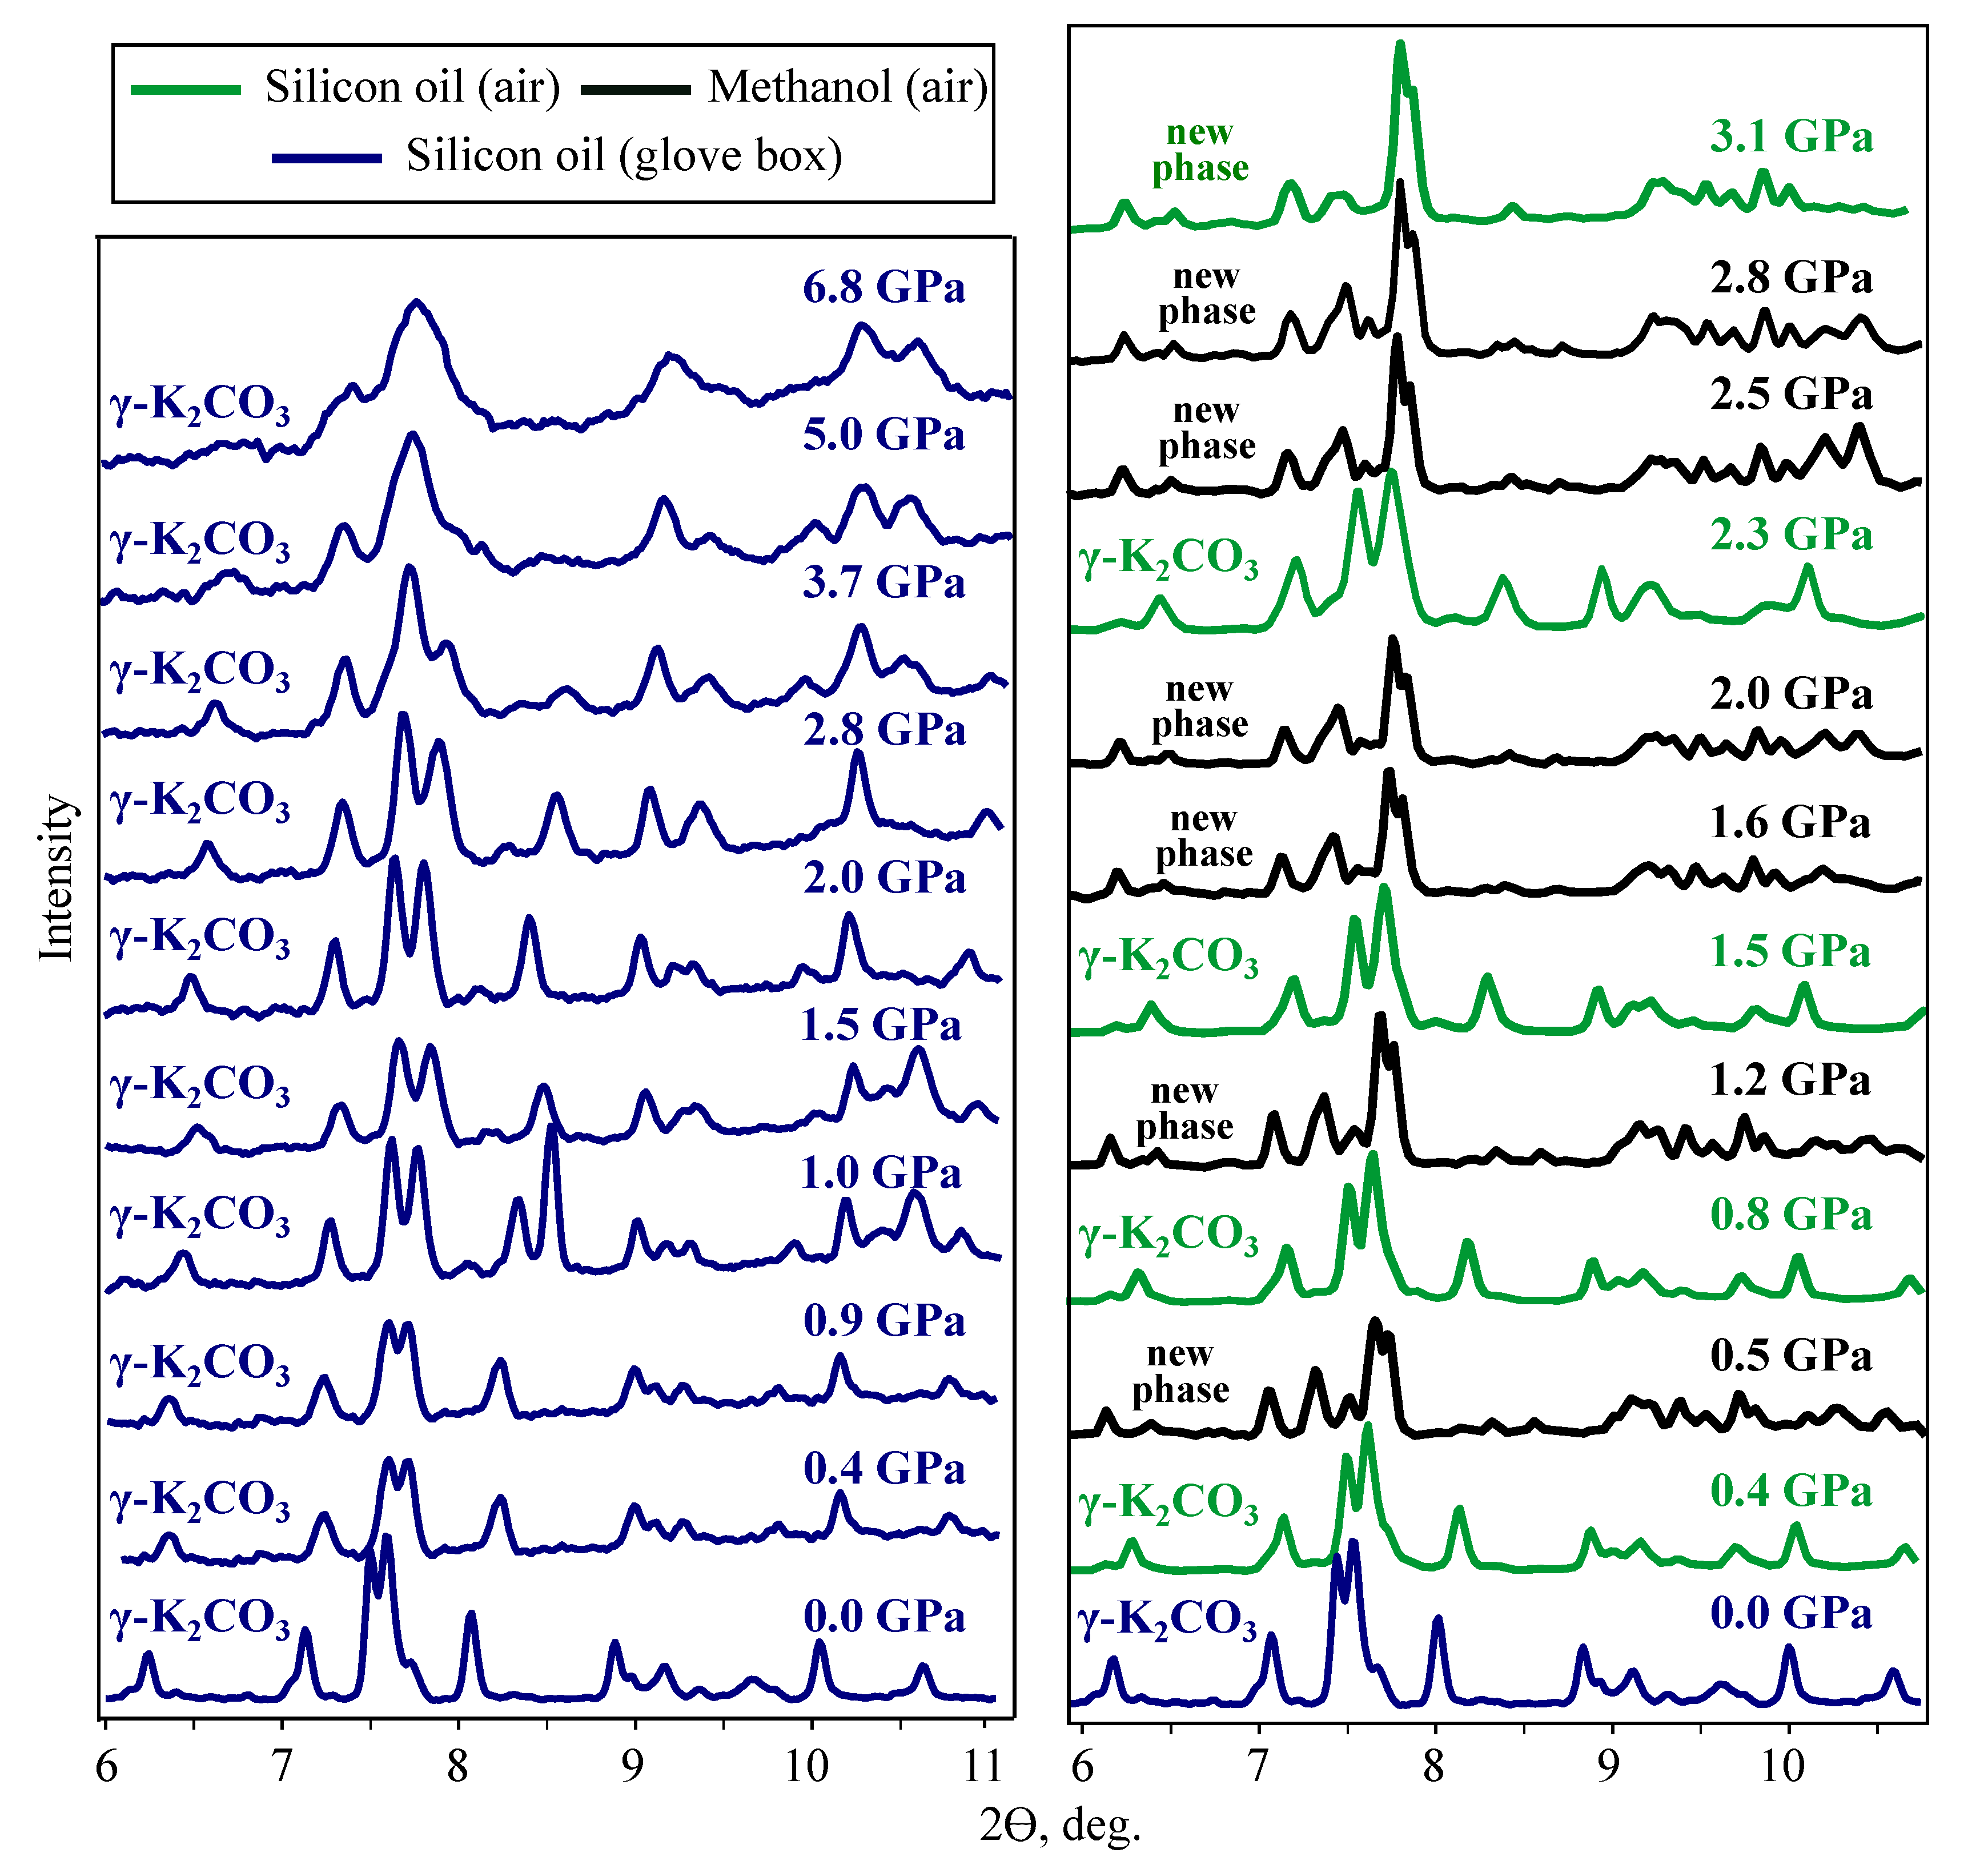
3.2. KCO
3.2.1. MA and DAC-APS Results
3.2.2. Indexing of Experimental Diffraction Patterns
3.2.3. The Effect of Water
4. Theoretical P-T Diagrams and Stability of The Phases
5. Discussion
Supplementary Materials
Author Contributions
Funding
Acknowledgments
Conflicts of Interest
References
- Zubkova, N.; Pushcharovsky, D.Y.; Ivaldi, G.; Ferraris, G.; Pekov, I.; Chukanov, N. Crystal structure of natrite, γ-Na2CO3. Neues Jahrb. FÜR-Mineral. Monatshefte 2002, 2002, 85–96. [Google Scholar] [CrossRef]
- Gittins, J.; McKie, D. Alkalic carbonatite magmas: Oldoinyo Lengai and its wider applicability. Lithos 1980, 13, 213–215. [Google Scholar] [CrossRef]
- Zaitsev, A.; Keller, J.; Spratt, J.; Jeffries, T.; Sharygin, V. Chemical composition of nyerereite and gregoryite from natrocarbonatites of Oldoinyo Lengai volcano, Tanzania. Geol. Ore Depos. 2009, 51, 608–616. [Google Scholar] [CrossRef]
- Bolotina, N.B.; Gavryushkin, P.N.; Korsakov, A.V.; Rashchenko, S.V.; Seryotkin, Y.V.; Golovin, A.V.; Moine, B.N.; Zaitsev, A.N.; Litasov, K.D. Incommensurately modulated twin structure of nyerereite Na1.64K0.36Ca(CO3)2. Struct. Sci. Cryst. Eng. Mater. 2017, 73, 276–284. [Google Scholar] [CrossRef] [PubMed]
- Gavryushkin, P.N.; Thomas, V.G.; Bolotina, N.B.; Bakakin, V.V.; Golovin, A.V.; Seryotkin, Y.V.; Fursenko, D.A.; Litasov, K.D. Hydrothermal synthesis and structure solution of Na2Ca(CO3)2:“synthetic analogue” of mineral nyerereite. Cryst. Growth Des. 2016, 16, 1893–1902. [Google Scholar] [CrossRef]
- McKie, D.; Frankis, E. Nyerereite: A new volcanic carbonate mineral from Oldoinyo Lengai, Tanzania. Z. Kristallogr. Cryst. Mater. 1977, 145, 73–95. [Google Scholar] [CrossRef]
- Golovin, A.V.; Sharygin, I.S.; Korsakov, A.V. Origin of alkaline carbonates in kimberlites of the siberian craton: Evidence from melt inclusions in mantle olivine of the Udachnaya-East pipe. Chem. Geol. 2017, 455, 357–375. [Google Scholar] [CrossRef]
- Egorov, K.; Ushchapovskaia, Z.; Kashaev, A.; Bogdanov, G.; Sizykh, I.I. Zemkorite-a new carbonate from yakutian kimberlites. Akad. Nauk. SSSR Dokl. 1988, 301, 188–193. [Google Scholar]
- Dickens, B.; Hyman, A.; Brown, W. Crystal structure of Ca2Na2(CO3)3 (shortite). J. Res. Natl. Bur. Stand. Sec. A Phys. Chem. 1971, 75, 129–140. [Google Scholar] [CrossRef]
- Pabst, A. The crystallography structure of eitelite, Na2Mg(CO3)2. Am. Mineral. 1973, 58, 211–217. [Google Scholar]
- Pertlik, F. Structural investigations of synthetic fairchildite, K2Ca(CO3)2. Z. Kristallogr. 1981, 157, 199–205. [Google Scholar] [CrossRef]
- Hesse, K.-F.; Simons, B. Crystal structure of synthetic K2Mg(CO3)2. Z. Kristallogr. Cryst. Mater. 1982, 161, 289–292. [Google Scholar] [CrossRef]
- Shatskiy, A.; Rashchenko, S.V.; Ohtani, E.; Litasov, K.D.; Khlestov, M.V.; Borzdov, Y.M.; Kupriyanov, I.N.; Sharygin, I.S.; Palyanov, Y.N. The system Na2CO3-FeCO3 at 6 GPa and its relation to the system Na2CO3-FeCO3-MgCO3. Am. Mineral. 2015, 100, 130–137. [Google Scholar] [CrossRef]
- Gavryushkin, P.N.; Bakakin, V.V.; Bolotina, N.B.; Shatskiy, A.F.; Seryotkin, Y.V.; Litasov, K.D. Synthesis and crystal structure of new carbonate Ca3Na2(CO3)4 homeotypic with orthoborates M3Ln2(BO3)4 (M=Ca, Sr and Ba). Cryst. Growth Des. 2014, 14, 4610–4616. [Google Scholar] [CrossRef]
- Shatskiy, A.; Gavryushkin, P.N.; Litasov, K.D.; Koroleva, O.N.; Kupriyanov, I.N.; Borzdov, Y.M.; Sharygin, I.S.; Funakoshi, K.; Palyanov, Y.N.; Ohtani, E. Na-Ca carbonates synthesized under upper-mantle conditions: Raman spectroscopic and X-ray diffraction studies. Eur. J. Mineral. 2015, 27, 175–184. [Google Scholar] [CrossRef]
- Shatskiy, A.; Sharygin, I.S.; Litasov, K.D.; Borzdov, Y.M.; Palyanov, Y.N.; Ohtani, E. New experimental data on phase relations for the system Na2CO3-CaCO3 at 6 GPa and 900–1400 °C. Am. Mineral. 2013, 98, 2164–2171. [Google Scholar] [CrossRef]
- Rashchenko, S.V.; Bakakin, V.V.; Shatskiy, A.F.; Gavryushkin, P.N.; Seryotkin, Y.V.; Litasov, K.D. Noncentrosymmetric Na2Ca4(CO3)5 carbonate of “M13M23XY3Z” structural type and affinity between borate and carbonate structures for design of new optical materials. Cryst. Growth Des. 2017, 17, 6079–6084. [Google Scholar] [CrossRef]
- Song, Y.; Luo, M.; Zhao, D.; Peng, G.; Lin, C.; Ye, N. Explorations of new UV nonlinear optical materials in the Na2CO3-CaCO3 system. J. Mater. Chem. 2017, 5, 8758–8764. [Google Scholar]
- Podborodnikov, I.V.; Shatskiy, A.; Arefiev, A.V.; Rashchenko, S.V.; Chanyshev, A.D.; Litasov, K.D. The system Na2CO3–CaCO3 at 3 GPa. Phys. Chem. Miner. 2018, 45, 773–1787. [Google Scholar] [CrossRef]
- Rashchenko, S.V.; Shatskiy, A.F.; Arefiev, A.V.; Seryotkin, Y.V.; Litasov, K.D. Na4Ca(CO3)3: A novel carbonate analog of borate optical materials. CrystEngComm 2018, 20, 5228–5232. [Google Scholar] [CrossRef]
- Kaminsky, F.V.; Wirth, R.; Schreiber, A. Carbonatitic inclusions in deep mantle diamond from Juina, Brazil: new minerals in the carbonate-halide association. Can. Mineral. 2013, 51, 669–688. [Google Scholar] [CrossRef]
- Kaminsky, F.; Matzel, J.; Jacobsen, B.; Hutcheon, I.; Wirth, R. Isotopic fractionation of oxygen and carbon in decomposed lower-mantle inclusions in diamond. Mineral. Petrol. 2016, 110, 379–385. [Google Scholar] [CrossRef]
- Li, Z.; Li, J.; Lange, R.; Liu, J.; Militzer, B. Determination of calcium carbonate and sodium carbonate melting curves up to Earth’s transition zone pressures with implications for the deep carbon cycle. Earth Planet. Sci. Lett. 2017, 457, 395–402. [Google Scholar] [CrossRef]
- Li, Z. Melting and Structural Transformations of Carbonates and Hydrous Phases in Earth’s Mantle. Ph.D. Thesis, University of Michigan, Ann Arbor, MI, USA, 2015. [Google Scholar]
- Wang, M.; Liu, Q.; Inoue, T.; Li, B.; Pottish, S.; Wood, J.; Yang, C.; Tao, R. The K2CO3 fusion curve revisited: New experiments at pressures up to 12 GPa. J. Mineral. Petrol. Sci. 2016, 111, 241–251. [Google Scholar] [CrossRef]
- Liu, Q.; Tenner, T.J.; Lange, R.A. Do carbonate liquids become denser than silicate liquids at pressure? Constraints from the fusion curve of K2CO3 to 3.2 GPa. Contrib. Mineral. Petrol. 2007, 153, 55–66. [Google Scholar] [CrossRef]
- Klement, W., Jr.; Cohen, L.H. Solid-solid and solid-liquid transitions in K2CO3, Na2CO3 and Li2CO3: Investigations to ≥5 kbar by differential thermal analysis; thermodynamics and structural correlations. Berichte Bunsenges. FÜR Phys. Chem. 1975, 79, 327–334. [Google Scholar] [CrossRef]
- Shatskiy, A.; Sharygin, I.S.; Gavryushkin, P.N.; Litasov, K.D.; Borzdov, Y.M.; Shcherbakova, A.V.; Higo, Y.; Funakoshi, K.-I.; Palyanov, Y.N.; Ohtani, E. The system K2CO3-MgCO3 at 6 GPa and 900–1450 °C. Am. Mineral. 2013, 98, 1593–1603. [Google Scholar] [CrossRef]
- Arefiev, A.V.; Shatskiy, A.; Podborodnikov, I.V.; Rashchenko, S.V.; Chanyshev, A.D.; Litasov, K.D. The system K2CO3–CaCO3 at 3 GPa: Link between phase relations and variety of K–Ca double carbonates at ≤0.1 and 6 GPa. Phys. Chem. Miner. 2018, 1–16. [Google Scholar] [CrossRef]
- Čančarevič, Ž.; Schön, J.; Jansen, M. Alkali metal carbonates at high pressure. Z. Anorg. Allg. Chem. 2006, 632, 1437–1448. [Google Scholar] [CrossRef]
- Gavryushkin, P.N.; Behtenova, A.; Popov, Z.I.; Bakakin, V.V.; Likhacheva, A.Y.; Litasov, K.D.; Gavryushkin, A. Toward analysis of structural changes common for alkaline carbonates and binary compounds: Prediction of high-pressure structures of Li2CO3, Na2CO3 and K2CO3. Cryst. Growth Des. 2016, 16, 5612–5617. [Google Scholar] [CrossRef]
- Katsura, T.; Funakoshi, K.-I.; Kubo, A.; Nishiyama, N.; Tange, Y.; Sueda, Y.-I.; Kubo, T.; Utsumi, W. A large-volume high-pressure and high-temperature apparatus for in situ X-ray observation,‘SPEED-Mk. II’. Phys. Earth Planet. Inter. 2004, 143, 497–506. [Google Scholar] [CrossRef]
- Sokolova, T.S.; Dorogokupets, P.I.; Dymshits, A.M.; Danilov, B.S.; Litasov, K.D. Microsoft excel spreadsheets for calculation of P–V–T relations and thermodynamic properties from equations of state of MgO, diamond and nine metals as pressure markers in high-pressure and high-temperature experiments. Comput. Geosci. 2016, 94, 162–169. [Google Scholar] [CrossRef]
- Prakapenka, V.; Kubo, A.; Kuznetsov, A.; Laskin, A.; Shkurikhin, O.; Dera, P.; Rivers, M.; Sutton, S. Advanced flat top laser heating system for high pressure research at gsecars: Application to the melting behavior of germanium. High Press. Res. 2008, 28, 225–235. [Google Scholar] [CrossRef]
- Gavryushkin, P.; Rashenko, S.; Shatskiy, A.; Litasov, K.; Ancharov, A. Compressibility and phase transitions of potassium carbonate at pressures below 30 kbar. J. Struct. Chem. 2016, 57, 1485–1488. [Google Scholar] [CrossRef]
- Piminov, P.; Baranov, G.; Bogomyagkov, A.; Berkaev, D.; Borin, V.; Dorokhov, V.; Karnaev, S.; Kiselev, V.; Levichev, E.; Meshkov, O.; et al. Synchrotron radiation research and application at VEPP-4. Phys. Procedia 2016, 84, 19–26. [Google Scholar] [CrossRef]
- Hammersley, A.; Svensson, S.; Hanfland, M.; Fitch, A.; Hausermann, D. Two-dimensional detector software: From real detector to idealised image or two-theta scan. Int. J. High Press. Res. 1996, 14, 235–248. [Google Scholar] [CrossRef]
- Rashchenko, S.V.; Kurnosov, A.; Dubrovinsky, L.; Litasov, K.D. Revised calibration of the sm: SrB4O7 pressure sensor using the sm-doped yttrium-aluminum garnet primary pressure scale. J. Appl. Phys. 2015, 117, 145902. [Google Scholar] [CrossRef]
- Dušek, M.; Chapuis, G.; Meyer, M.; Petricek, V. Sodium carbonate revisited. Acta Crystallogr. Sect. B Struct. Sci 2003, 59, 337–352. [Google Scholar] [CrossRef] [Green Version]
- Blöchl, P.E. Projector augmented-wave method. Phys. Rev. B 1994, 50, 17953. [Google Scholar] [CrossRef]
- Kresse, G.; Furthmüller, J. Efficient iterative schemes for ab initio total-energy calculations using a plane-wave basis set. Phys. Rev. B 1996, 54, 11169. [Google Scholar] [CrossRef]
- Kresse, G.; Furthmüller, J. Efficiency of ab-initio total energy calculations for metals and semiconductors using a plane-wave basis set. Comput. Mater. Sci. 1996, 6, 15–50. [Google Scholar] [CrossRef]
- Kresse, G.; Joubert, D. From ultrasoft pseudopotentials to the projector augmented-wave method. Phys. Rev. B 1999, 59, 1758. [Google Scholar] [CrossRef]
- Perdew, J.P.; Burke, K.; Ernzerhof, M. Generalized gradient approximation made simple. Phys. Rev. Lett. 1996, 77, 3865. [Google Scholar] [CrossRef] [PubMed]
- Stokes, H.T.; Hatch, D.M. FINDSYM: Program for identifying the space-group symmetry of a crystal. J. Appl. Crystallogr. 2005, 38, 237–238. [Google Scholar]
- Momma, K.; Izumi, F. VESTA 3 for three-dimensional visualization of crystal, volumetric and morphology data. J. Appl. Crystallogr. 2011, 44, 1272–1276. [Google Scholar] [CrossRef]
- Togo, A.; Oba, F.; Tanaka, I. First-principles calculations of the ferroelastic transition between rutile-type and CaCl2-type SiO2 at high pressures. Phys. Rev. B 2008, 78, 134106. [Google Scholar] [CrossRef]
- Seto, Y. Development of a software suite on X-ray diffraction experiments. Rev. High Press. Sci. Technol. 2010, 20, 269–276. [Google Scholar]
- Toby, B.H.; Von Dreele, R.B. Gsas-II: The genesis of a modern open-source all purpose crystallography software package. J. Appl. Crystallogr. 2013, 46, 544–549. [Google Scholar] [CrossRef]
- Shatskiy, A.; Gavryushkin, P.N.; Sharygin, I.S.; Litasov, K.D.; Kupriyanov, I.N.; Higo, Y.; Borzdov, Y.M.; Funakoshi, K.; Palyanov, Y.N.; Ohtani, E. Melting and subsolidus phase relations in the system Na2CO3-MgCO3 ± H2O at 6 GPa and the stability of Na2Mg(CO3)2 in the upper mantle. Am. Mineral. 2013, 98, 2172–2182. [Google Scholar] [CrossRef]
- Merlini, M.; Hanfland, M.; Crichton, W. CaCO3-III and CaCO3-VI, high-pressure polymorphs of calcite: Possible host structures for carbon in the Earth’s mantle. Earth Planet. Sci. Lett. 2012, 333, 265–271. [Google Scholar] [CrossRef]
- Gavryushkin, P.N.; Martirosyan, N.S.; Inerbaev, T.M.; Popov, Z.I.; Rashchenko, S.V.; Likhacheva, A.Y.; Lobanov, S.S.; Goncharov, A.F.; Prakapenka, V.B.; Litasov, K.D. Aragonite-II and CaCO3-VII: New high-pressure, high-temperature polymorphs of CaCO3. Cryst. Growth Des. 2017, 17, 6291–6296. [Google Scholar] [CrossRef]
- Litasov, K.D.; Shatskiy, A.; Gavryushkin, P.N.; Bekhtenova, A.E.; Dorogokupets, P.I.; Danilov, B.S.; Higo, Y.; Akilbekov, A.T.; Inerbaev, T.M. PVT equation of state of CaCO3 aragonite to 29 GPa and 1673 K: In situ x-ray diffraction study. Phys. Earth Planet. Inter. 2017, 265, 82–91. [Google Scholar] [CrossRef]
- Grzechnik, A.; Bouvier, P.; Farina, L. High-pressure structure of Li2CO3. J. Solid State Chem. 2003, 173, 13–19. [Google Scholar] [CrossRef]
- Klotz, S.; Chervin, J.; Munsch, P.; Le Marchand, G. Hydrostatic limits of 11 pressure transmitting media. J. Phys. Appl. Phys. 2009, 42, 075413. [Google Scholar] [CrossRef]
- Malins, K. The potential of K3PO4, K2CO3, Na3PO4 and Na2CO3 as reusable alkaline catalysts for practical application in biodiesel production. Fuel Process. Technol. 2018, 179, 302–312. [Google Scholar] [CrossRef]
- Maciel, A.; Ryan, J.; Walker, P. Structural phase transitions in K2CO3 (raman scattering study). J. Phys. Solid State Phys. 1981, 14, 1611. [Google Scholar] [CrossRef]
- Swainson, I.; Dove, M.; Harris, M.J. Neutron powder diffraction study of the ferroelastic phase transition and lattice melting in sodium carbonate, Na2CO3. J. Phys. Condens. Matter 1995, 7, 4395. [Google Scholar] [CrossRef]
- Vinet, P.; Ferrante, J.; Rose, J.; Smith, J. Compressibility of solids. J. Geophys. Res. Solid Earth 1987, 92, 9319–9325. [Google Scholar] [CrossRef]
- Blatov, V.A. Crystal structures of inorganic oxoacid salts perceived as cation arrays: A periodic-graph approach. In Inorganic 3D Structures; Springer: Berlin/Heidelberg, Germany, 2011; pp. 31–66. [Google Scholar]
- Shannon, R.D.; Prewitt, C.T. Revised values of effective ionic radii. Acta Crystallogr. Sect. Struct. Crystallogr. Cryst. Chem. 1970, 26, 1046–1048. [Google Scholar] [CrossRef]


| Pr.,Temp. (GPa, C) | Space Group | Lattice Parameters Å, deg. | Atomic Coordinates | |||||
|---|---|---|---|---|---|---|---|---|
| Species | x | y | z | |||||
| -NaCO | ||||||||
| 1 atm, 25 | /m | Na1 | 0.00 | 0.00 | 0.00 | |||
| 90 | Na2 | 0.00 | 0.00 | 0.50 | ||||
| Na3 | 0.17 | 0.16 | 0.74 | |||||
| C1 | 0.16 | 0.17 | 0.25 | |||||
| O1 | 0.10 | 0.10 | 0.28 | |||||
| O2 | 0.29 | 0.10 | 0.18 | |||||
| NaCO-/mcm | ||||||||
| 13.7, 25 | /mcm | Na1 | 0.33 | 0.67 | 0.00 | |||
| 90 | C1 | 0.00 | 0.00 | 0.25 | ||||
| O1 | 0.73 | 0.00 | 0.25 | |||||
| NaCO-/m | ||||||||
| 27.9, 800 | /m | Na1 | 0.63 | 0.25 | 0.37 | |||
| 90 | Na2 | 0.52 | 0.25 | 0.03 | ||||
| C1 | 0.01 | 0.25 | 0.73 | |||||
| O1 | 0.07 | 0.52 | 0.19 | |||||
| O2 | 0.20 | 0.25 | 0.59 | |||||
| Pressure (GPa) | Temperature (C) | Unit Cell Parameters (Å, deg.) | Volume (Å) | |||
|---|---|---|---|---|---|---|
| -NaCO | ||||||
| 0.0 | 25 | 8.89(5) | 5.27(2) | 6.05(3) | 101.33(7) | 277.7(31) |
| 3.3 | 25 | 8.73(5) | 5.16(2) | 5.95(3) | 101.54(7) | 262.7(31) |
| 4.7 | 25 | 8.69(5) | 5.12(2) | 5.89(3) | 101.65(7) | 256.8(31) |
| 8.6 | 25 | 8.55(5) | 5.07(2) | 5.91(3) | 101.44(7) | 250.9(31) |
| 9.6 | 25 | 8.53(5) | 5.06(2) | 5.86(3) | 101.67(7) | 248.0(31) |
| 7.4 | 800 | 8.70(5) | 5.13(2) | 5.91(3) | 101.16(7) | 259.0(31) |
| 8.8 | 800 | 8.65(5) | 5.13(2) | 5.90(3) | 101.41(7) | 256.5(31) |
| 12.0 | 800 | 8.55(5) | 5.06(2) | 5.93(3) | 101.04(7) | 251.5(31) |
| 13.0 | 800 | 8.53(5) | 5.06(2) | 5.90(3) | 101.53(7) | 249.5(31) |
| /mcm-NaCO | ||||||
| 13.7 | 25 | 4.783(2) | 4.783(2) | 5.621(1) | 111.11(7) | |
| 14.2 | 25 | 4.775(2) | 4.775(2) | 5.597(1) | 110.22(7) | |
| 17.5 | 25 | 4.742(2) | 4.742(2) | 5.562(1) | 108.11(7) | |
| 18.5 | 25 | 4.726(2) | 4.726(2) | 5.544(1) | 106.81(7) | |
| 21.5 | 25 | 4.691(2) | 4.691(2) | 5.503(1) | 104.90(7) | |
| 24.0 | 25 | 4.670(2) | 4.670(2) | 5.451(1) | 102.81(7) | |
| 26.8 | 25 | 4.668(2) | 4.668(2) | 5.436(1) | 102.02(7) | |
| 15.4 | 800 | 4.784(2) | 4.748(2) | 5.658(1) | 111.71(7) | |
| 20.4 | 800 | 4.731(2) | 4.731(2) | 5.583(1) | 108.07(7) | |
© 2019 by the authors. Licensee MDPI, Basel, Switzerland. This article is an open access article distributed under the terms and conditions of the Creative Commons Attribution (CC BY) license (http://creativecommons.org/licenses/by/4.0/).
Share and Cite
Gavryushkin, P.N.; Bekhtenova, A.; Lobanov, S.S.; Shatskiy, A.; Likhacheva, A.Y.; Sagatova, D.; Sagatov, N.; Rashchenko, S.V.; Litasov, K.D.; Sharygin, I.S.; et al. High-Pressure Phase Diagrams of Na2CO3 and K2CO3. Minerals 2019, 9, 599. https://doi.org/10.3390/min9100599
Gavryushkin PN, Bekhtenova A, Lobanov SS, Shatskiy A, Likhacheva AY, Sagatova D, Sagatov N, Rashchenko SV, Litasov KD, Sharygin IS, et al. High-Pressure Phase Diagrams of Na2CO3 and K2CO3. Minerals. 2019; 9(10):599. https://doi.org/10.3390/min9100599
Chicago/Turabian StyleGavryushkin, Pavel N., Altyna Bekhtenova, Sergey S. Lobanov, Anton Shatskiy, Anna Yu. Likhacheva, Dinara Sagatova, Nursultan Sagatov, Sergey V. Rashchenko, Konstantin D. Litasov, Igor S. Sharygin, and et al. 2019. "High-Pressure Phase Diagrams of Na2CO3 and K2CO3" Minerals 9, no. 10: 599. https://doi.org/10.3390/min9100599